Abstract
In recent years, the main usage of reinforced concrete (RC) structures in Korea has shifted from low-rise residential and commercial buildings to high-rise buildings. Because an increasing number of high-rise RC buildings are being built, especially in coastal cities, which are periodically hit by typhoons, wind-induced motion and the corresponding serviceability issues have attracted considerable attention. Natural period and damping ratio are the most important factors for estimating the design wind load and wind-induced response in the design of tall buildings. However, the Korean Building Code (KBC 2009) does not specify empirical formulae for estimating the natural period and damping ratio for wind design, unlike seismic design. In this study, the damping ratio and natural period of existing concrete buildings in Korea are measured and compared to those obtained using the formulae provided in various codes and research works. Furthermore, design formulae for estimating natural frequency and damping ratio for wind design are proposed based on the measured data. For this purpose, ambient vibration measurement is performed for 58 RC buildings with heights of 24.2–305 m.
1. Introduction
In recent years, the main usage of reinforced concrete (RC) structures in Korea has shifted from low-rise residential and commercial buildings to high-rise buildings. Because an increasing number of high-rise RC buildings are being built, especially in cities such as Busan and Incheon, which are periodically hit by typhoons, wind-induced motion and corresponding serviceability issues have attracted considerable attention.
Natural period and damping ratio are most important factors for estimating the design wind load and wind-induced response in the design of tall buildings [1]. In particular, the natural period of a building is the most important variable from the viewpoint of calculating wind load. Because a detailed analysis model for this purpose is not available in the initial design stage, wind load can be approximated using an empirical formula [2]. However, the Korean Building Code (KBC 2009) does not specify an empirical formula to estimate the natural period for wind design as it does for seismic design [3]. Instead, KBC 2009 introduced a few empirical formulas from foreign codes in the commentary. Consequently, engineers have to choose the values of natural period and damping ratio somewhat arbitrarily based on experience.
Chung et al. [4], however, reported a considerable discrepancy between the values obtained using foreign codes and the directly measured natural periods and damping ratios of existing RC buildings taller than 150 m in Korea. This is because residential buildings with concrete shear wall systems are more popular in Korea than in foreign countries and because the heavier gravitational load due to the unique floor heating system called “ondol,” with an additional unreinforced concrete layer measuring 10–15 cm in thickness in residential buildings, warrants the use of larger columns or shear wall sizes than those used in foreign countries. Consequently, the damping ratio provided in foreign codes may not necessarily be directly applicable to the design of tall buildings in Korea.
In this paper, the ambient vibrations of actual RC buildings in Korea are measured to construct a database of wind design parameters, such as natural period and damping ratio. For this purpose, the ambient vibration of 36 RC buildings with heights of 44.8–305 m is measured. In addition to the full-scale measurement results of 36 buildings, the data of 22 buildings presented in [5,6] are added to cover most of the RC buildings in Korea with heights less than 100 m. Thus, the data of 58 buildings were used in this study to evaluate the empirical formulae provided in various design codes and research papers. Furthermore, the design formulae of natural frequency and damping ratio for wind design are proposed based on the database. The heights of 58 buildings considered in this study ranged from 24.4 m to 305 m.
2. Empirical Formulae for Computing Natural Period of Reinforced Concrete (RC) Buildings for Wind Design
A formula to compute the natural period of a building for wind design is not provided in KBC 2009. Instead, the following approximate formula for estimating the natural period is provided for in the seismic design of RC moment frames:
where T is the natural period, and H is the building height (m).
ASCE 7-10 [7] presents two empirical formula based on the results of finite element analysis and wind tunnel tests of a building shorter than 91 m (300 ft).
Equation (2) is for RC moment frames, and Equation (3) is for RC buildings with structural systems other than the moment frame.
Unlike the finite-element-analysis-based empirical formula in ASCE 7-10, empirical formulae based on measured data are more frequently proposed and used in the wind design of buildings. The first empirical formula based on measured data was proposed by Lagomarsino [8]. He used the data of 185 buildings, of which 52 were RC buildings. He proposed the following formula for RC buildings based on a regression analysis of the measured data.
Lagomarsino’s proposal was adopted in Eurocode 1 [9] with minor modifications, as follows.
Equation (5) can be applied to steel buildings and buildings with other structural systems, as well as RC buildings. The Australia and New Zealand standard (AS/NZS 1170) [10] and Hong Kong design code [11] adopted the empirical formula given in Equation (5) for estimation of the natural period.
Research on the measured data of 137 steel buildings, 43 RC buildings, and 25 steel-reinforced concrete (SRC) buildings in Japan was conducted more recently, and the following regression formula was proposed for the wind design of RC buildings [12]:
Notably, Equation (5) was obtained from the data of buildings shorter than 120 m, and Equation (6) was obtained from the data of buildings shorter than 129.8 m. In Korea, Yoon and Joo [5] measured 22 rectangular residential buildings with RC shear wall systems and heights less than 66 m and proposed the following empirical formula:
All of these empirical formulae are summarized in Table 1. It can be seen from the table that in all formulae, the natural period is linearly proportional to the height of the building, except in KBC 2009 and ASCE 7-10.

Table 1.
Empirical formulae for estimating natural period.
3. Empirical Formulae for Damping Ratio of RC Buildings for Wind Design
The formulae for damping ratio can be categorized into (1) single-value damping ratio and (2) frequency- and amplitude-dependent damping ratio. The single-value damping ratio type formulae provide specific damping values regardless of the natural frequency of the building and the magnitude of building response under wind load. By contrast, the frequency- and amplitude-dependent damping ratio type formulae yield different damping values according to the natural frequency and response magnitude of a building.
3.1. Single-Value Damping Ratio
3.1.1. Eurocode 1
Eurocode 1 presents a logarithmic decrement of damping for the wind design of buildings depending on the type of structure, regardless of structure height or response amplitude. The logarithmic decrement of damping δ for the fundamental bending mode can be expressed as follows:
where δs is the logarithmic decrement of structural damping, δa is the logarithmic decrement of aerodynamic damping for the fundamental mode, and δd is the logarithmic decrement of damping due to damping devices such as tuned mass dampers and sloshing tanks. Unlike masts with small mass and slim towers, the logarithmic decrements of aerodynamic damping for buildings are relatively small compared to the logarithmic decrements of structural damping and the logarithmic decrements due to damping devices.
The values of logarithmic decrements of structural damping of buildings in Eurocode 1 are categorized according to the following building structure types: RC structure, steel structure, and SRC structure (Table 2). Because the use of the damping ratio is more popular in Korea than the use of the logarithmic decrement of damping, the equivalent damping ratios, which can be obtained by dividing the logarithmic decrement of structural damping with 2π, are listed in Table 2.
Table 2.
Logarithmic decrement of structural damping in the fundamental mode in Eurocode 1.
3.1.2. The Australia and New Zealand Standard (AS/NZS 1170)
AS/NZS 1170, which is used in Australia and New Zealand, uses the damping ratio of a building, regardless of building height and response amplitude. The damping ratio provided in AS/NZS 1170 depends on the serviceability limit state and the ultimate limit state for different types of structures. In terms of the serviceability limit state, structures are categorized into two types: steel structures and RC structures. In terms of the ultimate limit state, structures are categorized into three types: RC structures, bolted steel structures, and welded steel structures.
The damping ratios provided in AS/NZS 1170 are presented In Table 3, along with those for the ultimate limit state for reference. The table shows that damping ratios for RC structures and steel structures are in the same range in terms of the serviceability limit state.
Table 3.
Values of damping ratio in the Australia and New Zealand standard (AS/NZS 1170).
3.1.3. ASCE 7-10
In ASCE 7-10, specific values of damping ratios are not provided, but values of 1.0% for steel structures and 2.0% for RC structures are recommended in its Commentary Chapter C26.9.
3.2. Frequency- and Amplitude-Dependent Damping Ratio
3.2.1. ISO 4534
ISO 4354 [13] presents the damping ratio of a structure as the sum of the structural damping ratio, aerodynamic damping ratio, and auxiliary damping ratio, similarly to Eurocode 1, as follows:
where ζstr is the structural damping ratio, ζaer is the aerodynamic damping ratio, and ζaux is the additional damping provided by auxiliary damping devices or damping materials.
There is high variability in the structural damping ratio given in ISO 4354, unlike Eurocode 1, in which specific values are presented regardless of building height. Because the natural period of a building increases and its natural frequency decreases as its height increases, ISO 4354 is categorized as a frequency-dependent damping ratio in this paper. Table 4 summarizes the damping ratios provided in ISO 4354. It can be seen that the damping ratios of RC structures are larger than those of steel structures, and the values decrease as building height increases.
Table 4.
Values of structural damping ratio, ζstr, in ISO 4354.
3.2.2. Architectural Institute of Japan (AIJ) 2000
In Japan, the damping ratio for wind design is provided in a book “Damping in structures” [14] published by Architectural Institute of Japan (AIJ), as opposed to a design code. This book is called AIJ 2000 in this paper. AIJ 2000 provides empirical formulae for the damping ratio based on the measured damping ratios of 137 steel buildings, 43 SRC buildings, and 25 RC buildings.
The damping formulae provided in AIJ 2000 are categorized by structure type as follows:
where f1 is the first mode natural frequency, and x is the tip displacement. The empirical formulae for first mode natural frequency are given as follows:
Because Equations (12) and (13) have been derived using the data of existing buildings, it is suggested that they be used in the range of 10.8 m < H < 129.8 m for RC buildings and 19.1 m < H < 282.3 m for steel buildings.
3.2.3. Engineering Science Data Unit (ESDU) 83009
The damping ratio provided in Engineering Science Data Unit (ESDU) 83009 [15] is presented as the sum of the frequency-dependent damping ratio and the amplitude-dependent damping ratio, as follows:
where ζso is the frequency-dependent damping ratio, and is the increase in damping due to increase in amplitude. The values of ζso and are listed in Table 5, where D denotes building dimensions.
Table 5.
Values of ζso and in Engineering Science Data Unit (ESDU) 83009.
Cook [16] provided a simpler solution with which engineers can use Equation (14) more easily based on an analysis of the data given in ESDU 83009, as follows:
3.2.4. Yoon
Yoon [6] proposed empirical formulae similar to those in AIJ 2000 and ESDU 83009 based on the measured damping ratio data of 17 rectangular residential buildings in Korea. The heights of the measured buildings were 24.4–67 m, and an ambient vibration test and a human excitation test were performed to estimate the damping ratio. The empirical formulae for damping ratios along the longer and shorter directions are as follows:
where the first mode natural frequency is calculated using Equation (7) obtained from a regression analysis.
3.2.5. Lagomarsino
Lagomarsino [8] proposed the following empirical formula that depends only on the height of the building and excludes the top drift effect:
Because the fundamental mode frequency f1 is a reciprocal of the fundamental mode period T, and T is related with to building height, as given in Equation (5), it can be concluded that the damping ratio in Equation (18) is a function of the building height. Notably, Equation (18) yields a very large damping ratio for tall buildings whose natural frequencies are very low because Equation (18) is based on Rayleigh damping.
3.3. Comparison of Damping Ratio Formulae
Table 6 summarizes the structural damping ratio for RC buildings, while the damping ratios of RC buildings of different heights are compared in Figure 1. It can be inferred from Table 6 that tip displacement is required to compute the damping ratios by using the formulae given in AIJ 2000, ESDU 83009, and Yoon. Tip displacement due to wind loads, however, is not readily available in the design phase. Therefore, empirical values or values transformed from the acceleration limit values provided in design codes should be used instead. Satake et al. [12] suggested the empirical value of x/H ≤ 2 × 10⁻⁵ for use in the formula given in AIJ 2000.
Table 6.
Structural damping ratios of RC buildings.
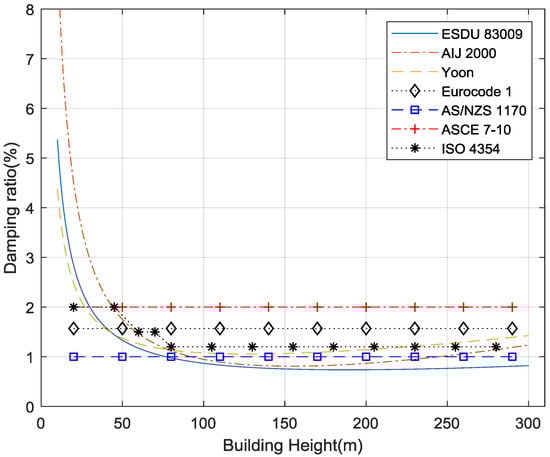
Figure 1.
Values of structural damping ratio for RC buildings.
4. Natural Period and Damping Ratio Identification from Measured Full-Scale Data
The list of 36 buildings used for ambient vibration measurement is presented in Table 7. As can be noticed from Table 7, 28 out of the 36 buildings are taller than 100 m. The gravitational resistance of buildings No. 1 to No. 10 is entirely provided by the RC shear wall because these are typical mid-rise residential buildings that consist of shear walls without any beams and columns. The gravitational resistance of all other buildings is provided by RC shear walls and moment frames. Building No. 14 is an exception because it is an SRC structure. The 36 measured buildings were selected based on the possibility of the measurement because most of them are privately owned residential buildings. Therefore, the monitored buildings may not be representative of the building stock in Korea.
Table 7.
List of RC buildings for ambient vibration measurement.
Ambient vibration measurements of all buildings listed in Table 7 were performed using three servo-type accelerometers installed on the top floor, as shown in Figure 2. Three accelerometers were used to detect two translational components and a rotational component of floor motion based on the assumption of rigid diaphragm behavior [17]. A data logger called Netpod 4003 (Keynes Control Ltd., Swallowfield Berkshire, UK) with 24-bit resolution was used to collect measured data. The acceleration measurement range was ±0.25g with a sampling rate of 200 Hz, and the measurement duration was at least 30 min. The measured data were digitally filtered using a band-pass filter with cut-off frequencies of 0.01 Hz and 10 Hz to remove signal drifts and high-frequency noises, and the data were subsequently decimated to a 20 Hz signal for efficient numerical data processing.
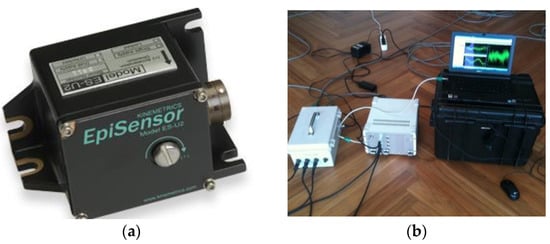
Figure 2.
Equipment for ambient vibration measurement: (a) accelerometer (Kinemetrics Episensor ES-U2) and (b) data logger (Netpod 4003, Keynes Control Co.).
In Figure 3 and Figure 4, the measured 1-min acceleration time histories of Harbor View 1502 and 30-s acceleration time histories of Central Park 103, respectively, are presented. Figure 3 represents the typical acceleration time histories obtained from the ambient vibration measurement on a calm day, while Figure 4 shows the peak acceleration measured on a windy day. It can be seen from Figure 3 and Figure 4 that the accelerations measured in the ambient vibration measurement are very small, with values of less than 1 milli-g. It was reported that the natural frequency and damping ratio are varying values depending on the vibration amplitude, temperature and humidity [18,19], but this variation is not considered in this study.
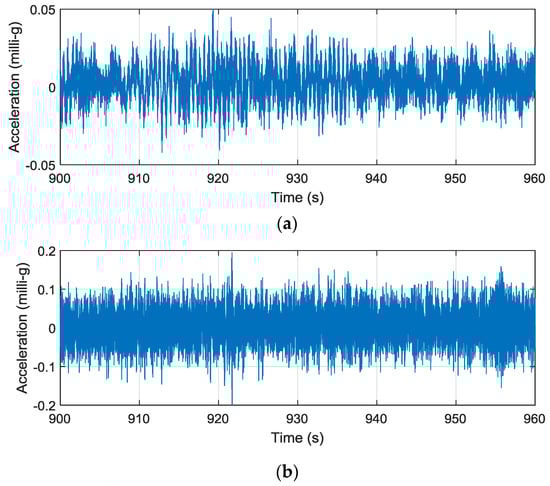
Figure 3.
Measured acceleration time histories of Harbor View 1502: (a) x-direction and (b) y-direction.
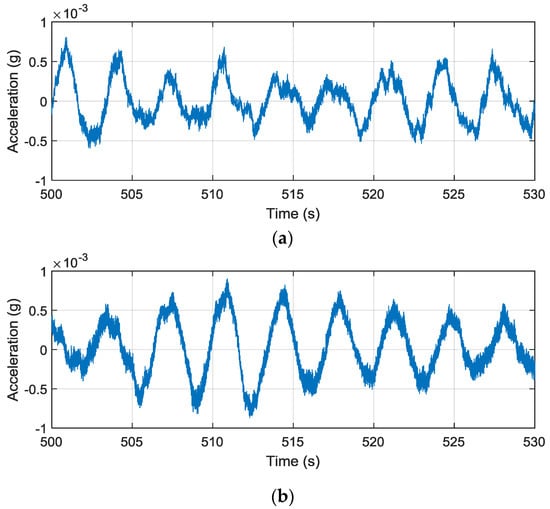
Figure 4.
Measured acceleration time histories of Central Park 103: (a) x-direction and (b) y-direction.
An output-only system identification technique called stochastic subspace identification (SSI) [20] was used to identify the natural period and damping ratio. Because wind load is generally assumed to be a wideband random signal with an averaging time of 10 min, the ambient vibration of tall buildings subjected to wind load can be applied to output-only system identification methods, such as the SSI method [21]. The SSI method yields estimates of modal parameters obtained from singular value decomposition of the block Hankel matrix, which is composed of correlation matrices of responses. Because the dynamic parameters are extracted from the state-space equation obtained directly from the time series of the data, this method is often used for system identification when the input force is not known [22].
Stabilization charts shown in Figure 5 were created to classify the poles into estimated poles by repeating the identification analysis according to the ascending order of state-space equations used in the SSI method. Estimated poles that correspond to physically relevant modes tend to appear for each order of state-space equations at nearly identical frequencies, while the so-called mathematical poles, which result from mathematical solutions of the equation and are meaningless with respect to the physical interpretation, tend to jump around [21]. Note that the first two modes of Central Park 103 are well separated while those of Harbor View 1502 are closely distributed as shown in Figure 5. The close distribution of modes is common in tall buildings with square plans. The identified first mode natural periods and damping ratios of the measured buildings are listed in Table 6.
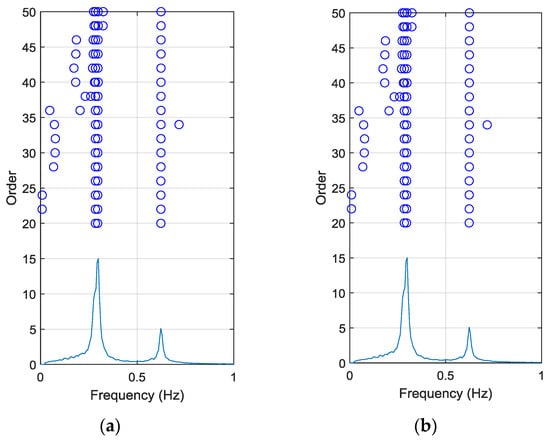
Figure 5.
Stabilization charts (circles denote poles determined by the stochastic subspace identification (SSI) method and solid lines denote the average power spectral density of the measured acceleration data): (a) Harbor View 1502 and (b) Central Park 103.
In addition to the results of the 36 buildings presented in Table 7, the data of 22 buildings used in [5,6] were added to include more data on buildings shorter than 100 m. The natural periods of all 22 buildings were provided in [5], where a formula to compute the natural period for wind design was proposed, while the damping ratios of 15 of those 22 buildings were given in [6], where a formula to compute the damping ratio for wind design was proposed. Consequently, the data of 51 buildings for evaluation of the damping ratio formulae and those of 58 buildings for evaluation of the natural period were used in this paper. The heights of the 58 buildings ranged from 24.4 m to 305 m. Figure 6 shows a histogram of the heights of the 58 buildings.
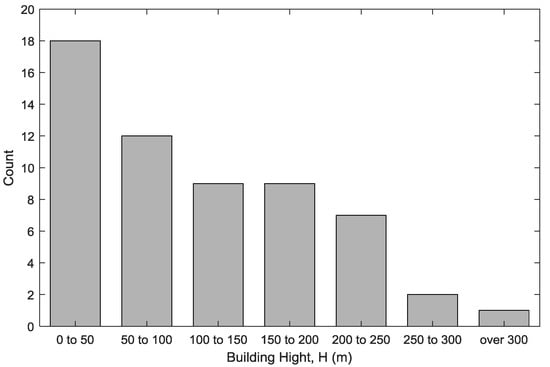
Figure 6.
Histogram of heights of the 58 buildings.
Figure 7 compares the results obtained using the empirical formulae provided in KBC 2009 and ASCE 7-10 with the measured natural frequencies. Notably, the empirical formulae given in ASCE 7-10, which were derived through finite element analysis, yielded a natural period that was twice as long as the measured natural period. The natural period estimated using the formula given in KBC 2009 was relatively closer to the measured natural period, even though this formula pertains to the seismic design of RC moment frames. However, it can be seen from Figure 7 that the formula provided in KBC 2009 overestimates and underestimates, respectively, the natural periods of buildings shorter than 100 m and buildings taller than 200 m. This is because this formula is non-linearly proportional to building height with an exponent of 0.75, while the measured natural period is more or less linearly proportional to building height. Therefore, it can be concluded that the formulae provided in KBC 2009 and ACSCE 7-10 are unsuitable for use in the early stages of wind design.
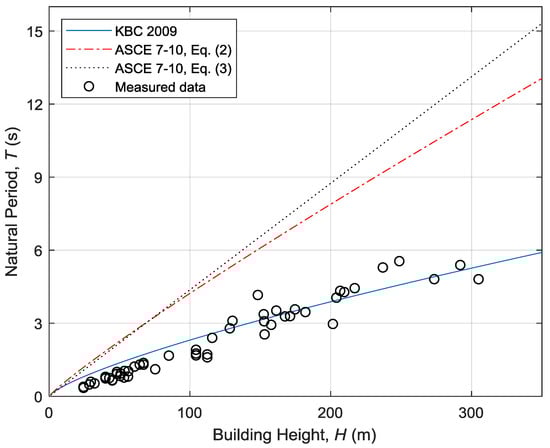
Figure 7.
Comparison of KBC 2009 and ASCE 7-10 formulae to measured natural frequency.
5. Proposed Equation for Estimation of Natural Period and Damping Ratio for Wind Design of RC Buildings
5.1. Equation for Natural Period Estimation
Figure 8 presents the results of a regression analysis of 36 measured natural periods and 22 natural periods obtained from references [5,6]. The linear regression was performed following previous research [5,8,9,12], such that the equation included a single term of building height, even though statistical dispersion increases as the building height increases.
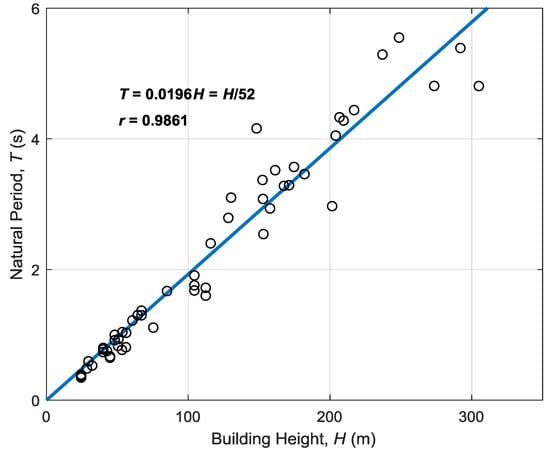
Figure 8.
Regression analysis of measured natural period.
The proposed equation of natural period for the wind design of RC buildings as obtained from the linear regression analysis is as follows:
T = 0.0196H = H/51
Equation (19) can be easily converted into an equation for natural frequency estimation as follows:
f1 = 51/H
The coefficient of correlation of Equation (19) is 0.9861, which implies a very close correlation with the measured data. Furthermore, Equation (19) is very similar to Equation (7) of Yoon and Joo, who derived their empirical formula from the measured data of Korean buildings shorter than 66 m and having shear walls.
Figure 9 compares the measured natural frequency data to the results obtained using Equation (19) and the other empirical formulae described in the previous section. All empirical formulae in Figure 9 yield results that are very close to the measured results because they were obtained from actual measured data, unlike the equations provided in ASCE 7-10, which are presented in Figure 7. In particular, the results obtained using Lagomarsino’s empirical formula were the closest to the measured values, with the exception of Yoon and Joo. The empirical formula provided in Eurocode 1 overestimated the natural periods, whereas the formula proposed by Satake et al. underestimated the natural periods.
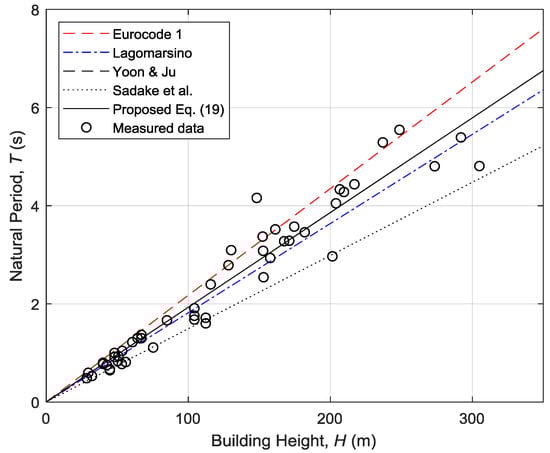
Figure 9.
Comparison of proposed equation for natural frequency estimation with other empirical formulae.
5.2. Equation for Damping Ratio Estimation
Figure 10 presents the results of a regression analysis of 36 measured damping ratios and 15 damping ratios obtained from references [4,5]. Similar to the natural period regression, the linear regression analysis of damping ratio was performed such that the damping value was linearly proportional to the inverse of building height, which is linearly proportional to the natural frequency of the building, as has been considered in previous research [5,13,14]. Figure 10 shows that the damping ratio decreases as the building height increases. The proposed equation of damping ratio for the wind design of RC buildings obtained from the regression analysis is as follows:
ζ = 0.2467/H + 0.0067
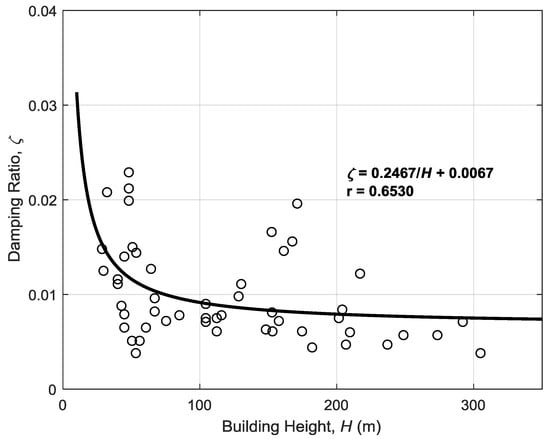
Figure 10.
Regression analysis of measured damping ratio.
The coefficient of correlation of Equation (21) is 0.6461. Even though the coefficient of correlation is relatively low compared to that in Equation (19) for natural period estimation, the value is considerably greater than that yielded by the Japanese formula of Satake et al. Equation (21) can be rewritten considering the relationship between natural period and building height in Equation (20) as follows:
ζ = 0.00487f1 + 0.0067
Notably, Equation (22) does not include a response-dependent term unlike the empirical formulae in Equations. (10) and (16) of Satake et al. and Yoon, respectively. Figure 11 and Figure 12 compare the proposed Equation (21) with those of Lagomarsino, Satake et al., and Yoon. Only the frequency-dependent term is considered in Figure 11, while the response-dependent term is included in Figure 12 in the empirical formulae of Satake et al. and Yoon. The value of x/H = 2 × 10⁻⁵, as suggested by Satake et al., is used for tip displacement. In addition, the empirical formula proposed by Lagomarsino is compared in Figure 11.
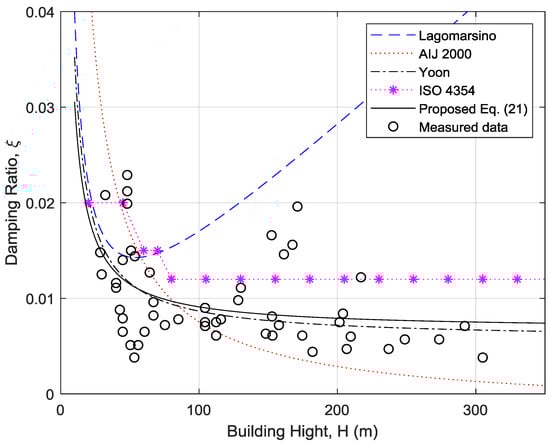
Figure 11.
Comparison of proposed equation for estimating damping ratio with various empirical formulae—only the frequency-dependent term is included.
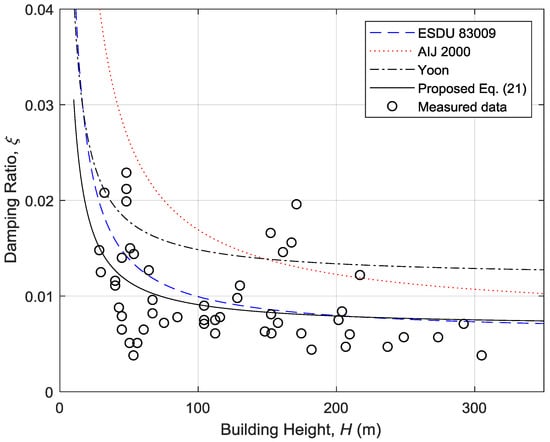
Figure 12.
Comparison of proposed equation for estimating damping ratio with various empirical formulae—both frequency- and amplitude-dependent terms are included.
Figure 11 shows that the empirical formula of Yoon without the amplitude-dependent term is the closest to the equation proposed in this study. Yoon’s formula, however, overestimates the damping ratio when the amplitude-dependent term is included in the damping ratio estimation, as shown in Figure 11. Moreover, the empirical formula of Lagomarsino yields very large damping ratios for buildings taller than 100 m because of the Rayleigh damping consideration. Note that only the first modal frequency calculated from Equation (5) is used to evaluate the empirical formula of Lagomarsino in Equation (8).
If the amplitude-dependent term is included, as in Figure 12, the empirical formula provided in ESDU 83009 matches well with the proposed equation. The empirical formulae provided in AIJ 2000 and Yoon considerably overestimate the damping ratio of buildings taller than 200 m. This overestimation can mainly be ascribed to the fact that those formulae were derived using the data of buildings with heights ranging up to 66 m for Yoon and up to 129.8 m for AIJ 2000.
6. Conclusions
A database of the natural periods and damping ratios of 58 RC buildings with heights ranging from 44.8 m to 305 m was constructed based on ambient vibration measurements. Design formulae of natural frequency and damping ratio for wind design were proposed using the database and compared to the empirical formulae provided in various design codes and research papers.
The proposed equation for estimating the natural period was found to be close to the empirical formula of Yoon and Joo, which was derived using the measured data of Korean buildings shorter than 66 m. Moreover, the results obtained using all the empirical formulae for estimation of the natural period provided in previous research were very close to the measured values, except those obtained using the formulae provided in ASCE 7-10.
In terms of estimation of the damping ratio, the results obtained using the empirical formula proposed by Yoon were the closest to the measured values only when the amplitude-dependent term was excluded. When the amplitude-dependent term was included in the calculation, the results obtained using the empirical formulae provided in ESDU 83009 yields were close to the results obtained using the proposed equation, while other empirical formulae overestimated the damping ratio considerably for buildings taller than 200 m.
Author Contributions
T.H. and H.K. conceived and designed the experiments; S.S. analyzed the data; H.K. wrote the paper. All authors have read and agreed to the published version of the manuscript.
Funding
This research received no external funding.
Conflicts of Interest
The authors declare no conflict of interest.
References
- Campbell, S.; Kwok, K.C.S.; Hitchcock, P.A.; Tse, K.T.; Leung, H.Y. Field measurements of natural periods of vibration and structural damping of wind-excited tall residential buildings. Wind Struct. 2007, 10, 401–420. [Google Scholar] [CrossRef]
- Simiu, E.; Scanlan, R.H. Winds Effects on Structures: Fundamentals and Applications to Design, 3rd ed.; John Wiely & Sons, Inc.: New York, NY, USA, 1996. [Google Scholar]
- Architectural Institute of Korea. Korean Building Code—Structural 2009; Ministry of Construction and Transportation of Korea: Seoul, Korea, 2009.
- Chung, J.H.; Kim, H.; Choi, S.Y. Comparison of Design Code Damping Formulae and Measured Damping Ratios of Tall Buildings under Wind Loads. J. Archit. Inst. Korea 2013, 29, 11–18. [Google Scholar]
- Yoon, S.W.; Joo, Y.K. Natural Periods of Reinforced Concrete Apartments for Serviceability Design. J. Archit. Inst. Korea 2003, 19, 3–10. [Google Scholar]
- Yoon, S.W. Damping ratios of Reinforced Concrete Apartment for Serviceability Design of Wind. J. Archit. Inst. Korea 2004, 20, 27–34. [Google Scholar]
- American Society of Civil Engineers (ASCE). ASCE/SEI 7-10. Minimum Design Loads for Buildings and Other Structures; American Society of Civil Engineers (ASCE): Reston, VA, USA, 2011. [Google Scholar]
- Lagomarsino, S. Forecast models for damping and vibration periods of buildings. Wind Eng. Ind. Aerod. 1993, 48, 221–239. [Google Scholar] [CrossRef]
- European Committee for Standardization (C.E.N.). Eurocode 1: Actions on Structures—Part 1–4: General Actions—Wind Actions; prEN 1991-1-4.6; European Committee for Standardization (C.E.N.): Brussels, Belgium, 2004. [Google Scholar]
- Australia/New Zealand (AS/NZS). Australian/New Zealand Standards, Structural Design Actions—Part 2, Wind Actions. AS/NZS 1170.2:2011; Standards Australia: Sydney, Australia, 2011. [Google Scholar]
- Buildings Department. Code of Practice for Structural Use of Concrete; Hong Kong Buildings Department: Hong Kong, 2004.
- Satake, N.; Suda, K.I.; Arakawa, T.; Sasaki, A.; Tamura, Y. Damping evaluation using full-scale data of buildings in Japan. J. Struct. Eng. 2003, 129, 470–477. [Google Scholar] [CrossRef]
- ISO. ISO 4354 (E) Second Edition: Wind Actions on Structures; International Organization for Standardization: Geneva, Switzerland, 2009. [Google Scholar]
- Architectural Institute of Japan (AIJ). Damping in Buildings; Architectural Institute of Japan (AIJ): Tokyo, Japan, 2000. [Google Scholar]
- Engineering Science Data Unit. ESDU83009. Damping of Structures, Part 1: Tall Buildings; ESDU: London, UK, 1983. [Google Scholar]
- Cook, N.J. The Designer’s Guide to Wind Loading of Building Structures; Butterworth-Heinemann Ltd.: London, UK, 1985. [Google Scholar]
- Kim, J.Y.; Yu, E.; Kim, D.Y.; Kim, S.D. Calibration of analytical models to assess wind-induced acceleration responses of tall buildings in serviceability level. Eng. Struct. 2009, 31, 2086–2096. [Google Scholar] [CrossRef]
- Tamura, Y.; Suganuma, S.Y. Evaluation of amplitude-dependent damping and natural frequency of buildings during strong winds. Wind Eng. Ind. Aerod. 1996, 59, 115–130. [Google Scholar] [CrossRef]
- Xia, Y.; Xu, Y.L.; Wei, Z.L.; Zhu, H.P.; Zhou, X.Q. Variation of structural vibration characteristics versus non-uniform temperature distribution. Eng. Struct. 2011, 33, 146–153. [Google Scholar] [CrossRef]
- Peeters, B.; De Roeck, G. Reference-based stochastic subspace identification for output-only modal analysis. Mech. Syst. Signal Pr. 1999, 13, 855–878. [Google Scholar] [CrossRef]
- Cho, B.H.; Jo, J.S.; Joo, S.J.; Kim, H. Dynamic Parameter Identification of Secondary Mass Dampers Based on Full-Scale Tests. Comput.-Aided Civ. Inf. 2012, 27, 218–230. [Google Scholar] [CrossRef]
- Kim, H.; Ko, Y.N.; Cho, J.M. Evaluation of Ambient Vibration Test Method for Historic Wooden Buildings Based on the Rigid Diaphragm Assumption. J. Asian Archit. Build. 2016, 15, 287–294. [Google Scholar] [CrossRef]
© 2020 by the authors. Licensee MDPI, Basel, Switzerland. This article is an open access article distributed under the terms and conditions of the Creative Commons Attribution (CC BY) license (http://creativecommons.org/licenses/by/4.0/).