Article

Smart Transformers as Active Interfaces Enabling the Provision of Power-Frequency Regulation Services from Distributed Resources in Hybrid AC/DC Grids

by
Justino Rodrigues
1,*,†,
Carlos Moreira
1,2 and
João Peças Lopes
2
1
CPES—INESC TEC, FEUP Campus, Rua Dr. Roberto Frias, 4200-465 Porto, Portugal
2
DEEC—Faculty of Engineering of the University of Porto, Rua Dr. Roberto Frias, 4200-465 Porto, Portugal
*
Author to whom correspondence should be addressed.
Current address: CPES—INESC TEC, FEUP campus, Rua Dr. Roberto Frias, 4200-465 Porto, Portugal.
Appl. Sci. 2020, 10(4), 1434; https://doi.org/10.3390/app10041434
Submission received: 10 December 2019 / Revised: 7 February 2020 / Accepted: 15 February 2020 / Published: 20 February 2020

Abstract

:
Smart Transformers (STs) are being envisioned as a key element for the controllability of distribution networks in a future context of Renewable Energy Source (RES), Energy Storage System (ESS) and Electric Vehicle (EV) massification. Additionally, STs enable the deployment of hybrid AC/DC networks, which offer important advantages in this context. In addition to offering further degrees of controllability, hybrid AC/DC networks are more suited to integrate DC resources such as DC loads, PV generation, ESS and EV chargers. The purpose of the work developed in this paper is to address the feasibility of exploiting STs to actively coordinate a fleet of resources existing in a hybrid AC/DC network supplied by the ST aiming to provide active power-frequency regulation services to the upstream AC grid. The feasibility of the ST to coordinate the resources available in the hybrid distribution AC/DC network in order to provide active power-frequency regulation services is demonstrated in this paper through computational simulation. It is demonstrated that the aforementioned goal can be achieved using droop-based controllers that can modulate controlled variables in the ST.

1. Introduction

Renewable energy is expected to be the main source of electricity generation in the next few years [1]. This change is expected to rely on an increasing amount of generation units being connected to the distribution grid, widely designated as Distributed Generation (DG) [2]. Alongside, the transportation sector is expected to move forward towards electrification as well. Electric Vehicles (EVs) are expected to have an increasing share in the global system load [3], requiring proper control and management strategies for charging their batteries [4,5] in order to mitigate adverse impacts that may result in the operation and control of the electric power system. The deployment of large-scale Renewable Energy Sources (RES) also has system-wide and localized impacts in terms of electric power system operation and control practices. Challenges regarding frequency regulation, voltage regulation and inertia provision are among the most important adverse impacts being addressed [6,7,8,9,10]. In particular, the power-frequency regulation adequacy in systems dominated by converter-interfaced generation systems is becoming a key concern. The wide nature of the aforementioned challenges has led to a push for the design of specific grid codes as well as advanced grid management solutions in order to mitigate the resulting impacts [11,12,13].
Within the domain of smart grids, pioneering concepts such as microgrids and more microgrids are widely regarded as key elements to address the need to increase the controllability and observability of the electric power system in the face of the expected large-scale deployment of RES and EV [14,15,16,17,18]. AC microgrids initially attracted attention for historical and technical reasons [14,15,19], with several implementations existing already worldwide [14]. However, important advancements in power electronics have attracted an increasing amount of attention to DC distribution microgrids. DC microgrids are better suited to integrate DC resources such as PV generation, EV charging stations and Energy Storage Systems (ESS) [20,21].
In this scope, the Smart Transformer (ST) is being envisioned as a suitable solution to increase the controllability and observability of distribution networks [22,23,24]. The ST is based on the adaptation of the three-stage Solid-State Transformer (SST) concept for the provision of advanced control functionalities to the distribution grids, in detriment of reductions in weight and volume [22,23]. The DC link connectivity offered by the ST enables the development and controllability of hybrid AC/DC distribution networks, thus offering the possibility to exploit the microgrid concept based on hybrid AC/DC networks [22,23,24]. A possible approach regarding the exploitation of the ST as an enabler for the autonomous operation of AC distribution grid sections under the multi-microgrid concept is addressed in [25]. Moreover, the ST creates opportunities in terms of local and direct integration of ESS with hybrid AC/DC networks, which represents a suitable solution to address the local RES variability and underlying local impacts, such as in voltage control [26].
However, among the opportunities offered by the ST in terms of controllability and observability of hybrid AC/DC distribution networks, important research gaps are still to be addressed. An important research gap identified in the literature is the absence of comprehensive studies addressing the provision of power-frequency regulation services to the upstream AC system by exploiting the flexibility available in hybrid AC/DC distribution grids connected to an ST. The focus of this paper is to address this research gap.
Being a converter-interfaced apparatus, the ST provides inherent decoupling in terms of voltage and frequency between the upstream Medium-Voltage (MV) network and its hybrid AC/DC distribution grid. This feature offers additional control possibilities involving the resources located in the hybrid distribution grid fed by the ST. However, it prevents the resources located in the hybrid distribution grid downstream the ST from providing power-frequency regulation services directly to the upstream AC power system, which constitutes a major drawback regarding current grid code developments for AC power grids [13]. As a result, the ST is required to incorporate advanced control solutions to coordinate all the resources available in the hybrid distribution grid downstream the ST in order to overcome such a limitation.
In the literature, it is possible to identify some approaches addressing the possibility of using the ST to control the frequency in the AC grid connected to it, aiming to enable the power-frequency response of the resources existing in the same grid [27,28,29]. This operation principle envisioned for the ST has been exploited within the scope of limiting the reverse power flow to the upstream grid in case of high generation in the grid connected to it [29], as well as to mitigate the risk of overloading conditions in an ST [24,28]. However, they are not designed for the provision of power-frequency regulation services to the upstream AC system.
The regulation of active power demand in the LV AC network fed by an ST as a function of frequency deviations in the main power system can also be achieved through the estimation and exploitation of load voltage sensitivity in LV AC networks, as demonstrated in [24,28,30,31]. However, the presented approaches are not designed to be applied to the DC network sections integrating a hybrid AC/DC distribution network fed by a ST.
From the literature review, it is possible to conclude that the exploitation of the resources available in both AC and DC sections of a hybrid AC/DC network fed by an ST, regarding the provision of power-frequency regulation services to the upstream system, remains comprehensibly unexplored. The main contribution of this paper is to present a set of advanced control functionalities, to be embedded in the ST, capable of enabling the ST to actively coordinate the fleet of resources available in both AC and DC sections of a hybrid AC/DC distribution grid supplied by the ST in order to enable active power-frequency regulation services to the upstream AC grid.
The proposed control functionalities are based on a coordinated action of droop controllers and are extensively demonstrated through computational simulations developed in a MATLAB®/Simulink® environment. The presented control solutions are expected to take an active role in future power systems regarding the expected reduction of the power system capability to perform frequency regulation, as a result of the progressive decommissioning of large synchronous generators that should take place in the face of increasing penetration of RES.

2. Computational Simulation Models

In order to attain the main goals proposed in this paper, a test network was modeled and studied in a computational simulation environment. The overall structure of the test network comprises a hybrid AC/DC distribution grid supplied by an ST that is connected to an upstream MV distribution grid, as depicted in Figure 1. The modeled ST is described in Section 2.1. The modeled hybrid AC/DC distribution network emerging from the ST comprises MV and LV DC networks (described in Section 2.2) and an LV AC network (described in Section 2.3). The controllable Distributed Energy Resources (DER) incorporated in the hybrid distribution network were modeled according to the description presented in Section 2.4. The MV AC network representing the main power system to which the ST is connected is modeled through a simplified equivalent generator and an equivalent load, as described in Section 2.5.
The computational simulation models were developed in a MATLAB®/Simulink® environment in accordance with some underling principles. The development of simulation models for electric power systems incorporating a large number of power-converter-based systems is usually based on the use of phase simulation models, as is evidenced in [25,32,33]. The phasor modeling approach has been demonstrated to have adequate representativeness regarding the main dynamics of the system, while demanding a low computational burden. This is achieved by neglecting the switching nature of electronic switches in power converters, as well as harmonics. More recently, and within the scope of developing simulation models for ST, a Dynamic Average Modeling (DAM) technique is proposed in [34]. DAM approximates the behavior of power electronic converters by applying the moving average operator at the switching frequency to the detailed switching model. Using this technique, the switching effects are removed from the model, but preserving the dynamic behavior of the electronic power converters [34]. As a result, a DAM can reproduce with a high accuracy the transient behavior of the original detailed switching model but using a larger time step size, thus allowing a faster simulation of systems containing several power electronic converters [34]. Therefore, the DAM modeling approach is used in this work given its superior performance in the representation of the converter operation with larger simulation steps.
Based on the aforementioned considerations, the developed models were structured in two layers at the simulation level aggregating, respectively, the electric grid components and the control structures of the ST itself, each one running at different time steps, as follows:
  • The simulation layer encompassing the electrical grid components (cables, loads—impedance types—filter of the power converters, etc.) was defined to operate with a time step of 10 μ s (100 kHz). The chosen time step was chosen as a compromise between simulation accuracy and simulation speed, following the value adopted in [34];
  • The simulation layer encompassing the control structures and electronic power components of the ST itself was modeled according to the aforementioned DAM approach, but considering a switching frequency of 20 kHz for the power converters, which results in a simulation time step of 50 μ s. The switching elements are replaced by controlled voltage and current sources, where the respective controlling signals are discretized according the switching frequency chosen to the replaced switching elements. The motive for this distinction is because a switching frequency of 20 kHz is more realistic (comparatively to 100 kHz) when considering high power electronic converters [22,35,36]. Thus, this approach allows further improvements in the computational performance of the developed models.

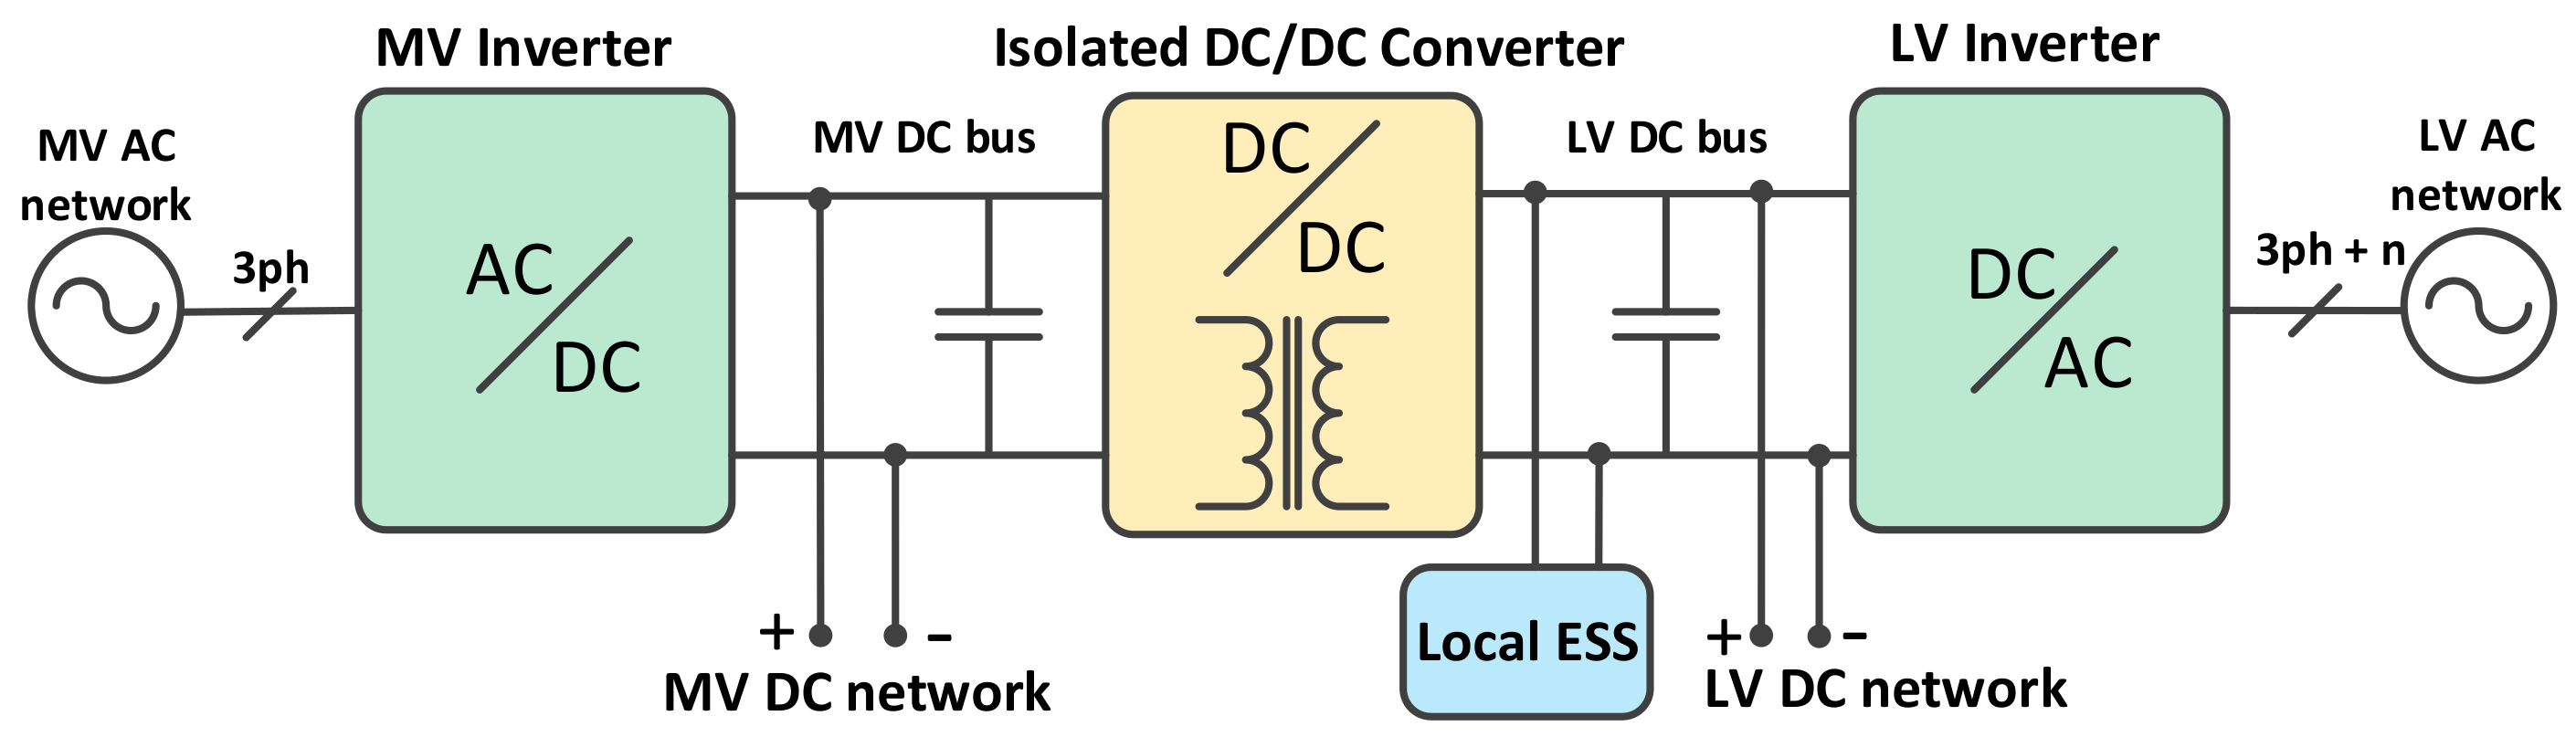
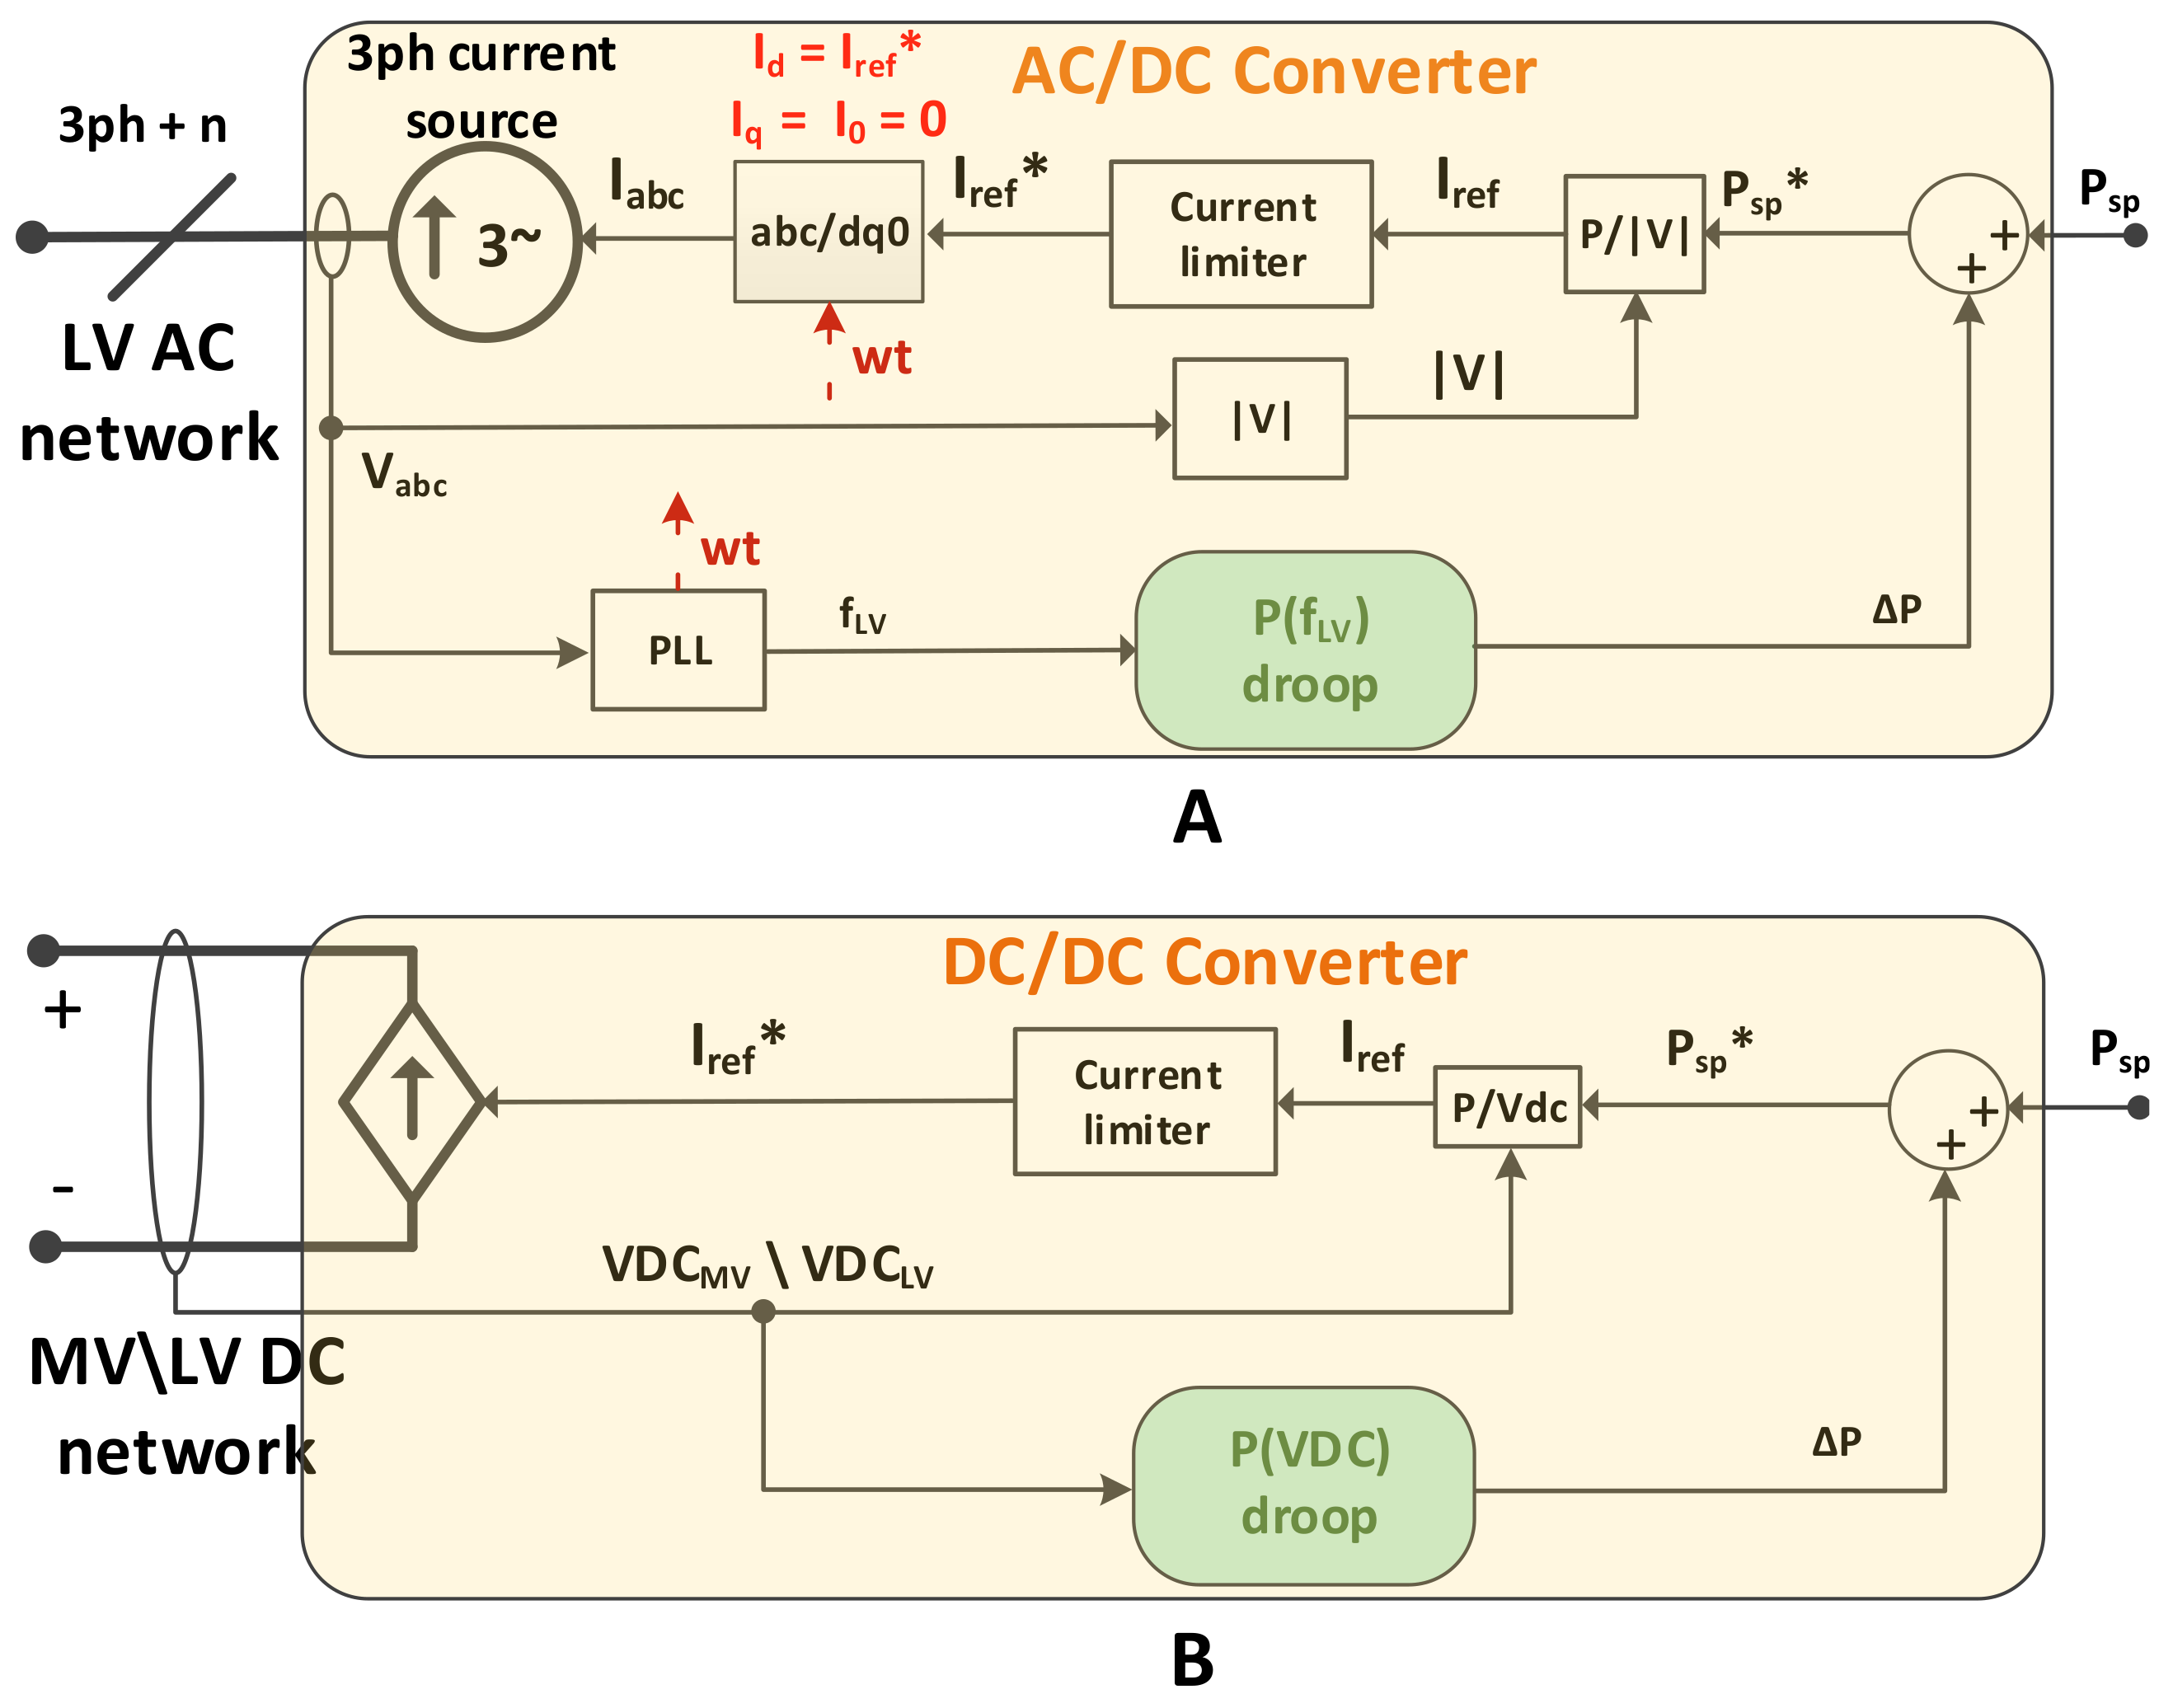
2.1. Smart Transformer

The aforementioned computational models revolve around a three-stage ST incorporating a local ESS, represented in Figure 2. The adopted modeling approach for the main blocks integrating the ST is presented in the next subsections.

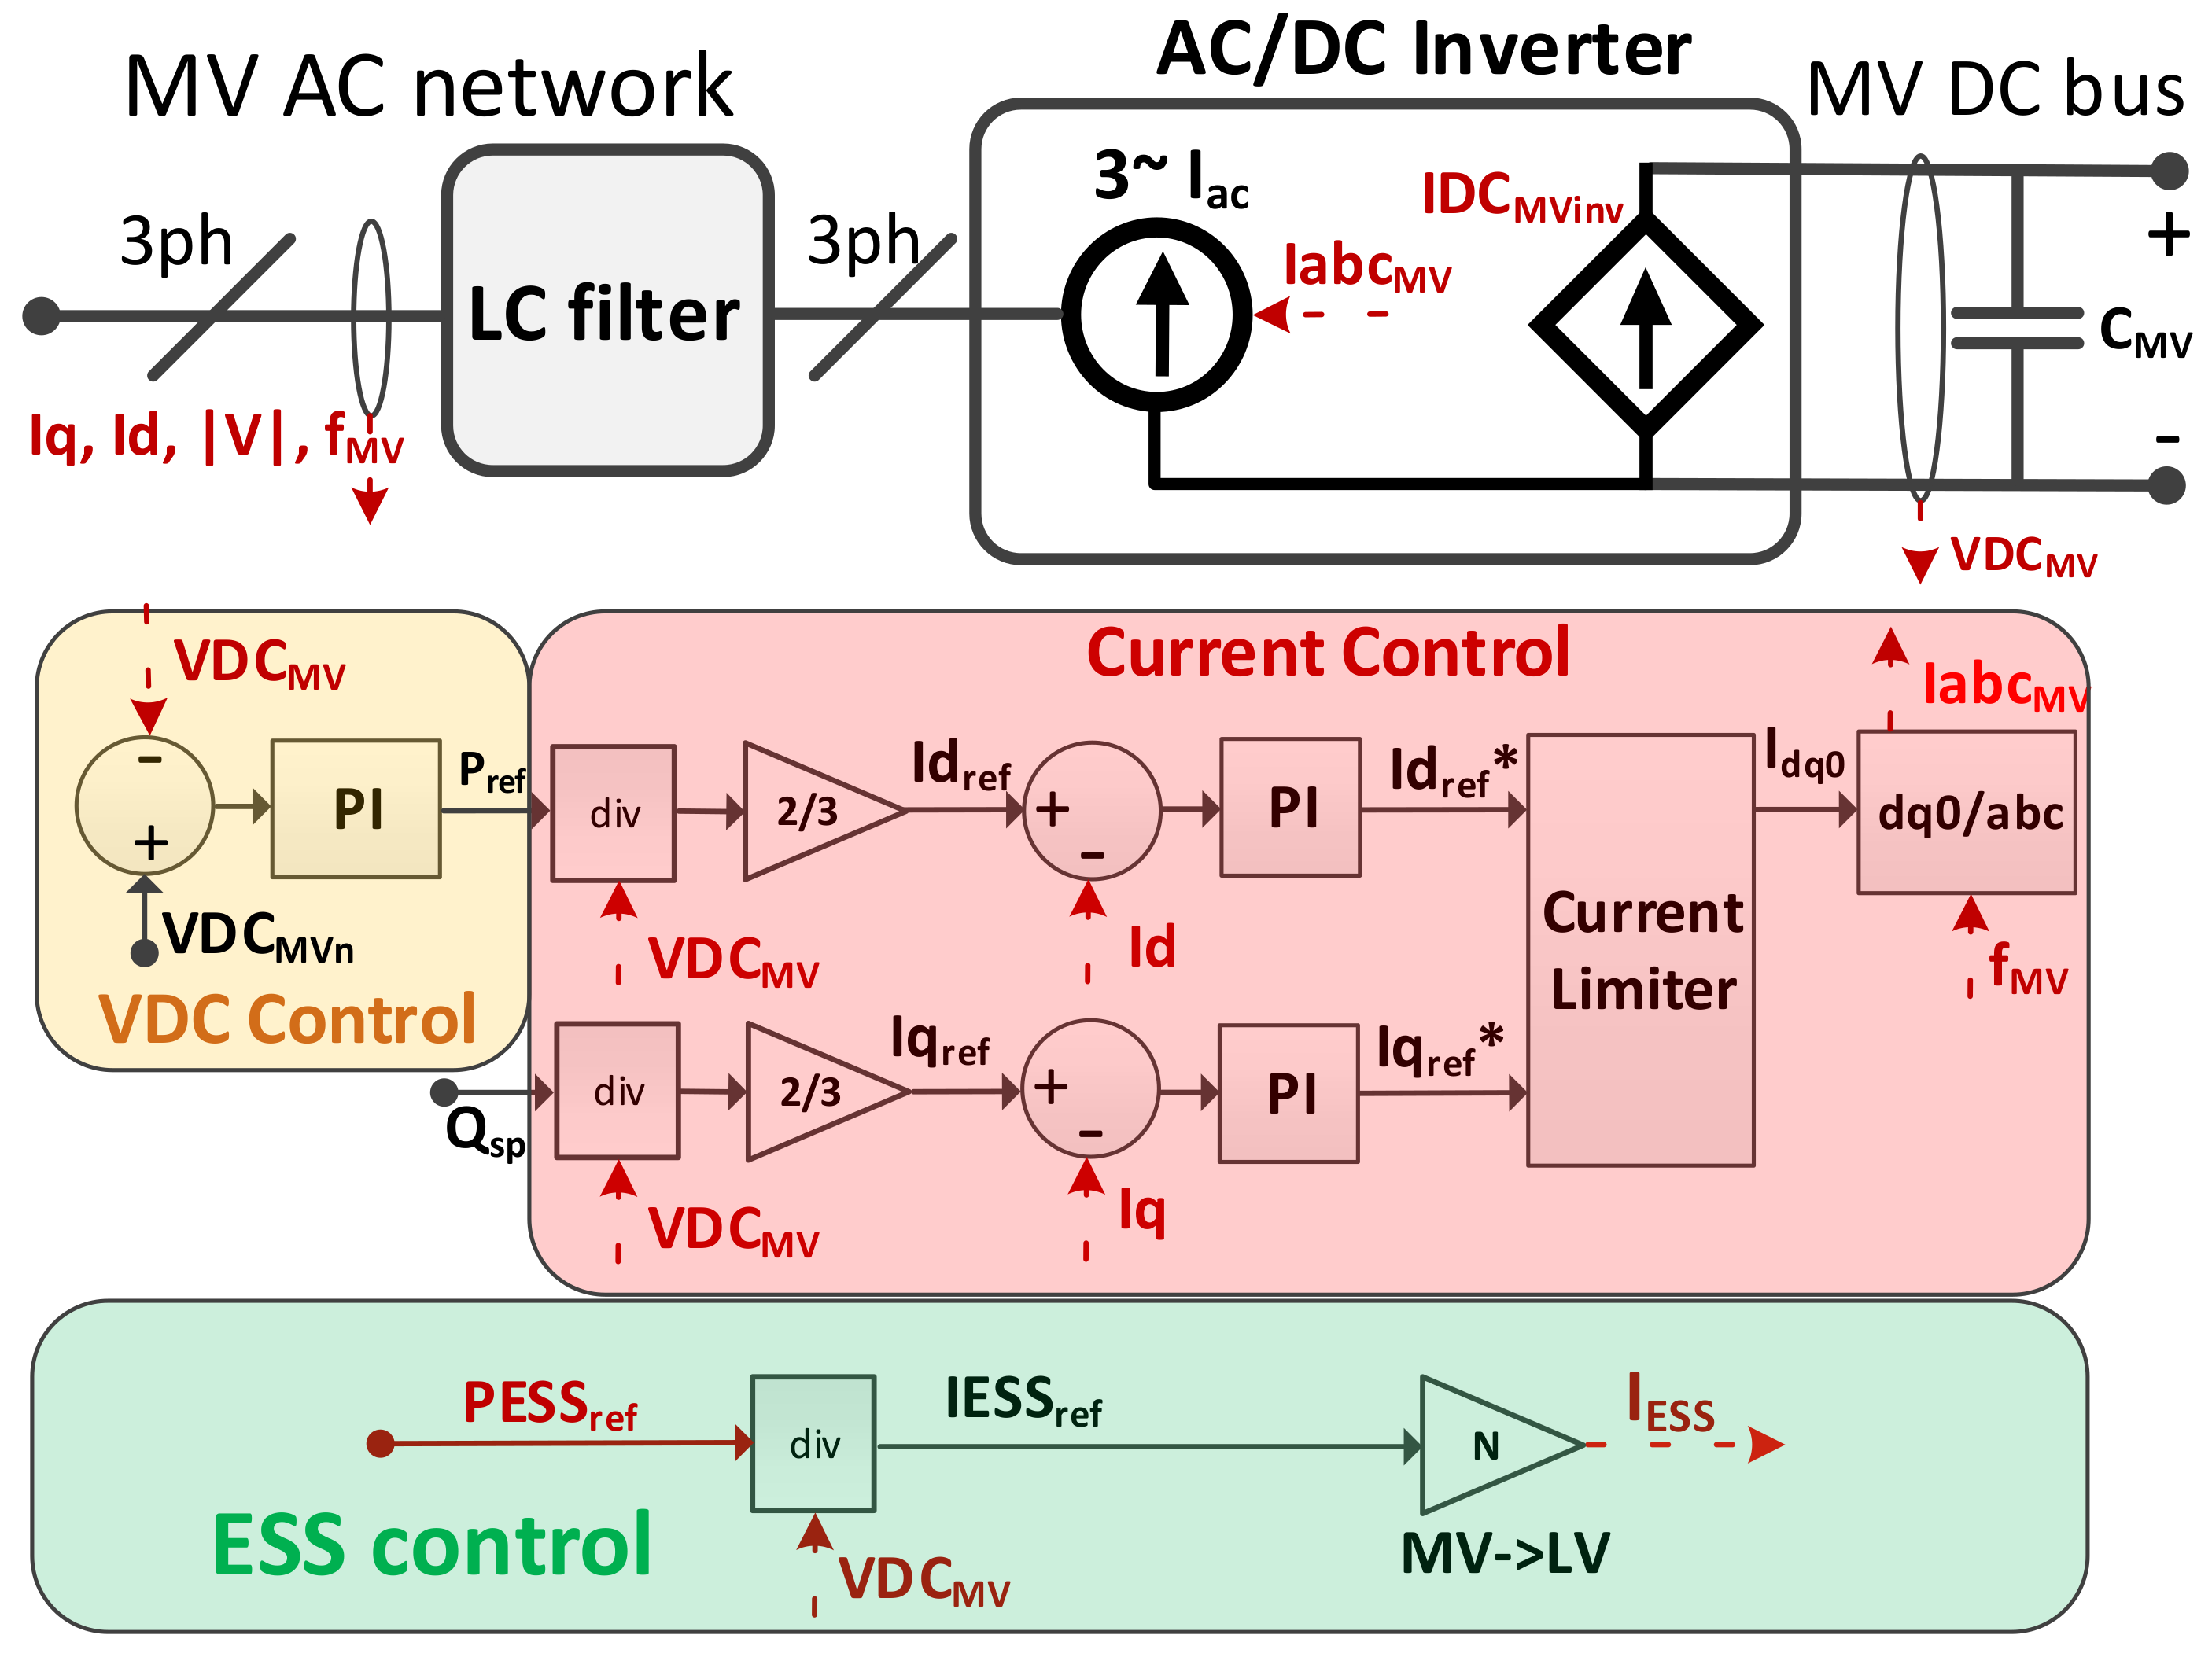
2.1.1. Medium Voltage Inverter

An overall representation of the ST’s MV inverter model and associated control structure is shown in Figure 3. The power stage of the ST’s MV inverter is modeled in the AC/DC Inverter block. The MV inverter is operated in grid-tied mode, thus controlling the active and reactive current injected in the MV network. For that reason, the interface of the MV inverter with the MV AC network was modeled using controlled current sources. According to the DAM approach, the low-level voltage control loop and the modulation mechanisms (e.g., PWM, SPWM or others) can be neglected without affecting the dynamics of the controller of the MV inverter [34]. The interface of the MV inverter with the MV DC bus is modeled using a controlled current source.
Equations (1)–(3) define the power balance between the MV inverter and the remaining elements connected to the MV DC bus.
I D C M V i n v = P M V I n v V D C M V = 1 V D C M V V a M V · I a M V + V b M V · I b M V + V c M V · I c M V
V D C M V = 1 C M V I M V c a p d t
I M V c a p = I D C M V i n v + I D A B M V + I D C M V g
The power transference between the MV network and the MV DC bus is determined by Equation (1), where I D C M V i n v is the DC current in the controlled current source interfacing the MV DC bus, P M V I n v is the active power in the MV inverter, V D C M V is the DC voltage in the MV DC bus, V a M V , V b M V , V c M V are the MV AC voltages in each phase and I a M V , I b M V , I c M V are the AC currents in each phase. The relation between I D C M V i n v and the MV DC bus is given by Equations (2) and (3), where C M V is the capacitance of the MV DC bus, I M V c a p is the current flowing to C M V , I D A B M V is the current exchanged between the MV DC bus and the isolated DC/DC converter and I D C M V g is the current exchanged between the MV DC bus and the MV DC network. By controlling I D C M V i n v , it is possible to control V D C M V in order to follow the reference value for the voltage in the MV DC bus ( V D C M V n ) .
The LC filter coupling the MV inverter to the upstream MV AC grid was also considered in the model, since it affects the main dynamics of the MV inverter’s controller. The LC filter was dimensioned according to Equations (4) and (5), where L is the filter inductance, C is the filter capacitance, f c is the cut-off frequency and Z 0 is the characteristic impedance of the filter. Z 0 is given by Equation (6), where VDC MVn is the nominal voltage of the MV DC link of the MV inverter and IMVmax p is the maximum AC current peak value of the MV inverter. A f c value of 2 kHz was also considered, providing an acceptable rejection of the harmonic content which would derive from the power inverter switching at 20 kHz (−40 dB/decade) while preserving an acceptable control bandwidth for the power inverter.
f c = 1 2 π L C
Z 0 = L C
Z 0 = V D C M V n I M V m a x p
Regarding the control structure, three main control structures are identified: VDC Control, Current Control and ESS Control. Since voltage/VAr support is not addressed in this paper, reactive power injection is set to zero.
The VDC Control is responsible for regulating VDC MV , by generating a reference for the active power ( P ref ). A PI controller is used to calculate P ref using the error between VDC MV and VDC MVn . P ref is used by the Current Control to determine the reference for the active current ( Id ref ) to be followed by the MV inverter. The reference for the reactive current ( Iq ref ) is set to zero, since voltage/VAr support is not addressed in this paper. Id ref and Iq ref are then compared with the measured values for the direct current ( Id ) and quadrature current ( Iq ). The resulting errors are processed by PI controllers, and new references for the direct current ( Id ref * ) and quadrature current ( Iq ref * ) are obtained in order to eliminate the steady-state error. Finally, Id ref * and Iq ref * are checked by the Current Limiter in order to ensure that the nominal current of the MV inverter is not exceeded.
The current in the ESS ( I ESS ) is given by Equation (7), where PESS ref is the reference power set-point defined for the ESS and N is the voltage transformation ratio of the isolated DC–DC converter (the ESS is connected to the ST’s LV DC bus).
I ESS = N · P E S S r e f V D C M V

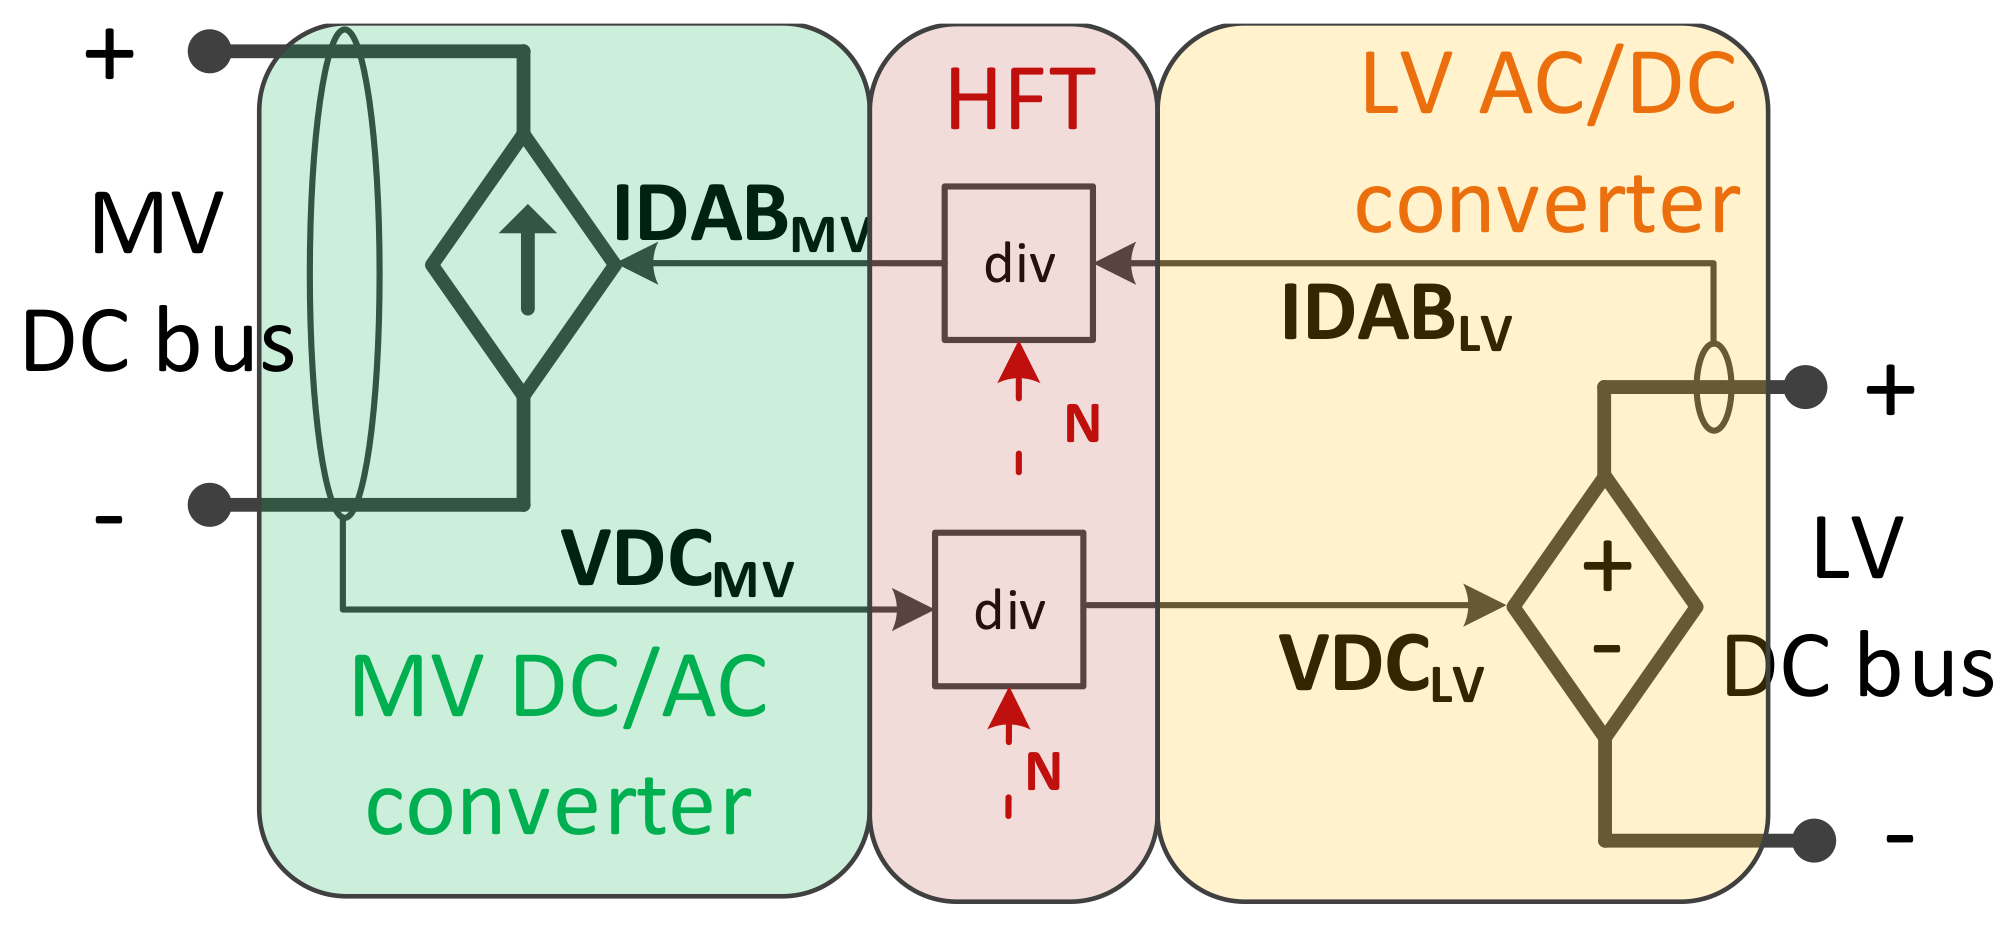
2.1.2. Isolated DC/DC Converter

The isolated DC/DC converter was modeled following the principles of an ideal Dual-Active Bridge (DAB) DC/DC converter, according to the approach presented in [37]. The power output in the LV side of the DAB Converter ( P D C L V ) can be obtained using Equations (8) and (9), defined as a function of the MV DC voltage in the primary stage V D C M V , the LV DC voltage in the secondary stage V D C L V , the transformation ratio N, the primary-referred leakage reactance X L of the High-Frequency Transformer (HFT) and the phase-shift ϕ between the square waveforms applied to the HFT.
P D C L V = V D C M V 2 X L d ϕ 1 | ϕ | π
d = V D C L V N V D C M V
Considering the results presented in [37], the dynamics of a DAB converter is much faster than the dynamics related to voltage variations in the MV DC bus. Therefore, two assumptions can be made in the modeling of the isolated DC/DC converter. First, the DC/DC power electronic converters can be modeled using two controllable sources according to the DAM approach [34], which are electrically independent in order to consider galvanic isolation. Second, the mathematical relations presented in Equations (10) and (11) are valid for an ideal DAB converter, where P D C M V is the converter input power, I D A B M V is the DC current in the primary stage, I D A B L V is the DC current in the secondary stage and the remaining variables are as defined for Equation (8). Given this, the HFT and the control loops needed to regulate the d and ϕ variables in Equation (8) can be replaced by simplified feedback control loops depending only on measured voltages and currents and on the transformation ratio, as shown in Figure 4. The transformation ratio N is assumed to be fixed, in order to regulate LV DC bus as a function of the DC voltage in the MV DC bus.
P D C L V = P D C M V = V D C M V I D A B M V I D A B M V = V D C M V X L d ϕ 1 | ϕ | π
V D C M V I D A B M V = V D C L V I D A B L V V D C M V I D A B L V N = V D C M V N I D A B L V

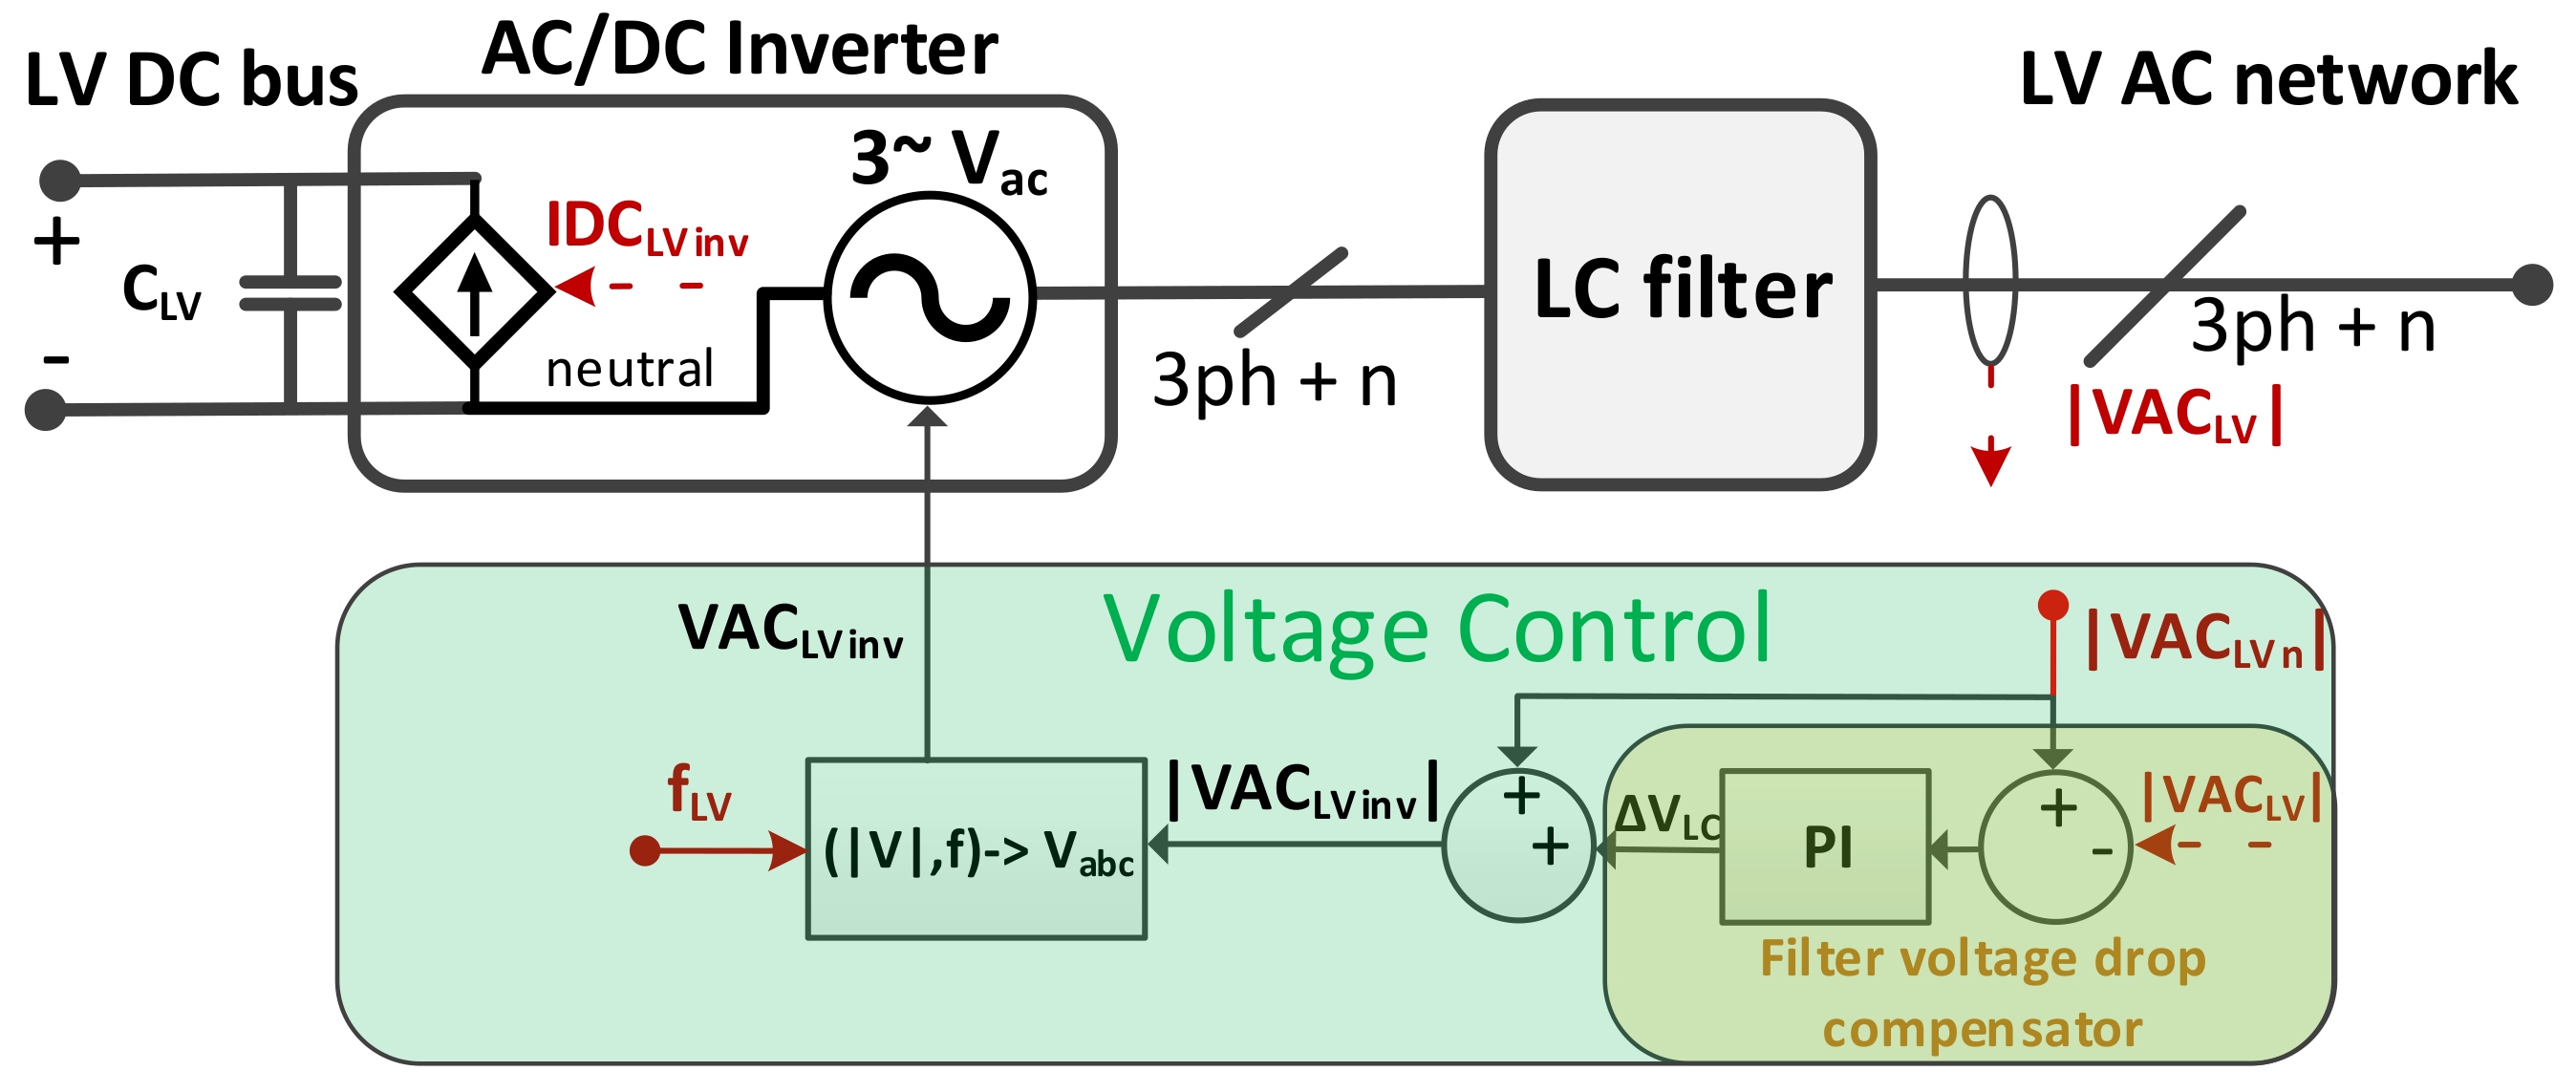
2.1.3. Low Voltage Inverter
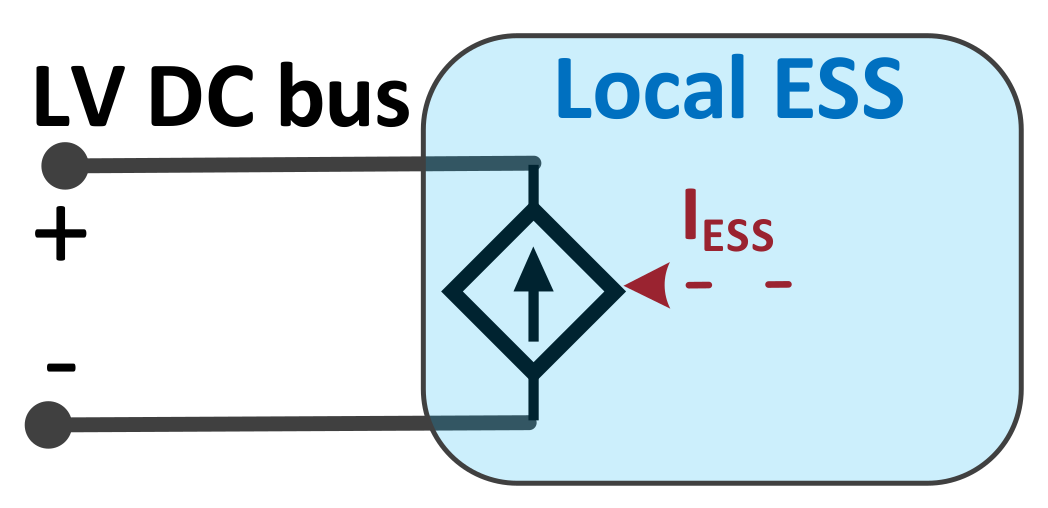
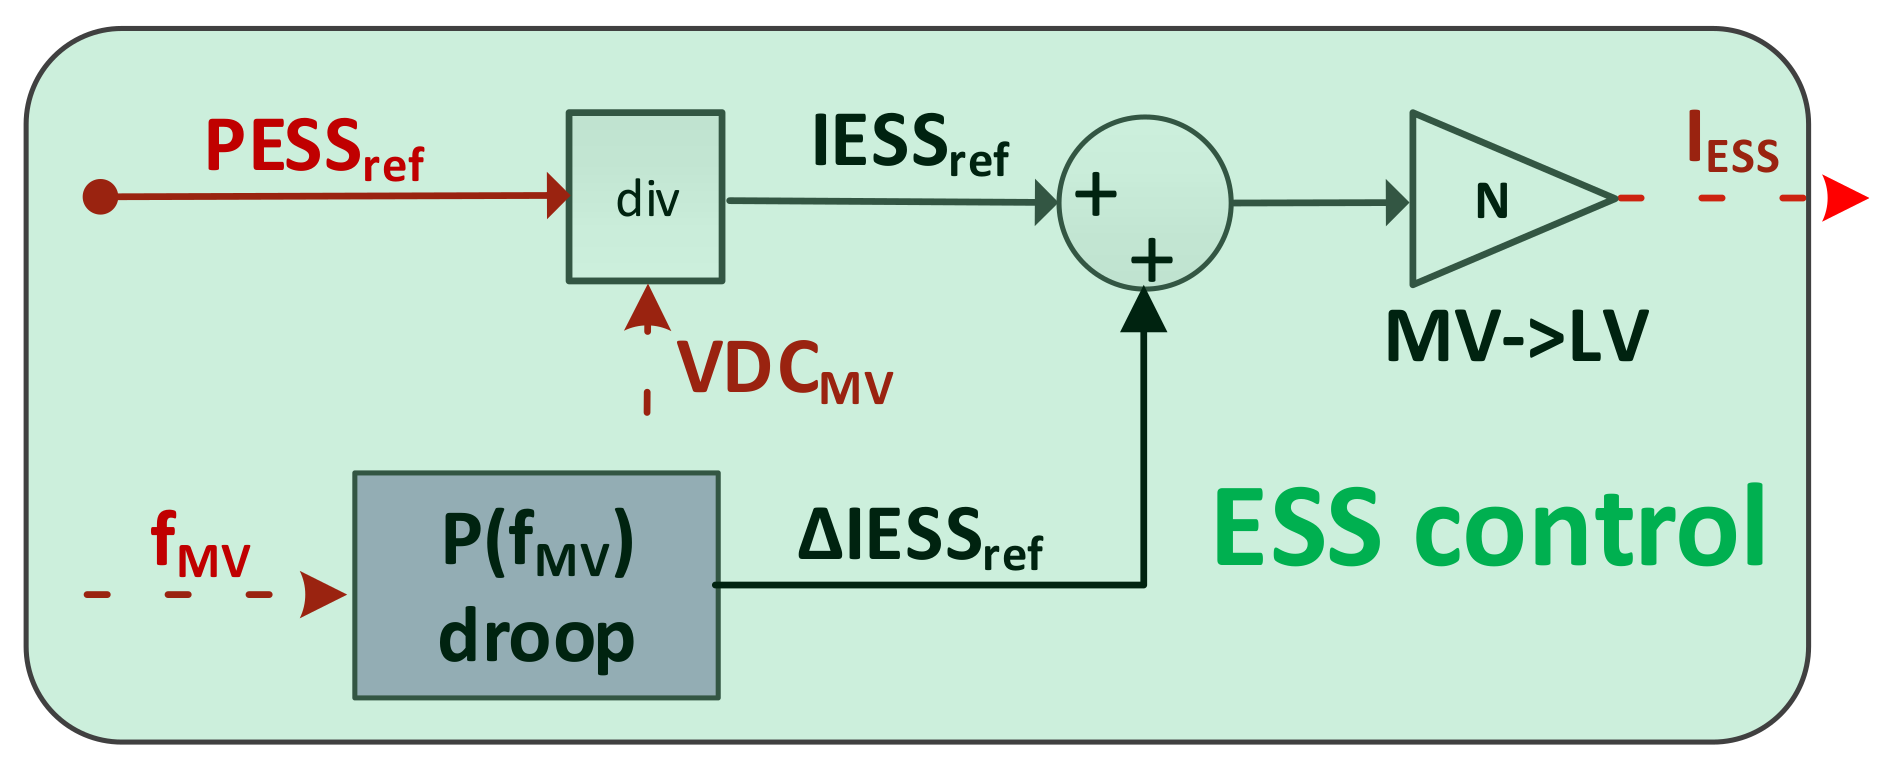
An overall representation of the ST’s LV inverter model and associated control structure is shown in Figure 5. This inverter is in charge of forming the LV AC network to which other resources are to be connected.
The power stage of the LV inverter is modeled in the AC/DC Inverter block. The LV inverter operates in grid-forming mode, controlling the magnitude and phase of the voltages applied to the LV AC network. For that reason, the interface of the LV inverter with the LV AC network was modeled using controlled voltage sources. According to the DAM approach, the modulation mechanisms (e.g., PWM, SPWM or others) can be neglected without relevant impacts in the dynamics of the controller of the LV inverter [34].
The interface with the LV DC bus is implemented using a controlled current source. The power transference between the LV network and the LV DC bus is determined by Equation (12), where I D C L V i n v is the DC current in the controlled current source interfacing the LV DC bus, P L V I n v is the active power in the LV inverter, V D C L V is the DC voltage in the LV DC bus, V a L V , V b L V , V c L V are the LV AC voltages in each phase and I a L V , I b L V , I c L V are the AC currents in each phase.
I D C L V i n v = P L V I n v V D C L V = 1 V D C L V ( V a L V · I a L V + V b L V · I b L V + V c L V · I c L V )
Regarding the voltage in the LV DC bus, it is determined according to Equations (13) and (14), where C L V is the capacitance of the LV DC bus, I L V c a p is the current flowing to C L V , I D A B L V is the DC current in the secondary stage of the isolated DC/DC converter, I D C L V i n v is the DC current in the LV inverter, I D C L V g is the current exchanged between the LV DC bus and the LV DC network and I E S S is the current in the local ESS.
V D C L V = 1 C L V I L V c a p d t
I L V c a p = I D A B L V + I D C L V i n v + I D C L V g + I E S S
Given that a fixed transformation ratio N was chosen for the isolated DC/DC converter, the ST’s MV inverter is also responsible for regulating the voltage in the LV DC bus. Such a relationship is expressed by Equation (15), which can be obtained combining Equations (2), (3), (11), (13) and (14). Equation (15) shows that V D C L V is regulated only through I D C M V i n v , given that the remaining current variables will vary according the existing load/generation in the hybrid distribution network and the local ESS power set-point.
VDC LV = 1 C L V N 2 C M V I D C L V i n v + I D C L V g + I E S S N IDC MVinv + I D C M V g d t
Similarly to the MV inverter stage, a coupling LC filter used to connect the LV inverter to the LV AC network was also considered in the modeling approach, since it affects the main dynamics of the LV inverter stage. The LC filter was dimensioned according to Equations (4) and (5). Z 0 is given by Equation (16), where V D C L V n is the nominal voltage of the LV DC bus and I L V m a x p is the maximum AC current peak value of the LV inverter. A f c value of 2 kHz was considered for the LC filter to connect to the LV inverter, according to the considerations already made for the LC filter connected to the MV inverter stage.
Z 0 = V D C L V n I L V m a x p
Regarding the control structure, the Voltage Control generates a three-phase AC voltage ( VAC LVinv ) from the references for frequency ( f L V ) and magnitude ( | VAC LVinv | ) according to Equation (17).
VAC LVinv = V a V b V c = | VAC LVinv | · s i n f L V d t s i n 2 π 3 + f L V d t s i n 2 π 3 + f L V d t
| VAC LVinv | is determined by the sum of two contributions: the magnitude set-point | VAC LVn | and the component Δ V L C generated by the Filter voltage drop compensator. The purpose of the Filter voltage drop compensator is to compensate the voltage drop in the inverter’s output filter. Using a PI controller, the Filter voltage drop compensator compares the magnitude of the voltage measured after the output filter ( | VAC LV | ) with | VAC LVn | .

2.1.4. Local ESS

The local ESS incorporated in the ST is modeled as a controllable current source, controlled by an external reference current generated in the controller of the ST’s MV inverter ( I ESS ), as shown in Figure 6. The dimensioning of the local ESS is not addressed within this work since the phenomena under analysis do not require a high energy volume, and thus, it does not represent a critical issue. The DC/DC converter that would be associated to the energy storage and respective control structure were neglected under the assumption that their dynamics is much faster in comparison to the dynamics related to the frequency variations in the AC MV network to which the local ESS must react. Thus, it is possible to use I ESS to drive the controlled current source.

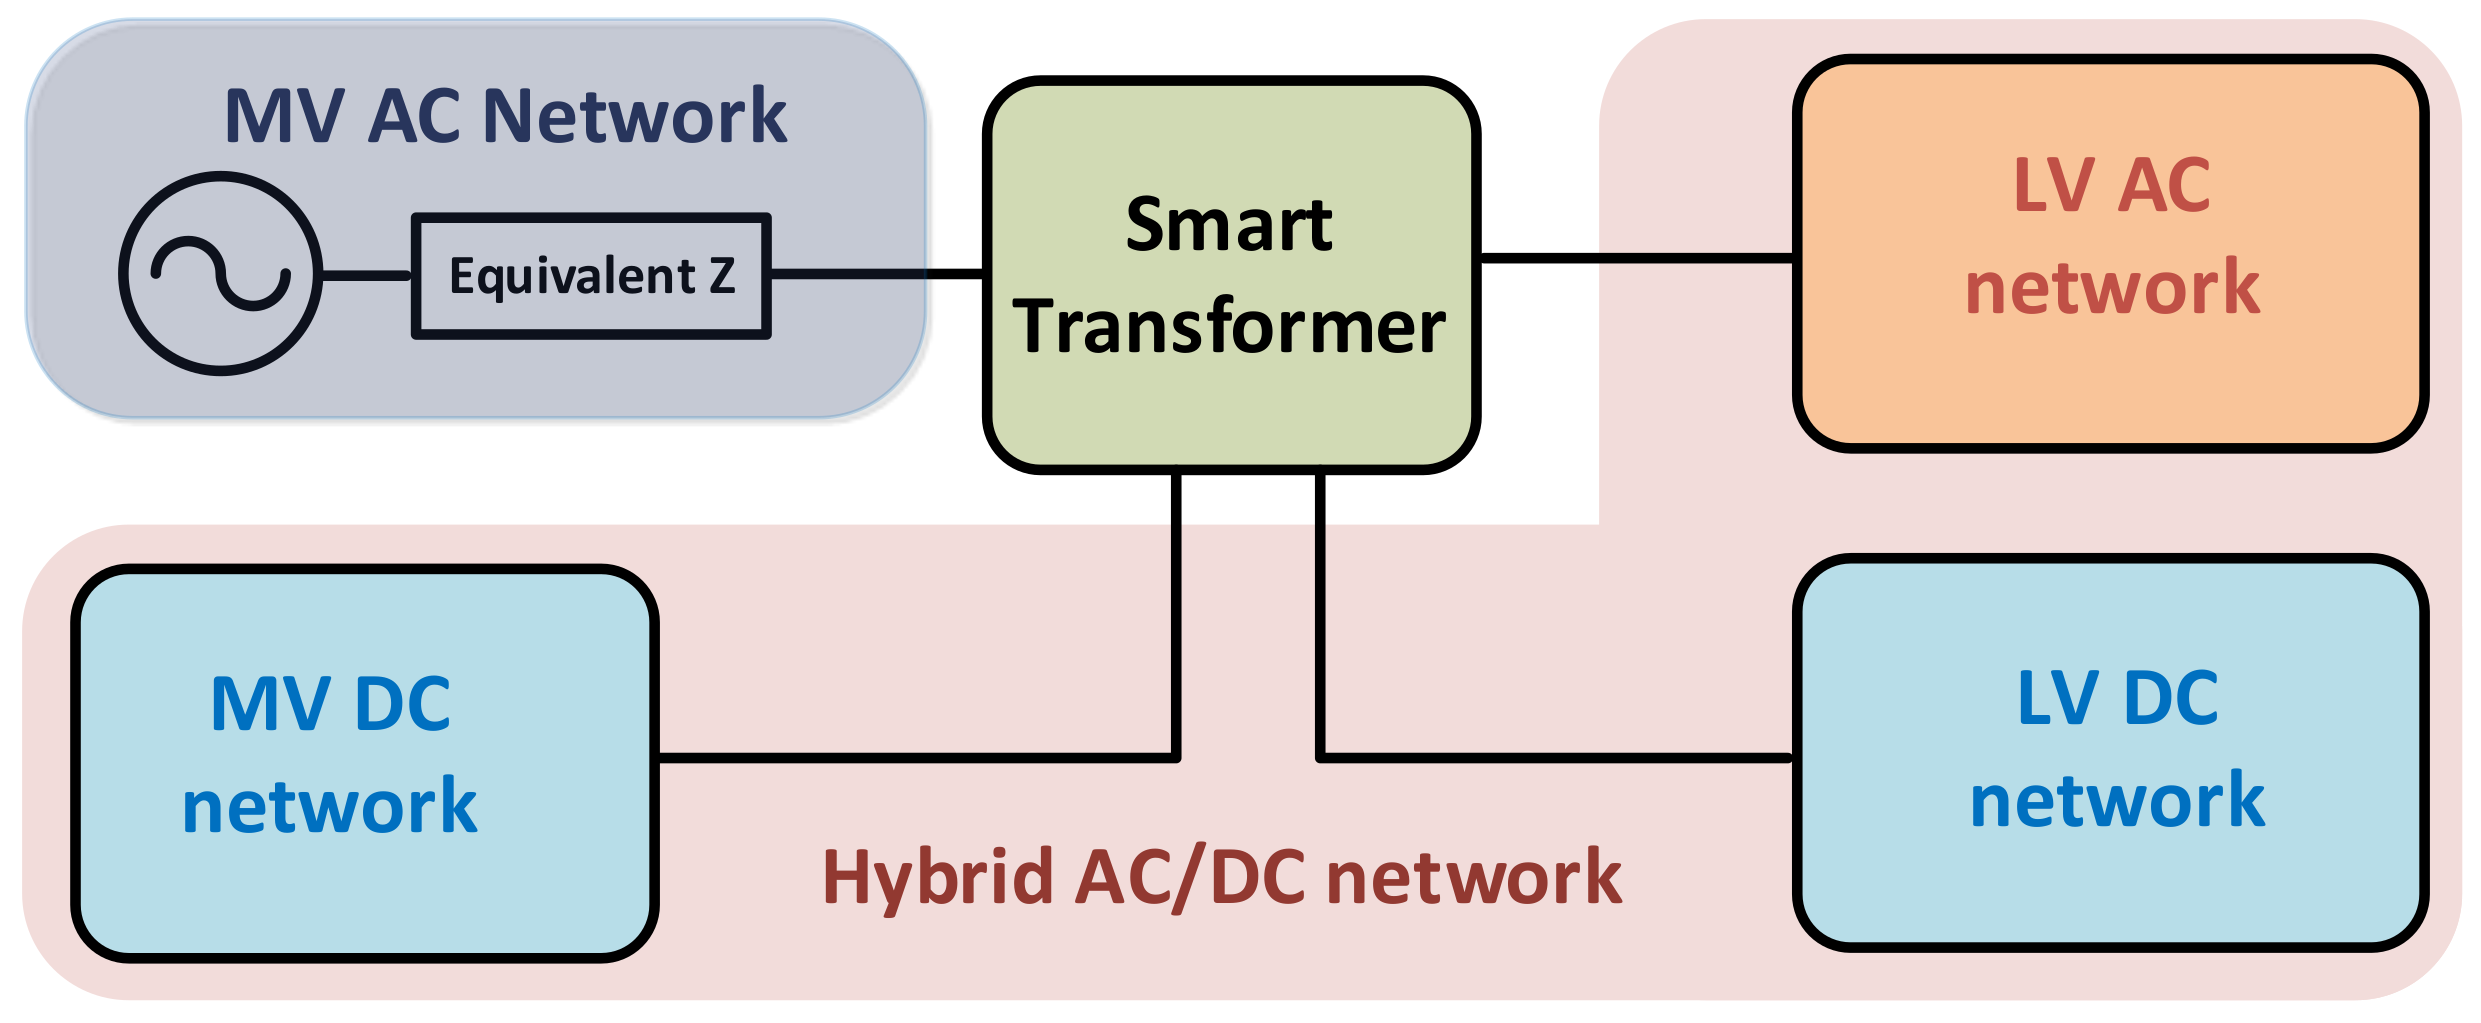
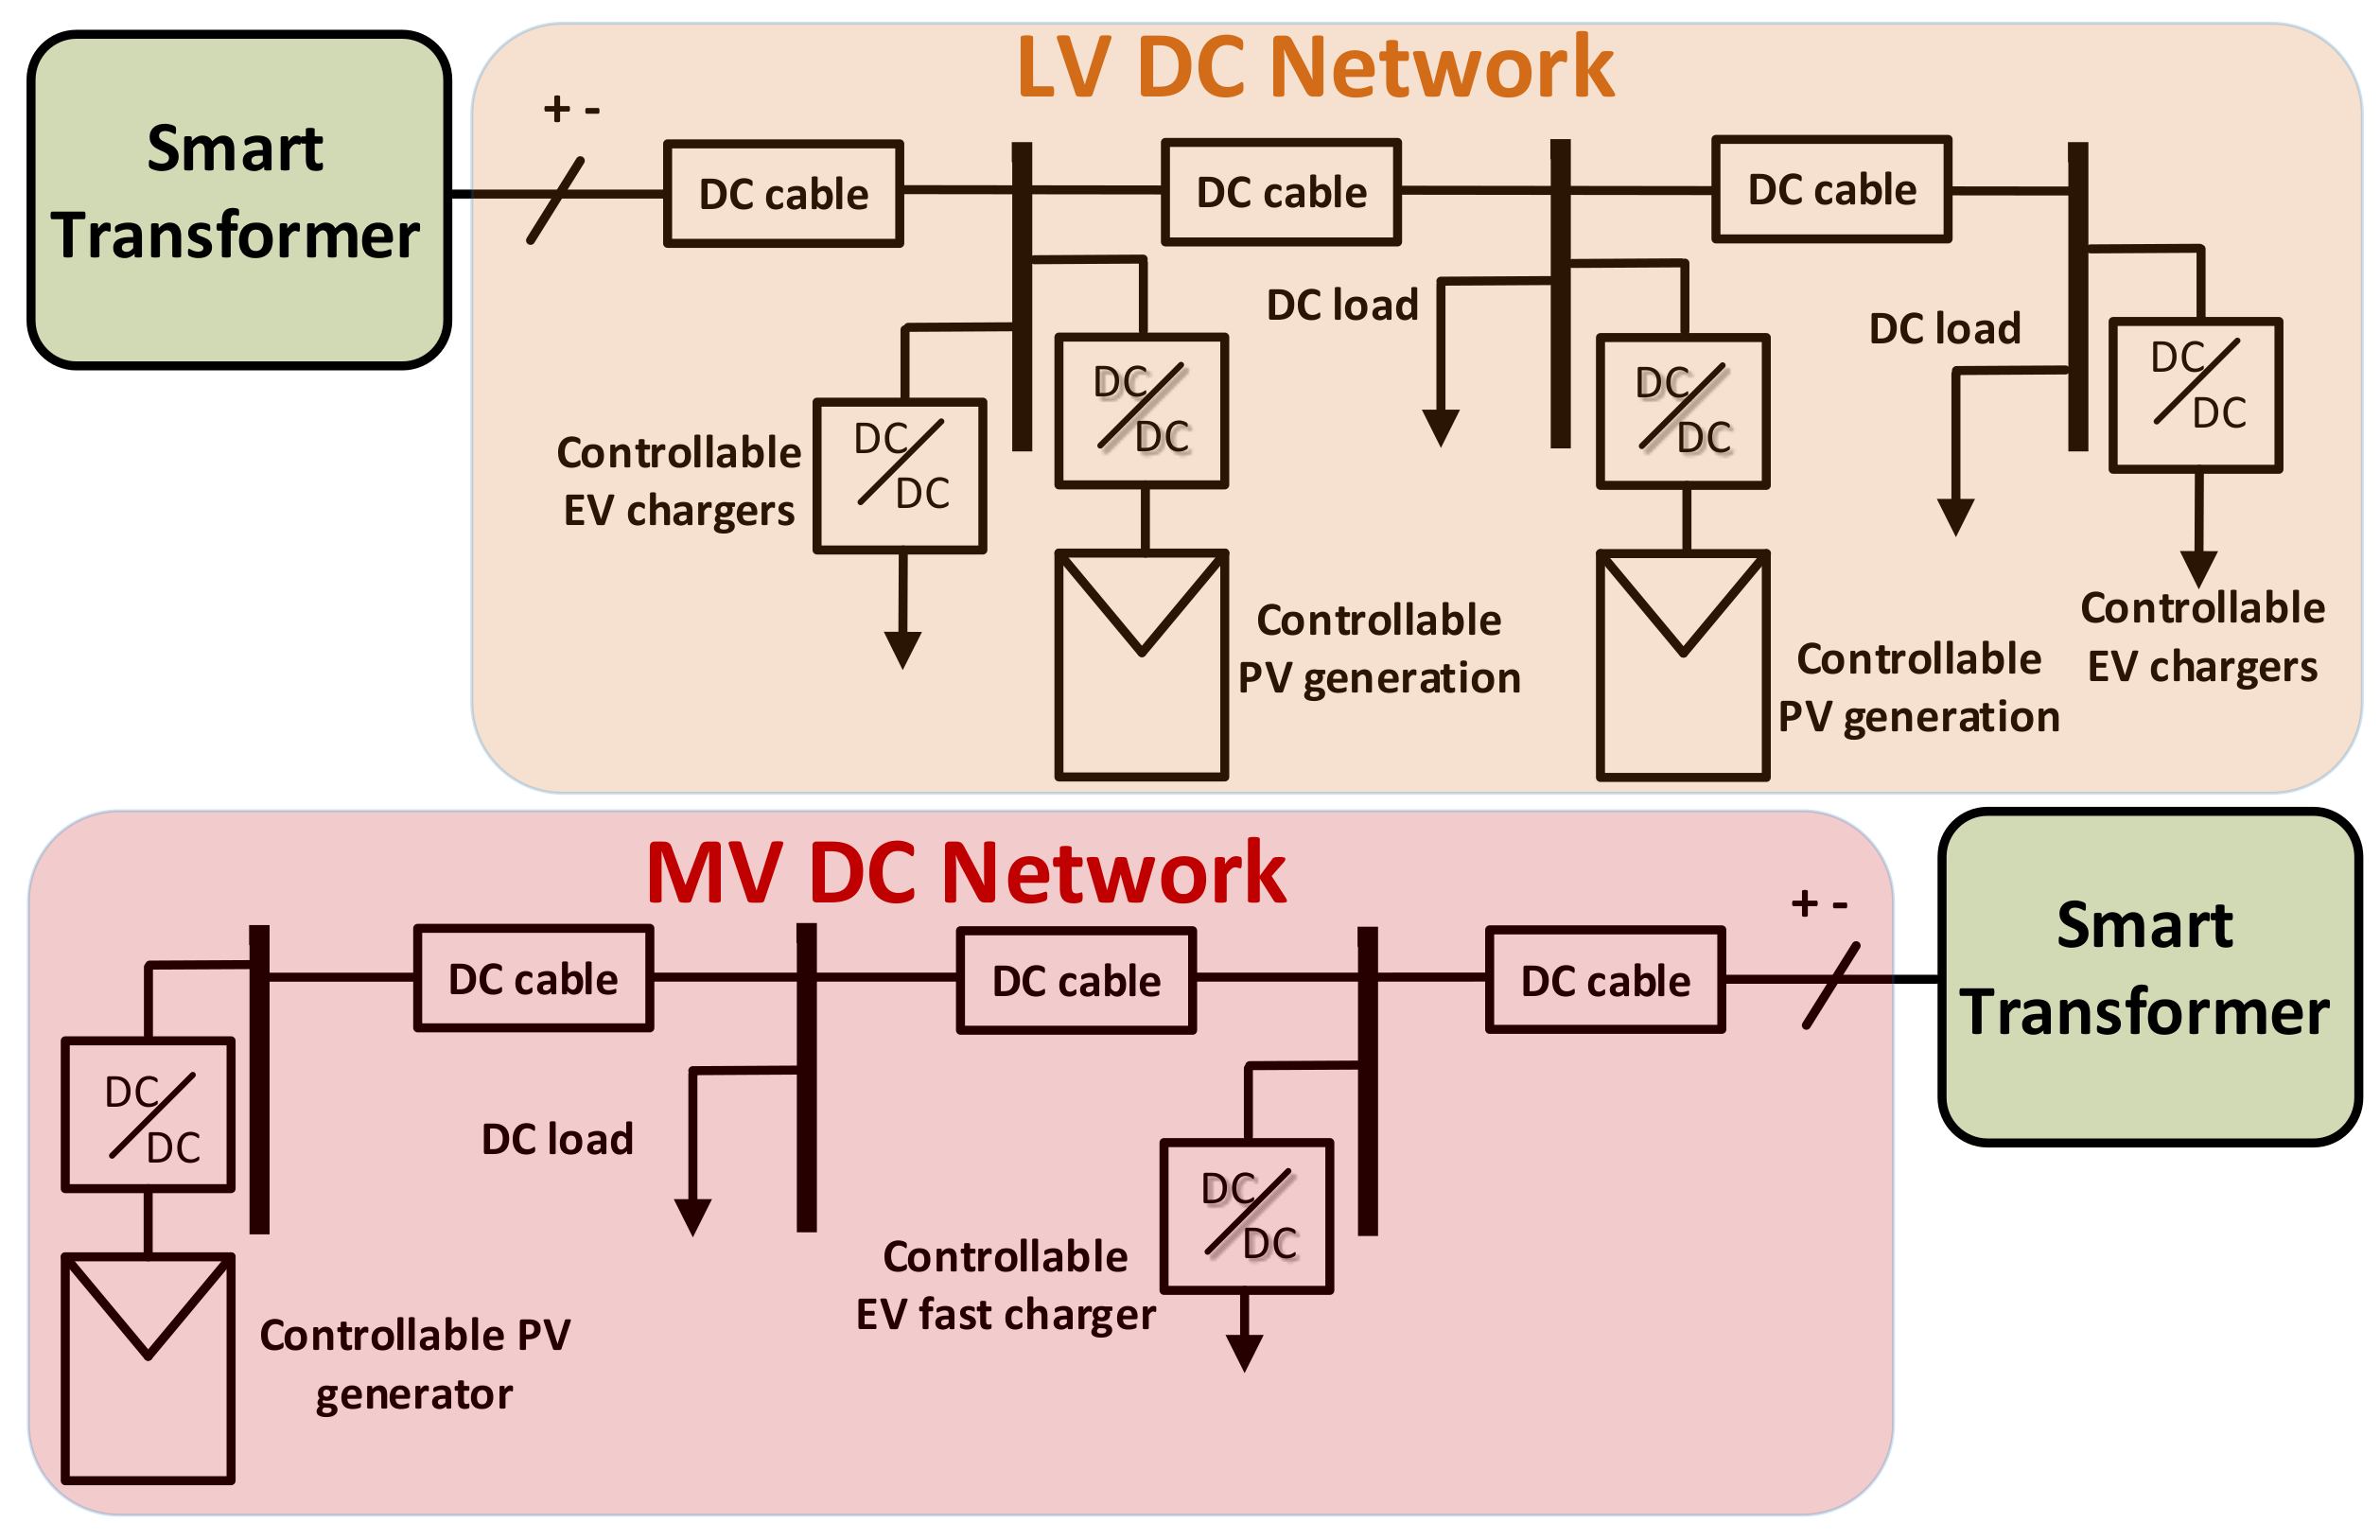
2.2. MV and LV DC Networks
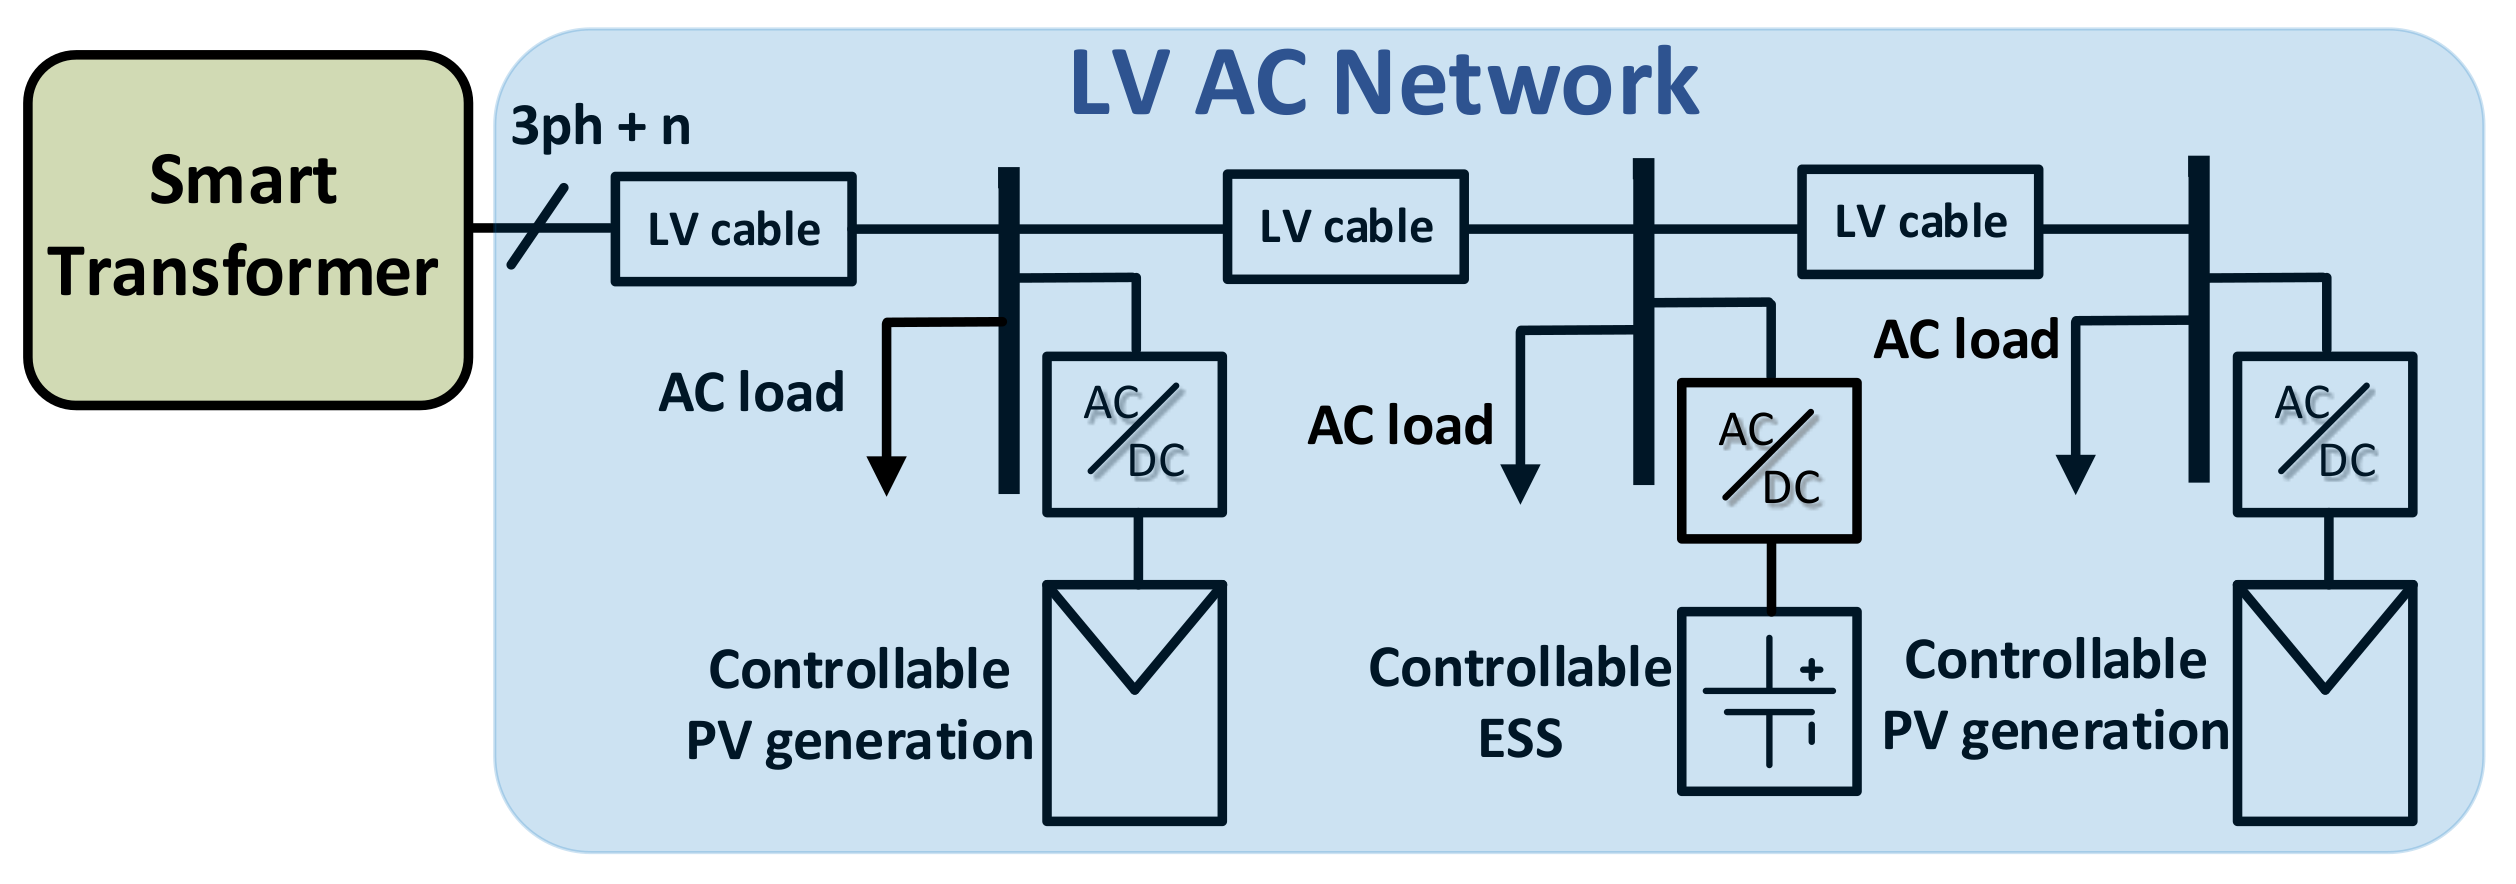
The hybrid AC/DC network modeled in this work comprises a MV and an LV DC section, as represented in Figure 7. The MV and LV DC networks comprise controllable EV charging systems (including controllable EV fast chargers [38]), controllable PV generation units and other non-controllable DC loads connected in different nodes.
The feeders of the DC networks were modeled considering only the resistance of the cables. Non-controllable loads were modeled in the DC networks in order to evaluate the exploitation of its voltage sensitivity for the provision of frequency support to the main power system. No relevant studies addressing the estimation of DC load voltage sensitivity or the use of DC load voltage sensitivity for the provision of frequency support were found in the literature. There are several references suggesting that a large portion of the load in DC systems, being based on power electronic converters, may behave as constant power loads [39,40]. An acceptable compromise can be found in [41], where a scenario with a considerable share of constant power loads is evaluated using the exponential load model. The aforementioned scenario is adopted in this work to represent the non-controllable DC loads, the modeling equation being adapted here to consider DC voltages, as expressed in Equation (18).
P = P 0 V D C V D C n 0 . 45

2.3. LV AC Network

The hybrid AC/DC network modeled in this work also comprises an LV AC section, as represented in Figure 8. The LV AC network section comprises controllable PV generation units, controllable ESS and other non-controllable DC loads connected in different nodes.
The feeders of the AC networks were modeled considering predominantly resistive cables, as it is the typical nature of LV AC distribution feeders. Non-controllable loads are modeled in the LV AC network in order to evaluate the exploitation of its voltage sensitivity for the provision of frequency support to the main power system. The feasibility of exploiting load voltage sensitivity in AC networks for the provision of frequency support to the main power system is already explored in the literature [42,43]. Moreover, the estimation of load voltage sensitivity in AC networks using the ST itself is already addressed in the literature [41,44]. Given this, the representation of the non-controllable load present in the LV AC network is based in one of the case-studies already addressed in the literature, namely in [41], represented by Equation (19).
P = P 0 V A C V A C n 0 . 63

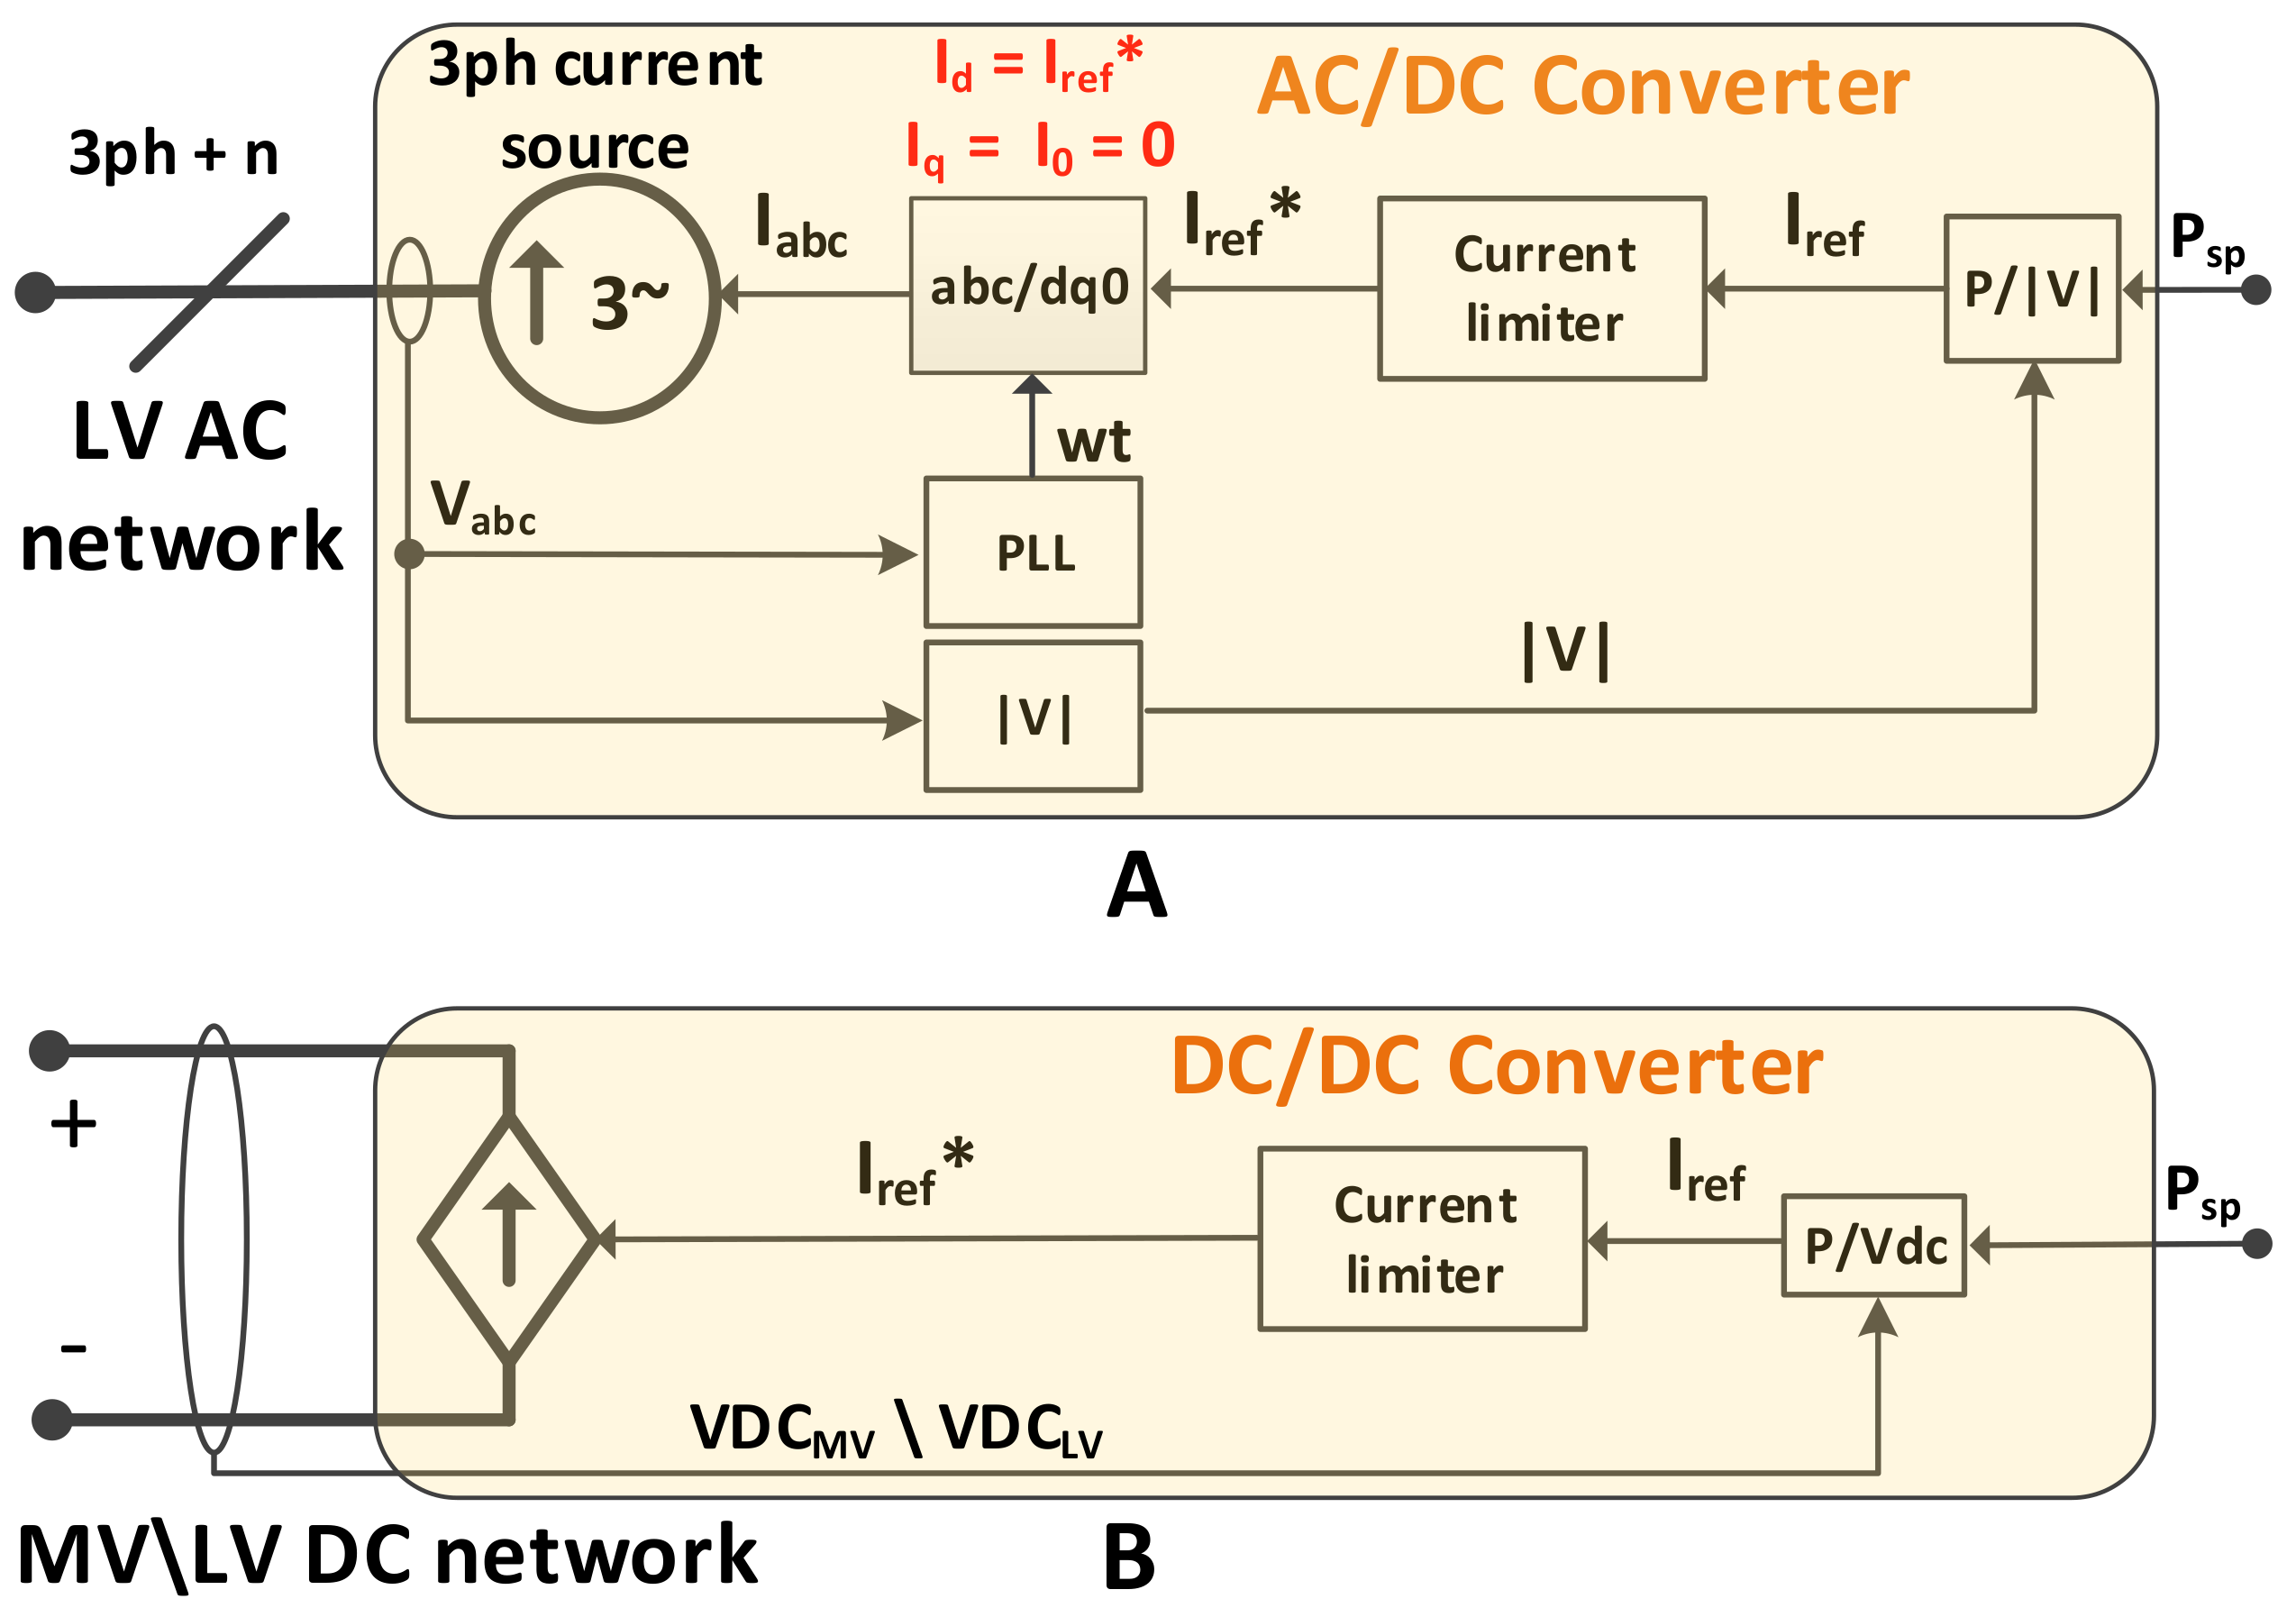
2.4. Distributed Energy Resources

The controllable DER available in the hybrid AC/DC network were modeled according to the block diagrams presented in Figure 9. Given the time intervals involved in the performed studies (few tens of seconds) and the dynamics of the phenomena under study, the following general underlying principles were adopted for the modeling of the controllable DER units:
  • The dynamics of the physical phenomena behind the AC or DC power converter stages used to connect the different DER units to the corresponding grid can be neglected. Given this, the models of the resources to be controlled, namely, the PV panels, EV and storage units, were considered to be operating around a given active power reference ( P s p ), the dynamics of the PV panels itself as well as the internal dynamics of batteries used in EV or stationary ESS being neglected.
  • According to the DAM approach, the low-level voltage control loop and the modulation mechanisms (e.g., PWM, SPWM or others) can be neglected, the interface to the grid (AC or DC) being represented by controlled current sources.
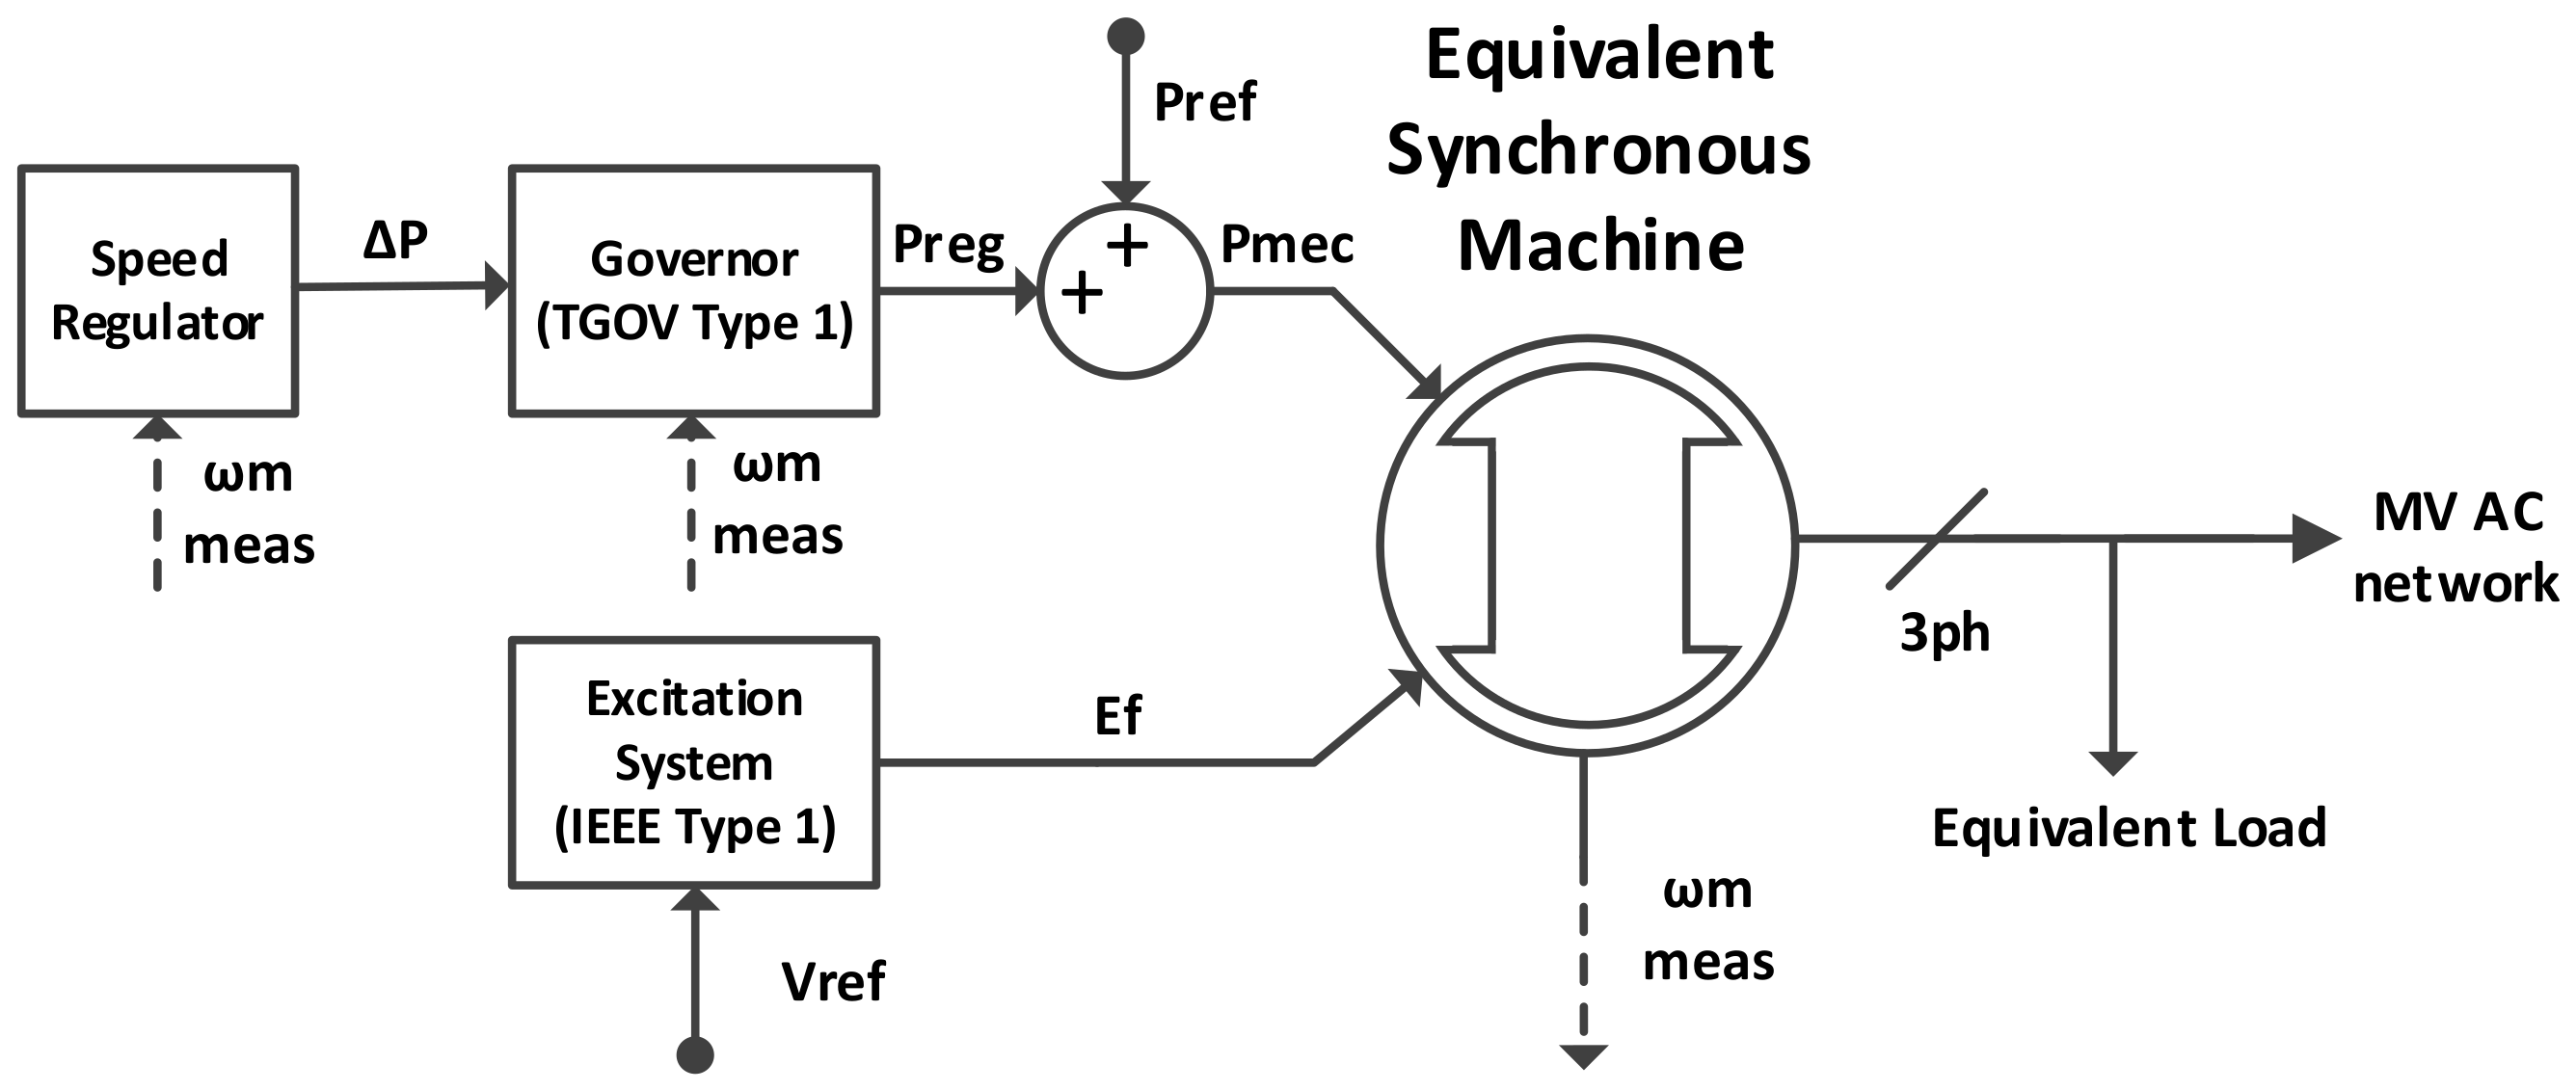
Nevertheless, the main control loops of the power converters used to couple these units to the AC and DC networks were considered: an AC/DC Converter (Figure 9A) for the electronic power converter to interface with the LV AC network and a DC/DC Converter (Figure 9B) for the electronic power converter to interface with the DC networks.
Reactive power is not considered in the DER units available in the LV AC distribution grid, since it is not the object of the study in this paper. Therefore, the generated reference current ( I r e f * ) represents only the direct current component, the quadrature current component being set to zero. Further, only the positive sequence of the measured voltage is considered for the calculation of the voltage magnitude ( | V | ), which is used to calculate the reference current ( I r e f ) from the active power reference ( P s p ). PV generation is assumed to operate at its maximum power point in normal operation conditions.

2.5. MV AC Network

The MV AC network represents the main power system at which the ST is connected (through a MV connection) and is modeled in a simplified way by means of an equivalent Synchronous Machine and an equivalent load. The adopted modeling approach can emulate representative frequency variations, to which the ST is intended to provide active power-frequency regulation services through the proposed control strategies. The overall structure of the computational model developed for the main power system is shown in Figure 10.
In order to regulate the power output and frequency of the equivalent Synchronous Machine, a TGOV type 1 governor and an IEEE Type 1 excitation system were modeled. Regarding the excitation system, it was modeled using the models available in MATLAB®/Simulink® (R2018b version), using the default settings. Regarding the governor, a droop constant of 5% was considered. Additionally, a speed regulator was also modeled, in order to bring the Synchronous Machine to the nominal speed in the face of load changes.

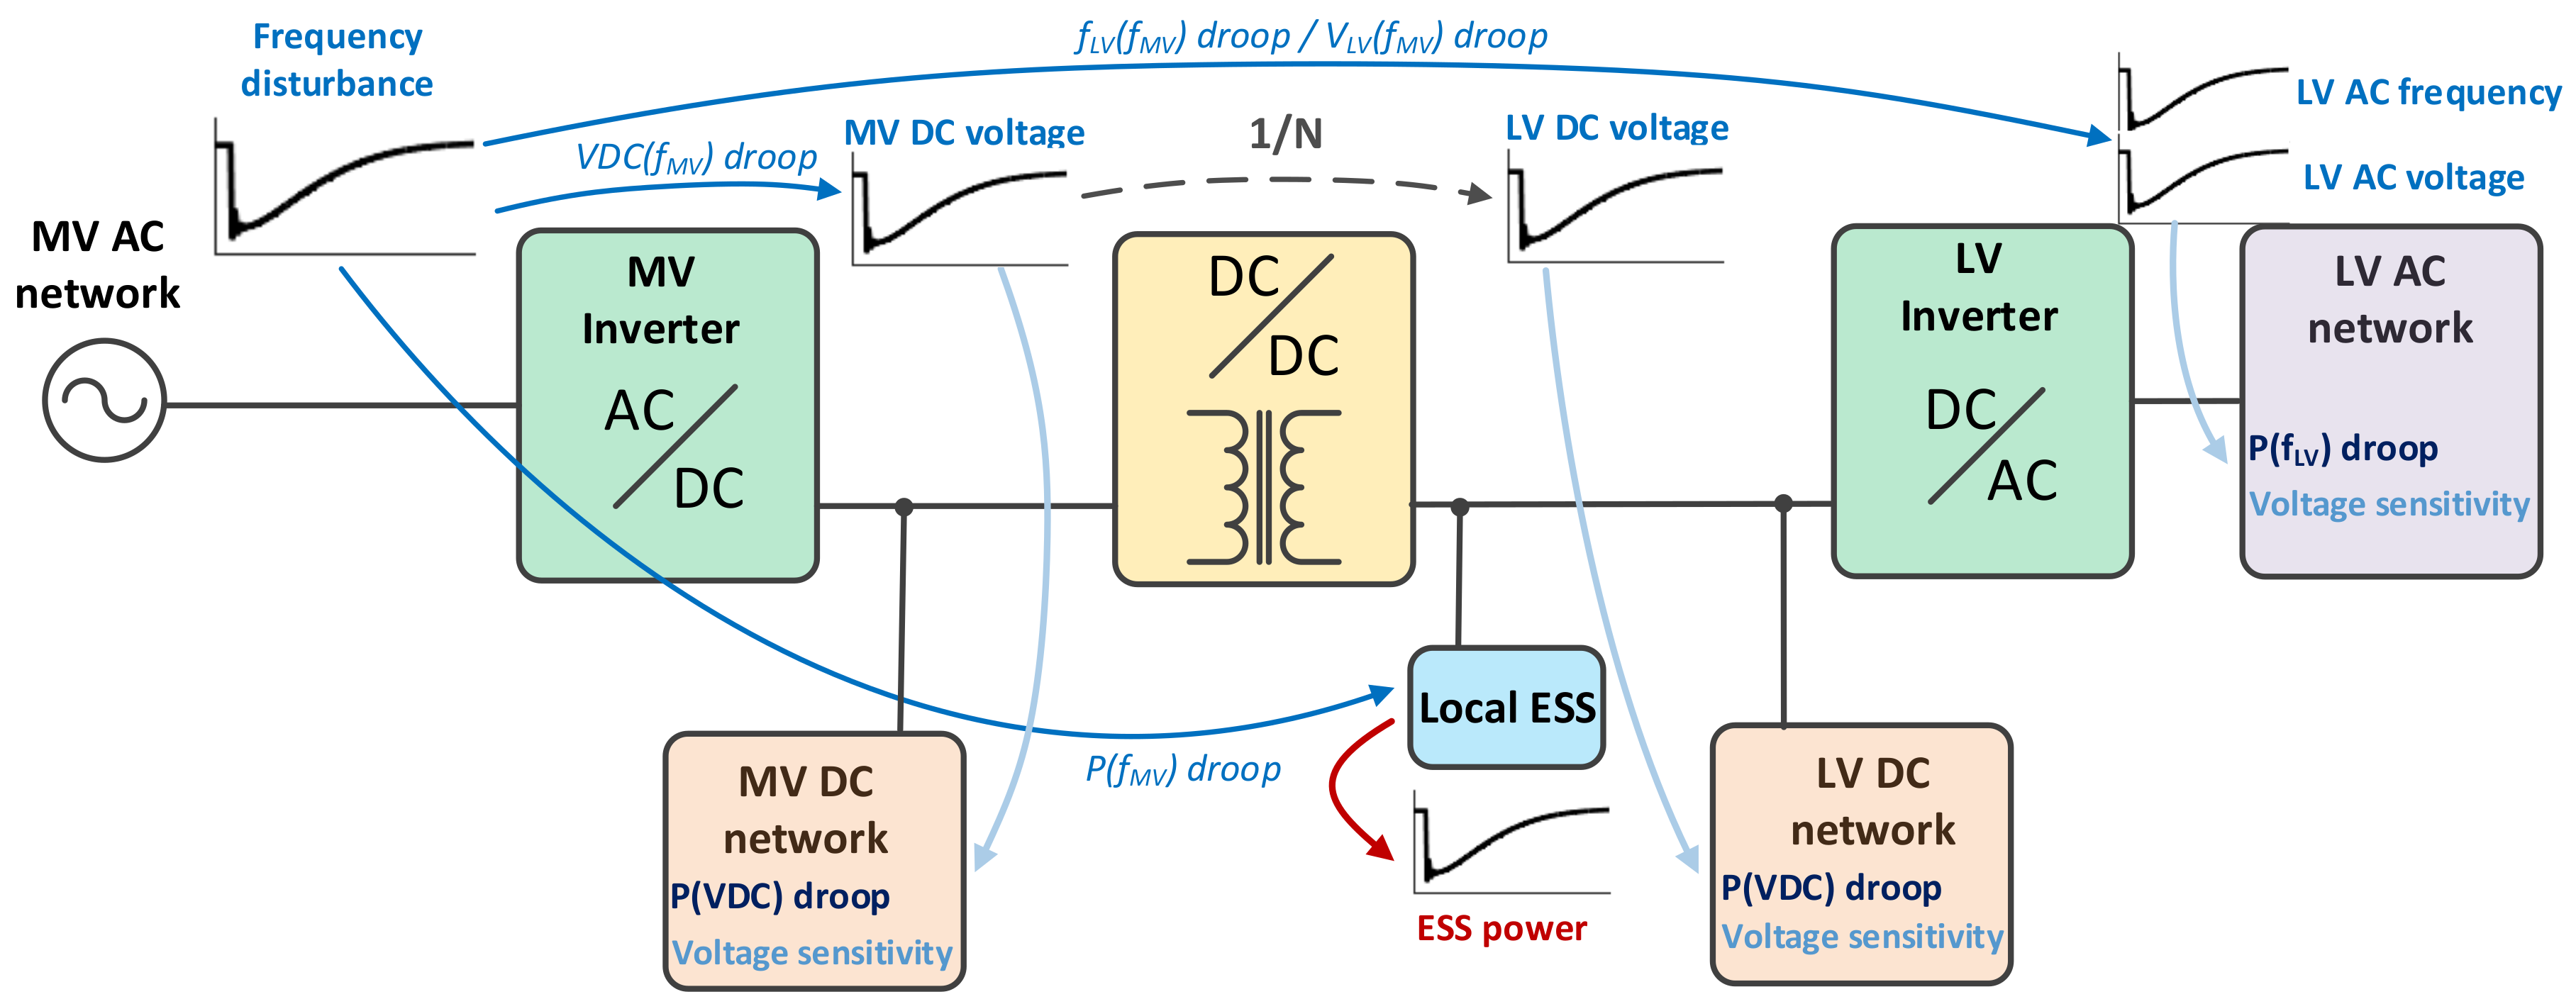
3. Advanced Control Functionalities for Power-Frequency Regulation

In order to enable the ST to provide active power-frequency regulation services to the main power system, a set of advanced functionalities based on droop controllers is proposed to be incorporated in the ST. The aforementioned droop controllers are intended to provide active power-frequency support to the main power system by regulating the active power exchanged between the ST and the main power system as a function of frequency deviations in the main power system. The droop controllers proposed to be incorporated in the ST are described in Section 3.1. The aforementioned droop controllers aim to trigger a response of the hybrid distribution network according to the relationships generally represented in Figure 11, namely, by inducing a power response in the controllable DER units through its embedded droop-based controllers (described in Section 3.2) and by exploiting an indirect active power response of non-controllable resources through its power-voltage sensitivity.
The implemented droop controllers follow the general functional relation represented in Figure 12 and expressed according to Equation (20), where the X axis represents the controlling quantity, the Y axis represents the quantity to be controlled (output of the droop controller), Y m i n / Y m a x is the minimum/maximum output of the droop controller, Y o s is the offset of the droop controller, m d is the slope of the droop controller, X m i n / X m a x is the minimum/maximum value of X at which the droop controller responds, X d b / X d b + is the dead-band interval at which the droop controller holds at the offset value and Δ Y / Δ Y + is the maximum negative/positive variation of Y provided by the droop controller around the offset value. m d is an input parameter which is applied to both intervals defined by [ X m i n , X d b ] and [ X d b + , X m a x ]. Further, Y m i n / Y m a x are input parameters, which means that X m i n and X m a x are defined as a function of Y m i n , Y m a x , X d b , X d b + , m d and Y o s according to Equation (20).
Y = Y m i n i f X ] , X m i n ] m d ( X X d b ) + Y o s i f X ] X m i n , X d b [ Y o s i f X [ X d b , X d b + ] m d ( X X d b + ) + Y o s i f X ] X d b + , X m a x [ Y m a x i f X [ X m a x , [ w h e r e , X m i n = Y m i n Y o s m d + X d b X m a x = Y m a x Y o s m d + X d b +
The reaction chain that triggers the combined actuation of the implemented droop controllers in face of the occurrence of frequency deviations in the main power system is represented in Figure 13. As shown in this figure, a frequency disturbance in the MV AC network will trigger the actuation of a set of droop controllers sensitive to the frequency in the MV AC network. Consequently, the DC voltage in the DC networks, the voltage and frequency in the LV AC network and the active power in the local ESS are modulated accordingly. As a result, the resources available in the hybrid distribution network will change their power output, due to voltage sensitivity in non-controllable loads and to the actuation of the droop controllers embedded in the controllable DER units. These power changes will propagate to the ST’s MV inverter (given the relationship expressed in Equation (15)), thus adjusting the ST active power exchange with the upstream AC power system.

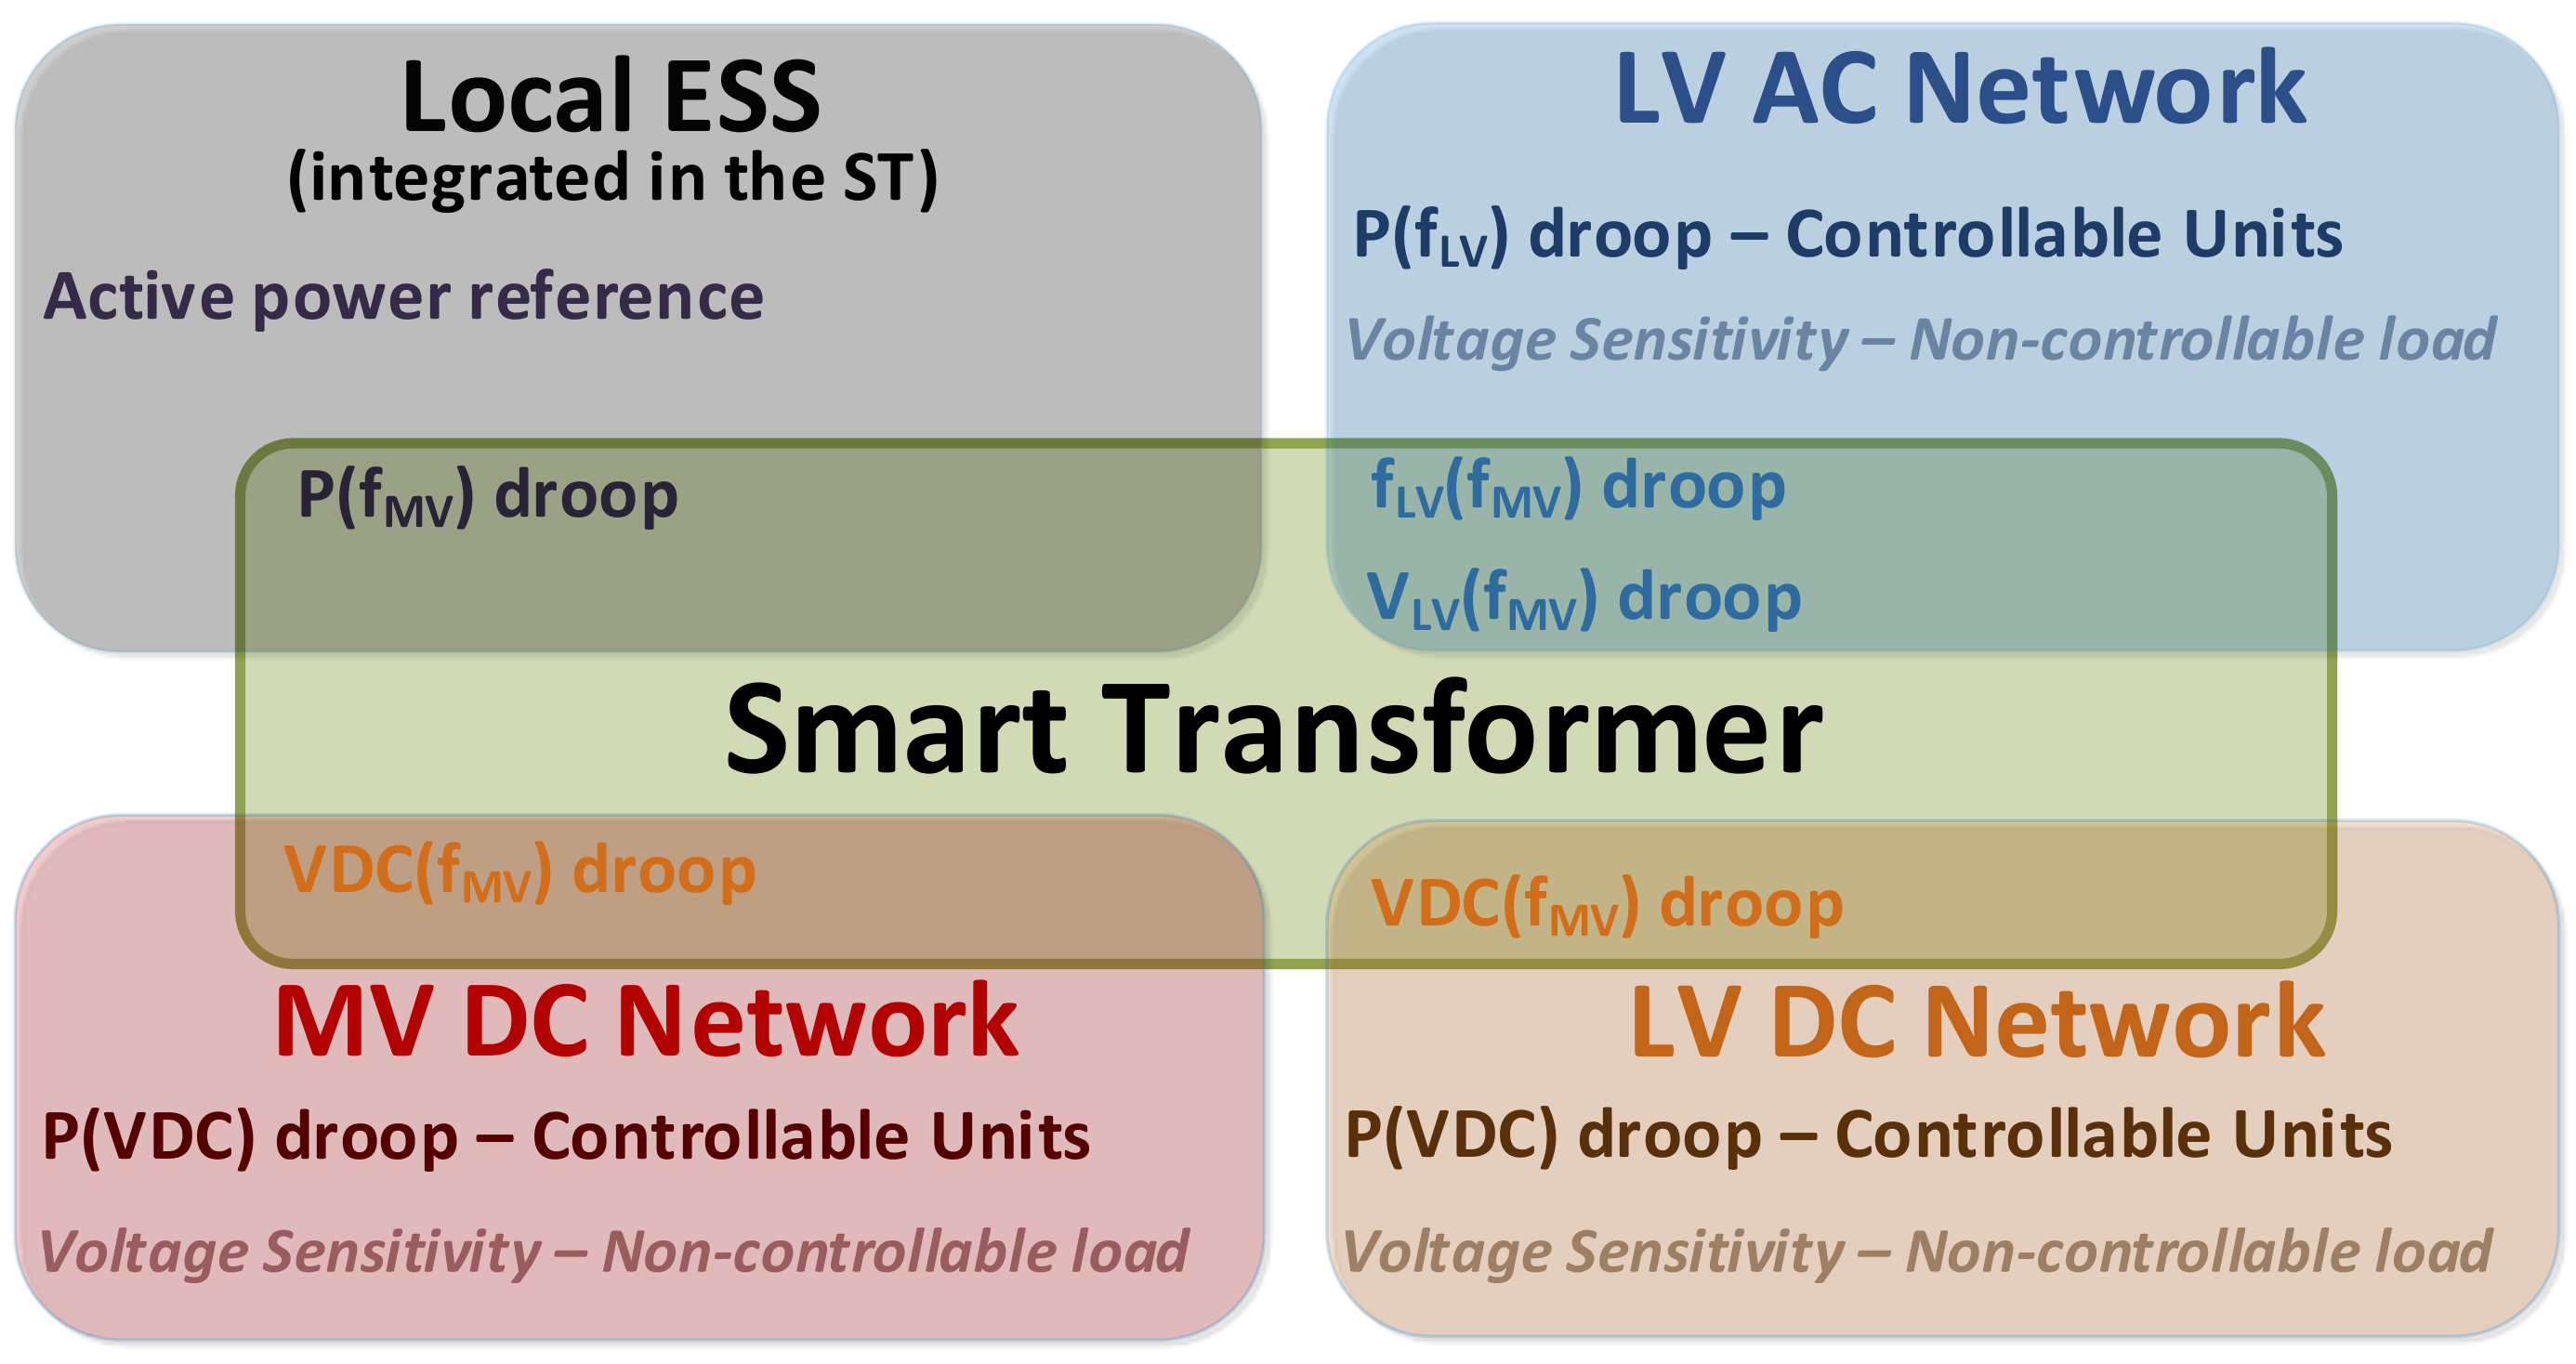
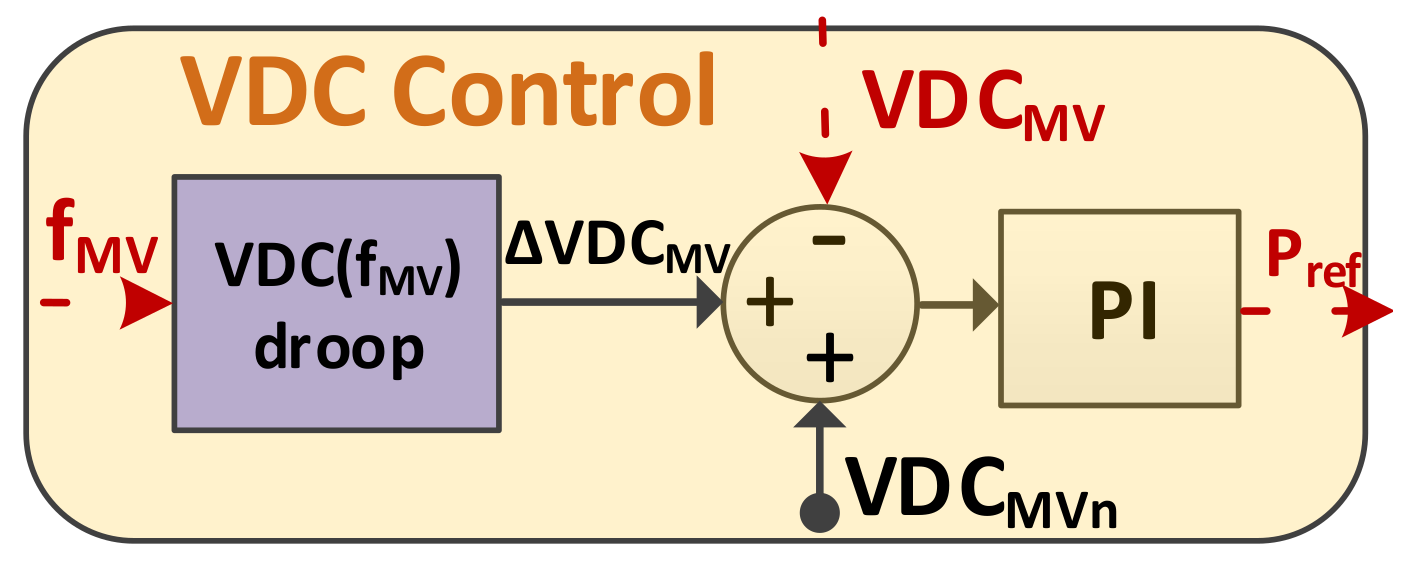
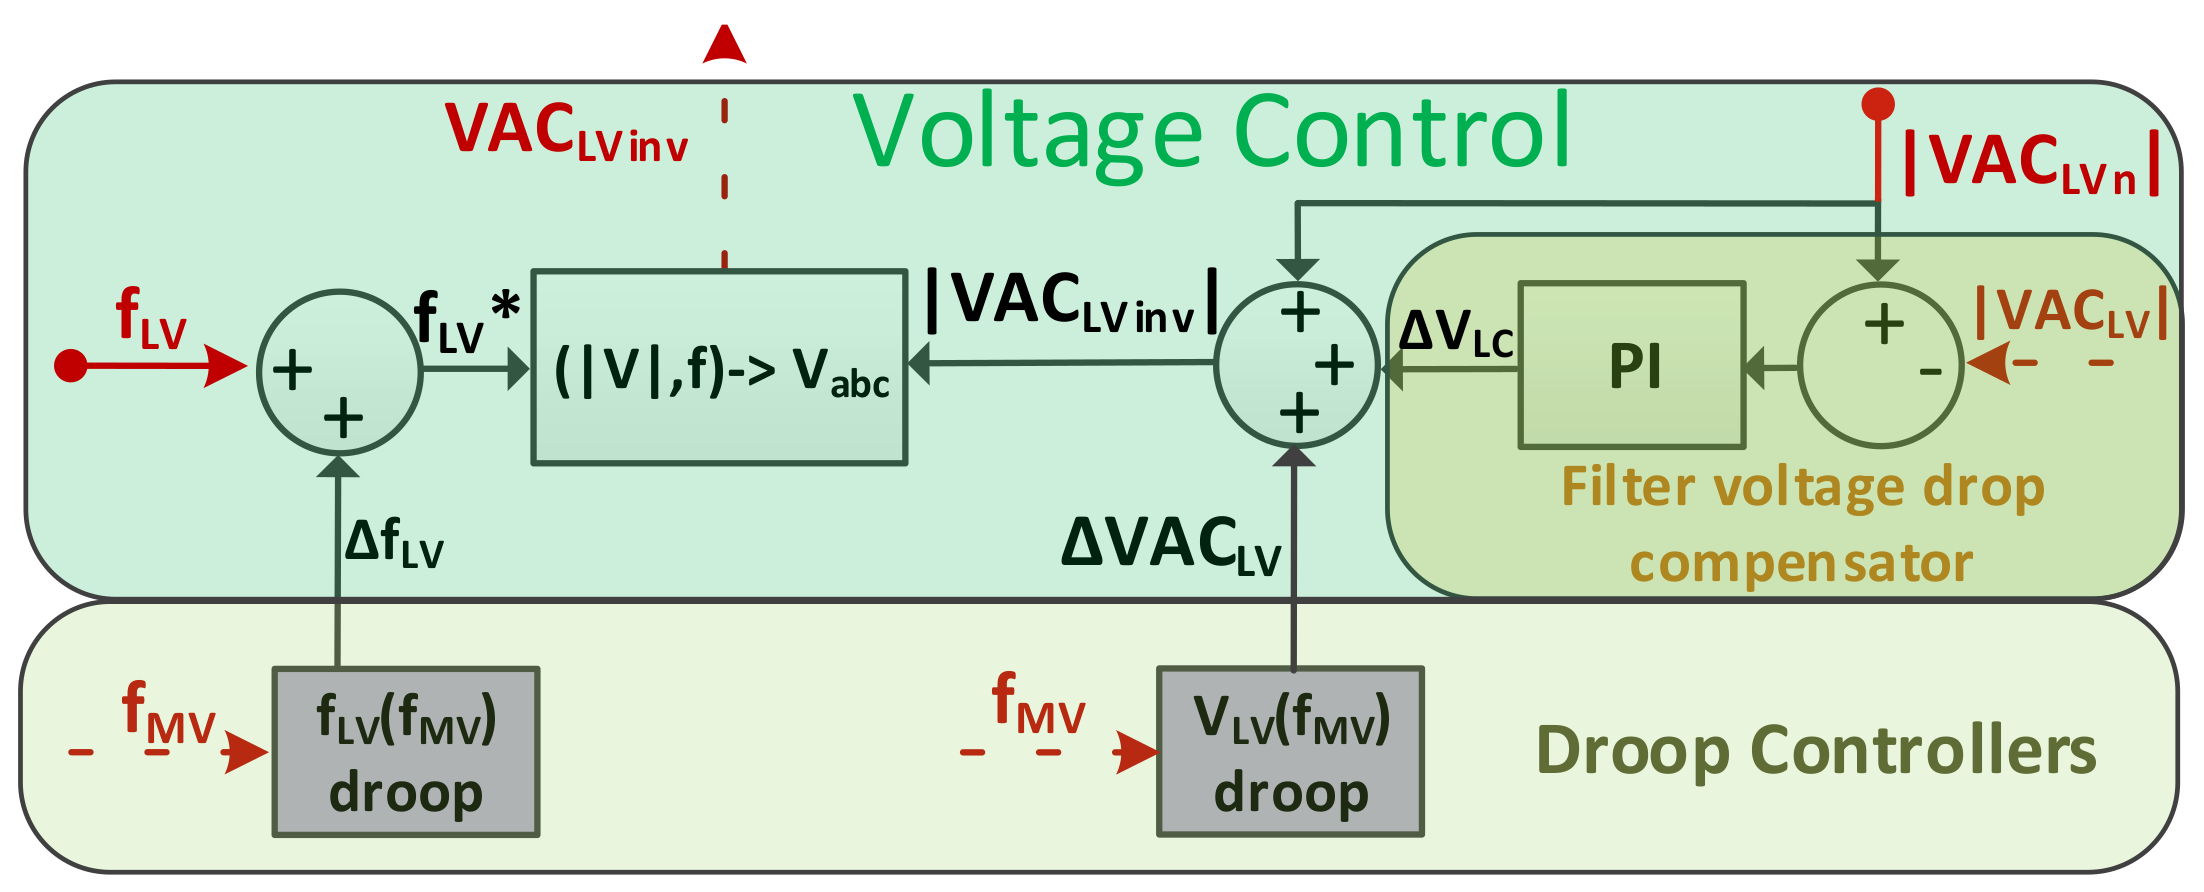
3.1. Droop Controllers Proposed to Be Incorporated in the Smart-Transformer
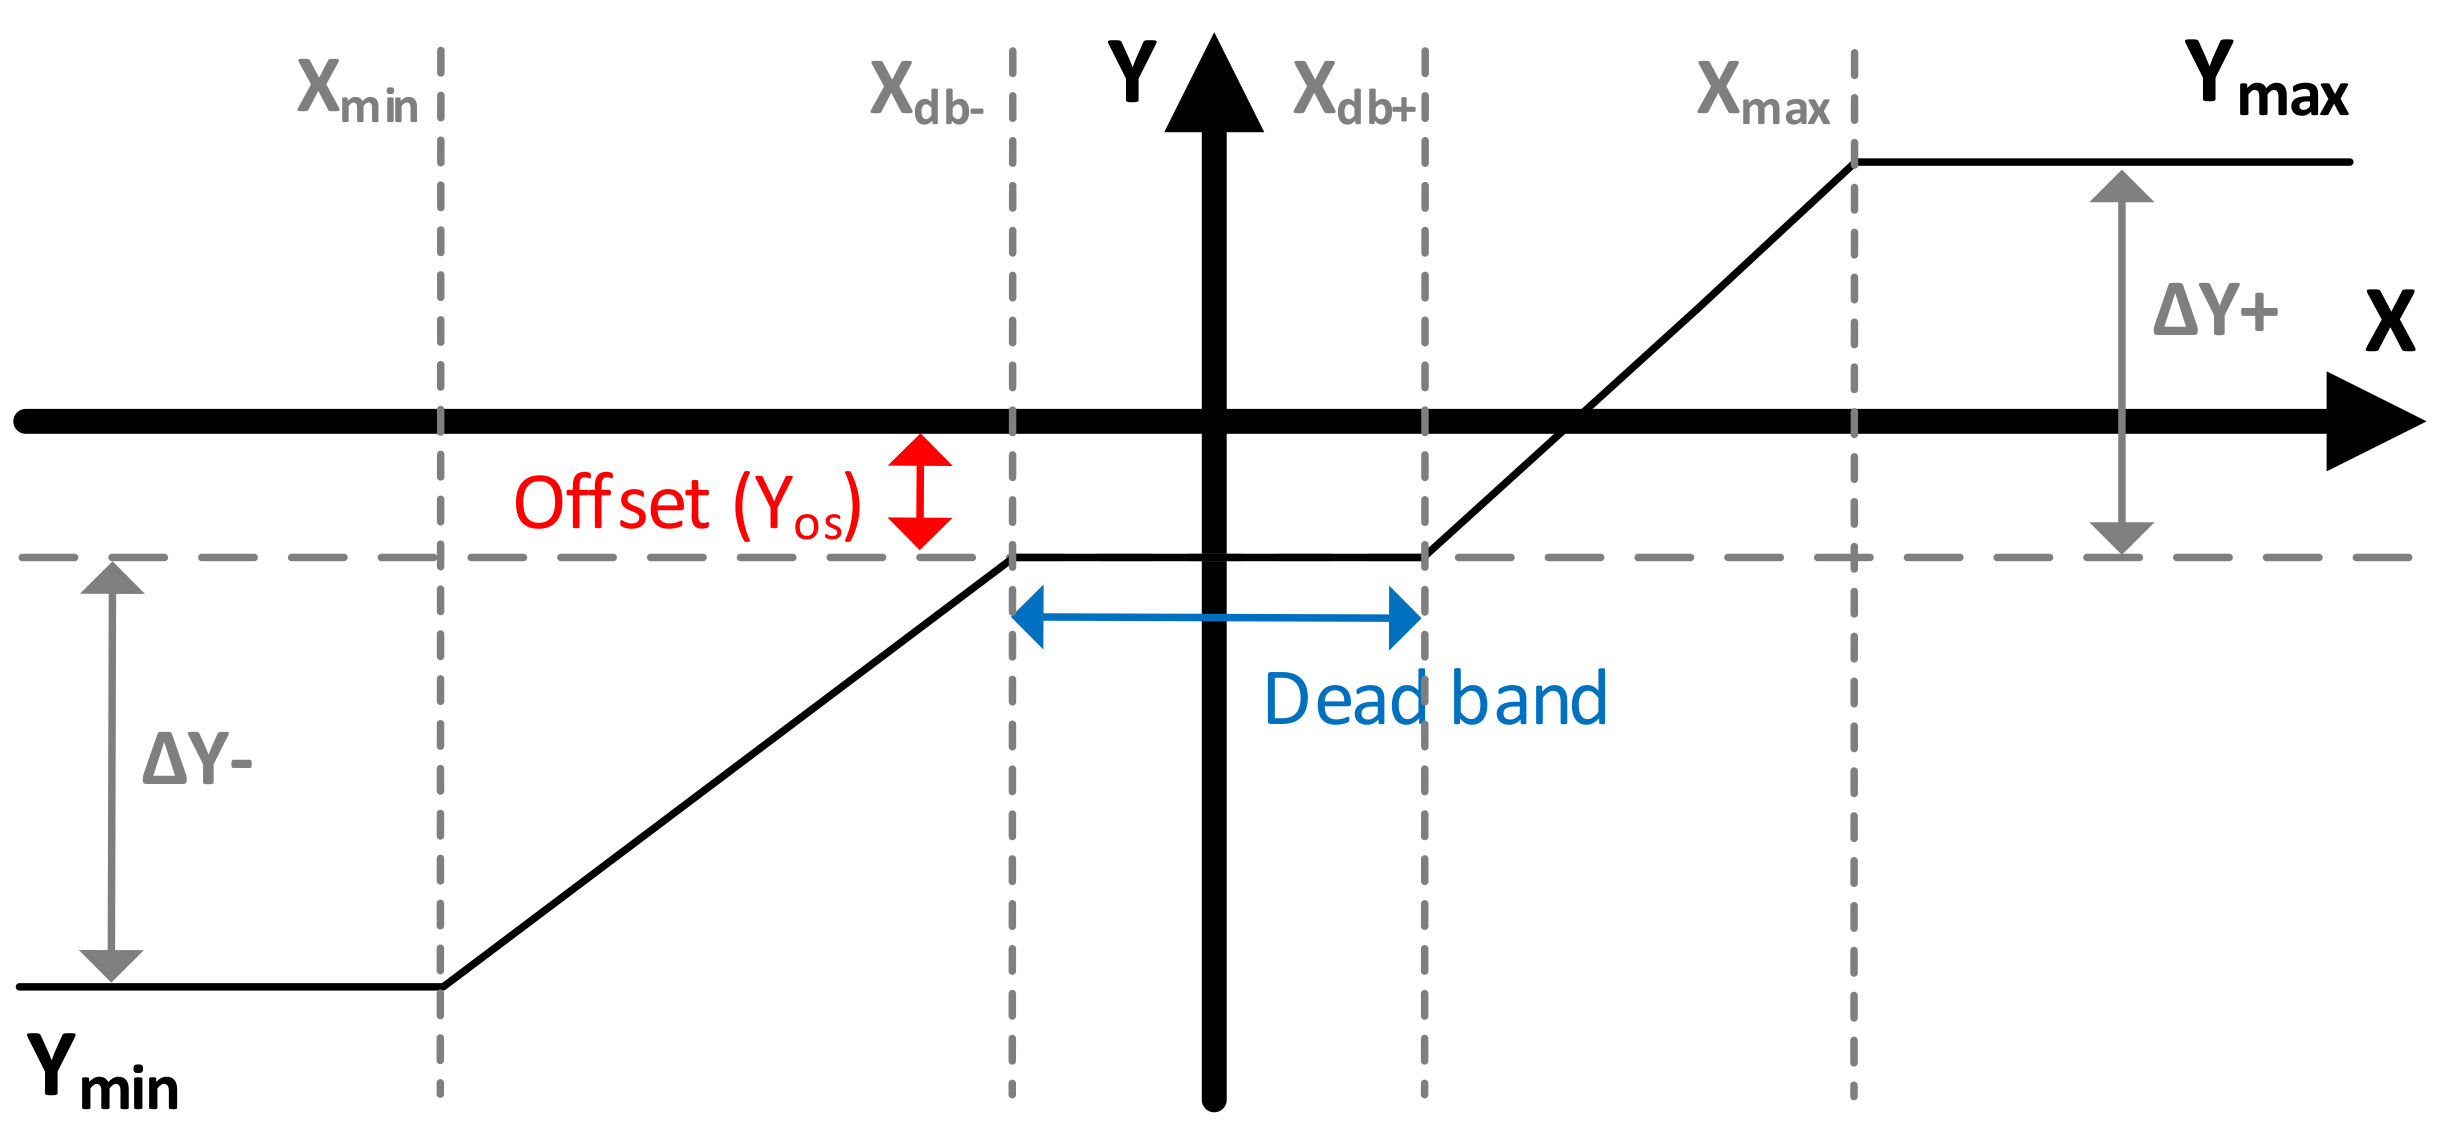
The following droop controllers are proposed to be implemented in the ST control structure, aiming to act on the reference active power of the local ESS (incorporated in the ST’s LV DC bus) and in the reference voltages and frequency of the hybrid AC/DC network. The presented droop controllers follow the general functional relation represented in Figure 12 and expressed according to Equation (20).

3.1.1. P ( f M V ) Droop

This droop controller is proposed to be integrated in the controller of the ST’s MV inverter (depicted in Figure 3) in the ESS control section, as illustrated in Figure 14. It regulates the active power set-point of the local ESS (described in Section 2.1.4) as a function of the frequency deviations in MV AC network in order to involve the local ESS in the provision of active power-frequency support. In this droop controller, f M V corresponds to the control quantity X and Δ IESS ref corresponds to the output of the droop controller Y.
Δ IESS ref is added to IESS ref in order to define the final current set-point for the local ESS. If no local ESS is available or the local ESS has no capacity to respond, the P ( f M V ) droop offers no contribution for the power-frequency regulation to be provided by the ST. The active power injected or consumed by the local ESS is delivered to the main power system by the ST’s MV inverter (described in Section 2.1.1), which is responsible for keeping the power balance in the MV DC bus.

3.1.2. V D C ( f M V ) Droop

This droop controller is intended to be integrated in the controller of the ST’s MV inverter (depicted in Figure 3), in the VDC Control section, as illustrated in more detail in Figure 15. This droop-type controller is responsible for the modulation of the voltage in the DC networks as a function of the frequency deviations in the MV AC network. In this droop controller, f M V corresponds to the control quantity X and Δ VDC MV corresponds to the output of the droop controller Y.
Δ VDC MV is added to VDC MVn in order to produce the final reference voltage for the DC networks. This adjustment in DC network voltage is then used by the controllable units existing in the modeled DC networks as the control variable to drive the modulation of its active power output using the P(VDC) droop described in Section 3.2.
The adjustment in DC networks voltage is also used to demonstrate that DC load voltage sensitivity can also be used to adjust the total active power consumed by the DC networks and thus contribute to the provision of active power-frequency support to the main power system, according to the assumptions previously described in Section 2.2.

3.1.3. f L V ( f M V ) Droop

This droop controller is integrated in the controller of the ST’s LV inverter (depicted in Figure 5), as shown in Figure 16. It is responsible for adjusting the frequency of the voltage waveform generated for the LV AC network as a function of frequency deviations in the MV AC network. In this droop controller, f M V corresponds to the control quantity X and Δ f L V corresponds to the output of the droop controller Y.
Δ f L V is added to f LV in order to produce the final frequency reference for the LV AC network. The aim is to enable the controllable DER units existing in the modeled LV AC network to modulate their active power output as a function of frequency deviations in the MV AC network (using the P ( f L V ) droop described in Section 3.2), which otherwise would not be possible due to the inherent frequency decoupling between MV and LV AC networks provided by the ST.
With this functionality, it is possible to obtain a proper power-frequency response of the LV network as a function of the frequency in the MV network, taking into account the characteristics of resources available in the LV AC network.

3.1.4. V L V ( f M V ) Droop

This droop controller is intended to be incorporated in the controller of the ST’s LV inverter (depicted in Figure 5), as illustrated in Figure 16. This droop is responsible for modulating the magnitude of the voltage waveform generated for the LV AC network as a function of frequency deviations in the MV AC network, in order to exploit load voltage sensitivity of the LV AC network to provide frequency support to the main power system. In this droop controller, f M V corresponds to the control quantity X and Δ V A C L V corresponds to the output of the droop controller Y.
Δ V A C L V is added to | VAC LVn | and Δ V L C in order to produce the final reference for the magnitude of the voltage waveform generated for the LV AC network. The feasibility of using load voltage sensitivity to provide frequency support services to conventional AC systems is demonstrated in the literature [42,43].

3.2. Droop Controllers Implemented in the Controllable Units Available in the Hybrid AC/DC Network

In order to enable the responsiveness of controllable DER units placed along the hybrid AC/DC network to the modulation induced by the ST in voltage and frequency references applied to the hybrid AC/DC network, the following droop controllers were embedded in the controllable DER units located in the hybrid AC/DC network. For the sake of simplicity, the presented droop controllers also follow the general functional relation represented in Figure 12 and expressed according to Equation (20).

3.2.1. P ( V D C ) Droop

This droop controller is adopted in the controllable DER units connected to the DC networks, as shown in Figure 17. It is responsible for regulating the active power output of the controllable DER units as a function of the DC voltage deviations induced by the ST in the DC networks through the V D C ( f M V ) droop as described in Section 3.1. For these droop controllers, the control quantity X corresponds to V D C M V for the DER units located in the MV DC grid and to V D C L V for the DER units located in the LV DC grid. Δ P corresponds to the output of the droop controllers Y. The droop regulation component Δ P is added to P SP in order to produce the final active power set-point for the controllable DER units.

3.2.2. P ( f L V ) Droop

This droop controller is integrated in the controllable DER units connected to the LV AC network, as shown in Figure 17. It regulates the active power output of the controllable DER units as a function of frequency deviations induced by the ST in the LV AC network through the f L V ( f M V ) droop (depicted in Figure 5) as described in Section 3.1. In this droop controller, f L V corresponds to the control quantity X and Δ P corresponds to the output of the droop controller Y. The droop regulation component Δ P is added to P SP in order to produce the final active power set-point for the controllable DER units.

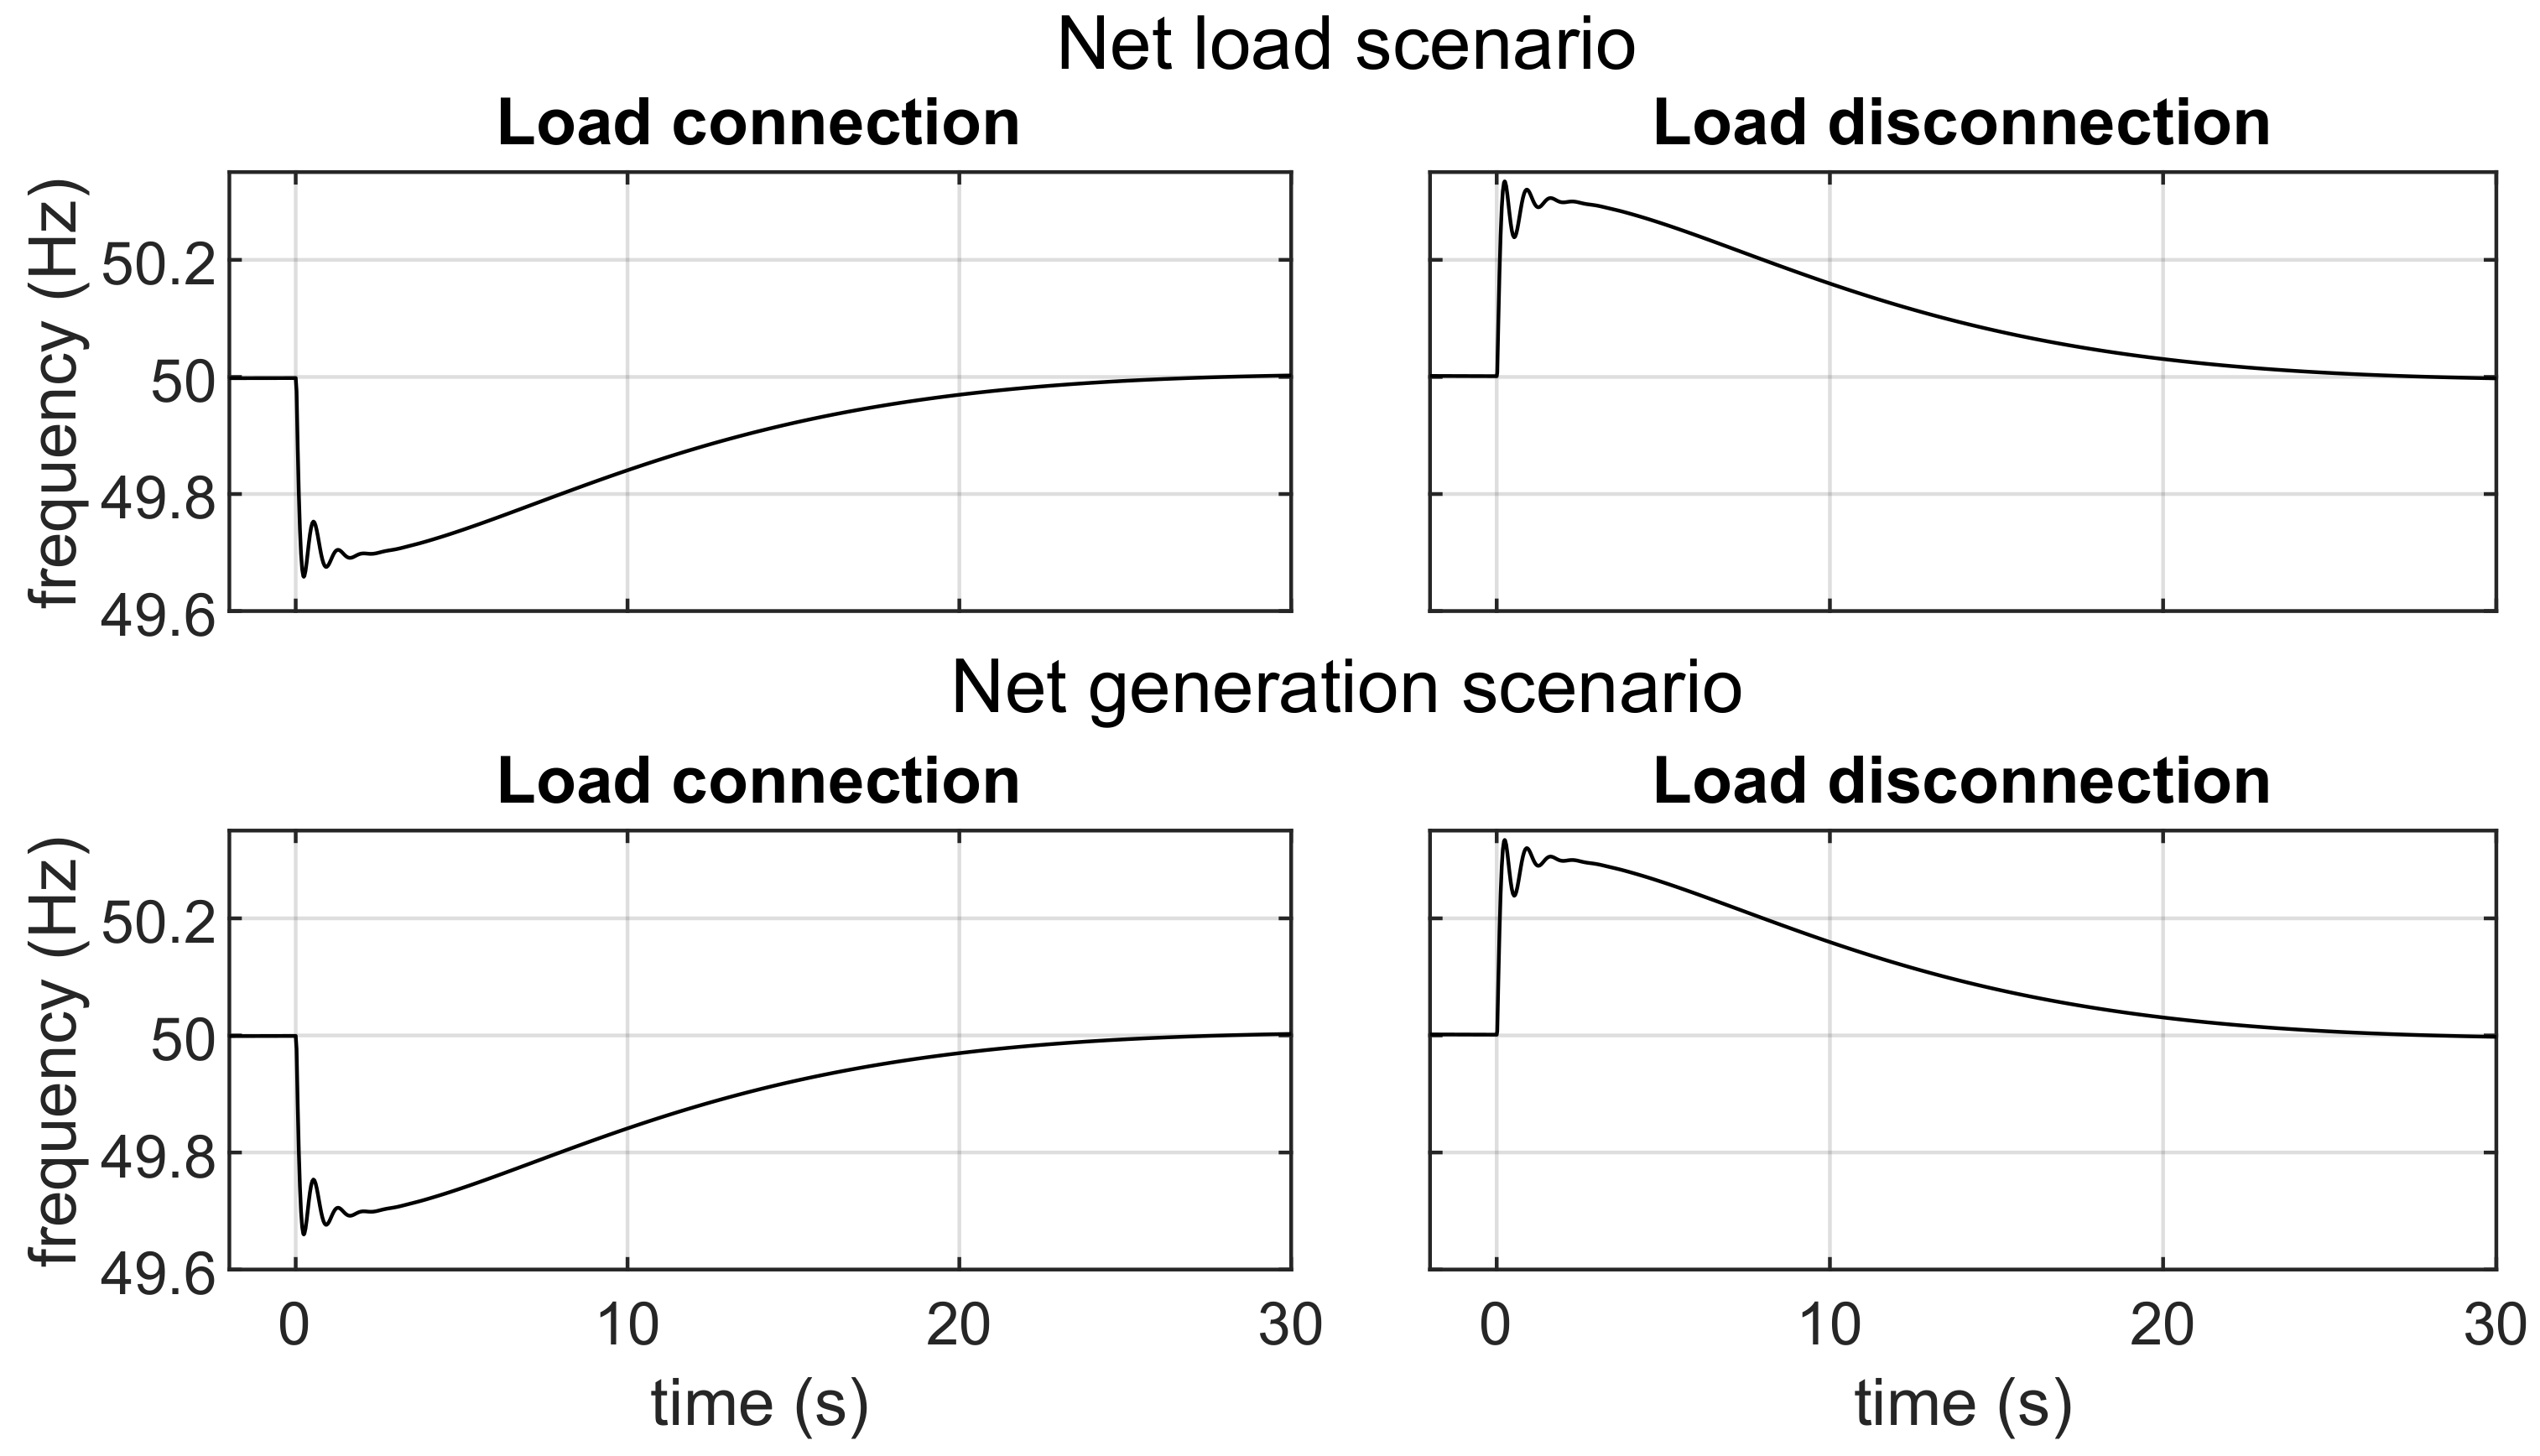
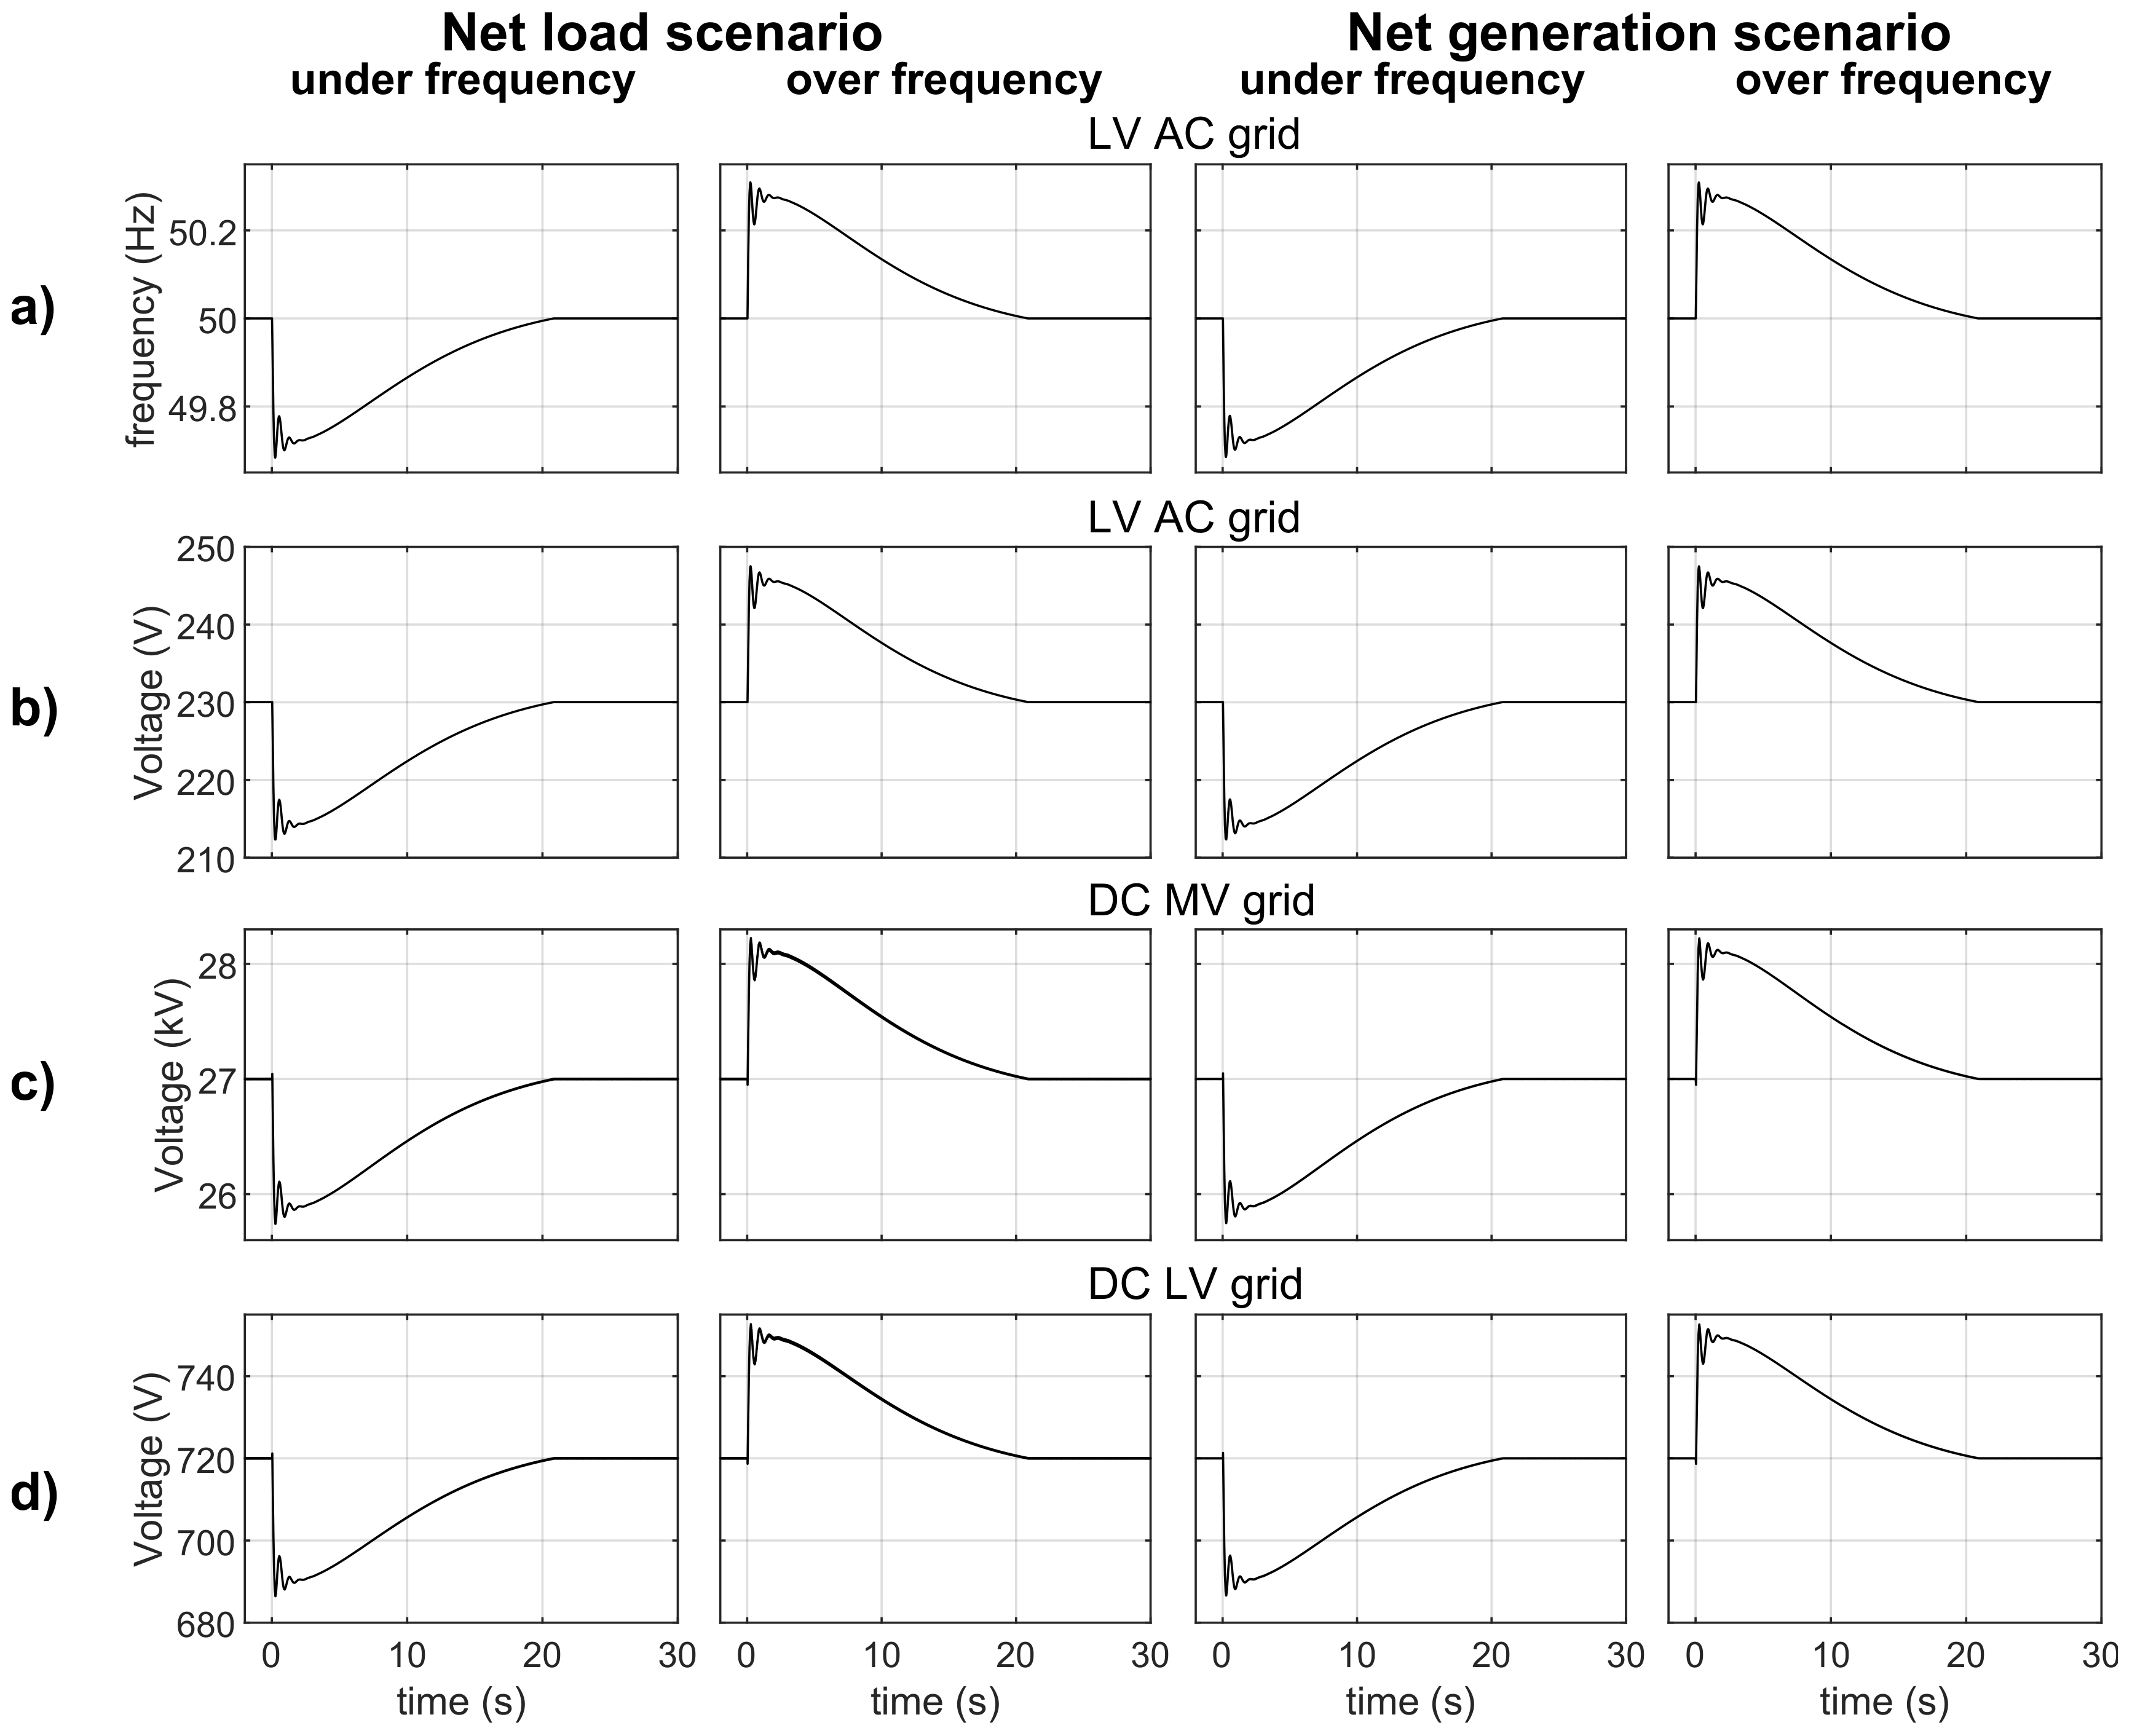
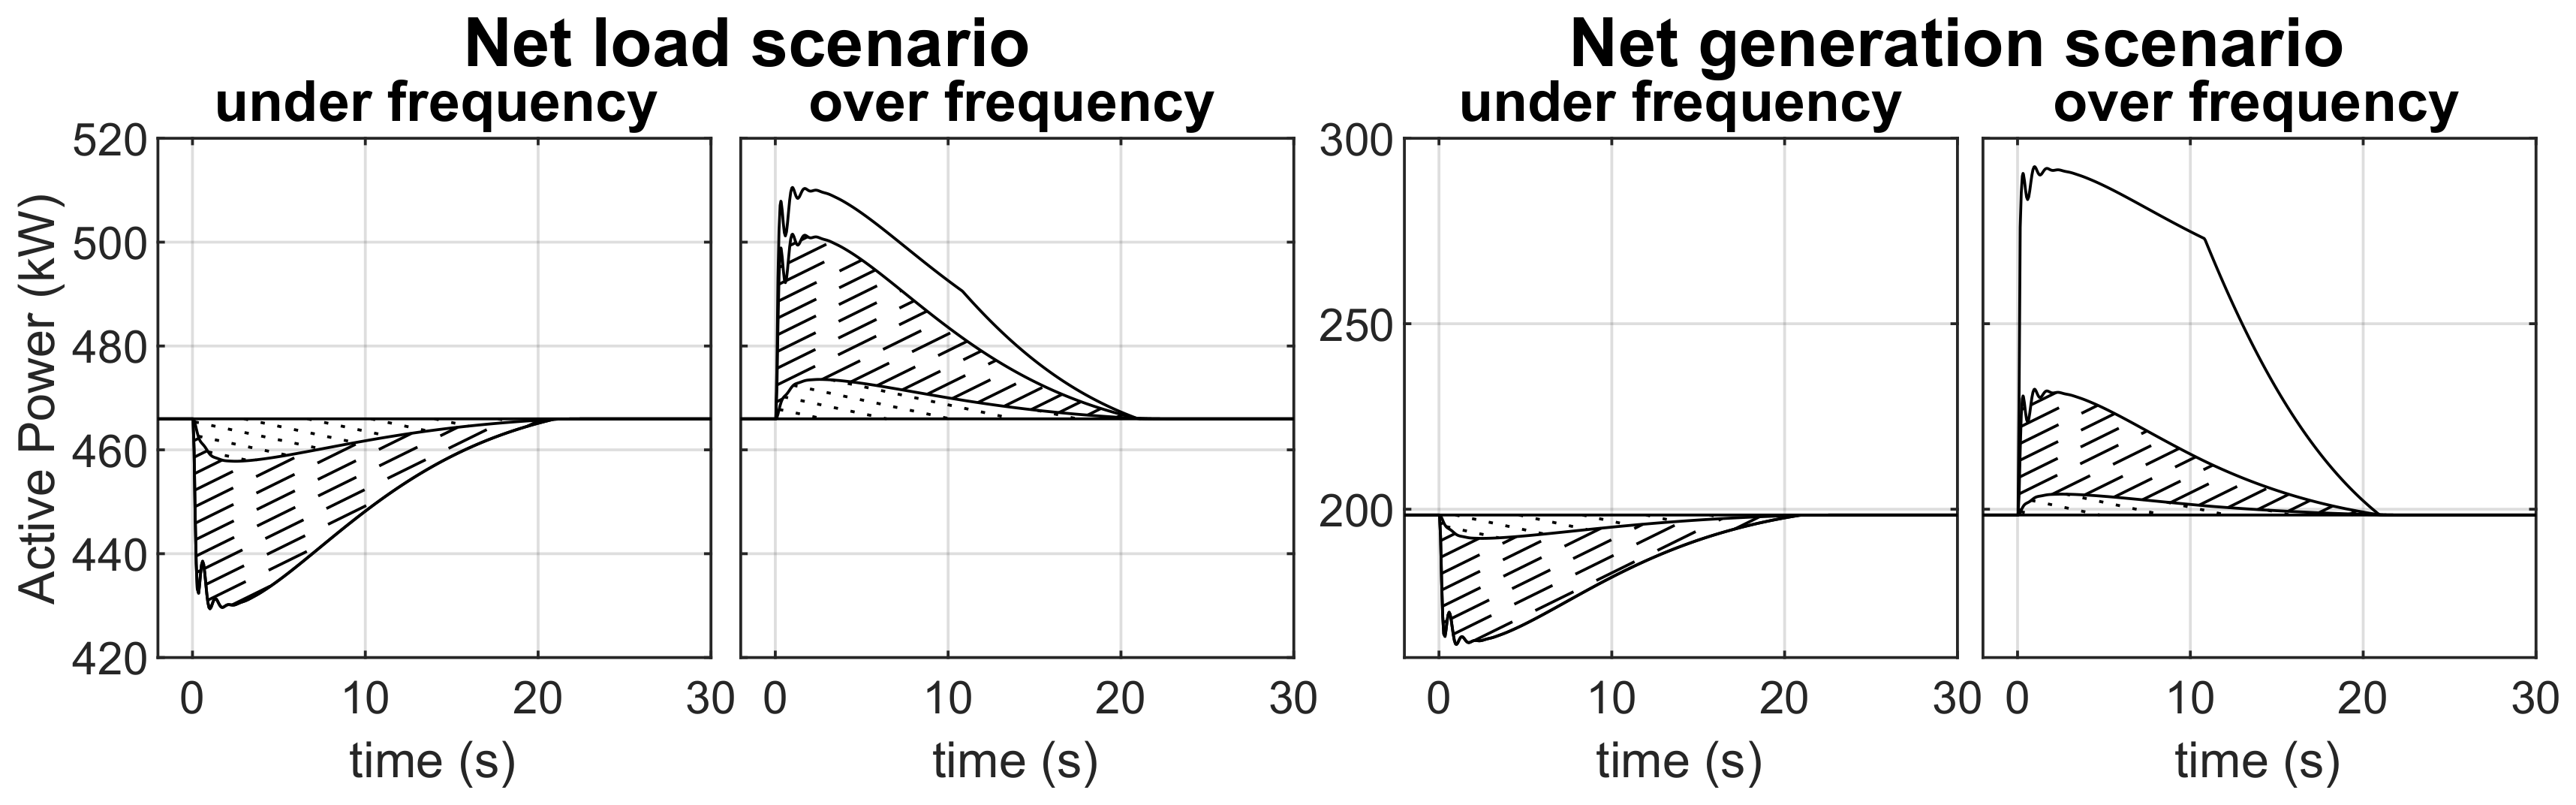
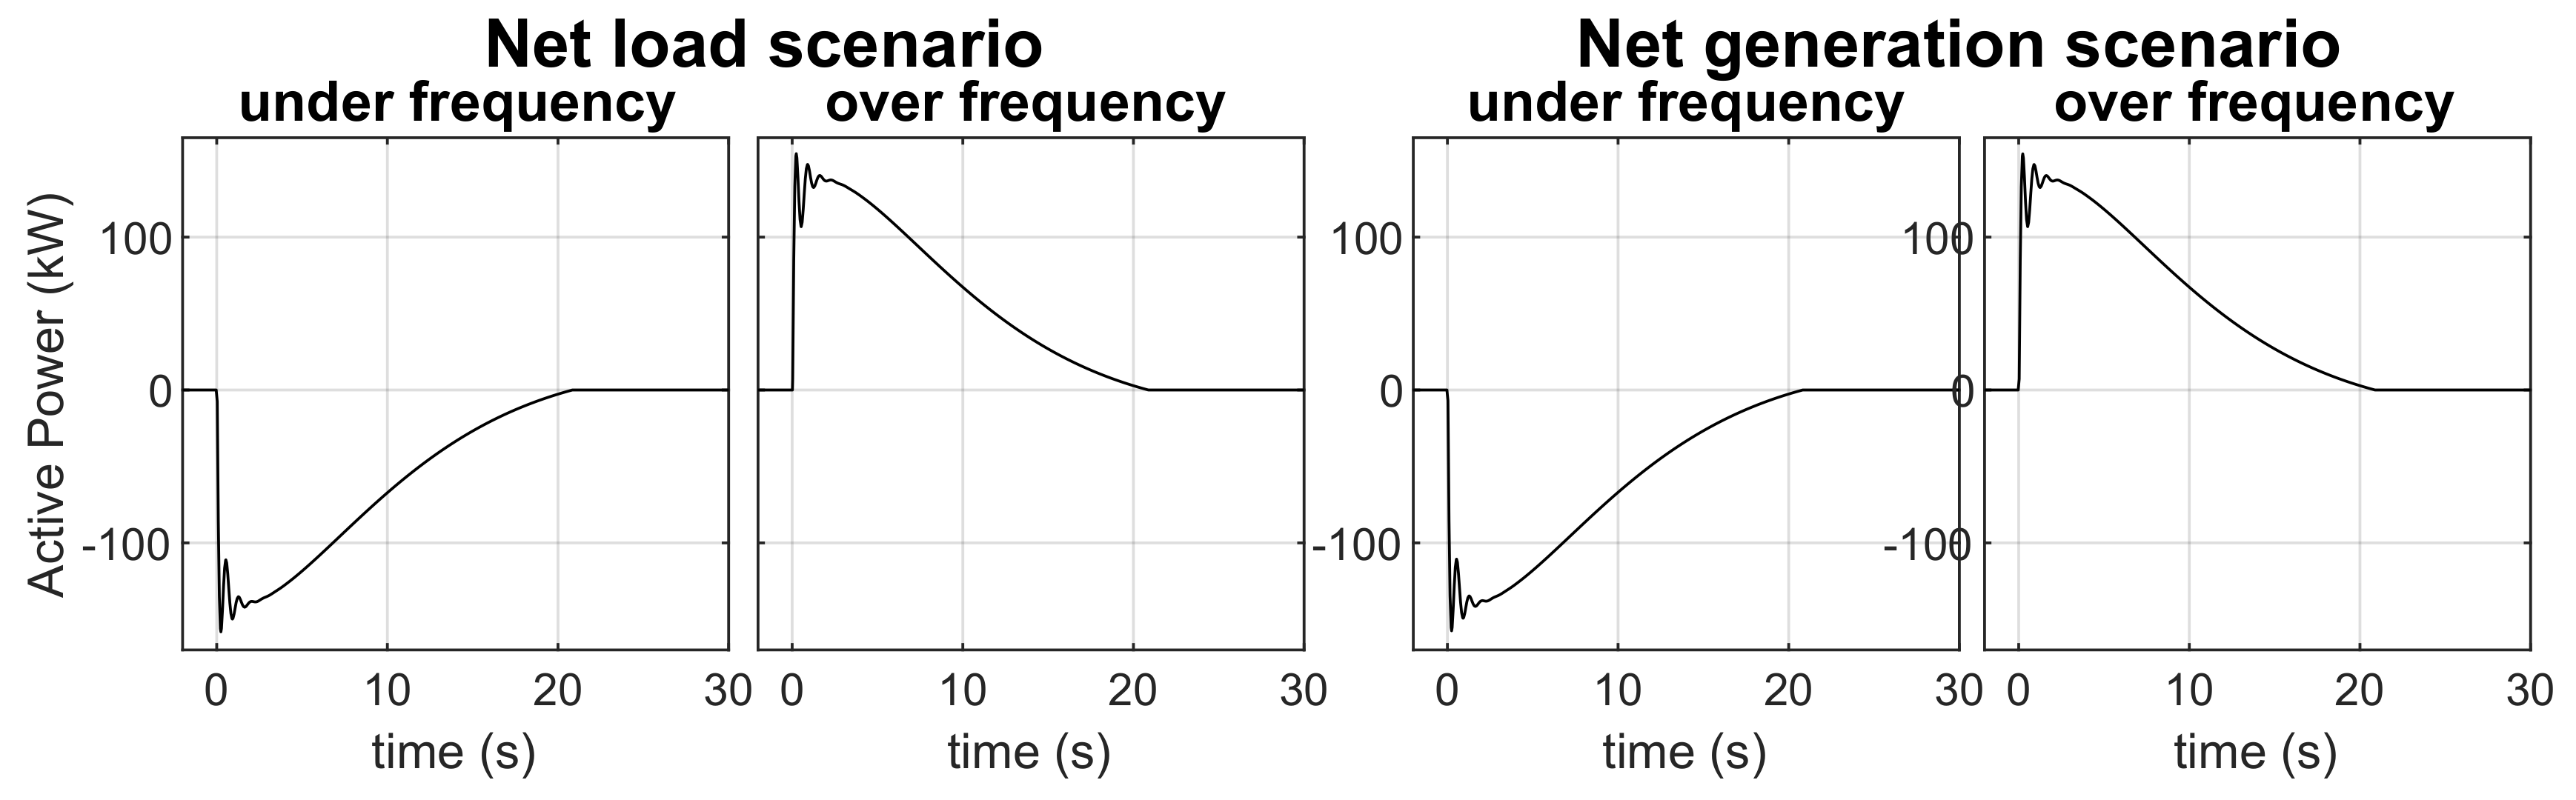
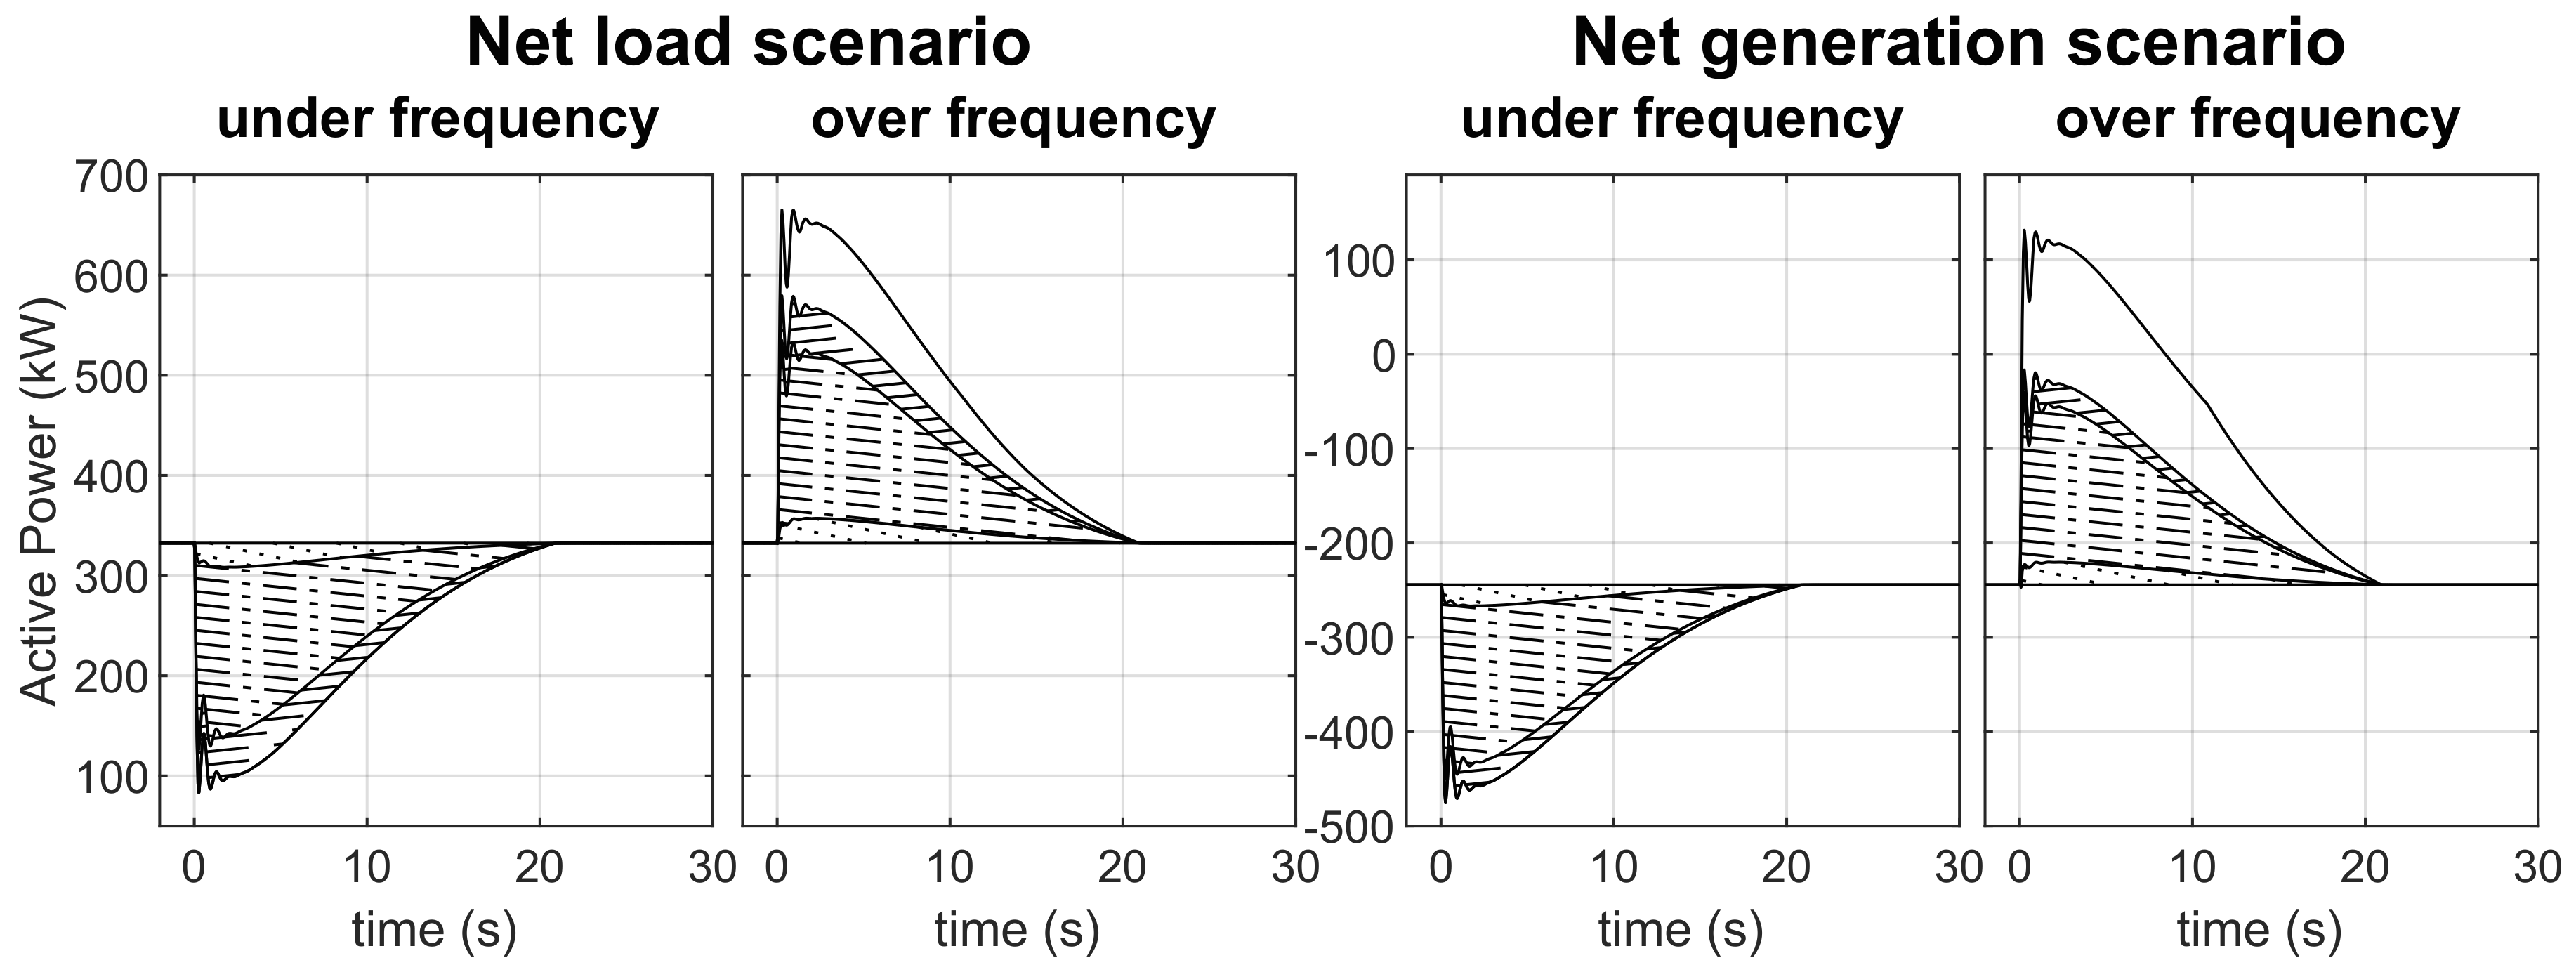
4. Results and Discussion

In order to demonstrate the effectiveness of the proposed control functionalities described in Section 3, a test system was considered, comprising an hybrid AC/DC distribution network (Figure 7 and Figure 8), the ST from Figure 2 and the equivalent representation of the upstream AC power system (Figure 10). Moreover, the performance of the proposed control functionalities was evaluated in four operational scenarios for the hybrid distribution network, namely:
  • Over frequency event in the upstream AC grid and net load scenario in the hybrid distribution network;
  • Over frequency event in the upstream AC grid and a net generation scenario in the hybrid distribution network;
  • Under frequency event in the upstream AC grid and a net load scenario in the hybrid distribution network;
  • Under frequency event in the upstream AC grid and a net generation scenario in the hybrid distribution network.
The main data and model parameters used in the test system are presented in Section 4.1. The obtained simulation results are presented and discussed in Section 4.2.

4.1. Model Parameters

The main parameters of the used computational models are presented in this section. Table 1 presents the main parameters of the equivalent main power system to which the ST is connected. Table 2 presents relevant data of the ST.
Regarding the steady-state conditions for the considered scenarios, the relevant data are presented in Table 3. For the net load scenarios, a total active load of 1.15 MW and a total active generation of 830 kW are considered in the hybrid AC/DC network in steady-state conditions (operation at nominal voltage and frequency). Regarding the net generation scenarios, considering the same conditions, a total active load of 700 kW and a total active generation of 1.1 MW are considered in the hybrid AC/DC network. Regarding the parametrization of the droop controllers for all scenarios, they were set according to Table 4.

4.2. Simulation results

In order to demonstrate the effectiveness of the proposed control functionalities described in Section 3, a sudden connection of 200 MW and a sudden disconnection of 200 MW in the main power system were considered both for net load and net generation scenarios in the hybrid distribution network. The considered power disturbances originated under- and over-frequency disturbances in the main power system, for both net load and net generation scenarios considered for the hybrid distribution network as represented in Figure 18. The resulting frequency disturbances are intended to evaluate the response of the active power-frequency support capabilities proposed for the ST regarding both under- and over-frequency conditions. It is possible to observe that the frequency disturbances in both net load and net generation scenarios are very similar. Such behavior was expected since the magnitude of the considered load steps (200 MW) is much higher than the rated power of the ST (1MVA).
In order to demonstrate the aggregated response of the active power-frequency support functionalities proposed for the ST and downstream hybrid AC/DC system, the presented results were obtained with the simultaneous operation of all droop controllers incorporated in the ST designed for that purpose. Since the frequency curves shown in Figure 18 are practically identical for both net load and net generation scenarios, the response of the droop controllers incorporated in the ST was practically identical for both scenarios, as shown in Figure 19.
The response of the f L V ( f M V ) and V L V ( f M V ) droops is shown in Figure 19a,b respectively, where it is possible to observe that the frequency and the RMS value of the voltage in the LV AC network are modulated according to the frequency disturbances observed in the MV AC network. Further, the response of the V D C ( f M V ) droop is shown in Figure 19c, where it is possible to observe that the voltage in the MV DC network is also modulated according to the frequency disturbances observed in the MV AC network. The voltage regulation performed over the MV DC network affects the voltage in the LV DC network, as shown in Figure 19d, since a fixed transformation ratio is defined for the isolated DC/DC converter. It is worth mentioning that the effect of the droops’ dead band is notorious from roughly t = 21 s, since the droop responses stabilize before the frequency returns completely to its nominal value.
The actuation of the droop controllers on the voltage and frequency in the hybrid distribution network originated a response of the hybrid distribution network in terms of net active power. The active power response obtained from the DC networks provided by each type of resource in each scenario is presented in Figure 20. The active power output in the DC networks before the frequency disturbance is slightly lower than the values presented in Table 3 due to power losses in the cables. Nevertheless, it is possible to observe that the ST is capable of extracting an active power response from the fleet of resources available in the DC networks for all the considered scenarios, in order to provide active power-frequency support to the main power system.
During under-frequency scenarios, a decrease in power consumption or increase in the generated power (depending on the scenario) takes place. During over-frequency scenarios, an increase in power consumption or decrease in the generated power (depending on the scenario) takes place. The active power response during the under-frequency scenarios is due solely to the reduction of the load power consumption. Controllable PV generation does not provide any contribution for under-frequency scenarios, since it is assumed that it operates at the maximum power point before the frequency disturbance. By contrast, the DC EV chargers are capable of reacting to both over- and under-frequency scenarios occurring in the MV AC network. Non-controllable load also provides active power compensation in both over- and under-frequency scenarios. The chosen droop settings ( V D C ( f M V ) and P ( V D C ) ) determine that the contribution of controllable units for active power compensation is considerably higher than the contribution of load voltage sensitivity of non-controllable loads. It is worth mentioning that the distinction between the net load and net generation scenarios takes into consideration the net power in the hybrid AC/DC distribution network as a whole, not only in the DC networks.
Regarding the AC LV network, the active power adjustment provided by each type of resource is presented in Figure 21. The active power output in the LV AC network before the frequency disturbance is slightly lower than the values presented in Table 3 due to power losses in the cables. Nevertheless, it is possible to observe that the ST is capable of extracting an active power response from the fleet of resources available in the LV AC network for all the considered scenarios, in order to provide active power-frequency support to the main power system. During under-frequency scenarios, a decrease in power consumption takes place, while during over-frequency scenarios, the power consumption increases. The active power response during the under-frequency scenarios is due solely to the reduction of the load power consumption. Controllable PV generation does not provide any contribution for under-frequency scenarios, since it is assumed that it operates at the maximum power point before the frequency disturbance. By contrast, the controllable energy storage and the non-controllable load provide active power compensation in both over- and under-frequency scenarios. The chosen droop settings ( V L V ( f M V ) , f L V ( f M V ) and P ( f L V ) ) determine that the contribution of controllable units for active power compensation is considerably higher than the contribution of load voltage sensitivity of non-controllable loads. It is worth mentioning that the distinction between the net load and net generation scenarios takes into consideration the net power in the hybrid AC/DC distribution network as a whole, not only the LV AC network.
Additionally, the local ESS incorporated in the ST has also responded to the frequency deviations observed in the MV AC network using the P ( f M V ) droop. As shown in Figure 22, the local ESS provides an effective contribution in terms of active power for all considered scenarios. It is also possible to observe that the response of the local ESS does not depend on the load scenario in the hybrid distribution network. This behavior was expected since the local ESS was set to react only as a function of the P ( f M V ) droop.
The overall active power-frequency support provided by the ST to the main power system for all the considered scenarios is obtained from the sum of all responses depicted in Figure 20, Figure 21 and Figure 22. The disaggregated contribution per type of resource is shown in Figure 23, where it is possible to observe the global contribution of non-controllable loads, controllable PV generation, controllable EV charging and energy storage capacity available in the hybrid distribution network plus local ESS.
For the net load scenarios, the total active power consumed by the ST increases from approximately 330 to approximately 660 kW during the response to the over-frequency event and decreases to approximately 100 kW during the response to the under-frequency case. For the net generation scenarios, the total active power injected by the ST increases from approximately 240 to approximately 460 kW during the response to the under-frequency event but reaches an active power consumption of roughly 120 kW during the response to the over-frequency case.

5. Conclusions

This paper presents a new approach for endowing ST-connected hybrid AC/DC distribution grids to provide active power-frequency regulation services to the upstream AC power system. The ability to provide this regulation service is of utmost relevance in future scenarios characterized by the massive integration of DER in distribution grids, where hybrid AC/DC distribution grids may play an important role. The proposed control strategy relies in a set of droop-based controllers to be embedded in the ST power conversion stages that are responsible for modulating its electrical variables (DC grids voltage, LV AC grid voltage and frequency) as well as the local ESS active power. Moreover, droop-based controllers are also associated to controllable DER available in the hybrid distribution network, making them responsive to ST electric variables. The load-voltage sensitivity of AC and DC connected loads is also exploited as a possible contribution within the scope of the active power-frequency regulation. The effectiveness of the proposed approach is illustrated in different operating scenarios of a hybrid AC/DC network connected to an ST. The numerical simulation results, obtained for different operating conditions, provide support to the possibility of further exploiting the proposed solution in ST connected hybrid AC/DC distribution grids regarding the need of providing active power-frequency regulation services to the upstream power grid.
The number of controllable DER resources and non-controllable resources considered in the test case under discussion in this paper suggests that the proposed approach can be extended to any number of controllable DER resources and non-controllable resources available in a hybrid AC/DC distribution network. Further, the proposed approach can be potentially extended to more than one Smart Transformer connected to the main power system, and to provide power-frequency regulation in hybrid distribution grids operating autonomously in islanded mode. Although not properly addressed in this paper, these subjects constitute research topics to be covered in the future due to its relevance. Moreover, according to [34], the use of the DAM approach is adequate to develop computational models suited for real-time platforms, but such an evaluation did not take place in the scope of this work, constituting though a aspect to be exploited in future research works.

Author Contributions

J.R. carried out the main research task and wrote the full manuscript. C.M. proposed the original idea and contributed to the revision of the obtained results and of the whole manuscript. J.P.L. contributed with a valuable evaluation of the scenarios to be considered and contributed to the revision of the whole manuscript. All authors have read and agreed to the published version of the manuscript.

Funding

This work is financed by the ERDF—European Regional Development Fund through the Operational Programme for Competitiveness and Internationalisation—COMPETE 2020 Programme and by National Funds through the Portuguese funding agency, FCT—Fundação para a Ciência e a Tecnologia, within project ESGRIDS—Desenvolvimento Sustentável da Rede Elétrica Inteligente, Ref. SAICTPAC/0004/ 2015-POCI-01-0145-FEDER-016434.

Conflicts of Interest

The authors declare no conflict of interest.

Nomenclature

Δ f L V Output from the f L V ( f M V ) droop controller
Δ I E S S r e f Output from the P ( f M V ) droop controller
Δ P Output from the V L V ( f M V ) Droop and P ( f L V ) Droop Controllers
Δ V L C Compensation component for the Voltage drop in the LC filter
Δ V A C L V Output from the V L V ( f M V ) droop controller
Δ Y / Δ Y + Maximum negative/positive variation of Y in the droop controller around Y o s
Δ VDC MV Output from the V D C ( f M V ) droop controller
ϕ Phase-shift between the square waveforms applied to the HFT
CCapacitance of the coupling filter
C L V Capacitance of the ST’s LV DC bus
C M V Capacitance of the ST’s MV DC bus
f c Cut-off frequency of the coupling filter
f L V Reference frequency for the ST’s LV inverter
f L V ( f M V ) Frequency (AC LV grid) - frequency (AC MV grid) droop
f M V Frequency measured in the MV AC network
I E S S Current in the local ESS
I a L V , I b L V , I c L V AC currents in the ST’s LV inverter, each phase
I a M V , I b M V , I c M V AC currents in the ST’s MV inverter, each phase
I d Measured active current in the ST’s MV inverter
I d r e f , I d r e f * Reference for the active current in the ST’s MV inverter
I D A B L V DC current in the secondary stage of the isolated DC/DC converter
I D A B M V DC current in the primary stage of the isolated DC/DC converter
I D C L V g Current exchanged between C L V and the ST’s LV DC network
I D C L V i n v Current exchanged between the ST’s LV inverter and the ST’s LV DC bus
I D C M V g Current exchanged between C M V and the ST’s MV DC network
I D C M V i n v Current exchanged between the ST’s MV inverter and the ST’s MV DC bus
I E S S r e f MV side equivalent for the reference current for the local ESS
I L V c a p Current flowing to the capacitance C L V
I M V c a p Current flowing to the capacitance C M V
I M V m a x p Maximum AC current peak value of the ST’s MV inverter
I q Measured reactive current in the ST’s MV inverter
I q r e f , I q r e f * Reference for the reactive current in the ST’s MV inverter
LInductance of the coupling filter
m d Slope of the droop controller
NTransformation ratio of the isolated DC-DC converter
P ( f L V ) Active power-frequency (AC LV grid) droop
P ( f M V ) Active power-frequency (AC MV grid) droop
P ( V D C ) Active power - DC voltage droop
P r e f Reference active power for the ST’s MV inverter
P D C L V Power output of the isolated DC/DC converter in the LV side
P D C M V Power output of the isolated DC/DC converter in the MV side
P E S S r e f Active power set-point for the local ESS
P L V I n v Active power in the ST’s LV inverter
P M V I n v Active power exchanged between the ST and the upstream MV AC grid
V L V ( f M V ) Voltage (AC LV grid) - frequency (AC MV grid) droop
V a L V , V b L V , V c L V AC voltages in the ST’s LV inverter, each phase
V a M V , V b M V , V c M V AC voltages in the ST’s MV inverter, each phase
V a b c L V Reference three-phase voltage for the ST’s LV inverter
V A C L V i n v Reference for the three-phase AC voltage in the ST’s LV inverter
V D C ( f M V ) DC Voltage (MV DC bus) - frequency (AC MV grid) droop
V D C L V n Reference value for the DC voltage in the ST’s LV DC bus
V D C L V DC voltage in the ST’s LV DC bus
V D C M V n Reference value for the DC voltage in the ST’s MV DC bus
V D C M V DC voltage in the ST’s MV DC bus
X d b / X d b + Dead-band limits of the droop controller
X L Primary-referred leakage reactance of the isolated DC/DC converter
X m i n / X m a x Minimum/maximum value of X at which the droop controller responds
Y m i n / Y m a x Minimum/maximum output of the droop controller
Y o s Offset value of the droop controller
Z 0 Characteristic impedance of the coupling filter

References

  1. IRENA. Global Energy Transformation: A Roadmap to 2050 (2019 Edition); Technical report; International Renewable Energy Agency: Abu Dhabi, UAE, 2019. [Google Scholar]
  2. IEA. Renewables 2018: Analysis and Forecasts to 2023; Technical report; International Energy Agency: Paris, France, 2018. [Google Scholar]
  3. IEA. Global EV Outlook 2018: Towards Cross-Modal Electrification; Technical report; International Energy Agency: Paris, France, 2018. [Google Scholar]
  4. De Hoog, J.; Alpcan, T.; Brazil, M.; Thomas, D.A.; Mareels, I. Optimal Charging of Electric Vehicles Taking Distribution Network Constraints into Account. IEEE Trans. Power Syst. 2015, 30, 365–375. [Google Scholar] [CrossRef] [Green Version]
  5. Veldman, E.; Verzijlbergh, R.A. Distribution Grid Impacts of Smart Electric Vehicle Charging From Different Perspectives. IEEE Trans. Smart Grid 2015, 6, 333–342. [Google Scholar] [CrossRef]
  6. Remon, D.; Cantarellas, A.M.; Mauricio, J.M.; Rodriguez, P. Power system stability analysis under increasing penetration of photovoltaic power plants with synchronous power controllers. IET Renew. Power Gener. 2017, 11, 733–741. [Google Scholar] [CrossRef] [Green Version]
  7. He, G.; Chen, Q.; Kang, C.; Xia, Q.; Poolla, K. Cooperation of Wind Power and Battery Storage to Provide Frequency Regulation in Power Markets. IEEE Trans. Power Syst. 2017, 32, 3559–3568. [Google Scholar] [CrossRef]
  8. Fang, J.; Li, H.; Tang, Y.; Blaabjerg, F. Distributed Power System Virtual Inertia Implemented by Grid-Connected Power Converters. IEEE Trans. Power Electron. 2018, 33, 8488–8499. [Google Scholar] [CrossRef] [Green Version]
  9. Molina-García, Á.; Mastromauro, R.A.; García-Sánchez, T.; Pugliese, S.; Liserre, M.; Stasi, S. Reactive Power Flow Control for PV Inverters Voltage Support in LV Distribution Networks. IEEE Trans. Smart Grid 2017, 8, 447–456. [Google Scholar] [CrossRef] [Green Version]
  10. Tamrakar, U.; Shrestha, D.; Maharjan, M.; Bhattarai, B.P.; Hansen, T.M.; Tonkoski, R. Virtual Inertia: Current Trends and Future Directions. Appl. Sci. 2017, 7, 654. [Google Scholar] [CrossRef]
  11. Fan, Z.; Kulkarni, P.; Gormus, S.; Efthymiou, C.; Kalogridis, G.; Sooriyabandara, M.; Zhu, Z.; Lambotharan, S.; Chin, W.H. Smart Grid Communications: Overview of Research Challenges, Solutions, and Standardization Activities. IEEE Commun. Surv. Tutor. 2013, 15, 21–38. [Google Scholar] [CrossRef] [Green Version]
  12. Gouveia, C.; Rua, D.; Ribeiro, F.; Miranda, L.; Rodrigues, J.; Moreira, C.; Lopes, J.P. Experimental validation of smart distribution grids: Development of a microgrid and electric mobility laboratory. Int. J. Electr. Power Energy Syst. 2016, 78, 765–775. [Google Scholar] [CrossRef]
  13. European Commission. Establishing a Network Code on Requirements for Grid Connection of Generators, no 2016/631; European Commission: Brussels, Belgium, 14 April 2016. [Google Scholar]
  14. Justo, J.J.; Mwasilu, F.; Lee, J.; Jung, J.W. AC-microgrids versus DC-microgrids with distributed energy resources: A review. Renew. Sustain. Energy Rev. 2013, 24, 387–405. [Google Scholar] [CrossRef]
  15. Yoldaş, Y.; Önen, A.; Muyeen, S.; Vasilakos, A.V.; Alan, İ. Enhancing smart grid with microgrids: Challenges and opportunities. Renew. Sustain. Energy Rev. 2017, 72, 205–214. [Google Scholar] [CrossRef]
  16. Hatziargyriou, N. Operation of Multi-Microgrids. In Microgrids: Architectures and Control; IEEE: New York, NY, USA, 2014; pp. 165–205. [Google Scholar] [CrossRef]
  17. Bidram, A.; Davoudi, A. Hierarchical Structure of Microgrids Control System. IEEE Trans. Smart Grid 2012, 3, 1963–1976. [Google Scholar] [CrossRef]
  18. Han, H.; Hou, X.; Yang, J.; Wu, J.; Su, M.; Guerrero, J.M. Review of Power Sharing Control Strategies for Islanding Operation of AC Microgrids. IEEE Trans. Smart Grid 2016, 7, 200–215. [Google Scholar] [CrossRef] [Green Version]
  19. Mirsaeidi, S.; Dong, X.; Shi, S.; Tzelepis, D. Challenges, advances and future directions in protection of hybrid AC/DC microgrids. IET Renew. Power Gener. 2017, 11, 1495–1502. [Google Scholar] [CrossRef] [Green Version]
  20. Dragičević, T.; Lu, X.; Vasquez, J.C.; Guerrero, J.M. DC Microgrids—Part I: A Review of Control Strategies and Stabilization Techniques. IEEE Trans. Power Electron. 2016, 31, 4876–4891. [Google Scholar]
  21. Dragičević, T.; Lu, X.; Vasquez, J.C.; Guerrero, J.M. DC Microgrids—Part II: A Review of Power Architectures, Applications, and Standardization Issues. IEEE Trans. Power Electron. 2016, 31, 3528–3549. [Google Scholar] [CrossRef] [Green Version]
  22. Ferreira Costa, L.; De Carne, G.; Buticchi, G.; Liserre, M. The Smart Transformer: A solid-state transformer tailored to provide ancillary services to the distribution grid. IEEE Power Electron. Mag. 2017, 4, 56–67. [Google Scholar] [CrossRef]
  23. Liserre, M.; Buticchi, G.; Andresen, M.; Carne, G.D.; Costa, L.F.; Zou, Z. The Smart Transformer: Impact on the Electric Grid and Technology Challenges. IEEE Ind. Electron. Mag. 2016, 10, 46–58. [Google Scholar] [CrossRef] [Green Version]
  24. De Carne, G.; Zou, Z.; Buticchi, G.; Liserre, M.; Vournas, C. Overload Control in Smart Transformer-Fed Grid. Appl. Sci. 2017, 7, 208. [Google Scholar] [CrossRef] [Green Version]
  25. Couto, M.; Lopes, J.P.; Moreira, C. Control strategies for Multi-Microgrids islanding operation through Smart Transformers. Electr. Power Syst. Res. 2019, 174, 105866. [Google Scholar] [CrossRef]
  26. Stenclik, D.; Denholm, P.; Chalamala, B. Maintaining Balance: The Increasing Role of Energy Storage for Renewable Integration. IEEE Power Energy Mag. 2017, 15, 31–39. [Google Scholar] [CrossRef]
  27. Zou, Z.X.; Carne, G.D.; Buticchi, G.; Liserre, M. Frequency-Adaptive Control of Smart Transformer-Fed Distribution Grid. In Proceedings of the 2016 IEEE Applied Power Electronics Conference and Exposition (APEC), Long Beach, CA, USA, 20–24 March 2016. [Google Scholar]
  28. Carne, G.D.; Buticchi, G.; Liserre, M.; Marinakis, P.; Vournas, C. Coordinated frequency and Voltage Overload Control of Smart Transformers. In Proceedings of the 2015 IEEE Eindhoven PowerTech, Eindhoven, The Netherlands, 29 June–2 July 2015; pp. 1–5. [Google Scholar]
  29. De Carne, G.; Buticchi, G.; Liserre, M. Reverse power flow control in a ST-fed distribution grid. In Proceedings of the 2016 IEEE Energy Conversion Congress and Exposition (ECCE), Milwaukee, WI, USA, 18–22 September 2016; pp. 1–5. [Google Scholar]
  30. Chen, J.; Zhu, R.; Liu, M.; De Carne, G.; Liserre, M.; Milano, F.; O’Donnell, T. Smart Transformer for the Provision of Coordinated Voltage and Frequency Support in the Grid. In Proceedings of the IECON 2018—44th Annual Conference of the IEEE Industrial Electronics Society, Washington, DC, USA, 21–23 October 2018; pp. 5574–5579. [Google Scholar]
  31. De Carne, G.; Buticchi, G.; Liserre, M.; Vournas, C. Real-Time Primary Frequency Regulation using Load Power Control by Smart Transformers. IEEE Trans. Smart Grid 2018, 10, 5630–5639. [Google Scholar] [CrossRef]
  32. Lopes, J.A.P.; Moreira, C.L.; Madureira, A.G. Defining control strategies for MicroGrids islanded operation. IEEE Trans. Power Syst. 2006, 21, 916–924. [Google Scholar] [CrossRef] [Green Version]
  33. Eghtedarpour, N.; Farjah, E. Power Control and Management in a Hybrid AC/DC Microgrid. IEEE Trans. Smart Grid 2014, 5, 1494–1505. [Google Scholar] [CrossRef]
  34. Martinez-Velasco, J.A.; Alepuz, S.; González-Molina, F.; Martin-Arnedo, J. Dynamic average modeling of a bidirectional solid state transformer for feasibility studies and real-time implementation. Electr. Power Syst. Res. 2014, 117, 143–153. [Google Scholar] [CrossRef]
  35. Ramirez, J.M.; Barrios, R.A.; Salome, B.J. Details and implementation of a SiC-based solid state transformer prototype. In Proceedings of the 2017 IEEE PES Innovative Smart Grid Technologies Conference—Latin America (ISGT Latin America), Quito, Ecuador, 20–22 September 2017; pp. 1–6. [Google Scholar]
  36. Lagier, T.; Chédot, L.; Ghossein, F.W.L.; Lefebvre, B.; Dworakowski, P.; Mermet-Guyennet, M.; Buttay, C. A 100 kW 1.2 kV 20 kHz DC-DC converter prototype based on the Dual Active Bridge topology. In Proceedings of the 2018 IEEE International Conference on Industrial Technology (ICIT), Lyon, France, 20–22 February 2018; pp. 559–564. [Google Scholar]
  37. Kheraluwala, M.N.; Gascoigne, R.W.; Divan, D.M.; Baumann, E.D. Performance characterization of a high-power dual active bridge DC-to-DC converter. IEEE Trans. Ind. Appl. 1992, 28, 1294–1301. [Google Scholar] [CrossRef]
  38. Gjelaj, M.; Træholt, C.; Hashemi, S.; Andersen, P.B. DC Fast-charging stations for EVs controlled by a local battery storage in low voltage grids. In Proceedings of the 2017 IEEE Manchester PowerTech, Manchester, UK, 18–22 June 2017; pp. 1–6. [Google Scholar]
  39. Lucas-Marcillo, K.E.; Plaza Guingla, D.A.; Barra, W.; De Medeiros, R.L.P.; Melo Rocha, E.; Vaca-Benavides, D.A.; Ríos Orellana, S.J.; Herrera Muentes, E.V. Novel Robust Methodology for Controller Design Aiming to Ensure DC Microgrid Stability Under CPL Power Variation. IEEE Access 2019, 7, 64206–64222. [Google Scholar] [CrossRef]
  40. Lu, X.; Sun, K.; Guerrero, J.M.; Vasquez, J.C.; Huang, L.; Wang, J. Stability Enhancement Based on Virtual Impedance for DC Microgrids With Constant Power Loads. IEEE Trans. Smart Grid 2015, 6, 2770–2783. [Google Scholar] [CrossRef]
  41. De Carne, G.; Buticchi, G.; Liserre, M.; Vournas, C. Load control using sensitivity identification by means of smart transformer. In Proceedings of the 2017 IEEE Power Energy Society General Meeting, Manchester, UK, 18–22 June 2017; p. 1. [Google Scholar]
  42. Bayat, M.; Sheshyekani, K.; Hamzeh, M.; Rezazadeh, A. Coordination of Distributed Energy Resources and Demand Response for Voltage and Frequency Support of MV Microgrids. IEEE Trans. Power Syst. 2016, 31, 1506–1516. [Google Scholar] [CrossRef]
  43. Delille, G.; Yuan, J.; Capely, L. Taking advantage of load voltage sensitivity to stabilize power system frequency. In Proceedings of the 2013 IEEE Grenoble Conference, Grenoble, France, 16–20 June 2013; pp. 1–6. [Google Scholar]
  44. De Carne, G.; Liserre, M.; Vournas, C. On-Line Load Sensitivity Identification in LV Distribution Grids. IEEE Trans. Power Syst. 2017, 32, 1570–1571. [Google Scholar] [CrossRef] [Green Version]
Figure 1. Overall structure of the complete computational model.
Applsci 10 01434 g001
Figure 2. Smart Transformer—overall structure of the developed computational model.
Applsci 10 01434 g002
Figure 3. Smart Transformer’s (ST) Medium Voltage Inverter model and respective control structure.
Applsci 10 01434 g003
Figure 4. DC-DC converter stage model.
Applsci 10 01434 g004
Figure 5. Block diagram of the ST’s Low Voltage inverter.
Applsci 10 01434 g005
Figure 6. Block diagram of the local Energy Storage System (ESS) model.
Applsci 10 01434 g006
Figure 7. Diagram of the developed computational model for the Medium-Voltage (MV) and LV DC networks constituting the hybrid distribution grid.
Applsci 10 01434 g007
Figure 8. Diagram of the developed computational model for the LV AC network constituting the hybrid distribution grid.
Applsci 10 01434 g008
Figure 9. Block diagram of the developed computational model for the controllable AC (A) and DC (B) Distributed Energy Resources (DER) units.
Applsci 10 01434 g009
Figure 10. Equivalent computational model for the Upstream AC power system.
Applsci 10 01434 g010
Figure 11. Advanced functionalities to be exploited by the ST.
Applsci 10 01434 g011
Figure 12. General curve followed by droop controllers.
Applsci 10 01434 g012
Figure 13. Reaction chain triggered following a frequency disturbance in the MV AC network.
Applsci 10 01434 g013
Figure 14. P ( f M V ) droop controller incorporated in the controller of the MV inverter (shown in Figure 3).
Applsci 10 01434 g014
Figure 15. V D C ( f M V ) droop controller in the controller of the MV inverter (shown in Figure 3).
Applsci 10 01434 g015
Figure 16. f L V ( f M V ) and V L V ( f M V ) droop controllers incorporated in the controller of the LV inverter (depicted in Figure 5).
Applsci 10 01434 g016
Figure 17. P ( f L V ) and P ( V D C ) droop controllers incorporated in the controllable AC (A) and DC (B) DER units connected to the hybrid distribution network.
Applsci 10 01434 g017
Figure 18. Frequency variations observed in the MV AC network for the net load (up) and net generation scenarios (down): under-frequency due to load connection (left) and over-frequency due to load disconnection (right).
Applsci 10 01434 g018
Figure 19. ST (droop controller) response to the frequency variations observed in the MV AC network for the net load and net generation scenarios, in terms of voltage and frequency in the hybrid AC/DC network: (a)— f L V ( f M V ) droop; (b)— V L V ( f M V ) droop; (c) and (d)— V D C ( f M V ) droop.
Applsci 10 01434 g019
Figure 20. Active power consumption variation in DC grids due to load voltage sensitivity (dotted area), controllable EV charging (dashed area) and controllable PV generation (white area). Positive values correspond to power consumption.
Applsci 10 01434 g020
Figure 21. Active power consumption variation in the AC LV network due to load voltage sensitivity (dotted area), controllable energy storage (dashed area) and controllable PV generation (white area). Positive values correspond to power consumption.
Applsci 10 01434 g021
Figure 22. Active power variation in the local ESS. Positive values represent power consumption (ESS charging). Positive values correspond to power consumption.
Applsci 10 01434 g022
Figure 23. Active power-frequency support provided by the ST to the main power system, obtained from non-controllable loads (dotted area), controllable energy storage (dot-dash area), controllable EV charging (dashed area) and controllable PV generation (white area). Positive values represent power consumption.
Applsci 10 01434 g023
Table 1. Main power system: main parameters.
Generation Capacity1 GW
Total Load600 MW/200 MVA
Equivalent system Inertia (H)2 s
Equivalent impedance (seen from MV connection)0.02 + j0.232 Ω
Table 2. Smart Transformer: main parameters.
Nominal Power1 MVA
Nominal MV AC Voltage (ph-ph)15,000 V (RMS)
Nominal MV DC link Voltage27,000 V
Nominal LV DC link Voltage720 V
Nominal LV AC Voltage (ph-n)230 V (RMS)
Table 3. Steady-state conditions and operation limits (nominal voltage and frequency).
Net Load Scenario
Z Cables *LoadPV Generation **EV Charging **ESS **
LV AC network
0.01 + j0.003 Ω 500 kW/220 kvar−30 kW (−30–0 kW)-0 kW (±30 kW)
LV DC network
0.02 Ω 50 kW/-−150 kW (−150–0 kW)200 kW (0–300 kW)-
MV DC network
0.02 Ω 150 kW/-−650 kW (−650–0 kW)250 kW (0–400 kW)-
Smart Transformer
-330 kW/0 kvar ***--0 kW (±1 MW) ****
Net Generation Scenario
Z Cables *LoadPV Generation **EV Charging **ESS **
LV AC network
0.01 + j0.003 Ω 400 kW/220 kvar−200 kW (−200–0 kW)-0 kW (±30 kW)
LV DC network
0.02 Ω 50 kW/-−200 kW (−200–0 kW)100 kW (0–300 kW)-
MV DC network
0.02 Ω 150 kW/-−700 kW (−700–0 kW)150 kW (0–400 kW)-
Smart Transformer
-−400 kW / 0 kvar ***--0 kW (±1 MW) ****
* All cable sections in each sub-network are considered to have the same impedance; ** the allowable variation range is represented between brackets; *** net load in the ST MV inverter (sum of active load and generation in the hybrid network; **** local ESS incorporated in the ST.
Table 4. Droop Controllers: main characteristics.
DroopSlopeOffset (Net Load/Net Generation)Dead-BandLimits
P( f M V )-Local ESS5e5 W/Hz0 W50 ± 0.025 Hz±200 kW
f L V ( f M V )1 Hz/Hz50 Hz50 ± 0.025 Hz±0.5 Hz
V L V ( f M V )80 V/Hz230 V50 ± 0.025 Hz±25 V
VDC( f M V ) *4e3V/Hz27 kV50 ± 0.025 Hz±5 kV
P( f L V )-ESS1e5W/Hz0 W50 ± 0.025 Hz±30 kW
P( f L V )-PV **2.5SP/fn−30 kW/−200 kW ***±0%+0/−30%
P(VDC)-PV **2.5SP/VDCn−800 kW/−900 kW ***±0%+0/−10%
P(VDC)-EV **2.5SP/VDCn450 kW/250 kW ***±0%±10%
Note: EV—EV chargers; SP—Setpoint prior to droop actuation; fn—Nominal frequency; VDCn—Nominal DC voltage in DC networks; * set for MV DC network. Affects LV DC network according transformation ratio; ** droop parameters are function of base active power set-point; *** aggregated values.

