Abstract
There are similarities and differences between open public space soundscape evaluation in different countries, mainly due to the influence of cultural background. This paper systematically compares the effect of social-cultural context on soundscape of urban public open spaces in China and Croatia. Eleven well-known and typical squares were selected. A series of questionnaire surveys within the soundscape framework were carried out during the summer season, and gathered data were analyzed. Principal component analysis (PCA) resulted in two principal components, eventfulness and pleasantness, as notable soundscape factors. However, eventfulness is the major factor in China, and pleasantness is the major factor in Croatia. In terms of environmental satisfaction, natural condition is the major factor based on PCA. Urban condition is the second factor in China, however, it is the third factor in Croatia. It is interesting to note that the physical environment is the most important factor in Croatian inland and coastal places, which is different compared to Chinese places. Visit purpose is the dominant factor associated with sound and environmental satisfaction. Natural sound and children have mainly positive correlations to sound and environmental satisfaction in China, whereas sounds of human activities have mainly negative correlations to sound and environmental satisfaction in Croatia.
1. Introduction
Soundscape and acoustic satisfaction are important parts of overall physical environmental satisfaction [1,2,3,4]. The study of urban soundscape [5,6,7,8,9], as well as of urban public open spaces [10] has been very extensive. Throughout the soundscape research of public open spaces with different functions and in different regions, the soundscape framework has been gradually established, in terms of sound, space, people and environment [11]. The soundscape paradigm recognizes environmental, social, and cultural significances and importance for a given community [12].
Noise pollution represents a major health problem for the modern world and reducing noise exposure of inhabitants [13] would help avoiding the well-known health effects: sleep disorders [14], learning impairment [15,16], hypertension ischemic heart disease [17,18] and risk for diabetes annoyance [19]. Such noise exposure is generally produced by common source roads [20,21], railway traffic [22], airports [23], and industrial plants [24]. A multivariate model has been developed to predict the probability of invoking a high noise annoyance response due to combined water sound and road traffic noise exposure [25]. The influence of spatial contexts on soundscapes in urban spaces have been explored [26,27]. In terms of sound and space within the soundscape framework, research on combined sound sources [28,29,30] and their distribution related to spatial contexts have been carried out.
The evaluation of how sound influences people depends primarily on subjective response, rather than merely being based on objective parameters [31]. Response to sound depends on the listener’s mental, social and geographical relation to the sound source and its context [32]. Countryside soundscape has been also studied through human preference [33]. The effect of demographic and social factors on sound evaluation and perception in urban public open spaces have been studied as well [10,34,35,36].
Considerable investigations have been carried out from the viewpoint of physical environment influence on soundscape. Liu et al. [37] analyzed the effects of landscape factors on soundscape perception in city parks. Jeon et al. [38] combined landscape, acoustics and light to investigate perceptions of urban soundscape. They concluded that urban soundscapes can be characterized by soundmarks, and soundscape perceptions are dominated by acoustic comfort, visual images and daylight. Pheasant et al. [39] presented an optimal relationship between the soundscape and the visual composition of a location for a “tranquil space”. Moreover, the audio-visual interaction and perception of water features used to mask road traffic noise were examined [40,41].
Cross-national studies on soundscape perception in different regions have been conducted as well. Kuwano et al. compared the sound quality [42] and emotional expression of various environmental noise sounds [43] using semantic differentials in Japan, Germany, the U.S.A. and China. Comparisons of semantic evaluation of noise with tonal components were conducted in Japan, France and Germany [44]. Responses to questionnaires of Arab and Turkish residents were compared for indoor soundscape perception in residential spaces, in terms of cultural, social and habitual criteria [45]. The effect of road traffic noise with horn sounds on annoyance evaluation between the Vietnamese and Japanese has been examined [46]. The effect of socio-cultural context, including language, on soundscape assessments in urban parks through laboratory experiments has been examined in France, Korea and Sweden as well [47].
However, the integral studies of soundscape framework are still limited. Moreover, cross-national comparisons have not been carried out systematically within the soundscape framework, which include contexts of environment indicators, social/demographical factors and sound sources. The aim of this paper is to focus on a cross-national comparison between two countries, based on soundscape framework. More specifically, comparisons of general satisfaction, soundscape indicators, sound satisfaction evaluation with integrated contexts of environment indicators, the effect of people characteristics and sound sources on soundscape perception have been undertaken. Five cities and eleven public open squares in China and Croatia were selected for comparison. Questionnaire surveys have been used to study the subjective evaluations.
2. Materials and Methods
In terms of soundscape framework, environmental indicators, people and sound sources, which form contexts for soundscape, influence the soundscape evaluation [12]. In this paper, subjective satisfaction, environmental indicators, demographic and social factors of people, and sound sources perception were investigated, after the sites were selected. The effects of contexts within the soundscape framework were analyzed.
2.1. Sites
Two countries were selected for this cross-national comparative study: China in Asia and Croatia in Europe. Croatia is one of the European countries whose economic development is close to China. It has both inland and coastal cities, which are close to the latitude of inland and coastal cities in northern China. Five cities were selected in China and Croatia for the field questionnaire survey and comparative study. Those are all tourist cities, which enabled the inclusion of non-local participants in the questionnaire survey. Two inland cities were selected: Harbin as a typical and provincial capital city in northern China, and Zagreb as the capital of Croatia, both located at about 45-degrees north latitude. The other three coastal cities were selected: Huludao, as a typical and coastal tourist city in northern China, and Biograd na moru and Zadar, as ancient and well-known cities in Croatia, all located at about 40-degrees north latitude. These cities have similar geographic locations, microclimatic conditions (especially as this research was conducted during the summer period), and surrounding environment.
Eleven urban public open spaces in total were chosen, as shown in Table 1. Three inland squares were selected in Harbin, namely the Square of Flood Control Monument, Zhaolin Park and the Square of Gexin Church; three coastal squares in Huludao, namely the Square of Longwan Seaside, the Square of Xingcheng Seaside and the Square of Dongdaihe Seaside; three inland squares in Zagreb, namely Cvjetni Square, J. Jelacica Square and Bundek Park; one coastal square in Biograd na moru and the Riva seaside location in Zadar. Those are all well-known sites and conveniently located. They have different spatial shapes and are typical multi-functional urban open public spaces, including activities such as tourism, relaxation, recreation, resident, culture, commerce, and sport. The squares are all conveniently located and have abundant sound sources, such as natural sounds, human sounds, electronic sounds and mechanical sounds.

Table 1.
Basic information about the case study site.
2.2. Questionnaire Survey
The comparative study was conducted through an on-site questionnaire survey during the summer period, both in China and Croatia, with the same structure and context, in Chinese in China and in Croatian (for domestic people) or English (for tourists) in Croatia. The respondents were asked about their gender, age, education level, living place (local or non-local), visit frequency and visit purpose, as shown in Table 2. A database was established with demographic/social information, including gender (male and female); age (groups 18–24, 25–34, 35–44, 45–54 and 55–64); education level (primary, middle, undergraduate and postgraduate); living place (local and non-local); visit frequency (first time, rarely, sometimes, often and very often) and visit purpose (travel, leisure, passing by, working and other).
Table 2.
Demographic and social indicators in the questionnaire, with their categorizations and scales.
To examine the relationship between overall satisfaction and environmental indicators satisfaction, the evaluations of sound and other parameters were investigated, including temperature, light, wind, air, health, odor, visual, urban planning, traffic and people. Linear scales were generally employed in the questionnaire. A five-point scale was used for sound satisfaction, from −2 (very dissatisfied), to 2 (very satisfied). A nine-point scale was employed for environmental satisfaction, from −4 (very dissatisfied), to 4 (very satisfied), which enabled obtaining much more detailed responses. Respondents were asked to evaluate sound environment and other environmental indicators, as mentioned above. In the questionnaire, subjective descriptions were given together with the linear scale numbers.
Additionally, the differences of tranquility importance and soundscape descriptors between China and Croatia in urban public open spaces were also examined. A five-point linear scale has been used for tranquility importance, namely from −2 (not very important), to 2 (very important). Four pairs of soundscape indices have been selected as soundscape factors of relaxation and communication [1], namely unpleasant–pleasant, agitating–calming, boring–interesting and uneventful–eventful, and a nine-point linear scale has been employed from −4 to 4.
To examine the relationship and differences between perceived sound and satisfaction evaluation, the respondents were also asked to describe the noticed sounds they heard in public open spaces in China and Croatia during the interview period. The sound sources were listed depending on each of the case study sites, including natural sounds (water, wind and animals), human sounds (talking, walking, selling and children), electronic sounds (broadcast, music and phone), and mechanical sounds (traffic, horn sound and mechanical source). A five-point linear scale has been used, namely: 1, do not hear at all; 2, a little; 3, moderately; 4, a lot and 5, dominates completely.
During the field questionnaire survey, there were a total of 706 respondents. All respondents were selected randomly at the case study sites. The percentage of male was 53.9% and female was 46.1% in China, compared to 47.8% of male and 52.2% female respondents in Croatia. The age of all respondents was distributed from 18 to 64 years. People aged 18–34 years were the main respondent group in China, around 63.7%, whereas the main respondent group in Croatia was aged 18–44 years, around 84.4%. In this research, there were less than 30 people older than 64 years of age in both countries that participated in the questionnaire. Therefore, the results from this age group have been excluded from this paper. The visit purposes were mainly leisure, passing by and traveling, both in China and Croatia.
2.3. Data Analysis
The software of Statistical Product and Service Solutions (SPSS) 18.0 was used to calculate statistical parameters based on the collected data of questionnaire surveys in two countries. The main statistical methods used in this study include Spearman’s rho correlation analysis for detecting the relationship among soundscape evaluation, environmental indicators, demographic and social factors, as well as sound sources. Furthermore, principal components analysis (PCA) was used for soundscape perception of indicators and overall environment evaluations of various environmental indicators.
3. Results
3.1. General Comparisons of Sound and Overall Environment Satisfaction Evaluation
Sound satisfaction and overall environmental satisfaction of coastal and inland spaces in China and Croatia are shown in Figure 1 and Figure 2. Figure 1 shows that 39.0% of respondents evaluated the sound environment in China as 0 (neither unsatisfied nor satisfied), being the most frequent answer. The average score is 0.21 of the scale from −2 to 2. Meanwhile, 54.9% of respondents evaluated the sound environment in Croatia as 1 (satisfied), as the most frequent answer. The average score is 0.61 on the scale from −2 to 2. In Figure 2, it can be seen that 21.3% respondents rated the overall environmental satisfaction in China as 0 (neither unsatisfied nor satisfied), as the most frequent answer. The average score is 1.16 on the scale from −4 to 4. Meanwhile, 35.2% of respondents evaluated overall environmental satisfaction in Croatia as 3 (very satisfied), being the most frequent answer. The average score is 2.53 on the scale from −4 to 4 in Croatia. It can be concluded that the satisfaction evaluation of sound and overall environment in Croatian places are better than those in China. Further analysis shows that there are significant evaluation differences on sound (p < 0.01) and overall environment (p < 0.01) between China and Croatia. The most probable reasons for that are the effects of environmental indicators, demographic/social factors and sound sources, as the following analysis shows.
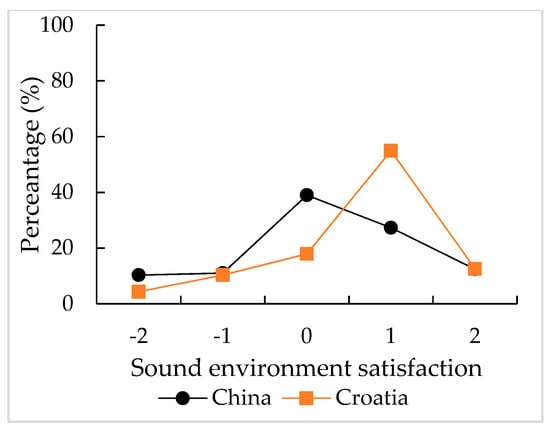
Figure 1.
Sound satisfaction of public open spaces in China and Croatia.
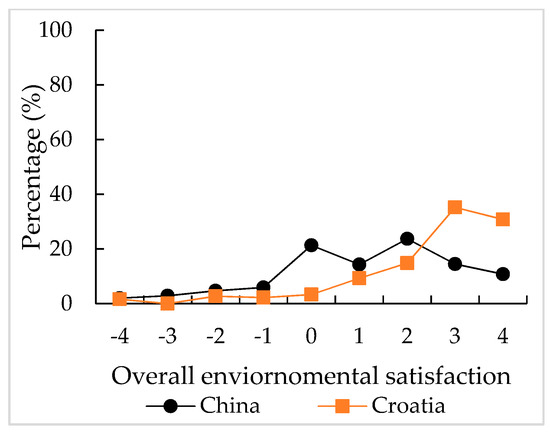
Figure 2.
Environmental satisfaction of public open spaces in China and Croatia.
Varimax-rotated component loadings of four soundscape descriptors divided between China and Croatia are presented in Figure 3. For China, Factor 1 (49.4%) is mainly associated with agitating–calming (marked as “A–C” in Figure 3), boring–interesting (B–I), and uneventful–eventful (U–E). Factor 2 (26.1%) is associated with unpleasant–pleasant (U–P). This finding is similar to a previous study [48] in Korean urban parks. By contrast, for Croatia, Factor 1 (35.3%) is mainly associated with unpleasant–pleasant and agitating–calming. Factor 2 (32.8%) is associated with uneventful–eventful and boring–interesting. The factors are mainly in correspondence with the findings in a previous study [49] for European outdoor soundscape, in which study, three components of pleasantness, eventfulness, and familiarity were found. It is interesting to note that the factors are the same, however, the order is different between those two countries. The findings illustrate that semantic nuances in describing soundscape might be different between different countries because of cultural background. They are largely organized in the two varimax-rotated components of eventfulness (Factor 1) and pleasantness (Factor 2) for Chinese outdoor soundscape, and pleasantness (Factor 1) and eventfulness (Factor 2) for Croatian outdoor soundscape, respectively. From these results it can be concluded that Chinese people will like eventful sound environments more than Croatian people.
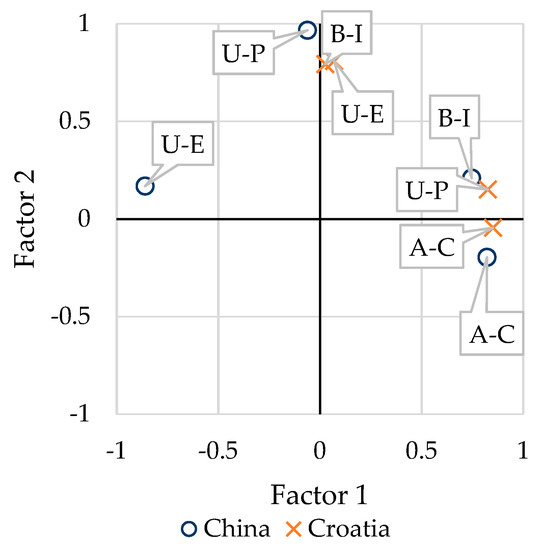
Figure 3.
Component loading plot of soundscape descriptors for China and Croatia.
Relationships among subjective satisfaction, tranquility importance and soundscape descriptors are shown in Table 3. It can be seen that sound satisfaction is positively correlated with environmental satisfaction both in China (p < 0.01) and in Croatia (p < 0.01). The importance of tranquility in public open spaces is negatively correlated with sound environment evaluation in China (p < 0.05) and in Croatia (p < 0.01), which means that the higher the requirement for environmental tranquility, the worse the evaluation of sound environmental satisfaction. Meanwhile, the importance of tranquility is negatively correlated with overall environmental evaluation in Croatia (p < 0.05), but not in China (p > 0.05). It is interesting to note that people need tranquility, however, the correlation coefficient between the tranquility requirement and sound environment satisfaction is much lower in China than in Croatia. This is mainly because people have different priority criteria for environmental satisfaction. The physical environment is the most important factor for satisfaction evaluation in Croatian inland and coastal places, which is different for Chinese places, as can be seen in the analysis of environmental indicators in Section 3.2.
Table 3.
Average score and Spearman’s rho correlations between subjective satisfaction, tranquility importance and soundscape factors.
The correlation results between subjective satisfaction and each soundscape factor in Chinese and Croatian public open places are shown in Table 3. Pleasantness (Factor 2) and eventfulness (Factor 1) for Chinese soundscape in public open spaces are positively related to sound satisfaction (p < 0.01) and environmental satisfaction (p < 0.01). Pleasantness (Factor 1) for Croatian outdoor soundscapes is positively related to sound (p < 0.01) and environmental satisfaction (p < 0.01), however, there is no significant correlation between eventfulness (Factor 2) and sound or environmental satisfaction (p > 0.05). Meanwhile, pleasantness (Factor 1) for Croatian soundscape in public open spaces is negatively related to tranquility importance (p < 0.01). This is mainly because sound sources might be constituted by water, music and horn sound sources in China, which is different from Croatia, as can be seen in the analysis of sound sources in Section 3.4.
3.2. Satisfaction of Environmental Indicators
As mentioned above, sound satisfaction is related to environmental satisfaction, therefore, evaluation of environmental satisfaction was analyzed. In this study, questions were asked about satisfaction of each of the following environmental indicators: sound, light, temperature, humidity, air, wind, water, color, health, urban planning, odor, traffic and people in both countries. The results are shown in Figure 4. The evaluation ranking of environmental satisfaction differs for each country. Figure 4 shows that wind (average score 0.69) and color (1.13) are the highest indicators by score, and health (average score 0.05) and humidity (0.41) are the lowest scores in China and Croatia respectively. The standard deviations are relatively low compared to the mean value. Satisfaction evaluation of environmental indicators in China is generally lower than in Croatia. The indicator of sound satisfaction is ranked as the tenth and the ninth among the totally 13 indicators in China and Croatia respectively.
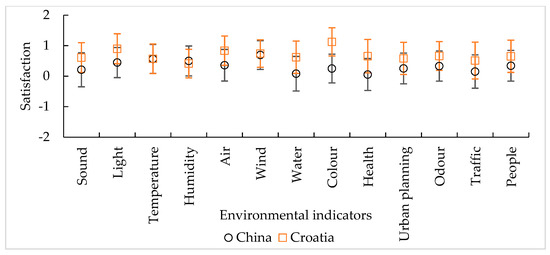
Figure 4.
Average evaluation score of each environmental indicator in China and Croatia.
By using the independent samples test, it can be seen that there are generally significant differences (p < 0.01) between satisfaction evaluations in China and Croatia, except temperature, humidity and wind (p > 0.05). In general, the physical environments are different in China and Croatia, however, in summer, respondents’ satisfaction with thermal comfort is not very different. Correlation between satisfaction of each environmental indicator and overall satisfaction is also studied. It can be noted that indicators are positively correlated to overall environmental satisfaction (p < 0.01) as well as evaluation of sound satisfaction (p < 0.01) both in China and Croatia. This mainly indicates the complexity of satisfaction evaluation in urban open public spaces. Environmental indicators, such as physical, urban and natural conditions, also influence satisfaction evaluation.
Factor analysis was used to analyze the relationship between overall environmental satisfaction evaluation and subjective evaluation of various environmental indicators in China and Croatia respectively. Varimax-rotated principal component analysis was employed to extract the orthogonal factors from 13 environmental indicators. With the criterion factor of eigenvalue >1, factors are determined as shown in Table 4.
Table 4.
Factor analysis of environmental indicators.
For China, Factor 1 (21.0%) is mainly associated with natural conditions, including water, air, color and health. Factor 2 (20.6%) is generally associated with urban conditions, including traffic, people, urban planning, odor and sound. Factor 3 (20.4%) is generally associated with physical environment, including humidity, temperature, light and wind. Three factors cover 62.0% of the total variance, which indicate the complexity in evaluating environmental satisfaction. For Croatia, Factor 1 (21.3%) is mainly associated with natural conditions, including air, health, water, color and wind. Factor 2 (20.2%) is generally associated with physical environment, including temperature, humidity, light and sound. Factor 3 (14.5%) is generally associated with urban conditions, including traffic, people and odor. Factor 4 (11.2%) is associated with urban planning. Four factors cover 67.2% of the total variance.
It is interesting to note that the results of Factor 1 in China and Croatia are both generally associated with natural conditions of overall satisfaction evaluation. However, Factor 2 in Chinese public open spaces is mainly urban condition, which is generally similar to Factor 3 in Croatian public spaces. Meanwhile, Factor 3 in Chinese spaces is mainly physical environment, which is generally similar to Factor 2 in Croatian public spaces. Natural condition, physical environment and urban condition cover together 60% of the total variance of overall environmental satisfaction, although there are some differences in the order of the factors.
To examine the difference between inland and coastal public spaces in China and Croatia, factor analysis was carried out based on four types of data separately, as shown in Table 5. For Chinese inland spaces, three factors cover 64.1% of the total variance, where factor 1 relates to urban and natural condition, factor 2 to physical environment, and factor 3 to thermal environment. For Chinese coastal spaces, three factors cover 62.4% of the total variance, where factor 1 relates to urban condition, factor 2 to physical environment, and factor 3 to natural condition. As mentioned above, the factors are generally similar to those in Table 4 for Chinese spaces, although the orders of the factors are different.
Table 5.
Factor analysis of environmental indicators for inland and coastal places in China and Croatia, respectively.
In Croatia, the first three and four factors cover 61.3% and 69.3% of the total variance, respectively, in inland and coastal spaces, where factor 1 in both cases relates to physical environment and other factors associated with natural and urban conditions. As mentioned above, the orders of the factors are different, however, the factors are generally similar to those in Table 4 for Croatian spaces.
It must be noted that physical environment is the most important factor for satisfaction evaluation in Croatian inland and coastal places, which is different from Chinese places. It can be concluded that tranquility importance has a correlation with environmental satisfaction in Croatian places, as analyzed in Section 3.1. Moreover, it seems that Factor 1 of Croatian places, which includes temperature and light, is in correspondence with the finding by Yang for European places [34]. In Yang’s research, the relationship between the overall physical comfort evaluation and the subjective evaluation in 14 urban public open spaces of five European countries was examined. It was found that Factor 1, including temperature, sunshine, luminance and so on, was the most important factor.
3.3. Effect of Demographic and Social Factors
Demographic and social factors of users may play an important role in environmental evaluation, especially in soundscape evaluation [12]. The result of sound satisfaction for Chinese and Croatian respondents in terms of gender, age, living place, education, visit frequency and visit purpose is shown respectively in Figure 5. As for gender, female respondents have a little higher evaluation score than male in both countries, with an average score for sound satisfaction 0.25 and 0.64 for female, and 0.17 and 0.56 for male respondents in China and Croatia respectively. As for age, respondents of 55–64 years old in Croatia rated their sound satisfaction (average score of 1.17) higher than other age groups (excluding age group of older than 64). This result is also consistent with Yang [34]. Contrary to Croatia, respondents 55–64 years old in China evaluated their sound satisfaction (0) lower than other age groups (excluding age group of older than 64). As for education, Chinese respondents with secondary education and above have similar sound satisfaction (0.14), which is lower than the group with primary education (0.91). In Croatia, respondents with postgraduate education have the slightly lowest evaluation of sound satisfaction among groups of education (0.48). As for living places, non-local residents has a little higher evaluation score (0.39 and 0.66), than that of local people (0.09 and 0.58) for local people in China and Croatia respectively. As for visit frequency, for Chinese places, people who visit public spaces very often have the lowest evaluation of sound satisfaction (−0.22); meanwhile, people who visit public spaces for first time have the highest score (0.63). For Croatian places, respondents who visit spaces rarely have the lowest evaluation (0.36). As for visit purpose, in both countries, the score is the highest for the purpose of travelling among all the groups, with scores 0.53 and 0.79 in China and Croatia respectively. The lowest satisfaction evaluation was given by the group of passing by in China (−0.02), and the group of other purpose in Croatia (0.39). The reason could be that people did not feel involved in open public spaces.
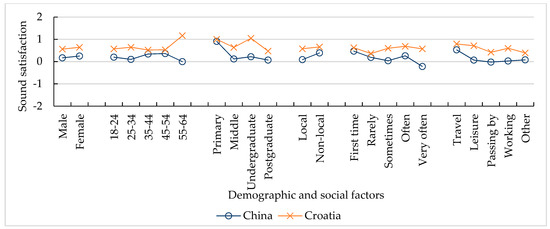
Figure 5.
The sound satisfaction in terms of demographic and social factors for gender, age, living place, education, visit frequency and purpose.
The relationship and significant differences of sound satisfaction, overall environment satisfaction, soundscape indicators, and importance of tranquility with demographic and social factors are examined respectively as shown in Table 6, and the related demographic/social factors are listed from high to low in terms of correlation coefficients. It is demonstrated that sound satisfaction is significantly related to visit purpose for China (p < 0.01) and Croatia (p < 0.05) respectively. Meanwhile, it is related to overall environmental satisfaction for both countries. This is mainly because visitors felt fresh and involved for the first time. Moreover, it seems that the result is similar to the finding by Meng and Kang [50]. In Meng’s research, the acoustic comfort of visitors is higher than that of citizens in Chinese urban open public spaces. Additionally, visit purpose is also correlated with overall environmental satisfaction in China (p < 0.05) and Croatia (p < 0.01) respectively. Moreover, the result is similar to the finding by Jiang [51]. In Jiang’s research, travelers’ participation in natural soundscapes could improve the evaluation of travel satisfaction, and people who were travelers were more satisfied with soundscapes than people that had other purposes of visiting these spaces.
Table 6.
Spearman’s rho correlations between subjective satisfaction, tranquility importance as well as soundscape factors, and demographic/social factors of gender, age, education, living place, visit frequency and visit purpose.
Visit frequency is negatively correlated with evaluation of sound satisfaction (p < 0.01) in China. It means that the more visits undertaken, the lower the evaluation of sound satisfaction in China. However, there is no significant correlation between visit frequency and sound satisfaction (p > 0.05) in Croatia. There are significant differences between local and non-local residents for sound satisfaction in China (p < 0.05) and for environmental satisfaction in Croatia (p < 0.05). Additionally, education is negatively correlated with environmental satisfaction (p < 0.01) both in China and Croatia. There is no significant difference in terms of sound satisfaction for gender (p > 0.05) either in China or Croatia, which is consistent with other research papers on subjective sound satisfaction [31,34].
In terms of pleasantness and eventfulness, for Chinese places, age group (excluding age group of older than 64) is positively correlated with pleasantness (p < 0.01), and visit frequency is negatively correlated with eventfulness (p < 0.01). For Croatian places, visit frequency is positively with pleasantness (p < 0.01), and age group (excluding age group of older than 64) is positively correlated with eventfulness (p < 0.01). There are significant differences between local and non-local residents for eventfulness in Croatia (p < 0.01), and for pleasantness both in China and Croatia (p < 0.01).
Table 6 also shows the correlations between importance of tranquility and respondents’ characteristics. It is interesting to note that visit frequency is negatively correlated with demand for tranquility both in China (p < 0.01) and Croatia (p < 0.05) respectively, and visit purpose is correlated with demand for tranquility both in China and Croatia (p < 0.05). Meanwhile, in China, the level of education is positively correlated to the need for tranquility (p < 0.01). In other words, the higher the level of education, the higher the need of tranquility in open public spaces. In Croatia, age is positively correlated to the need for tranquility (p < 0.05), and living place has significant difference in their demand for tranquility (p < 0.05). It is illustrated that visit frequency and purpose are the factors to influence the need for tranquility in both China and Croatia.
3.4. Effect of Sound Sources
The results of sound sources perception in China and Croatia are shown in Figure 6. This reveals that the constitution of sound sources is mainly different between China and Croatia. The sound sources of talking and children are the most perceived, with average score 3.67 in China and 3.75 in Croatia for talking, and 3.35 in China and 3.33 in Croatia for children. In China, sound sources of music (3.08) and water (3.03) are more likely to be perceived. Compared to China, walking (3.07) and music (2.61) are also perceived in Croatia, but less than in China. It can be noted that horn sounds (2.37) and mechanics (2.02) have been perceived in China, whereas they are proportionally less perceived in Croatia. Significant differences between sound sources perception in China and Croatia have been analyzed. The sound sources of water (p < 0.01), wind (p < 0.01), animals (p < 0.01), walking (p < 0.01), selling (p < 0.01), music (p < 0.01), horn sound (p < 0.01) and mechanical (p < 0.01) have significant differences between China and Croatia.
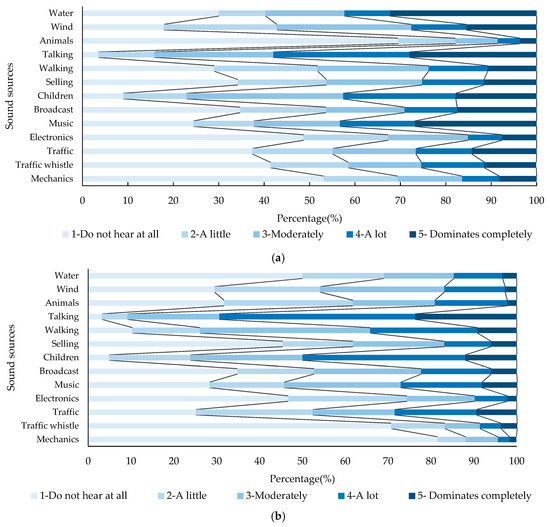
Figure 6.
Sounds perception of interviewees’ perceived sources (a) in China and (b) in Croatia.
By carrying out Spearman’s rho correlation test, the relationship between subjective satisfaction and each sound source are examined, as shown in Table 7. It can be seen that there are correlations between satisfaction and different sound sources both in China and Croatia. Based on the analysis of constitution of sound sources in Chinese public open spaces, the main sound sources, water (p < 0.01), wind (p < 0.01), and children (p < 0.05) have positive correlations with evaluation of sound satisfaction, however, music has a negative correlation with sound satisfaction (p < 0.01). In Croatian places, main sound sources, walking (p < 0.01) and talking (p < 0.05), have been negatively correlated with sound satisfaction, while traffic, with a score of 2.60, and broadcast, scored on average 2.41, have negative correlations as well (p < 0.05). It can be seen that natural sounds have positive correlation with sound satisfaction, especially in China. The result is consistent with other research [52], which indicated that natural sounds were related to positive perceptions of the urban soundscape. It is also illustrated that human sounds are the main factors to influence sound satisfaction in Croatia.
Table 7.
Spearman’s rho correlations of each sound source and subjective satisfaction, as well as perceived soundscape factors.
It was found that water (p < 0.01), wind (p < 0.01), talking (p < 0.01) and children (p < 0.05), which are the main sound sources in China, are positively related to environmental satisfaction. Similarly, water (p < 0.01) and wind (p < 0.05) are positively related to environmental satisfaction in Croatia. However, walking (p < 0.01) and talking (p < 0.01) are negatively related to environmental satisfaction in Croatia. This illustrates the fact that natural sounds have a positive correlation with overall environmental satisfaction in both China and Croatia. The responses from users show an effect of satisfaction on preference elements, and this finding corresponds with research [53], which indicated that the presence of elements of preference, not necessarily just sonic but also visual, help to change perception and thus the local soundscape. For Croatian spaces, human sounds and activities have negative correlations with environmental satisfaction. Additionally, it is interesting to note that music has a negative correlation with subjective satisfaction in Chinese places. The reason for that could be that the sound is too loud and the music is mainly related to square dancing, thus having a special character. It is different with a previous study of soundscape evaluation for square dance in the Chinese urban park [54], which indicated that square dance had no significant effect on soundscape evaluation. This is probably due to the fact that the visitors are present in open public spaces and urban parks with different purposes.
To investigate the relationships between perceived soundscape factors and sound sources, Pearson’s correlation coefficients between these variables are also presented in Table 7, and the related sound sources are listed from high to low in terms of correlation coefficients. Most sound sources are mainly associated with pleasantness both in China and Croatia. Perceived dominance of traffic (p < 0.01) and horn sounds (p < 0.01) have negative correlation coefficients with the pleasantness scores for Chinese places. Perceived dominance of talking (p < 0.01) and walking (p < 0.01), as human activities sounds, have negative correlation coefficients with the pleasantness scores for Croatian places. Other perceived human activities sound, such as children (p < 0.01) and selling (p < 0.05), and artificial sounds, such as music (p < 0.05) and traffic sound (p < 0.01), are also negatively related to the pleasantness scores for Croatian places. The result of correlation between traffic and pleasantness scores is similar to a previous study [47] done in France, Korea and Sweden. Differently, talking and walking are more related to pleasantness than traffic sound in Croatia.
Weak correlations were found between the perceived dominance of music (p < 0.05) and eventfulness scores in China. Human sound, such as talking (p < 0.01), is positively related to eventfulness scores, however, natural sounds, such as wind (p < 0.05) and water (p < 0.05), are negatively related to eventfulness scores in Croatia. It is found that different types of sound sources affect soundscape quality in China and Croatia. The results correspond to previous studies [55,56], which indicated that human activities sound and water were associated with eventfulness of soundscape.
The relationships between each of the social/demographical factors and sound perception factors were analyzed based on non-parametric test and Spearman’s rho correlation analysis. The results are shown in Table 8. They indicate that, as for gender, there are significant differences of perceived sound sources for wind (p < 0.05) and horn sounds (p < 0.05) in China, and natural sounds, such as water (p < 0.01) and wind (p < 0.05), in Croatia. It was reported that limited effects of gender on soundscape perception exist [37], however, it can be seen that females were more sensitive than males to some sound sources, especially for Croatian places in this research. As for age group (excluding age group of older than 64), in China, age is negatively correlated to perceived dominance, such as horn sound (p < 0.01) and traffic (p < 0.05). By contrast in Croatia, there is a negative correlation to sounds from human activities, such as walking (p < 0.01), talking (p < 0.01), and children (p < 0.01). As for education, in China, there is a negative correlation to perceived dominance sound from water (p < 0.01) and wind (p < 0.05), and positive correlation to traffic (p < 0.01) and horn sound (p < 0.01). Education shows no significant relationship with any sound source in Croatia, except animal sound (p < 0.05). As for living place, there are significant differences for natural sounds both in China and Croatia. This finding indicates that travelers would perceive positively more natural sounds than local people. Interestingly, local people are more sensitive than travelers to artificial sounds, such as music (p < 0.01), traffic (p < 0.01) and horn sounds (p < 0.05) in China, and to talking (p < 0.01) in Croatia. As for visit frequency, in China, it is positively related to three kinds of sound sources, such as walking (p < 0.05), traffic (p < 0.05), and artificial sounds, such as broadcasts (p < 0.05), music (p < 0.01), electronics (p < 0.05). In the same time, it is positively related to electronics (p < 0.05), mechanics (p < 0.05), and horn sounds (p < 0.05) in Croatia. The result is similar to a previous study [57], which indicated that in Chinese city park, visit frequency is positively related to five kinds of sounds, especially to live music. Visit purpose is negatively related to natural sounds, especially water sounds (p < 0.01) both in China and Croatia, which indicates that people who are travelers are much more sensitive to water. Music (p < 0.01), horn sounds (p < 0.01), walking (p < 0.01) and traffic (p < 0.05) sounds are much more noticed by people who have other activities in Chinese places. Sound from human activities, such as talking (p < 0.01) and walking (p < 0.05), are more likely to attract attention in Croatian places. The result is consistent with another research [58], which examined the relationship between people’s visit motivation and soundscape experiences in terms of the perceived occurrences in Germany.
Table 8.
Non-parametric test and Spearman’s rho correlation of perceived sound sources and demographic / social factors of gender, age, education, living place, visit frequency and visit purpose.
4. Discussion and Conclusions
Based on questionnaire surveys and statistical analysis of 11 urban open public spaces in China and Croatia, the comparisons of relationships between subjective satisfaction, as well as soundscape factors, demographic/social factors and perceived sound sources, related to the soundscape framework, have been shown. In terms of general comparisons, there are significant differences between China and Croatia. The satisfaction evaluation of sound and overall environment in Croatian places are better than those in China. It can be seen that sound satisfaction is positively related with overall satisfaction. Pleasantness and eventfulness are both soundscape factors, however, the order is different for those two countries. The semantic nuances in describing soundscape would indicate the cultural difference between different countries. The importance of tranquility in Croatia is negatively correlated with overall environmental evaluation, however, not in China.
In terms of environmental indicators, evaluation of environmental indicators in China is generally lower than that in Croatia. There are significant differences between satisfaction evaluations of environmental indicators, except for the thermal environment indicator. Sound satisfaction is positively related to overall satisfaction. In terms of subjective evaluation on overall environmental satisfaction, natural condition, urban condition and the physical environment are the main factors to evaluate satisfaction both in China and in Croatia, although the orders of the factors are different. It is interesting to note that the physical environment is the most important factor for satisfaction evaluation in Croatian inland and coastal places, which is different for Chinese places. This might explain why tranquility importance is associated with Croatian environmental satisfaction, not with Chinese. In other words, tranquility areas are more likely to be considered for construction in Croatia.
In terms of demographic and social factors, visit purpose is the dominant factor, which correlated with sound and overall environmental satisfaction both in China and Croatia. Visit frequency and living place are associated with sound satisfaction in China, not in Croatia. Education is negatively correlated with overall environment satisfaction both in China and Croatia. Visit frequency, age and living place are correlated with pleasantness and eventfulness of soundscape factors in China and Croatia. Visit frequency and purpose are common factors in the tranquility importance both in China and Croatia. It demonstrates that functions of urban open public space should be considered as an important context for soundscape design [55]. No significant difference was found between males and females both in China or Croatia on soundscape evaluations. Additionally, in China, the level of education is positively correlated to the need for tranquility, and in Croatia, age is positively correlated to it. In other words, the functions of open public spaces and people’s characteristics and activities should be considered for the acoustic environment and tranquility design in both countries, especially for the main purpose of traveling.
The perception of sound sources has mostly significant differences between China and Croatia. The natural sounds and children have positive correlation with evaluation of sound satisfaction in China; however, music has negative correlation mainly because of square dancing, which is a special activity in China. For Croatian spaces, human activities are mainly negative correlations with sound satisfaction. Natural sounds have positive correlation with overall environmental satisfaction in both China and Croatia. In particular, human sounds are positively correlated with overall environmental satisfaction, however, it is negative in Croatia. Most sound sources are mainly associated with pleasantness both in China and Croatia. Dominance of the sound of traffic is mainly negatively correlated with pleasantness in China and human sounds are mainly negatively correlated with pleasantness in Croatia. Additionally, demographical/social factors show significant influence on individual sound perception both in China and Croatia.
These findings reveal that there are significant differences in soundscapes between China and Croatia within the soundscape framework. In general, it can be concluded that soundscape evaluation by people in both countries is based on the context effects of environment indicators, cultural background and type of sound sources. Three particular findings are emphasized, which can be helpful to urban designers of open public spaces in both countries:
(1) Visit purpose is the dominant factor influencing sound and environmental satisfaction both in China and Croatia. Therefore, soundscape design for both sound and overall environment has to take into account the different functions of open public spaces, such as popularity and touristic attraction of places, communities, and parks, which are directly related to different visit purposes and visit frequencies.
(2) In Chinese open public spaces, the positive correlations between age of people and pleasantness is an important fact for creating an enjoyable atmosphere. Croatians pay more attention to the importance of quietness of the environment. Therefore, construction of tranquil spaces is very important and has to be taken into account when designing urban open public spaces, especially for older people, such as old-people communities.
(3) In terms of sound sources in China, the main factors associated with sound and environmental satisfaction are natural and children sounds which are considered positive and should be used appropriately when designing soundscapes, while music has to be controlled as it negatively relates to satisfaction. In Croatia, contrary to China, sounds from people activities are found to be the main factors that are negatively related to sound and environmental satisfaction and pleasantness, and must consequently be controlled.
Author Contributions
Conceptualization, J.K.; methodology, L.D., and J.K.; software, W.Z.; formal analysis, L.D., and W.Z.; investigation, L.D., W.Z., and K.J.; resources, J.K., and K.J.; writing—original draft preparation, L.D., and W.Z.; writing—review and editing, J.K., and K.J.; supervision, J.K.; project administration, J.K., and K.J.; funding acquisition, J.K., K.J. and W.Z. All authors have read and agreed to the published version of the manuscript.
Funding
This research was funded by Natural Science Foundation of China, grant number 51778169, Heilongjiang Province Postdoctoral Science Foundation in China, grant number LBH-Z17078, Heilongjiang Province Philosophy and Social Science Project, grant number 18SHC229, and Intergovernmental Science and Technology Cooperation Project, grant number 7-19.
Acknowledgments
We sincerely thank the anonymous reviewers for their helpful reviews.
Conflicts of Interest
The authors declare no conflict of interest.
References
- Kang, J.; Zhang, M. Semantic differential analysis of the soundscape in urban open public spaces. Build. Environ. 2010, 45, 150–157. [Google Scholar] [CrossRef]
- Frontczak, M.; Schiavon, S.; Goins, J.; Arens, E.; Zhang, H.; Wargocki, P. Quantitative relationships between occupant satisfaction and satisfaction aspects of indoor environmental quality and building design. Indoor Air 2012, 22, 119–131. [Google Scholar] [CrossRef] [PubMed]
- Gozalo, G.R.; Morillas, J.M.B.; González, D.M.; Moraga, P.A. Relationships among satisfaction, noise perception, and use of urban green spaces. Sci. Total Environ. 2018, 624, 438–450. [Google Scholar] [CrossRef] [PubMed]
- Jeon, J.Y.; Jo, H.I. Effects of audio-visual interactions on soundscape and landscape perception and their influence on satisfaction with the urban environment. Build. Environ. 2020, 169, 106544. [Google Scholar] [CrossRef]
- Nilsson, M.E.; Berglund, B. Soundscape quality in suburban green areas and city parks. Acta Acust. United Acust. 2006, 92, 903–911. [Google Scholar]
- Viollon, S.; Lavandier, C.; Drake, C. Influence of visual setting on sound ratings in an urban environment. Appl. Acoust. 2002, 63, 493–511. [Google Scholar] [CrossRef]
- Jeon, J.Y.; Lee, P.J.; Hong, J.Y. Effects of contexts on perception of urban soundscape. J. Acoust. Soc. Am. 2011, 129, 2570. [Google Scholar] [CrossRef]
- Liu, J.; Yang, L.; Xiong, Y.; Yang, Y. Effects of soundscape perception on visiting experience in a renovated historical block. Build. Environ. 2019, 165, 106375. [Google Scholar] [CrossRef]
- Aumond, P.; Can, A.; DeCoensel, B.; Botteldooren, D.; Ribeiro, C.; Lavandier, C. Modeling soundscape pleasantness using perceptual assessments and acoustic measurements along paths in urban context. Acta Acust. United Acust. 2017, 103, 430–443. [Google Scholar] [CrossRef]
- Schulte-Fortkamp, B.; Volz, R.; Jakob, A. Using the soundscape approach to develop a public space in Berlin-perception and evaluation. J. Acoust. Soc. Am. 2008, 123, 3808. [Google Scholar] [CrossRef]
- ISO 12913-1:2014. Acoustics Soundscape Part 1: Definition and Conceptual Framework; International Standardization Organization: Geneve, Switzerland, 2014. [Google Scholar]
- Kang, J. Urban Sound Environment; Taylor & Francis incorporating Spon: London, UK, 2006. [Google Scholar]
- Licitra, G.; Ascari, E.; Brambilla, G. Comparative analysis of methods to estimate urban noise exposure of inhabitants. Acta Acust. United Acust. 2012, 98, 659–666. [Google Scholar] [CrossRef]
- Sygna, K.; Aasvang, G.M.; Aamodt, G.; Oftedal, B.; Krog, N.H. Road traffic noise, sleep and mental health. Environ. Res. 2014, 131, 17–24. [Google Scholar] [CrossRef] [PubMed]
- Lercher, P.; Evans, G.W.; Meis, M. Ambient noise and cognitive processes among primary schoolchildren. Environ. Behav. 2003, 35, 725–735. [Google Scholar] [CrossRef]
- Chetoni, M.; Fredianelli, L.; Minichilli, F.; Cori, L.; Licitra, G.; Bianco, F. Correlation between perceived and measured noise, within the GIOCONDA project. In Proceedings of the 23rd International Congress on Sound and Vibration: From Ancient to Modern Acoustics (ICSV 2016), Athens, Greece, 10–14 July 2016. [Google Scholar]
- Vienneau, D.; Schindler, C.; Perez, L.; Probst-Hensch, N.; Röösli, M. The relationship between transportation noise exposure and ischemic heart disease: A meta-analysis. Environ. Res. 2015, 138, 372–380. [Google Scholar] [CrossRef]
- Roswall, N.; Raaschou-Nielsen, O.; Ketzel, M.; Gammelmark, A.; Overvad, K.; Olsen, A.; Sørensen, M. Long-term residential road traffic noise and NO2 exposure in relation to risk of incident myocardial infarction—A Danish cohort study. Environ. Res. 2017, 156, 80–86. [Google Scholar] [CrossRef]
- Licitra, G.; Fredianelli, L.; Petri, D.; Vigotti, M.A. Annoyance evaluation due to overall railway noise and vibration in Pisa urban areas. Sci. Total Environ. 2016, 568, 1315–1325. [Google Scholar] [CrossRef]
- Kephalopoulos, S.; Paviotti, M.; Anfosso-Lédée, F.; Maercke, D.V.; Shilton, S.; Jones, N. Advances in the development of common noise assessment methods in Europe: The CNOSSOS-EU framework for strategic environmental noise mapping. Sci. Total Environ. 2014, 482, 400–410. [Google Scholar] [CrossRef]
- Morel, J.; Marquis-Favre, C.; Gille, L.A. Noise annoyance assessment of various urban road vehicle pass-by noises in isolation and combined with industrial noise: A laboratory study. Appl. Acoust. 2016, 101, 47–57. [Google Scholar] [CrossRef]
- Bunn, F.; Zannin, P.H.T. Assessment of railway noise in an urban setting. Appl. Acoust. 2016, 104, 16–23. [Google Scholar] [CrossRef]
- Flores, R.; Gagliardi, P.; Asensio, C.; Licitra, G. A case study of the influence of urban morphology on aircraft noise. Acoust. Aust. 2017, 45, 389–401. [Google Scholar] [CrossRef]
- Fredianelli, L.; Gallo, P.; Licitra, G.; Carpita, S. Analytical assessment of wind turbine noise impact at receiver by means of residual noise determination without the wind farm shutdown. Noise Control Eng. J. 2017, 65, 417–433. [Google Scholar] [CrossRef]
- Leung, T.M.; Chau, C.K.; Tang, S.K.; Xu, J.M. Developing a multivariate model for predicting the noise annoyance responses due to combined water sound and road traffic noise exposure. Appl. Acoust. 2017, 127, 284–291. [Google Scholar] [CrossRef]
- Hong, J.Y.; Jeon, J.Y. Exploring spatial relationships among soundscape variables in urban areas: A spatial statistical modelling approach. Landsc. Urban Plan. 2017, 157, 352–364. [Google Scholar] [CrossRef]
- Hong, J.Y.; Jeon, J.Y. Relationship between spatiotemporal variability of soundscape and urban morphology in a multifunctional urban area: A case study in Seoul, Korea. Build. Environ. 2017, 126, 382–395. [Google Scholar] [CrossRef]
- Yang, M.; Kang, J. Psychoacoustical evaluation of natural and urban sounds in soundscapes. J. Acoust. Soc. Am. 2013, 134, 840–851. [Google Scholar] [CrossRef]
- Lee, P.J.; Jeon, J.Y. Evaluation of speech transmission in open public spaces affected by combined noises. J. Acoust. Soc. Am. 2011, 130, 219–227. [Google Scholar] [CrossRef]
- Park, S.H.; Lee, P.J.; Jeong, J.H. Effects of noise sensitivity on psychophysiological responses to building noise. Build. Environ. 2018, 136, 302–311. [Google Scholar] [CrossRef]
- Kang, J.; Aletta, F.; Gjestland, T.T.; Brown, L.A.; Botteldooren, D.; Schulte-Fortkamp, B.; Lercher, P.; Kamp, I.; Genuit, K.; Fiebig, A.; et al. Ten questions on the soundscapes of the built environment. Build. Environ. 2016, 108, 284–294. [Google Scholar] [CrossRef]
- Ren, X.; Kang, J.; Zhu, P.; Wang, S. Soundscape expectations of rural tourism: A comparison between Chinese and English potential tourists. J. Acoust. Soc. Am. 2018, 143, 373–377. [Google Scholar] [CrossRef]
- Lam, K.C.; Brown, A.L.; Marafa, L.; Chau, K.C. Human preference for countryside soundscapes. Acta Acust. United Acust. 2010, 96, 463–471. [Google Scholar] [CrossRef]
- Yang, W.; Kang, J. Soundscape and sound preferences in urban squares: A case study in Sheffield. J. Urban Des. 2005, 10, 61–80. [Google Scholar] [CrossRef]
- Yu, L.; Kang, J. Effects of social, demographical and behavioral factors on the sound level evaluation in urban open spaces. J. Acoust. Soc. Am. 2008, 123, 772–783. [Google Scholar] [CrossRef] [PubMed]
- Miedema, H.M.E.; Vos, H. Demographic and attitudinal factors that modify annoyance from transportation noise. J. Acoust. Soc. Am. 1999, 105, 3336–3344. [Google Scholar] [CrossRef]
- Liu, J.; Kang, J.; Luo, T.; Behm, H. Landscape effects on soundscape experience in city parks. Sci. Total Environ. 2013, 454, 474–481. [Google Scholar] [CrossRef] [PubMed]
- Jeon, J.Y.; Lee, P.J.; Hong, J.Y. Non-auditory factors affecting urban soundscape evaluation. J. Acoust. Soc. Am. 2011, 130, 3761–3770. [Google Scholar] [CrossRef]
- Pheasant, R.J.; Fisher, M.N.; Watts, G.R.; Whitaker, D.J.; Horoshenkov, K.V. The importance of auditory-visual interaction in the construction of ‘tranquil space’. J. Environ. Psychol. 2010, 30, 501–509. [Google Scholar] [CrossRef]
- Galbrun, L.; Ali, T.T. Acoustical and perceptual assessment of water sounds and their use over road traffic noise. J. Acoust. Soc. Am. 2013, 133, 227–237. [Google Scholar] [CrossRef]
- Galbrun, L.; Calarco, F.M. Audio-visual interaction and perceptual assessment of water features used over road traffic noise. J. Acoust. Soc. Am. 2014, 136, 2609–2620. [Google Scholar] [CrossRef]
- Kuwano, S.; Namba, S.; Florentine, M.; Zheng, D.; Fastl, H.; Schick, A. A cross-cultural study of the factors of sound quality of environmental noise. In Proceedings of the Forum Acusticum 1999, Berlin, Germany, 14–20 March 1999. [Google Scholar]
- Kuwano, S.; Namba, S.; Hashimoto, T.; Berglund, B.; Zheng, D.; Schick, A.; Hoege, H.; Florentine, M. Emotional expression of noise: A cross-cultural study. J. Sound Vib. 1991, 151, 421–428. [Google Scholar] [CrossRef]
- Hansen, H.; Weber, R. Semantic evaluations of noise with tonal components in Japan, France, and Germany: A cross-cultural comparison. J. Acoust. Soc. Am. 2009, 125, 850–862. [Google Scholar] [CrossRef]
- Mohamed, M.A.E.; Dokmeci, Y.P.N. Indoor soundscape perception in residential spaces: A cross-cultural analysis in Ankara, Turkey. Build. Acoust. 2019. [Google Scholar] [CrossRef]
- Phan, H.A.T.; Nishimura, T.; Phan, H.Y.T.; Yano, T.; Sato, T.; Hashimoto, Y. Annoyance from road traffic noise with horn sounds: A cross-cultural experiment between Vietnamese and Japanese. In Proceedings of the 9th International Congress on Noise as a Public Health Problem (ICBEN 2008), Foxwoods, CT, USA, 21 July 2008. [Google Scholar]
- Jeon, J.Y.; Hong, J.Y.; Lavandier, C.; Lafon, J.; Axelsson, Ö.; Hurtig, M. A cross-national comparison in assessment of urban park soundscapes in France, Korea, and Sweden through laboratory experiments. Appl. Acoust. 2018, 133, 107–117. [Google Scholar] [CrossRef]
- Jeon, J.Y.; Hong, J.Y. Classification of urban park soundscapes through perceptions of the acoustical environments. Landsc. Urban Plan. 2015, 141, 100–111. [Google Scholar] [CrossRef]
- Axelsson, Ö.; Nilsson, M.E.; Berglund, B. A principal components model of soundscape perception. J. Acoust. Soc. Am. 2010, 128, 2836–2846. [Google Scholar] [CrossRef]
- Meng, Q.; Kang, J. Effect of sound-related activities on human behaviours and acoustic comfort in urban open spaces. Sci. Total Environ. 2016, 573, 481–493. [Google Scholar] [CrossRef]
- Jiang, J.; Zhang, J.; Zheng, C.; Zhang, H.; Zhang, J. Natural soundscapes in nature-based tourism: Leisure participation and perceived constraints. Curr. Issues Tour. 2018. [Google Scholar] [CrossRef]
- Jeon, J.Y.; Lee, P.J.; You, J.; Kang, J. Acoustical characteristics of water sounds for soundscape enhancement in urban open spaces. J. Acoust. Soc. Am. 2012, 131, 2101–2109. [Google Scholar] [CrossRef]
- Soares, A.C.L.; Coelho, J.L.B. Urban park soundscape in distinct sociocultural and geographical contexts. Noise Mapping 2016, 3, 232–246. [Google Scholar] [CrossRef]
- Ba, M.; Zhang, X.; Kang, J. On the influence of square dance in the park on the evaluation of soundscape. Urban Archit. 2017, 7, 9–12. (In Chinese) [Google Scholar]
- Hong, J.Y.; Jeon, J.Y. Influence of urban contexts on soundscape perceptions: A structural equation modeling approach. Landsc. Urban Plan. 2015, 141, 78–87. [Google Scholar] [CrossRef]
- Aletta, F.; Kang, J.; Axelsson, Ö. Soundscape descriptors and a conceptual framework for developing predictive soundscape models. Landsc. Urban Plan. 2016, 149, 65–74. [Google Scholar] [CrossRef]
- Liu, J.; Xiong, Y.; Wang, Y.; Luo, T. Soundscape effects on visiting experience in city park: A case study in Fuzhou, China. Urban For. Urban Green. 2018, 31, 38–47. [Google Scholar] [CrossRef]
- Liu, J.; Wang, Y.; Zimmer, C.; Kang, J.; Yu, T. Factors associated with soundscape experiences in urban green spaces: A case study in Rostock, Germany. Urban For. Urban Green. 2019, 37, 135–146. [Google Scholar] [CrossRef]


© 2020 by the authors. Licensee MDPI, Basel, Switzerland. This article is an open access article distributed under the terms and conditions of the Creative Commons Attribution (CC BY) license (http://creativecommons.org/licenses/by/4.0/).