You are currently viewing a new version of our website. To view the old version click .
Applied Sciences
  • Article
  • Open Access

8 February 2020

Real-Time, Content-Based Communication Load Reduction in the Internet of Multimedia Things

,
,
,
,
and
1
Department of Computer Science, Lahore College for Women University, Jail Road, Lahore 54000, Pakistan
2
Software Research Institute, Athlone Institute of Technology, N37FW63 Athlone, Ireland
3
Department of Computer Science and Information Technology, The Islamia University of Bahawalpur, Bahawalpur 63100, Pakistan
4
Department of Electrical Engineering, Lahore College for Women University, Jail Road, Lahore 54000, Pakistan
This article belongs to the Special Issue Recent Developments on Multimedia Computing and Networking

Abstract

There is an increasing number of devices available for the Internet of Multimedia Things (IoMT). The demands these ever-more complex devices make are also increasing in terms of energy efficiency, reliability, quality-of-service guarantees, higher data transfer rates, and general security. The IoMT itself faces challenges when processing and storing massive amounts of data, transmitting it over low bandwidths, bringing constrained resources to bear and keeping power consumption under check. This paper’s research focuses on an efficient video compression technique to reduce that communication load, potentially generated by diverse camera sensors, and also improve bit-rates, while ensuring accuracy of representation and completeness of video data. The proposed method applies a video content-based solution, which, depending on the motion present between consecutive frames, decides on whether to send only motion information or no frame information at all. The method is efficient in terms of limiting the data transmitted, potentially conserving device energy, and reducing latencies by means of negotiable processing overheads. Data are also encrypted in the interests of confidentiality. Video quality measurements, along with a good number of Quality-of-Service measurements demonstrated the value of the load reduction, as is also apparent from a comparison with other related methods.

1. Introduction

The Internet of Things (IoT) is described as a network of smart objects collecting, processing and sharing data, with sensors and actuators enhancing object functionality. The number of such connected devices, as a result of rapid expansion, is estimated to reach 31 billion by 2020 [1]. For a long time, the IoT infrastructure has been linked to event-based systems. These systems [2] identify events, which cause streaming of structured or scalar data, for example the streaming of the ambient temperature of an object or its energy consumption. On the other hand, camera sensors detect multimedia events and, hence, communicate unstructured data. While event-based systems have hitherto detected mainly structured events, trends in the IoT domain are shifting from structured events to multimedia events. The Internet of Multimedia Things (IoMT) is an aspect of the IoT associated with relaying images, videos, audio, speech, and other multimedia data. Camera sensors coupled with connected devices, make those devices capable of capturing images and recording videos. Consequently, systems with diverse sensors are able to detect events based on image, video, or audio data. It is estimated [3] that the number of installed cameras will globally exceed 13 billion by 2030. These cameras can exist as either smart phone cameras or security cameras in homes, vehicles, cities, highways, and public places. However, IoMT systems differ from simple event-based systems in terms of: the heterogeneity and complexity of the sensed and communicated data; the high energy consumption of the communication devices and their sensors; their higher bandwidth requirements; the possible use of non-standardized protocols; the possible absence currently of suitable middleware; and the complex processing requirements of the multimedia data analytics at the data sink. Current practices and standards used in the IoT, such as the means of video encoding, the form of the protocol stack, and the cloud services availed of, are not well-suited to the real-time nature of the IoMT. Thus, in an IoMT [4], data is collected, stored, processed and distributed in real-time and, as a result, more resources are required.
Another development should be mentioned: There is an obvious increase in mobile multimedia devices and this growth brings with it large quantities of data, which development has been named Multimedia Big Data (MMBD). MMBD in the IoMT comes with challenges of real-time processing in terms of computation, communication and securing or protecting large amounts of data passing through heterogeneous IoT applications, while ensuring Quality-of-Service (QoS) and Quality-of-Experience (QoE) [5,6]. On top of that, real-time streaming and relaying of videos with high bandwidth requirements, video encoding and connectivity also pose potential issues. Cumulatively, the paradigm shift represented by IoMT gives rise to [7] issues of scalability, flexibility, compatibility, security, and mobility. Complexities in the IoMT are a by-product of the massive amount of data and the strain caused by sensing, processing and distributing such large quantities of data.
Camera sensors in IoMT tend to transmit videos, a complex type of data requiring storage and subsequent processing. A need then arises for image processing to identify effectively objects within the videos. As the number of camera sensors increases, the amount of video data distributed across multiple applications has escalated. Managing large amounts of video data, because of its complex nature, is a research challenge in general. Videos hold information indicating significant events, as far as applications, such as home security, traffic or military surveillance, are concerned. As a result, not only the protection and privacy of data is important but, for such content-sensitive applications, requires data integrity and data completeness, without loss of any meaningful information.
The aim of this study is to reduce the communication load in an IoMT through efficient video compression. This study proposes a method of content-based communication load reduction in an IoMT, based on detection of Regions-of-Motion (ROM) through a consecutive frame differencing mechanism. Notice that frame differencing is also known as background subtraction [8,9]. However, herein the intention is to apply this established method to the emerging field of sensor networks. The research focuses on the implementation of an efficient video compression technique, which reduces the communication load of camera sensors in an IoMT. The proposed mechanism is of a modular nature comprising of: Data acquisition; ROM identification, with trimming of changed video frames; load reduction, featuring image compression; and confidential transmission through video encryption. The contributions are:
  • Enabling sensors to transmit only changing motion information, established through inter- frame differing.
  • Consequently, reducing communication overhead by limiting the data to be sent.
  • Accommodation of limited resources in the IoMT by managing excessive data.
  • Efficient data compression based on the contents of individual frames.
  • Bitrate reduction through compression, while preserving the video content and its quality of representation.
  • Configuration of IoT testbed with two Intel NUC Core i5-6260U mini computers for experiments and performance evaluation of proposed load reduction scheme.
  • Analysis of the proposed method in comparison with five other related methods for load reduction. The relative merits and demerits of these methods are indicated.
This paper is arranged as follows: Section 2 gives the context to this paper, reviewing the research literature in this field and recording challenges in IoT including overloaded networks, and the need for resource management, video streaming, and IoT security. The Section also reviews the video processing background, including video compression and motion detection. Section 3 describes the methodology pursued in the paper, while experimental results are presented in Section 4, along with a discussion of their significance, including in relation to other recent similar systems. Finally, Section 5 draws some conclusions as a result of this study.

3. METHODOLOGY

In this Section, the methodology employed is described in a modular fashion. These modules include data acquisition, ROM identification, load reduction, and secure transmission.

3.1. Outline of the Approach

This study advocates a method of video compression in which each consecutive frame of a video is preprocessed, as the basis of making a decision regarding whether the video information at that time shall, after compression, be sent or not. That is to say, it decides whether to transmit the compressed video data from an originating IoMT device across the IoMT network. A difference frame is used to establish whether any meaningful information is present or not at any one moment in time. Based on that information, reduction of data can be achieved through motion detection. By reducing the video content, the method not only avoids storage problems, given the limited memory sizes of typical IoMT devices, but it also enables efficient processing and secure streaming of the compressed video data, preserving the video quality, while not omitting any significant information contained in the acquired video frames.

3.2. System Composition

The system that has been designed by the authors is divided into four major components comprising of: (1) Data Acquisition; (2) ROM Identification; (3) Load Reduction; and (4) Secure Transmission. The system, as shown in Figure 1, was implemented using the OpenCV library, written in the Python programming language, to facilitate a variety of functions for image and video processing. The proposed method uses an implementation of the JPEG codec in OpenCV. In data acquisition, video frames are captured as YUV video of Phase Alternating Line (PAL) TV/video system [57] before conversion back to the more convenient, as far as the current video processing of the authors is concerned, Red/Green/Blue (RGB) color space. Thus, frame difference images are formed in that RGB space. The difference frame calculated at any one instance is reduced to specified intensity values. A ROM is separated from an image depending on the amount of motion change within each identified region. The ROM is then compressed and encrypted before it is sent across the IoMT network. A more detailed overview of each module is now given.
Figure 1. A modular representation of the system.
It is important to notice that for some security applications, there may not be a need to convert from YUV to RGB, as color images may not be required. In fact, if difference imaging was the only application envisaged then only the Y channel could be sufficient and will result in saving of resources. However, if further video analysis is to be performed then conversion from YUV to RGB color space may well be required, such as for gait recognition at airports [58] or facial recognition using the Kinect sensor [8]. Therefore, this paper considers a system with the more general case, which readers can reduce according to their individual application requirements.

3.2.1. Data Acquisition

Acquisition of video data and conversion of color spaces, prior to actual processing, is carried out in this module. For simplicity, raw YUV videos (Y is the luminance value and UV are the two color component) are opened prior to conversion to the RGB format, which eases video processing. The trial video sequences, used in experiments, are obtained from open source repositories, selected on the basis of their different motion and color characteristics. Each of the video sequences used has differing content type, extent of motion, and frame sizes. These sequences consisted of five open-source videos named throughout this paper as Walk, Ground, Exercise, Duval Street and Football. Ground and Football were obtained from the VIRAT video dataset (release version 2.0) [59] and Xiph.org [60]. At a particular instance, a new frame is read from the stored video source. This new frame and a previously acquired frame are converted to RGB color space.

3.2.2. ROM Identification

This module comprises of the extraction of a ROM and is further divided into two main parts that is, Selector and Trimmer.
Selector: A difference frame is computed using new and reference frames. The difference frame is then checked for the amount of change and depending on this amount, a decision is made as to whether a ROM needs to be extracted or not. If no significant change is identified, the system state switches to load reduction mode directly. On the other hand, if prominent change is detected in a new frame with respect to (w.r.t.) the reference frame, then the difference frame is forwarded to the Trimmer.
Trimmer: The second step in ROM identification involves restriction of data to only the required portion. Intensities considered in the reference and current frame, when differencing the two frames, resulting, are limited to those greater than twenty (from a range 0 to 255) because lower intensity differences are visually indistinguishable in the grayscale. A threshold of 20 was set after observing the results from varying from threshold from 10 to 80, so as to check that there is not excessive loss of information if a sub-optimal threshold value is set. Thus only region(s) containing non-zero pixel values greater than the threshold value are selected from the difference frame. A region where those pixel values occur is mapped onto the matching region in the current frame, after which the ROM that it forms is cropped from the current frame. In Figure 2, a difference frame, F D in Figure 2a, is shown after differencing between the corresponding reference and current frame, F C . From Figure 2a, it is apparent that only the values 36, 45, and 40 are above the threshold. The region corresponding to the F C array in Figure 2b is cropped to the area defining significantly changed pixel values and is represented as F R e g i o n , after cropping, in Figure 2c. After cropping, the color space of a ROM is converted back from grayscale format to RGB, which is then used in the load reduction module.
Figure 2. Regions-Of-Motion (ROM) Identification. (a) Difference frame: example 2-D array of pixel values (b) Current frame: example 2-D array of pixel values corresponding to the FD array (c). Extracted ROM after cropping
As has been mentioned, a reference frame is required for accurate processing of the proposed system. In practice a reference frame can be selected during the calibration or installation phase of a system. This frame can be regularly updated automatically or manually, depending on the application domain. For example, during video surveillance, when cameras are usually mounted at a fixed position, the reference frame can be updated automatically by subtracting the static content of the reference frame (selected initially) from that of a frame with moving content. Furthermore, for some applications, a reference frame can be updated manually.

3.2.3. Load Reduction

To further reduce the data quantity, JPEG compression [33] is applied on a ROM, whereas an integer-valued indicator (rather than a ROM) is sent to a receiver in the case of little to no change identified across the difference image.
Thus, in many cases the video frame compression rate, will be the ratio of the original frame size to that of one integer. On the other hand, if there is maximal content change in the video frame (caused by many moving objects) then the compression rate will be equal to that achievable by JPEG compression of the whole frame. In general, however, the compression rate will be proportional to the size of the ROM. In addition, the compression rate within a ROM is also content dependent, according to factors such as the extent of exploitable spatial frequencies present in the ROM for the purpose of JPEG compression. Section 4.2.4 indicates the bit-rates achieved after compression (and before encryption) for varying content. From that Section it will be apparent that the overall compression rate is highly variable according to the content, so that there is no simple descriptor of the compression rate.

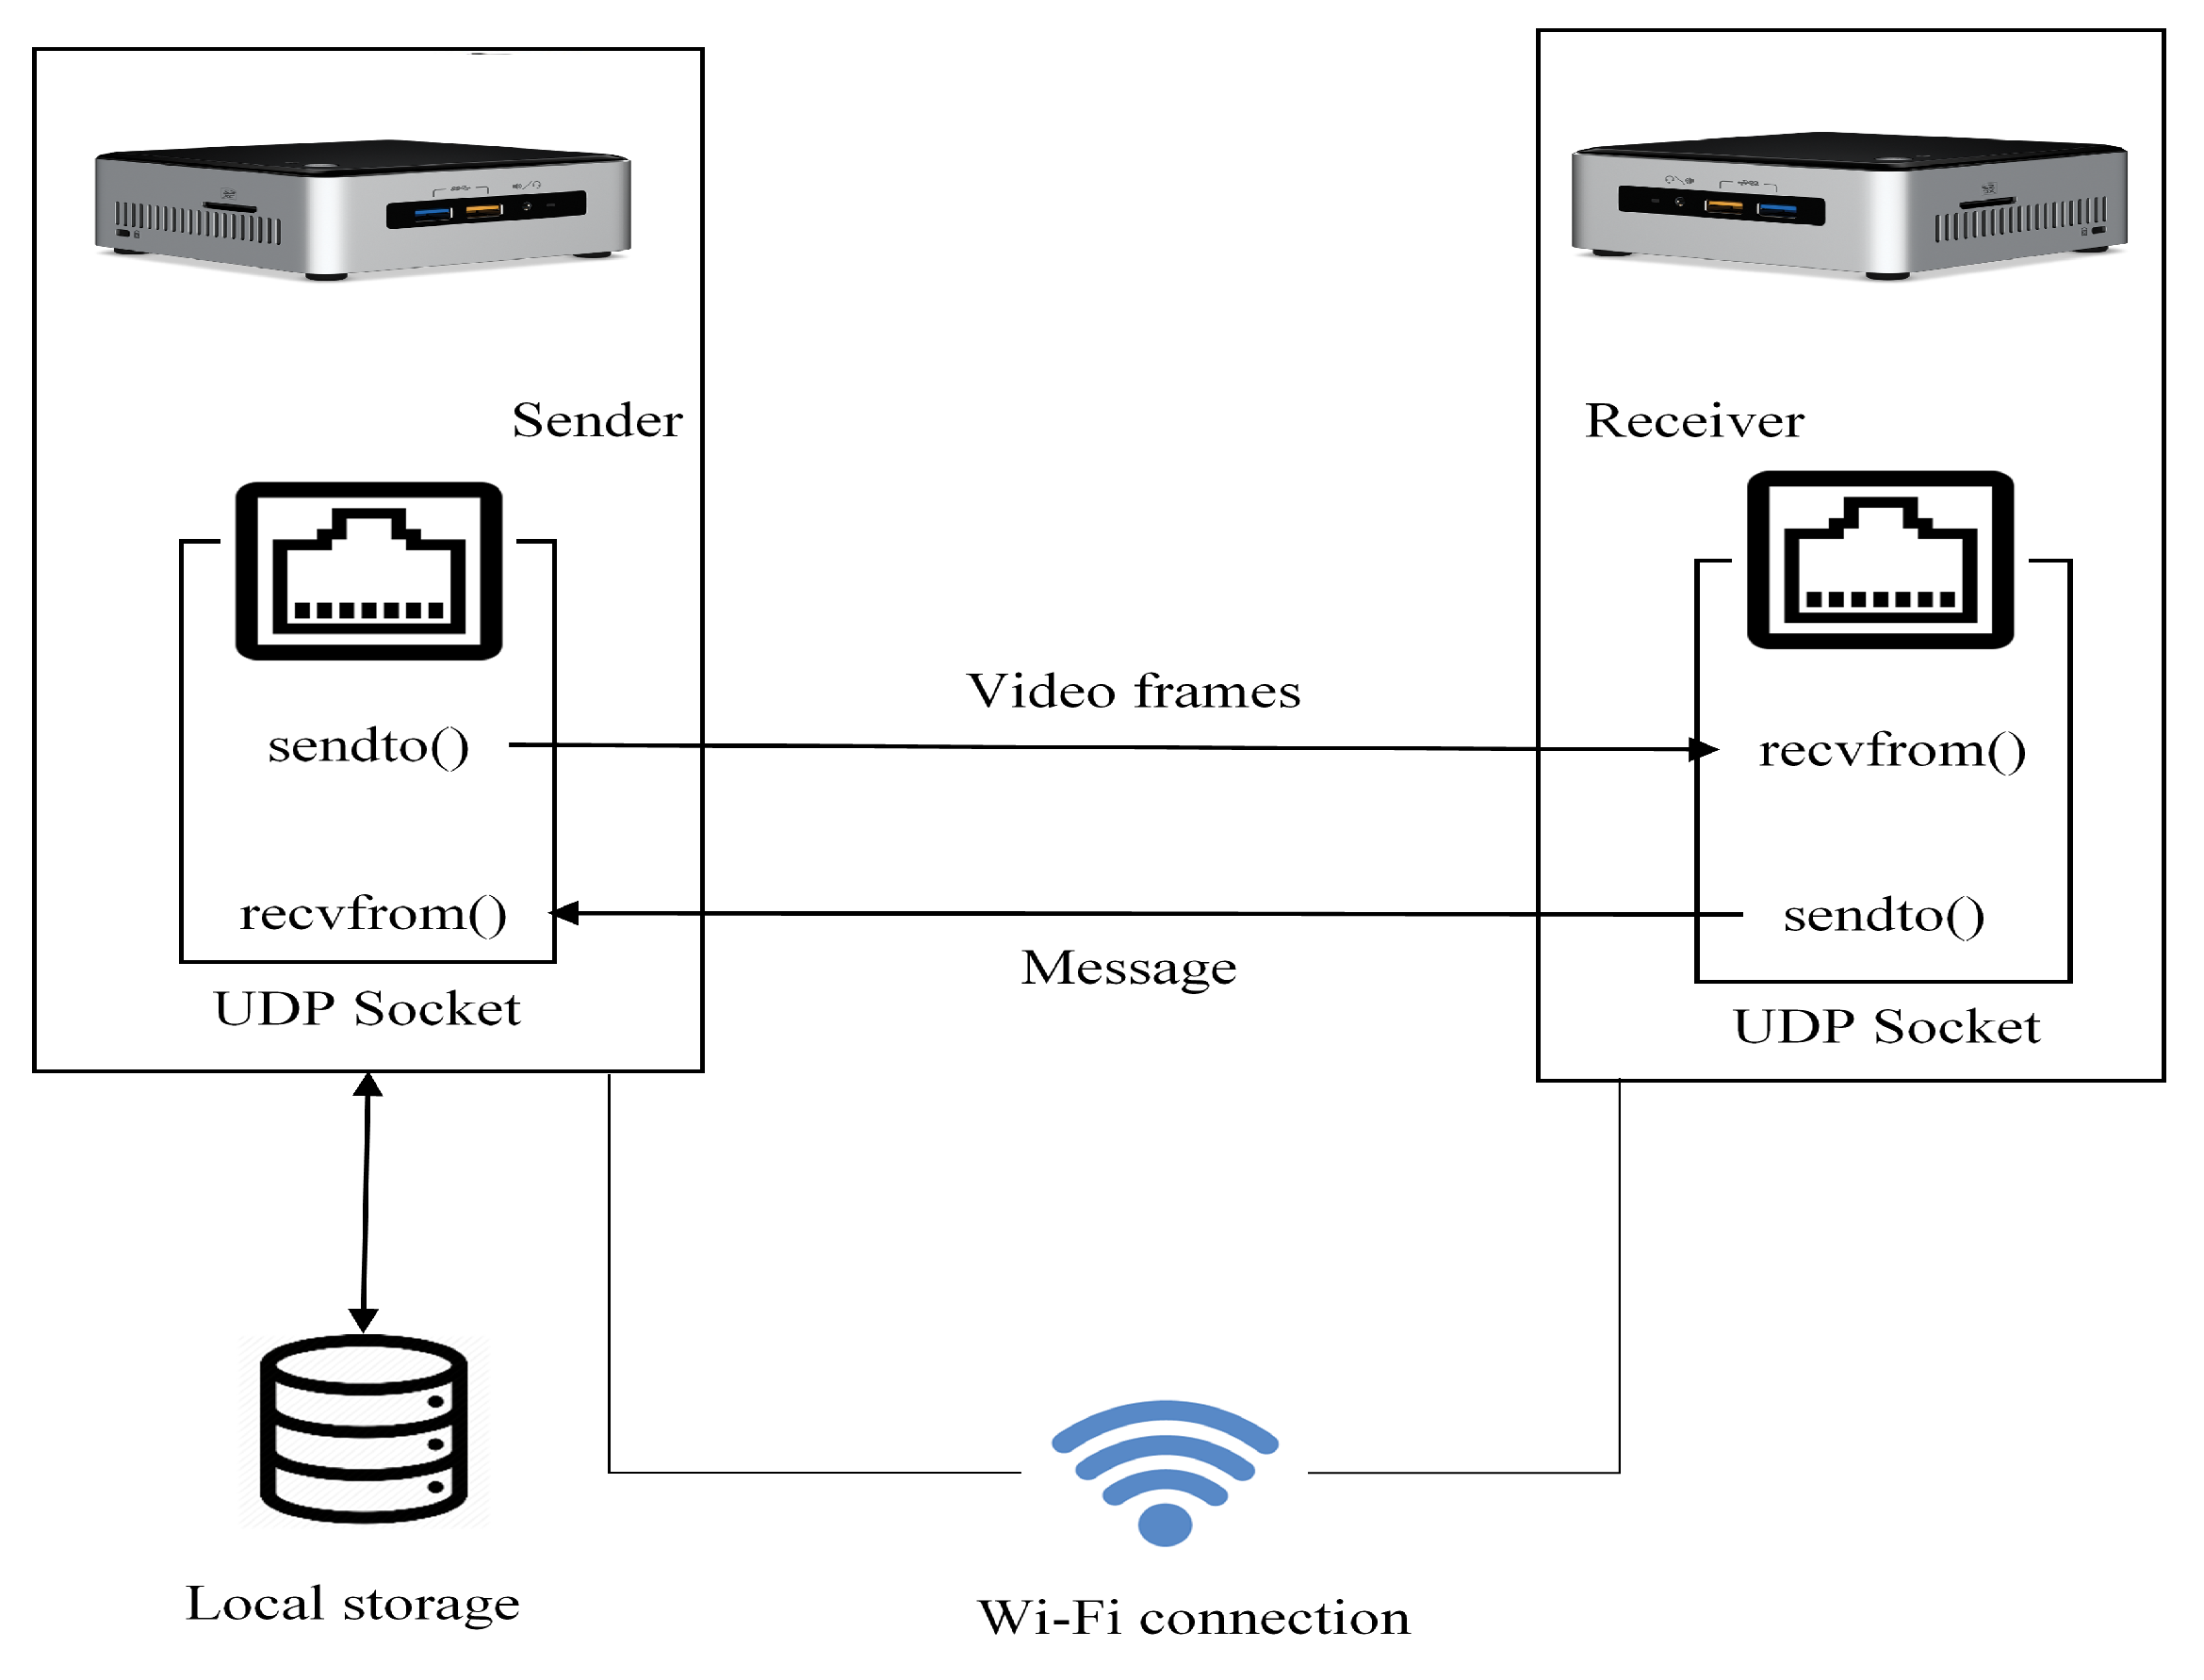
3.2.4. Secure Transmission

This module deals with the secure delivery of data through encryption. Data present as ROM, full frame, or integer value are sent to the receiver as encrypted bytes. As a result, the byte size will be more than that originally compressed because of encryption overhead. The average bit-rate increase is depicted in Section 4.2.4. A combination of two cryptographic techniques is used namely, Fernet and RSA, programmed in Python. RSA [61] is used at the time of connection between sender and receiver. On the other hand, Fernet [62] is used throughout the process for sending and receiving data. Farnet is a symmetric encryption scheme built on a standard cryptographic method, that is, AES. Therefore, it is a version of the strong and standardized cipher AES. For secure sharing of the Fernet public key between the sender and receiver, RSA is used. The sender uses the receiver’s public key to encrypt the Fernet-generated symmetric key and sends it to the receiver, which decrypts this key using its private key. Later on, the symmetric key generated by Fernet is used on both sides for encryption and decryption of the video data as indicated in Figure 3.
Figure 3. Combination of Farnet and Rivest-Shamir-Adleman (RSA) to encrypt the data at source.
For confidential transmission of information between sender and receiver, a Public Key Infrastructure (PKI) is normally initially employed to authenticate the receiver’s public key. This public key is needed in the encryption of the sender’s Fernet symmetric key. After establishment of a connection, the RSA receiver’s public key is authenticated by means of a digital certificate, supplied as part of the PKI process. Later, a symmetric key generated via Fernet is kept by the sender and also sent (in RSA encrypted form) to the receiver. To share this new symmetric key in an encrypted form, the RSA public key of the receiver is used, which secures the key from exposure outside the connection. At the receiver end, this Fernet key is decrypted to its original form with the help of the receiver’s private key. Once a Fernet symmetric key is maintained at both ends, video transfer is initiated and is secured through symmetric cryptography, that is, through AES. Each follow up message (either in the form of frame, ROM or integer indicator) is encrypted at the sender and decrypted at the receiver by the Fernet public key.
With a composite encryption mechanism, data are encrypted over the connection with a Fernet key. However, before that can happen the Fernet symmetric key must be exchanged. To protect that symmetric key from exposure, RSA is used. Notice, however, that RSA is computationally demanding as it uses large number modulo arithmetic. Therefore, RSA is only used for confidential exchange of the symmetric key. Therefore, RSA is only used for confidential exchange of the symmetric key. Notice that, though a PKI is only employed at the start-of the key exchange process, the well-known, lighter-weight Diffie-Hellman key exchange mechanism can be employed as an alternative.

3.2.5. Video Compression Algorithm

The previous Section described the system design. This Section illustrates the flow of data in a series of steps, describing how it is processed at the sender and receiver. There are two algorithms: one running at the sender and the other at the receiver, as illustrated in Figure 4.
Figure 4. Processing steps at a sender and at a receiver.
Algorithm at Sender
The sender first opens a video file and starts reading frames, as shown in Figure 4. The first frame of a video sequence is sent in its original form to the receiver, so that it is kept as a reference for subsequently received data. For all subsequent frames, a frame difference is calculated, converted to grayscale format and checked for any non-zero pixel intensity values. If the number of non-zero intensities in the difference frame F D exceed a given threshold, that is, a percentage of changed intensities to total frame size in number of pixels. For small frame sizes this percentage is set to 50% and for larger frames it is 10%, to avoid loss of data. In the case that F D meets the given threshold, then a rectangular region containing the remaining non-zero values is extracted as F R e g i o n and the co-ordinates of the starting and ending pixels are saved and sent along with this information. In Figure 4 at the sender, this is summarized as Motion detection. Otherwise, a single integer value is sent to the receiver as an indicator that no frame data will otherwise be sent. Here, a counter variable is used to maintain a record of how many times an integer is sent in place of a frame and every time the counter reaches eleven, that is, after a complete twelfth frame is forwarded. Each time, F C or F R e g i o n is sent, it is JPEG encoded and then encrypted. For every new frame a reference frame F R is maintained, namely the previous F C frame. This process continues until the end of the video sequence or stream. A detailed algorithm, including communication software primitives for a Sender is given as Algorithm 1.
Algorithm 1 Sender
  • sock = socketUDP()
  • clientRequest = sock.recv()
  • If(clientRequest == “Send Video”)
  •  vidObj = openVideoCaptureObject()
  •  count = 0
  • F C = vidObj.read()
  •  while(vidObj)
  •   If( F C is first frame)
  •     encodedBuffer=encode( F C , JPEG)
  •      sock.send(encrypt(encodedBuffer))
  •       F R = F C
  •     Else If (count == 11)
  •      count = 0
  •      encodedBuffer=encode( F C , JPEG)
  •      sock.send(encrypt(encodedBuffer))
  •       F R = F C
  •     Else
  •       F D = absolute( F R F C )
  •      convert( F D , GRAYSCALE)
  •      C=countNonZero( F D )
  •      If C >= threshold
  •        F D [ F D <=20] = 0
  •       region_Locations = nonzero( F D )
  •        startRow, endRow, startCol, endCol = region_Locations
  •         F R e g i o n = F C [startRow:endRow, startCol:endCol]
  •        count = 0
  •        encodedBuffer=encode( F R e g i o n , JPEG)
  •        sock.send(encrypt(encodedBuffer))
  •         F R = F C
  •     Else
  •        sock.send(encrypt([0]))
  •        count++
  •         F R = F C
  •    F C = vidObj.read()
  • Else
  •    return
Algorithm at Receiver
The receiver node also has its socket created and connected to a sender. Upon a video request, the receiver receives data from sender as F R e c v in an encrypted form. F R e c v is decrypted and the acquired data is checked as to whether it is a frame, a region of a frame (or ROM) or simply an integer value. After a decision is made, at this stage, the algorithm follows any of three sequences. If an integer value is received, it shows no motion is detected and results in a repetition of a previous frame at the display. On the other hand, if a frame is received, it is first decrypted and decoded as F C and then displayed while the previous frame F P r e v is updated by the current frame F C . Then, if an image region is received, it is decrypted and decoded, by using the co-ordinates of the starting and ending pixel, F P r e v is updated and displayed. This processing loop continues in the same manner until the sender stops or closes its socket. Figure 4 includes a flowchart for the receiver side algorithm and a pseudo-code representation of the detailed software code is given as Algorithm 2.
Algorithm 2 Receiver
  • sock = socketUDP()
  • sock.send(“Send Video”)
  • while(1)
  • F R e c v = sock.recv ()
  •  data = decrypt( F R e c v )
  •  If(frame data is null)
  •    return
  •  Else If(data has “Region”)
  •    startRow, endRow, startCol, endCol = decodedData [region_Locations]
  •     FPrev[startRow:endRow, startCol:endCol] = decode(regionOfMotion)
  •     imshow( F P r e v )
  •   Else
  •     If(data has [0])
  •     imshow( F P r e v )
  •     Else
  •      F C u r r = decode(data)
  •      F P r e v = F C u r r
  •     imshow( F C u r r )

4. Results

For experiments, the IoT testbed comprised of two Intel NUC Core i5-6260U mini computers connected via an IEEE 802.11 (wi-fi) connection. The operating system on both computers was the Ubuntu 16.04 64-bit variety of Linux and device specifications included 4GB RAM and 1.80 GHz processor. Both sender and receiver side software codes were implemented with the OpenCV library in the Python programming language, as previously mentioned. All communication was carried out through User Datagram Protocol (UDP) sockets [63]. Results were taken from stored videos, as mentioned already in Section 3. A diagram of the communication setup is given in Figure 5. Results were acquired through application of the proposed technique on the five previously-mentioned test video sequences. Five parameters were computed, comprising of the amounts of data transferred, delays in data transmission, bit-rates, and two measures of video quality, namely Peak Signal-to-Noise Ratio (PSNR) and Structural Similarity (SSIM) index [64].
Figure 5. Testbed communication setup.

4.1. ROM Extraction

All frames of the video sequences were each considered as a two-dimensional array with a depth of three, for the three RGB color channels. Thus, the image dimensions were of the form (width × height × depth), for example 1280 × 720 × 3 pixels. Figure 6 consist of sets of three images, with the left image showing the original frame, which is selected when the frame difference reaches a given threshold (as previously described in Section 3), that is, sufficient change is detected. The middle image depicts the identification of a ROM, while the right-hand one shows the resulting image after processing of a selected frame. This resulting image (after compression and then encryption) is then sent to the receiver of the video.
Figure 6. ROM identification in tested video sequences given in (AE): video sequences: with (a) Original frame from the video sequence, (b) Identification of a ROM, (c) Cropped image of a ROM.
Figure 6 shows sets of images (A–E) obtained from all five video sequences. Consider Figure 6A, where Figure 6(Aa) shows frame 28 of the video. This frame is selected after detection of prominent change in intensity values with respect to a reference frame, whereas Figure 6(Ab) shows the region where motion is detected. In most cases, a small region of a larger image is detected as a ROM. In the worst-case scenario, when there is more motion and that motion is mostly at the corners of the frame, then a whole frame is sent. For example, the actual size of Figure 6(Aa) was 384 × 288 × 3 bytes. After cropping, a region of size 267 × 286 × 3 bytes, as in Figure 6(Ac) was left for transmission. Similarly, considering Figure 6C, where Figure 6(Ca,Cc) also show a decrease in the amount of data, with the image size reduced from 352 × 240 × 3 to 11 × 35 × 3 bytes. This ROM is far smaller in size than the actual image. When a region of an image is identified, it is compressed through JPEG encoding, as a result of which an additional reduction in size of transmitted data occurs. Table 1 shows how much data is actually sent for the frames given in Figure 6.
Table 1. Comparison between the sizes of the extracted Region of Motion and the consequent encoded buffer (in bytes).

4.2. Evaluation Parameters

For each of the evaluation videos, the amount of data sent, the time delays in sending the data, and the frames per second (fps) were compared for two scenarios. The first scenario was through the proposed method, where portions of frames were sent for most of the time. On the other hand, in the second scenario, all frames were sent, with no ROMs, which scenario was called herein All Frames. Because, for confidential transmission of data, cryptography was employed, the bit-rate increase as a result of the application of cryptography was also compared for the proposed method with and without encryption. Lastly, results for the two video quality metrics, namely SSIM and PSNR (see Section 4) are discussed.

4.2.1. Data Sent

The amounts of data sent computed in kB for the test video sequences are shown in the graphs of Figure 7. The first 200 hundred frames were chosen to compare the results, that is, between the proposed method, plotted in yellow, and that of sending all frame data (plotted in blue). The x-axes in the graphs of Figure 7 indexes the video frame number and the y-axes show the amount of data sent in kB. For ease of representation sample frames are plotted. Thus, starting from frame 1 every seventh frame’s data point is plotted. All the frames in both scenarios are JPEG encoded before transmission. Thus, these results are computed for the encoded buffer created when images are compressed.
Figure 7. Comparison between the Proposed Method and All Frames in terms of data sent in kB against the first 200 frames of (a) Walk (b) Ground (c) Exercise (d) Duval Street (e) Football.
By studying the graph in Figure 7a, Walk, a noticeable cyclical pattern can be seen in the graph. For consecutive sample frames of video, blue markers are plotted lower than the previous one, but again after a few sample frames a blue marker can be seen at a higher value, showing that consecutive sample frames are almost the same for most of the video unless an abrupt change is detected as motion. The same pattern follows for the rest of this particular video sample. The ROM area is comparatively large, limiting the gains from the proposed method. The minimum and maximum data sent for the proposed method were ≈0.003 kB and ≈39.66 kB. On the contrary, for JPEG encoded complete frames data sent was ≈33.98 kB at a minimum and ≈39.66 kB at a maximum. Clearly, overall, less data were sent with the proposed method.
Figure 7b shows a plot for the second video, Ground, which illustrates that periodically, the amount of data reaches a maximum value (for both compared methods). This happens when a single byte, signifying an empty frame, is sent consecutively 11 times when no significant change occurs. On receiving an empty byte, the receiver repeats the display of the previous frame. Therefore, to avoid a still video, a way is opted for that involves sending a full frame every 12th occurrence of an empty byte. Figure 7b shows peaks mostly at regular intervals because, for this test video, the difference between each two consecutive frames is found to be less than the threshold most of the time (though not for the example of Figure 6). The proposed method reached its highest peak at ≈224.91 kB and a minimum value at ≈0.003 kB. On the other hand, byte size values are almost always consistently higher for the complete frames method. Similarly, Figure 7c, for Exercise, is another illustration of how the amount of data transmitted is controlled and reduced for a video. This plot shows varying values for the data transmitted after applying the proposed method, which can be easily distinguished from the method when full frames are always sent. The amount of data is very low on average, no doubt because of the limited size of the ROM. For this video, another pattern is noticeable, one different from that of Figure 7a. For a few consecutive frames, values of data transmitted remain almost the same but change shortly afterwards, depending upon how much change is detected. Here, the proposed method has its minimum value approximately at ≈0.003 kB whereas, for the complete frames method, minimum data value is ≈21.28 kB. Clearly, for this type of video with relatively small ROMs in each frame, the proposed method can consistently reduce the amount of data transmitted.
On the contrary, if Figure 7d is considered, markers for both methods are plotted near to one another. Data are reduced to some extent but not by a large margin. The reason here is the presence of more motion in the video sequence, as compared to the three previous videos. Similarly, in Figure 7e, the video sequence, Football, has again more motion. Although data values for the proposed method are lower than the All Frames method, due to smaller differences between frames, the line plots can barely be distinguished. Figure 7d,e show the results for videos with large motions and, thus, the identified ROMs are large in extent. As a result of more motion, the proposed method shows data values slightly lower or equal to the All Frames method.
Comparisons in Figure 7, show that the proposed method results in lower amounts of data sent for most frames, even though the difference in quantity is small for those video sequences in which there is motion across a significant extent of each frame. The reader can judge whether their application will benefit from the proposed method. As many applications in the broad category of surveillance or monitoring by an IoMT do not have large areas of motion occurring for a long time, one can argue that the proposed method has considerable value, though relaying a sports’ event may not be one of those applications.

4.2.2. Delays in Sending Video

The goal of the proposed method has been to find an efficient way of reducing data transmission for low-resourced devices in an IoMT. Therefore, as the word ‘efficient’ implies, a method should not only save data but also other resources including time. Figure 8, shows line plots representing average time delay in seconds for all five test videos using the proposed method. These values show by how much the subsequent response is delayed, that is, how much time it takes for the next complete frame to reach the receiver. Frames are sent in chunks and these chunks are ultimately combined as one frame at the receiver end. Delays are calculated for a complete frame, when all of its chunks are received and combined, their average for complete video are given in Figure 8. Figure 9 can be viewed in reference to Figure 8, as it reports the sender ROM processing time component in delay at the receiver. However, there is no clear correlation with delay, which indicates that other delays at the sender and some transmission delay has an impact on the delays.
Figure 8. Average delays during the reception of each consecutive frame at the receiver comparing the proposed method with the All Frames method (plotted as gray bars).
Figure 9. Average processing overhead at the sender for ROM identification.
The time taken for each complete frame to reach the receiver is affected by the overall processing overhead (not just that for ROM identification), which comes with ROM identification and extraction, the amount of data sent, and network conditions. Hence, results show variations for all test videos. The average delay for the first video sequence, Walk, is roughly equal for the proposed method and the All Frames method. For Walk, significant changes occur between consecutive frames and, for the majority part of the video, a ROM is extracted. Therefore, processing overhead and the consequent delay in transmission of the data contributes to the delay at the receiver. For Ground, the delay difference between the two methods is prominent, as the proposed method results in much less delay (on average). This is due to the reason that, for most of the test video frames, motion is not found to be significant and, therefore, the processing part of ROM identification is skipped and empty data is sent instead. Exercise and Football again show comparatively lower delays for the proposed method, when for Exercise less data makes up for low processing overhead, hence, low delay. However, for Duval Street, the trend changes and comparatively longer delays are evident, which are a result of network conditions and processing overhead. Overall, delays in data reception are low for the proposed method and are not significantly higher than the ALL Frames method.

4.2.3. Frame Rate

The frame arrival rate at the receiver of video by each second has been calculated for the proposed method and compared with that for All Frames. The values of the fps are given in Table 2 and Figure 9. The frame arrival rate varies according to the method used and the test video sequence sent. For the Walk and Duval Street sequences, the proposed method has a comparatively smaller fps. Additional processing is carried out upon both videos, that is additional processing occurs in extracting ROMs for nearly every frame. Duval Street’s frame size is also large too and, therefore, all in all, the fps lags behind. However, for Ground, Exercise and Football, the proposed method demonstrates higher fps than the All Frames method. The cause of this is that, for Ground, extra processing for ROM identification and extraction is not needed, because the difference between consecutive frames is usually not significant and an empty byte is sent most of the time. Whereas Exercise and Football have the same behavior in terms of ROM processing but, due to small frame sizes, processing time is low as well and so the fps is comparatively higher.
Table 2. Comparison of fps for the proposed method and the All Frames method.

4.2.4. Average Bit-Rate

The amount of data sent per second was measured as number of bits sent per second. A large bit-rate means more of the data are sent and the quality of information is usually larger. The proposed method aims to control the amounts of data transmitted, which has been shown in Figure 7. However, at the same time, information must be kept complete and accurate without loss of significant data. Figure 10 shows the average bit-rate for the proposed method across the five test video sequences. Lower bit-rates occur according to the extent of motion, the spatial resolution and the behavior upon application of the proposed method. Complete frames, ROMs and empty data bytes are sent in an encrypted form in this study, resulting in an increase in bytes transmitted. Although, the bit-rates increase after encryption, the new bit-rates are still quite low for the proposed method. It is likely that, overall, lower bit-rates do not present a significant loss of information but represent confidential transmission of that information.
Figure 10. Bit rates with and without encryption for five evaluation videos.

4.3. Video Quality Metrics

Video quality and accuracy of information is measured for all test videos. For the purpose of justifying results in a more elaborative way, two major video quality metrics were used in this study namely, SSIM and PSNR. The results obtained are presented next.

4.3.1. Structural Similarity (SSIM) Index

SSIM is used for the purpose of identifying degraded quality or loss in image information. The index’s value lies between 0 and 1, where near 0 means little to no similarity and 1 or near to 1 means more similarity. It was introduced [65] to represent the response of the human visual system more closely than other objective measures of video quality, without the cost and overhead of subjective testing. Herein, the SSIM index is computed for complete videos. An original frame of a video is compared with the one reconstructed at the receiver after ROM substitution. Results have also been computed for those frames which are not sent due to less motion and compared with the previous frame displayed at the receiver. This is done to show how many dissimilarities exist between actual frames at the sender and those received or displayed at the receiver. Results in Figure 11 showing average SSIM for all five video sequences. Average SSIM is within a range of 0.96 to 0.98 showing very few dissimilarities.
Figure 11. Average Structural Similarity (SSIM) between original frames at the sender and reconstructed frames at the receiver for five video sequences.
Though, SSIM, along with PSNR, is generally employed by researchers as a way of comparing their results, other video quality metrics have been surveyed and evaluated, such as in Reference [66] or Reference [67]. Unfortunately [68], it is difficult to make conclusions based on such comparative studies because the test images, testing procedures and applications differed. Ideally, subjective assessment is required to assess video quality. Unfortunately, managers of video streaming normally do not have access to a panel of viewers, owing principally to: time restrictions; and the difficulty of assembling a suitable set of viewers. However, objective subjective ratings can approximate the results of subjective testing with a high degree of correlation. For example, the Video Quality Experts Group (VQEG) Full-Reference Television (FR-TV) Phase II tests [69] for VQM [70], resulting in Pearson linear correlation coefficients (PCCs) with difference Mean Opinion Score (MOS) from subjective tests, of above 0.9 (out of a maximum of one). Following the VQEG evaluation procedure SSIM also resulted in correlations well above 0.9 and in Reference [71] outperformed four other models on the authors’ still image database. Since the original SSIM presentation [72], a number of refinements have also occurred. These give good confidence that SSIM along with VQM are excellent objective measures of MOS. However, the computation overhead resulting from VQM is high, which is why SSIM is generally preferred by researchers to SSIM.

4.3.2. Peak Signal-to-Noise Ratio (PSNR)

PSNR is an objective video quality metric [73] based on second order statistics across all the pixels of the video frames compared. Therefore, it is an objective measure that does not directly reflect the human visual system. Nevertheless, it has been and remains in widespread use. A lower PSNR shows that noise, for example, errors in the video representation, has disrupted the signal strength, for example, the frame representation at the receiver. This study analyzes PSNR to find the accuracy of information. It is computed for the test videos using random sample of 260 frames from each video. Their average values are shown in Table 3 for the Y, U and V channels separately. Results show a desirable quality of image, indicating a limited distortion, considering the use of a lossy compression that is, JPEG, used in this study. Of course, when natural images are involved, that is, those from a Markov field of order one, the human viewer is usually unable to tell that a scene has been affected by (say) compression distortion, unless the original scene is available.
Table 3. Average Peak Signal-to-Noise Ratio (PSNR) for Y, U, V channels of 260 random video frames for all five videos.

4.4. Discussion

Table 4 compares the authors’ method with the methods of five similar methods or systems of recent years, assessed in their own terms. As might be expected, no one method is without weaknesses or limitations. The authors’ method requires further software development, after the current research phase, as the processing latency at the sender is, at the moment, a concern. The work in Reference [12] seems to result in rather limited load reduction, whereas the method of Reference [37] is sensitive to the behavior of SSIM, which appears to be more suitable for assessing relative quality compared to an original image, rather than as a means of comparison across differing frames. The method of Reference [39] can result in low quality video, which might make it difficult to identify objects in surveillance video. Then, the method in Reference [74] is computationally complex, which currently makes it unsuitable for some sensor devices and certainly appears less computationally efficient than the authors’ core frame differencing method. Needless to say, there are many positive features, some of which appear in the Merits row of Table 4. In general, it appears that there may be trade-offs between the method of load reduction and the computational efficiency, as in Reference [74]. In fact, whatever the computational gains, the resulting overall video quality is important for the type of applications, that is surveillance ones, that are of interest to this paper’s authors. Thus, in some cases, such as with Reference [37], the quality can be erratic.
Table 4. Comparative analysis of the proposed method and prior art.
Returning to a discussion of the current paper’s research, the results show that transmitted video data are usually reduced by a significant amount through use of the proposed method of video compression allied with motion detection. Additionally, the accuracy of the information and the video quality in general are maintained, as was justified by SSIM and PSNR measurements. Not only is energy conserved by saving excess data from being transferred but also, even with processing overheads for each consecutive frame, acceptable transmission latencies were observed in respect to known applications of an IoMT. Considering the processing overhead and time delays, the frame rates at the receiver were proportionate. Network conditions in the wireless network may also have contributed to delays, though such delays were not this study’s focus, which was the video response, and probably warrants a wider investigation given a more extensive network testbed. Average bit-rates increased due to the application of encryption but it is noticeable that the overall bit-rates were generally low, despite the presence of encryption.

5. Conclusions

Resources are limited in an IoMT, which has similar limitations to the IoT, of which it is a subset. The resources available to an IoMT constitute memory, energy (or power over time), processing capability, and bandwidth. With the massive production of video data by mobile multimedia devices, which are constantly storing, processing, and sharing information, those resources in an IoMT are often devoured quickly. Devices in an IoMT become resource hungry due to processing large amounts of data and, therefore, that data needs to be controlled, without in the case of video and still images (considered herein) compromising quality, accuracy and confidentiality. In this study, a video compression method was proposed based on frame differencing. Difference frames were acquired by subtracting two consecutively occurring frames to extract motion information. Motion in a newly captured frame is forwarded only when prominent change is detected, judged by a threshold, when a Region of Motion or ROM is forwarded in JPEG compressed and AES encrypted form, as otherwise the previous frame is displayed at the receiver end. All the parameters that were considered and measured for the proposed method, including data size, bitrate, transmission delay, frame rate at the receiver, demonstrated the worthwhile nature of the proposed method. Not only was the video information accurate but, all the same, the amount of data transmitted was usually considerably reduced, especially when compared to a method without motion detection. The time delays recorded demonstrated that, even with the per video frame processing overheads, delays were close to those when sending all frames without motion detection and ROM extraction. The SSIM and PSNR video quality measurements show that, though there were some slight differences, the reconstructed frames at the receiver were nearly equivalent to the original frames at the sender, during tests across the wireless link. Therefore, no prominent degradations occurred. Bit-rates were increased as a result of encryption but the new bit-rates remained low, showing acceptable behavior.
Overall, the authors found the proposed method to be flexible and efficient enough to be used in resource-constrained IoMT devices such as Intel NUC for relaying videos. In fact, the paper includes a comparison of the proposed method and that of five other related methods for load reduction. All six methods have their relative merits and demerits, including for the proposed method a need to reduce the processing times in the forthcoming development phase of the authors’ method, after the present research phase. This study has focused on video aspects of the proposed method. Future work will consist in tests over a more extensive wireless network, using more representative IoMT devices such as the Raspberry-PI.

Author Contributions

Conceptualization, N.K.; Formal analysis, A.I.; Funding acquisition, M.N.A.; Investigation, I.T.; Methodology, N.K. and M.N.A.; Project administration, N.K. and M.F.; Resources, A.I.; Software, I.T. and F.T.; Supervision, M.N.A. and A.I.; Visualization, F.T.; Writing – original draft, I.T. and M.N.A.; Writing – review & editing, M.F. All authors have read and agreed to the published version of the manuscript.

Funding

This research received no external funding.

Conflicts of Interest

The authors declare no conflict of interest.

References

  1. Development, S.R. IoT: Number of Connected Devices Worldwide 2012–2025, Statista. 2016. Available online: https://www.statista.com/statistics/471264/iot-number-of-connected-devices-worldwide/ (accessed on 20 December 2019).
  2. Aslam, A.; Curry, E. Towards a generalized approach for deep neural network based event processing for the internet of multimedia things. IEEE Access 2018, 6, 25573–25587. [Google Scholar] [CrossRef]
  3. Mohan, A.; Gauen, K.; Lu, Y.H.; Li, W.W.; Chen, X. Internet of video things in 2030: A world with many cameras. In Proceedings of the IEEE International Symposium on Circuits and Systems (ISCAS), Baltimore, MD, USA, 28–31 May 2017; pp. 1–4. [Google Scholar]
  4. Alvi, S.A.; Afzal, B.; Shah, G.A.; Atzori, L.; Mahmood, W. Internet of multimedia things: Vision and challenges. Ad Hoc Netw. 2015, 33, 87–111. [Google Scholar] [CrossRef]
  5. Kumari, A.; Tanwar, S.; Tyagi, S.; Kumar, N.; Maasberg, M.; Choo, K.K.R. Multimedia big data computing and Internet of Things applications: A taxonomy and process model. J. Netw. Comput. Appl. 2018, 124, 169–195. [Google Scholar] [CrossRef]
  6. Zhu, W.; Cui, P.; Wang, Z.; Hua, G. Multimedia big data computing. IEEE Multimed. 2015, 22, 96-c3. [Google Scholar] [CrossRef]
  7. Al-Fuqaha, A.; Guizani, M.; Mohammadi, M.; Aledhari, M.; Ayyash, M. Internet of things: A survey on enabling technologies, protocols, and applications. IEEE Commun. Surv. Tutor. 2015, 17, 2347–2376. [Google Scholar] [CrossRef]
  8. Kaashki, N.; Safabakhsh, R. RGB-D face recognition under various conditions via 3D constrained local model. J. Vis. Commun. Image Represent. 2018, 52, 66–85. [Google Scholar] [CrossRef]
  9. Karmann, K. Moving object recognition using an adaptive background memory. In Time-Varying Image Processing and Moving Object Recognition; Cappellini, V., Ed.; Elsevier: Amsterdam, The Netherlands, 1990; Volume 2, pp. 297–307. [Google Scholar]
  10. Chen, S.; Xu, H.; Liu, D.; Hu, B.; Wang, H. A vision of IoT: Applications, challenges, and opportunities with china perspective. IEEE Int. Things J. 2014, 1, 349–359. [Google Scholar] [CrossRef]
  11. Whitmore, A.; Agarwal, A.; Da Xu, L. The Internet of Things—A survey of topics and trends. Inf. Syst. Front. 2015, 17, 261–274. [Google Scholar] [CrossRef]
  12. Wang, K.; Mi, J.; Xu, C.; Zhu, Q.; Shu, L.; Deng, D.J. Real-time load reduction in multimedia big data for mobile Internet. ACM Trans. Multimed. Comput. Commun. Appl. (TOMM) 2016, 12, 76. [Google Scholar] [CrossRef]
  13. Knight, M. Data Management and the Internet of Things. Available online: https://www.dataversity.net/data-management-internet-things/ (accessed on 20 December 2019).
  14. Park, T.; Abuzainab, N.; Saad, W. Learning how to communicate in the Internet of Things: Finite resources and heterogeneity. IEEE Access 2016, 4, 7063–7073. [Google Scholar] [CrossRef]
  15. Albreem, M.A.; El-Saleh, A.A.; Isa, M.; Salah, W.; Jusoh, M.; Azizan, M.; Ali, A. Green internet of things (IoT): An overview. In Proceedings of the 2017 IEEE 4th International Conference on Smart Instrumentation, Measurement and Application (ICSIMA), Putrajaya, Malaysia, 28–30 November 2017; pp. 1–6. [Google Scholar]
  16. Abbasi, M.A.; Memon, Z.A.; Memon, J.; Syed, T.Q.; Alshboul, R. Addressing the future data management challenges in iot: A proposed framework. Int. J. Adv. Comput. Sci. Appl. 2017, 8, 197–207. [Google Scholar]
  17. Perala, S.S.N.; Galanis, I.; Anagnostopoulos, I. Fog computing and efficient resource management in the era of Internet-of-video things (IoVT). In Proceedings of the 2018 IEEE International Symposium on Circuits and Systems (ISCAS), Florence, Italy, 27–30 May 2018; pp. 1–5. [Google Scholar]
  18. Devasena, C.L. IPv6 Low Power Wireless Personal Area Network (6LoWPAN) for Networking Internet of Things (IoT)–Analyzing its Suitability for IoT. Indian J. Sci. Technol. 2016, 9, 30. [Google Scholar]
  19. Pereira, R.; Pereira, E.G. Video streaming considerations for internet of things. In Proceedings of the 2014 International Conference on Future Internet of Things and Cloud, Barcelona, Spain, 27–29 Auguest 2014; pp. 48–52. [Google Scholar]
  20. Sammoud, A.; Kumar, A.; Bayoumi, M.; Elarabi, T. Real-time streaming challenges in Internet of Video Things (IoVT). In Proceedings of the 2017 IEEE International Symposium on Circuits and Systems (ISCAS), Baltimore, MD, USA, 28–31 May 2017; pp. 1–4. [Google Scholar]
  21. Jennehag, U.; Forsstrom, S.; Fiordigigli, F. Low delay video streaming on the internet of things using Raspberry Pi. Electronics 2016, 5, 60. [Google Scholar] [CrossRef]
  22. Mande, V.; Lakhe, M. Automatic Video Processing Based on IoT Using Raspberry Pi. In Proceedings of the 2018 3rd International Conference for Convergence in Technology (I2CT), Pune, India, 6–8 April 2018; pp. 1–6. [Google Scholar]
  23. Patil, N.; Ambatkar, S.; Kakde, S. IoT based smart surveillance security system using raspberry Pi. In Proceedings of the 2017 International Conference on Communication and Signal Processing (ICCSP), Chennai, India, 6–8 April 2017; pp. 344–348. [Google Scholar]
  24. Quadri, S.A.I.; Sathish, P. IoT based home automation and surveillance system. In Proceedings of the 2017 International Conference on Intelligent Computing and Control Systems (ICICCS), Madurai, India, 15–16 June 2017; pp. 861–866. [Google Scholar]
  25. Mahmoud, R.; Yousuf, T.; Aloul, F.; Zualkernan, I. Internet of things (IoT) security: Current status, challenges and prospective measures. In Proceedings of the 2015 10th International Conference for Internet Technology and Secured Transactions (ICITST), London, UK, 14–16 December 2015; pp. 336–341. [Google Scholar]
  26. Zhang, Z.K.; Cho, M.C.Y.; Wang, C.W.; Hsu, C.W.; Chen, C.K.; Shieh, S. IoT security: Ongoing challenges and research opportunities. In Proceedings of the 2014 IEEE 7th international conference on service-oriented computing and applications, Matsue, Japan, 17–19 November 2014; pp. 230–234. [Google Scholar]
  27. Shifa, A.; Asghar, M.N.; Noor, S.; Gohar, N.; Fleury, M. Lightweight Cipher for H. 264 Videos in the Internet of Multimedia Things with Encryption Space Ratio Diagnostics. Sensors 2019, 19, 1228. [Google Scholar] [CrossRef]
  28. Daemen, J.; Rijmen, V. The Design of Rijndael: AES-the Advanced Encryption Standard; Springer: New York, NY, USA, 2013. [Google Scholar]
  29. Wang, Y.; Ostermann, J.; Zhang, Y.Q. Video processing and communications. Progressive 2002, 1, 12. [Google Scholar]
  30. Ghanbari, M. Standard Codecs: Image Compression to Advanced Video Coding; Iet: London, UK, 2003. [Google Scholar]
  31. Joshi, M.A.; Raval, M.S.; Dandawate, Y.H.; Joshi, K.R.; Metkar, S.P. Image and Video Compression: Fundamentals, Techniques, and Applications; Chapman and Hall/CRC: New York, NY, USA, 2014. [Google Scholar]
  32. Rao, K.R.; Yip, P. Discrete Cosine Transform: Algorithms, Advantages, Applications; Academic Press: Cambridge, MA, USA, 2014. [Google Scholar]
  33. Pennebaker, W.B.; Mitchell, J.L. JPEG: Still Image Data Compression Standard; Springer: New York, NY, USA, 1992. [Google Scholar]
  34. Haskell, B.G.; Netravali, A.N. Digital Pictures: Representation, Compression, and Standards; Perseus Publishing: New York, NY, USA, 1997. [Google Scholar]
  35. Lee, J.H.; Jang, K.S.; Kim, B.G.; Jeong, S.; Choi, J.S. Fast video encoding algorithm for the internet of things environment based on high efficiency video coding. Int. J. Distrib. Sensor Netw. 2015, 11, 146067. [Google Scholar] [CrossRef]
  36. Sullivan, G.J.; Ohm, J.R.; Han, W.J.; Wiegand, T. Overview of the high efficiency video coding (HEVC) standard. IEEE Trans. Circuits Syst. Video Technol. 2012, 22, 1649–1668. [Google Scholar] [CrossRef]
  37. Hsu, C.C.; Fang, Y.T.; Yu, F. Content-sensitive data compression for IoT streaming services. In Proceedings of the 2017 IEEE International Congress on Internet of Things (ICIOT), Honolulu, HI, USA, 25–30 June 2017; pp. 147–150. [Google Scholar]
  38. Ukil, A.; Bandyopadhyay, S.; Pal, A. Iot data compression: Sensor-agnostic approach. In Proceedings of the 2015 Data Compression Conference, Snowbird, UT, USA, 7–9 April 2015; pp. 303–312. [Google Scholar]
  39. Jackson, E.S.; Peplow, R. Video compression system for mobile devices. RN 2003, 2. [Google Scholar]
  40. Al-Ani, M.S.; Awad, F.H. The JPEG image compression algorithm. Int. J. Adv. Eng. Technol. 2013, 6, 1055. [Google Scholar]
  41. Rawat, S.; Verma, A.K. Survey paper on image compression techniques. Int. Res. J. Eng. Technol. 2017, 4, 1–6. [Google Scholar]
  42. Bovik, A.C. Video Communication Networks, in Handbook of Image and Video Processing; Academic press: Cambridge, MA, USA, 2010; pp. 1031–1064. [Google Scholar]
  43. Jansi, P. A review on motion detection and tracking techniques. Int. J. Modern Trends Sci. Technol. Rev. Motion Detect. Track. Tech. 2017, 3, 219–224. [Google Scholar]
  44. Daniyal, F.; Cavallaro, A. Abnormal motion detection in crowded scenes using local spatio-temporal analysis. In Proceedings of the 2011 IEEE International Conference on Acoustics, Speech and Signal Processing (ICASSP), Prague, Czech Republic, 22–27 May 2011; pp. 1944–1947. [Google Scholar]
  45. Zeng, W.; Du, J.; Gao, W.; Huang, Q. Robust moving object segmentation on H. 264/AVC compressed video using the block-based MRF model. Real-Time Imaging 2005, 11, 290–299. [Google Scholar] [CrossRef]
  46. Widyawan, M.I.Z.; Nugroho, L.E. Adaptive motion detection algorithm using frame differences and dynamic template matching method. In Proceedings of the 2012 9th International Conference on Ubiquitous Robots and Ambient Intelligence (URAI), Daejeon, Korea, 26–28 November 2012; pp. 236–239. [Google Scholar]
  47. Yu, Z.; Chen, Y. A real-time motion detection algorithm for traffic monitoring systems based on consecutive temporal difference. In Proceedings of the 2009 7th Asian Control Conference, Hong Kong, China, 27–29 Auguest 2009; pp. 1594–1599. [Google Scholar]
  48. Singla, N. Motion detection based on frame difference method. Int. J. Inf. Comput. Technol. 2014, 4, 1559–1565. [Google Scholar]
  49. Alavi, S. Comparison of Some Motion Detection Methods in cases of Single and Multiple Moving Objects. Int. J. Image Process. 2012, 6, 389–396. [Google Scholar]
  50. Yong, C.Y.; Sudirman, R.; Chew, K.M. Motion detection and analysis with four different detectors. In Proceedings of the 2011 Third International Conference on Computational Intelligence, Modelling & Simulation, Langkawi, Malaysia, 20–22 September 2011; pp. 46–50. [Google Scholar]
  51. Metkar Shilpa, P.; Talbar Sanjay, N. Dynamic Motion Detection technique for fast and efficient video coding. In Proceedings of the TENCON 2008—2008 IEEE Region 10 Conference, Hyderabad, India, 19–21 November 2008; pp. 1–5. [Google Scholar]
  52. Choi, Y.; Zaijun, P.; Kim, S.; Kim, T.; Park, C. Salient Motion Information Detection Technique Using Weighted Subtraction Image and Motion Vector. In Proceedings of the 2006 International Conference on Hybrid Information Technology, Cheju Island, Korea, 9–11 November 2006; Volume 1, pp. 263–269. [Google Scholar]
  53. Elharrouss, O.; Moujahid, D.; Tairi, H. Motion detection based on the combining of the background subtraction and the structure–texture decomposition. Optik-Int. J. Light Electron Opt. 2015, 126, 5992–5997. [Google Scholar] [CrossRef]
  54. Kurylyak, Y. A real-time motion detection for video surveillance system. In Proceedings of the 2009 IEEE International Workshop on Intelligent Data Acquisition and Advanced Computing Systems: Technology and Applications, Rende, Italy, 21–23 November 2009; pp. 386–389. [Google Scholar]
  55. Oh, T.H.; Lee, J.Y.; Kweon, I.S. Real-time motion detection based on discrete cosine transform. In Proceedings of the 2012 19th IEEE International Conference on Image Processing, Orlando, FL, USA, 30 September–3 Octomber 2012; pp. 2381–2384. [Google Scholar]
  56. Rajpurohit, A.; Agarwal, A.; Gaikwad, M.; Garg, K.; Inamdar, V. Securing public places using intelligent motion detection. In Proceedings of the 2012 IEEE International Conference on Engineering Education: Innovative Practices and Future Trends (AICERA), Kottayam, India, 19–21 July 2012; pp. 1–4. [Google Scholar]
  57. Bradski, G.; Kaehler, A. Learning OpenCV: Computer Vision with the OpenCV Library; O’Reilly Media, Inc.: Sebastopol, CA, USA, 2008. [Google Scholar]
  58. Chattopadhyay, P.; Sural, S.; Mukherjee, J. Frontal Gait Recognition From Incomplete Sequences Using RGB-D. IEEE Trans. Inf. Forensics Secur. 2014, 9, 1843–1856. [Google Scholar] [CrossRef]
  59. Dataset, V.V. Virat Data. 2011. Available online: http://www.viratdata.org/ (accessed on 20 December 2019).
  60. Xiph.org. Derf’s Test Media Collection. Available online: https://media.xiph.org/video/derf/ (accessed on 20 December 2019).
  61. Rivest, R.L. A Description of o Single-Chip Implementortion of the RSA Cipher. LAMBDA 1980, Fourth Quarter, 14–18. [Google Scholar]
  62. Zadka, M. Cryptography. In DevOps in Python; Springer: New York, NY, USA, 2019; pp. 95–110. [Google Scholar]
  63. Fall, K.R.; Stevens, W.R. TCP/IP Illustrated, Volume 1: The Protocols; Addison-Wesley: Boston, MA, USA, 2011. [Google Scholar]
  64. Winkler, S.; Mohandas, P. The evolution of video quality measurement: From PSNR to hybrid metrics. IEEE Trans. Broadcasting 2008, 54, 660–668. [Google Scholar] [CrossRef]
  65. Chen, M.J.; Bovik, A.C. Fast structural similarity index algorithm. J. Real-Time Image Process. 2011, 6, 281–287. [Google Scholar] [CrossRef]
  66. Mayache, A.; Eude, T.; Cherfifi, H. A comparison of image quality models and metrics based on human vidual sensitivity. In Proceedings of the International Conference on Image Processing, Chicago, IL, USA, 7 October 1998; pp. 409–413. [Google Scholar]
  67. Avcibas, I.; Sankur, B.; Sayood, K. Statistical evaluation of image quality measures. J. Electron. Imaging 2002, 11, 206–223. [Google Scholar]
  68. Winkler, S. Digital Video Quality: Vision Models and Metrics; Wiley: Hoboken, NJ, USA, 2005. [Google Scholar]
  69. VQEG. Final Report from the Video Quality Experts Group on the Validation of Objective Models of Video Quality Assessment, Phase II. 2004. Available online: www.vqeg.org (accessed on 8 February 2020).
  70. Pinson, M.; Wolf, S. A new standardized method for objectively measuring video quality. IEEE Trans. Broadcasting 2004, 50, 312–322. [Google Scholar] [CrossRef]
  71. Moorthy, A.; Seshadrinathan, K.; Soundarajan, R.; Bovik, A. Wireless video quality assessment: A study of subjective scores and subjective algorithms. IEEE Trans. Circuits Syst. Video Technol. 2010, 20, 513–516. [Google Scholar] [CrossRef]
  72. Wang, Z.; Bavik, A.; Sheik, A.; Simoncelli, E. Image quality assessment: From error visibility to structural similarity. IEEE Trans. Image Process. 2004, 13, 600–612. [Google Scholar] [CrossRef] [PubMed]
  73. Huynh-Thu, Q.; Ghanbari, M. Scope of validity of PSNR in image/video quality assessment. Electron. Lett. 2008, 44, 800–801. [Google Scholar] [CrossRef]
  74. Zhang, F.; Bull, D.R. A parametric framework for video compression using region-based texture models. IEEE J. Sel. Top. Signal Process. 2011, 5, 1378–1392. [Google Scholar] [CrossRef]
  75. Leontaris, A.; Cosman, P.C. Region-of-interest video compression with a composite and a long-term frame. In Proceedings of the Seventh IASTED International Conference Computer Graphics and Imaging, Kauai, HI, USA, 17–19 August 2004. [Google Scholar]

Article Metrics

Citations

Article Access Statistics

Multiple requests from the same IP address are counted as one view.