Article

Analysis of Proteoglycan Content and Biomechanical Properties in Arthritic and Arthritis-Free Menisci

1
G.E.R.N. Tissue Replacement, Regeneration & Neogenesis, Department of Orthopedics and Trauma Surgery, Medical Center—Albert-Ludwigs-University of Freiburg, Faculty of Medicine, Albert-Ludwigs-University of Freiburg, Hugstetterstr. 55, 79106 Freiburg im Breisgau, Germany
2
Schoen Clinic Munich Harlaching, Teaching Hospital of Paracelsus Medical University Salzburg, 5026 Salzburg, Austria
*
Authors to whom correspondence should be addressed.
Appl. Sci. 2020, 10(24), 9012; https://doi.org/10.3390/app10249012
Submission received: 16 November 2020 / Revised: 9 December 2020 / Accepted: 14 December 2020 / Published: 17 December 2020
(This article belongs to the Special Issue Biomechanical and Biomedical Factors of Knee Osteoarthritis)

Abstract

:
Studies on osteoarthritis of the knee have examined isolated aspects of the meniscus biomechanically and histologically, but not the difference between instantaneous modulus (IM) in healthy and diseased samples. The aim of this study is to investigate the difference in the biomechanical behavior and proteoglycan content between arthritic and arthritis-free menisci. In addition, the relationship between the biomechanical behavior and proteoglycan content should be investigated. A novel indentation-based method was used, which allows the mapping of the entire meniscus, without damaging it for histological examinations. A total of 26 arthritic and 14 arthritis-free samples were examined in the present study. A Mach-1 Model V500css test machine was used for biomechanical testing. A position grid was placed over each sample allowing all measurements (indentation test and thickness measurements) to be taken at the same position. All sections were then graded for Safranin O staining intensity for proteoglycan content. The maximum applied load of our arthritic samples above the posterior horn was statistically significantly higher (p = 0.01) at 0.02 ± 0.02 N than the maximum applied load of the arthritis-free samples at 0.01 ± 0.01 N. The proteoglycan content of the meniscus, evaluated by the Safranin O score, correlated statistically significantly with the maximum applied load over the entire meniscus (p = 0.04, 95% CI: 0.06–0.71). The present study showed that in the final stage of gonarthritis, the attenuation behavior of the meniscus was significantly lower compared to the arthritis-free knee. The mapping of IM and histological examination of the meniscus showed a direct correlation between changes in proteoglycan content and altered mechanical properties of the meniscus in gonarthritis.

1. Introduction

In 2018, almost 100,000 arthroscopic procedures on joint cartilage and meniscus and 117,189 total knee replacements (TKR) were performed in Germany. In addition, 14,804 revision procedures were performed [1]. The number of people suffering from osteoarthritis (OA) is increasing every year, with the knee joint being one of the most frequently affected joints [2]. It is assumed that OA will be one of the most frequent causes of restriction of mobility in 2030 [3]. In everyday life, the knee joint is exposed to daily changing mechanical stress. Non-physiological stress can lead to degeneration of the articular cartilage and menisci and, thus, to arthritis. The main function of the menisci is to transmit force to the tibiofemoral joint by increasing the contact surface of the condyles with the joint to almost double the size [4]. The risk of arthritis increases many times over with a meniscectomy [5]. For this reason, attempts are made today to preserve as much of the meniscus as possible, and a meniscectomy is only recommended as a last resort [6].
So far, menisci from animals have been studied, including bovine [7,8,9,10], canine [7], baboon [10] and porcine [7,10]. The biomechanical testing of human menisci was mainly done under confined [7,11] and unconfined conditions [12,13] without differentiating between arthritic and arthritis-free menisci. For these tests, cylinders were punched out. This type of examination of the meniscus does not allow examination of the entire meniscus. In addition, it leads to tissue damage, which makes a later histological examination at the same place of the biomechanical examination impossible. One study has tried to establish a correlation between biomechanics by means of an indentation test and the structural composition of the tissue [14,15]. Patel et al. [16] showed in their review the predominant biomechanical testing methods for cartilage. These testing methods include ramp mechanical tests, stress relaxation tests, creep tests and dynamic tests. Most of these tests are performed under confined and unconfined conditions, which leads to tissue damage. Therefore, biomechanical testing methods, which allow biomechanical testing of the tissue without damaging it for later histological examination, are essential for a better understanding of the biomechanical properties of the meniscus. Mechanical characterization of the viscoelasticity of arthritic menisci compared to arthritis-free menisci, based on a complete indentation mapping test over the entire meniscus with subsequent correlation of the proteoglycan content, has not been published so far.
The aim of this study is to investigate the difference in the biomechanical behavior and proteoglycan content between arthritic and arthritis-free menisci. In addition, the relationship between the biomechanical behavior and proteoglycan content should be investigated. A novel indentation-based method was used, which allows the mapping of the entire meniscus, without damaging it for histological examinations.

2. Materials and Methods

2.1. Material

The mechanical and histological examinations were performed using the tibial plateau with the menisci taken from patients undergoing a TKR and corresponding to a grade 4 OA according to Kellgren and Lawrence [17]. Tissue samples were removed within 24 h postoperatively and then frozen. The arthritis-free samples were obtained from fresh frozen knees of body donors. A total of 26 arthritic samples and 14 arthritis-free samples were used in the present study. After thawing, the samples were directly tested. Therefore, both arthritic samples and arthritis-free samples were only frozen once prior to testing. All samples were handled according to approved institutional ethics committee certificates (ethics vote: 305/10 of the ethics commission of the Albert-Ludwigs-University Freiburg, Freiburg im Breisgau, Germany).

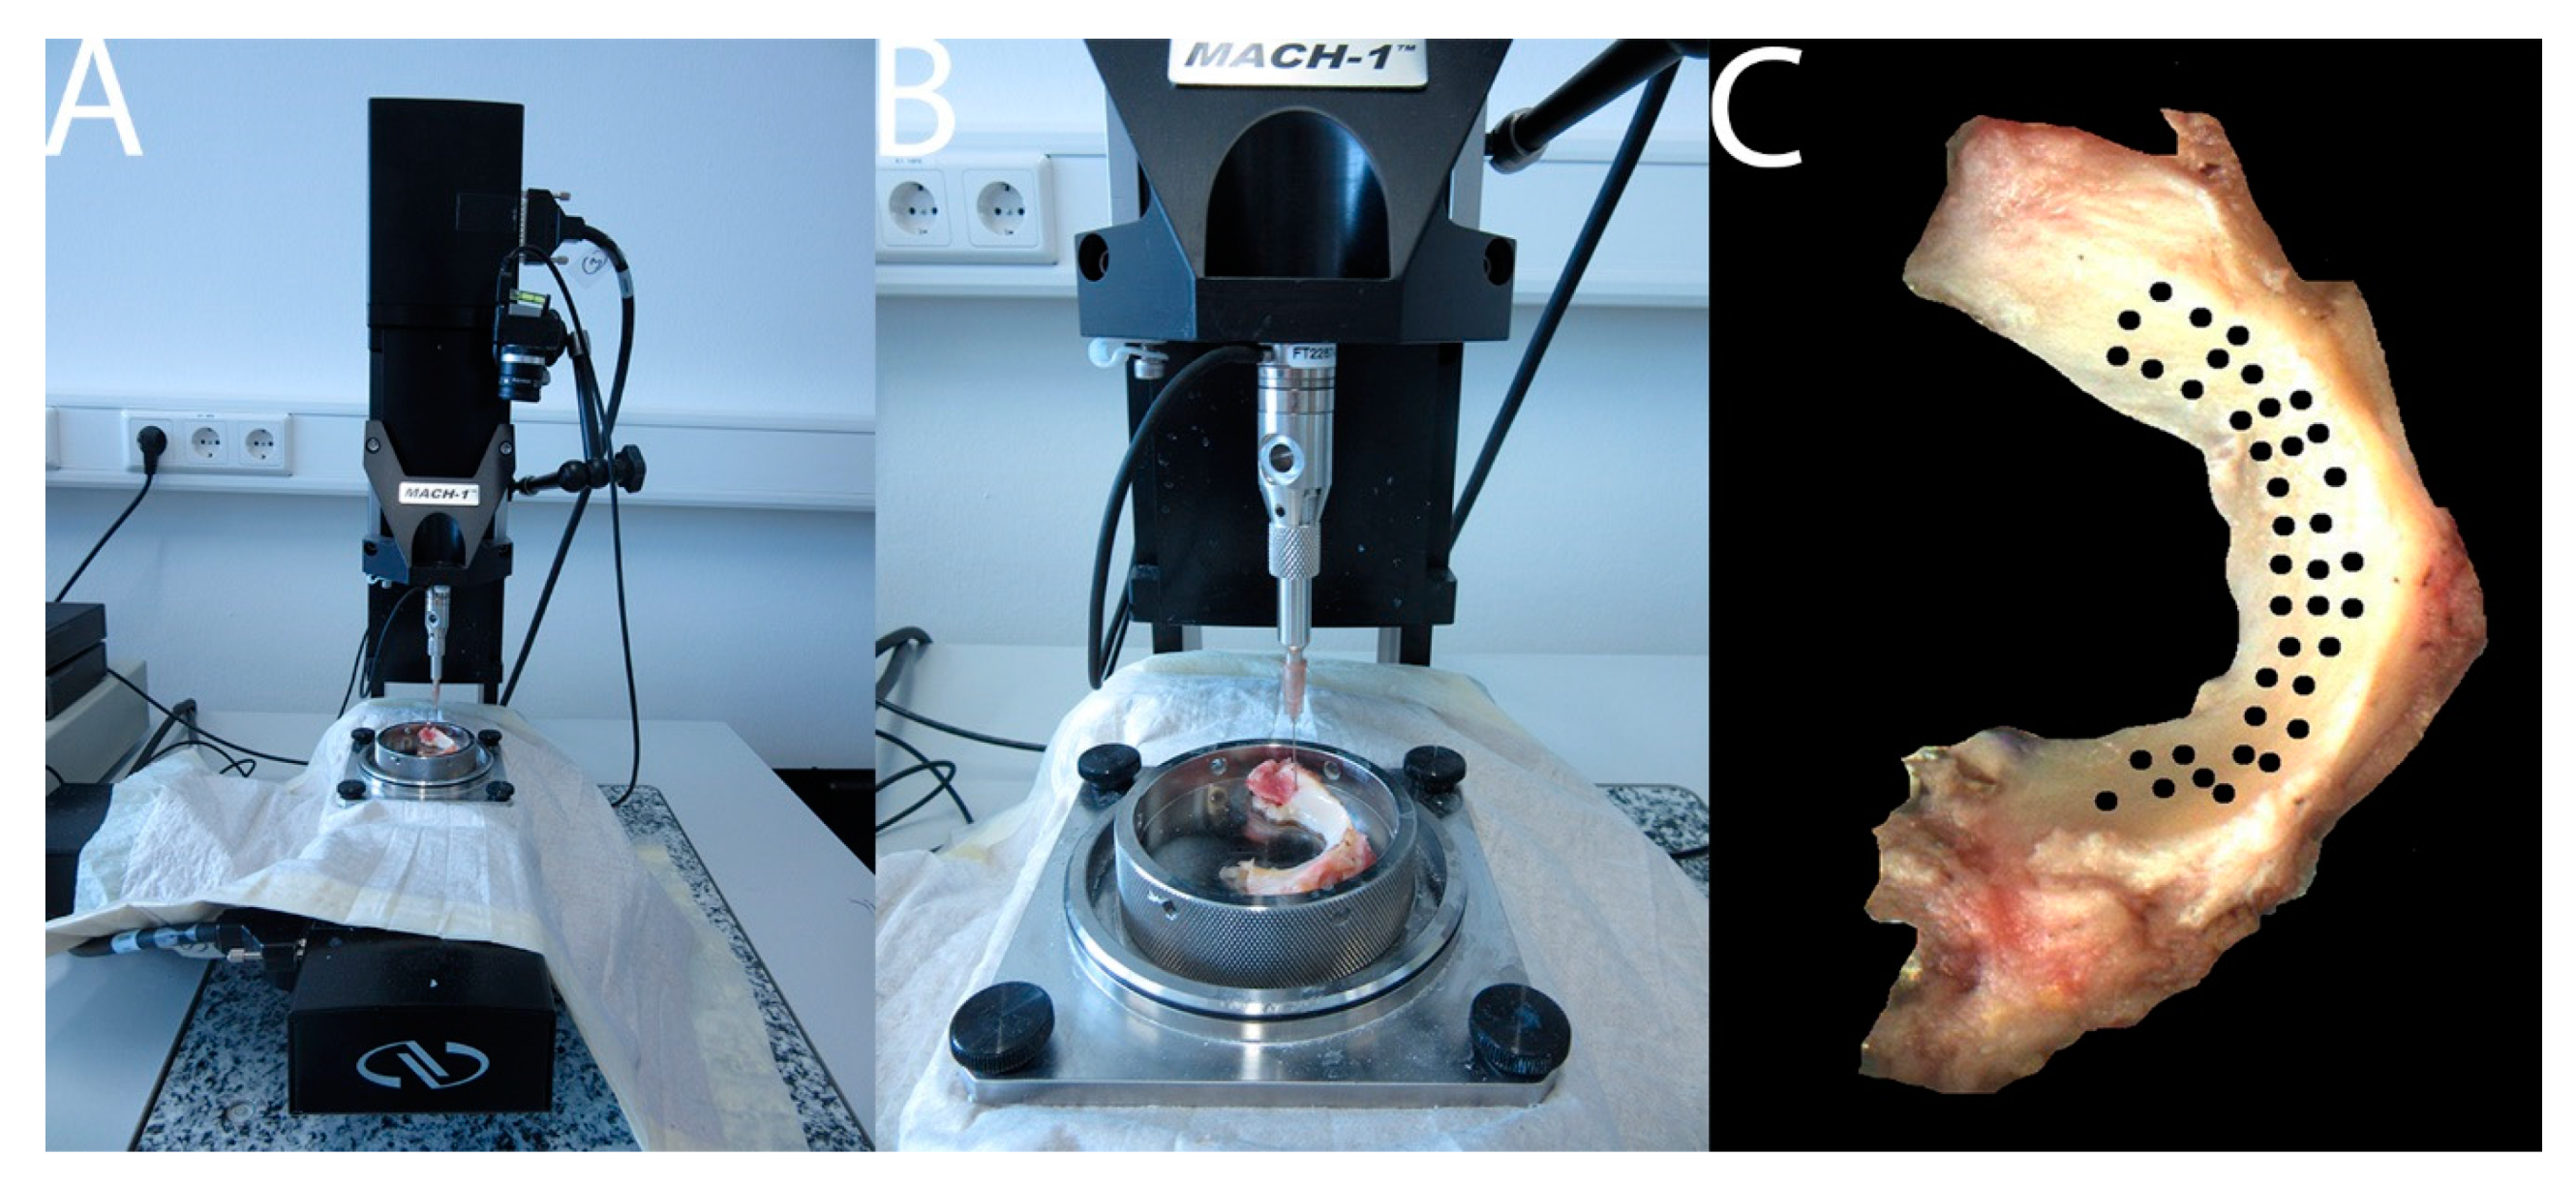
2.2. Mechanical Examinations

The following description of the biomechanical measurement methods is based on Pordzik et al. [18]. The menisci were first subjected to the indentation test [19,20] (DIN EN ISO 14577); then, the thickness was measured using the needle-measuring method [21].

2.2.1. Indentation Testings

The mechanical characterization of the menisci was carried out by means of automated mapping [22] based on indentation tests (DIN EN ISO 14577) [19,20]. A Mach-1 Model V500css test device (Biomomentum Inc., Montreal, QC, Canada), a multiaxial load cell with 17 N Model MA 233 (ATI industrial Automation, Apex, NC, USA) and Newport Motion Controller ESP 301 (Newport, Irvine, CA, USA) were used. The tests were displacement-controlled. This testing machine enables the examination of soft tissue. Based on Hayes [23], the resulting modulus is the instantaneous modulus (IM). IM, thickness and maximum load of the tissue were examined [22,24]. The maximum applied load was defined as the highest load registered by the load cell per measuring point. The menisci were fixed on to the MA646 specimen holder (Biomomentum Inc., Montreal, QC, Canada) by Loctide (Henkel AG & Company KGaA, Duesseldorf Germany) according to physiological circumstances and were then anchored in the testing device. The adhesive triggered no mechanical or structural changes in the meniscus and could be removed without leaving any residue after the measurements. After the samples were fixed in the testing machine, the measuring points were determined. For this purpose, each mounted meniscus was photographed with an HD camera (Biomomentum Inc., Montreal, QC, Canada). In the Mach-1 Analysis Software Version 4.1.0.17 (Biomomentum Inc., Montreal, QC, Canada), a position grid adapted to every meniscus could be projected on to the images. The position grid was created for each meniscus depending on its shape and size. The indentation test was then carried out by testing every determined point with the Mach-1 Motion Software 4.3.1.8 (Biomomentum Inc., Montreal, QC, Canada) using a spherical indenter MA680 (Biomomentum Inc., Montreal, QC, Canada) of 1 mm diameter. In contrast to previous studies, the entire menisci were examined. When testing the meniscus, an average of 45 measuring points was created in the position grid, comparable to Sim et al. [22] and Seidenstuecker et al. [25] (see Figure 1).
The testing parameters were chosen within the range of previous performed indentation tests [18,22,25]. The following criteria to test the meniscus were used: Poisson ratio: 0.5 [26], contact criterion: 0.1 N, indentation amplitude: 0.2 mm, indentation velocity: 0.2 mm/s and relaxation time: 10 s. NaCl 0.9% was used to prevent tissue dehydration during the measurements. Forces exceeding 5 N have been defined as the abort criterion to ensure the load cell was not damaged.

2.2.2. Thickness Measurement

The indentation test was followed by a thickness measurement via the needle technique [21] at exactly the same points as the indentation testing. A cannula size 18 (B.Braun, Melsungen, Germany) was placed on the indenter as shown in Figure 1. The following parameters were input into the Mach-1 Motion Software: stop criterion: 5 N, stage velocity: 0.5 mm/s and needle repositioning: 2x load resolution. The cannula was oriented perpendicular to the sample according to physiological circumstances and moved in the direction of the sample at a constant speed. This movement was stopped as soon as the cannula reached the metal below the meniscus. The thickness mapping used the same measuring grid as the automated indentation mapping, in order to get the thickness information on the exact same positions on the meniscus (see Figure 1).

2.2.3. Evaluation of Biomechanical Results

The data were evaluated according to Sim et al. [22] and Seidenstuecker et al. [25]. The thickness was calculated as the difference between the first point of the cannula’s contact with the tissue (red arrow in Figure 2) and the point of transfer (blue arrow in Figure 2) at which the load cell perceives a load against the stop criterion (stop criterion = 5 N).
The instantaneous modulus was evaluated at each measuring position according to Hayes [23] using the following equation:
I M = P H   ·   1 v 2 2 a k   ·   ( a h   v )
IM = instantaneous modulus; p = load; H = depth of indentation; a = radius of the contact region; ν = Poisson’s ratio (=0.5); k = correction factor dependent on a/h and ν; and h = sample thickness.

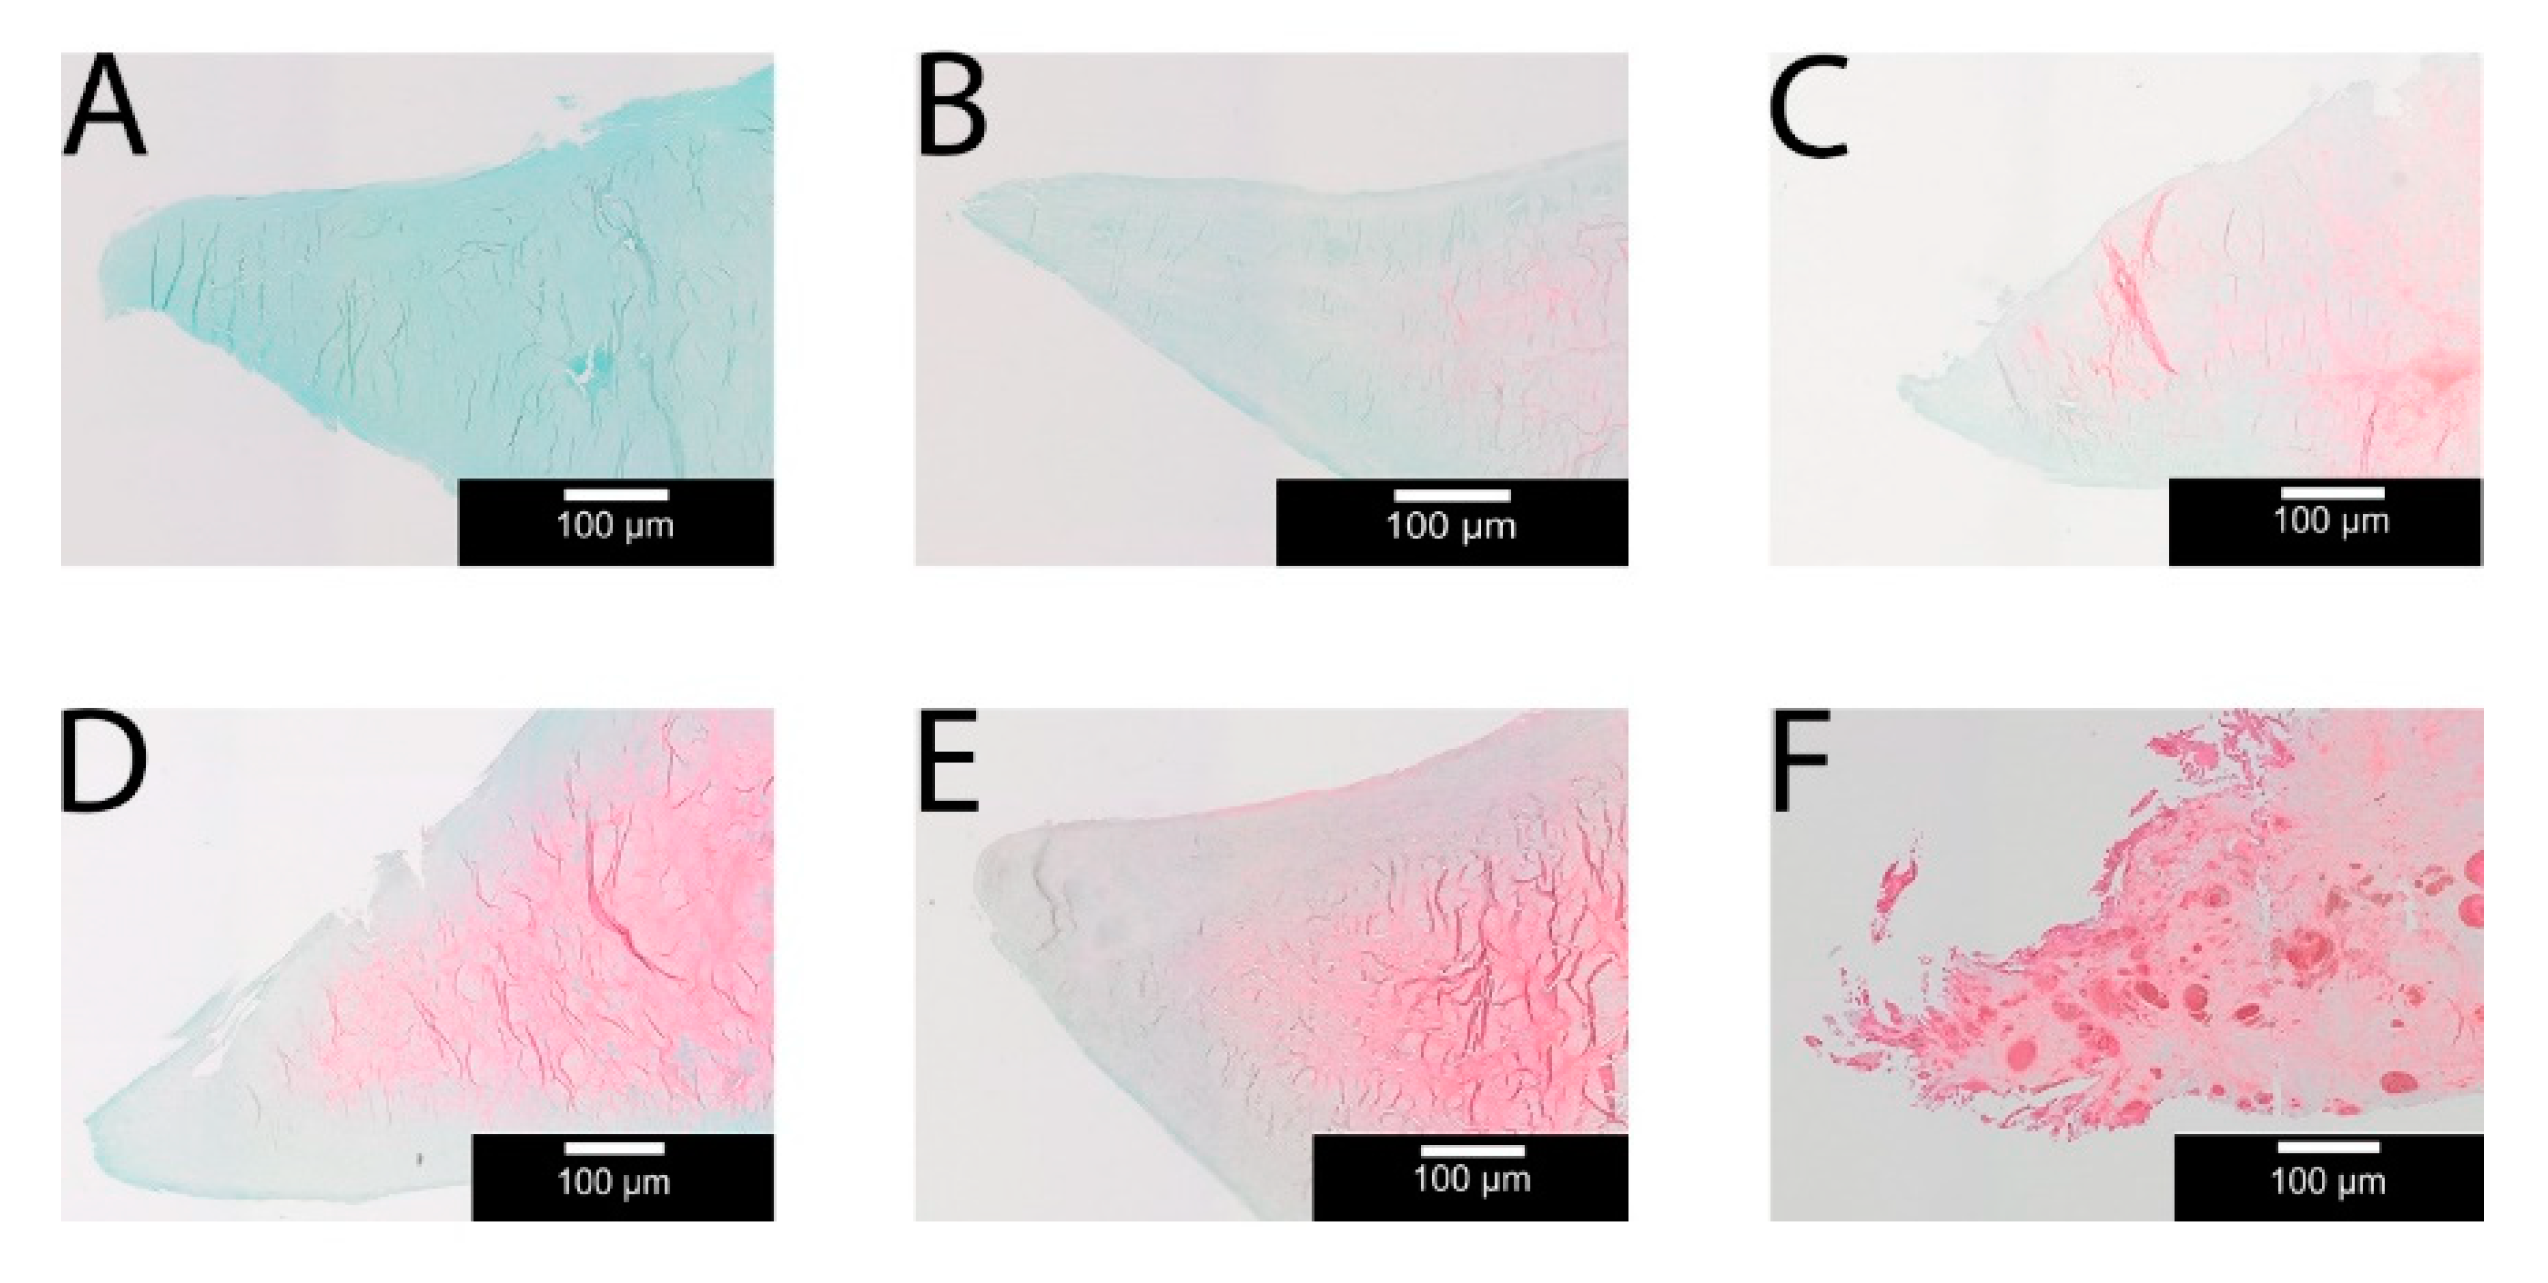
2.3. Histological Examination and Evaluation

After the mechanical tests, the menisci were cut into the following sections: anterior horn, middle section and posterior horn (see Figure 3). Two samples were taken from each section, one for transversal and the other one for longitudinal thin sections. The samples were fixed overnight in 4% formaldehyde solution and then dehydrated. The samples were embedded in paraffin so that both transverse and longitudinal sections could then be made per third. Using a Leica RM2255 rotational microtome (Leica Biosystems, Wetzlar, Germany), two 4 µm thin sections were made per specimen.
The Safranin O (SO) staining was carried out according to Romeis [27] for the proteoglycan content [28]. For SO staining, the following steps were used: dewaxing in xylene (Fisher-Chemical, Schwerte, Germany) (3 × 10 min); hydration in a descending ethanol series (SAV-LIQUID PRODUCTION GMBH, Flintsbach, Germany) (10 min each); actual dyeing; and dehydration in an ascending ethanol series (briefly impregnated 10 times) and xylene (2 × 5 min).
The evaluation of the SO stained sections was based on Sun et al. [28] in two longitudinal and two transverse sections per meniscus [29]. Each section was divided into an inner, middle and outer third, and each third was histologically evaluated [29]. The samples were examined with a Bx53 light microscope (Olympus, Shinjuku, Japan) equipped with an automated scanning table “SCAN 130 × 85” (Maerzhaeuser Wetzlar GmbH & Co KG, Wetzlar, Germany). The Olympus Stream Motion software version 1.9.4. allowed the recording of the entire cross-section. For this purpose, individual images were combined to form a high-resolution overview image.
The SO sections were assessed according to the SO dyeing intensity. The SO sections were evaluated according to Sun et al. [28] using the following grading scale: Grade 0: no SO staining; Grade 1 minimal SO staining; Grade 2: very weak SO staining; Grade 3: weak SO staining; Grade 4: strong SO staining; and Grade 5: very strong SO staining. The degree of staining thus allowed conclusions to be drawn about the proteoglycan content, with the higher the grading, the higher the proteoglycan content.

2.4. Statistics

The mechanical measurement data were evaluated with the Mach-1 Analysis Software Version 4.1.0.17 (Biomomentum, Montreal, QC, Canada), Origin 2018 Professional (Origin Lab, Northampton, MA, USA) and SPSS 25 (IBM, Armonk, NY, USA). All mechanical results were expressed as mean value with standard deviation (SD). Due to the small number of samples, it can be assumed that the data were not normally distributed. Samples were compared using the Mann–Whitney U test. From both the transverse and longitudinal sections, the medians for each third and medians for all sections of a staining were calculated. Since each section was divided into thirds again, this resulted in 12 score points per third of the meniscus and 36 score points for the entire meniscus. All histological results were expressed as medians. Independent samples were tested using the Mann–Whitney U Test. Correlations between mechanical and histological results were calculated according to Spearman. Bootstrapping was performed to get bias corrected and accelerated (BCa) 95 % confidence interval (CI). Bootstrapped results were based on 1000 bootstrap samples. Results with p < 0.05 were considered statistically significant. The SD was hypothesized with 0.06 MPa. To reach an alpha error level of 5%, at least 11 samples of each (specimen and control) were necessary. The online sample size and power calculator www.dssresearch.com were used. The calculated power for two different samples and two-tailed test with a difference of IM with 0.1 MPa, 26 arthritic samples and 14 arthritis-free samples, SD of 0.06 each, and alpha error level of 5% was calculated to be 99.9%.

3. Results

3.1. Sample Details

The average age of the patients and their menisci was 71.6 ± 6.7. A total of 19 arthritic samples were taken from female patients and 7 arthritic samples from male patients; 8 medial and 18 lateral menisci were tested. A total of 7 medial and 7 lateral menisci were available as arthritis-free samples.

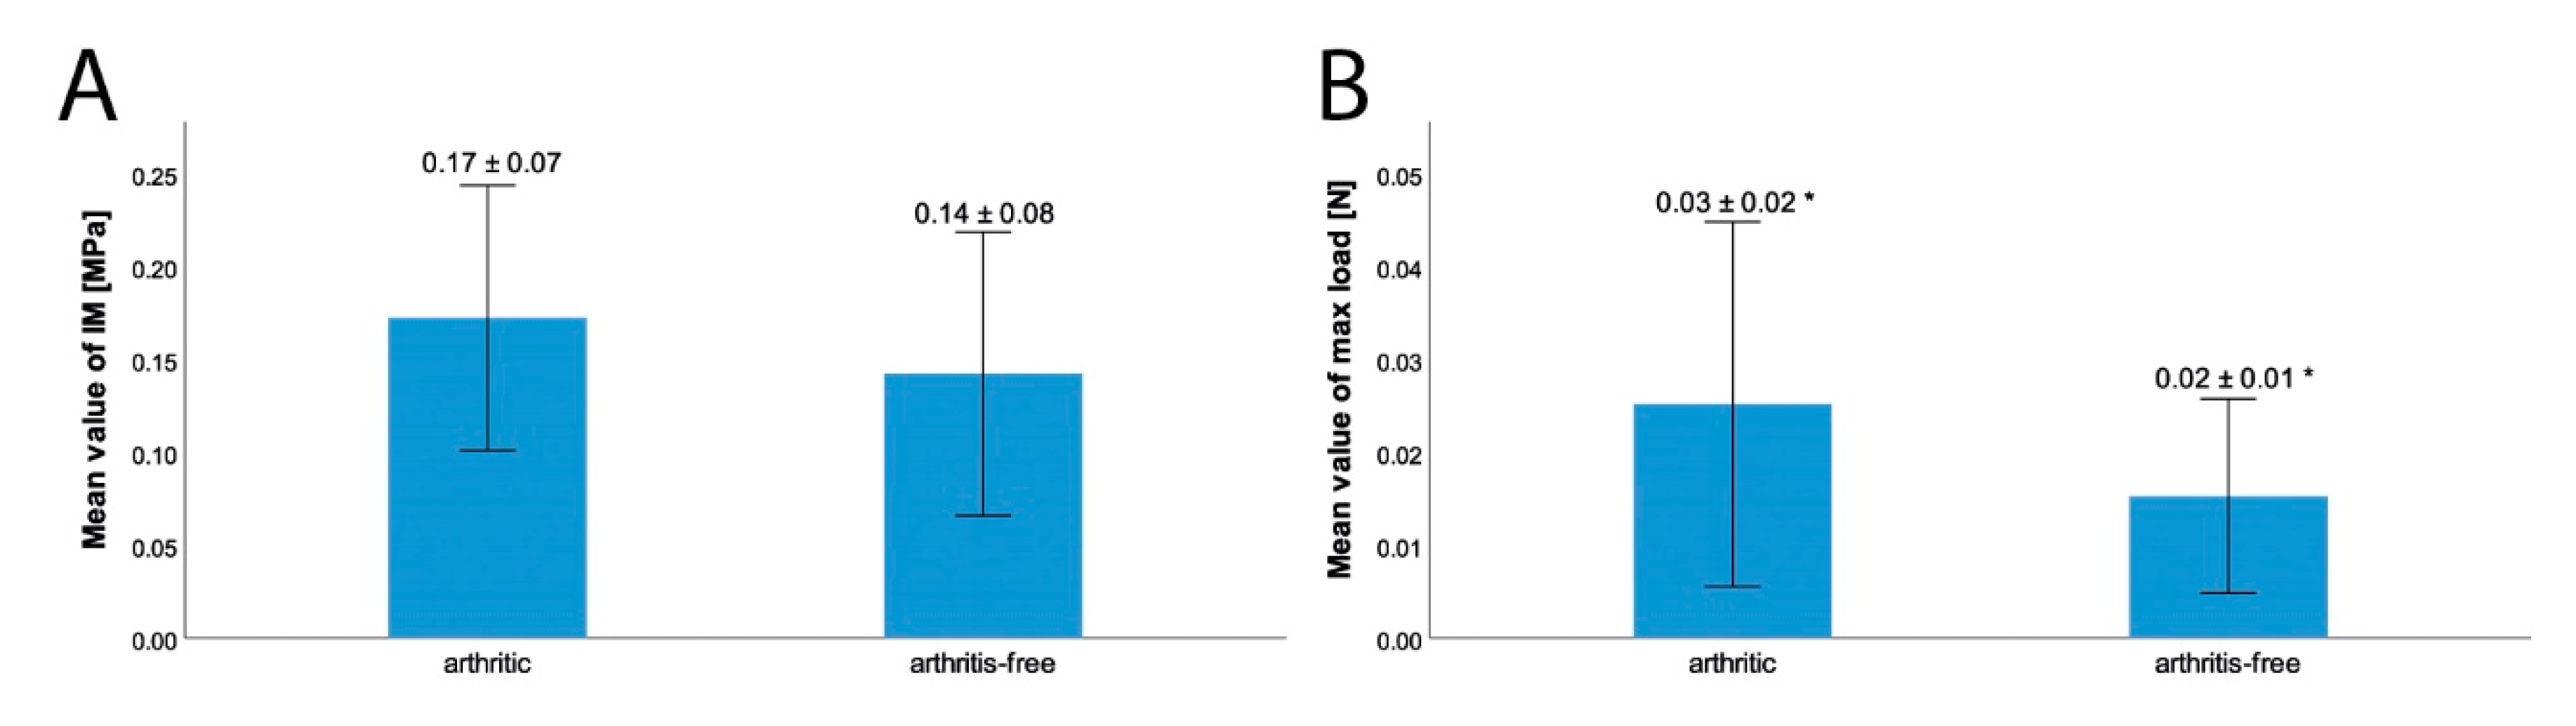
3.2. Biomechanical Results of the Meniscus

Figure 4 shows an example of IM mapping of arthritic and arthritis-free samples. The IM of the posterior horn of arthritic samples was 0.17 ± 0.1 MPa; the IM of arthritis-free samples was 0.12 ± 0.07 MPa. Although the difference in IM between the posterior horns was not statistically significant (p = 0.06), the difference in the maximum applied load was statistically significant (p = 0.01). The arthritic samples showed a maximum applied load (not to confound with the maximum load limit of 5 N for the abort criterion) of 0.02 ± 0.02 N, and the arthritis-free samples were 0.01 ± 0.01 N (see Figure 5). In relation to the arthritis-free samples, a 100% higher force was required to indent the arthritic samples to an equal depth (200 µm).
The IM, measured over the entire meniscus, was greater in the arthritic menisci with 0.17 ± 0.07 MPa than in the arthritis-free menisci with a value of 0.14 ± 0.08 MPa. Even if this difference was not statistically significant (p = 0.18), the difference in the maximum applied load over the entire meniscus was statistically significant (p = 0.02). The maximum applied load over the entire meniscus tissue was greater in the arthritic samples with 0.03 ± 0.02 N than in the arthritis-free samples with 0.02 ± 0.01 N (see Figure 6). In relation to the arthritis-free samples, a 50% higher force was required to indent the arthritic samples to an equal depth (200 µm).

3.3. Proteoglycan Content

Throughout the entire meniscus tissue, the median of the SO score (see Figure 7) in the arthritic samples with a score of 3 was statistically significantly higher than the median of the arthritis-free samples with a score of 1 (p < 0.001). Figure 8 shows the percent distribution of the evaluated SO sections over the score points.

3.4. Correlation between Biomechanical Behavior and Proteoglycan Content

Next, we evaluated if the proteoglycan content of the posterior horn, as determined by the SO score, correlated with our biomechanical results (see Figure 9). The proteoglycan content correlated with the IM (p = 0.04), and at a correlation coefficient of 0.33 (BCa 95 % CI: 0.03–0.58). Furthermore, the proteoglycan content correlated with the maximum applied load (p = 0.04) and a correlation coefficient of 0.33 (BCa 95% CI: 0.06–0.54). Similarly, the entire meniscus tissue also showed that the proteoglycan content correlated with a correlation coefficient of 0.33 (BCa 95% CI: −0.05–0.66) with the IM (p = 0.04) and with a correlation coefficient of 0.42 (BCa 95% CI: 0.06–0.71) with the maximum load (p = 0.01).

4. Discussion

4.1. Mechanical Properties

Studies comparing the mechanical properties between arthritic menisci and arthritis-free menisci are largely lacking. The confined and unconfined compression tests can only examine individual points of menisci. In addition, when the tissue is punched out, it is largely destroyed [10,11,13]. Danso et al. [14] performed an indentation test of the meniscus which did not damage the integrity of the tissue. However, only three points were measured per meniscus, and therefore, a complete mapping of the biomechanical properties is missing. Previous studies could show that a complete mapping of biomechanical properties of articular cartilage [22,25] and menisci [18] using indentation tests is possible. In the present study, we used an indentation test which allows a complete testing over the entire meniscus without leaving damage to the tissue.
Using this method, we showed that there was a tendency for a greater tissue stiffening in the arthritic menisci, which was mainly apparent from the statistically significant difference in the maximum applied load between the two groups (with p < 0.05). Although the difference does not seem to be large at 0.01 N, it should be noted that this does not correspond to the surface load over the entire meniscus. These data represent the average value of the measured points with a diameter of the indenter of 1 mm. The maximum applied load to the arthritic menisci was 33% greater than that applied to the arthritis-free menisci. In other words, this means that although arthritic menisci can withstand a third-higher load or require a 33% greater force for a comparable deformation to the nonarthritic menisci, they also lose 33% of their damping properties. The findings of this study that the stiffness of the meniscus is increasing under OA support previous studies. Schwer et al. [30] could show that the axial compressive strains in menisci and meniscal root attachments significantly increased in severely degenerated knee joints compared with mildly degenerated knees. Kowk et al. [31] observed increasing mechanical properties of the meniscus’ extracellular matrix under OA.
Especially the posterior horn is affected by OA. The maximum applied load on the posterior horn of the arthritic menisci was twice as high as the arthritis-free menisci. The damping behavior was so reduced by half. This can be explained by the special type of rolling sliding movement in the knee joint [4]. This movement is caused by an increased mechanical load on the posterior horn of the meniscus, of which the posterior horn of the medial meniscus is most affected [32]. A study investigating the load distribution in medial menisci concluded that the posterior horn bears the highest percentage of shear stress [33]. Furthermore, the findings of Warnecke et al. [34] suggest that the degenerative processes initially occur in the posterior horn. Under increased stress, stiffness seems to worsen in the particularly stressed regions of the meniscus, i.e., the posterior horn.

4.2. Proteoglycan Content

The statistically significant difference observed in the SO sections and thus in proteoglycan content also reinforces the observation made in previous studies showing an increased proteoglycan content in OA. Thus, Sun et al. [28] and Kwok et al. [31] observed increased proteoglycan content under arthritis via the SO staining technique. Peters et al. [35] also detected increased proteoglycan content in meniscus sections with degenerative tears. Herwig et al. [36] observed increased proteoglycan content depending on the severity of meniscus degeneration, and Gosh et al. [37] identified elevated proteoglycan content in menisci under gonarthritis, but not under rheumatoid arthritis. In this respect, all our evidence supports the results of previous studies, even if Warnecke et al. [34] described a tendency for a reduction of proteoglycan content under degeneration.

4.3. Influence of Structural Changes on Mechanical Properties

The proteoglycan content of the meniscus tissue between our arthritis-free samples and the arthritic samples statistically significantly correlated with the IM. Two other studies, Bursac P. et al. [13] and Danso et al. [15], also described a rise in the meniscus’ compression modulus under increased glycosaminoglycan content. Furthermore, Kwok et al. [31] described an increasing stiffness of the meniscus under an increasing proteoglycan content. The same was observed in the present work. This observation is attributable to the increased water accumulation within the meniscus due to excessive proteoglycan content in the degenerated meniscus [36]. Proteoglycans are proteins with glycosaminoglycan chains covalently bound to them [38]. Glycosaminoglycans are long polysaccharide chains that are negatively charged and as such have a polyanionic character. These anions cause the attraction of cations into the tissue, and then water follows the osmotic gradient [38,39]. The water thus stored fulfills mechanical tasks as a noncompressible substance [38] and gives the tissue a certain compression stiffness [39]. The stimulation of proteoglycan synthesis is often discussed as a treatment for arthritis [40]. This study encourages critical consideration of such therapies, as the level of proteoglycan in the meniscus and articular cartilage is diametrically opposed. Such therapies, if they are not limited to the articular cartilage, could negatively influence the biomechanical properties of the meniscus.

4.4. Weakness of the Study

One of the weaknesses of our study is that our arthritis-free samples were of the same age as the arthritic samples. We therefore cannot rule out age-related damage to the control group’s menisci, which can affect the mechanical behavior. Further, the number of arthritic samples from the arthritis group and from the arthritis-free samples differed. Laboratory studies are not entirely comparable with in vivo conditions. Patients’ demographics, which could be a potential source of bias, are missing due to the European general data protection regulation such as weight, height and BMI. However, a study [41] could show that there was no statistically significant relationship between weight, BMI and meniscal parameters.

5. Conclusions

This study is the first to examine the mechanical characterization of the viscoelasticity of arthritic menisci compared to arthritis-free menisci based on a complete indentation mapping test over the entire meniscus with subsequent correlation of the proteoglycan content. In contrast to most of the previous studies [7,11,12,13,34], a method for nondestructive automatic mapping of the biomechanical properties over the entire meniscus was performed.
The investigations showed that in the final stage of gonarthritis, the attenuation behavior of the meniscus was lower compared to the arthritis-free knee (up to 50% with respect to the posterior horn). This nondestructive automatic mapping method of the biomechanical properties of menisci showed that the posterior horn was in particular affected.
The mapping of IM and histological examination of the meniscus showed a direct correlation between changes in proteoglycan content and altered mechanical properties of the meniscus under gonarthritis. This study showed that the stiffness of the meniscus under OA is increasing under increasing proteoglycan content.

Author Contributions

Conceptualization, H.O.M., M.S., H.S. and A.B.; methodology, H.O.M., M.S., H.S., A.B. and J.P.; investigation, J.P., M.S., S.H.L. and A.M.; resources, A.B., H.S. and H.O.M.; data curation, J.P. and M.S.; writing—original draft preparation, J.P. and M.S.; funding acquisition, H.O.M., M.S., H.S. and A.B. All authors have read and agreed to the published version of the manuscript.

Funding

The project was financially supported by Alwin Jäger Foundation. The article processing charge was funded by the Baden-Wuerttemberg Ministry of Science, Research and Art and the University of Freiburg in the funding program Open Access Publishing.

Acknowledgments

The authors would like to thank Arthrex for providing the controls and Melanie L. Hart for proofreading.

Conflicts of Interest

The authors declare no conflict of interest.

References

  1. Destatis. Gesundheit—Fallpauschalenbezogene Krankenhausstatistik (DRG-Statistik) Operationen und Prozeduren der Vollstationären Patientinnen und Patienten in Krankenhäusern (4-Steller); Statistisches Bundesamt (Destatis): Wiesbadem, Germany, 2019; p. 78. [Google Scholar]
  2. Schiphof, D.; van den Driest, J.J.; Runhaar, J. Osteoarthritis year in review 2017: Rehabilitation and outcomes. Osteoarthr. Cartil. 2018. [Google Scholar] [CrossRef] [PubMed] [Green Version]
  3. Thomas, E.; Peat, G.; Croft, P. Defining and Mapping the Person with Osteoarthritis for Population Studies and Public Health. Rheumatology 2014, 53, 338–345. [Google Scholar] [CrossRef] [PubMed] [Green Version]
  4. Kummer, B. Biomechanik: Form und Funktion des Bewegungsapparates; mit 3 Tabellen; Dt. Ärzte-Verl.: Köln, Germany, 2005; Available online: https://www.aerzteblatt.de/archiv/50795/Biomechanik-Form-und-Funktion-des-Bewegungsapparates (accessed on 14 December 2020).
  5. Mezhov, V.; Teichtahl, A.J.; Strasser, R.; Wluka, A.E.; Cicuttini, F.M. Meniscal pathology—The evidence for treatment. Arthritis Res. Ther. 2014, 16, 206. [Google Scholar] [CrossRef] [PubMed] [Green Version]
  6. Noyes, F.R.; Barber-Westin, S.D. Repair of complex and avascular meniscal tears and meniscal transplantation. J. Bone Jt. Surg. Am. Vol. 2010, 92, 1012–1029. [Google Scholar]
  7. Joshi, M.D.; Suh, J.K.; Marui, T.; Woo, S.L. Interspecies variation of compressive biomechanical properties of the meniscus. J. Biomed. Mater. Res. 1995, 29, 823–828. [Google Scholar] [CrossRef]
  8. Fithian, D.C.; Kelly, M.A.; Mow, V.C. Material Properties and Structure-Function Relationships in the Menisci. Clin. Orthop. Relat. Res. 1990, 252, 19–31. [Google Scholar] [CrossRef]
  9. Proctor, C.S.; Schmidt, M.B.; Whipple, R.R.; Kelly, M.A.; Mow, V.C. Material properties of the normal medial bovine meniscus. J. Orthop. Res. 1989, 7, 771–782. [Google Scholar] [CrossRef]
  10. Sweigart, M.A.; Zhu, C.F.; Burt, D.M.; DeHoll, P.D.; Agrawal, C.M.; Clanton, T.O.; Athanasiou, K.A. Intraspecies and interspecies comparison of the compressive properties of the medial meniscus. Ann. Biomed. Eng. 2004, 32, 1569–1579. [Google Scholar] [CrossRef]
  11. Seitz, A.M.; Galbusera, F.; Krais, C.; Ignatius, A.; Durselen, L. Stress-relaxation response of human menisci under confined compression conditions. J. Mech. Behav. Biomed. Mater. 2013, 26, 68–80. [Google Scholar] [CrossRef]
  12. Chia, H.N.; Hull, M.L. Compressive moduli of the human medial meniscus in the axial and radial directions at equilibrium and at a physiological strain rate. J. Orthop. Res. Off. Publ. Orthop. Res. Soc. 2008, 26, 951–956. [Google Scholar] [CrossRef]
  13. Bursac, P.; Arnoczky, S.; York, A. Dynamic compressive behavior of human meniscus correlates with its extra-cellular matrix composition. Biorheology 2009, 46, 227–237. [Google Scholar] [CrossRef] [PubMed]
  14. Danso, E.K.; Makela, J.T.; Tanska, P.; Mononen, M.E.; Honkanen, J.T.; Jurvelin, J.S.; Toyras, J.; Julkunen, P.; Korhonen, R.K. Characterization of site-specific biomechanical properties of human meniscus-Importance of collagen and fluid on mechanical nonlinearities. J. Biomech. 2015, 48, 1499–1507. [Google Scholar] [CrossRef] [PubMed]
  15. Danso, E.K.; Oinas, J.M.T.; Saarakkala, S.; Mikkonen, S.; Toyras, J.; Korhonen, R.K. Structure-function relationships of human meniscus. J. Mech. Behav. Biomed. Mater. 2017, 67, 51–60. [Google Scholar] [CrossRef] [PubMed]
  16. Patel, J.M.; Wise, B.C.; Bonnevie, E.D.; Mauck, R.L. A Systematic Review and Guide to Mechanical Testing for Articular Cartilage Tissue Engineering. Tissue Eng. Part C Methods 2019, 25, 593–608. [Google Scholar] [CrossRef]
  17. Kellgren, J.H.; Lawrence, J.S. Radiological assessment of osteo-arthrosis. Ann. Rheum. Dis. 1957, 16, 494–502. [Google Scholar] [CrossRef] [Green Version]
  18. Pordzik, J.; Bernstein, A.; Watrinet, J.; Mayr, H.O.; Latorre, S.H.; Schmal, H.; Seidenstuecker, M. Correlation of Biomechanical Alterations under Gonarthritis between Overlying Menisci and Articular Cartilage. Appl. Sci. 2020, 10, 8673. [Google Scholar] [CrossRef]
  19. Abedian, R.; Willbold, E.; Becher, C.; Hurschler, C. In vitro electro-mechanical characterization of human knee articular cartilage of different degeneration levels: A comparison with ICRS and Mankin scores. J. Biomech. 2013, 46, 1328–1334. [Google Scholar] [CrossRef]
  20. McKee, C.T.; Last, J.A.; Russell, P.; Murphy, C.J. Indentation versus tensile measurements of Young’s modulus for soft biological tissues. Tissue Eng. Part B Rev. 2011, 17, 155–164. [Google Scholar] [CrossRef] [Green Version]
  21. Jurvelin, J.S.; Räsänen, T.; Kolmonens, P.; Lyyra, T. Comparison of optical, needle probe and ultrasonic techniques for the measurement of articular cartilage thickness. J Biomech. 1995, 28, 231–235. [Google Scholar] [CrossRef]
  22. Sim, S.; Chevrier, A.; Garon, M.; Quenneville, E.; Lavigne, P.; Yaroshinsky, A.; Hoemann, C.D.; Buschmann, M.D. Electromechanical probe and automated indentation maps are sensitive techniques in assessing early degenerated human articular cartilage. J. Orthop. Res. 2017, 35, 858–867. [Google Scholar] [CrossRef] [Green Version]
  23. Hayes, W.C.; Keer, L.M.; Herrmann, G.; Mockros, L.F. A mathematical analysis for indentation tests of articular cartilage. J. Biomech. 1972, 5, 541–551. [Google Scholar] [CrossRef]
  24. Zhou, Y.; Tang, Y.; Hoff, T.; Garon, M.; Zhao, F.Y. The Verification of the Mechanical Properties of Binder Jetting Manufactured Parts by Instrumented Indentation Testing. Procedia Manuf. 2015, 1, 327–342. [Google Scholar] [CrossRef] [Green Version]
  25. Seidenstuecker, M.; Watrinet, J.; Bernstein, A.; Suedkamp, N.P.; Latorre, S.H.; Maks, A.; Mayr, H.O. Viscoelasticity and histology of the human cartilage in healthy and degenerated conditions of the knee. J. Orthop. Surg. Res. 2019, 14, 256. [Google Scholar] [CrossRef] [PubMed] [Green Version]
  26. Jin, H.; Lewis, J.L. Determination of Poisson’s ratio of articular cartilage by indentation using different-sized indenters. J. Biomech. Eng. 2004, 126, 138–145. [Google Scholar] [CrossRef]
  27. Mulisch, M.; Welsch, U.; Romeis, B.; Aescht, E. Romeis Mikroskopische Technik, 19. Auflage; Springer: Berlin/Heidelberg, Germany, 2015; Available online: https://link.springer.com/book/10.1007/978-3-642-55190-1 (accessed on 14 December 2020).
  28. Sun, Y.; Mauerhan, D.R.; Kneisl, J.S.; Norton, H.J.; Zinchenko, N.; Ingram, J.; Hanley, E.N., Jr.; Gruber, H.E. Histological examination of collagen and proteoglycan changes in osteoarthritic menisci. Open Rheumatol. J. 2012, 6, 24–32. [Google Scholar] [CrossRef] [Green Version]
  29. Meister, K.; Indelicato, P.A.; Spanier, S.; Franklin, J.; Batts, J. Histology of the torn meniscus: A comparison of histologic differences in meniscal tissue between tears in anterior cruciate ligament-intact and anterior cruciate ligament-deficient knees. Am. J. Sports Med. 2004, 32, 1479–1483. [Google Scholar] [CrossRef]
  30. Schwer, J.; Rahman, M.M.; Stumpf, K.; Rasche, V.; Ignatius, A.; Durselen, L.; Seitz, A.M. Degeneration Affects Three-Dimensional Strains in Human Menisci: In situ MRI Acquisition Combined with Image Registration. Front. Bioeng. Biotechnol. 2020, 8, 582055. [Google Scholar] [CrossRef]
  31. Kwok, J.; Grogan, S.; Meckes, B.; Arce, F.; Lal, R.; D’Lima, D. Atomic force microscopy reveals age-dependent changes in nanomechanical properties of the extracellular matrix of native human menisci: Implications for joint degeneration and osteoarthritis. Nanomed. Nanotechnol. Biol. Med. 2014, 10, 1777–1785. [Google Scholar] [CrossRef] [Green Version]
  32. Lee, D.H.; Lee, B.S.; Kim, J.M.; Yang, K.S.; Cha, E.J.; Park, J.H.; Bin, S.I. Predictors of degenerative medial meniscus extrusion: Radial component and knee osteoarthritis. Knee Surg. Sports Traumatol. Arthrosc. Off. J. ESSKA 2011, 19, 222–229. [Google Scholar] [CrossRef]
  33. Walker, P.S.; Arno, S.; Bell, C.; Salvadore, G.; Borukhov, I.; Oh, C. Function of the medial meniscus in force transmission and stability. J. Biomech. 2015, 48, 1383–1388. [Google Scholar] [CrossRef]
  34. Warnecke, D.; Balko, J.; Haas, J.; Bieger, R.; Leucht, F.; Wolf, N.; Schild, N.; Stein, S.; Seitz, A.; Ignatius, A.; et al. Degeneration alters the biomechanical properties and structural composition of lateral human menisci. Osteoarthr. Cartil. 2020. [Google Scholar] [CrossRef] [PubMed]
  35. Peters, T.J.; Smillie, I.S. Studies on the chemical composition of the menisci of the knee joint with special reference to the horizontal cleavage lesion. Clin. Orthop. Relat. Res. 1972, 86, 245–252. [Google Scholar] [CrossRef] [PubMed]
  36. Herwig, J.; Egner, E.; Buddecke, E. Chemical changes of human knee joint menisci in various stages of degeneration. Ann. Rheum. Dis. 1984, 43, 635–640. [Google Scholar] [CrossRef] [PubMed] [Green Version]
  37. Ghosh, P.; Ingman, A.M.; Taylor, T.K. Variations in collagen, non-collagenous proteins, and hexosamine in menisci derived from osteoarthritic and rheumatoid arthritic knee joints. J. Rheumatol. 1975, 2, 100–107. [Google Scholar]
  38. Lüllmann-Rauch, R. Taschenbuch Histologie, 5., Vollst. Überarb. Auflage; Thieme: Stuttgart, Germany, 2015; Available online: https://www.thieme.de/shop/Anatomie-Histologie-Embryologie/Luellmann-Rauch-Asan-Taschenlehrbuch-Histologie-9783132425293/p/000000000145900106 (accessed on 14 December 2020).
  39. Mow, V.C.; Arnoczky, S.P.; Douglas, W. Knee Meniscus: Basic and Clinical Foundations; Jackson, M.D., Ed.; Raven Press: New York, NY, USA, 1992; p. 208. [Google Scholar]
  40. Van der Kraan, P.M.; van den Berg, W.B. Anabolic and destructive mediators in osteoarthritis. Curr. Opin. Clin. Nutr. Metab. Care 2000, 3, 205–211. [Google Scholar] [CrossRef]
  41. Erbagci, H.; Gumusburun, E.; Bayram, M.; Karakurum, G.; Sirikci, A. The normal menisci: In vivo MRI measurements. Surg. Radiol. Anat. SRA 2004, 26, 28–32. [Google Scholar] [CrossRef]
Figure 1. Mach-1 thickness measurement via the needle method (A,B); measuring positions on the meniscus (C).
Applsci 10 09012 g001
Figure 2. Exemplary representation of the thickness determination from the measurement data, red arrow: first contact point of the needle with the sample, blue arrow: transition point at which the load runs against the stop criterion; the distance between both points represents the thickness of the meniscus. Evaluation done with the Mach-1 Analysis Version 4.1.0.17.
Applsci 10 09012 g002
Figure 3. Subdivision into anterior horn, middle section and posterior horn for histological examinations, each subdivided into two parts for transversal and longitudinal incisions.
Applsci 10 09012 g003
Figure 4. Mapping of instantaneous modulus (IM) in arthritis-free samples (A) and arthritic meniscus (B).
Applsci 10 09012 g004
Figure 5. Comparison of the IM in MPa (A) arthritic: 0.17 ± 0.1 MPa; arthritis-free: 0.12 ± 0.07 MPa (p = 0.06) and maximum applied load (B) arthritic: 0.02 ± 0.02 N; arthritis-free: 0.01 ± 0.01 N over the posterior horn of the meniscus between menisci (p = 0.01), taken in total knee replacements (TKR) due to osteoarthritis and menisci, taken from donors without osteoarthritis as a control group: * = statistically significant difference with p < 0.05; error bar with +/− 1SD.
Applsci 10 09012 g005
Figure 6. Comparison of the IM in MPa (A) arthritic: 0.17 ± 0.07 MPa; arthritis-free: 0.14 ± 0.08 MPa (p = 0.18) and the maximum applied load (B) arthritic: 0.03 ± 0.02 N; arthritis-free: 0.02 ± 0.01 N (p = 0.02) over the entire meniscus tissue between menisci, taken in TKR due to osteoarthritis and menisci, taken from donors without osteoarthritis as control group: * = statistically significant difference with p < 0.05; error bar with +/− 1SD.
Applsci 10 09012 g006
Figure 7. Examples for the Safranin O (SO) score 0–5 (AF) for longitudinal cuts taken with 4x magnification; (A) Grade 0: no SO staining; (B) Grade 1: minimum SO staining; (C) Grade 2: very weak SO staining; (D) Grade 3: weak SO staining; (E) Grade 4: strong SO staining; (F) Grade 5: very strong SO staining; A+B corresponds to the arthritis-free group and CF to the arthritic group.
Applsci 10 09012 g007
Figure 8. Histogram of all arthritis-free SO stained sections (A); Histogram of all arthritic SO stained sections (B).
Applsci 10 09012 g008
Figure 9. Scatterplot with adjustment line concerning the correlation between SO score and IM over the posterior horn of the meniscus (A) and the entire meniscus tissue (B) for all samples (arthritic and arthritis-free).
Applsci 10 09012 g009
Publisher’s Note: MDPI stays neutral with regard to jurisdictional claims in published maps and institutional affiliations.

