Featured Application
A handheld near-infrared spectrometer combined with multivariate analysis enables real-time monitoring of quality parameters of individual ingredients and end-products, which permits production optimization through early corrective actions. The outcome of this research supports short scanning time (as low as 20 s) with fingerprinting capabilities that can be used to detect individual and total sugar contents in ground and intact breakfast cereals.
Abstract
This research demonstrates simultaneous predictions of individual and total sugars in breakfast cereals using a novel, handheld near-infrared (NIR) spectroscopic sensor. This miniaturized, battery-operated unit based on Fourier Transform (FT)-NIR was used to collect spectra from both ground and intact breakfast cereal samples, followed by real-time wireless data transfer to a commercial tablet for chemometric processing. A total of 164 breakfast cereal samples (60 store-bought and 104 provided by a snack food company) were tested. Reference analysis for the individual (sucrose, glucose, and fructose) and total sugar contents used high-performance liquid chromatography (HPLC). Chemometric prediction models were generated using partial least square regression (PLSR) by combining the HPLC reference analysis data and FT-NIR spectra, and associated calibration models were externally validated through an independent data set. These multivariate models showed excellent correlation (Rpre ≥ 0.93) and low standard error of prediction (SEP ≤ 2.4 g/100 g) between the predicted and the measured sugar values. Analysis results from the FT-NIR data, confirmed by the reference techniques, showed that eight store-bought cereal samples out of 60 (13%) were not compliant with the total sugar content declaration. The results suggest that the FT-NIR prototype can provide reliable analysis for the snack food manufacturers for on-site analysis.
1. Introduction
The global breakfast cereal market was valued at more than USD 37 billion in 2016 and is estimated to reach USD 51 billion value in 2023 [1,2,3]. Breakfast cereals are widely consumed worldwide because they are easay to prepare while also providing essential micronutrients, including folic acid, vitamin C, iron, zinc, fibers, and, potentially, antioxidants and phytoestrogens [4]. On the other hand, the large amount of sugar added to some products can increase the risk of obesity and diabetes [4,5] while reducing the overall nutritional quality of breakfast cereal [6]. According to the FDA, the difference between the laboratory analysis and the amount declared on the nutrition facts panel must be within ±20% range to comply with regulations [7], and many store-bought breakfast cereals are reported to have significantly higher or lower sugar content than the label indicates [8]. Therefore, it is important to monitor and control the product’s sugar content in every production step and at the end-product. Traditionally, sugar content analysis has been carried out using enzymes (invertase) [9], gas chromatography (GC) [10,11], capillary electrophoresis [12], high-performance anion-exchange chromatography coupled with a pulsed amperometric detection (HPAEC-PAD) [13], or high-performance liquid chromatography (HPLC) [14,15]. However, these techniques require lengthy sample preparation procedures and analysis time, use relatively expensive analytical equipment, generate hazardous waste, and produce results with varying accuracy, depending on personnel or operating conditions.
Optical spectroscopy offers an alternative to the aforementioned methods for measuring the nutritional content of cereals. Spectroscopic methods enable simple, fast, high-throughput, and non-destructive analysis with high specificity. Vibrational spectroscopy, specifically mid-infrared (MIR) and near-infrared (NIR) spectroscopy, has demonstrated accurate quantification of a variety of compounds, including sugar, salt, trans-fat, total fat, and moisture content, fatty acid composition, free fatty acids, peroxide value, and p-anisidine value in breakfast cereals, infant cereals, snack foods, cake mixes, bakery products, and potato chips [16,17,18,19,20,21,22,23,24].
In recent years, advancements in optoelectronics and micro-electromechanical systems (MEMS) have enabled the development of miniaturized infrared spectrometers that can be used in the field and/or in-line to meet requirements for continuous quality control and process monitoring in industrial applications [25]. Sensor technologies based on handheld [26,27,28], portable [29,30], pocket-size [31,32] spectrometers have become more mainstream and have the potential to replace bulky benchtop systems. Currently, most handheld spectrometers on the market use silicon-based Charge Coupled Device (CCD) detectors, which provide readily available, low-cost instruments but are constrained to operating between 780 to 1400 nm. However, recent efforts to integrate on-chip MEMS-based Fourier Transform (FT) spectrometers with reliable light sources and extended indium gallium arsenide (InGaAs) photodetector arrays provide reliable performance for NIR signals out to 2600 nm [25]. Si-Ware Systems introduced the first miniaturized FT-NIR instrument utilizing a MEMS-based Michaelson interferometer operating between 1350 and 2560 nm built on a Si chip using lithographic techniques. This longer-wave spectral range offers more valuable spectroscopic signatures (first or second overtones and combination vibrations) and stronger absorptivity that enables a more highly accurate characterization of food quality traits than the shorter-wave spectral range [33,34].
The combination of handheld, ruggedized NIR spectrometer technology with advanced chemometric algorithms enables handheld, accurate, and specific quantification of the nutritional content of food products. Future implementation of cloud computing can help monitor and analyze a large amount of data directly generated from a production line and would allow continuous monitoring of quality parameters and automation. Because sample preparation is minimal to none for vibrational spectroscopy analysis of many food products, it is possible to track quality parameters from ingredients to end-product.
The focus of this paper is to demonstrate the capabilities of a novel FT-NIR system developed at The Ohio State University, Columbus, OH, USA. The prototype unit has a small form factor and can communicate with an Android-based tablet through Bluetooth. The data were analyzed using chemometric methods and compared with reference analytical results to determine sugar content in commercial breakfast cereals, demonstrating the capability and suitability of our handheld sensor technology for industrial applications.
2. Materials and Methods
2.1. Sample Preparation
A total of 164 cereal samples were used in this study. A leading Ohio snack manufacturer provided sucrose-coated cereal samples (n = 104). To include commercial samples in the model, a total of 60 breakfast cereal samples were purchased from several grocery stores in Columbus, Ohio. Each sample was individually ground using a laboratory blender (6646 Oster 12-speed blender, Sunbeam Products, Inc., Boca Raton, FL, USA) at a pulse setting for 45 s to obtain a homogeneous and equal particle size. In addition to the ground samples, the samples purchased from the grocery stores (n = 60) were also tested in an intact state without any sample preparation (grinding) process.
2.2. Reference Analysis
A total of 1 g cereal was mixed with 40 mL of 80% (v/v) ethanol in a 50 mL centrifuge tube and vortexed for 1 min to extract sugars from the cereal samples. Then the samples were placed on a rotating mixer and held at 50 °C for 1 h. Mixed samples were centrifuged at 4 °C at 13,200 rpm for 20 min. After the centrifuge, the supernatant was transferred into a 100 mL round bottom flask, and the ethanol part was removed using a rotary evaporator (Büchi R110, Büchi Labortechnik AG, Flawil, Switzerland) at 40 °C under vacuum. The sugar and other solids were reconstituted from the round bottom flask using HPLC grade water and brought to 25 mL final volume in a volumetric flask. A 5 mL aliquot was passed through a methanol-activated C-18 cartridge to eliminate phenolic compounds. After the phenolics were removed, the sugars were eluted using HPLC grade water and filtered through a 0.45 μm pore size syringe filter into 2 mL glass HPLC vials.
Each sample’s sugar content was determined using HPLC (Shimadzu Scientific Instruments, Inc., Columbia, MD, USA) equipped with a refractive index detector. The sugars were separated on a stainless steel 7.8 mm ID × 300 mm Rezex™ RCM-Monosaccharide Ca+2 column under isocratic conditions at 80 °C using HPLC grade water with a flow rate of 1 mL/min for 20 min. An external standard curve (Fisher Scientific, Fair Lawn, NJ, USA) was used to quantify individual sugars, including sucrose, glucose, and fructose. The total sugar content of the samples was calculated by adding the individual sugar contents. The sugar analysis by HPLC was performed in duplicate.
2.3. Novel FT-NIR Spectral Sensor Prototype
FT-NIR spectral data collection was performed using a novel, handheld sensor based on an FT-NIR spectral sensor (Figure 1a). This sensor prototype comprises a NeoSpectra-Micro development kit (Si-Ware Systems, Cairo, Egypt), battery pack, cooling fan, sample rotation stage, gear motor, and USB port (Figure 1b,c). An Android-based tablet connects via Bluetooth to the FT-NIR sensor unit to control spectroscopic measurements and to transfer and analyze the data. The NeoSpectra-Micro development kit employs a palm-size FT-NIR spectral sensor (Figure 1c) that utilizes a single-chip Michelson interferometer with a monolithic opto-electro-mechanical structure coupled with a single uncooled InGaAs photodetector. The components are intrinsically aligned with lithography on the chip. Ground or intact cereal samples (~10 g) were placed in a glass Petri dish (Duroplan®, DWK Life Sciences GmbH, Mainz, Germany) and placed on the rotating stage to ensure reproducible measurements of the heterogeneous samples via spectral averaging. Spectra were collected over a wavelength range of 1350–2560 nm with 16 nm resolution that was chosen based on full width at half maximum criterion. FT-NIR spectra were collected at room temperature for 20 s, co-adding individual spectral scans to improve the signal-to-noise ratio. Spectra were collected in triplicate for each sample. Collected spectra were directly transferred and stored in the Android tablet. The spectral data were displayed using SpectroMOST Software (Si-Ware Systems, Cairo, Egypt). Background spectra were also collected to eliminate environmental factors using a highly reflective (99%) diffuse reflectance standard (Spectralon®, Labsphere, North Sutton, NH, USA).
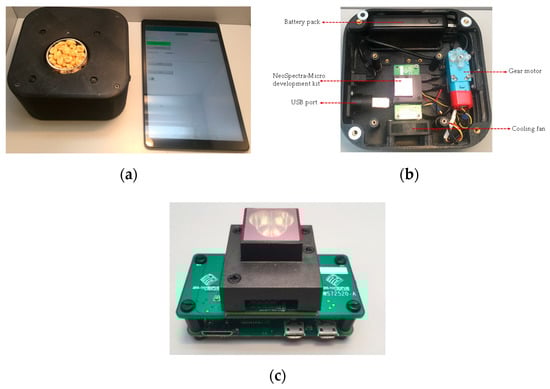
Figure 1.
The novel handheld Fourier Transform near-infrared (FT-NIR) spectral sensor prototype used to analyze breakfast cereal samples (a), the inner section of the handheld FT-NIR spectral sensor prototype (b), and the NeoSpectra-Micro development kit (c).
2.4. Partial Least Square Regression (PLSR) Analysis
The spectral data obtained by the compact FT-NIR spectral sensor were evaluated using multivariate analysis software (Pirouette® 4.5, Infometrix Inc., Bothell, WA, USA). The spectral data were prepared for analysis via mean-centering, normalization, and taking the 2nd derivative (Savitzky–Golay 35-point window) to enhance the spectral features through baseline shift correction and resolving the variability between replications [17]. The data were randomly divided into two groups: a calibration/training set (80% of the total sample set) and an external validation/test set (the remaining 20%). PLSR analysis was applied to the calibration set to correlate the reference sugar content (individual and total) from the HPLC with their corresponding spectral data to generate the multivariate quantitative models. PLSR analysis develops prediction algorithms by combining the features of both principal component analysis (PCA) and multiple linear regression (MLR) [35]. PLSR aims to predict the dependent variables (sugar content) through the independent variables (spectral data-wavelength) by extracting a number of orthogonal factors or latent variables with the best predictive power from the independent variables [35]. Model performance was assessed by latent variable/factor numbers, standard error of cross-validation (SECV), the correlation coefficient of calibration (RCV), standard error of prediction (SEP), the correlation coefficient of prediction (RPre), and outlier diagnostics.
3. Results and Discussion
3.1. Reference Values for Sugar Content in Breakfast Cereal Samples
The minimum and maximum sugar contents measured by HPLC for all of the breakfast cereal samples (purchased and industry-provided) are listed in Table 1. According to these results, the minimum content of individual and of total sugars were similar for the store-bought and company-provided samples. However, the maximum sugar content, mainly the sucrose and the total sugar, exhibited higher sugar levels in the purchased samples than those provided by industry (Table 1). Both the industry-provided and purchased breakfast cereals showed a broad distribution (large standard deviation) (Table 1). Various other researchers have measured comparable sugar levels in commercial breakfast cereals [6,11,16,36,37,38].

Table 1.
Individual and total sugar content for industry-provided and purchased breakfast cereal samples measured by high-performance liquid chromatography (HPLC).
The sugar content listings on the nutrition facts labels of the store-bought cereal samples were compared with our HPLC findings. Eight out of 60 samples (13%) were not in compliance with total sugar content declaration, having significantly (more than ±20% difference) higher total sugar content than the declared values, except one sample with less sugar content than the declaration. For instance, one of those samples reported a total of 10.6 g sugars/100 g of cereal, but our HPLC analysis found 18.2 g total sugars/100 g of cereal, which was 72% higher than the declared value. In a corn-based sample, the manufacturer listed 9.7 g sugars/100 g of cereal; the HPLC data showed 12.7 g/100 g of cereal, which was 31% higher than the declared value. In another sample, even though the manufacturers stated that the product had 0 g of sugar, we found 3.8 g of total sugar in 100 g of cereal. Products that are not in compliance with the declared content are possibly recalled, which can be avoided through the application of reliable and rapid testing that allows real-time decision-making to implement early corrections. Because the cereal production is continuous and cannot be tracked simultaneously using results from traditional techniques, the importance and the necessity of a technique that provides accurate and fast results become apparent.
3.2. Spectral Characterization of the Breakfast Cereal Samples
Examples of NIR spectra obtained from the ground and intact breakfast cereal samples are shown in Figure 2. These spectra show evidence of characteristic absorption bands of various vibrational modes, which are identified based on the prior studies in the literature [39,40,41,42]. The prominent absorption bands in the NIR spectra are centered at 2278, 2091, 1940, 1792, and 1463 nm (Figure 2). In particular, the bands at 2278 nm and 2091 nm correspond to aliphatic C–H bonds of carbohydrates and O–H fundamental vibrations, respectively, which are associated with crystalline sugar, particularly sucrose. The band at 1940 nm corresponds to a combination of O–H bending and stretching, while the bands near 1792 nm and 1463 nm relate to C–H overtone and the first overtone of O–H stretching, respectively.
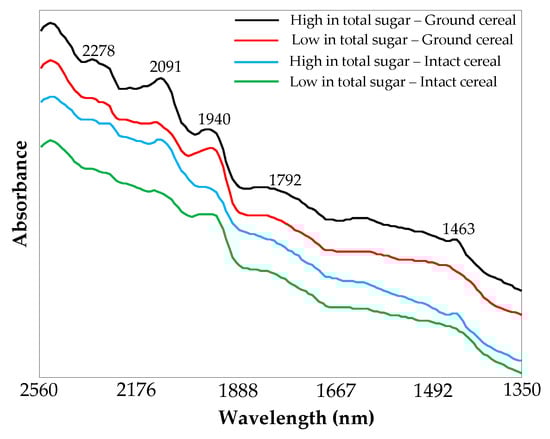
Figure 2.
Raw FT-NIR spectra of ground and intact cereals (high and low in sugar content).
Figure 2 also compares spectral differences between high sugar (50.3 g/100 g) and low sugar content (3.8 g/100 g) breakfast cereals in both ground and intact forms. The spectral differences between the high sugar content and low sugar content cereals are predominantly located at 2091 and 1940 nm. Absorbance at 2091 nm is greater in high sugar content samples in both ground and intact forms, indicating higher carbohydrate levels associated with the sugars. Absorbance at 1940 nm is greater in the low sugar content sample (Figure 2).
The visual comparison between the ground and intact cereal samples spectra revealed that the intact cereal samples had a higher degree of noise and slightly less intense bands, likely due to greater scattering of light. Even though the spectral band intensity was slightly lower, the differences between high and low total sugar content in intact cereal were still visually detectable (Figure 2).
3.3. Quantification of Individual and Total Sugars by Regression Analysis
PLSR analysis was performed to generate prediction models for both ground and intact samples by combining the spectral data collected using the handheld FT-NIR spectral sensor with the reference analysis results for individual and total sugars from the HPLC. The robustness of the ground and intact cereal models was evaluated by using an external validation set. The generated PLSR models’ performance statistics for total sugar and the individual sugars (sucrose, glucose, fructose) based on the handheld FT-NIR spectral sensor measurements are provided in Table 2. Our analysis used constrained spectral ranges associated with specific signatures of the investigated compounds (sugars) instead of using the whole spectral range during PLSR model development to increase the prediction ability of the models [43].
Table 2.
Statistical performance of the prediction models developed using a handheld FT-NIR spectral sensor for predicting individual (sucrose, glucose, and fructose) and total sugar content in ground and intact breakfast cereals.
In most cases, the prediction model performance improved with a higher number of orthogonal latent variables or factors, since each factor explains variance in the model. However, including a redundant number of factors into a model may integrate the random noise or irrelevant components besides the relevant variance and reduce the model performance, which is called overfitting the model. Likewise, employing fewer factors than the optimal number, incorporating less variance than needed, is called underfitting [35]. The optimum number of factors that explain the required variance and give the minimum SECV ranged from 5 to 6. Correlation coefficient (R) of the model measures the strength of the relationship between measured and predicted sugar contents, and +1 indicates total positive linear correlation. SECV provides the possible error between measured and predicted values. All generated models had good performances in terms of high R and low SECV values (Table 2). Furthermore, the PLSR plots (Figure 3a–d) generated for the sucrose and total sugar content in ground and intact breakfast cereals display a good correlation between the measured reference values and predicted sugar content by FT-NIR sensor.
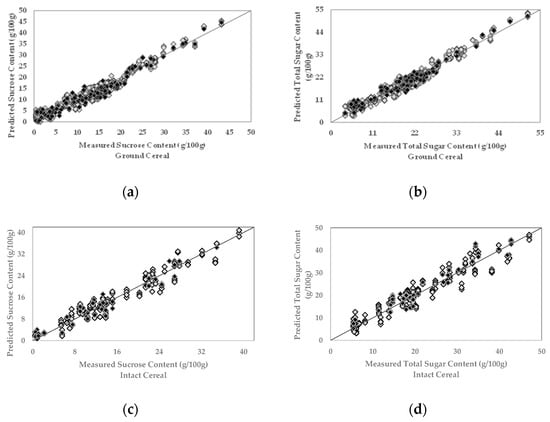
Figure 3.
Partial least square regression (PLSR) plots for sucrose (a,c) and total sugar (b,d) content in ground and intact breakfast cereal samples. The gray diamonds represent the calibration set samples; the black diamonds represent the external validation set samples.
PLSR loading vectors reveal which bands are responsible for explaining the highest variation in the model and assist in understanding which functional groups account for the correlation in the regression model. The marker bands associated with the PLSR loading vectors for the first latent variable (factor) for the sucrose, glucose, fructose, and total sugar content in ground breakfast cereals, shown in Figure 4, indicated that the bands at 2205, 2091, and 1940 nm explained most of the variance in their corresponding PLSR models. The NIR bands located near 2205 nm correspond to C–H combination bands that are common to the various sugars [44]. As mentioned previously, bands centered at 2091 nm is associated with O–H combination stretching and H–O–H deformation of polysaccharides [45,46,47], and the band at 1940 nm corresponds to O–H bending second overtone [20,47].
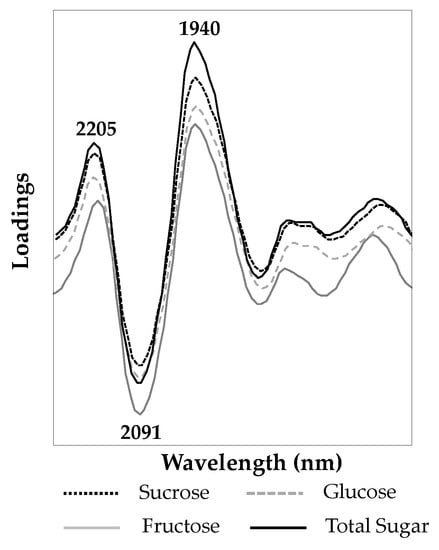
Figure 4.
PLSR loading vectors for the first latent variable in the calibration models for sucrose, glucose, fructose, and total sugar content in ground breakfast cereals.
To evaluate the FT-NIR sensor’s performance for intact breakfast cereals, spectra were collected only from the samples purchased from the grocery stores (n = 20). Prediction models were generated using PLSR analysis, and similar or slightly lower performance was obtained in comparison with the ground samples (Table 2). Usually, the breakfast cereals are manufactured by coating an unsweetened base with a sweetener solution [48]. Because the sugar is located mostly on the surface of the cereal samples, the prediction performance of models was not adversely affected by the light scattering within the unground samples.
The calibration models generated for the individual sugars and total sugar content in ground and intact breakfast cereals were externally validated using an independent sample set that has not been used before (20% of the total ground and intact samples). The performance statistics obtained from the external validation set were similar to the calibration model performance statistics in terms of correlation coefficients and error (Table 2), which confirmed the robustness and predictability of the models. Figure 3a–d demonstrate the external validation set samples’ distribution within the range of calibration set samples.
The calibration and external validation models for individual and total sugar content using the handheld FT-NIR sensor showed similar or superior performance in R and SEP or SECV to previously reported studies using laboratory instruments (Table 3).
Table 3.
Overview of studies performed using NIR spectroscopy to measure total or individual sugar content in cereal-based products, snack foods, and cake mixes.
4. Conclusions
Our novel FT-NIR spectral sensor, combined with multivariate analysis, enabled rapid (~20 s), accurate, and nondestructive determination of individual and total sugar content in breakfast cereals. Both ground and intact cereal samples were evaluated, and similar prediction performance was observed for both cases, indicating suitability for in-line use during production. The handheld sensor can be used as an in-line assessment tool in the snack food industry to monitor the sugar content during production to provide real-time feedback toward verifying that the product meets nutritional requirements. Finally, we observed that the total sugar contents for eight out of 60 (13%) commercial breakfast cereals on the market were not in compliance with the declared values based on our FT-NIR spectral sensor prototype and reference analysis results.
Author Contributions
D.P.A.: Formal Analysis, Methodology, Data curation, Visualization, Writing—original draft preparation. C.B.: Writing—review and editing. A.M.: Formal Analysis, Data curation. L.E.R.-S.: Conceptualization, Methodology, Writing—review and editing. All authors have read and agreed to the published version of the manuscript.
Funding
This research received no external funding.
Acknowledgments
The authors would like to thank Wyandot Inc. for providing the breakfast cereal samples, The Ohio State University Center for Design and Manufacturing Excellence (CDME) for manufacturing the necessary components of the FT-NIR spectral sensor prototype, and Doug Mooney (Early Moon, LLC) for implementing the Android app.
Conflicts of Interest
The authors declare no conflict of interest.
References
- Credence Research Breakfast Cereals Market by Product (Hot Cereals, Ready to Eat)—Growth, Future Prospects, Competitive Analysisi and Forecast to 2016–2023. Available online: https://www.credenceresearch.com/report/breakfast-cereals-market (accessed on 9 January 2020).
- Grand View Research Breakfast Cereal Market Size, Share & Trends Analysis Report by Product (RTE, Hot Cereal), by Distribution Channel (Supermarket, E-Commerce, Convenience Store), by Region, Vendor Landscape, and Segment Forecasts, 2018–2025. Available online: https://www.grandviewresearch.com/industry-analysis/breakfast-cereals-market (accessed on 9 January 2020).
- Perdon, A.A.; Poutanen, K.S.; Schonauer, S.L. Breakfast Cereals and How They Are Made—Introduction; Elsevier Inc.: Amsterdam, The Netherlands, 2020; ISBN 9780128120439. [Google Scholar]
- Williams, P.G. The Benefits of Breakfast Cereal Consumption: A Systematic Reviewof the Evidence Base. Adv. Nutr. 2014, 5, 636S–673S. [Google Scholar] [CrossRef]
- Williamson, C.S. Breakfast cereals—Why all the bad press? Nutr. Bull. 2010, 35, 30–33. [Google Scholar] [CrossRef]
- Devi, A.; Eyles, H.; Rayner, M.; Mhurchu, C.N.; Swinburn, B.; Lonsdale-Cooper, E.; Vandevijvere, S. Nutritional quality, labelling and promotion of breakfast cereals on the New Zealand market. Appetite 2014, 81, 253–260. [Google Scholar] [CrossRef] [PubMed]
- FDA Guidance for Industry: Guide for Developing and Using Data Bases for Nutrition Labeling. Available online: https://www.fda.gov/regulatory-information/search-fda-guidance-documents/guidance-industry-guide-developing-and-using-data-bases-nutrition-labeling (accessed on 9 July 2020).
- Walker, R.W.; Goran, M.I. Laboratory determined sugar content and composition of commercial infant formulas, baby foods and common grocery items targeted to children. Nutrients 2015, 7, 5850–5867. [Google Scholar] [CrossRef] [PubMed]
- Cerning-Beroard, J. The use of invertase for determination of sucrose. Application to cereals, cereal products, and other plant materials. Cereal Chem. 1975, 52, 431–438. [Google Scholar]
- Fernández-Artigas, P.; Guerra-Hernández, E.; García-Villanova, B. Changes in sugar profile during infant cereal manufacture. Food Chem. 2001, 74, 499–505. [Google Scholar] [CrossRef]
- Li, B.W.; Schuhmann, P.J. Gas-Liquid Chromatographic Analysis of Sugars in Ready-to-Eat Breakfast Cereals. J. Food Sci. 1980, 45, 138–141. [Google Scholar] [CrossRef]
- Jager, A.V.; Tonin, F.G.; Tavares, M.F.M. Comparative evaluation of extraction procedures and method validation for determination of carbohydrates in cereals and dairy products by capillary electrophoresis. J. Sep. Sci. 2007, 30, 586–594. [Google Scholar] [CrossRef]
- Ispiryan, L.; Heitmann, M.; Hoehnel, A.; Zannini, E.; Arendt, E.K. Optimization and Validation of an HPAEC-PAD Method for the Quantification of FODMAPs in Cereals and Cereal-Based Products. J. Agric. Food Chem. 2019, 67, 4384–4392. [Google Scholar] [CrossRef]
- AOAC International AOAC Official Method 982.14. In Official Methods of Analysis; AOAC International: Gaithersburg, MD, USA, 2007.
- Chávez-Servín, J.L.; Castellote, A.I.; López-Sabater, M.C. Analysis of mono- and disaccharides in milk-based formulae by high-performance liquid chromatography with refractive index detection. J. Chromatogr. A 2004, 1043, 211–215. [Google Scholar] [CrossRef]
- Baker, D.; Norris, K.H. Near-Infrared Reflectance Measurement of Total Sugar Content of Breakfast Cereals. Appl. Spectrosc. 1985, 39, 618–621. [Google Scholar] [CrossRef]
- Wang, T.; Rodriguez-Saona, L.E. Rapid Determination of Sugar Level in Snack Products Using Infrared Spectroscopy. J. Food Sci. 2012, 77. [Google Scholar] [CrossRef] [PubMed]
- Benes, E.; Gere, A.; Fodor, M. Predicting macronutrients and energy content of snack products using FT-NIR analysis and chemometric techniques. J. Food Eng. 2020, 280, 109954. [Google Scholar] [CrossRef]
- Osborne, B.G.; Fearn, T.; Randall, P.G. Measurement of fat and sucrose in dry cake mixes by near infrared reflectance spectroscopy. Int. J. Food Sci. Technol. 1983, 18, 651–656. [Google Scholar] [CrossRef]
- Lin, C.A.; Ayvaz, H.; Rodriguez-Saona, L.E. Application of Portable and Handheld Infrared Spectrometers for Determination of Sucrose Levels in Infant Cereals. Food Anal. Methods 2014, 7, 1407–1414. [Google Scholar] [CrossRef]
- Shotts, M.-L.; Plans, M.; Wong, K.; Milligan, A.M.; Aykas, D.P.; Rodriguez-Saona, R.E. Application of mid-infrared portable spectrometer for the rapid determination of trans-fatty acid content in lipid extracts of snack and bakery products. J. AOAC Int. 2020. [Google Scholar] [CrossRef]
- Priego-Capote, F.; Ruiz-Jiménez, J.; García-Olmo, J.; Luque De Castro, M.D. Fast method for the determination of total fat and trans fatty-acids content in bakery products based on microwave-assisted Soxhlet extraction and medium infrared spectroscopy detection. Anal. Chim. Acta 2004, 517, 13–20. [Google Scholar] [CrossRef]
- Shiroma, C.; Rodriguez-Saona, L. Application of NIR and MIR spectroscopy in quality control of potato chips. J. Food Compos. Anal. 2009, 22, 596–605. [Google Scholar] [CrossRef]
- Aykas, D.P.; Rodriguez-Saona, L.E. Analytical Methods Assessing potato chip oil quality using a portable infrared spectrometer combined with pattern recognition analysis. Anal. Methods 2016, 8, 731–741. [Google Scholar] [CrossRef]
- Rodriguez-Saona, L.; Aykas, D.P.; Borba, K.R.; Urbina, A.U. Miniaturization of Optical Sensors and their Potential for High-Throughput Screening of Foods. Curr. Opin. Food Sci. 2020. [Google Scholar] [CrossRef]
- de la Roza-Delgado, B.; Garrido-Varo, A.; Soldado, A.; González Arrojo, A.; Cuevas Valdés, M.; Maroto, F.; Pérez-Marín, D. Matching portable NIRS instruments for in situ monitoring indicators of milk composition. Food Control 2017, 76, 74–81. [Google Scholar] [CrossRef]
- Birkel, E.; Rodriguez-Saona, L. Application of a portable handheld infrared spectrometer for quantitation of trans fat in edible oils. JAOCS J. Am. Oil Chem. Soc. 2011, 88, 1477–1483. [Google Scholar] [CrossRef]
- Aykas, D.P.; Shotts, M.-L.; Rodriguez-Saona, L.E. Authentication of commercial honeys based on Raman fingerprinting and pattern recognition analysis. Food Control 2020, 117, 107346. [Google Scholar] [CrossRef]
- Pan, L.; Zhu, Q.; Lu, R.; McGrath, J.M. Determination of sucrose content in sugar beet by portable visible and near-infrared spectroscopy. Food Chem. 2015, 167, 264–271. [Google Scholar] [CrossRef] [PubMed]
- Zhu, G.; Tian, C. Determining sugar content and firmness of ‘Fuji’ apples by using portable near-infrared spectrometer and diffuse transmittance spectroscopy. J. Food Process Eng. 2018, 41. [Google Scholar] [CrossRef]
- Pu, Y.Y.; Sun, D.W.; Riccioli, C.; Buccheri, M.; Grassi, M.; Cattaneo, T.M.P.; Gowen, A. Calibration Transfer from Micro NIR Spectrometer to Hyperspectral Imaging: A Case Study on Predicting Soluble Solids Content of Bananito Fruit (Musa acuminata). Food Anal. Methods 2018, 11, 1021–1033. [Google Scholar] [CrossRef]
- Das, A.J.; Wahi, A.; Kothari, I.; Raskar, R. Ultra-portable, wireless smartphone spectrometer for rapid, non-destructive testing of fruit ripeness. Sci. Rep. 2016, 6, 1–8. [Google Scholar] [CrossRef]
- Yang, C.S.; Jin, F.; Swaminathan, S.R.; Patel, S.; Ramer, E.D.; Trivedi, S.B.; Brown, E.E.; Hommerich, U.; Samuels, A.C. Comprehensive study of solid pharmaceutical tablets in visible, near infrared (NIR), and longwave infrared (LWIR) spectral regions using a rapid simultaneous ultraviolet/visible/NIR (UVN) + LWIR laser-induced breakdown spectroscopy linear arrays detection system and a fast acousto-optic tunable filter NIR spectrometer. Opt. Express 2017, 25, 26885. [Google Scholar] [CrossRef]
- Guo, Z.; Huang, W.; Peng, Y.; Chen, Q.; Ouyang, Q.; Zhao, J. Color compensation and comparison of shortwave near infrared and long wave near infrared spectroscopy for determination of soluble solids content of “Fuji” apple. Postharvest Biol. Technol. 2016, 115, 81–90. [Google Scholar] [CrossRef]
- Abdi, H. Partial least squares regression and projection on latent structure regression (PLS Regression). Wiley Interdiscip. Rev. Comput. Stat. 2010, 2, 97–106. [Google Scholar] [CrossRef]
- Pombo-Rodrigues, S.; Hashem, K.M.; He, F.J.; Macgregor, G.A. Salt and sugars content of breakfast cereals in the UK from 1992 to 2015. Public Health Nutr. 2017, 20, 1500–1512. [Google Scholar] [CrossRef] [PubMed]
- Nieto, C.; Patiño, S.R.G.; Tolentino-Mayo, L.; Carriedo, A.; Barquera, S. Characterization of breakfast cereals available in the Mexican market: Sodium and sugar content. Nutrients 2017, 9, 884. [Google Scholar] [CrossRef]
- Schwartz, M.B.; Vartanian, L.R.; Wharton, C.M.; Brownell, K.D. Examining the Nutritional Quality of Breakfast Cereals Marketed to Children. J. Am. Diet. Assoc. 2008, 108, 702–705. [Google Scholar] [CrossRef] [PubMed]
- Kays, S.E.; Barton, F.E.; Windham, W.R.; Himmelsbach, D.S. Prediction of Total Dietary Fiber by Near-Infrared Reflectance Spectroscopy in Cereal Products Containing High Sugar and Crystalline Sugar. J. Agric. Food Chem. 1997, 45, 3944–3951. [Google Scholar] [CrossRef]
- Kays, S.E.; Barton, F.E. Near-infrared analysis of soluble and insoluble dietary fiber fractions of cereal food products. J. Agric. Food Chem. 2002, 50, 3024–3029. [Google Scholar] [CrossRef] [PubMed]
- Fodor, M.; Woller, A.; Turza, S.; Szigedi, T. Development of a rapid, non-destructive method for egg content determination in dry pasta using FT-NIR technique. J. Food Eng. 2011, 107, 195–199. [Google Scholar] [CrossRef]
- de Oliveira, G.A.; de Castilhos, F.; Renard, C.M.G.C.; Bureau, S. Comparison of NIR and MIR spectroscopic methods for determination of individual sugars, organic acids and carotenoids in passion fruit. Food Res. Int. 2014, 60, 154–162. [Google Scholar] [CrossRef]
- Ścibisz, I.; Reich, M.; Bureau, S.; Gouble, B.; Causse, M.; Bertrand, D.; Renard, C.M.G.C. Mid-infrared spectroscopy as a tool for rapid determination of internal quality parameters in tomato. Food Chem. 2011, 125, 1390–1397. [Google Scholar] [CrossRef]
- Xie, L.; Ye, X.; Liu, D.; Ying, Y. Quantification of glucose, fructose and sucrose in bayberry juice by NIR and PLS. Food Chem. 2009, 114, 1135–1140. [Google Scholar] [CrossRef]
- Chen, S.F.; Danao, M.G.; Singh, V.; Brown, P.J. Determining sucrose and glucose levels in dual-purpose sorghum stalks by Fourier transform near infrared (FT-NIR) spectroscopy. J. Sci. Food Agric. 2014, 94, 2569–2576. [Google Scholar] [CrossRef]
- da Costa Filho, P.A. Rapid determination of sucrose in chocolate mass using near infrared spectroscopy. Anal. Chim. Acta 2009, 631, 206–211. [Google Scholar] [CrossRef] [PubMed]
- Shenk, J.S.; Workman, J.J.; Westerhaus, M.O. Application of NIR Spectroscopy to Agricultural Products. In Handbook of Near-Infrared Analysis; Burns, D.A., Ciurczak, E.W., Eds.; CRC Press: Boca Raton, FL, USA, 2008; pp. 347–386. ISBN 978-0-8493-7393-0. [Google Scholar]
- Burns, R.E.; Caldwell, E.F.; Fast, R.B.; Jones, W.H. Application of Nutritional and Flavoring/Sweetening Coatings. In Breakfast Cereals and How They Are Made; Fast, R.B., Caldwell, E.F., Eds.; American Association of Cereal Chemists: St. Paul, MN, USA, 2000; ISBN 1-891127-15-2. [Google Scholar]
Publisher’s Note: MDPI stays neutral with regard to jurisdictional claims in published maps and institutional affiliations. |
© 2020 by the authors. Licensee MDPI, Basel, Switzerland. This article is an open access article distributed under the terms and conditions of the Creative Commons Attribution (CC BY) license (http://creativecommons.org/licenses/by/4.0/).