Article

Experimental Research on Mechanical Performance of SSRC Columns under Eccentric Compression

School of Water Conservancy Engineering, Zhengzhou University, Zhengzhou 450001, China
*
Author to whom correspondence should be addressed.
Appl. Sci. 2020, 10(16), 5629; https://doi.org/10.3390/app10165629
Submission received: 25 July 2020 / Revised: 9 August 2020 / Accepted: 12 August 2020 / Published: 13 August 2020
(This article belongs to the Section Civil Engineering)

Abstract

:
To study the mechanical properties of stainless-steel-reinforced concrete (SSRC) columns under eccentric compression, one ordinary reinforced concrete column and eight SSRC columns were designed for eccentric compression load tests. The eccentricity and reinforcement ratio were considered as the variation parameters. The cracking and failure modes of the SSRC columns were studied. The effects of the variation parameters on the longitudinal strain, concrete strain, lateral displacement, and ultimate load were analyzed. The test results demonstrated that the failure modes of SSRC columns under eccentric compression are similar to those of ordinary reinforced columns. Eccentricity significantly affected the failure modes of the SSRC columns. Under the same eccentricity, the reinforcement ratio had negligible effect on the lateral displacement corresponding to the ultimate load. The mechanical properties of SSRC columns under small eccentric compression were better than expected; however, the ultimate loads under large eccentric compression were proposed. The ultimate load–bending moment curves obtained were consistent with the results of the test and finite element analysis. Based on the experimental results, the force characteristic coefficient was set as 2.7 for calculating the long-term crack width.

1. Introduction

The corrosion of reinforcement reduces the service life of a structure and affects its general functioning. The damage caused by the corrosion of the reinforcement is usually difficult to repair. Stainless steel reinforcement offers oxidation resistance, high-temperature resistance, corrosion resistance, chemical stability, and high strength [1,2,3,4,5]. Some studies [6,7] have shown that the replacement of traditional reinforcements with stainless steel reinforcement in certain erosive environments may offer excellent economic benefits. Recently, stainless-steel-reinforced concrete (SSRC) has been used to extend the service life of structures and reduce their life cycle costs [8,9,10,11]. At present, SSRC is used in bridges, coasts, docks, and other projects, such as the HK–Zhuhai–Macao Bridge, the Apate Bridge in Stockholm (Sweden), and the Gala Galdana Bridge in Menorca (Spain).
The cost of stainless-steel reinforcement is significantly higher than that of ordinary reinforcement and limits its application. However, with the development of smelting and rolling technology, various types of high-strength stainless steel reinforcements have been developed [12,13,14,15,16]. Low-nickel stainless steel reinforcements are highly cost-competitive.
Compared with carbon steel, stainless steel has excellent corrosion resistance [3,4,16,17,18]. The presence of chromium forms dense passive films on the surface of stainless steel, making it resistant to electrochemical corrosion caused by chloride ions. However, this changed composition imparts significantly different mechanical properties to stainless steel. Stainless steel exhibits nonlinearity, early significant strain hardening, and high ductility under tension without a significant yield plateau. Owing to these altered properties, the mechanical properties of SSRC have become the focus of extensive research in recent years.
Adequate bond performance between the reinforcement and concrete is essential to ensure the reliability of reinforced concrete (RC). Therefore, some studies [19,20,21] focused on evaluating the bond–slip characteristics between stainless steel reinforcement and concrete. Calderon Uriszar-Aldaca et al. [20] investigated the bond strengths of SSRC specimens and standard RC specimens in a corrosive environment and analyzed the effects of the water–cement ratio and corrosion on the specimens. The test results indicated that, under the effect of corrosion, the bonding strength of SSRC members is stronger than that of RC specimens. Pauletta et al. [21] compared the bonding properties of SSRC and standard RC and analyzed the effects of the concrete thickness, concrete strength, and steel bar diameter. The results of the past studies have demonstrated that stainless steel reinforcement and concrete have a good bond performance.
Research on the structural behavior of SSRC has increased recently, with the focus being on the flexural performance, fatigue behavior, seismic behavior, and mechanical behavior under the impact load of SSRC [1,22,23,24]. Rabi et al. [23] established the finite element model of SSRC beams based on the existing test data. They reported that the current code ignores the partial strength of stainless steel reinforcement after yielding and underestimates the bearing capacity of SSRC beams. Therefore, a new method for calculating the bearing capacity based on the continuous strength method is proposed. Hitherto, the existing research has indicated that the mechanical responses of SSRC and traditional RC differ. However, the mechanical behavior of SSRC subjected to eccentric compression has not been studied.
Therefore, investigating the mechanical properties of SSRC and establishing corresponding specifications can reduce its engineering cost and promote its application. In this study, nine columns, including SSRC columns, were tested under eccentric compression and were theoretically analyzed. Three variables (namely reinforcement type, reinforcement ratio, and eccentricity (e)) were employed to investigate their effects on the failure mode, strain, and deflection of SSRC columns. Finally, based on the current codes [25,26,27], the calculations for the ultimate load and maximum crack width of SSRC members were analyzed and discussed.

2. Experimental Program

2.1. Mechanical Properties of Reinforcements

The 2304 stainless steel and HRB400 hot-rolled reinforcements were selected for longitudinal bars of the specimens used in this study. The reinforcement tensile test results are summarized in Table 1. During the test, 2304 SS reinforcements did not yield significantly.

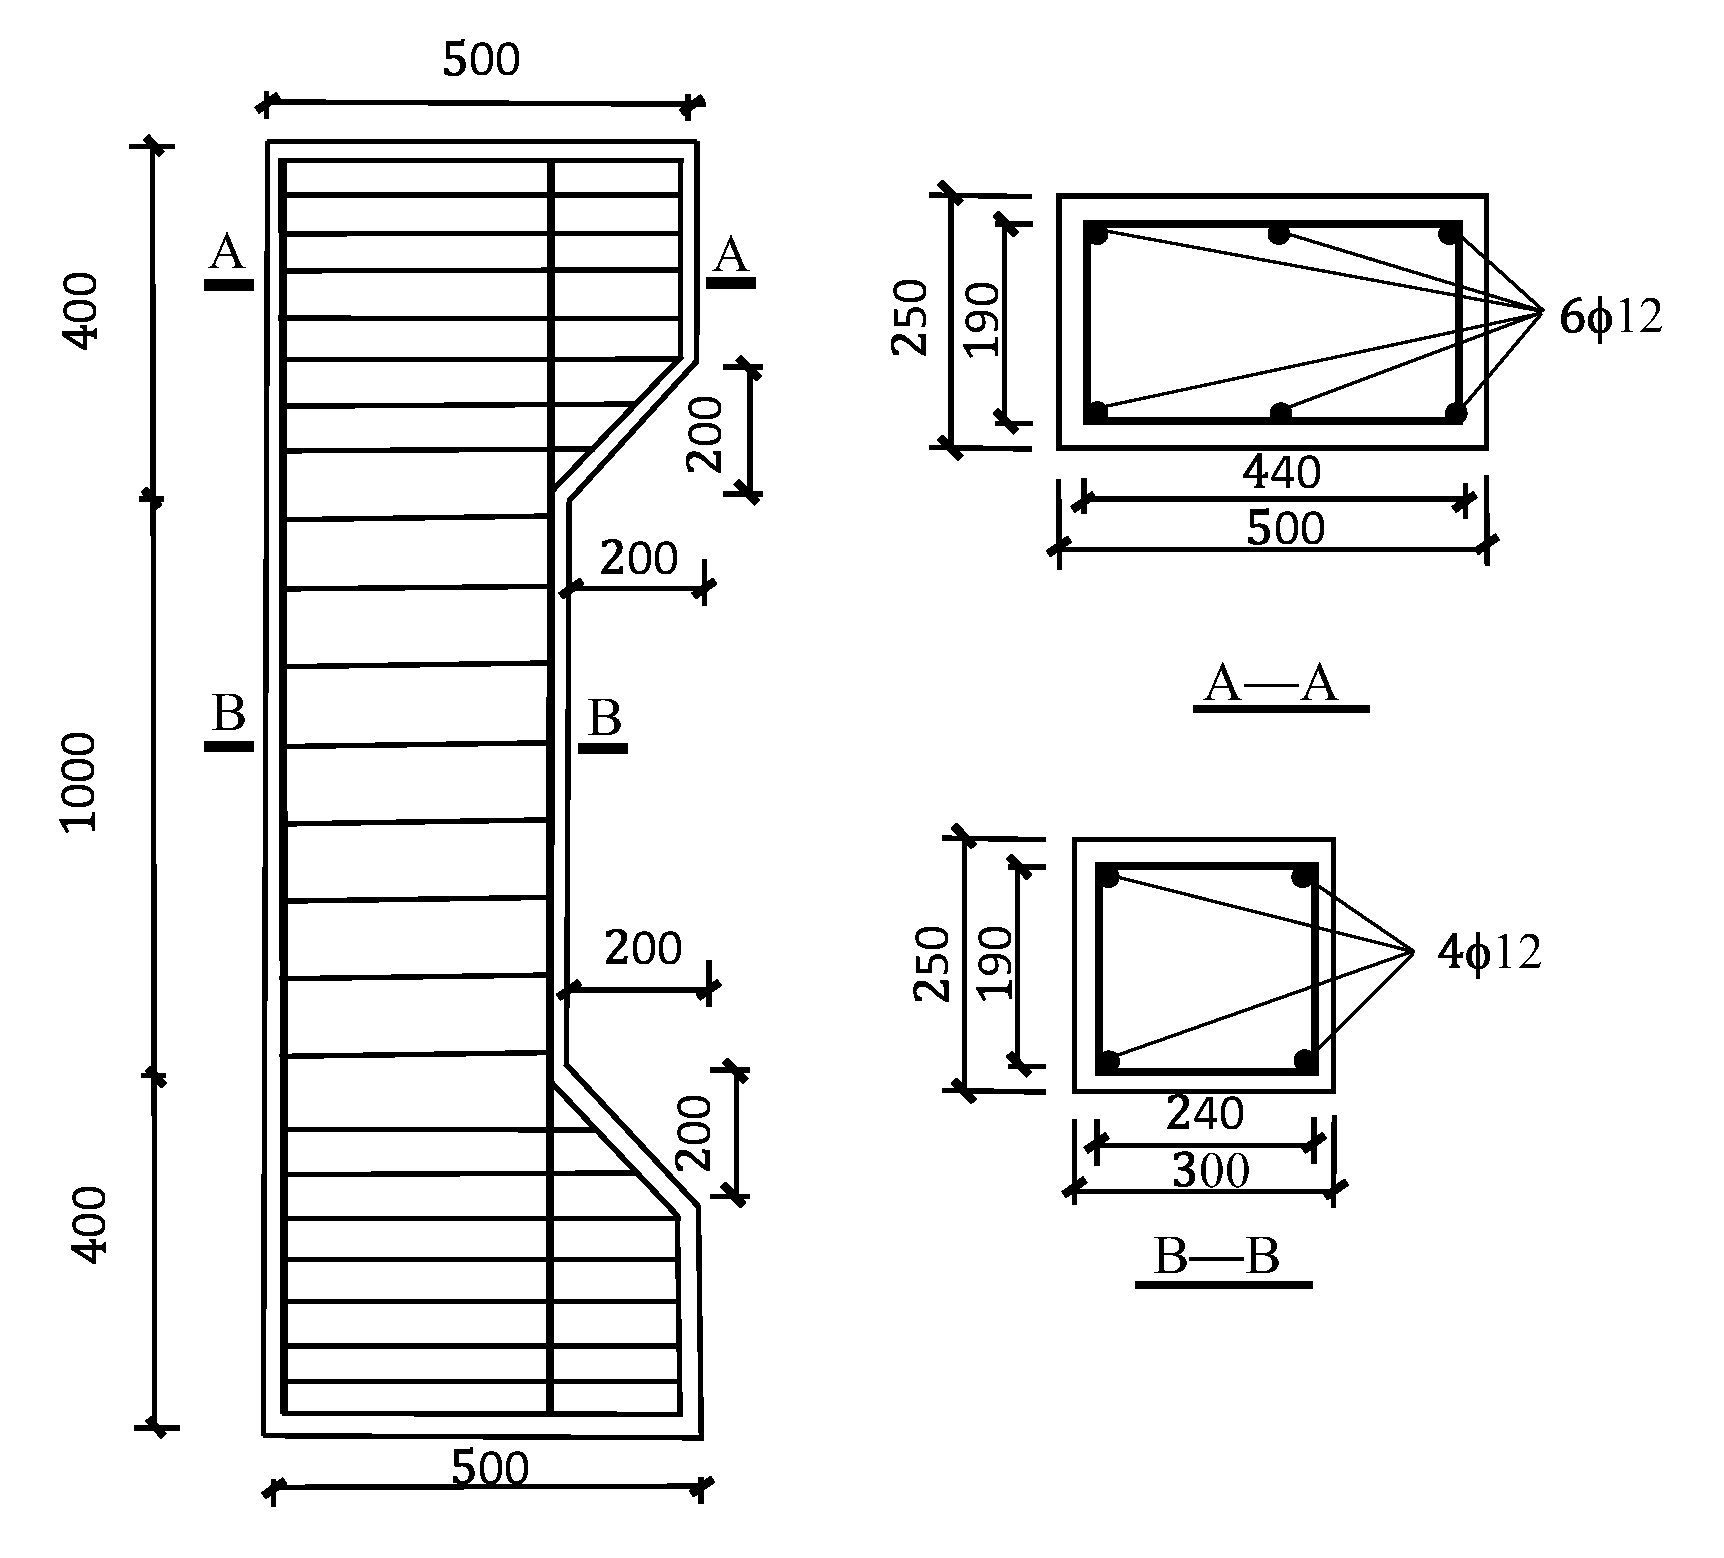
2.2. Specimen Design

The geometry of the specimens is depicted in Figure 1. Each specimen had a cross section of 250 mm × 300 mm and a height of 1800 mm, and the thickness of the protective layer was 30 mm. The concrete design strength grade was C30, and the actual cube compressive strength was determined to be 30.8 MPa by testing three concrete cubes with dimensions of 150 mm × 150 mm × 150 mm. Two bent steel bars were placed at the corbel, and the stirrup spacing was reduced to 50 mm.
Nine specimens were designed: one ordinary reinforced concrete column (HRC9) and eight SSRC columns (SSRC1-8). The system variable parameters considered included four eccentricities (80, 150, 200, and 270 mm), three longitudinal diameters (12, 16, and 25 mm), and three reinforcement rates (0.60%, 1.07%, and 2.61%). The design parameters of the specimens are listed in Table 2.

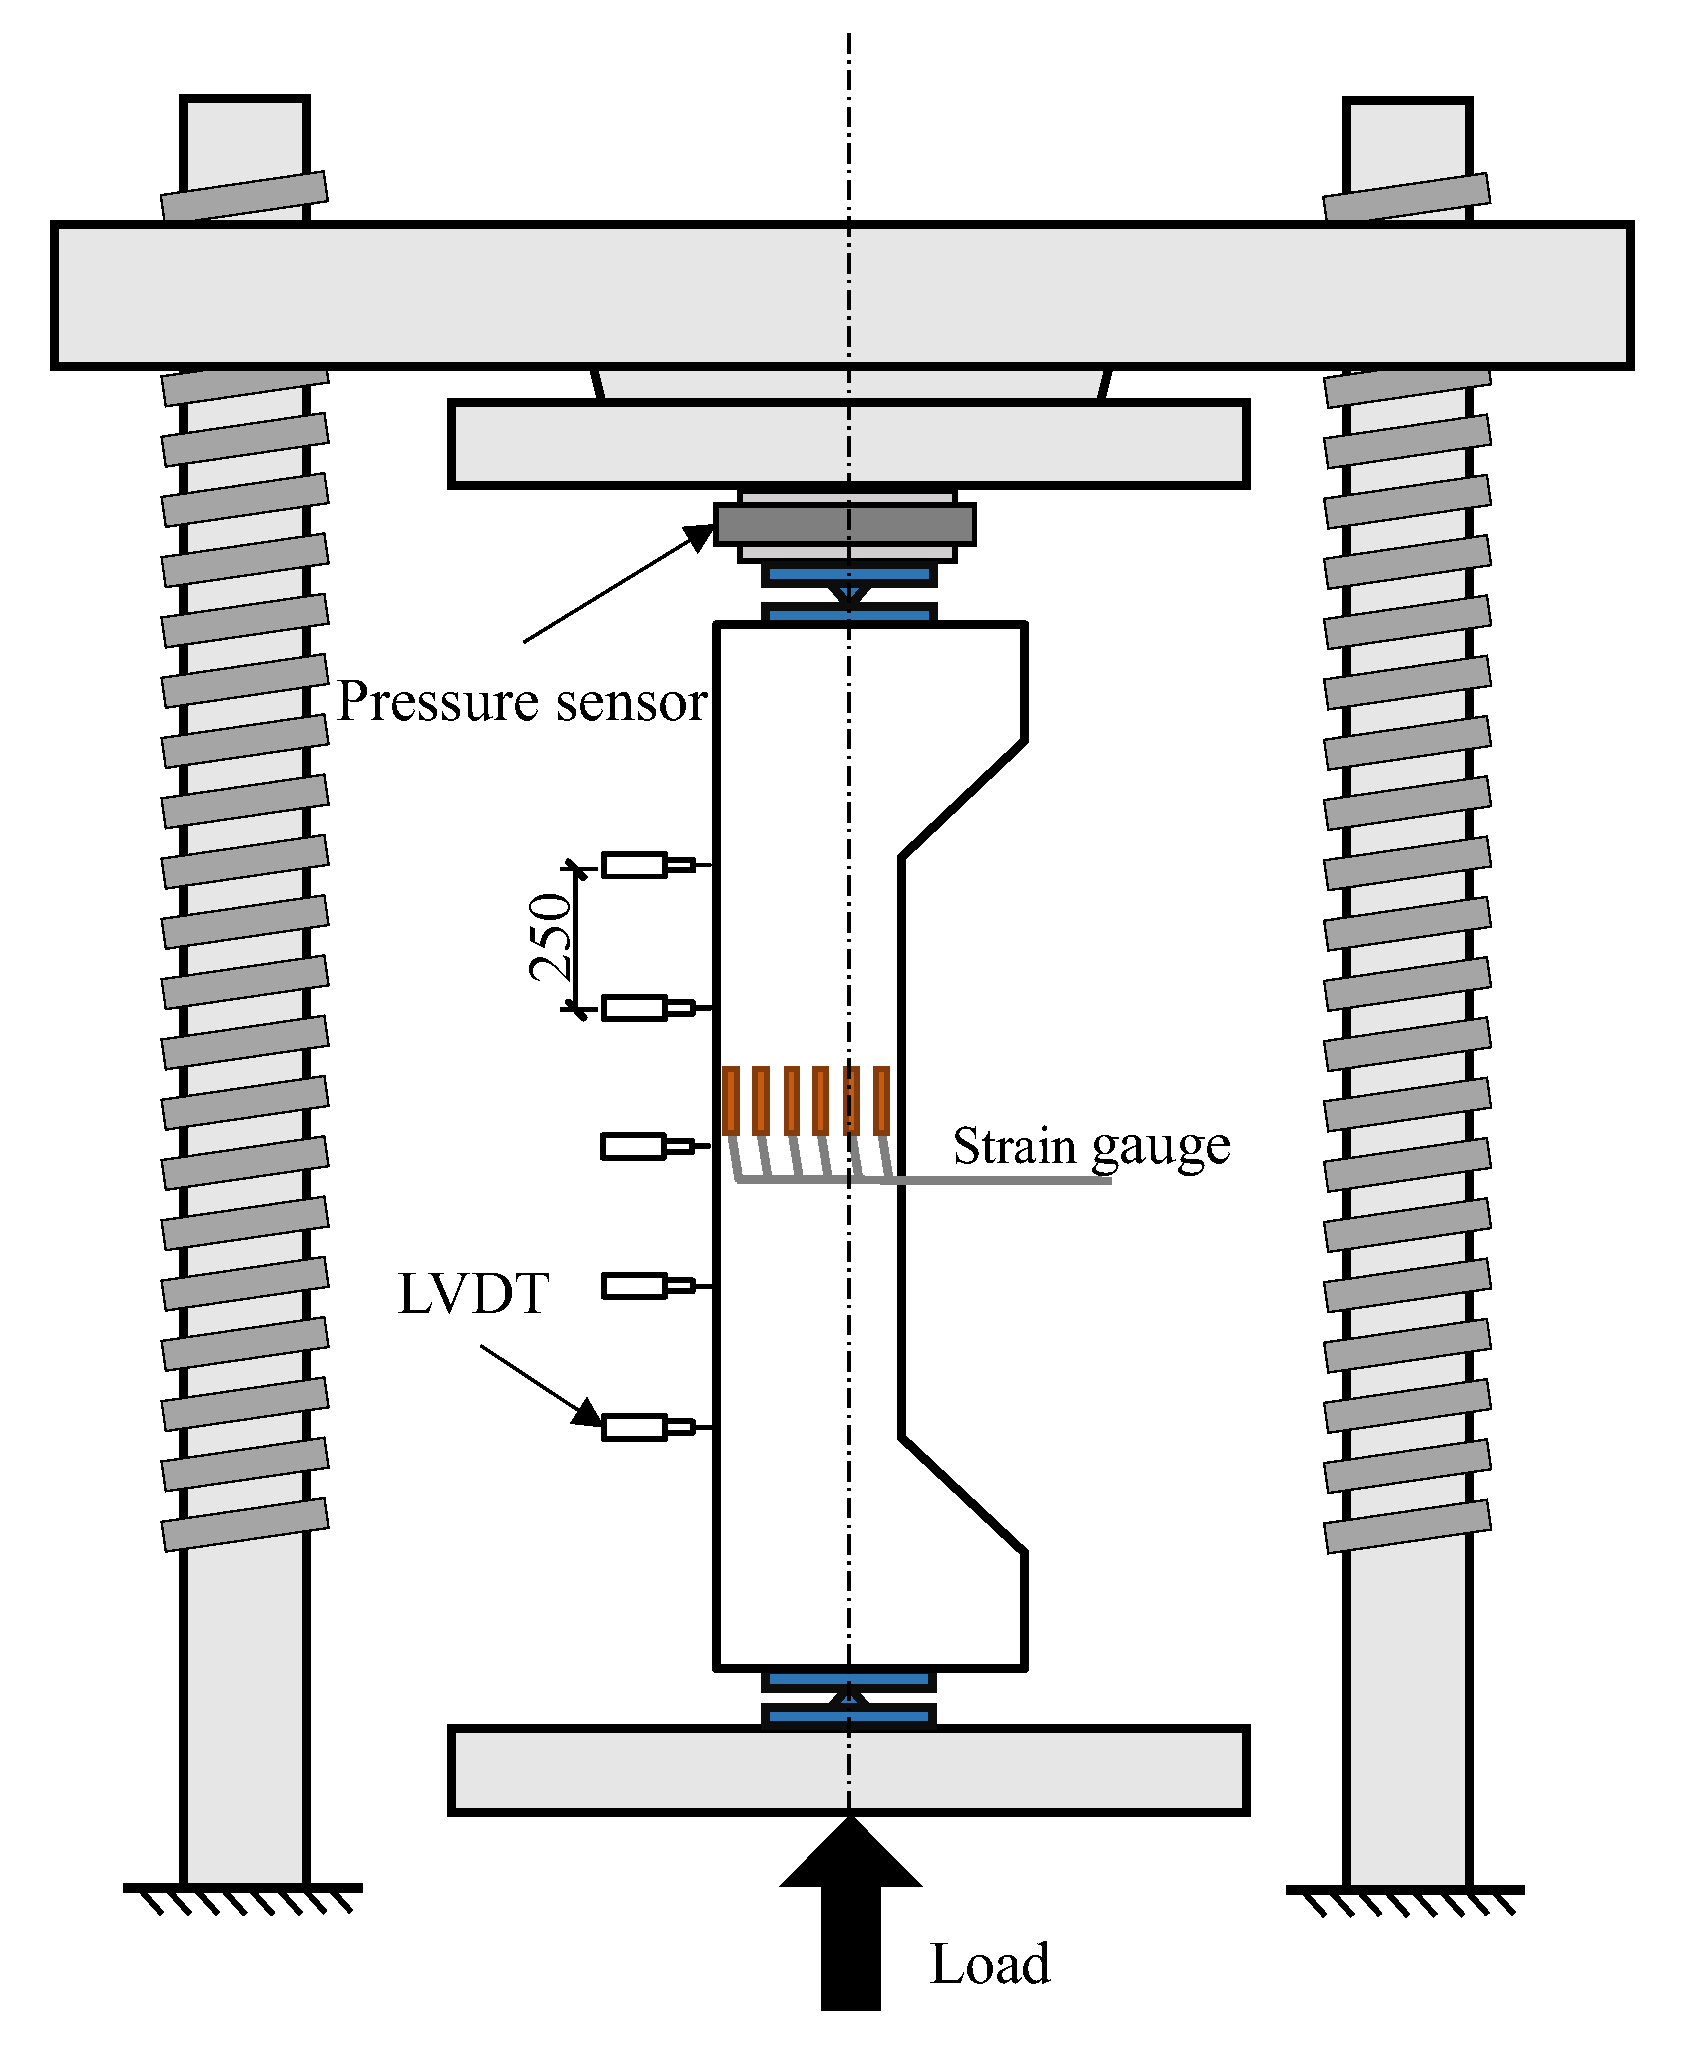
2.3. Experimental Setup and Measurement Scheme

The test setup is depicted in Figure 2. All specimens were tested using a 5000 kN compression machine. The roller hinge support was placed above and below the specimen to realize hinge support at both ends. The load eccentricity was varied by moving the hinge support. The load was recorded using a 2000 kN pressure sensor placed on the top of the specimen, and the crack development was recorded using a crack observer with an accuracy of 0.02 mm. A DH3821 static strain tester was used to record the changes in strain and displacement.
Five electronic displacement meters were evenly arranged along the height of the specimen, at 250 mm intervals, as depicted in Figure 2. Steel strain gauges were placed on the longitudinal reinforcement along the height of the column. Six concrete strain gauges were placed on the concrete surface of the column at 0, 50, 100, 150, 225, and 300 mm from the edge of the section.

2.4. Experimental Program

The method of monotonic static loading was used in this study. The test device was preloaded after geometric alignment (approximately 10% of the theoretical ultimate bearing capacity). The instruments and meters were formally arranged after no abnormality was found. In the initial stages, 10% of the theoretical ultimate load was applied at each stage. When the load reached 80% of the theoretical ultimate load, the load increment at each stage was set to 5% of the theoretical ultimate load. When 90% of the theoretical ultimate load was reached, the increase in the load was controlled through the displacement until the specimen failed.

3. Experimental Results
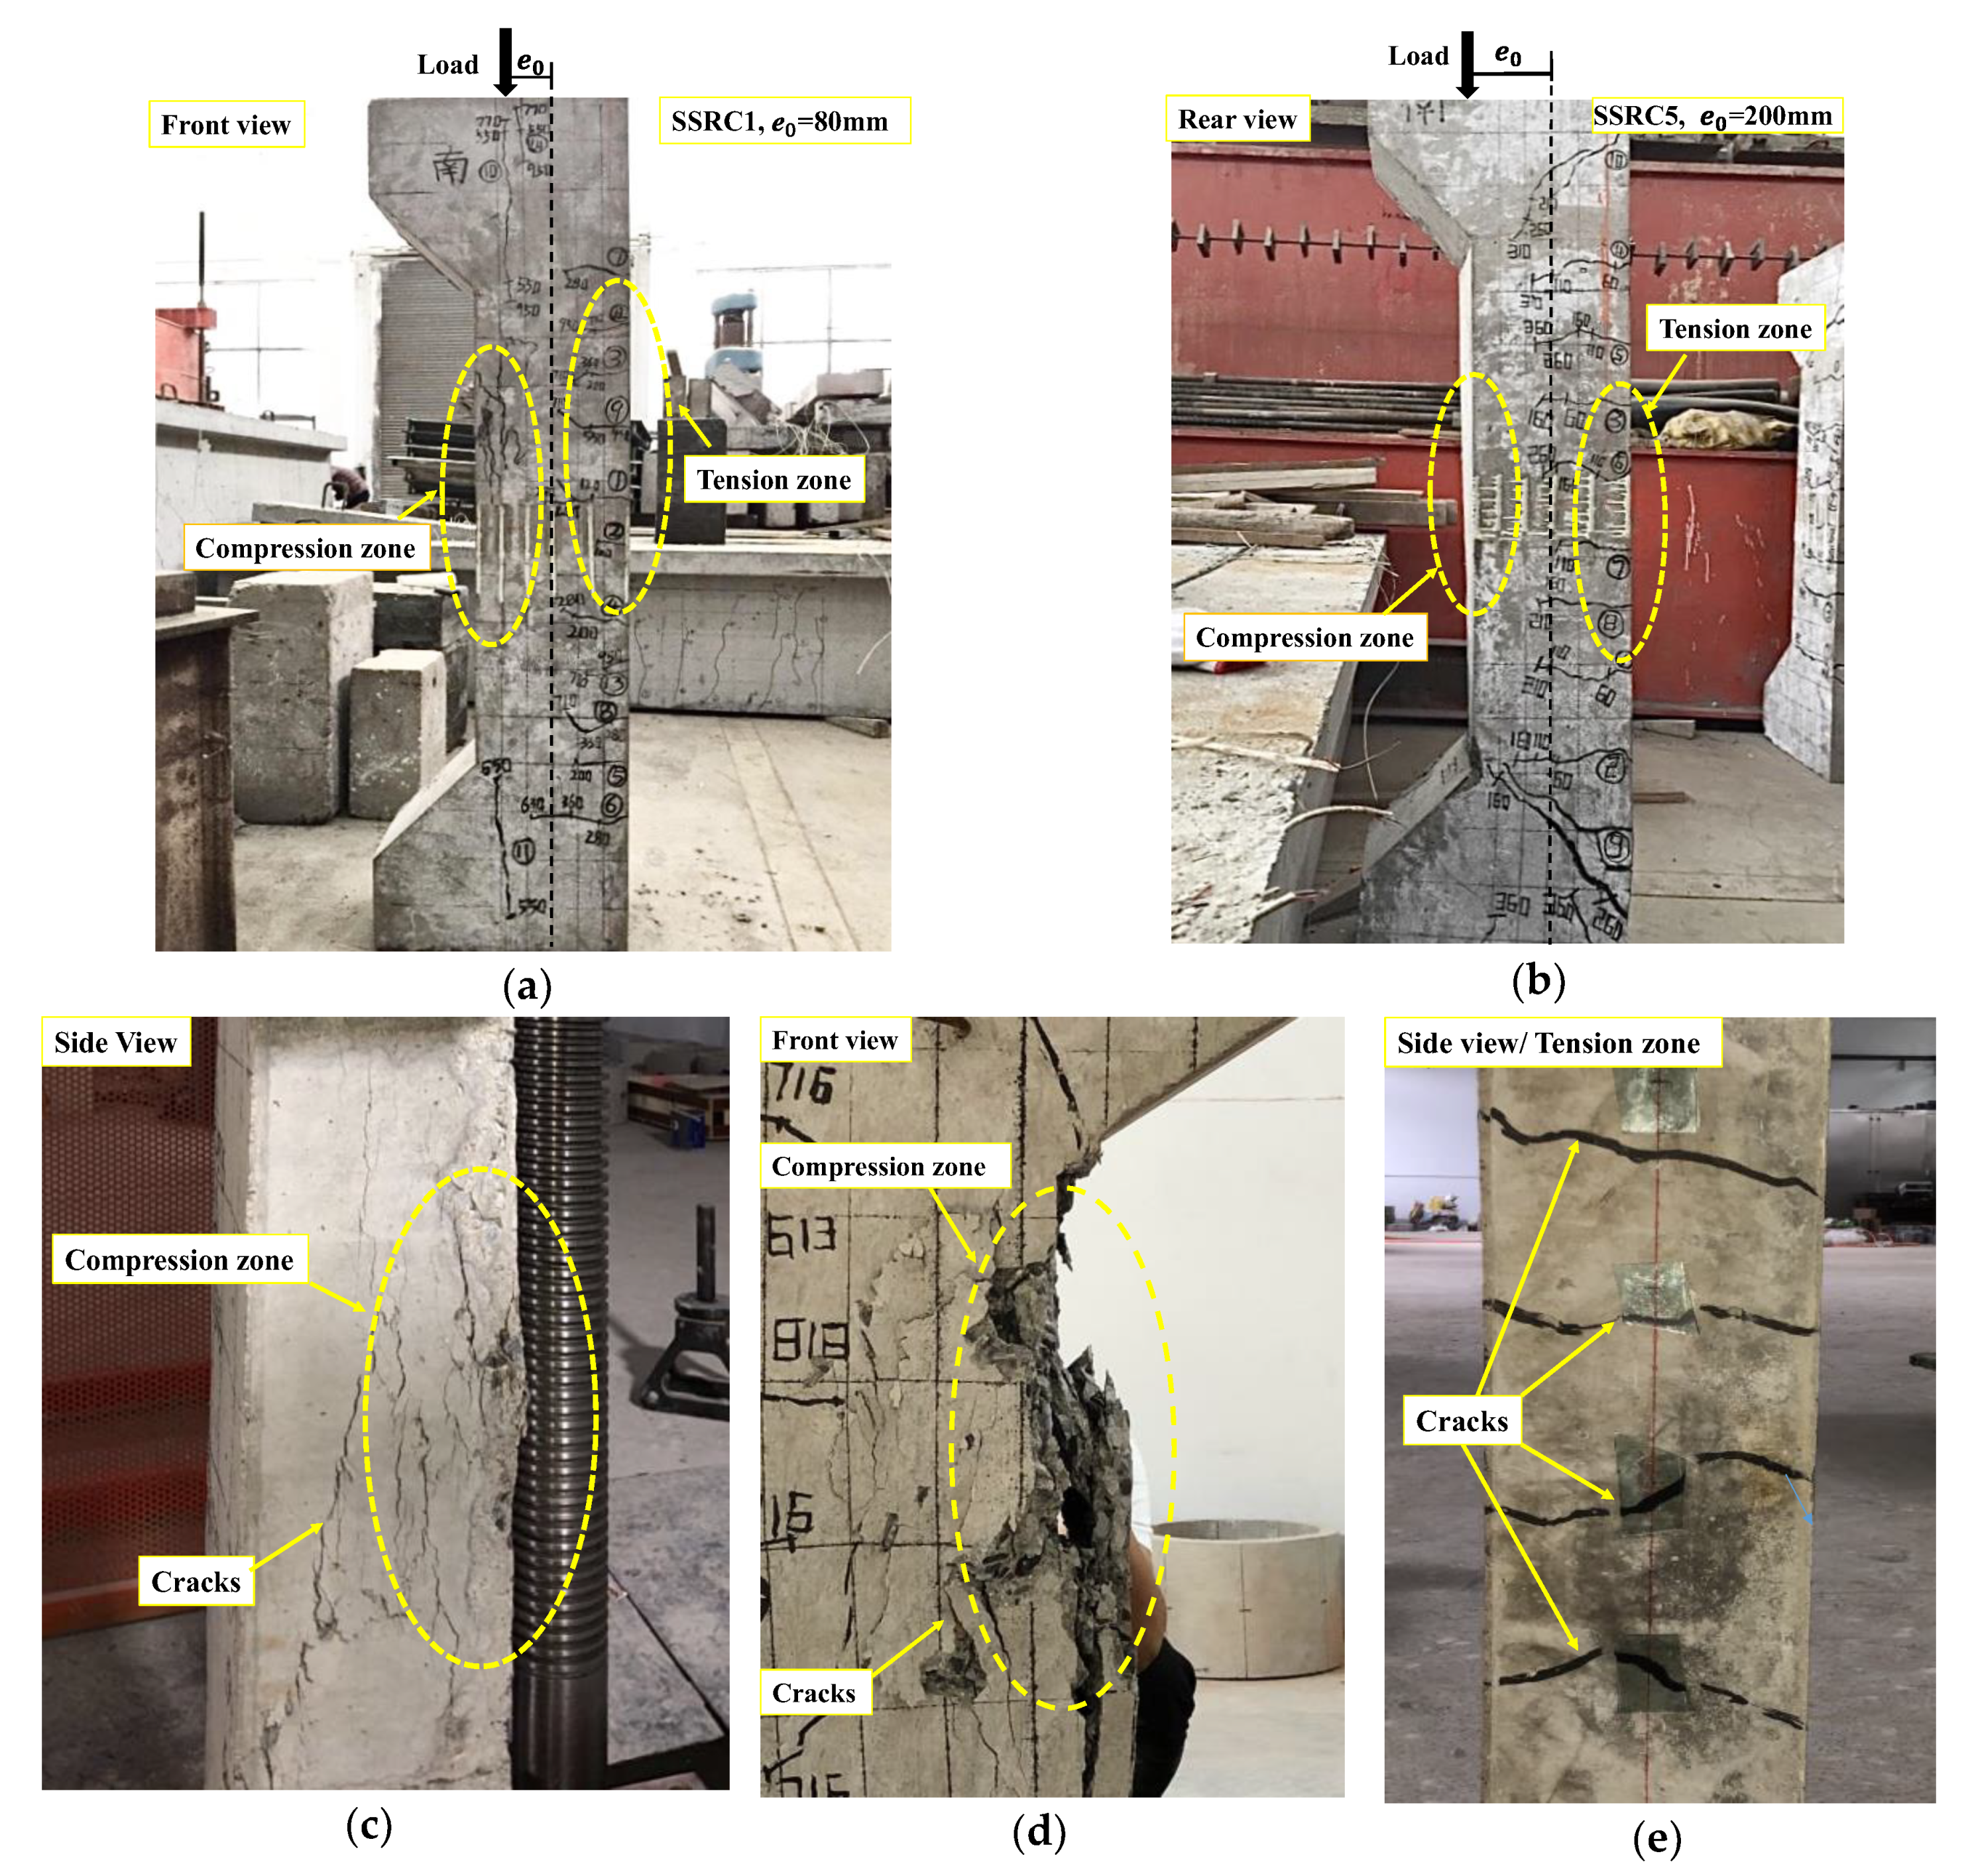
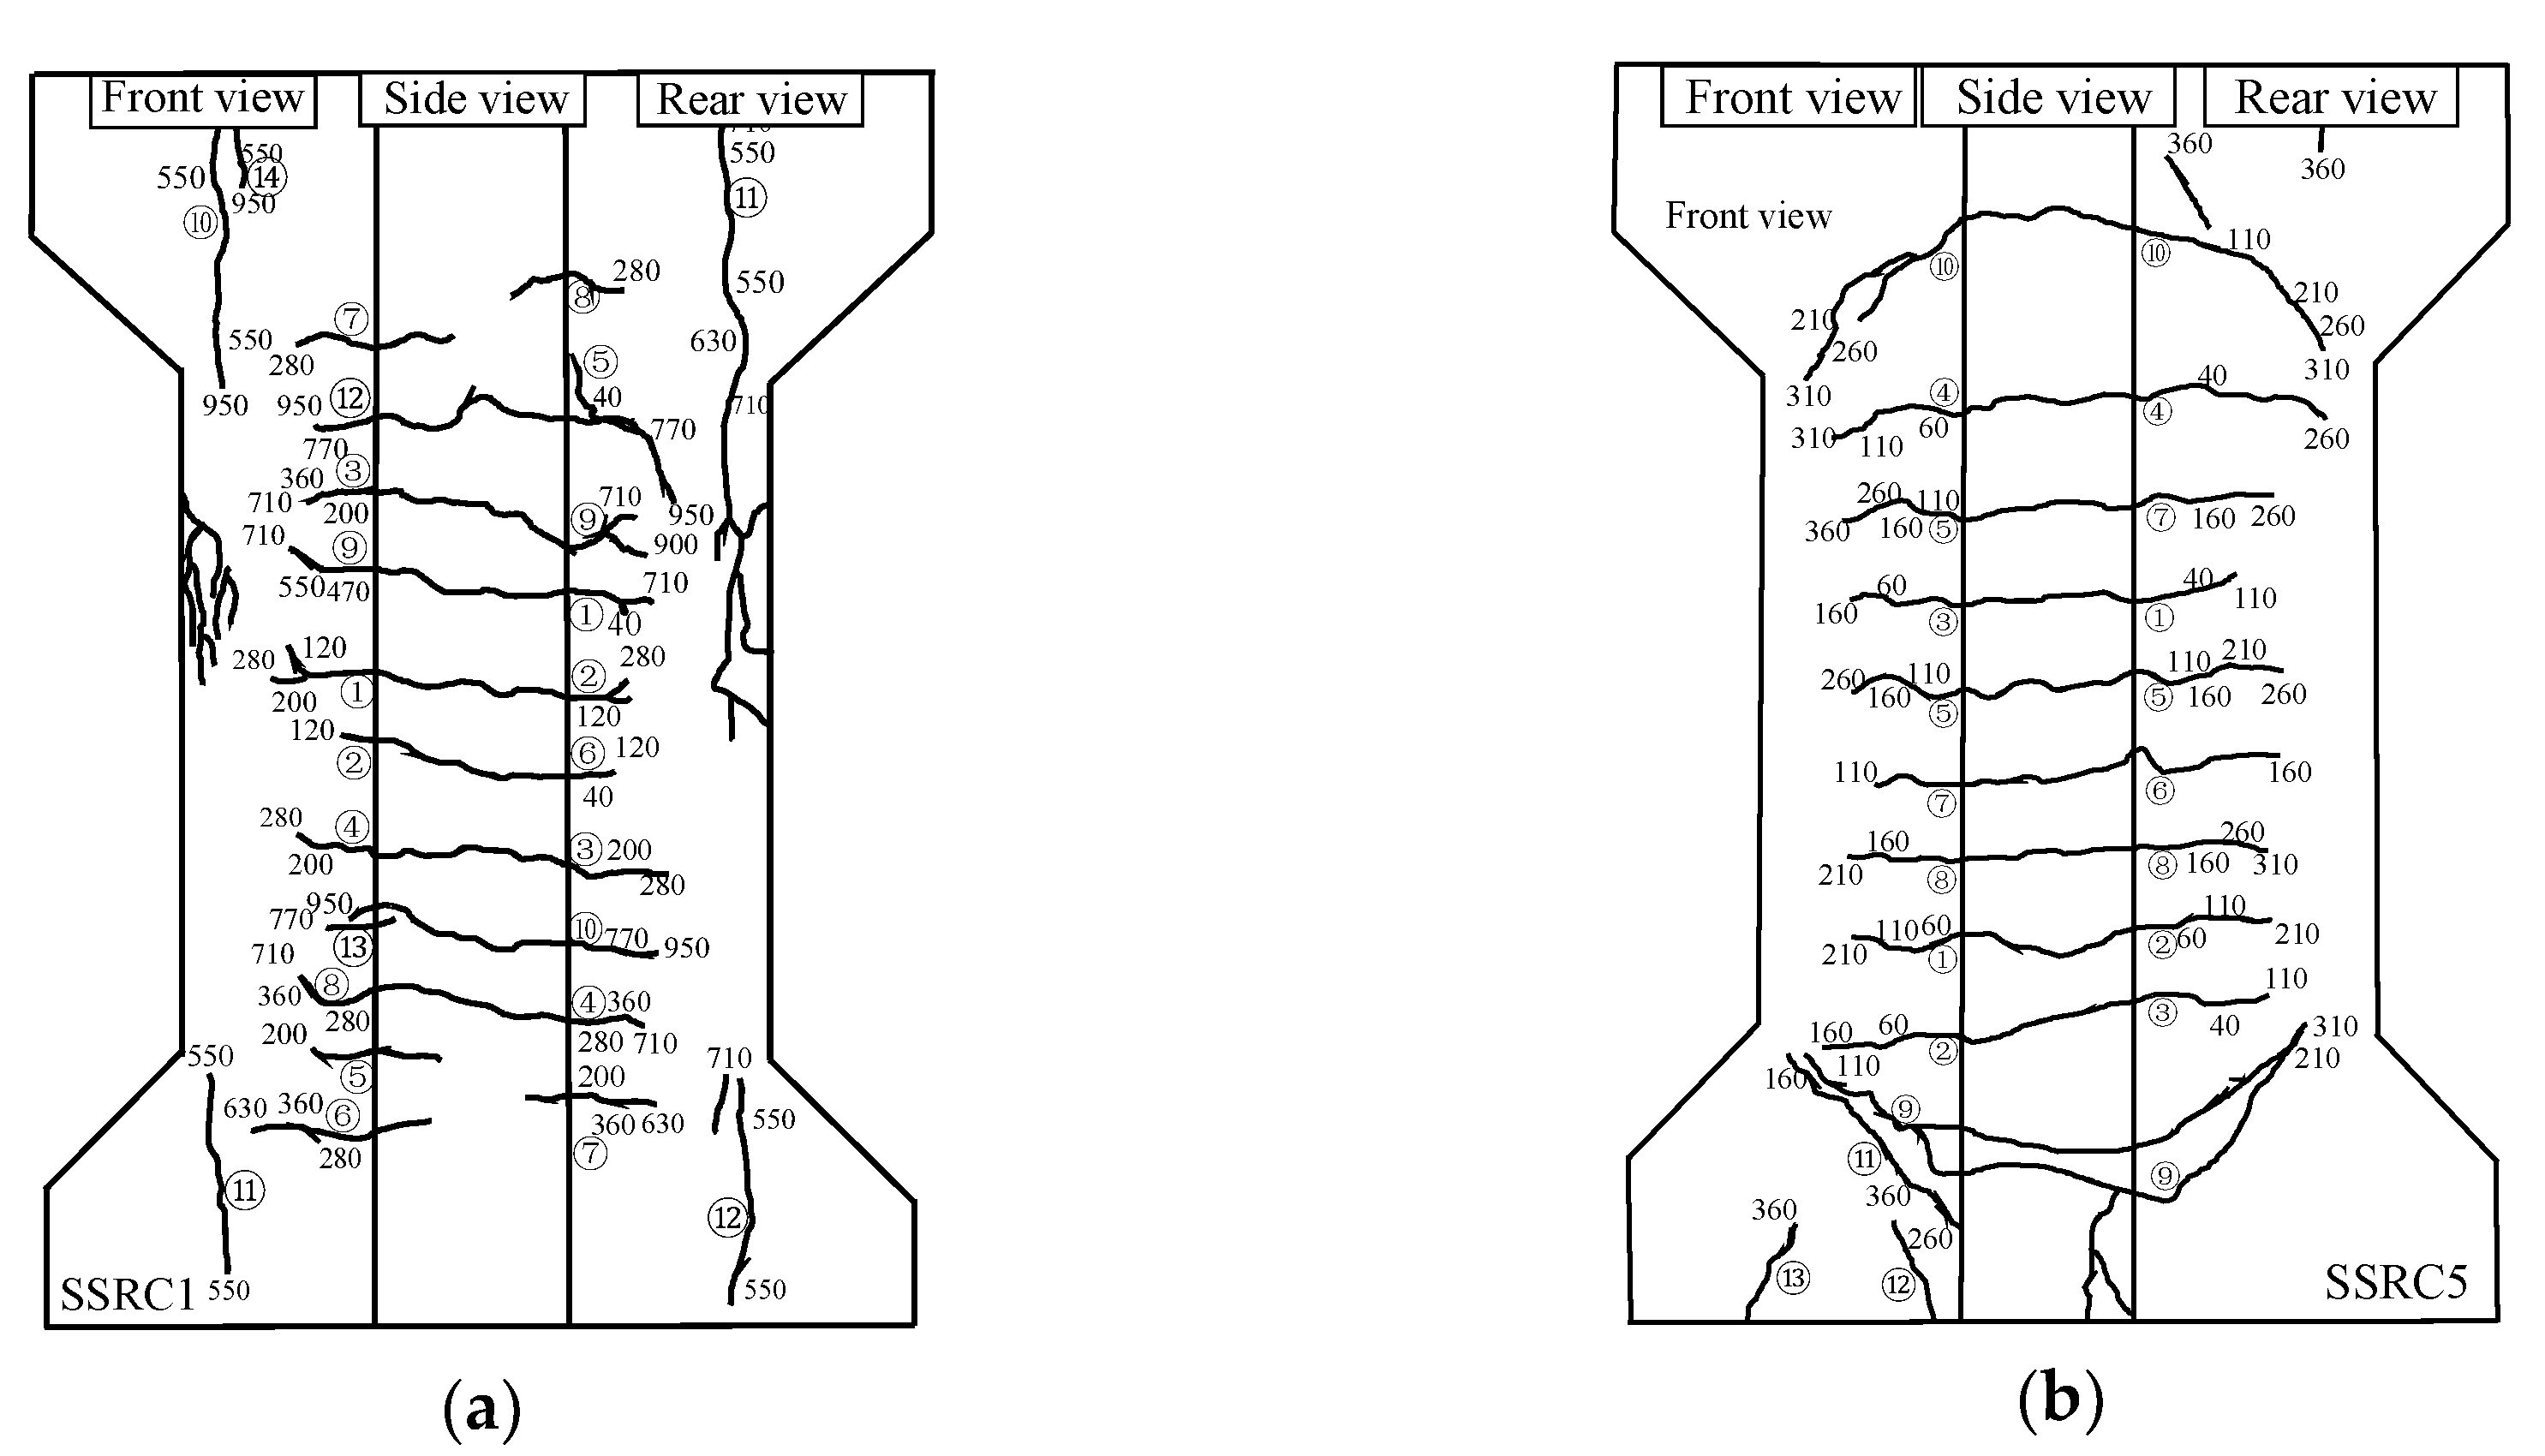
3.1. Failure Modes

The typical failure and crack development patterns caused by the eccentric loading of the columns are depicted in Figure 3 and Figure 4. Specimens SSRC1, SSRC3, SSRC4, and SSRC7 were loaded under small-eccentricity loads. At 20% of the ultimate load, 3–4 transverse cracks appeared in the tension zone. At 30–50% of the ultimate load, the number of cracks increased gradually, and the lengths and widths of existing cracks developed slowly. At 50% of the ultimate load, longitudinal cracks appeared in the compression zone. At 90% of the ultimate load, the transverse crack extended to the neutral axis of the test column, the crack width became larger, and the lateral displacement continued to increase. When the ultimate load was reached, the test column produced a crisp noise, and many longitudinal cracks appeared in the compression zone. The load dropped rapidly when the lateral displacement increased.
Specimens SSRC2, SSRC5, SSRC6, and SSRC8 were loaded under large eccentricities. At 20% of the ultimate load, transverse cracks appeared in the tension zone of the test column, and the increase in the load was accompanied by increments in the widths and lengths of the transverse cracks. At 50% of the ultimate load, there were almost no new cracks in the tension zone. At 90% of the ultimate load, longitudinal cracks appeared in the compression zone, and transverse cracks penetrated.

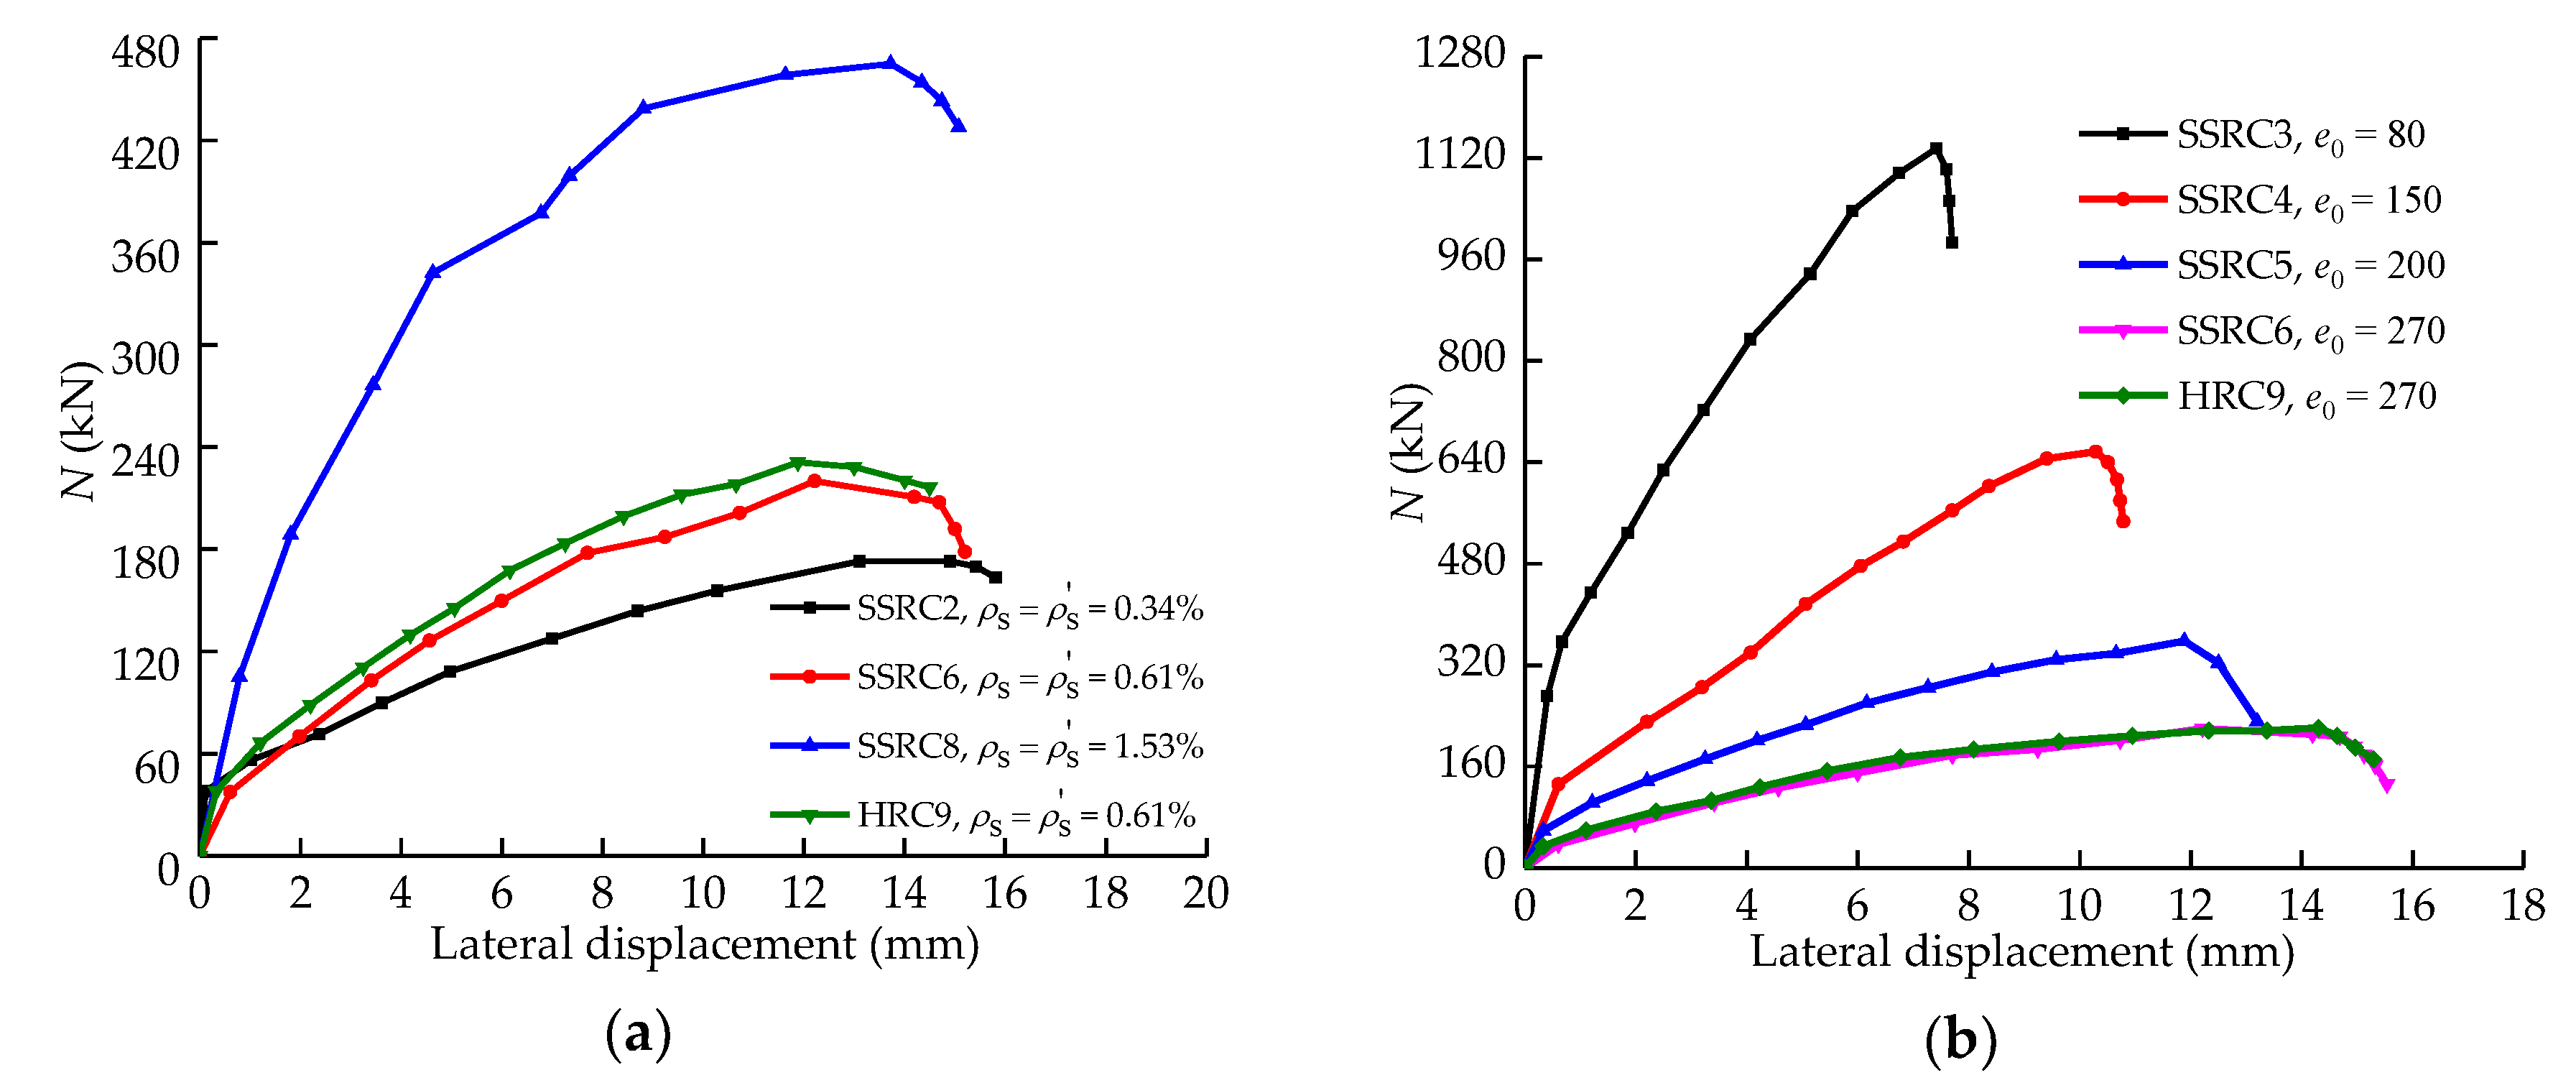
3.2. Load–Lateral Displacement Curves

The experimental load–lateral displacement curves of the specimens are exhibited in Figure 5. The failure process is divided into three stages:
  • Linear growth stage: The lateral displacement is small, and the load increases linearly.
  • Nonlinear growth stage: With the increase in load, transverse cracks appear in the concrete on the tension side, and the section stiffness decreases gradually.
  • Falling stage: After the ultimate load, the curve exhibits a downward trend. The falling stage for the curves of the large eccentric compression specimen is gentler, showing good ductility.
As shown in Figure 5a, under the same eccentricity, the reinforcement ratio is positively correlated with the bearing capacity of SSRC members; however, it has little effect on the lateral displacement corresponding to the ultimate load. As shown in Figure 5b, under the same reinforcement ratio, the eccentricity is negatively correlated with the bearing capacity of SSRC members.
The lateral deflection curves of all specimens under various loads are displayed in Figure 6. The lateral displacement curves of the eccentric compression specimens are symmetrically distributed along the middle of the columns and are approximately sinusoidal. The maximum lateral displacement occurs in the middle of the test column. Under the same eccentricity, the reinforcement ratio had a negligible effect on the lateral displacement corresponding to the ultimate load. The specimens SSRC3, SSRC4, SSRC5, and SSRC6 have the same reinforcement and increasing eccentricity; as the eccentricity increases, the ultimate load decreases. As the eccentricity increases, the lateral deflection at maximum load increases for columns SSRC3 and SSRC4 (reaching approximately 10 and 17 mm, respectively) and begins to decrease for columns SSRC5 and SSRC6 (reaching approximately 12 and 10 mm, respectively).This effect may be due to the axle being applied to the corbel.

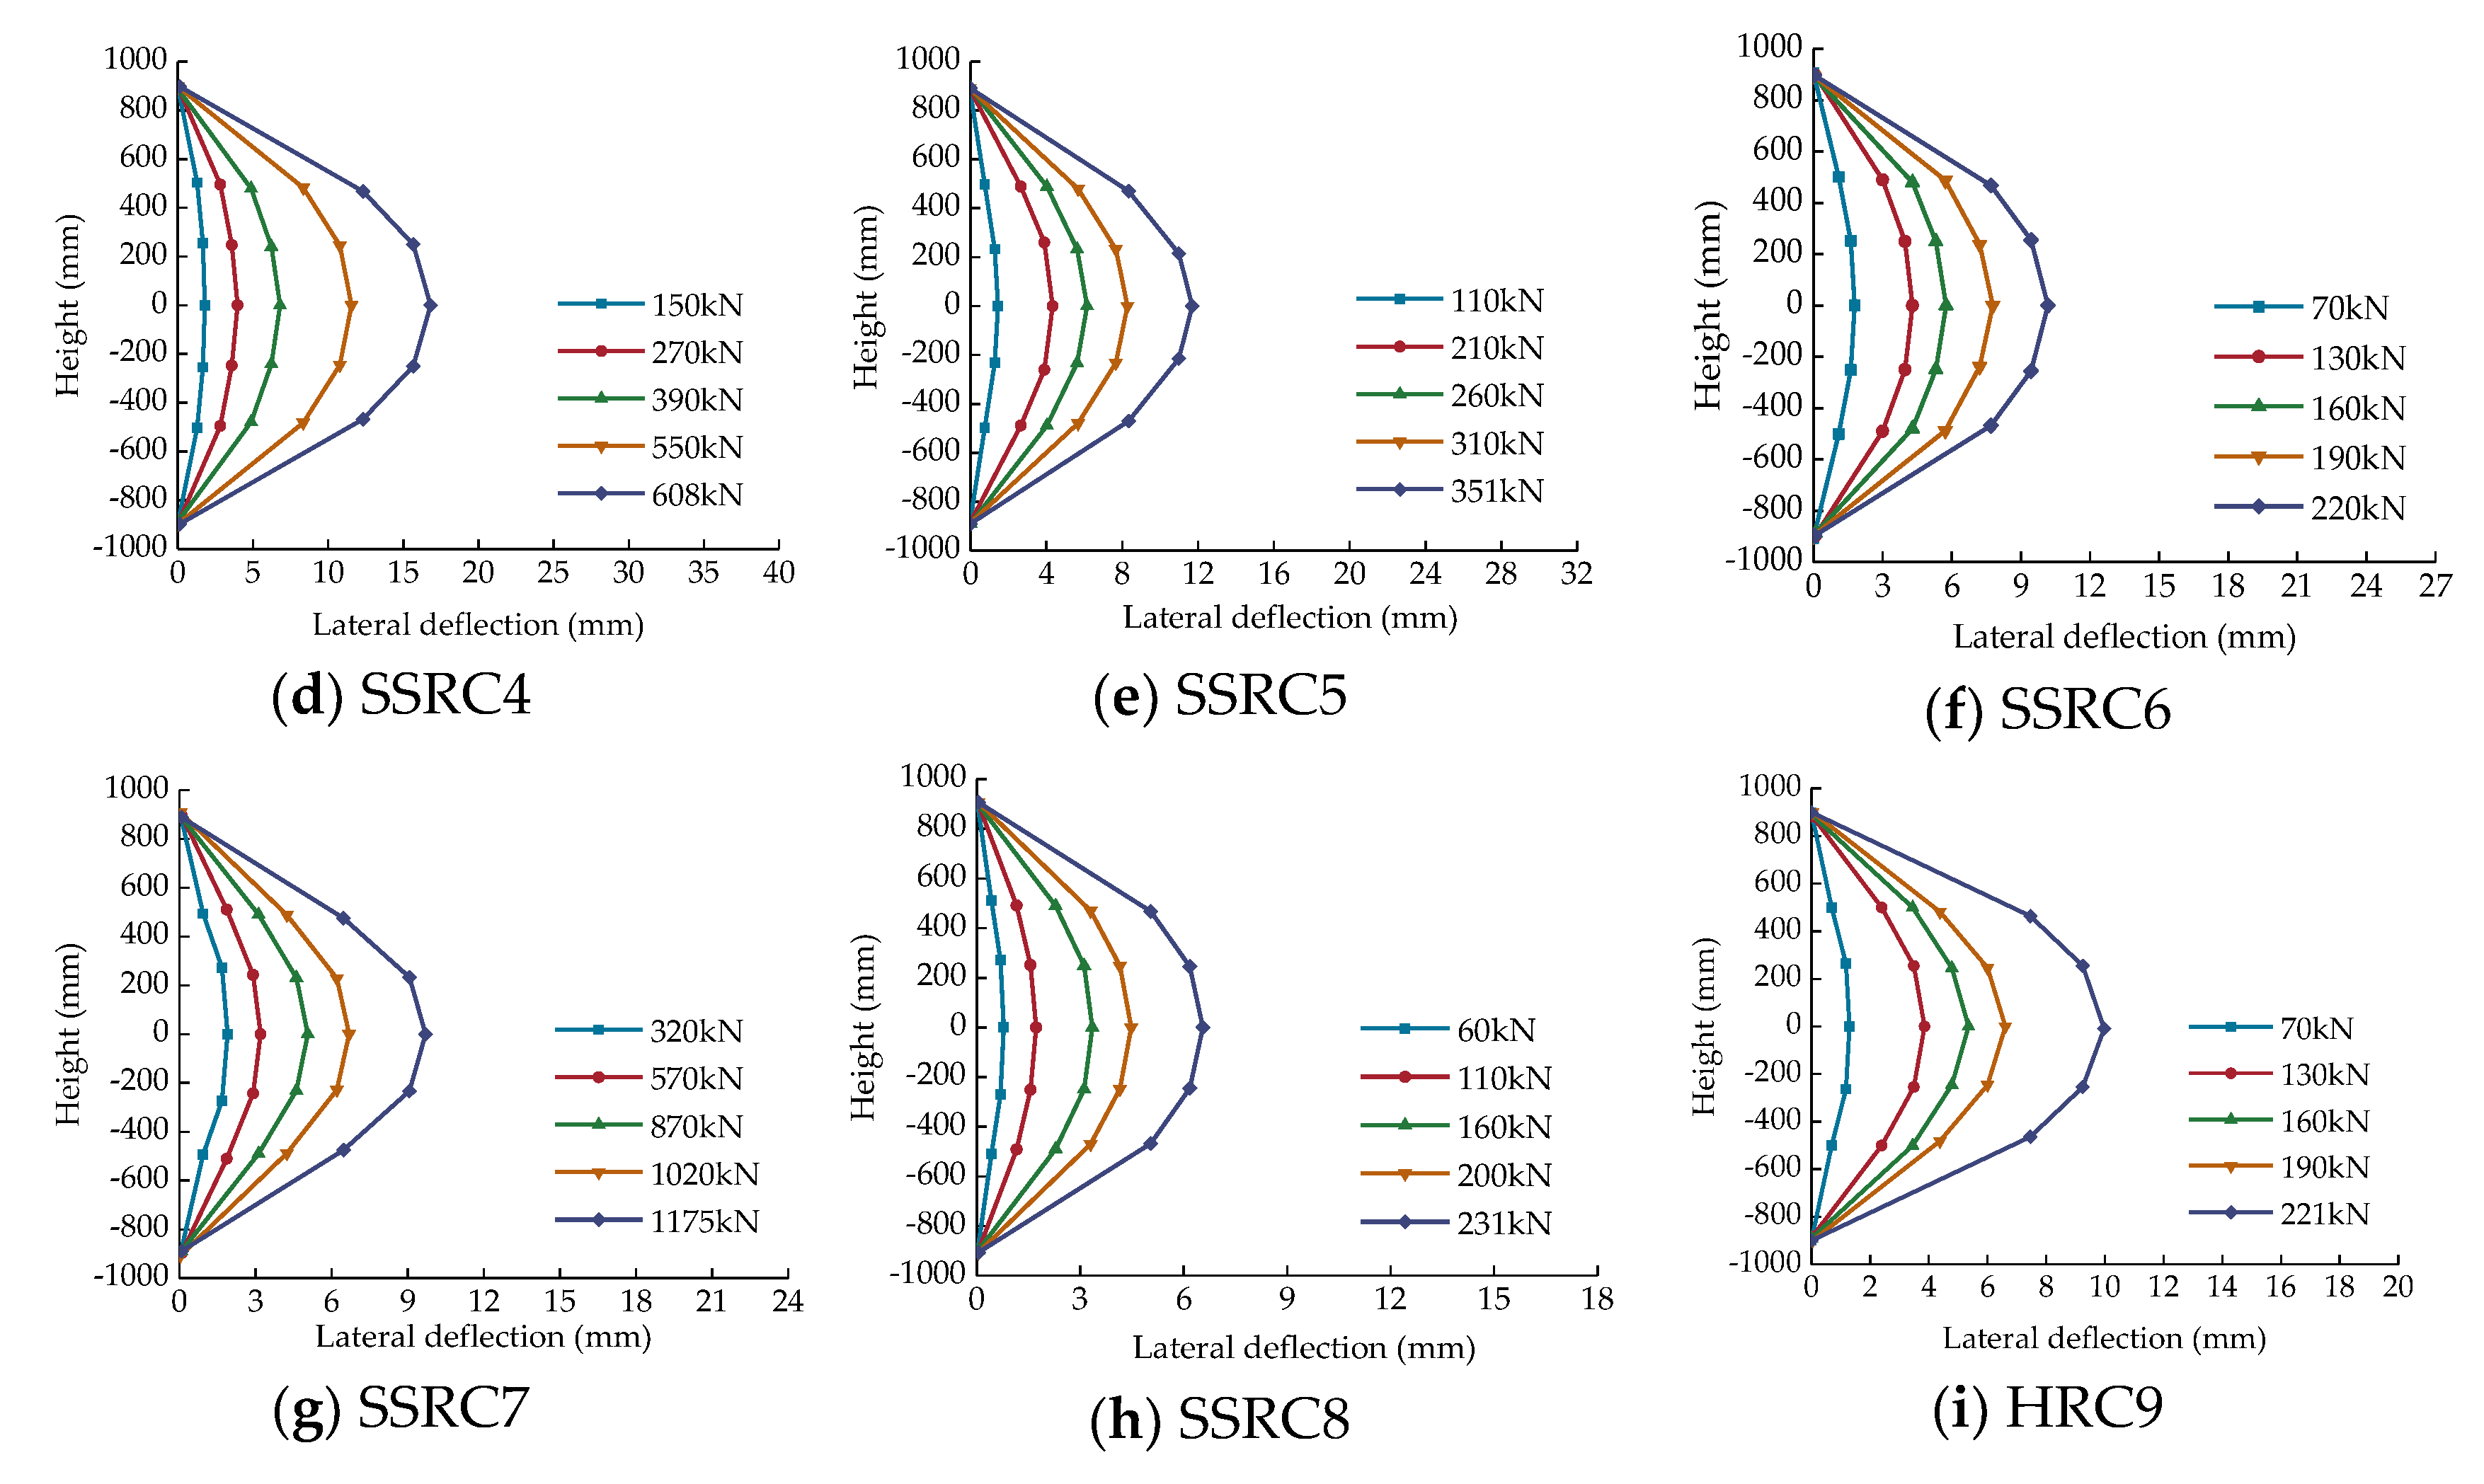
3.3. Load–Longitudinal Strain Curves

To analyze the effects of the eccentricity and reinforcement ratio on the load–longitudinal reinforcement strain curves, the specimens were divided into two groups: Group A (SSRC3, SSRC4, SSRC5, SSRC6, and HRC9) and Group B (SSRC2, SSRC6, SSRC8, and HRC9). Figure 7 exhibits the load–longitudinal reinforcement strain curves of the specimens.
The load–reinforcement strain curves under various eccentricity values are depicted in Figure 7a. With the same reinforcement ratio, the ultimate load increases as the initial eccentricity of the specimen decreases. Under the same load, the tensile reinforcement strain of SSRC6 is always greater than that of HRC9. The load–reinforcement strain curves under various reinforcement ratios with the same eccentricity are depicted in Figure 7b. Under the same level of load, the reinforcement strain of large eccentric specimens decreases with an increase in reinforcement ratio.

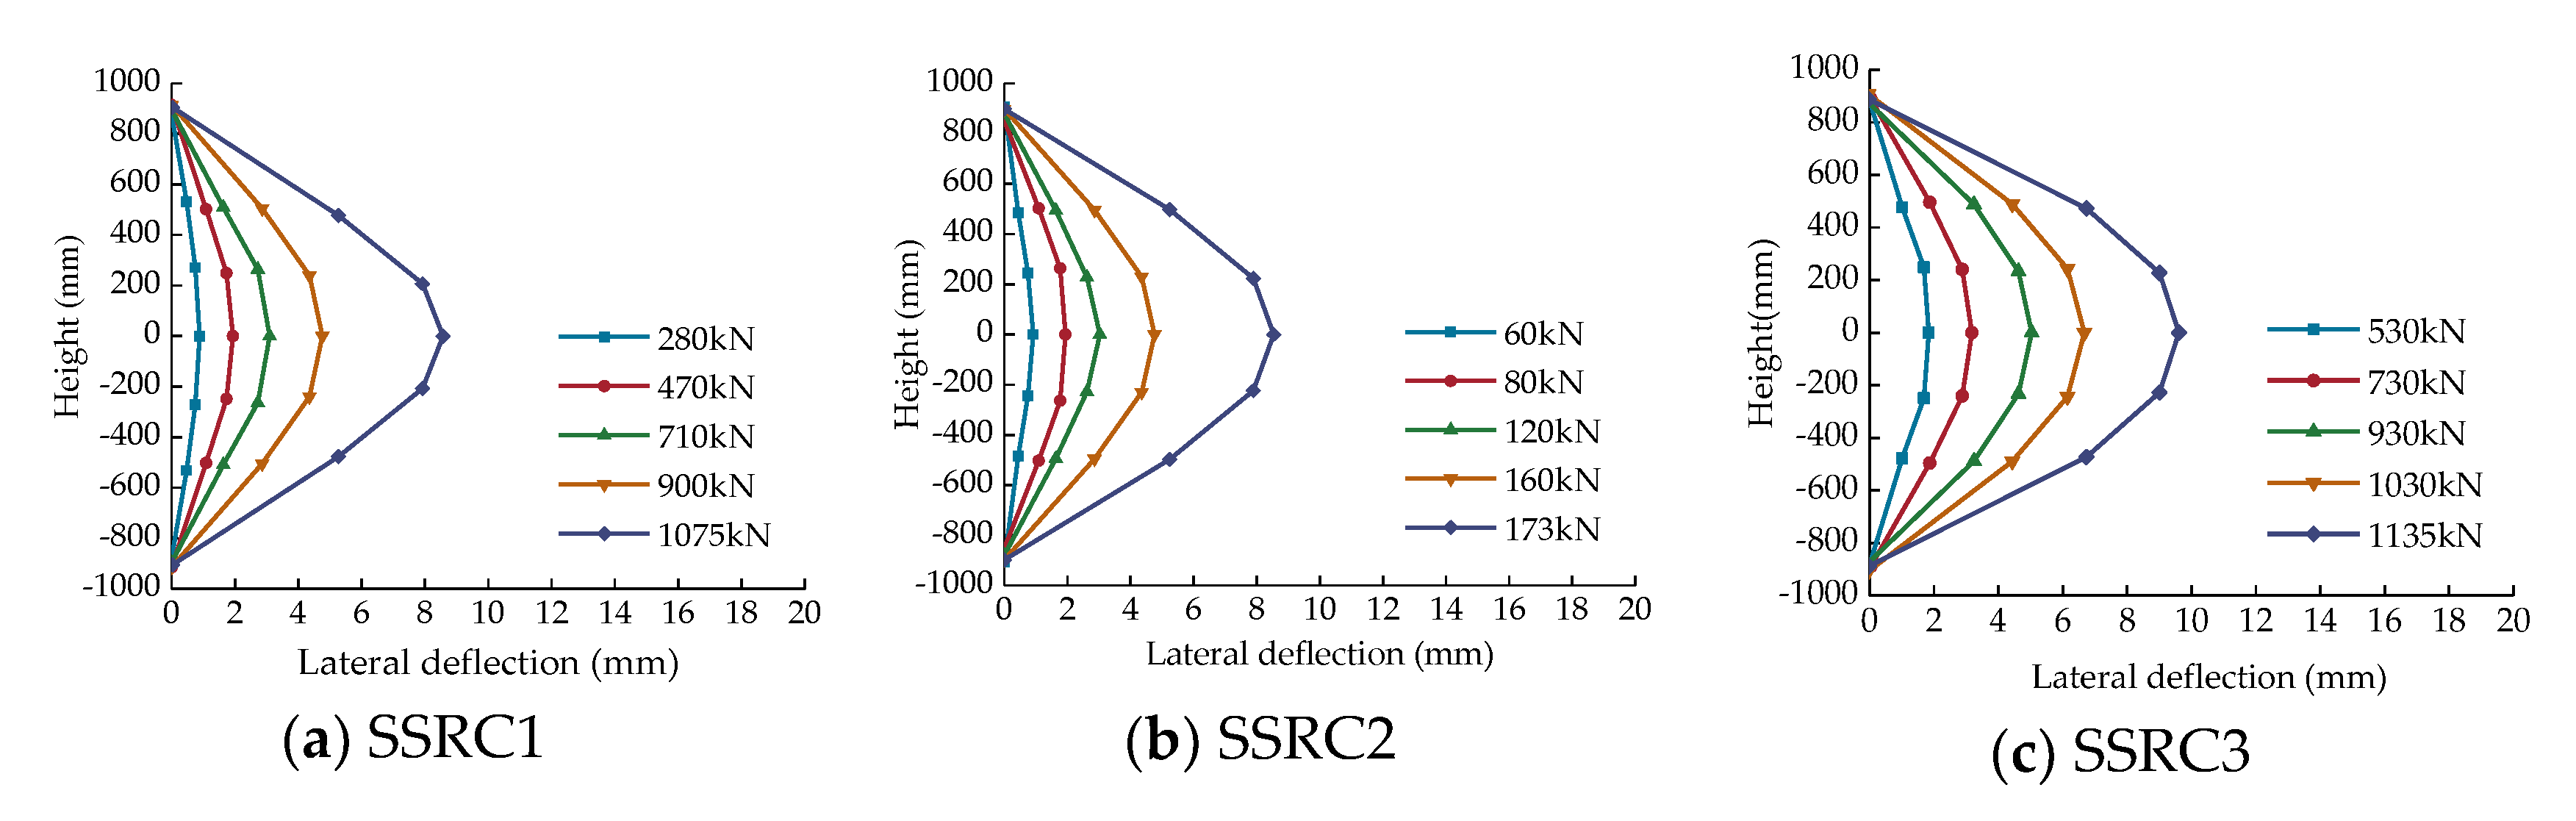
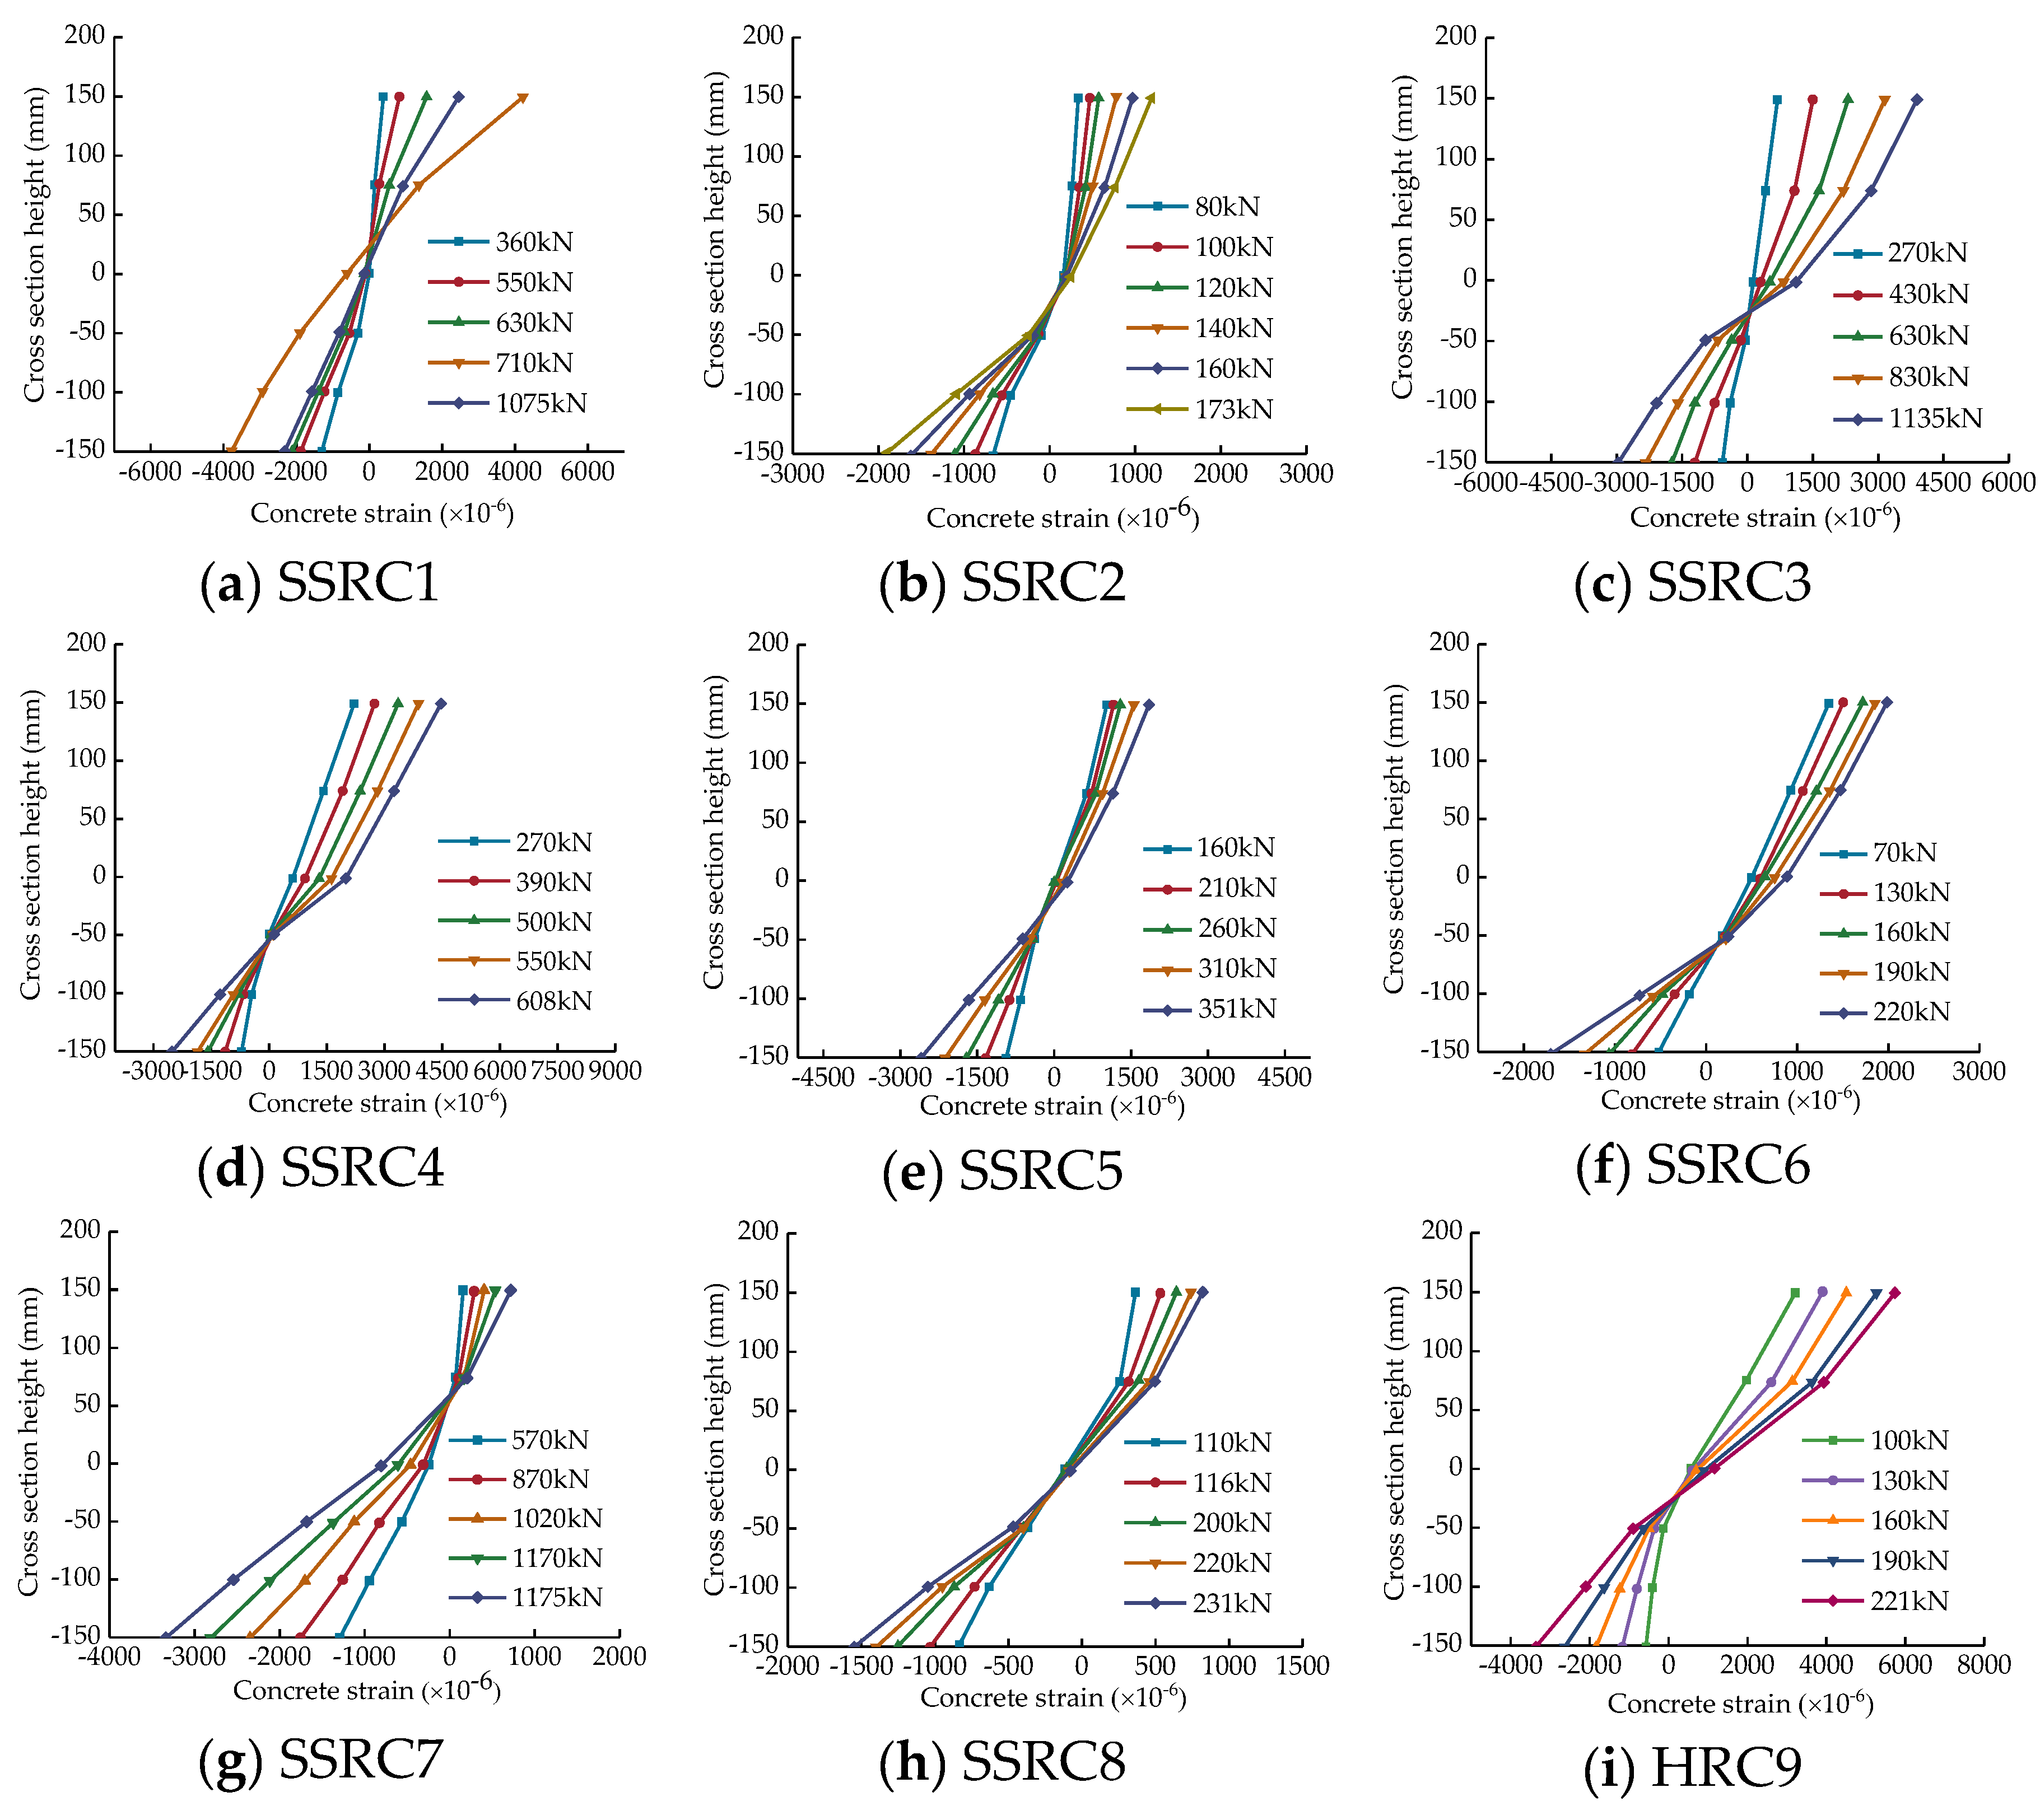
3.4. Strain Distribution

Figure 8 exhibits the concrete strain distribution at the midspan sections of the specimens under various loads. As the load increased, the neutral axis of the transverse section moved to the compression side. When damaged, the concrete strain changed suddenly owing to the sharp deformation of the cross section. It is evident from Figure 8 that the concrete strain in the midspan section is approximately linearly distributed before destruction, which means that the deformation of the specimen section conforms to the assumption of the plan section.

4. Analysis of Normal Section Capacity

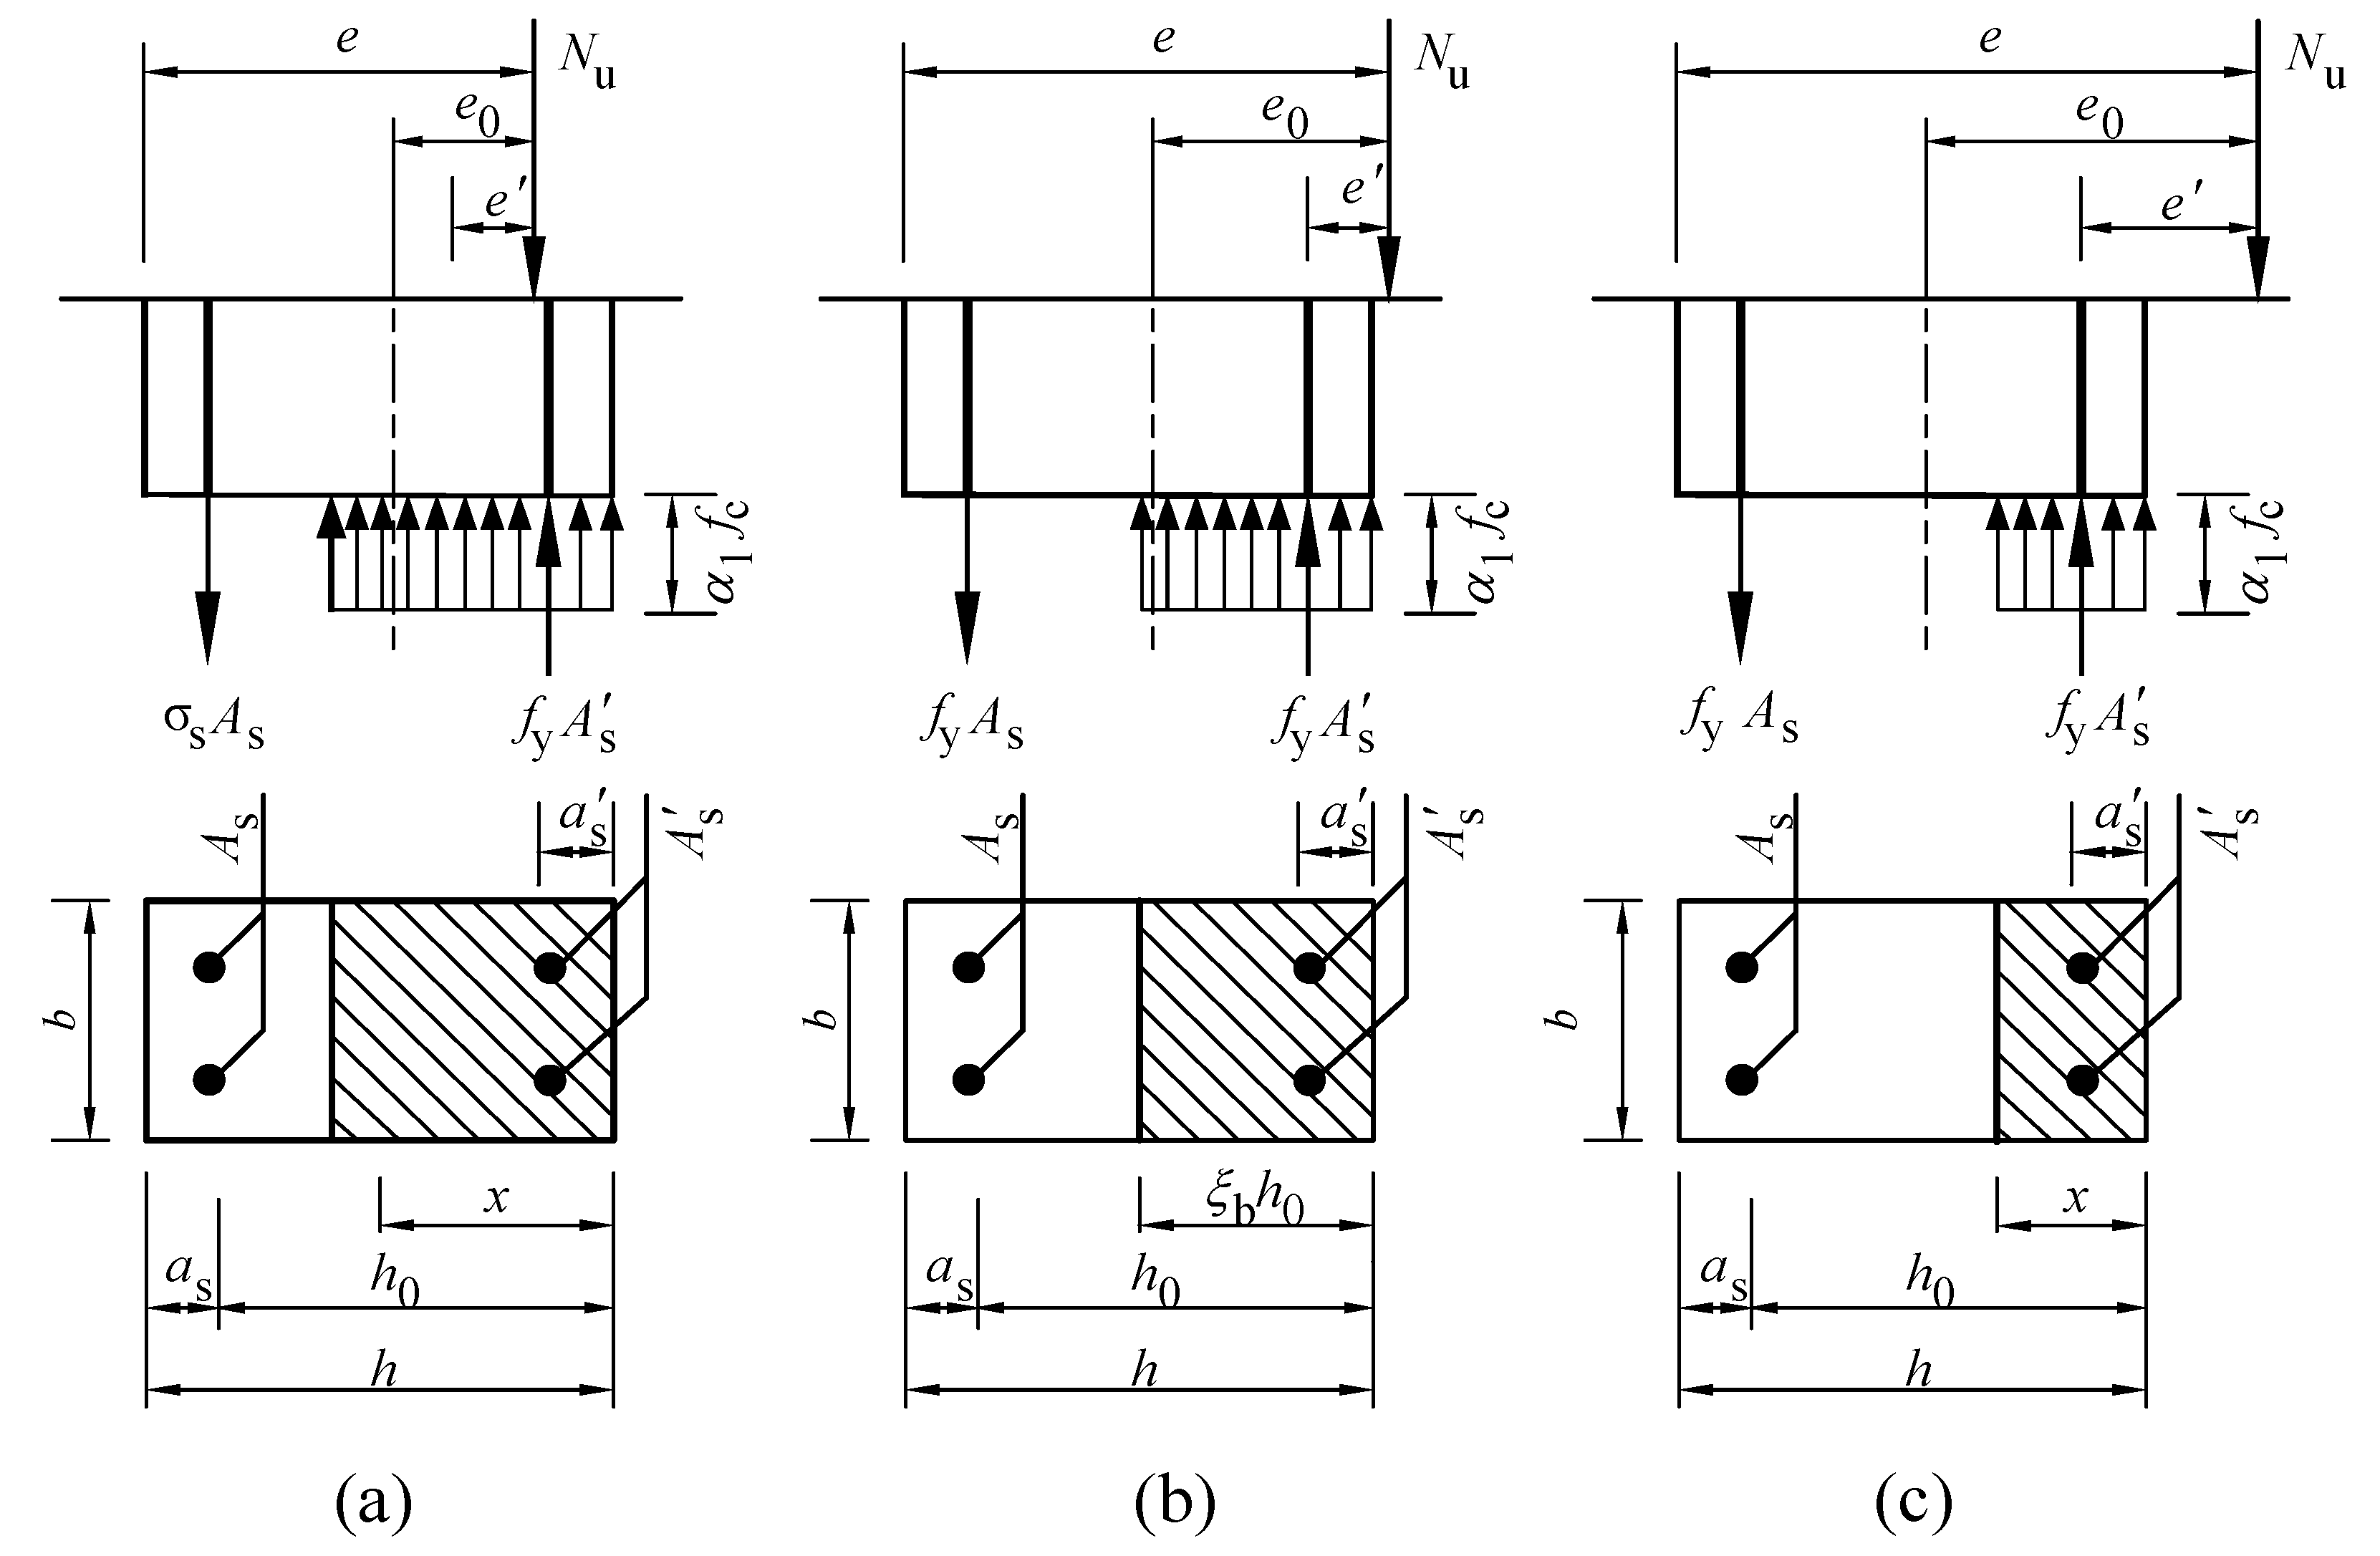
4.1. Existing Calculation Methods

The current codes, GB50010-2010 and ACI 318-14, do not provide specific guidelines for SSRC members. The basic models of the two codes are consistent; however, there are differences in the values of the cube concrete strength and the rectangular stress block factor. When the concrete cube strength is less than 50 MPa, there is almost no difference between the calculation results of the two codes without considering the reduction factor. Therefore, this section presents analytical research on the current calculation methods in GB50010-2010 [26] based on experimental and simulated data.

4.1.1. Basic Calculation Model

Based on the equilibrium conditions, the basic calculation equations of the normal section capacity are as follows:
{ N u = α 1 f c b x + f y A s σ s A s N u e = α 1 f c b x ( h 0 x 2 ) + f y A s ( h 0 a s ) e = e i + h 2 a s e i = e 0 + e a e a = min ( 20 mm , h 30 ) σ s = f y 0.8 ξ 0.8 ξ b f y σ s f y
where Nu is the ultimate load (kN), α1 is the rectangular stress block factor, fc is the concrete axial compressive strength (MPa), x is the height of the concrete compression zone (mm), fy is the yield stress (MPa), and σs is the tensile reinforcement stress (MPa); ξ and ξb are the relative and limiting relative heights of the compression zone, respectively. When σ s > f y (i.e., ξ ξ b ), σs = fy. When σ s < f y (i.e., ξ > 1.6 ξ b ), σs =−fy. Parameter e is the distance between the axial force point and the resultant point of the tensile reinforcement (mm). Parameter ei is the initial eccentricity (mm). Parameter e0 is the eccentricity (mm). Parameter ea is the additional eccentricity (mm). Some other size parameters are depicted in Figure 9.

4.1.2. Model Validation and Analysis

To verify the calculation model, the finite element analysis (FEA) model established in [24] was used to increase the sample size. The ultimate bearing capacities of models with various reinforcement areas, concrete strengths, eccentricities, and some other parameters are listed in Table 3. Based on the calculation methods and Equation (1), the calculated ultimate capacities of all the tested SSRC columns and FEA models are also summarized in Table 3. The corresponding average ratios of N u / N u t were 1.058 and 1.117, the standard deviations were 0.193 and 0.158, and the variation coefficients were 0.037 and 0.025. It can be noted that the deviation of the calculated results using the current equation is large for both the test columns and the FEA models. When the relative eccentricity, e0/h0, is small, the calculated result is smaller than the obtained result. When e0/h0 is significant, the calculation result is greater than the test result. This demonstrates Equation (1) cannot accurately calculate the ultimate load of SSRC columns under eccentric loading.

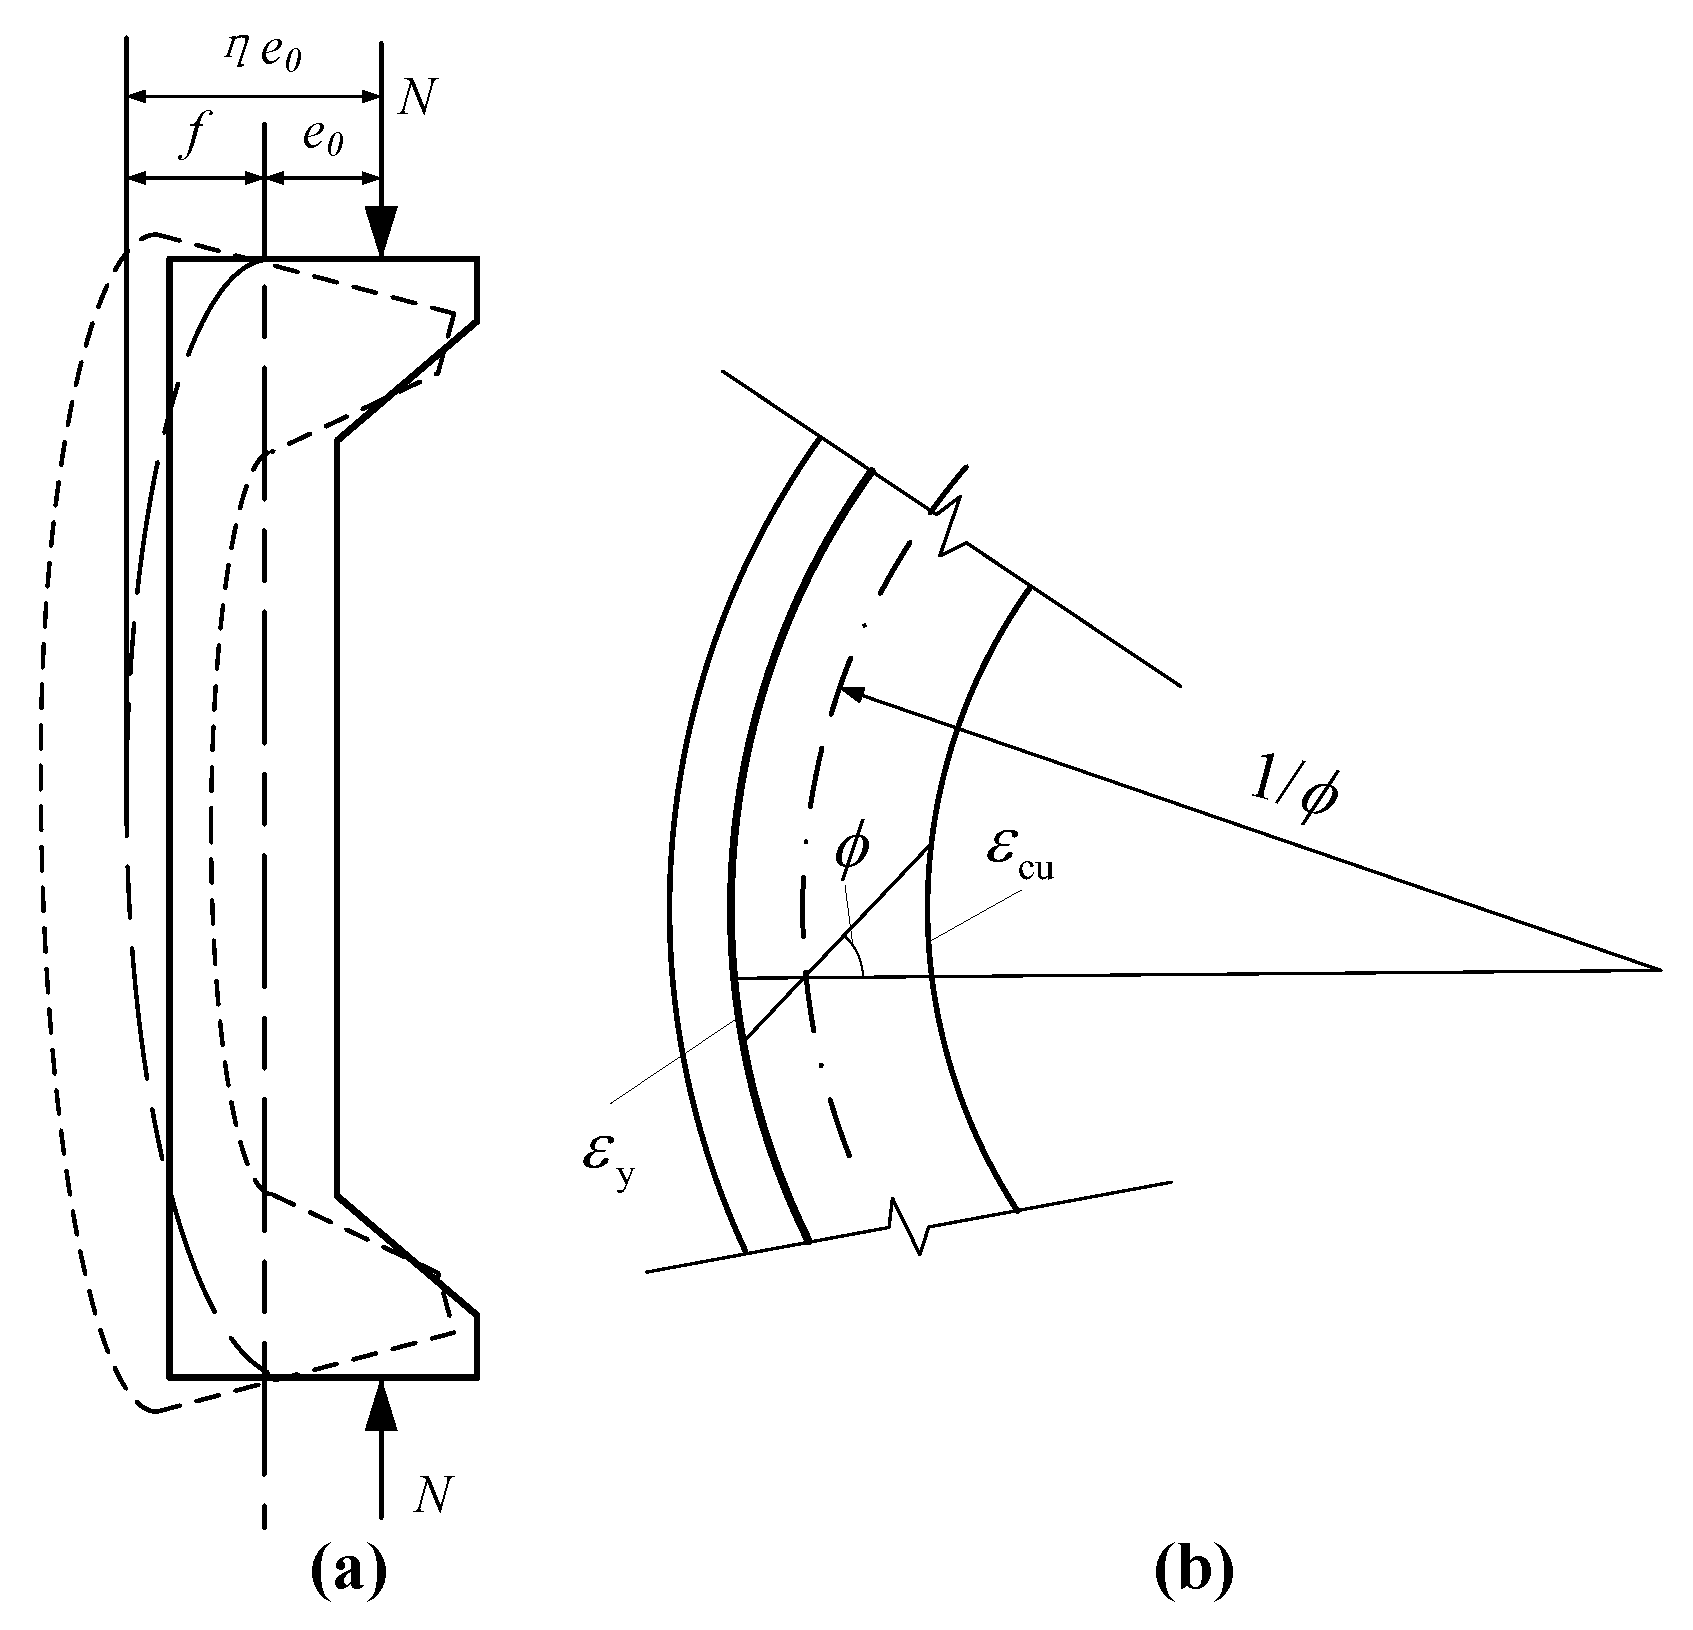
4.2. Model Optimization

The deviation between test value Nu and calculated value N u t is related to the additional bending moment generated by the SSRC columns during loading. In the existing empirical theory, for columns with a length-to-section-height ratio of l0/h0 ≤ 8, the additional bending moment (second-order effect) caused by the lateral displacement f is not considered. This means that specimens SSRC1–SSRC8 are regarded as short columns, and it is not necessary to consider the second-order effect when calculating their ultimate load. However, as depicted in Figure 6, the experimental SSRC columns produced significant lateral displacements, which varied with the load. Therefore, the second-order effect should be considered when calculating the ultimate load of SSRC columns.
The mechanical properties of SSRC members are different. When using the increasing eccentricity method in GB50010-2010 or the increasing bending moment method in ACI 318-14, the deviation is reduced; however, the results are still not accurate. As is evident from the data in Table 3, this deviation is also linked to relative eccentricity e0/h0. Therefore, based on the test and simulation results, a calculation method for amplification factor η of eccentricity for SSRC columns is proposed. As depicted in Figure 10, the initial eccentricity can be calculated as
e i = e 0 + f = ( 1 + f e 0 ) e 0 = η e 0
Assuming that the lateral displacement curves of the SSRC columns are sinusoidal, the lateral deflection is given as
f = ϕ l 0 2 π 2
where ϕ is the sectional curvature at failure, as seen in Figure 10b. The relationship among concrete strain εcu, reinforcement strain εy, and ϕ can be denoted as follows:
ϕ = ε cu + ε y h 0
Based on the above equations and considering the impact of the relative eccentricity, η can be expressed as
η = 1 + ( ε cu + ε y ) l 0 2 π 2 h 0 e 0
where ζ is the correction coefficient of the sectional curvature related to the relative eccentricity. Based on the test and FEA results, ζ can be denoted as follows:
ζ = 7.4 e 0 h 0 0.3

4.3. Validation

The optimization model substitutes the calculation method for ei in Equations (2)–(6) into Equation (1) to calculate the ultimate load. Based on the aforementioned optimization model, the calculated ultimate loads of all test and FEA columns are depicted in Table 3. The average N u / N u t ratios were 0.933 and 0.959, the standard deviations were 0.096 and 0.030, and the variation coefficients were 0.009 and 0.001 for test and FEA columns, respectively. It can be concluded that the calculated values of the optimization model are slightly smaller than the real values. In general, it is safe and reliable to use the optimization model to calculate the ultimate load of SSRC columns.

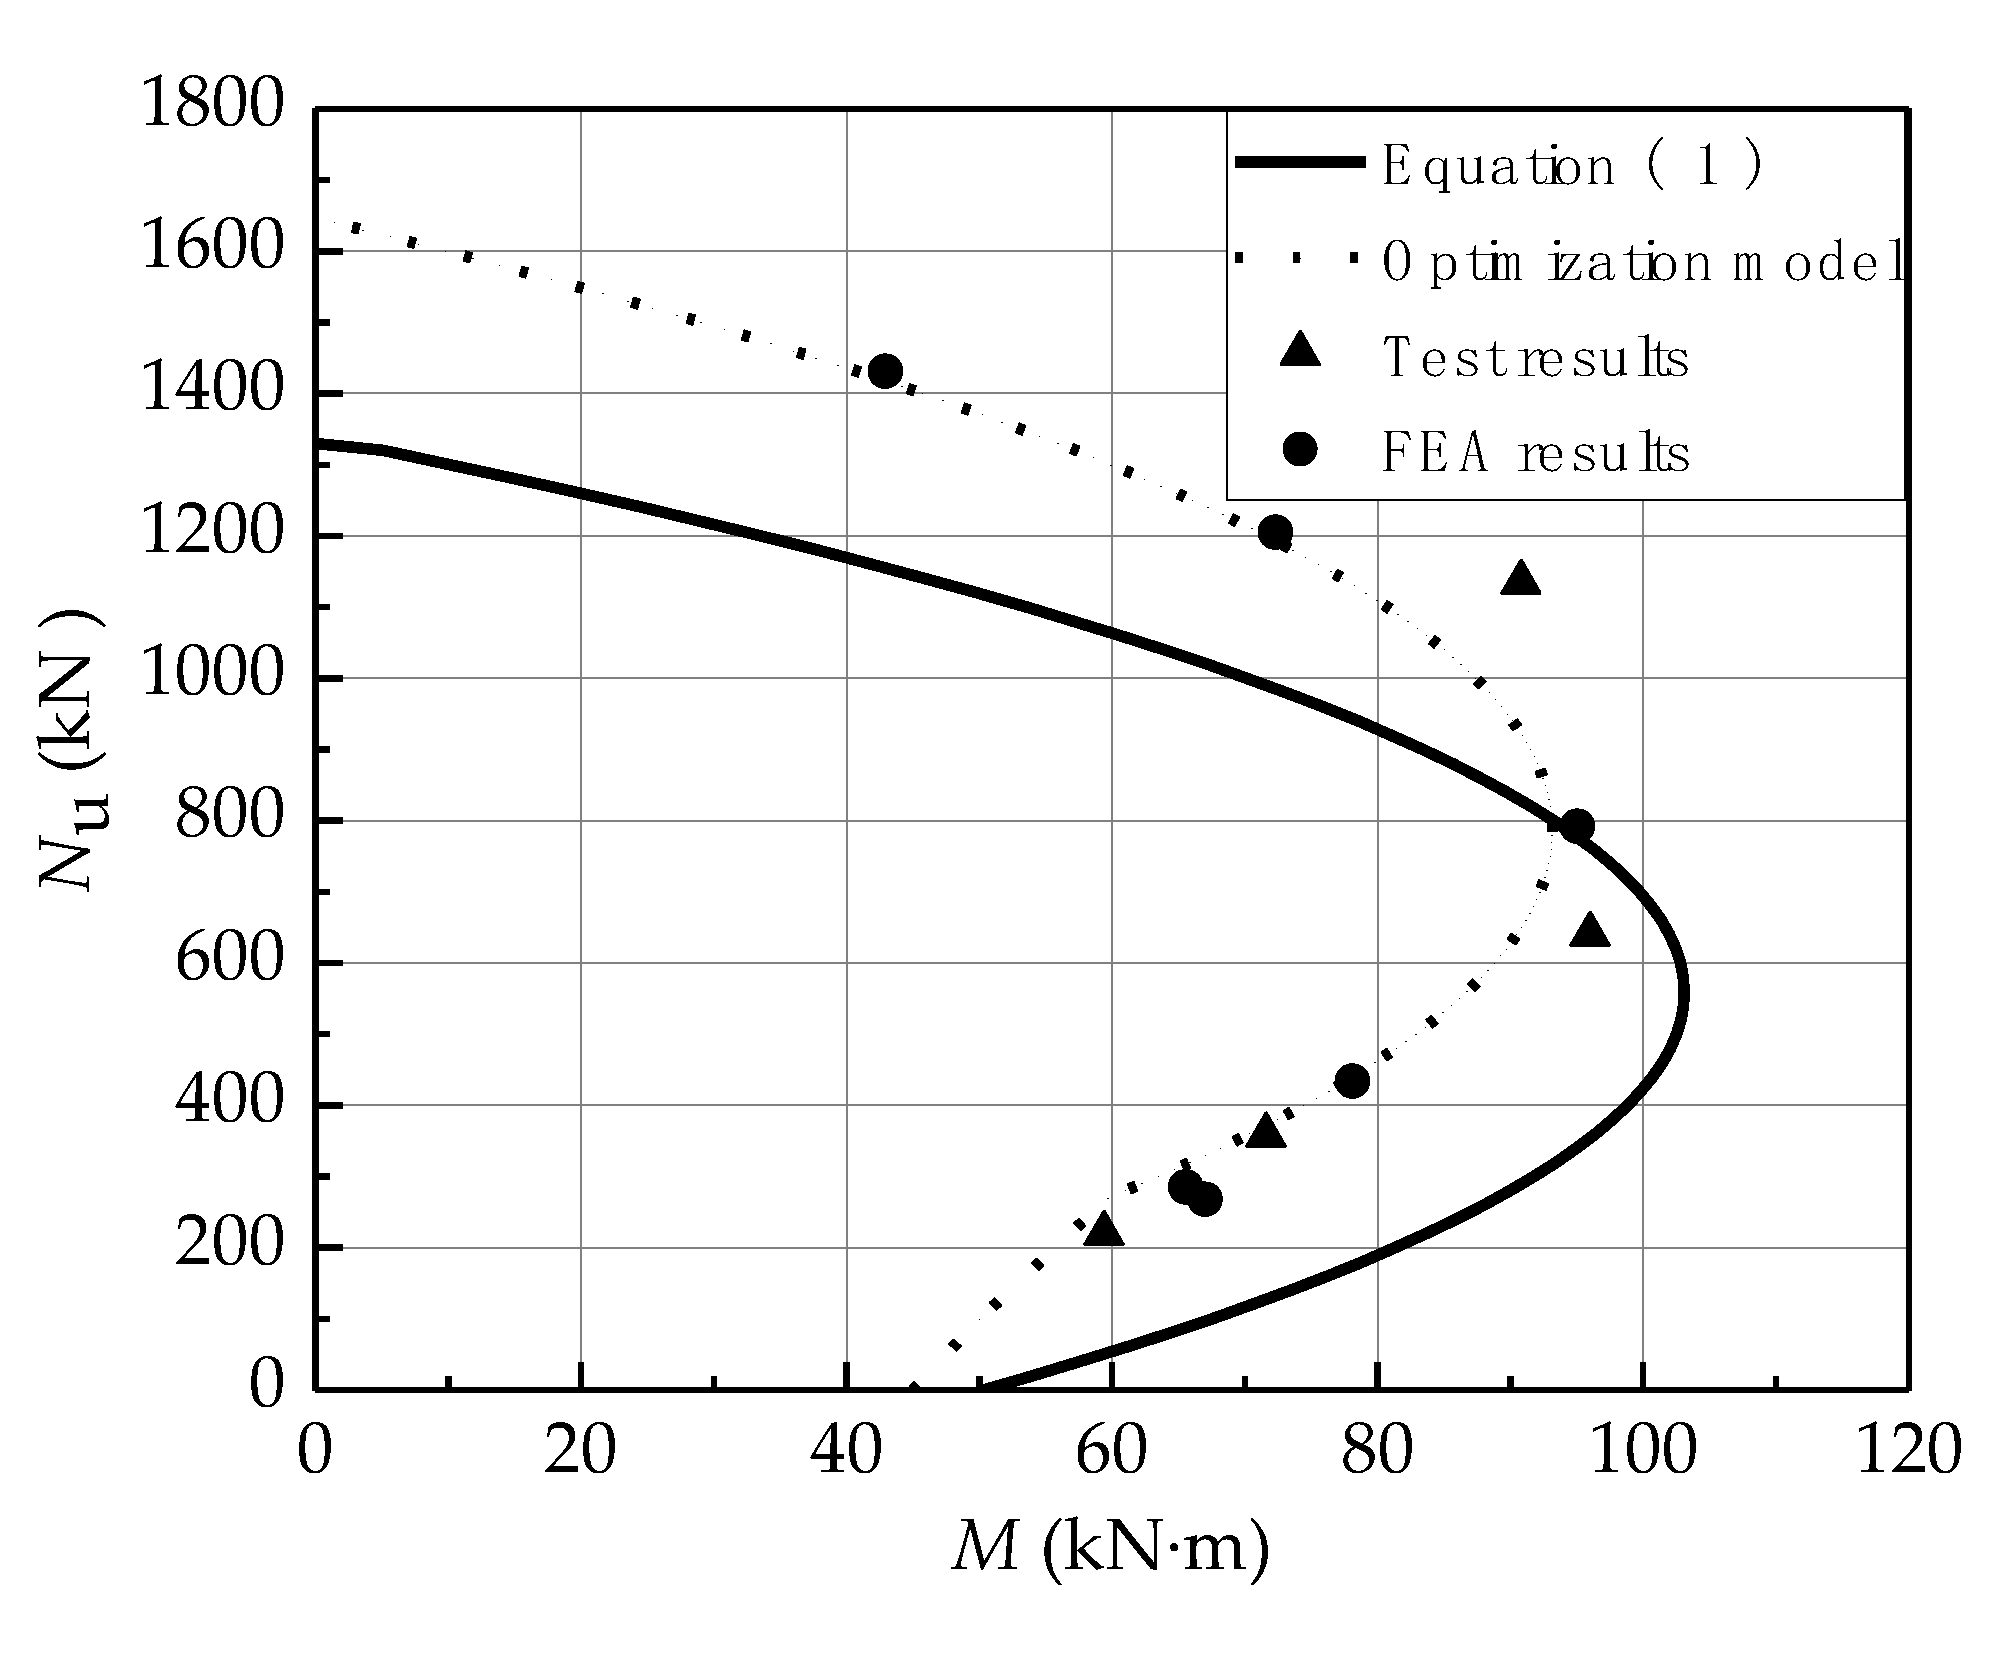
4.4. Ultimate Load–Bending Moment Curve

The ultimate load–bending moment (NuM) curves of SSRC columns can be calculated using Equation (1) and the optimization model. For fc = 20.1 MPa and AS = AS = 30 mm2, the NuM curves for various eccentricities are depicted in Figure 11. The NuM curve of the optimization model is consistent with the test and FEA results, and the predicted results always remain safe. In addition, these results indicate that the mechanical properties of SSRC columns perform better when the relative eccentricity is smaller.

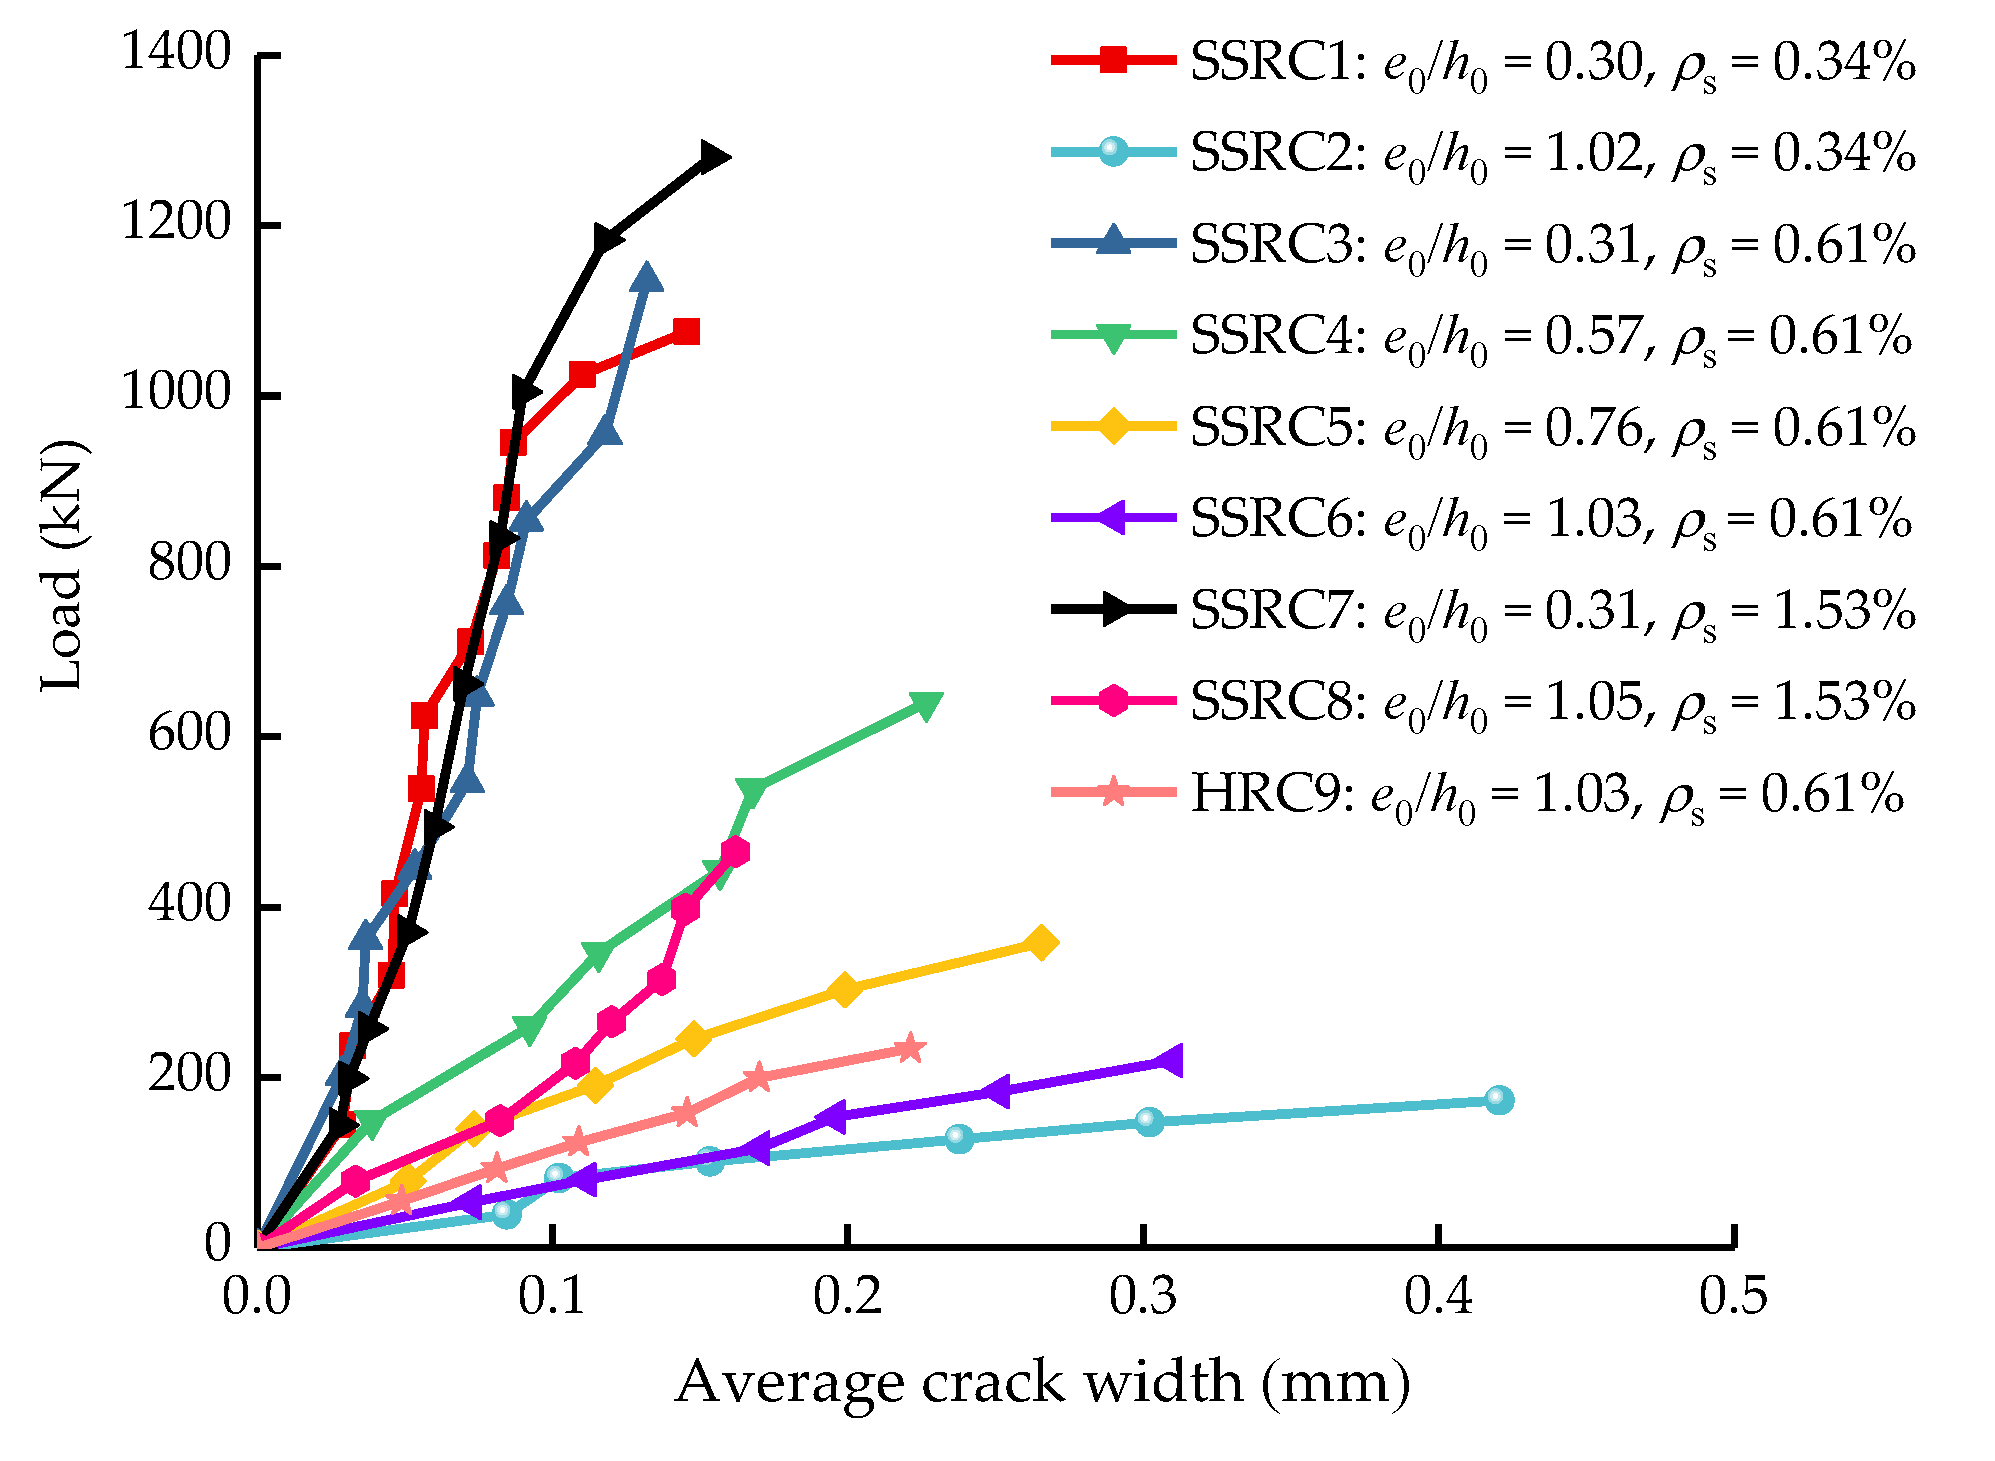
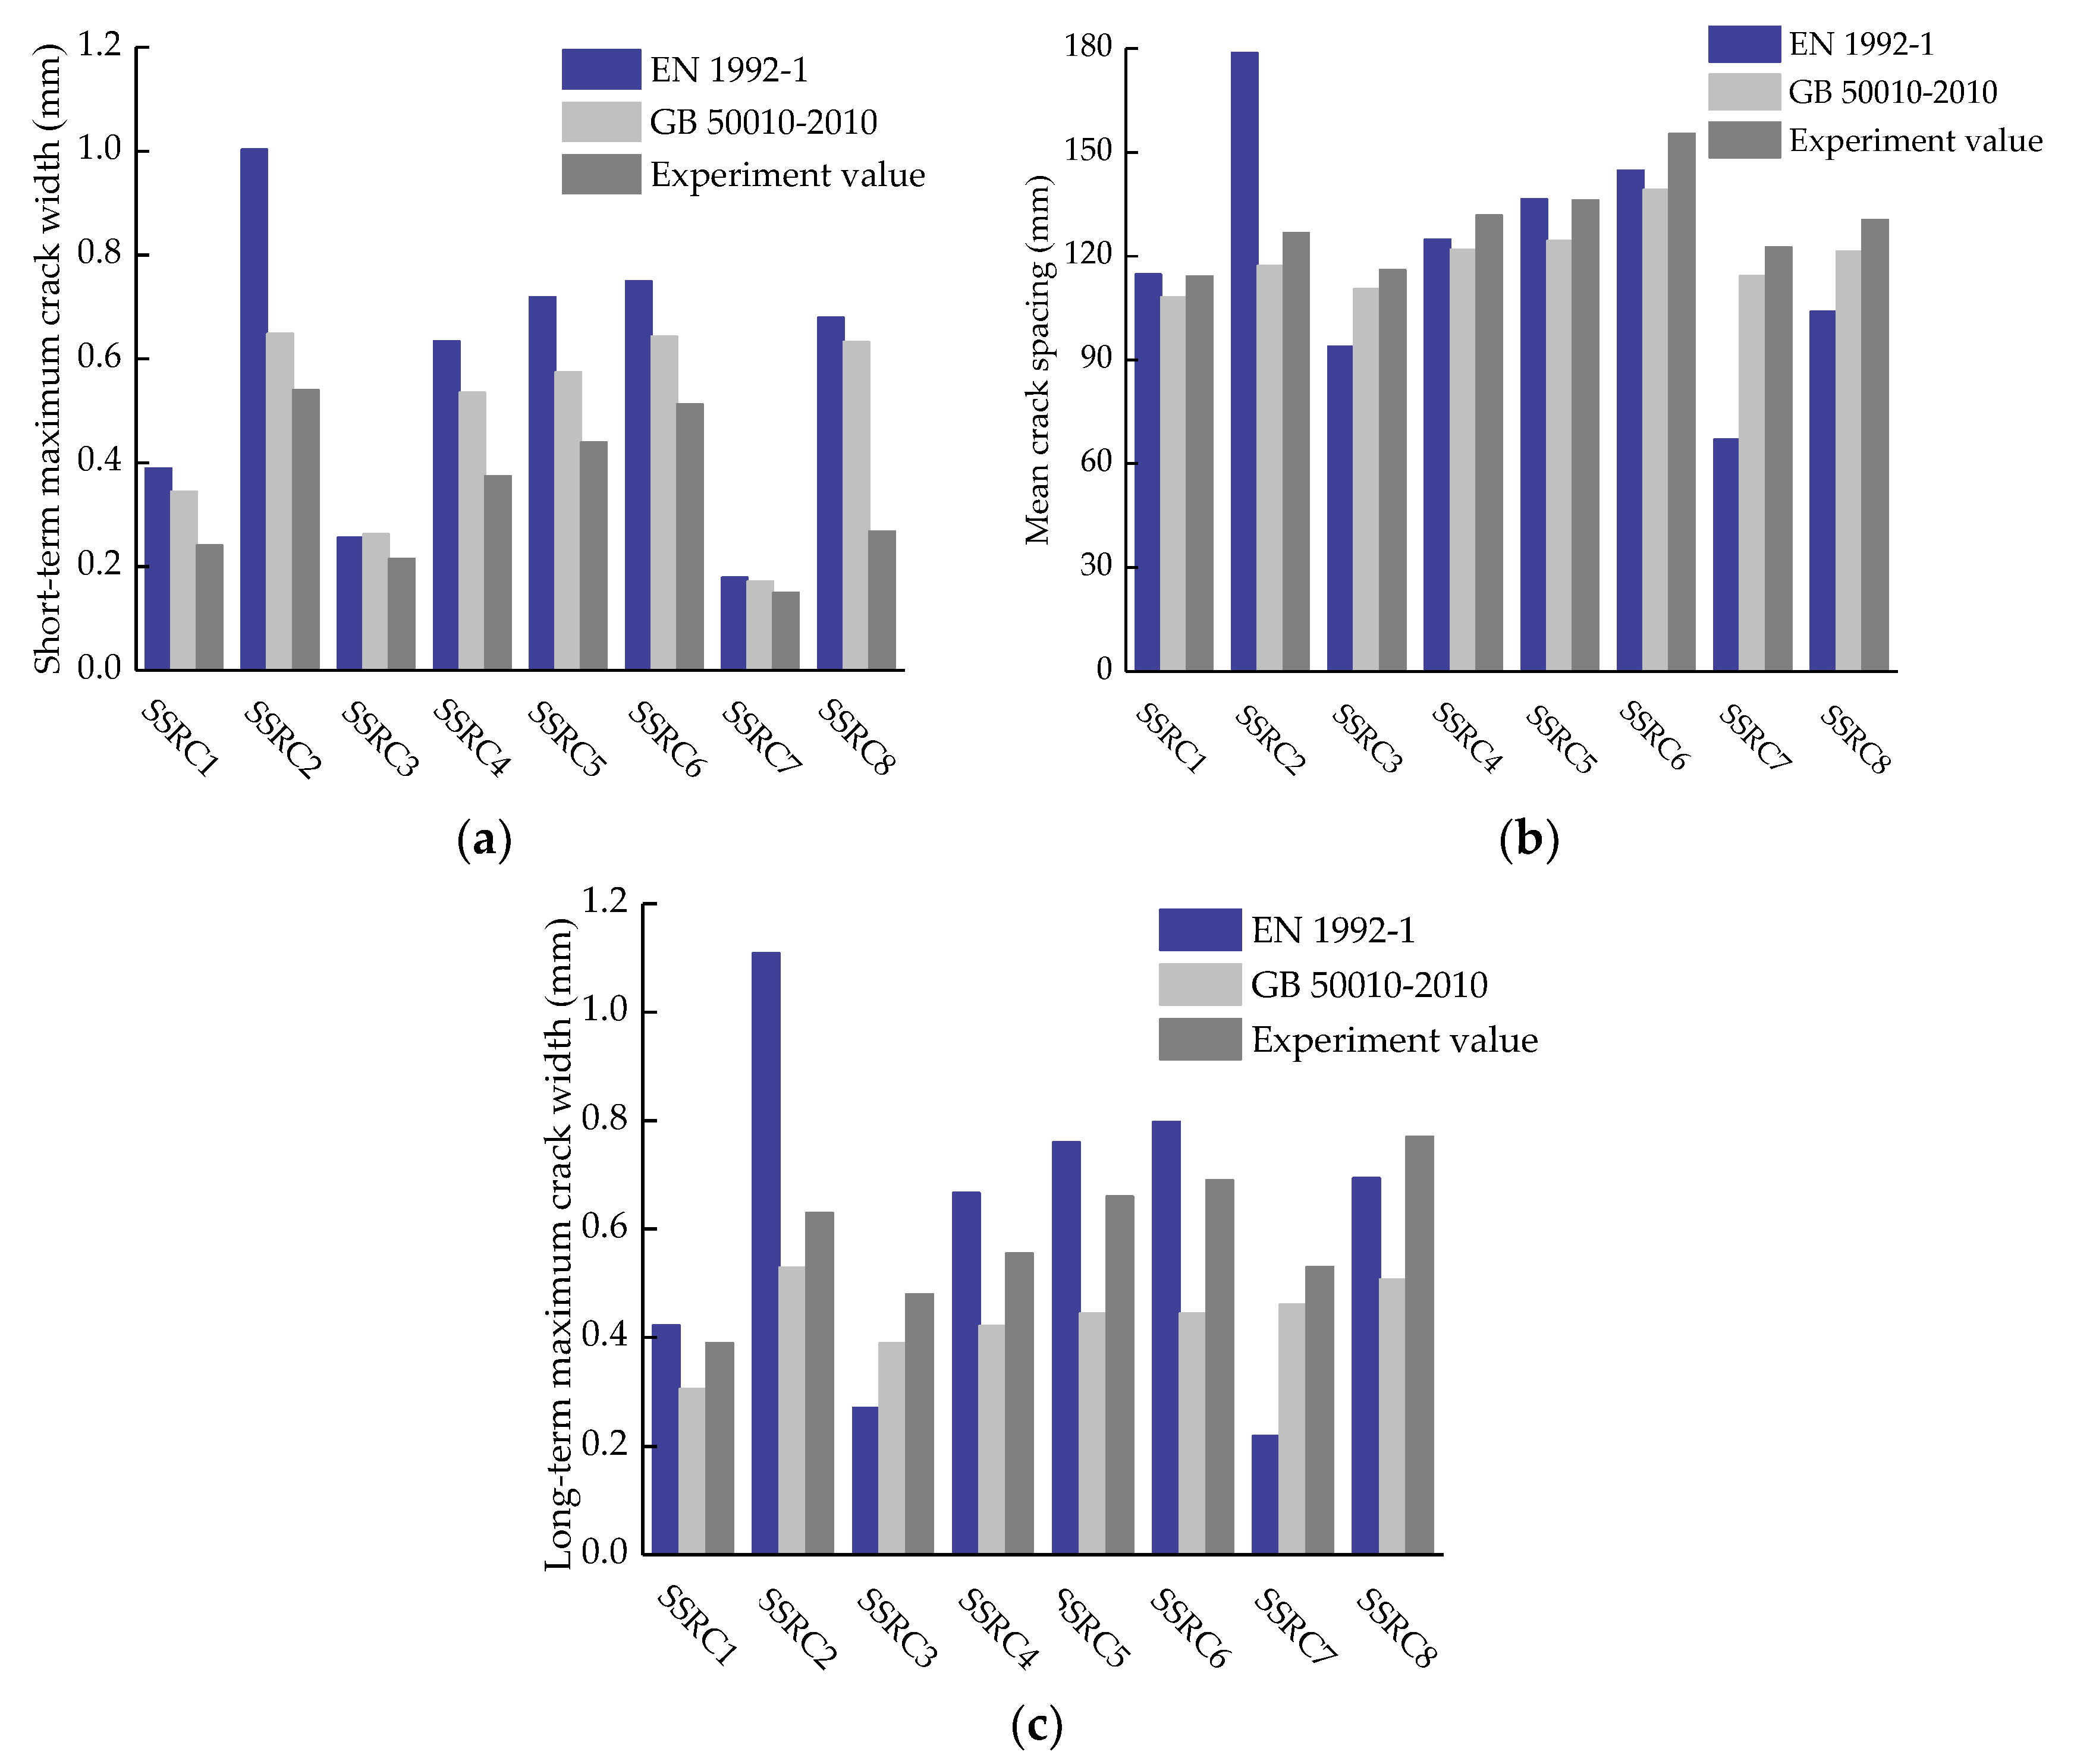
5. Crack Width Analysis

5.1. Load–Crack Curve

The ultimate load–average crack curves of specimens are depicted in Figure 12. The average crack widths of the SSRC columns at failure were between 0.13 and 0.42 mm. Under the same eccentricity, the average crack width increased with a decrease in the reinforcement ratio. For the SSRC columns under small eccentric compression, the change in the reinforcement ratio has a negligible effect on the crack development when compared with the eccentricity. In addition, the development of the crack widths is similar for SSRC6 and HRC9 under the same conditions.

5.2. Calculation Models for Crack Width

The calculation models for the crack width are summarized in the following subsections.

5.2.1. GB 50010-2010

The equations of the maximum crack width for the long-term load in GB 50010-2010 are listed as follows:
w max l = α cr ψ σ sk E s ( 1.9 c + 0.08 d eq ρ te )
ψ = 1.1 0.65 f tk ρ te σ sk
where αcr is the force characteristic coefficient, ψ is the strain nonuniformity coefficient of the longitudinal reinforcement between the cracks, σsk is the tensile reinforcement stress under standard load, Es is the elastic modulus of the reinforcement, c is the thickness of the protective layer of the outside tensile reinforcement, deq is the equivalent diameter of tensile reinforcement, ρte is the converted longitudinal reinforcement ratio, and ftk is the standard value of the concrete tensile strength.
The maximum crack width for the short-term load is defined as follows:
w max s = w m × τ s
where wm is the average crack width and τs (= 1.90) is the expansion factor. When long-term effects are considered, expansion coefficient τ1 = 1.5.

5.2.2. EN 1992-1

In EN 1992-1, the crack width and maximum crack spacing are calculated as follows:
w k = S r , max   ( ε sm ε cm )
S r , max = k 3 c + ϕ k 1 k 2 k 4 ρ p , eff
ε sm ε cm = σ s k t f et , eff ( 1 + α e ρ p , eff ) ρ p , eff E s 0.6 σ s E s
where Sr,max is the maximum crack spacing, εsm is the average strain of the reinforcement under the relevant load combination, εcm is the average strain of concrete between cracks, k1 is the coefficient of the bonded reinforcement, k2 is the strain distribution coefficient, k3 and k4 are two empirical coefficients (the recommended values are 3.4 and 0.425, respectively), c’ is the cover to the longitudinal reinforcement, ρp,eff is the effective reinforcement ratio for longitudinal reinforcement, ϕ is the diameter of the reinforcement, and αe is the ratio of the elastic modulus of the reinforcement to the secant modulus of elasticity of concrete; kt is a factor dependent on the duration of the load, taking a value of 0.4 for the long-term load and a value of 0.6 for the short-term load.

5.3. Comparison of Calculation Results

As is evident in Figure 13a, both codes give accurate predictions when calculating the maximum crack width for the short-term load. The average ratio of the measured maximum crack width (wmax,s) to the short-term maximum crack width ( w max , s EN ) calculated by EN1992-1 is 0.685, and the variation coefficient is 0.324. The average value of w max , s / w max , s GB is 0.738, and the variation coefficient is 0.223.
It is evident from Figure 13b that the average ratio of the measured concrete crack spacing (L) and the crack spacing LEN calculated by EN1992-1 is 1.143, and the variation coefficient is 0.132. The average value of L/LGB is 1.078, and the variation coefficient is 0.053. The measured average crack spacing of all SSRC specimens is greater than and close to the value calculated using GB 50010-2010, which indicates that the calculation results are safe and conservative.
The calculated and experimental values of the long-term maximum crack widths are compared in Figure 13c. Based on EN1992-1 and GB 50010-2010, the long-term maximum crack widths w max , l c of eight SSRC columns under eccentric compression are calculated. The average values of w max , l / w max , l c obtained using EN1992-1 and GB 50010-2010 are 1.169 and 1.341, and the variation coefficients are 0.229 and 0.201, respectively. The calculation results of w max , l c using EN1992-1 are always safe; however, the results do not satisfactorily comply with wmax,l. The calculation result of w max , l c using GB 50010-2010 is less than wmax,l; however, it has a better correlation with wmax,l.

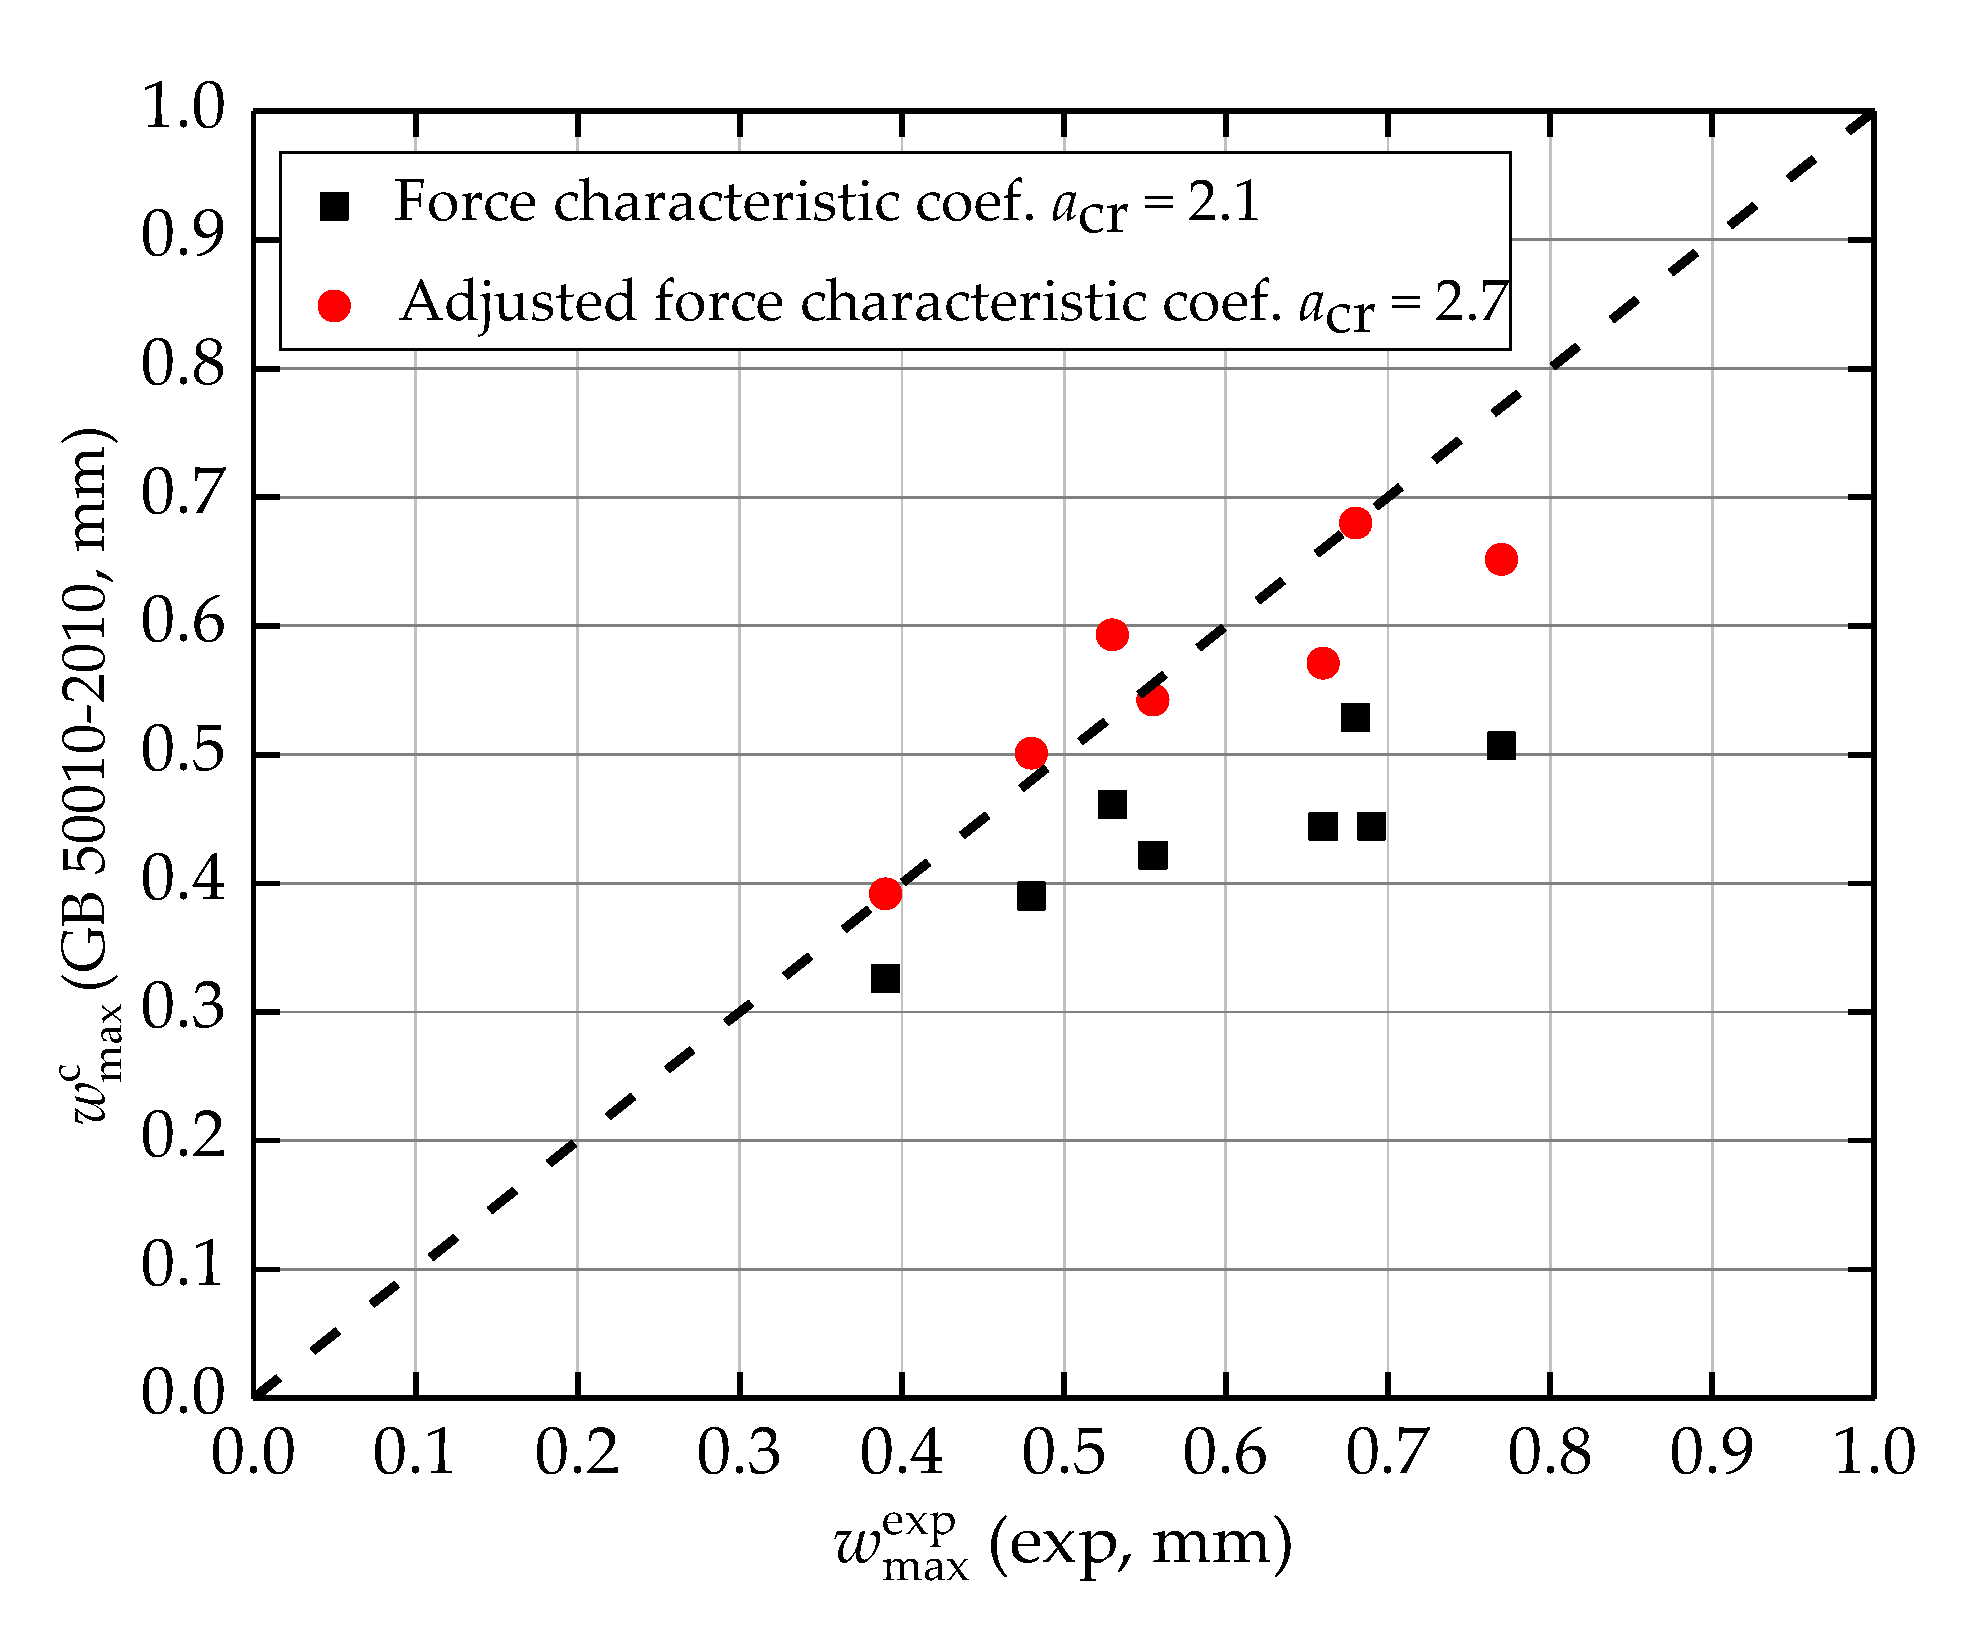
5.4. Revision of Force Characteristic Coefficient

Considering the aforementioned results, it is not appropriate to use directly these two codes to calculate the maximum crack width of SSRC columns under the long-term load for the following reasons: First, the low elastic modulus and high strength of stainless steel reinforcements increase the ductility and lateral displacement SSRC columns. The large displacement results in a large maximum crack width in the SSRC column. In addition, the bonding properties of stainless-steel reinforcements and concrete differ from those of traditional reinforced concrete and have an effect on the crack width.
Considering the good correlation between the calculation results of GB 50010-2010 and the test values, GB 50010-2010 is still used to calculate the crack width of SSRC columns under long-term loads, and only αcr needs to be adjusted. Based on the existing test results, it is recommended to set αcr to 2.7. As depicted in Figure 14, the revised theoretical calculation value, w max c , of the long-term maximum crack width is more consistent with the measured values, w max exp   , of SSRC columns. The average value of w max exp / w max c is 1.034, and the variation coefficient is δ = 0.0733.

6. Conclusions

In this study, one ordinary reinforced concrete column and eight SSRC columns were tested under eccentric compression. Furthermore, the SSRC columns were theoretically analyzed based on the finite element model and current codes. The following conclusions were obtained:
  • Eccentricity had a significant effect on the failure mode of SSRC columns. The failure modes of SSRC columns under eccentric compression were similar to those of ordinary reinforced columns.
  • SSRC columns exhibited good ductility under load. At the ultimate load, the load of the specimens under small eccentricity decreased rapidly, whereas the others under large eccentricity could still maintain a certain displacement growth.
  • The lateral displacement curves of SSRC columns were symmetrically distributed along the middle and were approximately sinusoidal. Under the same eccentricity, the reinforcement ratio had negligible effect on the lateral displacement corresponding to the ultimate load.
  • The mechanical properties of SSRC columns under small eccentric compression were better than expected; however, the ultimate loads under large eccentric compression were lower than the theoretical values. Therefore, the effects of the relative eccentricity and characteristics of stainless-steel reinforcement on the second-order effect were considered. An optimization model of the ultimate load of SSRC columns was proposed. The calculation results of this model were accurate and safe, and the NuM curve obtained was in agreement with the test and FEA results. Therefore, it is recommended to regard SSRC columns as slender columns and use the proposed optimization model to calculate the ultimate loads of SSRC columns in practice.
  • For the SSRC columns under small eccentric compression, changes in the reinforcement ratio have a negligible effect on the crack development when compared with changes in the eccentricity. The average crack widths of SSRC columns at failure were between 0.13 and 0.42 mm.
  • Based on the existing experimental results, the value of αcr in the crack width calculation formula for the SSRC columns under the long-term load was set to 2.7. The calculated results for the long-term crack width at αcr = 2.7 were in good agreement with the experimental results, and the relative error was less than 4%.

Author Contributions

Conceptualization, Q.L.; experiment, Y.Z., Y.K. and W.G.; software, W.G.; validation, Y.K. and W.G.; resources, Q.L.; writing—original draft preparation, Y.K.; writing—review & editing, W.G.; supervision, Q.L.; project administration, Q.L. All authors have read and agreed to the submitted version of the manuscript.

Funding

This research was funded by the National Natural Science Foundation of China (No. 51679220) and the Open Project Fund of Research Center on Levee Safety and Disaster Prevention of MMR (No. 2018002).

Conflicts of Interest

The authors declare no conflict of interest.

References

  1. Medina, E.; Medina, J.M.; Cobo, A.; Bastidas, D.M. Evaluation of mechanical and structural behavior of austenitic and duplex stainless steel reinforcements. Constr. Build. Mater. 2015, 78, 1–7. [Google Scholar] [CrossRef]
  2. Gardner, L.; Bu, Y.; Francis, P.; Baddoo, N.R.; Cashell, K.A.; McCann, F. Elevated temperature material properties of stainless steel reinforcing bar. Constr. Build. Mater. 2016, 114, 977–997. [Google Scholar] [CrossRef]
  3. Wu, X.; Li, L.; Li, H.; Li, B.; Ling, Z. Effect of strain level on corrosion of stainless steel bar. Constr. Build. Mater. 2018, 163, 189–199. [Google Scholar] [CrossRef]
  4. Martin, U.; Ress, J.; Bosch, J.; Bastidas, D.M. Stress corrosion cracking mechanism of AISI 316LN stainless steel rebars in chloride contaminated concrete pore solution using the slow strain rate technique. Electrochim. Acta 2020, 335, 135565. [Google Scholar] [CrossRef]
  5. Yin, F.; Yang, L.; Wang, M.; Zong, L.; Chang, X. Study on ultra-low cycle fatigue behavior of austenitic stainless steel. Thin Walled Struct. 2019, 143, 106205. [Google Scholar] [CrossRef]
  6. Gardner, L. The use of stainless steel in structures. Prog. Struct. Eng. Mater. 2005, 7, 45–55. [Google Scholar] [CrossRef]
  7. Baddoo, N.R. Stainless steel in construction: A review of research, applications, challenges and opportunities. J. Constr. Steel. Res. Allergy 2008, 64, 1199–1206. [Google Scholar] [CrossRef]
  8. Gedge, G. Structural uses of stainless steel—Buildings and civil engineering. J. Constr. Steel. Res. Allergy 2008, 64, 1194–1198. [Google Scholar] [CrossRef]
  9. Nürnberger, U.; Wu, Y. Stainless steel in concrete structures and in the fastening technique. Mater. Corros. 2008, 59, 144–158. [Google Scholar] [CrossRef]
  10. Mistry, M.; Koffler, C.; Wong, S. LCA and LCC of the world’s longest pier: A case study on nickel-containing stainless steel rebar. Int. J. Life Cycle Assess. 2016, 21, 1637–1644. [Google Scholar] [CrossRef] [Green Version]
  11. Corradi, M.; Di Schino, A.; Borri, A.; Rufini, R. A review of the use of stainless steel for masonry repair and reinforcement. Constr. Build. Mater. 2018, 181, 335–346. [Google Scholar] [CrossRef]
  12. Merello, R.; Botana, F.J.; Botella, J.; Matres, M.V.; Marcos, M. Influence of chemical composition on the pitting corrosion resistance of non-standard low-Ni high-Mn-N duplex stainless steels. Corros. Sci. 2003, 45, 909–921. [Google Scholar] [CrossRef]
  13. Freire, L.; Novoa, X.R.; Pena, G.; Vivier, V. On the corrosion mechanism of AISI 204Cu stainless steel in chlorinated alkaline media. Corros. Sci. 2008, 50, 3205–3212. [Google Scholar] [CrossRef]
  14. Gastaldi, M.; Bertolini, L. Effect of temperature on the corrosion behaviour of low-nickel duplex stainless steel bars in concrete. Cem. Concr. Res. 2014, 56, 52–60. [Google Scholar] [CrossRef]
  15. Yang, Y.; Qian, H.; Su, Y. Effect of Mn addition on deformation behaviour of 23% Cr low nickel duplex stainless steel. Mater. Charact. 2018, 145, 606–618. [Google Scholar] [CrossRef]
  16. Alonso, M.C.; Luna, F.J.; Criado, M. Corrosion behavior of duplex stainless steel reinforcement in ternary binder concrete exposed to natural chloride penetration. Constr. Build. Mater. 2019, 199, 385–395. [Google Scholar] [CrossRef]
  17. Veleva, L.; Alpuche-Aviles, M.A.; Graves-Brook, M.K.; Wipf, D.O. Comparative cyclic voltammetry and surface analysis of passive films grown on stainless steel 316 in concrete pore model solutions. J. Electroanal. Chem. 2002, 537, 85–93. [Google Scholar] [CrossRef]
  18. Ogunsanya, I.G.; Hansson, C.M. The semiconductor properties of passive films and corrosion behavior of stainless steel reinforcing bars in simulated concrete pore solution. Materialia 2019, 6, 100321. [Google Scholar] [CrossRef]
  19. Ertzibengoa, D.; Matthys, S.; Taerwe, L. Bond behaviour of flat stainless steel rebars in concrete. Mater. Struct. 2012, 45, 1639–1653. [Google Scholar] [CrossRef]
  20. Calderon-Uriszar-Aldaca, I.; Briz, E.; Larrinaga, P.; Garcia, H. Bonding strength of stainless steel rebars in concretes exposed to marine environments. Constr. Build. Mater. 2018, 172, 125–133. [Google Scholar] [CrossRef]
  21. Pauletta, M.; Rovere, N.; Randl, N.; Russo, G. Bond-Slip Behavior between Stainless Steel Rebars and Concrete. Materials 2020, 13, 979. [Google Scholar] [CrossRef] [PubMed] [Green Version]
  22. Zhang, G.; Zhang, Y.; Zhou, Y. Fatigue Tests of Concrete Slabs Reinforced with Stainless Steel Bars. Adv. Mater. Sci. Eng. 2018, 2018, 5451398. [Google Scholar] [CrossRef] [Green Version]
  23. Rabi, M.; Cashell, K.A.; Shamass, R. Flexural analysis and design of stainless steel reinforced concrete beams. Eng. Struct. 2019, 198, 109432. [Google Scholar] [CrossRef]
  24. Li, Q.; Guo, W.; Liu, C.; Kuang, Y.; Geng, H. Experimental and Theoretical Studies on Flexural Performance of Stainless Steel Reinforced Concrete Beams. Adv. Civ. Eng. 2020, 2020, 4048750. [Google Scholar] [CrossRef]
  25. ACI Committee 318. Building Code Requirements for Structural Concrete (ACI 318-14) and Commentary (318R-14); American Concrete Institute: Farmington Hills, MI, USA, 2014. [Google Scholar]
  26. Ministry of Housing and Urban-Rural Development of the People’s Republic of China. National Standard of the Peoples Republic of China, Code for Design of Concrete Structures: GB 50010-2010; China Architecture & Building Press: Beijing, China, 2015.
  27. EN. EN 1992-1-1 Eurocode 2: Design of Concrete Structures—Part. 1-1: General Rules and Rules for Buildings; CEN: Brussels, Belgium, 2005. [Google Scholar]
Figure 1. Geometry of column specimen (considering SSRC1 as an example; units: mm).
Applsci 10 05629 g001
Figure 2. Test setup.
Applsci 10 05629 g002
Figure 3. Typical failure modes for specimens: (a) small eccentric compression, (b) large eccentric compression, (c) side view, (d) compression side, and (e) tension side.
Applsci 10 05629 g003
Figure 4. Typical crack patterns: (a) small eccentric and (b) large eccentric.
Applsci 10 05629 g004
Figure 5. Load–lateral displacement curves for various (a) reinforcement ratios and (b) eccentricities.
Applsci 10 05629 g005
Figure 6. Lateral deflection curves.
Applsci 10 05629 g006aApplsci 10 05629 g006b
Figure 7. Load–longitudinal reinforcement strain curves under various (a) eccentricities and (b) reinforcement ratios.
Applsci 10 05629 g007
Figure 8. Concrete strain distribution at the midspan section.
Applsci 10 05629 g008
Figure 9. Calculation diagram for stainless-steel-reinforced concrete (SSRC) columns subjected to eccentric load: (a) small eccentricity, (b) limiting eccentricity, and (c) large eccentricity.
Applsci 10 05629 g009
Figure 10. Schematic of the second-order effect: (a) additional eccentricity and (b) amplification factor.
Applsci 10 05629 g010
Figure 11. Ultimate load–bending moment curve.
Applsci 10 05629 g011
Figure 12. Load–average crack width curves.
Applsci 10 05629 g012
Figure 13. Comparison of calculated results with test results: (a) maximum crack widths for short-term load, (b) mean crack spacing, and (c) maximum crack widths for long-term load.
Applsci 10 05629 g013
Figure 14. Comparison of crack widths calculated using the modified formula with the experimental crack widths.
Applsci 10 05629 g014
Table 1. Mechanical properties of reinforcement specimens.
SpecimenReinforcement Diameter (mm)Proof Strength at No Proportional Extension (MPa)Ultimate Strength (MPa)Elastic Modulus (×105 MPa)Elongation (%)
230412636.5842.31.5633.0
230416531.8768.31.5636.4
230425542.7760.71.4034.1
HRB40016477.0654.32.0226.8
Table 2. Specimen specifications.
SpecimenEccentricity (mm)Stirrup Diameter (mm)Stirrup Spacing (mm)Number of Longitudinal Reinforcement BarsLongitudinal Reinforcement Bar Diameter (mm)Reinforcement Ratio (%)
SSRC18081254120.60
SSRC227081254120.60
SSRC38081254161.07
SSRC415081254161.07
SSRC520081254161.07
SSRC627081254161.07
SSRC78081254252.61
SSRC827081254252.61
HRC927081254161.07
Table 3. Experimental and theoretical ultimate loads of columns.
SourceColumnfc (MPa)e0 A s / A s
(mm2)
Nu (kN)Equation (1)Optimization Model
N u t N u t / N u N u t N u t / N u
Test resultsSSRC120.1802261075813.90.757 821.30.764
SSRC220.1270226173202.71.172 158.30.915
SSRC320.1804021135913.70.805 919.00.810
SSRC420.1150402640677.91.059 639.00.998
SSRC520.1200402358422.31.180 347.70.971
SSRC620.1270402220281.61.280 222.51.011
SSRC720.18098212801273.90.995 1275.00.996
SSRC820.1270982465566.91.219 464.70.999
FEA results20.1150226525558.21.063 519.60.990
20.1200226267319.01.195 257.20.963
20.13040214311235.00.863 1368.10.956
20.16040212051021.00.906 1061.50.942
20.1120402792758.70.958 729.70.921
20.1180402434616.91.421 406.20.936
20.1230402285350.71.231 282.10.990
20.1250402268313.01.168 249.20.930
26.88040211571122.40.970 1129.80.976
26.8150402587673.41.147 581.80.991
26.8200402371455.11.227 367.10.989
26.8270402236292.41.239 228.00.966
32.48040213231292.40.977 1301.70.984
32.4150402651728.31.119 620.70.953
32.4200402397476.01.199 378.90.954
32.4270402239298.61.249 231.10.967

