Abstract
In blasting operation, some undesirable impacts, such as fly-rock, fragmentation, and back break, are induced. If the blasting design is not optimized, these mentioned impacts would reduce the blasting efficiency. To improve and optimize the blast design, blasting effect evaluation is essential. Due to the complexity of interactions among blasting parameters, empirical methods may not be appropriate for blast design optimization. A two-level mathematical model based on fuzzy mathematics, is proposed in this work. In total, 11 typical parameters were chosen and classified into three groups. The blasting effect is evaluated from three aspects, and then the comprehensive evaluation is given. A blasting effect evaluation system was developed based on the mentioned method on the platform of VC++. Some other techniques, such as image processing, were integrated into the system, which allowed for obtaining all of the parameters rapidly and conveniently. The system was applied in practical bench blast engineering. The results obtained from the system can provide effective information for the optimization of the next blast design.
1. Introduction
The bench blast has been widely applied in many fields, such as mining engineering and hydraulic tunnel excavation. The effects of the bench blast would directly affect subsequent operations, such as loading, hauling and crushing. Otherwise, the bench blast would also cause some undesirable impacts, such as fly-rock, vibration and back-break, if the blast design is not optimized [1]. To improve and optimize the bench blast design, a comprehensive, valid and convenient for application evaluation method of blast performance is therefore expected by mining engineers.
As efforts to find more scientific and the reliable methods to evaluate bench blast performance, various research studies were initiated. These works can be divided into three types from different viewpoints: (1) statistical analysis method; (2) harmful effects evaluation method; (3) numerical modeling method.
The statistical analysis method mainly employed the Artificial Neural Network (ANN) [2,3,4,5,6,7]. The ANN is an information processing system that is used for modeling complex relationships between input and output data. An ANN consists of an input layer, hidden layers and an output layer. Once the network has been trained by the previous blasting parameters and results, the results can be predicted by the network according to the new data inputs. However, in hidden layers, all the input parameters are calculated as whole, so this method can only show approximate relationships between parameters and results.
The numerical simulation method has been widely applied to predict the results of the bench blast, such as the Finite Element Method (FEM) [8,9,10], Discrete Element Method (DEM) [11,12,13] and Discontinuous Deformation Analysis (DDA) [14,15,16]. The feedback from simulated results can provide a direction for design. However, the numerical model needs many parameters, such as geological and construction conditions, and some parameters are unavailable or difficult to be determined. The simulated results always have a significant difference with the results measured on site. Therefore, the numerical modeling method is only considered as a reference for bench blast design.
The harmful effects evaluation method mainly focuses on predicting the harmful effects induced by bench blasts [17,18,19,20]. For example, the famous Sadovsky equation [21] was employed to predict the peak particle velocity (PPV) for a certain bench blast design, and some empirical formulas were obtained to evaluate the distance of the fragments flying away from the blast source [22]. In this method, the single factor of bench blast performances was analyzed, instead of the comprehensive evaluation of the bench blast. Although they are still widely used due to their simplicity and relatively good reliability of results, these equations have one-sidedness because they only consider the harmful effects of blasting to evaluate the blasting effect.
To overcome the limitations of the abovementioned methods, a comprehensive evaluation method of bench blast in an open pit mine was proposed in this work. Eleven parameters were determined to evaluate the performance of bench blasts. Then, an evaluation model based on the linear programming and the fuzzy mathematics was proposed. Furthermore, a program code was developed on the platform of VC++. An application case of a bench blast was finally analyzed.
2. The Method of Blasting Effect Evaluation
2.1. Evaluation Parameters
Bench blasting performance has some undesirable impacts, such as vibration and back break; therefore, effect evaluation for bench blasting is quite complicated. The rationality of the established method for evaluating blasting effect is related to the fact that it could reflect the blasting effect correctly, and then provide information for optimizing the blast design.
In bench blast design, security issues are the key factors to be considered. In bench blasting performance, fly-rock is one of the most important causes of accidents, and blasting vibration is particularly harmful to buildings; therefore, the blasting safety evaluation is basic for the whole blasting effect evaluation. Blasting quality is the purpose of blast design. Blasting quality can directly affect construction efficiency, which would affect the subsequent operations, such as loading, hauling and crushing. Under the premise of ensuring blasting safety, optimizing the blast design is important for maximizing the blasting efficiency. Additionally, in bench blasting performance, energy and economic waste usually exist; therefore, the effective measures to reduce blasting costs and improve economic efficiency should be taken, which is the main factor that a blast design needs to be considered. Therefore, in this study, the blasting effect is evaluated from three aspects: blasting safety, quality and cost—11 typical parameters are chosen and are divided into these three classes. Eleven typical parameters are used to describe the effect of bench blasting. Fly-rock: the shorter the distance of flying stone, the less harm caused by blasting. Vibration: the smaller the peak value of blasting vibration, the smaller the harm caused by vibration. Boulder yield: the block size meets the engineering requirements, and the block rate is low. Muck pile height: the blasting pile is concentrated and has certain looseness, which should not be too high or too low, so as to meet the requirements of efficient shoveling of equipment. Forward distance: using the slag body reserved from the previous blasting, the forward striking distance of blasting pile body is controlled to make the blasted rock mass collide with the residual slag body, reduce the block rate and improve the energy utilization rate. Back break: under excavation, this will cause processing delay or idling, reduce productivity and waste money. Depth of lateral posterior sulcus: in order to avoid the slope collapse, the back gully should be built at an appropriate place outside the slope to remove the water. Bench smoothness: high step flatness is conducive to improve the efficiency of the next drilling and shoveling transportation. Explosive unit consumption: reasonable explosive unit consumption is conducive to improving energy utilization and saving cost. Blasted volume per meter: the higher the blasting quantity, the better the blasting effect. Auxiliary materials: lowering the consumption of auxiliary materials but maintaining the same blasting effect, meaning the cost is lower. Finally, the comprehensive evaluation is given. The parameter classifications are listed in Table 1.

Table 1.
Parameter classifications.
2.2. Fuzzy Mathematical Model
Due to the complexity of interactions among blasting parameters, empirical methods may not be appropriate for blast design optimization, but the fuzzy model can cope with the complexity of complicated systems in a flexible and reliable way. Therefore, fuzzy mathematics has been widely applied in mining engineering. In this study, a two-level mathematical model was built based on fuzzy mathematics. In the first-level mathematical model, the subclasses (blasting safety, cost and quality) are evaluation objectives, and the parameters belonging to the subclass are constraint conditions. The first-level mathematical model is described by Equation (1):
where are the evaluated results of safety, quality and cost, respectively, and are the weight and membership degrees.
For the second-level mathematical model, the comprehensive blasting effect is the evaluation objective, and the subclasses are constraint conditions. The model is described by Equation (2):
where is the comprehensive evaluation, and are the weight of safety, quality and cost, respectively.
2.3. Membership and Weight Determination
All evaluation parameters are described by linguistic variables. Then linguistic variables are translated to memberships, respectively. The linguistic variables and memberships are shown in Table 2.
Table 2.
The parameter linguistic variables and memberships.
Weight determination is the most important factor that affects the accuracy of fuzzy comprehensive evaluation. Due to the different focus of each engineering assessment, the fixed weight method may not be suitable. In this study, the weight adjustment method is used. The initial weight is given by expert valuation for some special engineering, so if there are some unreasonable weight values, the weight can be adjusted. If the adjusted value is given, the new weight value and other new weight values can be recalculated by Equation (3):
After the adjusted weight value is known, the other weight values can also be recalculated by Equation (5):
3. Program Development
In this study, a blasting effect evaluation system (BEES) was developed based on the aforementioned method. The detailed algorithm was designed, and the corresponding code was developed on the platform of VC++ (The version is 6.0, Microsoft). The program structure is shown in Figure 1.
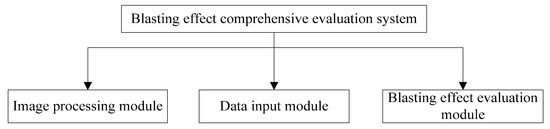
Figure 1.
Program structure of BEES.
Boulder yield is calculated from rock fragmentation size distribution. The rock fragmentation size distribution is an important parameter for blasting effect evaluation, but the manual measurement is tedious and time-consuming. Today, software is available for use with any camera or photo type, or cameras with inbuilt software that automatically gives rock fragmentation size distribution both in table view and graphically. So, in this system, the image analysis technique is used for rock fragmentation size statistics. The boulder yield can be calculated easily by setting the standard value. The algorithm of fragment size statistics is shown in Figure 2. The muck pile height can also be obtained by the method of image processing—the algorithm is shown in Figure 3a, and its explanation on how muck pile height is determined is shown in Figure 3b. The vibration can be measured by vibration measuring instrument. The distance meter can measure the distance of flying rock. The forward distance, under excavation, depth of side and back ditch and the flatness of terrace can be obtained by field observation and image processing. The blasting cost could be calculated by inputting the bench blasting engineering information.
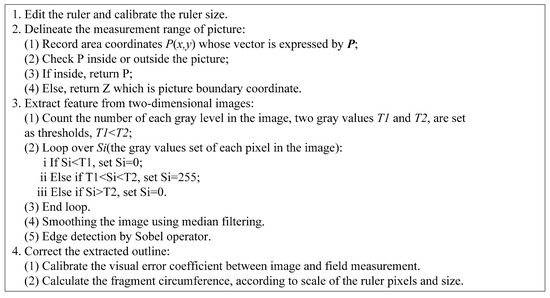
Figure 2.
The algorithm of fragment size statistics.
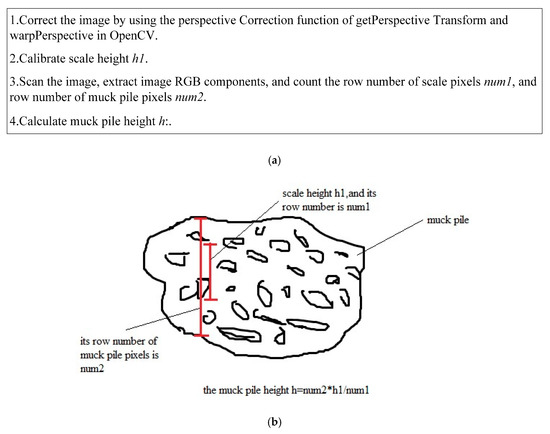
Figure 3.
Muck pile height calculation: (a) The algorithm; (b) The explanation.
In this system, the default data range and weight values are given by the expert evaluation method. That is to organize the experts in the field of Open-pit Bench Blasting Engineering, use professional knowledge and experience, and through intuitive induction, give a strong professional judgment and evaluation (see Table 3 and Table 4). However, the data ranges and weight values may be different for different construction environments and blast designs, it is not suitable for evaluation with the fixed data ranges and weight values. So, the data ranges and weight values should be changed with engineering conditions as it will be easier for deciders to obtain the advantages and disadvantages of blast design, and to better optimize the next blast design. In the system, the normal user and administrator models are provided. The administrator can adjust the data ranges and weight values according to the actual situation. The adjusted data are saved to the text in binary form and can be recalled next time.
Table 3.
The default data ranges of parameters in BEES.
Table 4.
Weight values of parameters.
After all the information input is completed, all the parameters are calculated and classified according to subclasses. The BEES provides dialogs for users to observe the evaluation of each parameter (see Figure 4). According to all the parameter evaluation results, the blasting effect evaluation can be obtained—the algorithm is shown in Figure 5—and the blasting effect evaluation results are displayed by the form of a graph (They can be seen in the next two figures, Figure 6 and Figure 7).
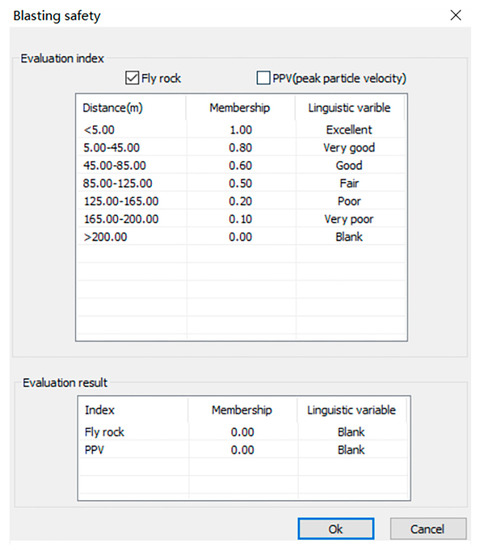
Figure 4.
The evaluation result of each index.
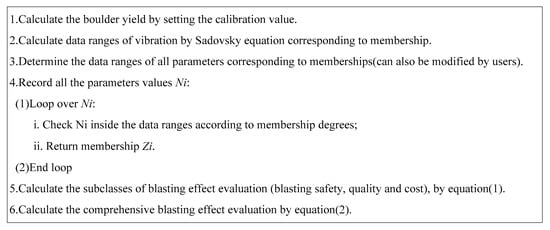
Figure 5.
The algorithm of blasting effect evaluation.
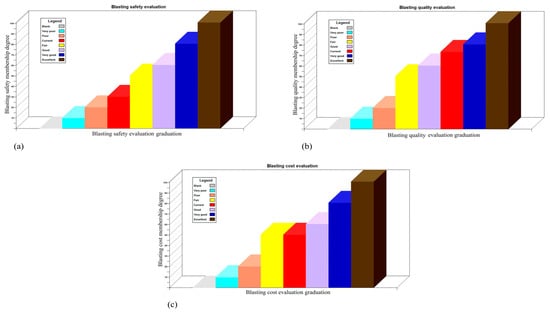
Figure 6.
Histogram of blast effect evaluation by first-level mathematical model: (a) blasting safety; (b) blasting quality; (c) blasting cost.
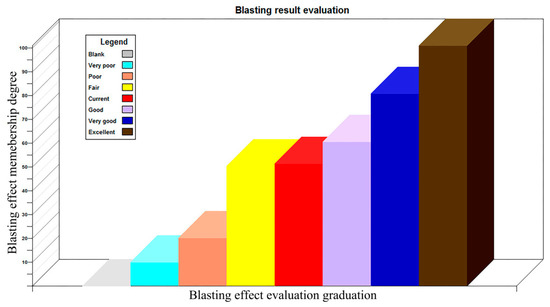
Figure 7.
Histogram of blast comprehensive evaluation.
4. Application
To verify the evaluation and optimization method proposed in this paper, a practical bench blast engineering in a copper deposit was selected as an application case. The photo shot on site is shown in Figure 8. This copper mine is mined by open-pit deep-hole step blasting. A No. 2 rock explosive is selected, and the structure of continuous charge is adopted. The total charge amount in the blasting area is 4392 kg. Detonators are used to detonate explosives. The latest Series IV advanced vibration and overpressure monitors are used for the blasting vibration measurement.
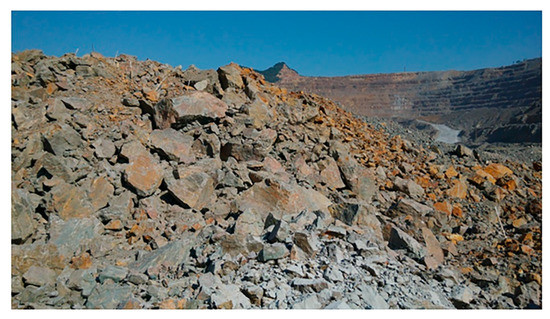
Figure 8.
Muck pile on site.
In general, there is visual error between photo measurement and site measurement; therefore, the correction coefficient is necessary. The camera is used to measure the image of the explosive pile particles. The visible area of the blasting pile is selected to shoot in an open direction. The area of each shot is about 40–30 m. The camera should be located in the front of the shooting area, and the elevation angle of the line of sight is within 35 degrees. Insert a pole, which should be located in the middle of the field of view, with an effective visible length of 1–2 m. The image scale coefficient is determined by the size of the post on the image and the actual size of the post. Then, the error of the image measurement method is corrected according to the measured particle size of the explosive pile sample, and the correction coefficient between the image measurement method and the geometric method is obtained. In this study, the coefficient is 0.8 and the rock fragment distribution is shown in Figure 9.
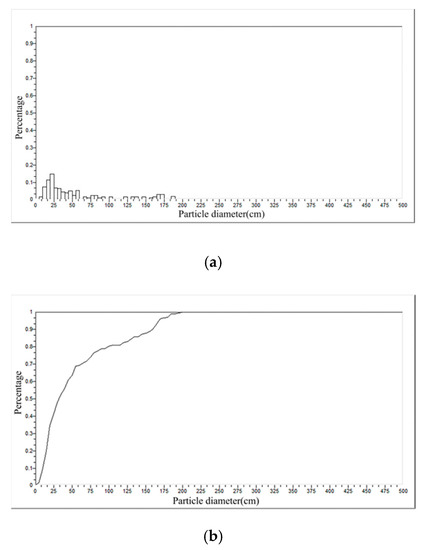
Figure 9.
Rock fragment distribution: (a) histogram; (b) gradation chart.
With the different construction environments, the data ranges and weight values should be changed according to the construction condition. The BEES provides the default data ranges, and also provides the permission to modify the data. In this study, the data ranges are listed in Table 5, and the weight values were not modified (see Table 4).
Table 5.
The data ranges of parameters corresponding to membership degrees.
The comprehensive blasting effect evaluation has two steps. First, in this study, a representative blasting operation was selected and 11 representative parameter values were obtained (see Table 6). According to the values of the 11 parameters, the BEES evaluates blast effect from blasting safety, quality and cost, respectively, and shows the evaluation results by histogram—as shown in Figure 6, the red column represents the evaluation result of the current index.
Table 6.
Eleven parameter values of a typical blasting operation.
Second, the BEES shows the comprehensive evaluation result—the result is shown by histogram—as shown in Figure 7, the red column represents the comprehensive evaluation result.
The blasting effect evaluation of this bench blast is between fair and good. The blasting cost evaluation is similar to the blasting effect evaluation. The blasting quality evaluation is between good and very good, but the blasting safety evaluation is poor. So, this blast design is not optimized. The next blast design should focus on burden and row spacing, etc., to control the blasting fly-rock and vibration.
5. Conclusions
Blasting effect evaluation is very necessary for blast design. In this paper, a method of blasting effect evaluation was proposed and an evaluation system was developed. The traditional evaluation methods are tedious and time-consuming. However, the developed evaluation system integrates several techniques, such as image analysis and parameter classification. All the selected parameters can be obtained easily to achieve rapid evaluation. The evaluation results are divided as subclass evaluation results and comprehensive evaluation results. The system has been used in practical bench blast engineering. The results are easier for deciders to obtain the advantages and disadvantages of blast design and provide the effective information for the optimization of the next blast design. The comprehensive evaluation system of blasting effect developed is not only convenient, accurate and objective, but also beneficial to enrich and perfect the fine management system of digital blasting management systems. The use of this software greatly reduces the burden of engineers and technicians and realizes the rapid statistics and evaluation of blasting effect.
Author Contributions
M.L. contributed conceptualization, resources, formal analysis and software. J.L. contributed funding acquisition and methodology. M.Z. contributed data curation, writing-review & editing. F.Z., Z.X., P.S., C.O., Y.W., H.Z. and Z.L. contributed writing-review & editing. All authors have read and agreed to the published version of the manuscript.
Funding
This research was funded by the National Natural Science Foundation of China, grant number 51874118.
Acknowledgments
This work is supported by the National Natural Science Foundation of China (NO. 51874118), the Fundamental Research Funds for the Central Universitise (NO. KYCX18-0567).
Conflicts of Interest
The authors declare that they have no conflict of interest.
Data Availability Statement
The data used to support the findings of this study are available from the corresponding author upon request.
References
- Mahdi, H.; Danial, J.A.; Masoud, M.; Samira, S. Risk assessment and prediction of rock fragmentation produced by blasting operation: A rock engineering system. Environ. Earth Sci. 2016, 75, 1–12. [Google Scholar]
- Mohsen, H.; Danial, J.A. Blast-induced air and ground vibration prediction: A particle swarm optimized-based artificial neural network approach. Environ. Earth Sci. 2015, 74, 2799–2817. [Google Scholar]
- Monjezi, M.; Hasanipanah, M.; Khandelwal, M. Evaluation and prediction of blast-induced ground vibration at Shur River Dam, Iran, by artificial neural network. Neural Comput. Appl. 2013, 22, 1637–1643. [Google Scholar] [CrossRef]
- Tonnizam, M.E.; Hajihassani, M.; Jahed, A.D.; Marto, A. Simulation of blasting-induced air overpressure by means of artificial neural networks. Int. Rev. Model. Simul. 2012, 5, 2501–2506. [Google Scholar]
- Hajihassani, M.; Armaghani, D.J.; Sohaei, H.; Mohamad, E.T.; Marto, A. Prediction of airblast-overpressure induced by blasting using a hybrid artificial neural network and particle swarm optimization. Appl. Acoust. 2014, 80, 57–67. [Google Scholar] [CrossRef]
- Monjezi, M.; Bahrami, A.; Varjani, A.Y. Simultaneous prediction of fragmentation and flyrock in blasting operation using artificial neural networks. Int. J. Rock Mech. Min. Sci. 2010, 47, 476–480. [Google Scholar] [CrossRef]
- Yang, J.H.; Lu, W.; Li, P.; Yan, P. Evaluation of Rock Vibration Generated in Blasting Excavation of Deep-buried Tunnels. KSCE J. Civ. Eng. 2018, 22, 2593–2608. [Google Scholar] [CrossRef]
- Ratnesh, T.; Singh, T.N.; Neel, G. Prediction of Blast-Induced Flyrock in Opencast Mines Using ANN and ANFIS. Geotech. Geol. Eng. 2015, 33, 875–891. [Google Scholar]
- Stojadinovic, S.; Pantovic, R.; Zikic, M.; Stojanovic, G. FEM Comparison of Crack Response to Blasting Ground Vibration and Environmental Changes. Acta Montan. Slovaca 2014, 19, 175–181. [Google Scholar]
- Jayasinghe, L.B.; Zhou, H.Y.; Goh, A.T.; Zhao, Z.Y.; Gui, Y.L. Pile Response Subjected to Rock Blasting Induced Ground Vibration near Soil-rock Interface. Comput. Geotech. 2017, 82, 1–15. [Google Scholar] [CrossRef]
- Preece, D.S.; Chung, S.H. Development and Application of 3-D rock blast computer modeling capability using discrete elements-DMCBLAST-3D. In Proceedings of the 27th Annual Conference on Explosive and Blasting Technique, Orlando, FL, USA, 28–31 January 2001; pp. 11–18. [Google Scholar]
- Fakhimi, A.; Lanari, M. DEM-SPH simulation of rock blasting. Comput. Geotech. 2014, 55, 158–164. [Google Scholar] [CrossRef]
- Yan, P.; Zhou, W.X.; Lu, W.B.; Chen, M.; Zhou, C.B. Simulation of Bench Blasting Considering Fragmentation Size Distribution. Int. J. Impact Eng. 2016, 90, 132–145. [Google Scholar] [CrossRef]
- Motazavi, A.; Katsabanis, P.D. Application of Discontinuous Deformation Analysis to the Modelling of Rock Blasting in Mining. In Proceedings of the 37th US Rock Mechanics Symposium (Vail Rock 99), Vail, CO, USA, 6–9 June 1999; pp. 543–550. [Google Scholar]
- Zhu, C.Y.; Dai, C.; Jiang, Q.H. Numerical Simulation of Bench Blasting by the Discontinuous Deformation Analysis Method. J. Rock Mech. Eng. 2002, 21, 2461–2464. (In Chinese) [Google Scholar]
- Sun, D.Y.; Peng, Y.J.; Wang, X.Z. Application of DDA Method in Stability Analysis of Topple Rock Slope. Chin. J. Rock Mech. Eng. 2002, 21, 39–42. (In Chinese) [Google Scholar] [CrossRef]
- Monjezi, M.; Razaei, M.; Yazdian, A. Prediction of Backbreak in Open-pit Blasting Using Fuzzy Set Theory. Expert Syst. Appl. 2010, 37, 2637–2643. [Google Scholar] [CrossRef]
- Faramarzi, F.; Mansouri, H.; Farsangi, M. Development of Rock Engineering System-Based Models for Flyrock Risk Analysis and Prediction of Flyrock Distance in Surface Blasting. Rock Mech. Rock Eng. 2014, 47, 1291–1306. [Google Scholar] [CrossRef]
- Sanchidrian, J.A.; Ouchterlony, F. A Distribution-free Description of Fragmentation by Blasting Based on Dimensional Analysis. Rock Mech. Rock Eng. 2017, 50, 781–806. [Google Scholar] [CrossRef]
- Liu, J.; Sun, P.Y.; Liu, F.X.; Zhao, M.S. Design and Optimization for Bench Blast Based on Voronoi Diagram. Int. J. Rock Mech. Min. Sci. 2014, 66, 30–40. [Google Scholar] [CrossRef]
- Henrych, J.; Abrahamson, G.R. The Dynamics of Explosion and Its Use; Elsevier Scientific Publications: Amsterdam, The Netherlands, 1979. [Google Scholar]
- Hustrulid, W. Blasting Principles for Open Pit Mining; Mining Engineering: FL, USA, 1999. [Google Scholar]
© 2020 by the authors. Licensee MDPI, Basel, Switzerland. This article is an open access article distributed under the terms and conditions of the Creative Commons Attribution (CC BY) license (http://creativecommons.org/licenses/by/4.0/).