Abstract
In the industrial domain, one important research activity for cognitive robotics is the development of assistant robots. In this work, we show how the use of a cognitive assistant robot can contribute to (i) improving task effectiveness and productivity, (ii) providing autonomy for the human supervisor to make decisions, providing or improving human operators’ skills, and (iii) giving feedback to the human operator in the loop. Our approach is evaluated on variability reduction in a manual assembly system. The overall study and analysis are performed on a model of the assembly system obtained using the Functional Resonance Analysis Method (FRAM) and tested in a robotic simulated scenario. Results show that a cognitive assistant robot is a useful partner in the role of improving the task effectiveness of human operators and supervisors.
1. Introduction
In the industrial domain, one important research activity for cognitive robotics is the development of assistant or advisor robots designed for increasing productivity and effective work organisation [1,2]. In work environments in manufacturing, assistance for skilled workers becomes crucial. Industrial companies, beyond ergonomic or safety issues, are starting to consider new qualification needs and technical competences with regard to operators. Decisions in the overall work processes are communicated to the operators to improve their information and skills [3].
Moreover, the industrial robotics area is currently developing in specific human-robot interaction domains from industrial robots to collaborative robots (cobots), especially in small and medium enterprises (SMEs) due to affordable costs. The classical robotics approach in industrial settings does not facilitate interaction with humans since people’s safety and factory resources are priorities, so closed, fenced spaces are only considered [4]. This is the case for mechanical robot arms. The current move from industrial to collaborative robotics scenarios is transforming the safety model, the fencing disappears and shared workplaces are favoured for cooperative tasks between human and robot. Hence, the first kind of interaction being under consideration in Industry is the physical one. By physical interaction we mean several scenarios considering human and robot [5]: space sharing, proximity, voluntary physical contact (limited in time), involuntary physical contact (collision), reciprocal exchange of forces. At a mechanical level, the robot should meet specifications for limiting force and speed. At the human level, aspects of bio-mechanics, risk prevention and injuries associated with involuntary physical contacts should be analysed.
One of the purposes of collaborative robotics development is to introduce robot-based solutions in small and medium-sized companies [6]. Thus, it is convenient to find out the degree of maturity of the current industrial robotics area towards new interaction models. In these human-machine interaction models there are several functionalities to be developed [7]: planning, monitoring, intervention, learning, interaction between human and artificial agent (trained to have a dialogue with the human), assessment of mental load, levels of automation (manual, shared, and supervised control). Following this innovation path, industrial robotics evolves towards cognitive robotics. Moreover, considering progress in artificial intelligence, the integration of humans with artificial engineering systems is an interesting research area to be analysed [8,9].
Research on workers and robots interaction is an emerging area evolving as the current robotics also does it within the framework of the new industrial paradigm called connected factory or Industry 4.0. At the plant level, the human operator should interact with several devices with changing capabilities as the synergy between artificial intelligence algorithms and electronic devices with fault diagnosis functionalities increases, communications using advanced protocols, etc.
As long as research on increasing social skills of the future human operator is being developed, it should be also ensured that the design of work tasks promotes standardisation [10,11]:
- Ensure that the human-robot team make a significant contribution to task effectiveness and productivity.
- Provide people with the appropriate level of autonomy for make decisions, procedure and task execution.
- Provide opportunities for novice operators for the development of existing skills and acquisition of new skills.
- Provide sufficient feedback for maintain the human operator in the loop.
From a cognitive or social interaction approach, the improvement in the development of algorithms should allow the intelligent robot or cognitive agent to know about the operator’s working preferences, how to adapt to them, how to suggest better/optional ways of joint working and how to enhance the operator’s skills. The dialogue between operator and robot should be changeable and allow advances in operator learning and in the perception of comfort that the operator experiences when working with robots [12]. Hence, one of the functionalities of cognitive robots is that of cognitive assistance. However, cognitive assistance in the form of an automatic expert partner is far from the functionality of today’s collaborative robots, mainly focused on safety and physical assistance.
The purpose of this work is to show how a cognitive assistant module endowed into a collaborative robot (cobot) can contribute to (i) improving task effectiveness and productivity, (ii) providing autonomy for the human supervisor to make decisions, providing or improving human operators’ skills, and (iii) giving feedback to the human operator in the loop. In the next section, a comparison between several approaches in human-robot tasks, metrics and teams is introduced, so allowing us the definition of an interactive model. The design of the assistant robot is expanding the architecture proposal in [2], a joint one formed by operator, advisor agent and collaborative robot. Evidence of how this designed cognitive assistant robot contributes to improving human operators’ skills and process productivity is obtained by evaluating our approach on the variability reduction in a manual assembly system. From a manufacturing perspective, variability is a negative situation defined as an inherent process deviation from a specified requirement or nominal value [13]. In Section 3, the overall study and analysis are performed on a model of the assembly system obtained using the Functional Resonance Analysis Method methodology (FRAM) [14]. Finally, we conclude with a discussion of the obtained results and further research to be developed.
2. Performance of Human-Robot Systems
Periodically, researchers carry out the validity of methodological proposals in Human-Robot Interaction (HRI) using several measures [15,16]. According to the increasing presence of collaborative and intelligent robots in industry, standardised metrology for the performance measurement of human-robot (H-R) systems [17] is still needed in the manufacturing environment.
2.1. State of the Art
A comparison among several approaches introduced in recent published works is presented in Table 1. Columns show the robotics approach employed (Research, Social and Industry), the interaction level considered (Physical, Cognitive), the employed metrics and some main characteristics of the approach.

Table 1.
A comparison among several Human-Robot Interaction metrics. Columns show the robotics approach, the interaction level, the employed metrics and some particular features. H, R notation means human or robot (traded), while H-R means human and robot (shared).
The column Category in Table 1 shows that whether the interaction is Physical, the main concern is to establish safety in the use of collaborative robots, for instance in [18] or ISO TS 15066 standard in [25]. From the robot side, the speed of the robot’s terminal element is regulated and the force exerted by the mechanical arm is limited. Talking about the human side, possible collisions between human and robot are analysed and risk prevention due to the impact on various sensitive parts of the human body [26]. The wide variety of scenarios, the type of terminal element used by the robot, the manipulation that the robot is performing on a part in a task, the proximity of the human, makes very complicated to obtain a generic performance metric [17]. In the case of adding a collaborative robot in a manual workplace, the reduction of human physical fatigue should be measurable. Some authors propose to establish a measure of the level of collaboration [27]. If the percentage of tasks performed by the robot in an H-R system is increased, the human workload is decreasing.
When the Category’s label for the interaction is Cognitive, it is convenient to employ a measure of the performance of the automatic task planner: what tasks does the human do, what tasks are assigned to the robot [22]. For this kind of interaction, it is a key issue to enhance the perception of the environment. Using sensors, operators can be located, so other robots, predict the human’s intention to move, analyse the execution time of the human’s tasks and assess whether the robot can optimise sub-tasks initially assigned to the human. It can be also identified human’s working styles, the rhythm in which the human performs his/her tasks, changes in this rhythm. Hence, the robot can suggest that operators change their working behaviors. For instance, the not so noticeable fatigue is mental fatigue. By applying sensors for measuring heart rate or respiratory rate, for example, it is possible to collect data on the state of the human and recommend breaks. Some authors focus their research in the direction of an intuitive human-robot interaction taking into account human cognitive skills. For instance, speed control of a mobile robot [28], or in communication with a collaborative robot [29]. In both cases, brain computer interfaces (BCI) are used to achieve a good accuracy and improve the feedback answer between human and robot for an effective performance. All this sensory devices can become invasive, and traditionally a questionnaire is used when the task is finished, to collect the subjective assessment of the operator. The NASA-TLX questionnaire measures mental load and is suitable for assessing differences in cognitive load when the human is carrying out a main task and a secondary task is added [15,19].
Thus, an improved workplace setting should take into account the joint framework conformed by human, cognitive agent, and collaborative robot. In this context, we should distinguish two roles for the human: supervisor and operator. In the case of a human with the role of supervisor, the cognitive agent assists her/him in deciding the best task planning. The cognitive robot can show the performance of the set of operators that work with collaborative robots and can provide guidelines for a better assignment of tasks to operators. Besides, for a human in the role of operator who works with the collaborative robot, the cognitive agent/robot can remind the operator about performance in previous days, and can advise her/him on maintaining the working mode or changing to improve performance. In the case of new operators, the cognitive robot can provide feedback to enhance learning.
2.2. General HRI Metrics
Regarding Human-Robot Interaction metrics, the usual human-centred interaction metrics consider effectiveness, efficiency and user satisfaction. Metrics to be considered are, for instance, degree of success in completing a task, total task time, user physical load or mental workload. These starting HRI metrics should be increased with metrics associated with the robot behaviour, which in the industrial field are known as Key Performance Indicators (KPIs) as percentage of use of the robot, tasks successfully completed by the robot, task time. Some standardised metrics for task effectiveness and task efficiency are listed in Table 2.
Table 2.
Task effectiveness and task efficiency metrics for measuring performance of human-robot interaction.
For measuring user satisfaction in the interaction, qualitative questionnaires is the main approach. In the application of satisfaction questionnaires, the need to adapt existing questionnaires in human-computer interaction to a broader scope should be addressed. As a starting point, a first approach is to adapt questions from questionnaire models, such as the Technology Acceptance Model (TAM) [30], System Usability Scale (SUS) [31], Fluency (Subjective Fluency Metrics) [20] and the Part C questionnaire on comfort in ISO 9241-420 Table D.1 [32]. To facilitate the use of these heuristics, a consensus scale is required. For example, a 5-point Likert scale, where in many of the heuristics the ends of the scale are ‘Strongly disagree’ and ‘Strongly agree’. These cited qualitative metrics for measuring interaction from the user satisfaction perspective are partial since once an H-R task is defined, the synergy between each of the agents involved leads to a broader model that must consider the overall performance and teamwork fluency [33,34], which are quantitative measures used for effectiveness and efficiency.
Our proposal is defending quantitatively measuring the overall satisfaction of the interaction, i.e., user satisfaction, but also ‘task satisfaction’, by using variability in the task efficiency metric ‘time to complete a task’, TT. That is, we propose to move from both direct quantitative robotics and qualitative human measures to the overall product or process quality evaluation.
2.3. Metrics for Product/Process Quality Evaluation: Variability
The product or process quality evaluation aims to investigate if a task or an activity requires improvements in terms of standardization and reduction of process instability or variability [35,36]. From a manufacturing approach, variability is defined as an inherent process deviation from a nominal value. In [35], process variability is identified as a coefficient of variation ,
where is the standard deviation and is the mean value of time data or success rate data. As a consequence, variability is a negative situation which requires a more controlled condition to achieve the designed process and product quality values [37]. In order to ensure the product quality and save manufacturing costs, growing attention has been paid to the problem of the stability of the manufacturing process with unknown probability distribution and trend [38].
The collaboration of workers in automated tasks using cobots improves product quality and process results, but introduces such a kind of unknown/unpredictable variability, especially in time execution for activities. Once all activities are mapped and measured, it is useful to identify a list of them which present a high level of process variability (see Figure 1). The amount of process variability can be categorised (‘Low PV’, ’Medium PV’, High PV’) according to either previously registered dispersion in the measures (data-driven), activity modelling in simulation (model driven), or both in the case of digital twins [39]. In case to detect a certain amount of variability, cognitive assistance to the worker can be employed to provide a set of recommendations related with timing, checking accuracy, training for novice workers, modifications in the order. In a qualitative manner, cognitive assistance is related to process variability. After a new execution phase and collected data, variability is again measured and task allocation is reconsidered.
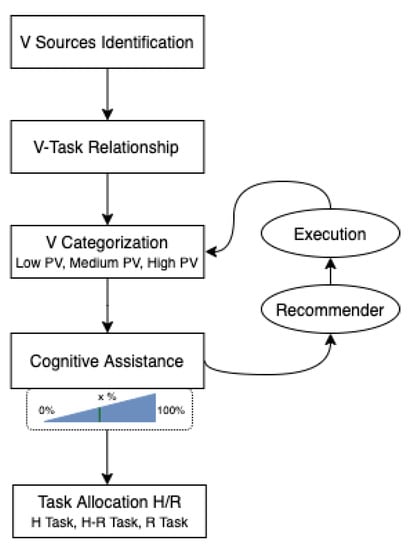
Figure 1.
Analysing process variability in human-robot collaborative tasks and task allocation.
2.4. Proposed Human-Robot Interactive System
The proposed discussion will support Small and Medium Enterprises (SME) designers to adopt a structured methodology for the analysis of the integration of collaborative systems. AS with [40], a manual assembly system is evaluated as human-robot interactive system. A preliminary task/activity allocation defines whether an assembly activity can be performed exclusively by the human (H), exclusively by the robot (R) or equally by the human and robot (H or R) [41].
The new industrial robotics approach goes beyond the design of an interactive system focused on people. Since the robot has more capabilities, the interaction with a human should be more complete. Following the design focused on interactive systems, it is provided in Figure 2 a popular starting scheme of different phases: context of use (research, academic domain), requirements analysis (simulation scenario, laboratory scenario, the robot is a mechanical arm), design (workstation, task), launch (programming, execution) and evaluation (performance, metrics).
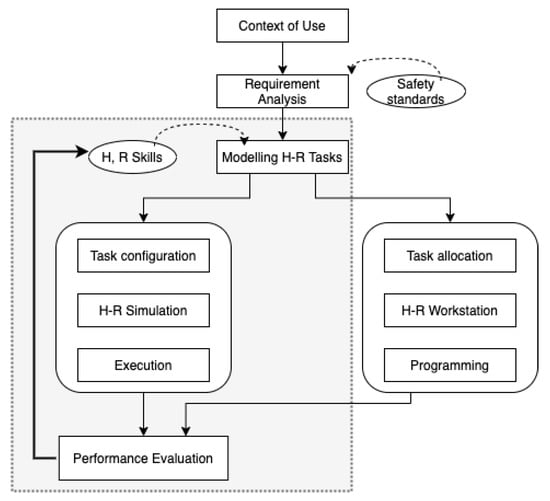
Figure 2.
Interactive model for human-robot tasks. The shadow zone is where our approach is focusing.
Starting from the components Context of Use, Safety standards specified, and Requirements Analysis, Human-Robot (H-R) activity modelling (Modelling H-R Tasks) should be addressed, i.e., the input component into the shadow zone in Figure 2 where our study is focused. In our case, the FRAM (Functional Resonance Analysis Method) model, just introduced in the next section, is employed. From these preliminary results, two scenarios are considered, one of them in a Simulation Environment and the other in the actual Process Plant, eventually into an academic laboratory. This modelling phase is relevant since robots are being introduced in workplaces where initially the activity was manual, so it is a key point to assess the acquisition of skills, and move from novice operators to expert operators [42].
In the Simulation Part (shadow zone in Figure 2), it is convenient to define a Task configuration —in this case through an interface developed in FlexSim [43]. The H-R Simulation scenario is then programmed and its Execution is performed on 3D RoboDK software (https://robodk.com/) since Universal Robots UR3e are considered in the physical setting. In the process plant part, out of the scope of this article, Task allocation should be defined for the assignment of activities. The H-R Workstation scenario focuses on the design of the workplace and the type of terminal element. In our case, Programming would be coded on Polyscope program for UR3e robots. For both scenarios, the simulated one and the actual process plant, non deterministic human behaviour should be addressed, even more, in some cases the execution of an activity performed by an operator may be delayed. The human could divide attention between several tasks/workstations at the same time, fatigue can appear, error in the execution of actions should be considered, especially for either, novice operators or operators assigned to a new workstation. The robot does not escape from an irregular execution either since it must be assessed whether the robot program works optimally or can be improved: the robot has been working for a while and the motors have overheated, the program can be optimised by modifying speeds, force, path points.
Performance Evaluation of activities will be processed taking into consideration task efficiency and effectiveness metrics from the point of view of variability, as previously introduced. Since high variability is a negative behaviour for the system, it will be evaluated into the model for task timing and precision. For instance, to measure uncertainty in the time to complete a task (efficiency), time that novice operators need to complete an activity after requesting/obtaining assistance from the robot (effectiveness), or production quality related with rejected products from the workstation. These measures conform the information to be employed to provide cognitive feedback (feedback line in Figure 2) to the human, modify robot actuation (H,R Skills) and perform a new task modelling.
2.5. Functional Resonance Analysis Methodology
The variability of human behaviour during plan execution poses a difficult challenge for human-robot teams. Some researchers use the theory of mind (ToM), or the ability to infer beliefs, desires and intentions of others [44]. The Functional Resonance Analysis Method (FRAM) allows modelling complex socio-technical systems by collecting data from real/simulated work practices. It provides a tool to describe system outcomes using the idea of resonance arising from the variability of everyday performance. By understanding sources of human variability using FRAM it could be possible design cognitive assistant robots with the aim to balance this variability. FRAM is based on four basic principles [45,46],
- Principle of Equivalence of Successes and Failures. Failures and successes stem from the same source. When outcomes differ, this does not imply that the underlying process is different.
- Principle of Approximate Adjustment. As systems operate in environments uncertain and dynamic, they are partially under-specified to allow them to approximately adjust their performance to the wide variety of operating conditions, leading to performance variability.
- Principle of Emergence. Everyday operational conditions are variable, so performance also is it. Variability within one activity can be managed or monitored; however variability in multiple activities can combine in unanticipated ways.
- Principle of Functional Resonance. Variability from multiple activities could lead to consequences that are disproportional large, producing non-linear effects [45] and spreading to other activities through their couplings, which can lead to unexpected and adverse events.
In the context of human-robot interactive systems, the application of FRAM when modelling H-R tasks in order to get task allocation/configuration between human operator and robot allows in a straightforward form to evaluate variability as a performance measure. Whit this aim in mind, some analysis steps are necessary,
- Identify and describe system activities into a task, and characterise each one using a six basic characteristics (aspects) schema: Resource, Precondition, Input, Time, Control, Output. See Figure 3 and Table 3.
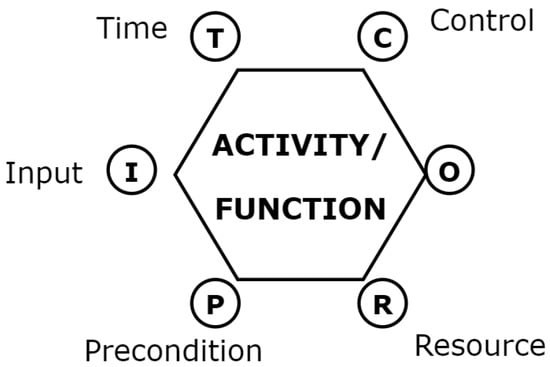 Figure 3. FRAM activity/function representation [45] in order to graphically represent instances in a FRAM study.
Table 3. Aspects related to an <ACTIVITY>.
Figure 3. FRAM activity/function representation [45] in order to graphically represent instances in a FRAM study.
Table 3. Aspects related to an <ACTIVITY>. - Check the completeness/consistency of the model. In this point, a discussion about the work of human-robot teams is required.
- Characterise the potential variability of the activities in the FRAM human-robot model.
- Define useful variability metrics.
- Identify an effective task allocation/configuration between human and robots.
The variability of an activity’s output is revealed by the variability occurred in its outputs, and is referred to the deviation of one or several of the following dimensions such as: timing, duration, magnitude, object, and so on, with respect to an expected value. Thus, the variability occurred in the upstream functions affects the performance of the downstream function. The subsequent propagation of the variability in the system may lead to nonlinear effect called resonance generating unexpected/uncontrolled consequences. However, the impact of such variability over the system cannot be determined by observing the variability of the upstream function output only. In fact, it also depends on the variability acceptance capacity of the function receiving inputs (downstream). Thus, the functional resonance effect is triggered by the output variability of the upstream function exceeding the variability dumping capacity of the downstream function [47].
All the elements highlighted in Figure 2 are now defined: human and robotics activities will be modelled using FRAM, because this methodology allows the evaluation of the variability in quantitative measures. Modelling configures a task in several activities, which will be simulated using FlexSim, RodoDK and UR robots simulator, and executed to get information about this variability in the measure. According to the obtained performance, feedback is provided to improve human skills and robot behaviour. Eventually, this feedback will generate new interaction models for the task. In the next section, all these elements will be implemented in the form of a manual assembly task and results obtained from the executed simulation will be analysed.
3. Environment Modelling and Simulation
This section will provide a precise description of the experimental setup, in the form of collaborative manual assembly; metrics under consideration, mainly variability depending on user preferences and selected process strategies, impacting on product/process quality; modelling of the task, using the FRAM method, in the form of activities; obtained results in a simulated environment; their interpretation, as well as the experimental conclusions that are drawn from the simulated experiences of the manual assembly task. For ease of discussion, FRAM principles of failures and emergence are out of the scope in this article.
3.1. Experimental Setup: A Manual Assembly Task
The production process to be automated is an assembly system, which is part of a whole production system. In Figure 4, the components of the assembly task are shown. The product to be assembled (see Figure 5) requires three parts: a base on which a bearing is placed and finally the assembly is sealed with a cap. As an initial stage it is assumed that the raw material is always available. The workstation process is described as follows (Work as Imagined, WAI [45]):
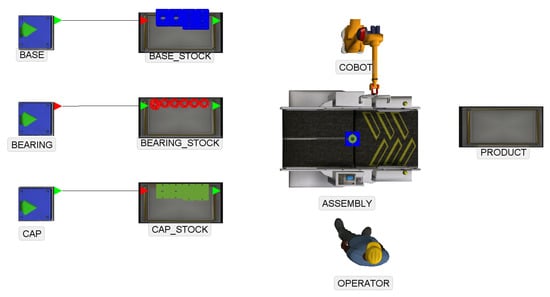
Figure 4.
Simulated layout of an assembly task.
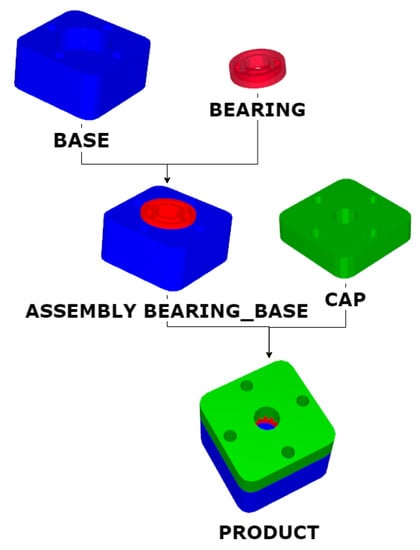
Figure 5.
Product and assembly steps.
- It is verified that there is a base, a bearing and a cap from the stock to start the assembly.
- Get a base from the stock, get the bearing and pre-assemble on the base.
- Next, get the cover and assemble the product.
- Take the assembly and store it in a stock.
This process of assembly will continue until completing the production order, or until the end of the work shift. Input and output stocks can be into either, the same or different location.
3.2. Activities Modelling for the Manual Assembly Task
The goal of the model is the allocation of functions needed to perform product assembly, and to assign functions to the operator or robot within the workplace in a collaborative human-robot environment. For the modelling, first a basic model of the necessary functions of the process is created, without considering who performs the function, and then 3 scenarios are established for the execution,
- Scenario 1. Fully manual task.
- Scenario 2. Fully automated task with a robot (a cobot is supposed).
- Scenario 3. The process is executed in a collaborative manner, human-robot shared task.
The FRAM methodology (Functional Resonance Analysis Method) [14] is followed for modelling, based on the four steps described above.
3.2.1. Identify and Describe Functions
Based on the description of the process, the following are the <ACTIVITIES> associated with the [MANUAL ASSEMBLY] Task. Each work task in the process is divided into activities, assignable to H, R, or both H-Rs. In the context of the FRAM model, activities are also referred as Functionalities,
- <ASSEMBLY PRODUCT>
- <ASSEMBLY BEARING_BASE>
- <GET BASE>
- <GET BEARING>
- <GET CAP>
- <CHECK PRODUCT>
- <START PRODUCTION>
- <CHECK PARTS>
- <PROVIDE PARTS>
- <STORE ASSEMBLY>
These Activities or Functionalities are described in a FRAM form. For illustrative purposes, the <ASSEMBLY PRODUCT> activity is shown in Table 4. Function Type is not initially described as far as it can be either ‘Human’, when performed by an operator, or ‘Technological’, when is a cobot under consideration. An instance of the model in the FRAM visualisation tool, shown in Figure 6, highlights the <ASSEMBLY PRODUCT> function considered to be an objective function of the system.
Table 4.
Function <ASSEMBLY PRODUCT>.
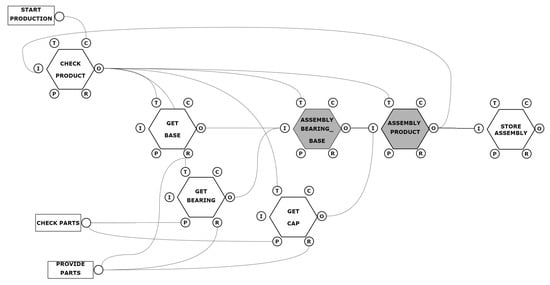
Figure 6.
The assembly task as an instance of the model FRAM.
3.2.2. Scenario 1. Fully Manual Task
In this scenario the functions will be executed by a single operator, within the work shift, who performs assemblies according to the production orders that arrive at the workstation. For the execution of the functions a new function is added to the basic model, called <OPERATORS>, which oversight resource operator, as shown in Table 5.
Table 5.
Function <OPERATORS>.
According to the FRAM methodology the functions executed by the operator are ‘Human’ type. Therefore the Function Type characteristic initially labelled as ‘Not described initially’ now changes according to those options shown in Table 6.
Table 6.
Function Type defined as ‘Human’ for all the activities in the manual assembly task.
3.2.3. Scenario 2. Fully Automated Task with a Robot
In this scenario functions are executed by a single robot, within the work shift, which performs the amount of assemblies possible according to the production orders. For the execution, the function called <OPERATORS> is redefined as shown in Table 7.
Table 7.
Function <OPERATORS>.
Now the functions executed by the Robot are of the Technological type, and the ‘Function type’ characteristic changes according to those shown in Table 8.
Table 8.
Function Type defined as ‘Technological’ for all the activities in the Scenario 2.
3.2.4. Scenario 3. The Process is Executed in a Collaborative Manner, Human-Robot Shared Task
In this scenario, the functions will be executed collaboratively by either an operator or a robot, within the work shift, performing assemblies according to the production orders. For the execution, the function <OPERATORS> is in charge of changing the type of function within the model, according to the strategy established by a human agent or by a technological agent. As result, now the functions executed by the robot are ‘Technological’ type, and the functions executed by the operator are ‘Human’ type. The characteristic changes according to those shown in Table 9.
Table 9.
Function Type defined as ‘Human’ or ‘Technological’ depending on the activities to be performed in the Scenario 3.
The choice between ‘Technological’ and ‘Human’ for this scenario has been determined in order to mix both types for Assembly functions and Get functions, for illustrative purposes. It has been assumed that the base-bearing assembly is a delicate one, from a decorative perspective. Hence, introducing dexterous human abilities will improve final quality of the product from a decorative/customer perspective that the robot is not able to perform always with the current sensor setting or programming.
3.3. Identifying Variability
For the identification of the variability, the type of function defined in the model is considered. The objective of the study is to determine the variability according to the type of agent used to perform the functions. Based on the FRAM methodology, to check the variability of the performance of the output of the functions, the characteristics Time and Quality are selected.
The measurement of the output characteristics will be performed through the ‘Time to Task’ and ‘High Quality Product Percentage’ KPIs, as it can be seen in Table 10.
Table 10.
KPI quantitative variables definition.
Based on the definitions, Equations (2) and (3) show how they are calculated, respectively,
with being the time to complete activities <GET BASE>, <GET BEARING>, <ASSEMBLY BEARING_BASE>, <GET CAP>, and <ASSEMBLY PRODUCT>, for , respectively, and
As a general concept, for each planned scenario, the characteristics of the operator are considered to be sources of Time variability. Reversely, Quality of the final product will vary and be reduced when robots are considered into the process. All the products have, at least, Standard quality, but most of them are High quality in some sense for the customer, not affecting functioning but, for instance, decorative issues. For example, the parts for the assembly arrive at the process without any orientation, the process assembly its products with high efficacy and typical quality, but if the operator aligns them by changing their orientation, the customer perceives a better quality of the product. This alignment is an easy task of decision for the human operator, while for the robot it would require the use of extra sensors, for example artificial vision.
3.3.1. Scenario 1. Fully Manual Task
In this scenario the variability is considered to depend on the type of operator performing the process, defined as Expert, Standard or Novice. Based on the FRAM methodology, Table 11 and Table 12 show the characteristics considered.
Table 11.
Potential output variability for Time in Scenario 1.
Table 12.
Potential output variability for Quality in Scenario 1.
3.3.2. Scenario 2. Fully Automated Task with a Robot
Based on the FRAM methodology, Table 13 and Table 14 show the characteristics considered. The ’Type Operator’ is a cobot that can be considered in a Basic version or an Optimised one, which is faster processing parts.
Table 13.
Potential output variability for Time in Scenario 2.
Table 14.
Potential output variability for Quality in Scenario 2.
3.3.3. Scenario 3. The Process is Executed in a Collaborative Manner, Human-Robot Shared Task
In this scenario, the variability will be the result of the multiple possible combinations of the variability of the human-type functions and the technological functions; the result depends on the strategy of assignment of the activities. In this first version, the MABA-MABA (Men-Are-Better-At/Machines-Are-Better-At) method is considered [48], for which it is assumed that the human operator better develops the function <ASSEMBLY BEARING_BASE>, and the robot for the function <ASSEMBLY PRODUCT>. Table 15 and Table 16 show the characteristics considered, for the different activities.
Table 15.
Potential output variability for Time in Scenario 3.
Table 16.
Potential Output variability for Quality in Scenario 3.
3.4. Execution in a Simulated Environment
Experimentation in the Manual Assembly task is performed as described according to the associated activities. Variability for process Time and product Quality is evaluated. Using the FRAM approach, the task is simulated (in a Flexsim software scenario) under several contexts of use. Some distribution functions for variability will be used to perform a realistic simulation of an industry assembly task.
Before starting the simulation, a virtual basic version of the process was created using the RoboDK simulation software to obtain realistic completion times for each activity, these will be considered to be references for the process. Results are shown in Table 17.
Table 17.
Time to Task values obtained from the RoboDK virtual model.
Using the FRAM methodology, two variation characteristics are considered in a straightforward form, Time, expressed as for Time to Task (in seconds) and Quality, defined as the Percentage of High-quality Products Completed (in %).
For the simulation, two types of distribution functions are used. The operator takes different time periods to perform operations about take and place the different parts for the assembly. Time for these operations tends to be greater than the average value for robot, thus affecting downstream in the assembly process and increasing the total production time of the parts. Following the recommendations of experts in manufacturing modelling [49], a lognormal distribution is used for this type of cases (see Table 18). The Mean variation value ( s), i.e., how much time, in mean, is used for the different kind of operators for each activity, is not modified. Hence, there is not difference in how fast are operators completing activities. However, standard deviation increases when expertness operator decreases. In this form, for the study, only variability is affecting Time process.
Table 18.
Values used in distribution functions for Time, the same for all the functions.
Variations in the assembly process affect product Quality, in this case between High quality and Typical quality values. For this case, according to [49], a Bernoulli distribution function is used (see Table 19). It is considered that 98% of products are High quality when activities are performed by an expert operator. This percentage decreases to 90% and 80% for the case of standard and novice operators, respectively.
Table 19.
Values used in distribution functions for Quality, the same for all the functions.
For the simulation the Flexsim software has been configured with a working time of , that is one hour, and a total of 30 replicates per experiment, to avoid bias from the probability distribution.
3.5. Results on Task Indicators
In this section, the results for task indicators (Time to Task and Percentage of products finished with high quality) are shown using simple statistics (mean and standard deviation).
3.5.1. Scenario 1. Fully Manual Task
For the first scenario it is considered that only one operator develop activities. It can be observed how mean time and its standard deviation for completing the task increases as the level of expertise decreases (see Table 20). It should be noted that it was supposed that all the operators are identically fast performing activities (). Thus, variability introduces delays in the task performance from 11.87 s to complete a task, in the case of an expert operator, to 13.77 and 15.20 s, for the other two cases. In this form, an expert operator is able to complete 173 products in one hour, a standard one is completing 152 products and a novice operator is only completing 138 products.
Table 20.
Scenario 1: Results for Time (, ) and Quality (, ).
As it could be expected, mean quality is similar to the default percentages assigned for each type of operator (see Table 19). However, it is worth noting how standard deviation for high product quality gets significantly high values for all the type of operators, showing clearly how time variability impacts on final product Quality.
3.5.2. Scenario 2. Fully Automated Task with a Robot
For this fully automated scenario, it is considered for the cobot that starting from the typical/normal condition, an optimization upgrade allows increase its speed by 20%, and so is the result for , as displayed in Table 21. In addition, no time deviation is considered, as it is the usual high precision case in industrial robotics, therefore gets a null value as result.
Table 21.
Scenario 2: Results for Time (, ) and Quality (, ).
Our hypothesis is that the cobot is not well prepared for this new task, because some decorative specifications are asked for the user that the robot is not able to sense. This is the reason human operators help in the assembly process. Consequently, the mean value used in the distribution function for high quality products is 79%, below novice operator. Consequently, a similar is obtained as result for both type of cobots. It is worth noting that standard deviation value is higher for the basic operator than for the upgraded (faster) one. Hence, high quality is not downgraded because faster processing.
3.5.3. Scenario 3. The Process is Executed in a Collaborative Manner, Human-Robot Shared Task
The implementation of the MABA-MABA strategy has been carried out in this scenario, as a result of which there are six possible cases, as observed in Table 22. For the implementation of the cases the ETTO [50] (Efficiency-Thoroughness Trade-Off) principle has been maintained.
Table 22.
Scenario 3: Results for Time (, ) and Quality (, ).
For this collaborative scenario, values are ever higher than the ones for the fully automated scenario. No significant time increase is observed for the basic cobot, hence humans are not delaying too much the product completion. However, this is the case for the optimised cobot case, for all the type of human operators. As a first conclusion, optimised cobots are not worthy for the collaborative scenario in this assembly task. The standard deviation is reduced from the totally manual scenario, as it is expected because cobots are not inserting variability.
For the measure of Quality, it is important to highlight how percentages of high quality products in this collaborative scenario are very similar to the ones in the totally manual scenario. That is, the human-robot shared task allows outperforming the low percentage due to the use of only cobots due to the dexterous expertise of the human operators.
In Figure 7 the boxplot for the variation of the Time to Task for 30 replicates is shown in a workspace composed of a Human Operator (Expert, Standard, Novice) and the Robot Operator set Basic, in this image you can see a greater variability in the novice operator. A similar boxplot figure is displayed in Figure 8 for the percentage of high quality products. For this scenario, quality is more related to the characteristics that the operator imposes on the process, which is why there is greater variability for each case.
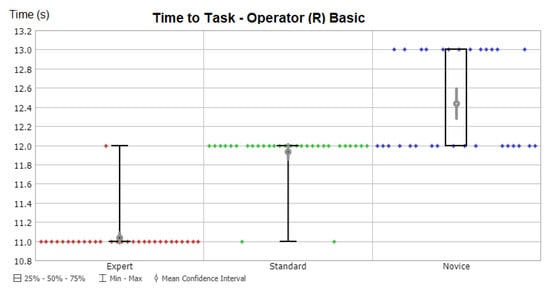
Figure 7.
Time variation with Operator Robotic Basic in Scenario 3.
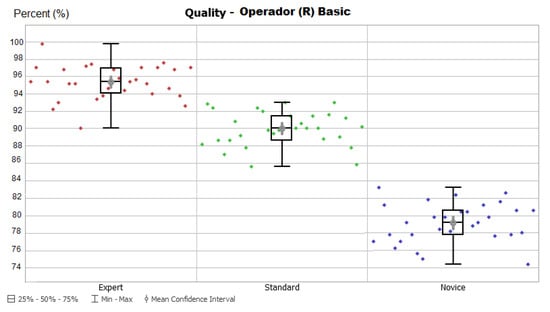
Figure 8.
Quality variation with Operator Human Standard in Scenario 3.
4. Discussion
From the FRAM methodology (model, scenarios and identification of variability) and the simulation of the model (distribution function, discrete event simulation) it has been quantitatively checked that variability in the output of the system is directly related to the performance of the type of operator in the workplace. Now is time to convert these results into cognitive information, so the operator can organize her/his shift time, the supervisor can organize production, and the robot can, eventually, recommend some strategies to the operator or the supervisor in case some deviation in the actual production specifications is happening.
For this analysis, the coefficients of variation defined in Equation (1) as the ratio between standard deviation and mean expressed as a percentage, are used for the operator human, the one introducing variability in time. Hence, is calculated and displayed in Table 23 in reference to the time in activities (5) to complete the product, as the mean value, .
Table 23.
Results for the overall activity (Manual Assembly). Values are the mean for each the activities related for the task.
In Table 24, represents the resulting variation in time for the assembly of the product. Values for mean and standard deviation are obtained from Table 20.
Table 24.
Results for the overall tasks (Manual Assembly). Values are the mean for all the task.
Next, for the Time variable the percentage of variation from mean time in task and time in activity is obtained,
It is shown in Table 25 the results obtained for variability at each scenario.
Table 25.
Relation of Coefficient of Variation for Time and Quality.
A similar percentage of variation is calculated for Quality, also shown in Table 25. In this case, it is assumed that parts are introduced into the system with the same distribution, independently from the operator in the activities. The coefficient of quality in input, has the same value for all the cases, and the quality total of output is , hence .
4.1. General Remarks
As it can be see in Table 25, input variations are amplified through the system. Novice operators insert the greatest variation and therefore there is the greatest amplification. On the other hand, if the system activities are only executed by the robot, quality variability changes when moving from an optimized robot to a basic one, but not so much.
The Human-Robot collaborative (HRC) system presents less variability for time and quality with respect to a human only system. Moreover, this scenario increases the production. The assignment of activities can be optimized based on the information of the activity times employed and the functions performed, so dynamic assignment of functions is possible. For the assignment of activities, a strategy is employed based on system operating conditions that are favourable to the operator and that maintain acceptable levels of efficiency within the work shift. The activity assigner could consider transitioning from a novice operator to an expert operator and modify the assignment to achieve maximum efficiency of the HRC system.
4.2. Cognitive Agent Recommendation
Let us suppose that our customer is asking for a batch of products such that at least 85% are high quality. According to the variability study performed, a fully manual task (Scenario 1) with Expert or Standard operators is providing for sure this result. It is impossible to get it for the Scenario 2, only considering a fully automated task. Finally, in the collaborative Scenario 3, again Expert or Standard operators should be considered. Hence, a first recommendation message is not to consider novice operators for this case. However, they could be considered in the case that the asked high quality percentage were 75%. A fully automated scenario could be also considered.
Looking at the percentage of variation for Quality, is not spreading in the Scenario 1 for Expert and Standard operator, so a Standard one can be considered without risks. In the case that the percentage of high quality products can be reduced to 75% a novice operator is not a good choice for the Scenario 1 because variation is increased to 117.15%. However, it can be considered in case that Scenario 3 is selected. A recommendation from the cognitive module would be, in case only novice operators are available in this moment for this task, to work in a collaborative Scenario 3. In this case, you can provide autonomy to the novice operator selecting the basic or the optimized version of the cobot because percentage of high quality products will be similar and variation is also similar.
A similar study could be performed on the Time specification, depending on the customer specifications as well as the plant organization, in order to improve task effectiveness and productivity.
5. Conclusions and Further Research
In recent years, robot manufacturers have been introducing collaborative robots into industrial plants. This paradigm change has key implications in the assessment of how to achieve the desired production taking into account new actors (cobots). On the one hand, totally automated assembly systems are possible, but they require design and commissioning of terminal elements for the robot, robot programming, conditioning of the robotized station and new safety requirements for collaborative robots. On the other hand, manual assembly systems are available in which the operator supplies the station (feeding) and performs several assembly tasks with a certain degree of flexibility but with a decrease in productivity. The intersection or middle point, i.e., balanced collaborative assembly systems in which operator and robot share physical space, is the subject of study in this research.
Quantitative results are obtained by identifying sources of variability as a negative effect into the process, and analysing how they are propagated using two performance metrics (time to task and percentage of high quality products) and the FRAM methodology. Hence, it is demonstrated that variability inherent to humans can be bounded near to the precision obtained in fully automated tasks in a mixed human-robot scenario. Moreover, human flexibility helps to obtain high quality products even tough robots are not totally equipped to match this level of quality. This beneficial symbiotic relationship is observed for any level of human expertise. At the same time, this increased high quality production obtained when human flexibility is considered into the process, is not at cost of high increasing rates in the time-to-task value. Humans are delaying the total time needed to complete the overall task, but this delay is bounded by the activities where robots are present.
It should be emphasized that using our proposed approach, recommender systems can assist humans in tasks allocation (human operator, collaborative robot), identification of optimal production mixed scenarios and gap reduction in the connectivity between plant and manufacturing execution systems, allowing analyzing economical costs of possible production scenarios.
In this research work, the workplace was analysed as an isolated system. As a future work, communication with manufacturing execution system (MES type management systems) should be considered, towards a complete sociotechnical system. Moreover, by transforming the information obtained from data in a real-world process into knowledge, it is possible to change the strategy of assignment of activities. As a further research line, other near engineering disciplines can also benefit of this kind of studies, such as cognitive systems engineering, information management systems or resilience engineering.
Finally, another extension to the current work is to add the principle of failure analysis. In the FRAM methodology, this study means to analyse how to maintain the same level of production when one part (human or robot) is working in abnormal situation, even missing because parallel works, and it is necessary to increase the workload of the other part. Furthermore, it would be also possible to add another module inside the cognitive agent with recommendations in safety critical systems.
Author Contributions
Conceptualization, A.C. and P.P.; Data curation, A.C.; Formal analysis, C.A.; Investigation, A.C. and P.P.; Methodology, P.P.; Project administration, C.A.; Resources, A.C.; Software, A.C.; Supervision, P.P. and C.A.; Validation, A.C. and P.P.; Writing—original draft, A.C. and P.P.; Writing—review and editing, C.A. All authors have read and agreed to the published version of the manuscript.
Funding
This work has been co-financed by the European Regional Development Fund of the European Union in the framework of the ERDF Operational Program of Catalonia 2014-2020, grant number 001-P-001643. Cecilio Angulo has been partly supported by the European Union’s Horizon 2020 research and innovation programme under grant agreement No. 825619 (AI4EU).
Conflicts of Interest
The authors declare no conflict of interest.
References
- International Federation of Robotics. The Impact of Robots on Productivity, Employment and Jobs; Positioning Paper; International Federation of Robotics: Frankfurt, Germany, 2018. [Google Scholar]
- Chacón, A.; Angulo, C.; Ponsa, P. Developing Cognitive Advisor Agents for Operators in Industry 4.0. In New Trends in the Use of Artificial Intelligence for the Industry 4.0; Martínez, L.R., Rios, R.A.O., Prieto, M.D., Eds.; IntechOpen: Rijeka, Croatia, 2020; Chapter 7. [Google Scholar] [CrossRef]
- Moniz, A.B.; Krings, B.J. Robots Working with Humans or Humans Working with Robots? Searching for Social Dimensions in New Human-Robot Interaction in Industry. Societies 2016, 6, 23. [Google Scholar] [CrossRef]
- Groover, M.P.; Weiss, M.; Nagel, R.N.; Odrey, N.G. Industrial Robotics: Technology, Programming, and Applications; McGraw-Hill: New York, NY, USA, 1986. [Google Scholar]
- Pervez, A.; Ryu, J. Safe physical human robot interaction-past, present and future. J. Mech. Sci. Technol. 2011, 22, 469–483. [Google Scholar] [CrossRef]
- Gualtieri, L.; Palomba, I.; Wehrle, E.J.; Vidoni, R. The Opportunities and Challenges of SME Manufacturing Automation: Safety and Ergonomics in Human–Robot Collaboration. In Industry 4.0 for SMEs: Challenges, Opportunities and Requirements; Springer International Publishing: Cham, Switzerland, 2020; pp. 105–144. [Google Scholar] [CrossRef]
- Sheridan, T.B. Supervisory Control. In Handbook of Human Factors and Ergonomics; John Wiley & Sons, Ltd.: New York, NY, USA, 2006; Chapter 38; pp. 1025–1052. [Google Scholar] [CrossRef]
- Teo, G.; Matthews, G.; Reinerman-Jones, L.; Barber, D. Adaptive aiding with an individualized workload model based on psychophysiological measures. Hum. Intell. Syst. Integr. 2019. [Google Scholar] [CrossRef]
- Illankoon, P.; Tretten, P.; Kumar, U. Modelling human cognition of abnormal machine behaviour. Hum. Intell. Syst. Integr. 2019, 1, 3–26. [Google Scholar] [CrossRef]
- ISO Central Secretary. Ergonomics–General Approach, Principles and Concepts; Standard ISO 26800:2011; International Organization for Standardization: Geneva, Switzerland, 2011. [Google Scholar]
- ISO Central Secretary. Ergonomics Principles in the Design of Work Systems; Standard ISO 6385:2016; International Organization for Standardization: Geneva, Switzerland, 2016. [Google Scholar]
- Wang, W.; Chen, Y.; Li, R.; Jia, Y. Learning and Comfort in Human-Robot Interaction: A Review. Appl. Sci. 2019, 9, 5152. [Google Scholar] [CrossRef]
- Goh, Y.M.; Micheler, S.; Sanchez-Salas, A.; Case, K.; Bumblauskas, D.; Monfared, R. A variability taxonomy to support automation decision-making for manufacturing processes. Prod. Plan. Control 2020, 31, 383–399. [Google Scholar] [CrossRef]
- Nemeth, C. Erik Hollnagel: FRAM: The functional resonance analysis method, modeling complex socio-technical systems. Cogn. Technol. Work 2013, 15, 117–118. [Google Scholar] [CrossRef]
- Steinfeld, A.; Fong, T.W.; Kaber, D.; Scholtz, J.; Schultz, A.C.; Goodrich, M. Common Metrics for Human-Robot Interaction. In Proceedings of the First ACM/IEEE International Conference on Human-Robot Interaction, Salt Lake City, UT, USA, 2–3 March 2006. [Google Scholar]
- Murphy, R.R.; Schreckenghost, D. Survey of metrics for human-robot interaction. In Proceedings of the 2013 8th ACM/IEEE International Conference on Human-Robot Interaction (HRI), Tokyo, Japan, 3–6 March 2013; pp. 197–198. [Google Scholar]
- Marvel, J.A.; Bagchi, S.; Zimmerman, M.; Aksu, M.; Antonishek, B.; Wang, Y.; Mead, R.; Fong, T.; Ben Amor, H. Test Methods and Metrics for Effective HRI in Collaborative Human-Robot Teams. In Proceedings of the 2019 14th ACM/IEEE International Conference on Human-Robot Interaction (HRI), Daegu, Korea, 11–14 March 2019; pp. 696–697. [Google Scholar]
- Bajcsy, A.; Losey, D.P.; O’Malley, M.K.; Dragan, A.D. Learning Robot Objectives from Physical Human Interaction. In Proceedings of the 1st Annual Conference on Robot Learning; Levine, S., Vanhoucke, V., Goldberg, K., Eds.; Proceedings of Machine Learning Research; PMLR: Mountain View, CA, USA, 2017; Volume 78, pp. 217–226. [Google Scholar]
- Harriott, C.E.; Buford, G.L.; Adams, J.A.; Zhang, T. Mental Workload and Task Performance in Peer-Based Human-Robot Teams. J. Hum. Robot Interact. 2015, 4, 61–96. [Google Scholar] [CrossRef]
- Hoffman, G. Evaluating Fluency in Human-Robot Collaboration. IEEE Trans. Hum. Mach. Syst. 2019, 49, 209–218. [Google Scholar] [CrossRef]
- Di Nuovo, A.; Varrasi, S.; Conti, D.; Bamsforth, J.; Lucas, A.; Soranzo, A.; McNamara, J. Usability Evaluation of a Robotic System for Cognitive Testing. In Proceedings of the 14th ACM/IEEE International Conference on Human-Robot Interaction, HRI’19, Daegu, Korea, 11–14 March 2019; pp. 588–589. [Google Scholar]
- Lemaignan, S.; Warnier, M.; Sisbot, E.A.; Clodic, A.; Alami, R. Artificial cognition for social human–robot interaction: An implementation. Artif. Intell. 2017, 247, 45–69. [Google Scholar] [CrossRef]
- Lasota, P.A.; Rossano, G.F.; Shah, J.A. Toward safe close-proximity human-robot interaction with standard industrial robots. In Proceedings of the 2014 IEEE International Conference on Automation Science and Engineering (CASE), Taipei, Taiwan, 18–22 August 2014; pp. 339–344. [Google Scholar]
- Kimble, K.; Van Wyk, K.; Falco, J.; Messina, E.; Sun, Y.; Shibata, M.; Uemura, W.; Yokokohji, Y. Benchmarking Protocols for Evaluating Small Parts Robotic Assembly Systems. IEEE Robot. Autom. Lett. 2020, 5, 883–889. [Google Scholar] [CrossRef]
- Marvel, J.A. Performance Metrics of Speed and Separation Monitoring in Shared Workspaces. IEEE Trans. Autom. Sci. Eng. 2013, 10, 405–414. [Google Scholar] [CrossRef]
- Marvel, J.A.; Falco, J.; Marstio, I. Characterizing Task-Based Human–Robot Collaboration Safety in Manufacturing. IEEE Trans. Syst. Man, Cybern. Syst. 2015, 45, 260–275. [Google Scholar] [CrossRef]
- Kolbeinsson, A.; Lagerstedt, E.; Lindblom, J. Foundation for a classification of collaboration levels for human-robot cooperation in manufacturing. Prod. Manuf. Res. 2019, 7, 448–471. [Google Scholar] [CrossRef]
- Katona, J.; Ujbanyi, T.; Sziladi, G.; Kovari, A. Speed control of Festo Robotino mobile robot using NeuroSky MindWave EEG headset based brain-computer interface. In Proceedings of the 2016 7th IEEE International Conference on Cognitive Infocommunications (CogInfoCom), Wroclaw, Poland, 16–18 October 2016; pp. 000251–000256. [Google Scholar]
- Salazar-Gomez, A.F.; DelPreto, J.; Gil, S.; Guenther, F.H.; Rus, D. Correcting robot mistakes in real time using EEG signals. In Proceedings of the 2017 IEEE International Conference on Robotics and Automation (ICRA), Singapore, 29 May–3 June 2017; pp. 6570–6577. [Google Scholar]
- Davis, F.D. Perceived Usefulness, Perceived Ease of Use, and User Acceptance of Information Technology. MIS Q. 1989, 13, 319–340. [Google Scholar] [CrossRef]
- Brooke, J. SUS: A Retrospective. J. Usability Stud. 2013, 8, 29–40. [Google Scholar]
- ISO Central Secretary. Ergonomics of Human-System Interaction—Part 420: Selection Of Physical Input Devices; Standard ISO 9241-420:2011; International Organization for Standardization: Geneva, Switzerland, 2011. [Google Scholar]
- Hoffman, G.; Breazeal, C. Cost-Based Anticipatory Action Selection for Human–Robot Fluency. IEEE Trans. Robot. 2007, 23, 952–961. [Google Scholar] [CrossRef]
- Hazbar, T.; Kumar, S.; Sahin, F. Cyber-Physical Testbed for Human-Robot Collaborative Task Planning and Execution. arXiv 2019, arXiv:1905.00199. [Google Scholar]
- Gualtieri, L.; Rojas, R.A.; Ruiz Garcia, M.A.; Rauch, E.; Vidoni, R. Implementation of a Laboratory Case Study for Intuitive Collaboration Between Man and Machine in SME Assembly. In Industry 4.0 for SMEs: Challenges, Opportunities and Requirements; Springer International Publishing: Cham, Switzerland, 2020; pp. 335–382. [Google Scholar] [CrossRef]
- Nwanya, S.; Achebe, C.; Ajayi, O.; Mgbemene, C. Process variability analysis in make-to-order production systems. Cogent Eng. 2016, 3, 1269382. [Google Scholar] [CrossRef]
- Sanchez-Salas, A.; Goh, Y.; Case, K. Identifying variability key characteristics for automation design—A case study of finishing process. In Proceedings of the 21st International Conference on Engineering Design (ICED 17), Vol. 4: Design Methods and Tools, Vancouver, BC, Canada, 21–25 August 2017; pp. 21–30. [Google Scholar]
- Xia, X.; Zhu, W. Evaluation for the stability variation of the manufacturing process based on fuzzy norm method. In Proceedings of the 2016 12th International Conference on Natural Computation, Fuzzy Systems and Knowledge Discovery (ICNC-FSKD), Changsha, China, 13–15 August 2016; pp. 1057–1064. [Google Scholar]
- Caputo, F.; Greco, A.; Fera, M.; Macchiaroli, R. Digital twins to enhance the integration of ergonomics in the workplace design. Int. J. Ind. Ergon. 2019, 71, 20–31. [Google Scholar] [CrossRef]
- Gualtieri, L.; Rauch, E.; Vidoni, R.; Matt, D.T. An evaluation methodology for the conversion of manual assembly systems into human-robot collaborative workcells. Procedia Manuf. 2019, 38, 358–366. [Google Scholar] [CrossRef]
- Bruno, G.; Antonelli, D. Dynamic task classification and assignment for the management of human-robot collaborative teams in workcells. Int. J. Adv. Manuf. Technol. 2018, 98, 2415–2427. [Google Scholar] [CrossRef]
- Koch, P.; van den Broek, M.; Dȩbska, P.; Thormann, M.; Tetzlaff, A.; Bøgh, S.; Chrysostomou, D. A Skill-based Robot Co-worker for Industrial Maintenance Tasks. Procedia Manuf. 2017, 11, 83–90. [Google Scholar] [CrossRef]
- Nordgren, W.B. Flexsim: Flexsim Simulation Environment. In Proceedings of the 34th Conference on Winter Simulation: Exploring New Frontiers, Winter Simulation Conference, San Diego, CA, USA, 8–11 December 2002; pp. 250–252. [Google Scholar]
- Hiatt, L.M.H.; Trafton, A.M.; Gregory, J. Accommodating human variability in human-robot teams through theory of mind. In Proceedings of the 22nd International Joint Conference on Artificial Intelligence, IJCAI’11, Barcelona, Spain, 16–22 July 2011; pp. 2066–2071. [Google Scholar]
- Hollnagel, E. FRAM: The Functional Resonance Analysis Method: Modelling Complex Socio-Technical Systems; Ashgate Publishing: Farnham, UK, 2012; pp. 1–142. [Google Scholar] [CrossRef]
- Praetorius, G.; Hollnagel, E.; Dahlman, J. Modelling Vessel Traffic Service to understand resilience in everyday operations. Reliab. Eng. Syst. Saf. 2015, 141, 10–21. [Google Scholar] [CrossRef]
- Bellini, E.; Coconea, L.; Nesi, P. A Functional Resonance Analysis Method Driven Resilience Quantification for Socio-Technical Systems. IEEE Syst. J. 2020, 14, 1234–1244. [Google Scholar] [CrossRef]
- Dekker, S.W.A.; Woods, D.D. MABA-MABA or Abracadabra? Progress on Human–Automation Co-ordination. Cogn. Technol. Work 2002, 4, 240–244. [Google Scholar] [CrossRef]
- Piera, M.À. Modelado y Simulación. Aplicación a Procesos Logísticos de Fabricación y Servicios; Universitat Politècnica de Catalunya, Iniciativa Digital Politècnica: Barcelona, Spain, 2004. [Google Scholar]
- Hollnagel, E. The ETTO Principle: Why Things that Go Right Sometimes Go Wrong; Ashgate: Farnham, UK, 2009. [Google Scholar]
© 2020 by the authors. Licensee MDPI, Basel, Switzerland. This article is an open access article distributed under the terms and conditions of the Creative Commons Attribution (CC BY) license (http://creativecommons.org/licenses/by/4.0/).