Abstract
Material extrusion (ME), an extrusion-based rapid prototyping technique, has been extensively studied to manufacture final functional products, whose forming quality is significantly influenced by the melt flow behavior (MFB) inside the extrusion liquefier. Applied vibration has a great potential to improve the MFB, and thereby promote the forming quality of the built product. To reveal the mechanism, a dynamic model of the melt flow behavior (DMMFB) is established based on fluid dynamics, Tanner nonlinear constitutive equation and Newton’s power law equation. The MFB, i.e., pressure drop, shear stress and apparent viscosity, is investigated without and with different vibration applied. The corresponding finite element analysis (FEA) is then carried out. From the comparison between DMMFB and FEA results, it is concluded that the proposed model is reliable. When vibration is applied onto the extrusion liquefier, the time-domain MFB will change periodically. Its effective value decreases significantly, and further decreases with the increase of vibration frequency or amplitude. This paper provides the theoretical basis to improve the MFB by applied vibration, and thereby to enhance the forming quality of ME products.
1. Introduction
Material extrusion (ME), used by ISO/ASTM 52900:2015 to include FDM (fused deposition molding)/FFF (fused filament fabrication) technologies, is one of the most promising rapid prototyping techniques [1,2] due to the advantages of ease of operation, low cost, broad resources of raw materials, etc. In this technique, the raw material filament is first fed into an extrusion liquefier, where it is melted and flowed. The solid portion of the filament is acting as a piston to push the melt out of the liquefier through a nozzle. The extrudate then cools, solidifies and bonds with the extruded material layer beneath it. A three-dimensional model or part entity is finally completed by repeating this procedure through to the last layer [3,4]. Although the products built via ME have been increasingly widely used for electronic, automotive and aerospace applications [5], widespread industrial adoption of this technique is limited due to the limitations of final part properties, and there is still a lot of space for improvement in their forming quality [6,7].
Since the melt flow behavior (MFB) is one of the key factors affecting the forming quality of ME products [8,9], it is of great importance to try to improve it. Ramanath et al. [10,11] established a mathematical model of Polycaprolactone (PCL) melts in a ME liquefier to study the thermal and flow behavior by varying input conditions. Finite element analysis (FEA) was also performed to validate the model. It was found that the deviations in pressure drop obtained by the mathematical model and FEA were in agreeable limits. The pressure drop and the velocities of the melt flow depended on the flow channel parameters. The proposed model could be used to reflect on the quality of built parts. Peng et al. [12] proposed an experimental approach (pigment distribution) to illustrate the temperature and flow history in the extrusion process. The results showed that a smaller shear rate occurred near the center, leading to a more blunted velocity profile. The extrusion process was highly non-isothermal, especially at high extrusion speed. Pandey and Pradhan [13] theoretically investigated the MFB within ME to find the optimum feed rate at the liquefier inlet. The melt velocity, pressure drop, shear stress and temperature could be predicted through the momentum balance equation and energy balance equation. Stewart et al. [14] analyzed the MFB of polylactic acid (PLA) within ME in order to promote part quality, process control and efficiency. They experimentally analyzed the power output of the resistive heat source, theoretically studied external coefficients of heat-transfer and validated liquefier temperatures. The results showed that the temperature was significantly different at different areas inside the liquefier. The research provided theoretical insight for better extruder designs and material options. Zhang et al. [15] studied the effects of nozzle diameter, filler size, resin viscosity and volume content on the MFB in the extrusion liquefier. It was found that the nozzle diameter and volume content had a significant effect on the melt flow property. Clogging was more likely to occur when the material viscosity was higher, the material particle was bigger and the nozzle diameter was smaller. Coogan and Kazmer [16] experimentally investigated the rheology of the melt in ME by using a designed in-line rheometer. The extrusion liquefier was modified with a custom pressure transducer and a thermocouple. The results showed that the in-line rheometer provided accurate viscosity measurements with appropriate corrections applied. Mackay [17] thoroughly reviewed the rheological behavior within ME to highlight its significance, mainly including heat transfer, MFB, die swell, healing, etc. He emphasized that concerted rheologycentric investigations were clearly needed to clarify the interaction between MFB and the fabricating process so that the forming quality of ME parts could be improved.
Liu et al. [18,19,20] studied the velocity, rheological behavior and shear rate of the polymer melt in the capillary without and with vibration applied. The entry pressure, volume flow rate and their phase-difference were measured and analyzed. The characterization formula of the MFB (i.e., viscosity and viscoelastic behavior) was established. It was found that the flow velocity of the polymer melt was significantly increased, and the viscosity was greatly decreased when vibration was introduced. Ellenberger and Krishna [21] investigated the flow rate of the liquid inside capillaries with the longitudinal sinusoidal vibration applied. The results showed that the liquid flow rate was significantly enhanced when vibration was applied.
Similarly, applying vibration into the process of ME has a great potential to improve the MFB, and thereby enhance the forming quality of ME parts. However, few scholars have proposed this concept at present [22,23], and little corresponding information (either theoretical or experimental data) is available. To cover this gap, this paper establishes a dynamic model of the MFB (DMMFB) to analyze the pressure drop, shear stress and apparent viscosity in the ME liquefier without and with different vibrations applied. The corresponding simulations are then performed to compare with the modeling results. The influencing rule of applied vibration on the MFB is illustrated. The proposed model offers a theoretical tool for MFB process monitoring and provides a theoretical basis for improving the forming quality of ME products by applied vibration. This research also gives technical reference to improve the forming quality of similar manufacturing processes (like injection molding) in industry.
2. The DMMFB
The MFB within ME, i.e., pressure drop, shear stress and apparent viscosity, is related to the geometry and size of the internal passage of the extrusion liquefier, as well as the viscoelastic behavior of the melt. The interior of the liquefier can be mainly divided into three geometric regions, as shown in Figure 1. Region I is the upper zone of the liquefier (cylindrical in shape), where the material filament enters and melts into a molten state, Region II is the transition zone for the molten material from Region I to III in the liquefier, and the shape is a truncated cone and Region III is the lower zone of the liquefier (also cylindrical in shape but smaller), from which the molten material is extruded out.
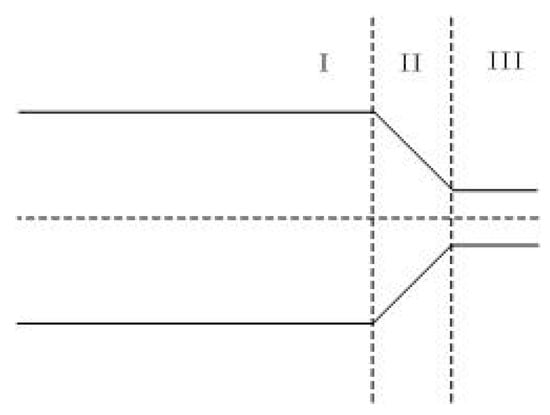
Figure 1.
Schematic diagram of the internal geometric region of the extrusion liquefier.
Since the modeling principle is similar among the three regions, details are provided for Region I, with its geometry and coordinates shown in Figure 2. The length and radius of the cylindrical passage are and , respectively. For ease of analysis about Region I, a cylindrical coordinate system is used to describe the coordinate points. Among them, is the direction of the melt flow, is the direction of the velocity gradient and is the neutral direction.
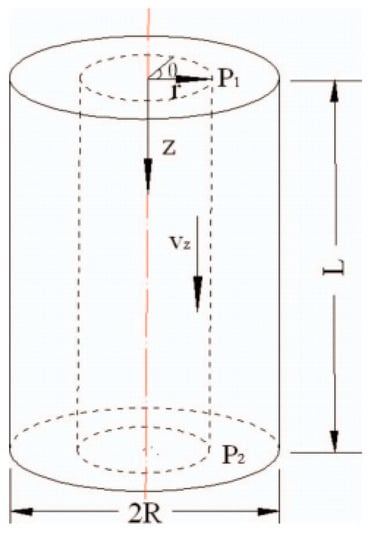
Figure 2.
Cylindrical area coordinates.
To further facilitate the analysis, the following assumptions are proposed:
- The melt flow is laminar, Re (Reynolds number) < 5.
- The temperature is constant inside the whole liquefier.
- The melt is incompressible.
- The effect of gravity force is negligible.
- There is no external force, like magnetic, etc.
- The velocity near the wall surface is zero, and it does not change in the neutral direction.
- No flow occurs in the direction.
The modeling details are provided in Appendix A.
3. FEA
FEA was carried out to simulate the MFB inside the extrusion liquefier without and with different types of sinusoidal vibration applied. The Fluent module with fluid analysis function in ANSYS workbench (commercial software) was used for simulation analysis. There were three steps, including pre-processing, solving and post-processing. Firstly, the three-dimensional (3D) geometric model of the internal flow channel of the liquefier was set up according to Table 1. It was imported into the pre-processing sub-module to define the entry, exit and boundary conditions. Since the geometric model was simple and axisymmetric, an unstructured grid automatically generated by the sweeping method was used to divide mesh of the internal flow channel wall of the liquefier, as shown in Figure 3.

Table 1.
The internal geometry of the extrusion liquefier.
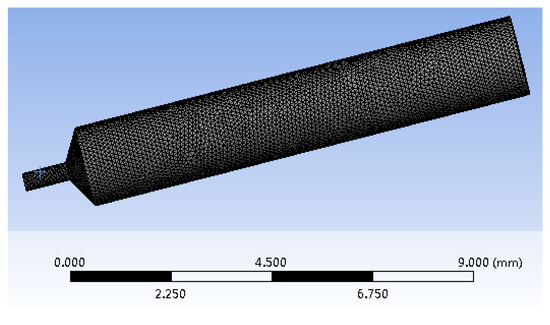
Figure 3.
The meshed internal flow passage.
In the solving sub-module, the analysis type was transient analysis, and the model entrance and exit were set to velocity-inlet and pressure-outlet, respectively. According to Assumptions 1 and 3, the simulation environment was set to be good at solving the pressure correction algorithm of incompressible flow, and the semi implicit original algorithm (suitable for laminar flow calculation) was adopted. For each vibration cycle, there were 50 time sub-steps divided. The maximum number of iterations in each sub step is 70, with the iteration accuracy set to 0.00001. In addition, the velocity of the melt at the internal wall was zero due to Assumption 6. The inlet velocity boundary conditions were set as in Equation (A4). The inlet temperature of the melt was , the temperature of the internal wall was and the reference temperature was . Besides, PLA, the working material in this research, was a type of biological renewable and biodegradable polymer with good workability and forming stability [24]. The basic physical properties of PLA are shown in Table 2. After the solution was completed, the corresponding information in terms of MFB could be obtained by entering the post-processing sub-module.
Table 2.
Physical properties of polylactic acid (PLA) [25].
4. Results and Discussion
In this section, the MFB results within ME are compared between DMMFB and FEA, and the influencing rule of different applied vibration is then provided. According to fractional factorial design [26], each section shows the detailed effect of only one single variable on the MFB, and gives corresponding discussions.
4.1. Effect of Vibration on the Pressure Drop
4.1.1. 0.25 g Vibration at Different Frequency
Figure 4 shows the time-domain internal pressure drop of the extrusion liquefier obtained by DMMFB and FEA without and with different-frequency vibration applied, of which the amplitude is 0.25 g and the frequency is, separately, 100, 200, 300, 400 and 500 Hz. When vibration is applied, the time-domain pressure drop changes periodically as the inlet velocity of the extrusion liquefier changes from a constant to a periodic variation. From the comparison, it can be seen that the analytical pressure drop (obtained by DMMFB) is in good agreement with the simulated one (obtained by FEA), both in value and trend.
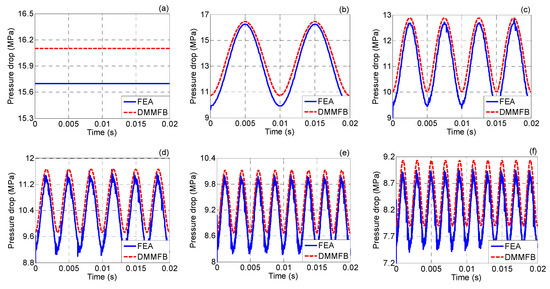
Figure 4.
The internal pressure drop of the extrusion liquefier without and with 0.25 g vibration applied at different frequencies. (a) No vibration applied, (b) 100 Hz, (c) 200 Hz, (d) 300 Hz, (e) 400 Hz, (f) 500 Hz.
Table 3 summarizes the effective value of the pressure drop for each condition. It can be seen that the value of the pressure drop decreases with the application of vibration and further decreases with the increase of vibration frequency. For example, when no vibration is applied, the effective value of the pressure drop predicted by DMMFB is 16.1 MPa. When the frequency of the applied vibration is 200 Hz, the value is reduced down to 11.7 MPa, decreased by 27.3%. When the frequency is 500 Hz, the value is further reduced to 8.5 MPa, decreased by 47.2%. This can be explained by the fact that increasing vibration frequency will decrease the amplitude of inlet velocity and speed up the changes according to Equation (A4), the amplitude of the pressure drop is then reduced and the changes are fast, as referred to by Equation (A20). Therefore, the larger the introduced vibration frequency is, the smaller the magnitude in pressure drop will be.
Table 3.
Effective value of the pressure drop without and with 0.25 g vibration applied at different frequencies.
4.1.2. 0.3 g Vibration at Different Frequency
Figure 5 shows the comparison of pressure drop between DMMFB and FEA. The amplitude of the applied vibration is 0.3 g and the frequency is, separately, 100, 200, 300, 400 and 500 Hz. From the comparison, it can be seen that the results predicted by DMMFB agree well with those obtained by FEA, no matter without or with vibration applied.
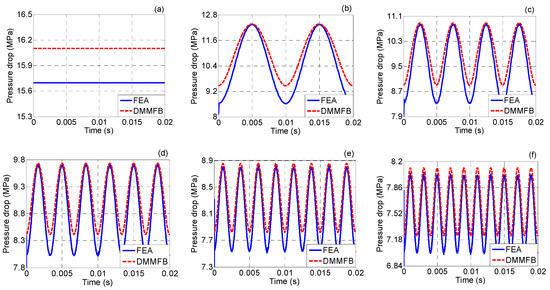
Figure 5.
The internal pressure drop of the extrusion liquefier without and with 0.3 g vibration applied at different frequencies. (a) No vibration applied, (b) 100 Hz, (c) 200 Hz, (d) 300 Hz, (e) 400 Hz, (f) 500 Hz.
The effective value of the pressure drop for each condition is detailed in Table 4. The results show the same trend as above, that is, the pressure drop is decreased with the application of vibration, and it is further decreased with the increase of applied vibration frequency. The reason for this phenomenon is the same as discussed above.
Table 4.
Effective value of the pressure drop without and with 0.3 g vibration applied at different frequencies.
4.1.3. 0.35 g Vibration at Different Frequency
The comparison of the pressure drop within ME obtained respectively by DMMFB and FEA is shown in Figure 6. No matter without or with vibration applied (the amplitude is 0.35 g and the frequency is, separately, 100, 200, 300, 400 and 500 Hz), the analytical and simulated pressure drop have a good agreement with each other.
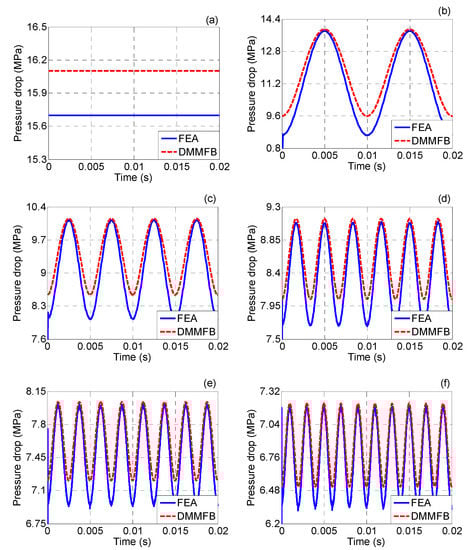
Figure 6.
The internal pressure drop of the extrusion liquefier without and with 0.35 g vibration applied at different frequencies. (a) No vibration applied, (b) 100 Hz, (c) 200 Hz, (d) 300 Hz, (e) 400 Hz, (f) 500 Hz.
Table 5 details the effective value of the above pressure drop for each condition. Again, the value decreases with vibration applied, and further decreases with the increase of vibration frequency.
Table 5.
Effective value of the pressure drop without and with 0.35 g vibration applied at different frequencies.
From the above, applying vibration onto the ME extrusion liquefier can reduce the internal pressure drop, and it will be further reduced with the increasing frequency of applied vibration. This can help improve the continuity and uniformity of the extrudate, and thereby enhance the forming quality of ME products.
4.1.4. Effect of Different Vibration Amplitude
Figure 7 compares the analytical and simulated results of the effective value of the pressure drop without and with different vibration applied, whose amplitude is, separately, 0.25, 0.3 and 0.35 g. Generally, the predictions agree well with the simulations. When vibration is applied, the pressure drop is reduced. The value is further reduced when the amplitude of applied vibration is growing. For example, when the amplitude of applied vibration is 0.25 and 0.35 g at 300 Hz, the effective value of the analytical pressure drop is 10.3 and 8.3 MPa, respectively. Compared with that under the no-vibration field (16.1 MPa), the pressure drop is decreased separately by 36.0% and 48.4%. This can be explained by the fact that increasing vibration amplitude will decrease the inlet velocity according to Equation (A4), and the pressure drop is then reduced as referred to in Equation (A20). Therefore, increasing the amplitude of applied vibration can reduce the pressure drop inside the extrusion liquefier of ME, which helps enhance the forming quality of ME products.
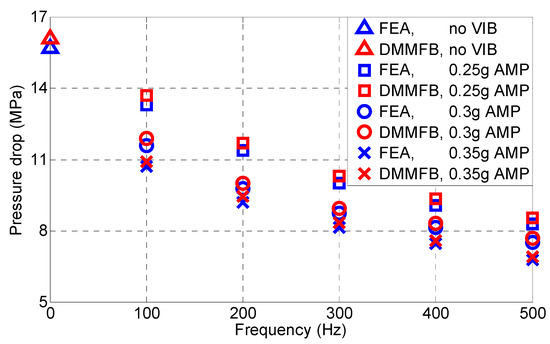
Figure 7.
Effective value of the internal pressure drop inside the extrusion liquefier without and with different-amplitude vibration applied.
4.2. Effect of Vibration on the Shear Stress
4.2.1. 0.25 g Vibration at Different Frequency
Figure 8 shows the time-domain shear stress at the internal wall of the extrusion liquefier obtained by DMMFB and FEA without and with different-frequency vibration applied, of which the amplitude is 0.25 g and the frequency is, separately, 100, 200, 300, 400 and 500 Hz. With vibration applied, the shear stress in time domain changes periodically as the pressure drop changes to a periodic variation. From the comparison, it can be seen that both the values and trend of the analytical shear stress are in good agreement with the simulated ones.
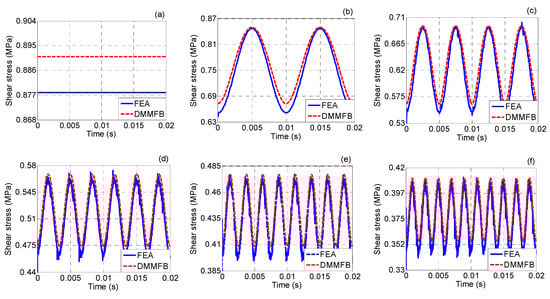
Figure 8.
The shear stress at the internal wall of the extrusion liquefier without and with 0.25 g vibration applied at different frequencies. (a) No vibration applied, (b) 100 Hz, (c) 200 Hz, (d) 300 Hz, (e) 400 Hz, (f) 500 Hz.
Table 6 summarizes the above effective value of the shear stress for each condition. The shear stress is decreased with the application of vibration and further decreased with the increase of vibration frequency. For example, when no vibration is applied, the effective value of the shear stress predicted by DMMFB is 0.89 MPa, when the frequency of the applied vibration is 100 Hz, the value is reduced down to 0.75 MPa, decreased by 15.7%, and when the frequency is 400 Hz, the value is further reduced to 0.44 MPa, decreased by 50.6%. This is because the shear stress is directly influenced by the pressure drop, see Equation (A5). Its changing situation and trend are similar to those of the pressure drop, as discussed previously.
Table 6.
Effective value of the shear stress without and with 0.25 g vibration applied at different frequencies.
4.2.2. 0.3 g Vibration at Different Frequency
Figure 9 shows the comparison of the shear stress at the internal wall of the extrusion liquefier between DMMFB and FEA. The amplitude of the applied vibration is 0.3 g and the frequency is, separately, 100, 200, 300, 400 and 500 Hz. From the comparison, it can be seen that the shear stress predicted by DMMFB agrees well with that simulated by FEA, no matter without or with vibration applied.
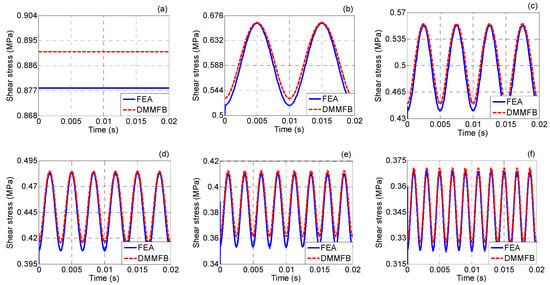
Figure 9.
The shear stress at the internal wall of the extrusion liquefier without and with 0.3 g vibration applied at different frequencies. (a) No vibration applied, (b) 100 Hz, (c) 200 Hz, (d) 300 Hz, (e) 400 Hz, (f) 500 Hz.
The effective value of the shear stress for each condition is detailed in Table 7. The results show the same trend as above, i.e., the pressure drop is decreased with the application of vibration, and it is further decreased with the increase of applied vibration frequency. The reason for this phenomenon is the same as that discussed in Section 4.2.1.
Table 7.
Effective value of the shear stress without and with 0.3 g vibration applied at different frequencies.
4.2.3. 0.35 g Vibration at Different Frequency
The comparison of the shear stress at the internal wall of the extrusion liquefier within ME obtained respectively by DMMFB and FEA is provided in Figure 10. No matter without or with vibration applied (the amplitude is 0.35 g and the frequency is, separately, 100, 200, 300, 400 and 500 Hz), the analytical and simulated shear stress have a good agreement.
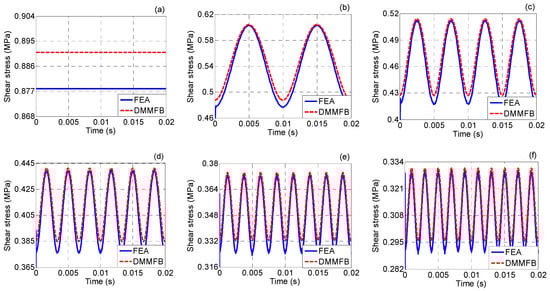
Figure 10.
The shear stress at the internal wall of the extrusion liquefier without and with 0.35 g vibration applied at different frequencies. (a) No vibration applied, (b) 100 Hz, (c) 200 Hz, (d) 300 Hz, (e) 400 Hz, (f) 500 Hz.
Table 8 details the effective value of the above shear stress for each condition. Again, the value decreases with vibration applied, and further decreases with the increase of vibration frequency.
Table 8.
Effective value of the shear stress without and with 0.35 g vibration applied at different frequencies.
To sum up, introducing vibration into the extrusion process can reduce the shear stress at the internal wall of the liquefier, and increasing the vibration frequency will further reduce the shear stress, which helps improve the forming quality of ME products.
4.2.4. Effect of Different Vibration Amplitude
Figure 11 compares the analytical and simulated effective value of the shear stress without and with different vibration applied, whose amplitude is, separately, 0.25, 0.3 and 0.35 g. It is shown that the predictions agree well with the simulations. When vibration is applied, the shear stress is reduced. The value is further reduced when the amplitude of applied vibration is growing. For example, when the amplitude of applied vibration is 0.3 and 0.35 g at 200 Hz, the effective value of the analytical shear stress is 0.51 and 0.48 MPa, respectively. Compared with that under the no-vibration field (0.89 MPa), the shear stress is decreased separately by 42.7% and 46.1%. The reason for this is that increasing vibration amplitude will decrease the pressure drop of the melt inside the extrusion liquefier, leading to the reduction in shear stress according to Equation (A5). Therefore, increasing the amplitude of applied vibration can further reduce the shear stress inside the extrusion liquefier of ME, helping to improve the continuity and uniformity of the extrudate, and thereby enhance the forming quality of ME products.
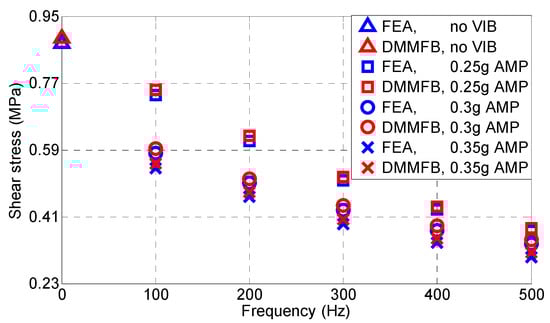
Figure 11.
Effective value of the shear stress without and with different-amplitude vibration applied.
4.3. Effect of Vibration on the Apparent Viscosity
4.3.1. 0.25 g Vibration at Different Frequency
Figure 12 shows the time-domain apparent viscosity of the melt inside the extrusion liquefier obtained by DMMFB and FEA without and with different-frequency vibration applied, of which the amplitude is 0.25 g and the frequency is, separately, 100, 200, 300, 400 and 500 Hz. It can be seen that when vibration is applied, the apparent viscosity changes periodically with time as the shear stress changes from a constant to a periodic variation, according to Equation (A8). Generally, both values and trend of the analytical apparent viscosity agree well with the simulated ones.
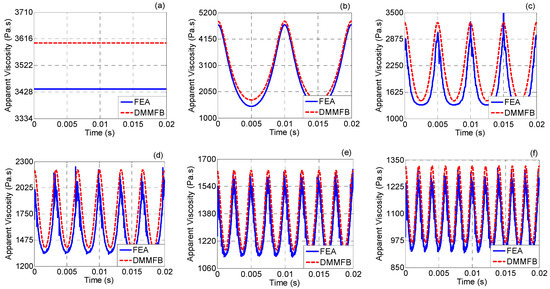
Figure 12.
The apparent viscosity of the melt inside the extrusion liquefier without and with 0.25 g vibration applied at different frequencies. (a) No vibration applied, (b) 100 Hz, (c) 200 Hz, (d) 300 Hz, (e) 400 Hz, (f) 500 Hz.
Table 9 gives the effective apparent viscosity of the melt inside the extruder liquefier for each condition. The viscosity is decreased with the application of vibration and further decreased with the increase of vibration frequency. For example, when no vibration is applied, the effective value of the viscosity predicted by DMMFB is 3601 Pa·s, when the frequency of the applied vibration is 200 Hz, the value is reduced down to 2220 Pa·s, decreased by 38.4%, and when the frequency is 300 Hz, the value is further reduced to 1760 Pa·s, decreased by 51.1%. This is because the apparent viscosity of the melt is reduced with vibration applied, and it is further reduced when the vibration frequency is increased [27,28]. In addition, due to the close relationship between apparent viscosity and shear stress according to Equation (A8), the changing situation and trend are similar to those of the shear stress, as discussed previously.
Table 9.
Effective value of the apparent viscosity without and with 0.25 g vibration applied at different frequencies.
4.3.2. 0.3 g Vibration at Different Frequency
Figure 13 shows the comparison of apparent viscosity between DMMFB and FEA. The amplitude of the applied vibration is 0.3 g and the frequency is, separately, 100, 200, 300, 400 and 500 Hz. From the comparison, it can be seen that the results predicted by DMMFB agree well with those obtained by FEA whenever vibration is applied or not.

Figure 13.
The apparent viscosity without and with 0.3 g vibration applied at different frequencies. (a) No vibration applied, (b) 100 Hz, (c) 200 Hz, (d) 300 Hz, (e) 400 Hz, (f) 500 Hz.
Table 10 shows the effective value of the apparent viscosity for each condition. The results show the same trend as above, that is, the apparent viscosity is decreased with the application of vibration, and it is further decreased with the increase of applied vibration frequency. The reason for this phenomenon is the same as that discussed above.
Table 10.
Effective value of the apparent viscosity without and with 0.3 g vibration applied at different frequencies.
4.3.3. 0.35 g Vibration at Different Frequency
The comparison of the apparent viscosity within ME obtained respectively by DMMFB and FEA is shown in Figure 14. No matter without or with vibration applied (the amplitude is 0.35 g and the frequency is, separately, 100, 200, 300, 400 and 500 Hz), the analytical and simulated apparent viscosity have a good agreement with each other.
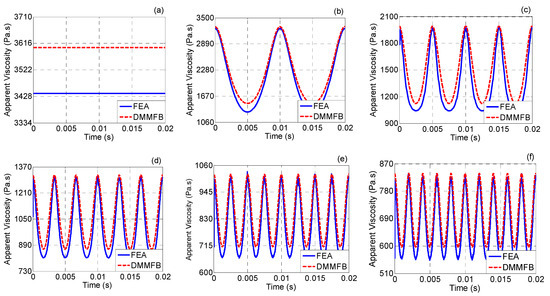
Figure 14.
The apparent viscosity without and with 0.35 g vibration applied at different frequencies. (a) No vibration applied, (b) 100 Hz, (c) 200 Hz, (d) 300 Hz, (e) 400 Hz, (f) 500 Hz.
Table 11 provides the effective value of the above apparent viscosity for each condition. Again, the value decreases with vibration applied, and further decreases with the increase of vibration frequency.
Table 11.
Effective value of the apparent viscosity without and with 0.35 g vibration applied at different frequencies.
In summary, applying vibration onto the extrusion liquefier can reduce the apparent viscosity inside the liquefier, which will be further reduced with the increasing vibration frequency. This could improve the continuity and uniformity of the extrudate, and thus enhance the forming quality of ME products.
4.3.4. Effect of Different Vibration Amplitude
Figure 15 compares the analytical and simulated effective value of the apparent viscosity without and with different vibration applied, whose amplitude is, separately, 0.25, 0.3 and 0.35 g. It is shown that the predictions agree well with the simulations. When vibration is applied, the apparent viscosity is reduced. The value is further reduced when the amplitude of applied vibration is growing. For example, when the amplitude of applied vibration is 0.3 and 0.35 g at 500 Hz, the effective value of the analytical apparent viscosity is 962 and 697 Pa·s, respectively. Compared with that under the no-vibration field (3601 Pa·s), the apparent viscosity is decreased separately by 73.3% and 80.6%. The reason is that the apparent viscosity is reduced with vibration applied, and it is further reduced when the vibration amplitude is increased [27,28]. This can also be seen from the relationship between apparent viscosity and shear stress in Equation (A8). Therefore, increasing the amplitude of applied vibration can reduce the apparent viscosity inside the extrusion liquefier of ME, which helps promote the forming quality of ME products.
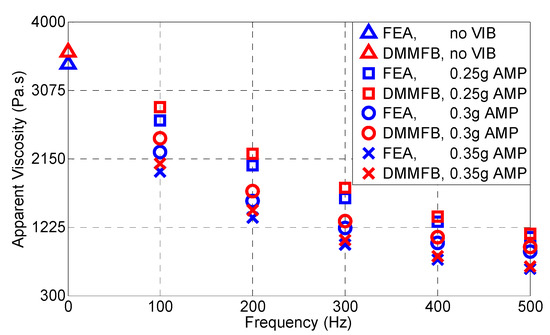
Figure 15.
Effective value of the apparent viscosity without and with different-amplitude vibration applied.
5. Conclusions
In this paper, the DMMFB inside the extrusion liquefier within ME is established based on fluid dynamics, Tanner nonlinear constitutive equation and Newton’s power law equation. The influencing rule of applied vibration on the MFB (i.e., pressure drop, shear stress and apparent viscosity) is illustrated. FEA is then performed accordingly. The conclusions are drawn as follows:
- (1)
- The time-domain pressure drop, shear stress and apparent viscosity inside the extrusion liquefier change periodically when vibration is applied.
- (2)
- With vibration applied on the liquefier, the pressure drop, shear stress and apparent viscosity decrease significantly, and they will further decrease with the increase of frequency or amplitude of the applied vibration.
- (3)
- The DMMFB results of MFB are in good agreement with those obtained by FEA both in value and trend.
- (4)
- When vibration is applied, the MFB within ME will be reduced, which helps enhance the continuity and uniformity of the extrudate, and thus improves the forming quality of ME products.
- (5)
- This research provides a theoretical tool for MFB process monitoring within ME and gives technical reference for fabrication improvement of similar manufacturing processes in industry.
In the near future, experiments are recommended to validate the DMMFB and FEA in terms of MFB to thoroughly clarify the corresponding mechanism.
Author Contributions
Conceptualization, S.J.; data curation, P.C. and Y.Z.; formal analysis, S.J., P.C. and Y.Z.; funding acquisition, S.J.; investigation, P.C., Y.Z. and C.Z.; methodology, S.J. and P.C.; project administration, S.J.; resources, S.J. and C.Z.; software, P.C.; supervision, S.J.; validation, S.J., P.C. and Y.Z.; writing—original draft preparation, P.C. and Y.Z.; writing—review and editing, S.J. and C.Z. All authors have read and agreed to the published version of the manuscript.
Funding
The work described was supported by the National Natural Science Foundation of China (51705068) and the fundamental research funds for the central universities (N170302001 and N180703009).
Conflicts of Interest
The authors declare no conflict of interest.
Appendix A
The kinematic equation of the melt flow in the direction can be expressed as follows:
where, is the density of the polymer melt, is the velocity vector of direction, is time, is the pressure, , and are stress tensors and is the gravitational acceleration vector of direction. According to the assumption mentioned above, , , , , and can be regarded as 0, thus Equation (A1) becomes
Integrating both sides of Equation (A2), the shear stress can be obtained by
Applying vertical vibration to the extrusion liquefier, the velocity variation inside the liquefier is
where, is the material wire feed speed, is the speed of applied vibration, , is the vibration amplitude, is the gravitational acceleration and is the angular frequency of vibration.
Substituting Equation (A4) into (A3), the internal shear stress of the melt in the channel is
Taking into account the material properties, the melt is regarded as Newtonian fluid and its flow behavior follows the power law [29], which is expressed by
where, is the apparent viscosity, is the consistency coefficient, is the power law index and is the shear rate.
According to Newton’s power law, the shear rate and shear stress have the following relationship:
Substituting Equation (A7) into (A6), the relationship between apparent viscosity and shear stress can be obtained by
Considering the influence of vibration field applied, the Tanner nonlinear constitutive equation modified from Maxwell linear constitutive equation is used to accurately reflect the time-varying and viscoelastic behavior of the melt [20]. The expression is
where, is the relaxation time of the polymer.
Based on Assumption 1 and 3, the pressure gradient can be expressed by
where, is the length of the fully developed flow region, is the pressure difference of two extremities of the fully developed flow region. Since Region I (shown in Figure 2) is the upper end of the liquefier, the material cannot completely melt into liquid and the melt does not fully flow here, thus the pressure gradient is corrected by Bagley correction method. The corrected pressure gradient is given by
where, is the revised factor of pressure gradient under the vibration field and is the pipe radius of Region I.
Substituting Equations (A5) and (A11) into Equation (A9) yields
The velocity gradient can be obtained by
According to Assumption 6, , substituting into Equation (A13), the velocity can be obtained by
The relationship between flow rate and velocity can be obtained by
Substituting Equation (A14) into (A15) and integrating Equation (A15), the flow expression can be obtained by
According to Equations (A4) and (A16), the velocity can be given by
Rearranging Equation (A17), the pressure drop can be obtained by
Although PLA melt is a pseudoplastic fluid, it can be considered as a Newtonian fluid at zero shear rate since the thermal effect can continuously regenerate the polymer chain [30]. As a Newtonian fluid, the relationship between viscosity and temperature can be expressed by the Arrhenius equation, which is shown below
where, is the activation energy, is the working temperature and is the reference temperature. Combining Equations (A18) and (A19), the final expression of the pressure drop becomes
The pressure drop for Region II can be derived by discretizing the tapered regions into differential cylindrical regions and summing the differential cylindrical regions. For Region III, its expression of pressure drop is similar with that of Region I. Therefore, and are given by the following equations:
Therefore, the total pressure drop inside the extrusion liquefier under vibration field is given by
References
- Griffiths, C.A.; Howarth, J.; De Almeida-Rowbotham, G.; Rees, A. A design of experiments approach to optimise tensile and notched bending properties of fused deposition modelling parts. Proc. Inst. Mech. Eng. Part B J. Eng. Manuf. 2016, 230, 1502–1512. [Google Scholar] [CrossRef]
- Rinaldi, M.; Ghidini, T.; Cecchini, F.; Brandao, A.; Nanni, F. Additive layer manufacturing of poly (ether ether ketone) via FDM. Compos. Part B Eng. 2018, 145, 162–172. [Google Scholar] [CrossRef]
- Cuan-Urquizo, E.; Barocio, E.; Tejada-Ortigoza, V.; Pipes, R.B.; Rodriguez, C.A.; Roman-Flores, A. Characterization of the mechanical properties of FFF structures and materials: A review on the experimental, computational and theoretical approaches. Materials 2019, 12, 895. [Google Scholar] [CrossRef]
- Popescu, D.; Zapciu, A.; Amza, C.; Baciu, F.; Marinescu, R. FDM process parameters influence over the mechanical properties of polymer specimens: A review. Polym. Test. 2018, 69, 157–166. [Google Scholar] [CrossRef]
- Wu, P.; Wang, J.; Wang, X. A critical review of the use of 3-D printing in the construction industry. Autom. Constr. 2016, 68, 21–31. [Google Scholar] [CrossRef]
- McIlroy, C.; Olmsted, P.D. Deformation of an amorphous polymer during the fused-filament-fabrication method for additive manufacturing. J. Rheol. 2017, 61, 379–397. [Google Scholar] [CrossRef]
- McIlroy, C.; Graham, R. Modelling flow-enhanced crystallisation during fused filament fabrication of semi-crystalline polymer melts. Addit. Manuf. 2018, 24, 323–340. [Google Scholar] [CrossRef]
- Liu, G.; Li, H. Extrusion of ultrahigh molecular weight polyethylene under ultrasonic vibration field. J. Appl. Polym. Sci. 2003, 89, 2628–2632. [Google Scholar] [CrossRef]
- D’Amico, A.; Peterson, A.M. An adaptable FEA simulation of material extrusion additive manufacturing heat transfer in 3D. Addit. Manuf. 2018, 21, 422–430. [Google Scholar] [CrossRef]
- Ramanath, H.S.; Chua, C.K.; Leong, K.F.; Shah, K.D. Melt flow behaviour of poly-epsilon-caprolactone in fused deposition modelling. J. Mater. Sci. Mater. Med. 2008, 19, 2541–2550. [Google Scholar] [CrossRef]
- Ramanath, H.; Chandrasekaran, M.; Chua, C.K.; Leong, K.F.; Shah, K.D. Modelling of extrusion behaviour of biopolymer and composites in fused deposition modelling. Key Eng. Mater. 2007, 334, 1241–1244. [Google Scholar] [CrossRef]
- Peng, F.; Vogt, B.D.; Cakmak, M. Complex flow and temperature history during melt extrusion in material extrusion additive manufacturing. Addit. Manuf. 2018, 22, 197–206. [Google Scholar] [CrossRef]
- Pandey, A.; Pradhan, S.K. Investigations into complete liquefier dynamics and optimization of process parameters for fused deposition modeling. Mater. Today Proc. 2018, 5, 12940–12955. [Google Scholar] [CrossRef]
- Stewart, S.R.; Wentz, J.E.; Allison, J.T. Experimental and computational fluid dynamic analysis of melt flow behavior in fused deposition modelling of poly (lactic) acid. In Proceedings of the ASME 2015 International Mechanical Engineering Congress and Exposition, American Society of Mechanical Engineers Digital Collection, Houston, TX, USA, 13–19 November 2016; Volume 2A. [Google Scholar]
- Zhang, X.; Chen, L.; Kowalski, C.; Mulholland, T.; Osswald, T.A. Nozzle flow behavior of aluminum/polycarbonate composites in the material extrusion printing process. J. Appl. Polym. Sci. 2019, 136, 47252. [Google Scholar] [CrossRef]
- Coogan, T.J.; Kazmer, D.O. In-line rheological monitoring of fused deposition modeling. J. Rheol. 2019, 63, 141–155. [Google Scholar] [CrossRef]
- Mackay, M.E. The importance of rheological behavior in the additive manufacturing technique material extrusion. J. Rheol. 2018, 62, 1549–1561. [Google Scholar] [CrossRef]
- Liu, Y. The formula for apparent viscosity of polymer melt extruding through a capillary under a superimposed vibration. Polym. Plast. Technol. Eng. 2005, 44, 1645–1656. [Google Scholar] [CrossRef]
- Liu, Y.; Li, X.; Huang, Y. Characterization theory and technique for polymer melt under the superimposed vibration. In Proceedings of the AIP Conference Proceedings, Monterey, CA, USA, 3–8 August 2008; American Institute of Physics, 2008; Volume 1027, pp. 1192–1194. [Google Scholar]
- Liu, Y.; Qu, J.; Cao, X. Mathematical model of shear rate of polymer melt dynamic extruding through capillary. J. Appl. Polym. Sci. 2005, 95, 1056–1061. [Google Scholar] [CrossRef]
- Ellenberger, J.; Krishna, R. Flow enhancement of shear-thinning liquids in capillaries subjected to longitudinal vibrations. Chem. Ing. Tech. 2017, 89, 1360–1366. [Google Scholar] [CrossRef]
- Jiang, S.; Siyajeu, Y.; Shi, Y.; Zhu, S.; Li, H. Improving the forming quality of fused filament fabrication parts by applied vibration. Rapid Prototyp. J. 2020, 26, 202–212. [Google Scholar] [CrossRef]
- Jiang, S.; Siyajeu, Y.; Shi, Y.; Sun, N.; Zhao, C. Experimental investigation on the effect of utilizing vibration on the dynamic property of FDM plates. J. Vib. Shock 2019, 38, 1–6. [Google Scholar]
- Schwach, E.; Averous, L. Starch-based biodegradable blends: Morphology and interface properties. Polym. Int. 2004, 53, 2115–2124. [Google Scholar] [CrossRef]
- Farah, S.; Anderson, D.G.; Langer, R. Physical and mechanical properties of PLA, and their functions in widespread applications—A comprehensive review. Adv. Drug Deliv. Rev. 2016, 107, 367–392. [Google Scholar] [CrossRef] [PubMed]
- Mohamed, O.A.; Masood, S.H.; Bhowmik, J.L.; Nikzad, M.; Azadmanjiri, J. Effect of process parameters on dynamic mechanical performance of FDM PC/ABS printed parts through design of experiment. J. Mater. Eng. Perform. 2016, 25, 2922–2935. [Google Scholar] [CrossRef]
- Yan, Z.; Shen, K.Z.; Zhang, J.; Chen, L.M.; Zhou, C. Effect of vibration on rheology of polymer melt. J. Appl. Polym. Sci. 2002, 85, 1587–1592. [Google Scholar] [CrossRef]
- He, G.J.; Yin, X.C.; Qu, J.P. The dynamic apparent viscosity of polymer melts during pulsatile extrusion flow with vibration force field: Theory and experiment. Int. Polym. Process. 2008, 23, 2–7. [Google Scholar] [CrossRef]
- Bellini, A.; Guceri, S.; Bertoldi, M. Liquefier dynamics in fused deposition. J. Manuf. Sci. Eng. Trans. ASME 2004, 126, 237–246. [Google Scholar] [CrossRef]
- Haleem, A.; Kumar, V.; Kumar, L. Mathematical modelling & pressure drop analysis of fused deposition modelling feed wire. Int. J. Eng. Technol. 2017, 9, 2885–2894. [Google Scholar]
© 2020 by the authors. Licensee MDPI, Basel, Switzerland. This article is an open access article distributed under the terms and conditions of the Creative Commons Attribution (CC BY) license (http://creativecommons.org/licenses/by/4.0/).