Abstract
Due to its versatility, virtual technology is being widely employed in different domains, from industry to amusement. The possibility to adopt this technology in early product/service design is going to bring positive effects such as the reduction of costs associated with the production of physical prototypes and the generation of a more effective knowledge of users’ feedback. This study proposes a preliminary methodology to evaluate users’ engagement in interacting with a virtual environment that consists of the integration between a self-report method (the user engagement scale questionnaire) and a method based on facial expression recognition. Results reported in this paper show that the two methodologies generate different types of knowledge which can be used to fit users’ needs and expectations. Even if focused on a specific case study, i.e., the evaluation of the engagement in a virtual learning environment, this paper aims to propose a methodology that can be applied to all kinds of virtual products.
1. Introduction
E-learning systems were introduced to facilitate and enhance the learning process [1,2,3]; a problem associated with their use is that the loss of face-to-face interaction makes it impossible to assess students’ attention and response. This way, it is not possible to adapt courses to students’ needs. Technologies enabling the monitoring and recognition of users’ emotions and sentiments can address this problem [4,5]. In this sense, the evaluation of students’ engagement is the starting point to develop effective virtual learning environments.
Fredricks et al. reported that there are three types of engagement in learning: (1) behavioral engagement; (2) cognitive engagement; and (3) emotional engagement [6]. Behavioral engagement corresponds to effort, persistence, attention, and participation; cognitive engagement refers to psychological investment of the learner, such as being committed to understanding work. Lastly, emotional engagement focuses on students’ feelings in learning processes such as being happy, sad, interested, bored, frustrated, or angry. The goal in increasing students’ engagement led researchers to study in-depth methods to measure it [7,8]. Notwithstanding the interest in developing methods to measure students’ engagement, there are not many studies concerning the measure of engagement in e-learning environments; in this sense, Lee et al. proposed a scale to measure engagement in this specific learning context [9]. Currently, the most popular tools for measuring engagement include (1) questioning methods; (2) physiological methods; and (3) observing methods. The first relies on questionnaires or self-reports in which students describe their own level of attention, engagement, distraction, excitement, or boredom [6,7]. Self-reports are undoubtably useful and widespread since they do not require the use of any instrument to perform the evaluation; on the other hand, they have well-known limitations [8]. For example, some students may feel embarrassed in admitting they are not engaged, voiding the result of the questionnaire. Moreover, self-reports may be biased by primacy and recency memory effects, or they may differ dramatically in their own sense of what it means to be engaged.
Concerning the physiological methods, engagement can be measured based on physiological and neurological sensor readings [8,10]. In neuroscience, engagement is typically equated with the level of arousal or alertness. In this sense, physiological measures such as EEG (electroencephalogram), blood pressure, heart rate, and galvanic skin response are used to evaluate engagement and alertness [11,12,13,14]. However, these measures require specialized sensors, and they are difficult to use in large scale studies.
A third kind of automatic engagement recognition involves computer vision systems offering the prospect of unobtrusively estimating the engagement of a student by analyzing cues from the face, body posture, and hand gestures [4,5,15,16]. A real-time students’ engagement recognition system would have a wide range of applications, such as the following:
- Human teachers in distance-learning environments could get real-time feedback on the level of engagement of their audience;
- Audience responses to educational videos could be used to automatically identify specific parts of the video causing disengagement, allowing the creator to change it adequately;
- Educational researchers could acquire large amounts of data to study the causes and the variables that affect students’ engagement; these data would have a high temporal resolution when compared to self-reports and questionnaires;
- Educational institutions could monitor students’ engagement and intervene.
In the domain of the automatic evaluation of users’ feedback, facial expression recognition (FER) is one of the possible methods. Interest in FER grew in the last few years; particularly, research is focusing on three-dimensional (3D) methods to refine the recognition accuracy and to widen the possibility of application [17]. Our FER approach and, in general, our face analysis approach, positions itself in the 3D methodologies, with particular attention paid to the development of methods facing the challenge in the presence of facial occlusions [18].
This paper proposes a methodology for evaluating a virtual environment aimed at learning. The proposed method consists of the integration between traditional methods of self-report and innovative methods of emotion recognition through face analysis.
The main contribution of this paper is to propose a preliminary methodology for the evaluation of the engagement felt by users interacting with a virtual learning environment; traditional self-report questionnaires and an automatic FER (facial expression recognition) system were used, and results coming from the two methods were compared and embedded to offer a more complete assessment of engagement. The proposed methodology, even if focused on the evaluation of a virtual environment finalized to learning, could fit the design of every type of product or service.
2. Materials and Methods
The case study analyzed in this paper concerns the evaluation of users’ engagement in interacting with a virtual learning environment developed during a European project for education purposes. An approach based on design science research (DSR) was followed taking inspiration from the one proposed by Schimanski et al [19]. Our DSR approach to the issue was as follows: (1) problem statement: self-reports are not sufficient in giving a complete evaluation of users’ feedback; (2) hypothesis: an FER methodology can make more thorough the users’ feedback analysis; (3) development: an SVM (support vector machine) method can classify the level of user engagement based on facial analysis; (4) evaluation: assessment of the proposed solution on a group of sample users during the navigation in a virtual learning environment. A scheme of the followed DSR approach is shown in Figure 1.
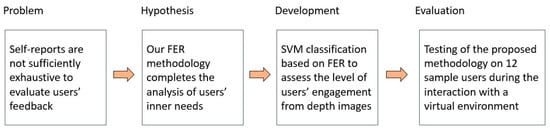
Figure 1.
Schematization of design science research (DSR) approach.
A sample of 12 participants (six males and six females) were asked to navigate the virtual learning environment; the participants (students, postdoctoral students, PhD students, and researchers) with an age from 20 to 30 years and without any payment for their participation, took part in our research. During the navigation, the participants were equipped with the Intel® RealSense™ SR300 structured-light depth camera; this way, learners’ body posture and facial expressions were monitored and recorded in real time in the form of depth maps (Figure 2). During the experience, two raters evaluated and annotated the emotional response of the user. Immediately after the virtual learning experience, the participants were asked to fill in the UES (user engagement scale) questionnaire [20]. The two raters analyzed the 3D videos and selected frames of interest according to their annotations during the users’ experience; this was necessary to construct the dataset for the automatic expression classification. The aim of involving facial expressions in the monitoring of emotional activation was to measure the involvement and the engagement of sample users interacting with the virtual environment with a real-time acquisition of facial expressions that are supposed to be spontaneous.
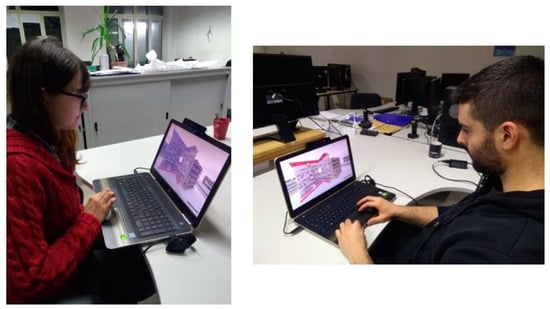
Figure 2.
Example of experimental set-up.
The virtual learning environment involved in this study was developed as a supporting tool for educational purposes within the context of the Erasmus+ project “EVA—A European Entrepreneurship VET Model and Assessment Framework for Ethnic Minorities”. The virtual environment was created using 360-degree computer-generated panorama images produced using a 3D computer graphics software toolset. Blender was applied because it is one of the best free and open-source alternatives currently available on the market. Thanks to its Cycles Render Engine which allows generating ray-tracing production-quality images, it was possible to obtain the best photorealism possible and enhance the immersivity and effectiveness of the images. Then, different high-quality, royalty-free 3D models, commonly available on the internet on repositories such as Google SketchUP Repository, were used to assemble the virtual environment. Then, we employed Google VR (virtual reality) view, which allows embedding 360-degree VR media into websites. It is based on WebGL technology, allowing our virtual environment to be effectively cross-platform.
Our virtual environment was a 3D simulator, hosted on a website, in which the user navigates multiple rooms in order to learn the required paths to become an entrepreneur. The 3D simulator is composed of five rooms projecting the learner in five different scenarios a starter entrepreneur could have to face: business creation, business starting, financial issues, marketing and communication, and networking. In Figure 3, it is possible to observe one of the five rooms, the scenario of business starting: a virtual shop under construction. All the examples in this room concern the starting of a business: choice of the location, creation of a budget, staff recruitment, determination and elaboration of the characteristics of the target consumers, risk analysis, and building of a pricing strategy.
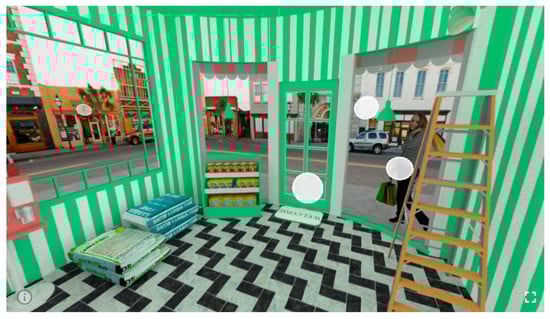
Figure 3.
Scenario of business starting.
Three classes of emotional activation were defined through the adoption of Russell’s model [21]: (1) deactivated; (2) averagely activated; and (3) activated. Class (1) gathered facial expressions labeled as bored, relaxed, and unresponsive. Class (2) gathered expressions recognized as happy, attentive, content, and perplexed. Class (3) collected facial images classified as surprised, astonished, and embarrassed. For this model, only the first and the fourth quadrants were considered. Figure 4 schematizes the emotions used to construct the three classes of activation according to the model proposed by Russell. These three classes were considered more significant for the case in analysis to cluster different levels of engagement.
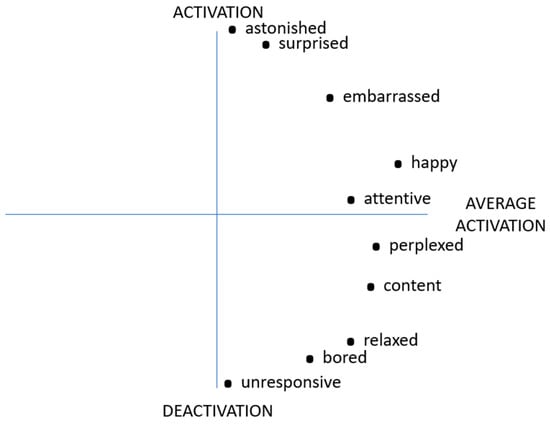
Figure 4.
Considered emotions inspired by Russell’s model.
Selected facial depth maps were post-processed to frame only the face of the subject; then, each depth map was imported into Matlab® (version: MatlabR2019b), and facial shells were obtained. Figure 5 shows an example of a facial depth map given in output by the sensor and an example of a facial shell obtained in Matlab®. Geometrical descriptors were computed on the facial shells, as they are discriminative features to perform facial analysis [22]. Previous articles assessed the reliability of facial analysis performed using the implementation of geometrical descriptors in a face recognition application [23] and the discriminative capability of these features with a neural network approach [24]. To classify the data in the three classes of engagement, an SVM (support vector machine) classification method implemented in python was used, relying on that proposed in a previous work by Violante et al. for defining the inner users’ requirements [25]. Since our purpose was to compare the result given by the classification based on facial analysis and the result shown by the questionnaire, values of Likert scale used in the UES were grouped into three classes. The class corresponding to “deactivated” was identified with a score ranging from 1–2, and the class corresponding to “averagely activated” was identified with a score ranging from 3–5, while the class corresponding to “activated” was located in a range from 6–7. This means that, e.g., a score of five corresponds to an average level of emotional activation felt by the user, according to the chosen model. These three classes corresponded to different levels of engagement felt by the user while interacting with the learning environment EVA; specifically, the class labeled as “activated” corresponded to the highest level of engagement reached by the sample users, the class labeled as “averagely activated” fit a medium level of engagement, and finally the class named “deactivated” collected expressions mirroring a low level of engagement of the users in the virtual environment.
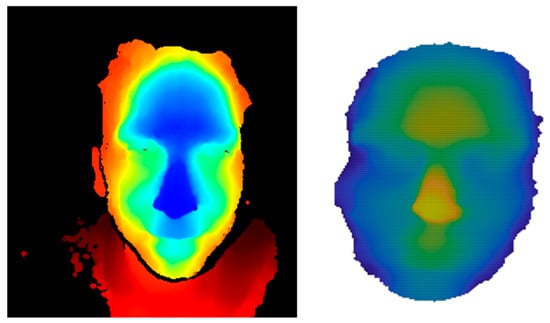
Figure 5.
Depth map as output of the structured-light sensor (left) and shell (right).
To assess the level of engagement of every participant, two parallel evaluations were performed. For each participant, occurrences of images classified with the SVM in the three classes were counted; the class with the highest number of occurrences was stated to be the most representative of the emotional activation of the subject during the virtual learning experience. Separately, a second operator computed mean scores and medians of answers to the UES questionnaire for each sample user and defined their level of engagement based on the aforementioned subdivision of scores. Lastly, the outcome of the two processes of evaluation were compared. The complete methodology is schematized in Figure 6.
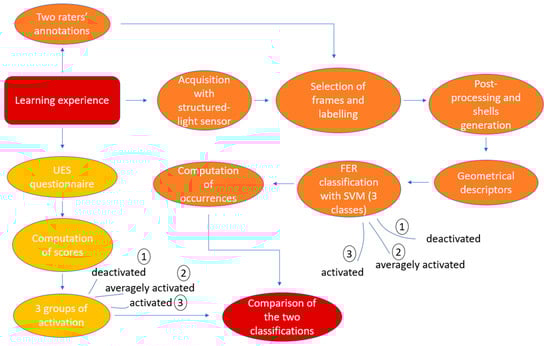
Figure 6.
Schematization of the proposed methodology. The two parallel methods of evaluation of engagement are highlighted with different colors: orange (facial analysis and support vector machine (SVM) classification) and yellow (self-report evaluation). The red blocks represent the starting point of our evaluation (the learning experience) and the focus of our work (the comparison of the two classifications, i.e., the comparison of the results coming to light from the questionnaires and from the facial expression recognition (FER) methodology).
3. Results
After collection, data were analyzed to make a comparison between the level of engagement felt by the users while interacting with the EVA virtual learning environment emerging from the questionnaire method and from the automatic classification of emotions in classes of emotional activation.
3.1. Reliability of Data from Questionnaires
To assess the reliability of data involved in the study, Cronbach’s alpha was computed on sub-scales [26]. According to O’Brien and Toms, sub-scales are defined based on six factors (aesthetics (AE), focused attention (FA), felt involvement (FI), perceived usability (PU), novelty (NO), and endurability (EN)) with which the questionnaire’s items are associated [20]. To perform data analysis, eight items were reverse-coded [27]. Means and standard deviations were computed on sub-scales; means ranged from 3.767 to 5.250 and standard deviations ranged from 0.437 to 0.952 (Table 1). Thus, the data showed some variability but few responses toward the extremes of the scale. Cronbach’s alphas for five (aesthetics, felt involvement, perceived usability, novelty, and endurability) of the six factors were considered acceptable since their values were above 0.7 (values ranging from 0.7 to 0.9 are considered optimal [28]).

Table 1.
Sub-scales, items, and sub-scale means and standard deviation of user engagement scale (UES).
3.2. Questionnaire Analysis
Table 2 shows the results of UES sub-scales for each of the 12 sample users. Results reported in Table 3 indicate that the platform had an acceptable level of engagement with 62.51%. In the breakdown of the scale, it can be found that the sub-scale with the highest percentage of responses was NO (75.00%), which means that a higher users’ level of interest in the platform and curiosity was evoked by the system and its contents. On the other hand, the sub-scale with the lowest percentage value was FA, with 55.24%, suggesting that perhaps the setting of the simulator is slightly dispersive; thus, the participants would possibly recommend the platform with a likelihood of returning to use the EVA learning environment.
Table 2.
UES questionnaire results. Abbreviations for sub-scales are used: AE = aesthetics, FA = focused attention, FI = felt involvement, PU = perceived usability, NO = novelty, EN = endurability.
Table 3.
UES sub-scales (percentage).
The UES sub-scales were all positively correlated (Table 4); the correlation of the aesthetics sub-scale with focused attention, felt involvement, perceived usability, and novelty sub-scales was moderate. According to the correlation guide suggested by Evans [29], in which correlation values ranging from 0.00 to 0.19 indicate a “very weak” correlation, values ranging from 0.20 to 0.39 indicate a “weak” correlation, values between 0.40 and 0.59 are considered as “moderate” correlations, values between 0.60 and 0.79 are considered “strong” correlations, and values that range from 0.80 to 1.0 are considered as “very strong” correlations, there is a very weak correlation between FI and PU (0.16) and between FI and EN (0.32) sub-scale elements, and there is a weak correlation between AE and FI (0.26), AE and NO (0.37), FA and PU (0.27), FA and NO (0.24), and PU and NO (0.24) sub-scale elements. Moderate correlation results can be found between AE and FA (0.57), FI and NO (0.49), and NO and EN (0.56) elements, while a strong correlation exists between AE and PU (0.79), FA and FI (0.69), FA and EN (0.63), and PU and EN (0.70) elements. Lastly, a very strong correlation exists between AE and EN (0.92).
Table 4.
Correlation among the six factors. Very weak correlations are highlighted in black, weak correlations in yellow, moderate correlations in blue, strong correlations in green, and very strong correlations in red.
From these results, in particular focusing on strong correlations, it is visible how the aesthetics sub-scale is correlated with the other sub-scale elements; thus, the feedback on the visual appeal may be considered the first aspect to take into account when developing virtual products or services, particularly in the learning domain. The correlation between focused attention and felt involvement and between focused attention and endurability shows that the phase of design of a virtual service must consider the necessity for the user to be engaged in the tasks not only because of the final aim, e.g., the learning process for becoming an entrepreneur, but also because of the elements accompanying the environment and making the user, in this case the learner, appreciate the product (visual appeal, intuitiveness, usability, sense of curiosity).
To compare the level of engagement emerging from the questionnaires and the level of activation defined through the SVM expression classification, median values of the scores assigned by each participant to the UES items on the seven-point Likert scale were calculated.
3.3. SVM Classification
As mentioned before, three classes of emotional activation were defined basing on the two raters’ annotations: (1) deactivated; (2) averagely activated; and (3) activated. To evaluate the level of engagement, the state of emotional activation was assigned to each subject relying on the class with the most occurrences for that subject. Table 5 reports the numerousness of the classes for each participant. The class with the highest numerousness was “averagely activated” for 10 of the 12 participants; for one participant, the class with highest number of elements was “activated”, while, for one participant, the number of elements in class “averagely activated” was equal to that of class “deactivated”. None of the participants was classified as “deactivated”.
Table 5.
Numerousness of the three classes for each sample user. The class with the highest number of elements is underlined. As can be seen, the most populous class was “averagely activated” for most of the participants.
3.4. Comparison of Questionnaires and SVM Classification
A similar classification to the one reported in the subsection below was performed concerning the resulting scores of the UES questionnaires (Table 6). Points assigned to each item were divided into three groups, corresponding to the three classes of activation used for the SVM FER-based classification: (1) group “deactivated” ranged from 1–2; (2) group “averagely activated” ranged from 3–5; and (3) group “activated” ranged from 6–7. Based on this grouping, a classification of the level of engagement was performed on the median of the score for each participant. For eight of the 12 subjects, the class of activation was “averagely activated”; for two subjects, the class of activation was “deactivated”, and, for the remaining two participants, the resulting class was “activated”.
Table 6.
Median computed on UES questionnaire scores and respective groups of engagement classification. Elements of the table highlighted by a box correspond to the participants for whom the UES method and the FER method gave the same response.
From the comparison of the outcomes of the two classifications (Table 6), it can be seen that, for six participants (the sample users numbered as 1, 3, 5, 6, 8, and 9), the two methods were in agreement with each other. On the basis of the answers given to the questionnaire, user number 2 and user number 12 resulted with the highest level of engagement (Table 6), while, for the expression classification, their level of activation was average (Table 5). For user number 7, the level of engagement expressed through the questionnaire was the lowest (Table 6), but the most of their images were classified as averagely activated (Table 5). User number 10 was classified by the SVM as activated (Table 5), while, from the questionnaire, an average level of engagement was determined (Table 6); user 11 gave negative feedback to the UES items (Table 6), while the facial expression classification denoted the class “averagely activated” (Table 5).
4. Discussion
The involvement of users is a crucial matter at each stage of the product development cycle, as it influences their contributions in an aggregate way and, thus, maximizes their effects [30]. Notably, it is recommended to involve users in the initial design stage, as it is a critical phase of the design process [31,32]; increased access to and understanding of the users’ needs, experiences, and expectations offers a deepening in the functionality, usability, and quality of future new products. Moreover, engaging users at various stages across all the phases of product development cycle (from ideation and development to launch) would allow industries to interpret users’ needs efficaciously and to obtain solution-related knowledge [33,34,35].
As stated by Su et al., the user knowledge is crucial in the process of developing innovative products and in designing customized services, and virtual technologies can be the means to share such knowledge [36]. Through the successful implementation of digital technologies in the product design phase, user interaction, personalization, and product visualization are made possible, paving the way for meeting the dynamic needs of the user during product development [37].
According to Sanders and Stappers [31], design tools should simplify the communication between designers and final users in a “co-design approach”, and this synergic collaboration between designers and users’ favors user-centered design approaches to active co-design. From this view point, virtual reality is an interesting option, allowing the production of representations of the concept and the collection of data on ergonomics, usability, user acceptance, body metrics, and users’ feeling [38,39]. VR is being widely employed in different domains of manufacturing such as design, prototyping, assembly, and maintenance [40] since it addresses all the requirements in each product development stage thanks to its capability of solving engineering design concerns of the manufacturer, logistical concerns of the maintainer, and training and programmatic concerns of the operator [41]. The involvement of potential users in both generation and development stages of an NPD (new product development) project might offer to producers the possibility of understanding and interpreting what users actually shared in the ideation stage, and to precisely apply the user knowledge to the design of the new product in the development stage, leading to a synergistic effect. In this context, the evaluation of the level of agreeableness felt by potential users of a product/service seems to be a crucial point in the success of a new product. Virtual technologies offer a valid approach to the initial phases of the product development cycle, in particular in the design stage. A virtual prototype would allow tailoring the new product/service to the customer based on a direct feedback from sample users; this way, it would be possible to correct and rethink the product, avoiding the costs of production of different physical prototypes. In addition to product development, virtual reality and virtual environments can be involved in the development of services targeted at the final users. A crucial matter of this approach to product development is the evaluation of the feedback given by sample users; a summary quantification of user satisfaction and involvement with the product would hinder the advantages given by the introduction of such technologies. In particular, due to the goal of the EVA project, the study focused on the evaluation of the users’ engagement in interacting with virtual environments.
The preliminary approach proposed here allows integrating two different types of information; one relies on traditional methods of a self-report questionnaire, while the other is based on face analysis techniques. From the analysis of the score of the questionnaires of the 12 participants involved, it resulted that the majority (eight of the 12 participants) were averagely engaged in the learning task, since the median of their scores was between three and five. Among the remaining participants, two resulted in the highest class of engagement, “activated”, while the others resulted in the class “deactivated”, denoting a low level of engagement. The classification of expressions performed with the SVM on facial features gave a slightly different result. As for the UES questionnaire, the majority of participants were classified as averagely engaged (10 of 12 participants), while one subject (user number 10) was classified as engaged; a border case resulted for user number 4, since the number of images classified as “deactivated” was equal to the number of images classified as “averagely activated”.
The comparison of the two methods shows that, for six of the 12 sample users, the UES questionnaire and the facial analysis determined the same findings, i.e., the EVA learning environment received positive feedback with an average level of engagement (user numbers 1, 3, 5, 6, 8, and 9). For the remaining participants, discrepancies were found. Concerning user 2 and user 12, the median values were respectively seven and six, corresponding to a high level of engagement; from the facial analysis of their images, they had an average level of engagement. On the other hand, user 7 and user 11 declared a low level of engagement in the virtual environment (their median values were two and one, respectively), while, from the facial analysis, their level of activation was classified as average, indicating that their real feedback on the EVA simulator was perhaps less negative than they claimed. The UES questionnaire for user 4 assessed a good level of engagement (class “averagely activated”), but the SVM classification resulted that the number of images classified as “averagely activated” was equal to the number of images classified as “deactivated”. This could indicate that the real level of engagement felt by this subject was lower than they declared. Lastly, user 10 claimed a good level of engagement in the UES questionnaire (their score resulted in class “averagely activated”), but the majority of their facial expressions were classified as “activated”; this could suggest that a more reasoned assessment led this user to express a lower level of agreement than that shown spontaneously through facial expressions.
This outcome can be interpreted as evidence of the advantages given by the integration between traditional and innovative methods for evaluations of engagement. Both self-reports and FER give useful knowledge for the design of a successful product, but the type of information comes from different areas of perception; the first gives the user the time to ponder their own feedback, while the second is originated by a spontaneous real-time reaction.
5. Conclusions
Virtual environments and virtual reality are being widely used in different domains of manufacturing, and their adoption is also going to bring benefits in the first phases of the product development cycle. As VR seems to be useful for the development of physical products, virtual environments show their usefulness in the design of services. In this study, the attention was focused on a service for learning via virtual environment.
This study was aimed at providing a more realistic method for the evaluation of the engagement felt by potential users of a virtual product or service, through the integration of traditional methods of self-reporting and an FER approach based on facial analysis. The results that were presented here showed that the information coming from the two approaches partially overlapped but, in some cases, they led to different conclusions on the level of engagement of sample users. Even if the proposed methodology is still preliminary, the analysis of facial expressions is potentially a tool for having more spontaneous feedback from users, which might be not so objective while answering the questionnaires. In particular, it seems to be a useful tool when the sample of potential users is not so numerous to guarantee an objective evaluation only through self-reports. The synergic adoption of both traditional and innovative engagement evaluation methods seems to provide a more complete evaluation of engagement and, in general, of the feedback from sample users, which can be used to develop the best possible product.
Author Contributions
Conceptualization, M.G.V. and E.V.; methodology, M.G.V. and E.C.O.; software, E.C.O.; validation, E.C.O. and F.M.; formal analysis, M.G.V.; investigation, M.G.V.; resources, M.G.V.; data curation, E.C.O. and M.G.V.; writing—original draft preparation, E.C.O., M.G.V., and F.M.; writing—review and editing, E.V. and B.E.; visualization, E.C.O.; supervision, B.E. and E.V.; project administration, E.V. and B.E.; funding acquisition, E.V. and M.G.V. All authors have read and agreed to the published version of the manuscript.
Funding
This research received no external funding.
Acknowledgments
The authors wish to thank the Erasmus+ program (project 2016-1-DK01-KA202-022320).
Conflicts of Interest
The authors declare no conflicts of interest.
References
- Violante, M.G.; Vezzetti, E. Implementing a new approach for the design of an e-learning platform in engineering education. Comput. Appl. Eng. Educ. 2014, 22, 708–727. [Google Scholar] [CrossRef]
- Violante, M.G.; Vezzetti, E. Virtual interactive e-learning application: An evaluation of the student satisfaction. Comput. Appl. Eng. Educ. 2015, 23, 72–91. [Google Scholar] [CrossRef]
- Violante, M.G.; Vezzetti, E. Design and implementation of 3D Web-based interactive medical devices for educational purposes. Int. J. Interact. Des. Manuf. IJIDeM 2017, 11, 31–44. [Google Scholar] [CrossRef]
- Useche, O.; El-Sheikh, E. An Intelligent System Framework for Measuring Attention Levels of Students in Online Course Environments. In Proceedings of the International Conference on Artificial Intelligence (ICAI), Las Vegas, NV, USA, 27–30 July 2015; p. 452. [Google Scholar]
- van der Haar, D.T. Student Emotion Recognition in Computer Science Education: A Blessing or Curse? In Proceedings of the International Conference on Human-Computer Interaction, Paphos, Cyprus, 2–6 September 2019; pp. 301–311. [Google Scholar]
- Fredricks, J.A.; Blumenfeld, P.; Friedel, J.; Paris, A. School Engagement. In What Do Children Need to Flourish? Conceptualizing and Measuring Indicators of Positive Development; Moore, K.A., Lippman, L.H., Eds.; Springer: Boston, MA, USA, 2005; pp. 305–321. [Google Scholar]
- Parsons, S.A.; Nuland, L.R.; Parsons, A.W. The ABCs of student engagement. Phi Delta Kappan 2014, 95, 23–27. [Google Scholar] [CrossRef]
- Boekaerts, M. Engagement as an inherent aspect of the learning process. Learn. Instr. 2016, 43, 76–83. [Google Scholar] [CrossRef]
- Lee, J.; Song, H.-D.; Hong, A.J. Exploring factors, and indicators for measuring students’ sustainable engagement in e-learning. Sustainability 2019, 11, 985. [Google Scholar] [CrossRef]
- Parsons, J.; Taylor, L. Improving student engagement. Curr. Issues Educ. 2011, 14, 745. [Google Scholar]
- Berka, C.; Levendowski, D.J.; Lumicao, M.N.; Yau, A.; Davis, G.; Zivkovic, V.T.; Olmstead, R.E.; Tremoulet, P.D.; Craven, P.L. EEG correlates of task engagement and mental workload in vigilance, learning, and memory tasks. Aviat. Space Environ. Med. 2007, 78, 231–244. [Google Scholar]
- Sparacino, J.; Ronchi, D.; Brenner, M.; Kuhn, J.W.; Flesch, A.L. Psychological correlates of blood pressure: A closer examination of hostility, anxiety, and engagement. Nurs. Res. 1982. [Google Scholar] [CrossRef]
- Chanel, G.; Rebetez, C.; Bétrancourt, M.; Pun, T. Boredom, engagement and anxiety as indicators for adaptation to difficulty in games. In Proceedings of the 12th International Conference on Entertainment and Media in the Ubiquitous Era, Tampere, Finland, 7–9 October 2008; pp. 13–17. [Google Scholar]
- Latulipe, C.; Carroll, E.A.; Lottridge, D. Love, hate, arousal and engagement: Exploring audience responses to performing arts. In Proceedings of the SIGCHI Conference on Human Factors in Computing Systems, Vancouver, BC, Canada, 7–12 May 2011; pp. 1845–1854. [Google Scholar]
- Duraisamy, P.; Van Haneghan, J.; Blackwell, W.; Jackson, S.C.; Murugesan, G.; Tamilselvan, K.S. Classroom engagement evaluation using computer vision techniques. In Pattern Recognition and Tracking XXX, Proceedings of the International Society for Optics and Photonics, Baltimore, MD, USA, 15–16 April 2019; SPIE: Bellingham, WA, USA, 2019; Volume 10995, p. 109950R. [Google Scholar]
- Deniz, S.; Lee, D.; Kurian, G.; Altamirano, L.; Yee, D.; Ferra, M.; Hament, B.; Zhan, J.; Gewali, L.; Oh, P. Computer Vision for Attendance and Emotion Analysis in School Settings. In Proceedings of the 2019 IEEE 9th Annual Computing and Communication Workshop and Conference (CCWC), Las Vegas, NV, USA, 7–9 January 2019; pp. 134–139. [Google Scholar]
- Nonis, F.; Dagnes, N.; Marcolin, F.; Vezzetti, E. 3D Approaches and Challenges in Facial Expression Recognition Algorithms—A Literature Review. Appl. Sci. 2019, 9, 3904. [Google Scholar] [CrossRef]
- Dagnes, N.; Marcolin, F.; Nonis, F.; Tornincasa, S.; Vezzetti, E. 3D geometry-based face recognition in presence of eye and mouth occlusions. Int. J. Interact. Des. Manuf. IJIDeM 2019, 13, 1–19. [Google Scholar] [CrossRef]
- Schimanski, C.P.; Pasetti Monizza, G.; Marcher, C.; Matt, D.T. Pushing digital automation of configure-to-order services in small and medium enterprises of the construction equipment industry: A design science research approach. Appl. Sci. 2019, 9, 3780. [Google Scholar] [CrossRef]
- O’Brien, H.L.; Toms, E.G. The development and evaluation of a survey to measure user engagement. J. Am. Soc. Inf. Sci. Technol. 2010, 61, 50–69. [Google Scholar] [CrossRef]
- Russell, J.A. A circumplex model of affect. J. Pers. Soc. Psychol. 1980, 39, 1161. [Google Scholar] [CrossRef]
- Marcolin, F.; Vezzetti, E. Novel descriptors for geometrical 3D face analysis. Multimed. Tools Appl. 2017, 76, 13805–13834. [Google Scholar] [CrossRef]
- Olivetti, E.C.; Ferretti, J.; Cirrincione, G.; Nonis, F.; Tornincasa, S.; Marcolin, F. Deep CNN for 3D Face Recognition. In Proceedings of the International Conference on Design, Simulation, Manufacturing: The Innovation Exchange, Volyn Oblast, Ukraine, 11–14 June 2019; pp. 665–674. [Google Scholar]
- Ciravegna, G.; Cirrincione, G.; Marcolin, F.; Barbiero, P.; Dagnes, N.; Piccolo, E. Assessing discriminating capability of geometrical descriptors for 3D face recognition by using the GH-EXIN neural network. In Neural Approaches to Dynamics of Signal Exchanges; Springer: Berlin/Heidelberg, Germany, 2020; pp. 223–233. [Google Scholar]
- Violante, M.G.; Marcolin, F.; Vezzetti, E.; Ulrich, L.; Billia, G.; Di Grazia, L. 3D Facial Expression Recognition for Defining Users’ Inner Requirements—An Emotional Design Case Study. Appl. Sci. 2019, 9, 2218. [Google Scholar] [CrossRef]
- Cronbach, L.J. Coefficient alpha and the internal structure of tests. Psychometrika 1951, 16, 297–334. [Google Scholar] [CrossRef]
- O’brien, H.L.; Toms, E.G. Examining the generalizability of the User Engagement Scale (UES) in exploratory search. Inf. Process. Manag. 2013, 49, 1092–1107. [Google Scholar] [CrossRef]
- DeVellis, R.F. Factor analysis. Scale development, theory and applications. Appl. Soc. Res. Method Ser. 2003, 26, 10–137. [Google Scholar]
- Evans, J.D. Straightforward Statistics for the Behavioral Sciences; Thomson Brooks/Cole Publishing Co.: Belmont, CA, USA, 1996. [Google Scholar]
- Shah, S.G.S.; Robinson, I. Benefits of and barriers to involving users in medical device technology development and evaluation. Int. J. Technol. Assess. Health Care 2007, 23, 131–137. [Google Scholar] [CrossRef]
- Sanders, E.B.-N.; Stappers, P.J. Co-creation and the new landscapes of design. CoDesign 2008, 4, 5–18. [Google Scholar] [CrossRef]
- Wang, L.; Shen, W.; Xie, H.; Neelamkavil, J.; Pardasani, A. Collaborative conceptual design—State of the art and future trends. Comput. Aided Des. 2002, 34, 981–996. [Google Scholar] [CrossRef]
- Fang, E. Customer Participation and the Trade-Off between New Product Innovativeness and Speed to Market. J. Mark. 2008, 72, 90–104. [Google Scholar] [CrossRef]
- Gruner, K.E.; Homburg, C. Does Customer Interaction Enhance New Product Success? J. Bus. Res. 2000, 49, 1–14. [Google Scholar] [CrossRef]
- Hoyer, W.D.; Chandy, R.; Dorotic, M.; Krafft, M.; Singh, S.S. Consumer Cocreation in New Product Development. J. Serv. Res. 2010, 13, 283–296. [Google Scholar] [CrossRef]
- Su, C.-T.; Chen, Y.-H.; Sha, D.Y. Linking innovative product development with customer knowledge: A data-mining approach. Technovation 2006, 26, 784–795. [Google Scholar] [CrossRef]
- Apeagyei, P.R. Application of 3D body scanning technology to human measurement for clothing fit. Int. J. Digit. Content Technol. Appl. 2010, 4, 58–68. [Google Scholar]
- Nagamachi, M. Kansei Engineering, 2 Volume Set; CRC Press: Boca Raton, FL, USA, 2010. [Google Scholar]
- Schütte, S.T.W.; Eklund, J.; Axelsson, J.R.C.; Nagamachi, M. Concepts, methods and tools in Kansei engineering. Theor. Issues Ergon. Sci. 2004, 5, 214–231. [Google Scholar] [CrossRef]
- Ong, S.K.; Nee, A.Y.C. Virtual and Augmented Reality Applications in Manufacturing; Springer Science & Business Media: Berlin, Germany, 2013. [Google Scholar]
- Violante, M.G.; Marcolin, F.; Vezzetti, E.; Nonis, F.; Moos, S. Emotional Design and Virtual Reality in Product Lifecycle Management (PLM). In Proceedings of the International Conference on Sustainable Design and Manufacturing, Budapest, Hungary, 4–5 July 2019; pp. 177–187. [Google Scholar]
© 2019 by the authors. Licensee MDPI, Basel, Switzerland. This article is an open access article distributed under the terms and conditions of the Creative Commons Attribution (CC BY) license (http://creativecommons.org/licenses/by/4.0/).