Abstract
The growing demand for transparency in sustainability reporting has compelled enterprises to look far beyond the boundaries of classical financial ratios when assessing their own performance. Environmental, social, and governance (ESG) indicators have dominated recent academic debate—primarily because of mounting regulatory and societal pressure. By contrast, the significance of other non-financial performance indicators (NFPIs), such as operational efficiency, quality management, and employee turnover, has been insufficiently explored, despite their importance for long-term competitiveness. Existing research is fragmented and provides limited integrative insights, which creates a clear gap regarding how ESG and non-ESG indicators collectively influence organisational performance. To address this gap, this study synthesises the NFPI landscape through (1) a combined bibliometric and systematic literature review, (2) detailed manual content analysis used to construct a theoretical framework integrating ESG and non-ESG indicators, and (3) expert validation to recommend a concise set of NFPIs for the manufacturing sector. Findings indicate that experts prioritise sustainability-related indicators, even when presented with a broader NFPI framework. This highlights a practical misalignment between theoretical expectations and industry focus. The study contributes a validated NFPI set and an integrative framework that aids more informed managerial decisions.
1. Introduction
Rapid changes in the business-performance environment in recent years have meant that traditional methods and measures of company performance do not reflect the increasing need for additional information. First, the major shift in necessary information is related to the increasing regulation, requirements, and societal demands for information on environmental, social, and governance (ESG) and sustainability practices. Key initiatives driving the growing regulation of ESG practices include the EU Corporate Sustainability Reporting Directive (CSRD) (European Parliament and Council of the European Union, 2022), alongside influential global reporting frameworks such as the Global Reporting Initiative (GRI) (Global Reporting Initiative, 2021) and the Sustainability Accounting Standards Board (SASB) (Sustainability Accounting Standards Board, 2022), and were introduced to enhance transparency, ensure comparability, and align corporate reporting with stakeholders’ expectations. These developments have necessitated that companies transform their information systems to collect and report non-financial performance indicators (NFPIs). In addition, non-ESG NFPIs are crucial in manufacturing because they capture operational and organisational performance drivers—such as quality, delivery reliability, process efficiency, innovation and employee productivity—that are not visible in financial statements or ESG disclosures but act as leading indicators of future outcomes and support continuous improvement. Evidence from performance measurement and Balanced Scorecard research shows that such non-financial indicators in the customer, internal-process and learning-and-growth domains are positively associated with financial performance and need to be tailored to sector-specific technologies and processes rather than relying solely on generic ESG metrics (Kumar et al., 2024; Molenda et al., 2023; Serbinenko & Ludviga, 2025; Yawson & Paros, 2023).
Research on non-financial performance indicators is fragmented across various themes, including disclosure practices, governance characteristics, and sector-specific sustainability studies. In this Introduction, we only summarise the main directions of this research, while a more detailed, method-based synthesis is provided in the following literature and framework sections.
Although prior studies focus on individual non-financial indicators or ESG dimensions, the existing literature lacks a comprehensive, theoretically grounded, and expert-validated framework that encompasses the full range of non-financial performance indicators relevant to manufacturing firms. To close this gap, we utilise an integrated methodological approach that combines bibliometric, systematic, and manual analyses to map and refine the NFPI landscape. This is followed by expert validation to ensure the proposed framework’s practical relevance and applicability. Unlike previous studies, this research presents a unified NFPI framework that combines ESG and non-ESG indicators into a single, empirically grounded structure. The study aims to develop a system of Non-Financial Performance Indicators (NFPIs) by constructing a theoretical framework through a comprehensive analysis of the literature and validating it through expert interviews. To achieve this, the research employs a two-stage methodology. In the first stage, the literature analysis employs a combination of bibliometric and systematic approaches. The bibliometric analysis utilises the Web of Science database, VOSviewer (version 1.6.19) to identify key themes and relationships and Bibliometrix (version 4.0) to estimate a broader set of indicators. This is followed by a systematic analysis that refines the initial set of papers through screening and manual analysis to ensure their relevance and rigour. In the second stage, semi-structured interviews are conducted with domain experts to validate the proposed framework. These interviews provide practical insights and confirm the framework’s applicability.
This research is significant from both scientific and practical perspectives. From a scientific standpoint, it contributes to the development of a structured framework for non-financial performance indicators (NFPIs). This framework addresses gaps in the existing literature and incorporates environmental, social, and governance (ESG) dimensions into performance measurement. Practically, the proposed system aids public managers, entrepreneurs, and policymakers by providing tools to enhance transparency, align organisational strategies with sustainability goals, and comply with evolving regulatory requirements. For businesses, it enhances decision-making and communication with stakeholders; for policymakers, it provides insights to inform the creation of evidence-based regulations and reporting standards.
The paper proceeds as follows. Section 2 provides a concise literature overview of NFPIs and performance measurement. Section 3 presents the mixed-methods methodology, including the bibliometric and systematic literature analysis, as well as the design of the expert interviews. Section 4 develops the theoretical NFPI framework, grounded in the existing literature. Section 5 presents the empirical results of the expert validation and introduces the NFPI set, which is tailored for manufacturing companies. Section 6 and Section 7 discuss the findings, outline their implications, and present conclusions and directions for further research.
2. Overview of NFPI Literature
2.1. Research on Non-Financial Performance Indicators (NFPIs)
Analysis of NFPIs is within the purview of scholars, although various studies have focused on different aspects of the topic. Most researchers have investigated the disclosure of non-financial performance information and indicators, the need for a unified or specific NFPI system for different sectors or categories of companies (Zarzycka & Krasodomska, 2022; Hálek et al., 2020; Raucci & Tarquinio, 2020; Krasodomska & Zarzycka, 2021; Castilla-Polo et al., 2020; Melović et al., 2021), the quality of non-financial information and its impact on decision-making, financial performance (Paula Monteiro et al., 2022), or bankruptcy (Sánchez-Alegría et al., 2022), the impact of sustainability disclosures on financial performance (Alodat et al., 2024; Gutiérrez-Ponce et al., 2022), and the reverse effect of liquidity and capital structure on financial sustainability (Wu et al., 2023), regulation, requirements, and the quality of non-financial reporting in management reports (Petryk et al., 2021), and integrated reporting (Richard & Odendaal, 2021). There is some theoretical research on non-financial disclosures (Saini et al., 2022) and a framework for business sustainability performance (Arianpoor & Salehi, 2020). This body of work highlights the diversity of NFPI-related research, showcasing both disclosure-based and performance-oriented perspectives.
2.2. Governance, Strategic, and Organisational Dimensions
Some studies have investigated only limited aspects of non-financial indicators. Gong and Girma (2021) researched the impact of top management gender diversity on financial performance, and Guizani and Abdalkrim (2023) examined the impact of the gender diversity of boards on a firm experiencing financial distress. Others have investigated the impact of board attributes on sustainability performance (Disli et al., 2022), the impact of corporate governance mechanisms on financial and non-financial aspects of firm performance in medium and large-scale manufacturing firms (Erena et al., 2022), and negative reporting tone as an indicator of future performance (Bassyouny & Machokoto, 2024). Juliana et al. (2021) investigated the alignment of business strategy, organisational configurations, and management accounting systems with performance, and Al-Mawali (2023) proposed a model identifying the cause-and-effect relationships between the five aspects of the sustainability balanced scorecard. The connection between corporate social responsibility and companies’ credit ratings was assessed by Ben Saad et al. (2024), and Mishchuk et al. (2022) determined the aspects of enterprise social capital that can have a significant impact on achieving sustainable competitiveness. These contributions collectively illustrate the diverse governance, strategic, and organisational factors that are part of the broader NFPI domain.
2.3. ESG, Sustainability Reporting, and Corporate Outcomes
A range of recent studies have analysed the reporting of listed companies on non-financial or sustainability information (Salehi & Arianpoor, 2021; Beleneși et al., 2021; Lombardi et al., 2022; Calvo-Centeno et al., 2022), the change in the quality of non-financial disclosures after regulatory enforcement (Traxler et al., 2023), and the impact of ESG and other non-financial performance indicators on financial performance (Loprevite et al., 2020; Noja et al., 2024; Ghosh et al., 2024; Özer et al., 2023; Hamad & Cek, 2023; Danisch, 2021; Prayanthi & Budiarso, 2022). Others have considered the impact of non-financial sustainability reporting (NFSR) on corporate reputation and the role of the CEO (Zimon et al., 2022). Xu and Zhao (2024) constructed an ESG model evaluation framework for energy enterprises, Chi and Chu (2021) established a going-concern prediction model using efficient deep learning algorithms for the evaluation of corporate sustainability, and Gadhoum et al. (2022) assessed ethical disclosures by Islamic banks. These studies highlight the increasing significance of ESG-related information for evaluating organisational performance, risk management, and long-term sustainability.
2.4. Fragmentation of NFPI Research and the Need for Integrated Frameworks
Overall, in analysing different aspects of non-financial performance indicators, scholars have emphasised the need for a unified system of NFPI or even several frameworks that reflect the specific contexts of different sectors and countries. Despite existing recognition in the field, current contributions are still fragmented. They vary across disclosure studies, governance analyses, sector-specific examinations, and assessments focused on ESG (Environmental, Social, and Governance) factors, without converging into a unified framework for a NFPI applicable to the manufacturing sector. This fragmentation highlights the necessity for a thorough NFPI framework that is backed by theory and supported by empirical evidence, combining both ESG and non-ESG indicators.
3. Methodology
3.1. Research Design and Methodological Rationale
This study aims to create a comprehensive and practical system of non-financial performance indicators (NFPIs) for the manufacturing sector. To achieve this, it employs a multi-stage, mixed-method research design. The methodology includes bibliometric analysis, systematic literature reviews, manual content analysis, and expert interviews. This approach ensures both theoretical completeness and empirical validation.
Bibliometric analysis is used to map the scope and structure of existing research on NFPI, identify dominant themes, and reveal intellectual connections across various studies. A systematic literature review follows, which rigorously refines the literature to ensure that only relevant and methodologically sound studies are included for in-depth analysis. Next, manual content analysis is applied to extract, classify, and synthesise non-financial indicators from the selected full-text studies, forming the theoretical foundation of the NFPI framework. Finally, expert interviews are conducted to empirically validate, prioritise, and refine the theoretically derived indicators, ensuring that they are relevant and applicable in manufacturing practices.
Figure 1 presents the overall methodological workflow of the study, emphasising the sequential integration of literature-based analysis and expert validation.
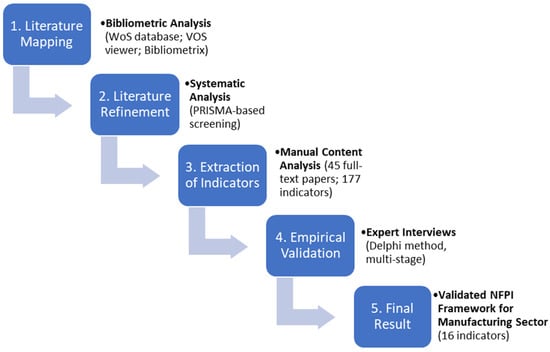
Figure 1.
The Methodological Workflow. Source: compiled by authors.
3.2. Bibliometric Analysis
The combination of bibliometric and systematic literature analysis was selected to ensure a comprehensive examination of existing research, encompassing both breadth and depth. Bibliometric analysis is a popular and rigorous method for exploring and analysing large volumes of scientific data (Donthu et al., 2021). It helps identify key themes and research trends within a large body of literature, offering a broader overview of the field. A bibliometric analysis was conducted to identify and visualise patterns, trends, and key contributions in the field; the process is presented in Table 1.

Table 1.
Search Criteria for Systematic Literature Analysis.
In this study, the bibliometric analysis was conducted using the Web of Science (Clarivate Analytics) database. The Web of Science database was selected as the sole source because it is a platform that is extensively utilised by other scientific researchers in the field of bibliography (Sarkar et al., 2022), widely recognised for its comprehensive coverage of high-quality, peer-reviewed research across disciplines and its rigorous indexing standards. While other databases exist, Web of Science ensures consistency and reliability in bibliometric analysis, which is critical for mapping research trends and minimising duplication. As the most comprehensive scientific research website, WoS by Clarivate Analytics provides information regarding author/editor, title, source, conference information, abstract, cited references, document type, conference sponsors, addresses, times cited, keywords, publisher information, ISSN/ISBN, cited reference count, source abbrev., page count, IDS number, language, Web Of Science categories, research areas, funding information, accession number, author identifiers, usage count, PubMed ID, open access, hot paper, and highly cited paper (Sarkar et al., 2022).
The initial search query included the keywords “non-financial performance indicators” and yielded 685 results. The search concentrated on the exact phrase to uphold the concept of non-financial performance indicators and to exclude the literature that is outside the study’s purpose. Options such as “nonfinancial performance indicators” were considered during the screening process.
The search was refined to limit results to the most recent studies (2020–2024) to ensure their relevance and contemporaneity. This time frame was selected to capture recent developments and emerging trends in the field. Only English-language, peer-reviewed documents were considered. The search strategy was to make use of the categories from the Web of Science. The categories considered most relevant to environmental and performance evaluation, which included the highest number of references, were as follows: Management, Business, Business Finance, Green Sustainable Technology, Economics, Environmental Sciences, and Environmental Studies. Limiting the search to these categories narrowed the dataset to 255 references.
Bibliometric mapping and visualisation were conducted using VOSviewer, while additional quantitative indicators were generated with the Bibliometrix R package (version 4.5.2) and its web interface, Biblioshiny (Aria & Cuccurullo, 2017). This stage allowed the identification of key research themes, keyword co-occurrence patterns, and publication trends, which guided the following stages of literature screening and indicator extraction.
3.3. Systematic Literature Analysis
The systematic analysis enables the rigorous and focused assessment of the most relevant studies, allowing for the synthesis of theoretical insights and methodological approaches. Together, these methods provide a solid foundation for developing a structured NFPI framework.
Systematic reviews serve many critical roles. They can provide syntheses of the state of knowledge in a field, from which future research priorities can be identified; they can address questions that otherwise could not be answered by individual studies; they can identify problems in primary research that should be rectified in future studies; and they can generate or evaluate theories about how or why phenomena occur (Page et al., 2021). The systematic literature analysis followed standard steps: planning, identification, screening, eligibility, and analysis. The planning phase is an initial phase and involves establishing the review’s objectives (Page et al., 2021). It involved defining the review objectives, research scope, inclusion and exclusion criteria, time horizon, and database selection. The identification phase focuses on comprehensively identifying relevant studies. In this phase, search strategies, used databases, registers, and websites, including filters and limits used, are presented (Page et al., 2021). During the identification stage, a thorough search strategy was employed to capture all potentially relevant studies. This involved querying the Web of Science database using specific keywords related to non-financial performance indicators and limiting the search to relevant subject categories. The initial set was made of 255 papers. The goal of this stage is to maximise coverage and minimise the risk of overlooking important or relevant contributions. During screening, the methods used to decide whether a study meets the inclusion criteria are detailed (Page et al., 2021). This phase involved an initial evaluation of titles and abstracts to exclude studies that were clearly irrelevant to the research objectives. The screening process was supported by the RAYYAN.AI tool (version 1.7), which is a web-based application designed to assist with systematic reviews by enabling the detection of duplicates and semi-automated exclusion based on predefined criteria. Only English-language, peer-reviewed publications from 2020 to 2024 were included to ensure relevance and timeliness. Studies were excluded if they addressed unrelated research topics, employed inappropriate methodologies, or failed to offer substantial insights into non-financial performance indicators. This stage ensures efficiency while upholding methodological rigour by filtering out studies that do not meet the basic relevance requirements. The eligibility phase involves applying predefined criteria to determine which studies are suitable for inclusion. The review’s inclusion and exclusion criteria are specified (Page et al., 2021). In this phase, the remaining studies were assessed through full-text analysis to evaluate their conceptual relevance, methodological rigour, and contribution to the understanding of non-financial performance indicators. Studies that did not provide meaningful insights related to indicators or employed inadequate research designs were excluded at this stage. This step enhances the internal validity of the review by ensuring that only high-quality and relevant studies contribute to the synthesis. The analysis phase encompasses extracting data from eligible studies and synthesising the findings (Page et al., 2021). It involved a thorough manual content analysis of the selected full-text articles. During this stage, non-financial performance indicators were systematically extracted, compared, and categorised into coherent dimensions. This structured synthesis transforms the reviewed literature into a theoretically grounded framework, representing the core value-adding phase of the systematic review. The systematic selection process is summarised using a PRISMA flow diagram.
3.4. Manual Content Analysis
After conducting a systematic review, a manual content analysis was performed on a final selection of 45 full-text articles. The purpose of this stage was to extract and synthesise the non-financial performance indicators explicitly discussed in the literature and to organise them into a coherent theoretical framework.
Each selected paper was analysed in detail regarding its topics, research aims, research objects, research methods, and main results. Full-texts were obtained through the institution’s electronic library subscription. Indicators identified in the literature were compared with existing classification to ensure conceptual consistency. Where necessary, new subcategories were created to accommodate emerging themes.
This process led to the identification of 177 non-financial performance indicators, systematically organised into five key dimensions: economic, social, ethical, environmental, and governance. These indicators form the theoretical framework of non-financial performance indicators (NFPI) that is used for empirical validation.
3.5. Expert Interview Method
To empirically validate the theoretical NFPI framework, expert interviews were conducted using a structured Delphi approach. Expert interviews, operationalised as a structured expert survey, were conducted in February 2025 to gather qualified opinions and validate the theoretical NFPI system. Interviews were conducted using a Google Forms survey. Respondents had the opportunity to ask clarifying questions by phone or via MS Teams.
The study employed targeted expert selection, prioritising the experts’ work experience and competence in the relevant field. The expert panel consisted of 15 experts, and this number aligns with methodological recommendations for Delphi-type expert engagement studies, where panels of approximately 10–18 experts are often suggested to balance opinion diversity with feasible data collection and analysis (Nworie, 2011; Williamson et al., 2021). Recent reviews of Delphi applications in health and social sciences similarly report typical panel sizes ranging from about 8–23 participants (Shang, 2023).
Fifteen experts participated in the survey and were divided into five groups based on their professional affiliations. The selection of experts was based on professional experience and competence in the relevant field; criteria such as gender and age were not determining factors in the selection conditions. However, to reduce potential selection bias, experts of various genders and age groups representing both mid-career and late-career stages participated in the survey. Each group consisted of three experts. Experts were selected according to the following criteria: at least 5 years of work experience and competence in the relevant field. Additional criteria were set for each expert group to ensure the reliability of the data obtained.
The expert survey was designed as a multi-stage, indicator-based questionnaire. The expert validation process utilised a modified Delphi method, which included two anonymous evaluation rounds: an initial screening round and a prioritisation round. This was followed by a controlled feedback and reassessment stage, where experts received aggregated mean scores along with their individual responses. This approach aimed to enhance consensus and improve the stability of their judgments. In the first stage, experts assessed the necessity of including each of the 177 indicators using a 3-point Likert scale, which included options for “agree,” “neutral/don’t know,” and “disagree.” Indicators that met predefined inclusion thresholds were retained for further evaluation. In the second stage, the refined set of indicators was evaluated using a 5-point Likert scale to determine their relative importance in the context of sustainability. Controlled feedback was provided to participants to enhance the consistency and stability of their judgments.
This expert validation ensured that the final NFPI framework, including 16 indicators, reflects both theoretical completeness and practical relevance within the manufacturing sector.
4. Theoretical Framework of NFPI
4.1. Bibliometric Analysis Results: Mapping the NFPI Research Landscape
The theoretical framework established in this study is based on a thorough synthesis of the literature on non-financial performance. The bibliometric analysis offers a comprehensive overview of the intellectual structure and evolution of research on non-financial performance indicators (NFPIs). The selected dataset of 255 references, as described in Section 3, was analysed to gain insights and evaluate the NFPI landscape.
The dataset consisted of various document types, including articles (85%), proceeding papers (6%), early access papers (4%), review articles (3%), and book chapters and editorial material (2%). The distribution of references across the selected years is as follows (by final publication year): 2020 (68), 2021 (64), 2022 (49), 2023 (38), 2024 (36). Most of the studies identified were published in 2020 and 2021. This may be the result of contextual factors such as the global emphasis in this period on sustainability, corporate social responsibility (CSR), and performance-evaluation reforms. This refined sample of studies was employed for the subsequent review and analysis, which focused on their keywords, research purpose, methods, and main results.
In the first stage, bibliometric data of the selected 255 papers were analysed using the VOSviewer to map keyword co-occurrence, with a minimum of five occurrences, excluding synonyms. This analysis revealed five clusters comprising 63 items, 653 links, and a total link strength of 1195 (see Figure 2 for clusters and colour coding). The strongest keywords were performance, impact, management, CSR, and quality: Performance (Cluster 2, green) yielded 61 links, with a total link strength of 223 and 80 occurrences pointing to corporate governance, determinants, ownership, market; impact (Cluster 4, yellow) yielded 50 links, with a total link strength of 154 and 53 occurrences connecting to indicators, framework, model, transparency; management (Cluster 3, blue) yielded 45 links, with a total link strength of 89 and 36 occurrences highlighting research on information, balanced scorecard, knowledge management, innovation, industry; CSR (Cluster 1, red) yielded 42 links, with a total link strength of 116 and 34 occurrences highlighting ESG, non-financial reporting, integrated reporting, sustainability, legitimacy, non-financial reporting and disclosure; quality (Cluster 5, violet) yielded 30 links, with a total link strength of 58, and 16 occurrences indicating to disclosures, board, earnings management, behaviour. The relationships among the five clusters illustrate a closely interconnected intellectual structure, where major terms—represented by larger node sizes—act as central concepts linking multiple thematic areas. The green cluster (performance) has strong connections with the yellow cluster (impact) and the red cluster (CSR). This indicates the integration of governance and sustainability considerations in performance measurement. Similarly, the blue cluster (management) is associated with both the performance and CSR clusters, suggesting that managerial tools, such as balanced scorecards, are increasingly being used in sustainability contexts. Furthermore, the violet cluster (quality) is linked to the CSR and governance clusters, emphasising the importance of disclosure quality in non-financial reporting.
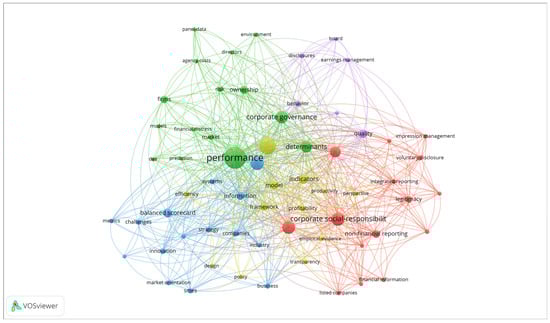
Figure 2.
Results of bibliometric analysis. Source: compiled by authors.
Overall, the intellectual structure of the field coalesces around five interrelated themes: (1) CSR/ESG disclosure practices; (2) governance-driven analyses of corporate performance; (3) managerial performance-measurement frameworks; (4) sustainability-oriented impact research; and (5) the quality and assurance of reported non-financial indicators.
The bibliometric analysis revealed a strong relationship between research on NFPI and the evaluation of companies’ performance, their impact, information formation in different forms and management, the importance of CSR and its reporting, and the quality of the information on companies.
To enhance the bibliometric layer beyond the network visualisations created with VOSviewer, the workflow has been supplemented by the Bibliometrix R package and its web interface, Biblioshiny (Aria & Cuccurullo, 2017). This tool offers a wider range of indicators, providing additional quantitative frameworks and diagnostics.
After re-running the export and harmonising the records in Bibliometrix, the working corpus increased from 255 to 277 documents. The current dataset spans the years 2020 to 2025, based on the final publication year, and includes 237 articles, 3 book chapters, 11 early-access articles, 15 proceedings papers, 9 reviews, and a few other document types.
Table 2 provides the main metrics on the analysed literature dataset, while Supplementary Materials File S2 offers more detailed information in the Bibliometrix reports.
Table 2.
Summary of Bibliometrix Reports Analysis.
The analysis of the dataset reveals a strong thematic emphasis on performance measurement, sustainability, and corporate governance. The most frequently mentioned keywords include “performance,” “impact,” “management,” “financial performance,” and “ESG.” Research output peaked in 2024, while citation impact has gradually declined since 2021. There is notable collaboration among authors, with an average of 3.19 co-authors per paper, and moderate international co-authorship at 21.3%. The most prolific journal in this field is Sustainability, which has published 41 articles. According to Bradford’s Law, the core journals focus on areas such as governance, quality management, and accounting. Geographically, the leading contributors to this research are China, Italy, Spain, Romania, and Germany, with China showing the fastest growth since 2021. The most highly cited papers address topics like ESG and sustainability reporting, corporate governance, and non-financial disclosure. Overall, the field is evolving from a focus on purely financial metrics toward integrated frameworks that combine financial, social, environmental, and governance indicators.
4.2. Results of the Systematic Literature Analysis
Following bibliometric analysis, a systematic literature review was conducted to refine the relevant studies and ensure analytical rigour. Figure 3, obtained using the RAYYAN.AI tool, shows how papers were filtered in the form of a PRISMA (Preferred Reporting Items for Systematic reviews and Meta-Analyses) Flow Diagram. In the identification phase, 255 records were retrieved from Web of Science database. One duplicate was detected during the analysis of 255 papers; 174 papers were excluded by the automation tool (RAYAN.AI), leaving 80 papers for screening. At the screening phase, 36 were excluded after title and abstract review, 12 for being the “wrong outcome,” 6 for being the “wrong research object,” 2 for being from the “wrong period,” and 16 for having the “wrong study design.” The eligibility phase involved a full-text assessment of the final sample of 44 papers, which were subject to further detailed analysis based on their topics, research aims, research objects, research methods, and main results. During this phase, a backward reference check was conducted, resulting in the identification of an additional relevant publication (Arianpoor & Salehi, 2020). This article was crucial in developing the NFPI theoretical framework and was subsequently included in the final sample, bringing the total to 45 articles. During the full-text assessment of the 45 articles, five were excluded because no access was available (3) or the wrong study approach (2) was taken. A detailed analysis of the 40 papers is provided in Supplementary Materials File S1, Table S1.
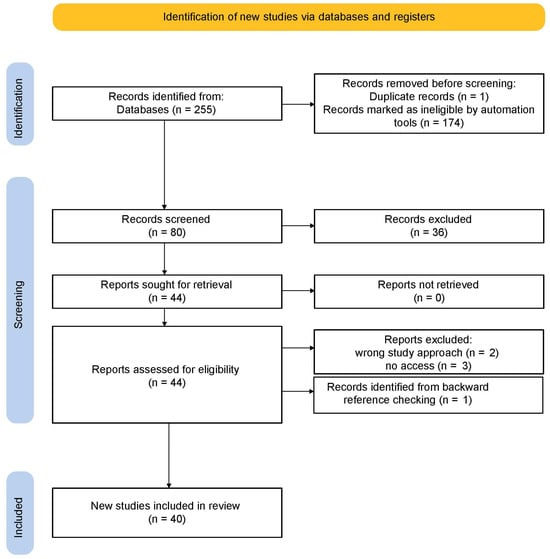
Figure 3.
PRISMA Flow Diagram. Source: Compiled by authors. Note: Although five reports were excluded during the eligibility stage, one additional study was identified through backward reference checking and included in the final sample. As a result, the total number of studies included in the review is 40 (44 total studies minus 5 excluded plus 1 added).
The systematic review refined the final set of articles for the next stage of manual analysis. The results of a systematic literature review indicate that most existing studies primarily focus on specific areas of non-financial performance, such as the quality of ESG (Environmental, Social, and Governance) disclosures, governance practices, sustainability reports, or individual social and environmental outcomes. Although many researchers recognise the significance of using indicators that are specific to different sectors, there are relatively few studies that suggest comprehensive non-financial performance indicator (NFPI) systems designed specifically for manufacturing companies. Additionally, there is limited empirical validation of NFPI frameworks, as most research relies on secondary data or theoretical arguments rather than assessments based on practitioner-based evaluations.
4.3. Manual Content Analysis and Indicator Extraction
The manual literature analysis returned research covering a wide range of countries across diverse geographic regions and economic contexts. The main countries of analysis were Spain (4), Italy (3), Poland (2), the UK (2), Ukraine (2), Jordan (2), Indonesia (2), and Iran (2). Papers that focused on individual countries analysed one country each. These included Romania, France, Germany, the Czech Republic, Montenegro, and Turkey in Europe; China, India, Taiwan, and Malaysia in Asia; and Ghana, Ethiopia, and South Africa in Africa. Broader regional studies covered OECD countries (1), 20 emerging markets (1), Islamic countries (1), Europe (1) and several regions (1).
Almost all papers analysed companies, but only a few were based on a theoretical analysis or literature review. Approximately 60% of the analysed companies were listed; the remaining companies included small and medium-sized enterprises, cooperatives, or entities without identified classifications. The sectors in which companies operated were usually broadly described as non-financial. Where the sector considered was clearly defined, the manufacturing sector was the most analysed; other sectors analysed were technology, oil and gas, consumer goods, pharmaceuticals, energy, and agriculture, reflecting the diverse sectors associated with the analysed companies.
The studies reviewed primarily used content analysis to assess disclosures, develop indices, for example, GRI and ESG, and evaluate reporting quality, and quantitative techniques, such as regression analysis, correlation tests, ANOVA, and DEA (Data Envelopment Analysis) to measure efficiency and performance. Other studies used advanced econometrics such as structural equation modelling (SEM), TOPSIS, and AHP-entropy for decision-making and indicator weighting or surveys and questionnaires to collect data from managers and to evaluate practices and perceptions. A few studies conducted bibliometric analysis and employed predictive models, such as machine learning (e.g., LSTM, GRU), Altman Z-Score for predictions and trend analysis, and mixed (qualitative and quantitative) methods, including Delphi and meta-synthesis techniques.
The analysis shows the growing recognition of NFPIs and their role in sustainability and CSR, as well as the prevalence of non-ESG NFPIs. The positive impact of NFPIs on decision-making, sustainability, and corporate survival, and the positive correlation with financial performance, is clear from the findings. The results show that ESG practices enhance profitability (ROA, ROE) and company value. Furthermore, regulatory pressure, such as that from the EU Directive, is driving improvements in NFPI disclosure, and alignment with ESG improves sustainability reporting and stakeholder engagement. Gender-diverse and independent boards are also shown to reduce financial risks and improve governance quality. However, there are remaining challenges in the comparability of NFPs and standardisation. A more standardised approach to non-financial performance measurement, or even NFPI disclosure by specific sectors, is needed.
4.4. Development of the Theoretical NFPI Framework
Based on the synthesis of bibliometric findings, systematic review results, and manual content analysis, a theoretical framework of NFPIs was constructed and is provided in Supplementary Materials File S1, Table S2. Figure 4 shows the main categorical elements and subcategories of the NFPI system reflecting different company dimensions: economic, social, ethical, environmental, and governance. Economic dimension, capturing non-financial drivers of a firm’s ability to achieve efficiency, support growth, and sustain long-term value through strategic orientation and investment. These indicators function as leading signals of future financial outcomes and are particularly relevant in manufacturing environments. The social dimension includes indicators related to a firm’s responsibilities towards employees, consumers, and society. This encompasses fair labour practices, respect for human rights, social impact, and product responsibility. These indicators reflect the internal social sustainability of organisations. Ethical dimensions involve business integrity, transparency, compliance, and responsible conduct. While previously less frequently operationalised in NFPI frameworks, ethical indicators have emerged consistently in the literature as foundational elements of organisational legitimacy and trust. Environmental dimension, including indicators for resource consumption, emissions, waste management, energy efficiency, and compliance with environmental regulations. This dimension reflects both regulatory requirements and operational environmental performance. The governance dimension encompasses the structures and practices that promote accountability, transparency, shareholder protection, and effective oversight by the board in corporate decision-making. While governance indicators are frequently examined in ESG research, they are seldom integrated with operational and organisational performance indicators within a single framework. The development of the NFPI framework followed a structured classification procedure. The initial structure was based on the categories proposed by Arianpoor and Salehi (2020), which provided the foundation for the NFPI system. After conducting a full-text screening of 40 articles, indicators explicitly discussed in the literature were extracted, and additional indicators that were not included in the initial framework were incorporated into the corresponding categories. In particular, detailed indicator-level contributions were drawn from studies (such as Arianpoor & Salehi, 2020; Zimon et al., 2022; Hálek et al., 2020; Salehi & Arianpoor, 2021; Noja et al., 2024; Gutiérrez-Ponce et al., 2022; Al-Mawali, 2023; Xu & Zhao, 2024; Mishchuk et al., 2022). These studies provided sufficiently detailed definitions of the Non-Financial Performance Index (NFPI), which facilitated its direct integration into the framework. Other studies reviewed contributed to refining, validating, and defining categories, even though they did not clarify indicators at a level conducive to direct integration. Each newly identified indicator was compared to the existing category definitions to ensure conceptual consistency. If necessary, new sub-sections were introduced to accommodate emerging themes. Five dimensions together provide a comprehensive representation of non-financial performance, integrating ESG-related considerations with broader organisational and operational drivers.
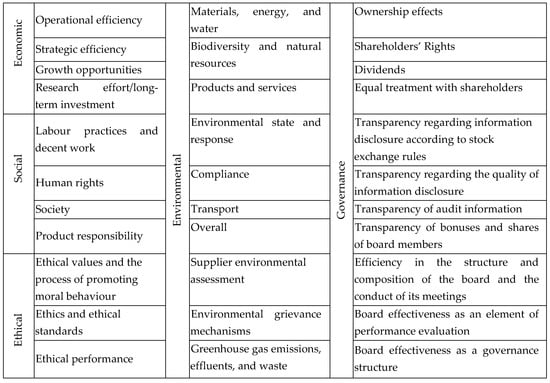
Figure 4.
Categorical Elements of the Theoretical Framework of the System of NFPI. Source: compiled by authors.
Ultimately, the final list of 177 indicators represents a comprehensive, literature-derived classification systematically organised according to the five NFPI dimensions.
The literature-driven framework identifies the core categories of non-financial performance indicators (economic, social, ethical, environmental, and governance). However, translating these concepts into a practical system for manufacturing requires expert judgement. Specialists in the sector can validate the relevance of these indicators, uncover implicit shop-floor practices, and identify constraints at the plant level, such as data availability, measurement frequency, and cost. Thus, the theoretical framework developed here serves as the foundation for the subsequent empirical validation phase.
Interviews will play a vital role in prioritising and weighting these indicators based on real operational trade-offs, ensuring alignment with existing systems, and calibrating variable thresholds and benchmarks according to subsector and technology. Additionally, expert opinions help validate the theoretical framework, enhance external validity across different manufacturing contexts, and foster stakeholder commitment to implementation. Accordingly, the indicators identified in this section are not final outputs but constitute the basis for testing and refinement in Section 5.
5. Results: Expert Validation
5.1. Expert Panel Characteristics
To empirically evaluate the theoretical Non-Financial Performance Indicator (NFPI) framework, expert interviews were conducted with professionals from regional planning authorities, manufacturing management, finance executives, sworn auditors, and academics in accounting and finance. The goal of these interviews was to refine, prioritise, and operationalise the proposed NFPI system, ensuring its relevance, feasibility, and applicability within the manufacturing sector. The characteristics of the expert groups are presented in Table 3.
Table 3.
Expert Characterisation.
5.2. Overview of the Expert Evaluation Procedure
In the first step, each of the 177 indicators within the theoretical NFPI framework (Supplementary Materials File S1, Table S2) was formulated as a separate question and presented to experts for evaluation. Experts assessed the necessity of including each indicator in a manufacturing company’s sustainability report using a 3-point Likert scale (“agree,” “neutral/don’t know,” “disagree”). Consequently, the expert survey did not rely on a standalone questionnaire; instead, it consisted of a direct, anonymous assessment of the NFPI framework itself. In the second phase, the reduced set of indicators retained from this selection was presented again, and experts were personally asked to assess their significance in the context of sustainability using a 5-point Likert scale from 1 (“completely insignificant”) to 5 (“very important”), thus determining the significance of the selected indicators in the context of sustainability.
The theoretical framework of the NFPI system (Supplementary Materials File S1, Table S2) covers five subcategories (Figure 4) and comprises 177 indicators.
5.3. Process of Evaluation of NFPI
The following steps were followed to evaluate and select the desired NFPIs:
Step 1. In the first step of the NFPI system theoretical framework indicator evaluation, experts assessed the necessity of including 177 indicators of the NFPI system theoretical framework in the sustainability report of manufacturing enterprises using a 3-point Likert scale: “Agree,” “Neutral/Don’t Know,” and “Disagree,” to obtain expert judgments on the inclusion or exclusion of the respective indicator in the next step of the NFPI system theoretical framework evaluation. Likert-type scales can reasonably use different numbers of response categories (usually from 3 to 7) depending on the measurement objective and the cognitive demands placed on respondents (Koo & Yang, 2025). Using a smaller response scale can reduce cognitive load without aiming for detailed attitude measurement (Sun et al., 2025). Methodologically, the response “Neutral/Don’t Know” was considered an insignificant selection category, indicating a lack of clear agreement or rejection of an indicator. The proportion was on average 13–33% (corresponding to 2–5 expert responses), depending on the indicator, and was therefore reported to indicate the extent of information excluded at the screening stage. For the application of inclusion thresholds for indicators included in the second step of the NFPI system theoretical framework evaluation, only the responses “Agree” and “Disagree” were used. The responses provided by experts were compiled. Indicators were included in the second step of the NFPI system theoretical framework evaluation if (1) at least 8 out of 15 experts or the majority—53.3% marked the response “Agree” for the respective indicator, or (2) if only 1 of the experts responded “Disagree” for the respective indicator. The second inclusion criterion focused on indicators that had a high proportion of “Neutral/Don’t know” responses. This suggests a lack of a clear expert opinion rather than an outright rejection. In these cases, indicators were retained for the next evaluation stage if no more than one expert chose the response “Disagree.” This approach aims to prevent the premature exclusion of context-dependent indicators. Barrios et al. (2020) point out that although there are several approaches to reporting consensus, the most common is to use a certain percentage of group agreement, and most Delphi studies do not always specify a threshold percentage a priori, and the range reported as the assumed consensus is a very wide (50–97%) threshold.
Step 2. In the second step of the NFPI system theoretical framework indicator evaluation, experts assessed the set of indicators created in the first step of the evaluation within the context of sustainability, using a Likert scale from 1 to 5, where 1—“Completely insignificant”, 2—“Less significant”, 3—“Moderately significant”, 4—“Significant” and 5—“Very significant”. In this step, the previously used 3-point Likert scale was replaced with a 5-point Likert scale because the experts’ task shifted from initial indicator selection to evaluating the significance of each indicator in the context of sustainability. Research (Abulela & Khalaf, 2024; Aybek & Toraman, 2022) indicates that a five-point Likert scale provides a balance between reliability, validity, and expert load in such significance evaluations. The responses provided by the experts were compiled.
Step 3. In the third step of the evaluation of the theoretical framework indicators of the NFPI system, the average value of each indicator of the theoretical framework of the NFPI system was calculated.
Step 4. In the fourth step, each expert received feedback on the average value of each indicator within the NFPI system’s theoretical framework as well as their individual assessments. Experts were asked to reassess the indicators if their evaluation significantly differed from the average value of each indicator within the theoretical framework of the NFPI system. This controlled feedback procedure is consistent with modified Delphi-type approaches aimed at increasing the stability of expert judgments and reducing random variation between individual assessments.
Step 5. After evaluation, 16 indicators with the highest average value were selected.
Overall, the methodological approach combines a theory-driven construction of the NFPI universe with a structured, multi-stage expert evaluation procedure, which is commonly recommended for the development and refinement of indicator systems and scales based on Likert-type ratings.
5.4. Screening of the Full Set of NFPI
In the first step, 15 experts assessed the need to include 177 indicators in the NFPI theoretical framework for manufacturing companies with the answers “Agree”, “Neutral/don’t know,” and “Disagree”. Thirty indicators were selected for the NFPI theoretical framework (Table 4).
Table 4.
NFPI System Framework (1–2 Steps) (Intermediate Result).
Following the expert evaluation of the indicators for the NFPI theoretical framework, 30 indicators were selected for the NFPI system, reflecting four different company spheres: economics (6 indicators), social (9 indicators), environmental (12 indicators), and governance (3 indicators).
5.5. Prioritisation and Final Indicator Selection
In the second step of the NFPI selection, experts were asked to evaluate the 30 indicators in the NFPI theoretical framework selected in the previous steps on a Likert scale from 1 (completely insignificant) to 5 (very significant). The answers provided by the experts were then summarised, and the average value of each indicator was calculated. Sixteen indicators with the highest average value were selected, assuming the average value was at least 4.00 points. The indicators, set out in Table 5, were distributed in the following categories: economic (3 indicators), social (3 indicators), environmental (9 indicators), and governance (1 indicator).
Table 5.
The Validated NFPI System for Manufacturing Companies.
The median of 7 out of 16 indicators is 5, which indicates that the given indicators are assessed by experts as “Very important” in the context of sustainability. In almost all indicators, the mean value is very close to the median, which indicates a relatively symmetrical distribution and a small impact of extreme values. This indicates that experts assign a significant role to non-financial performance aspects, especially innovations, environmental management and responsible use of resources. Indicators with a lower standard deviation reflect a uniform and stable understanding of their importance in the context of sustainability, while indicators with a higher variance signal uneven practices and different priorities in the experts’ view. Overall, the analysis of the median and standard deviation confirms that non-financial performance areas are strategically important in the experts’ view, although their level of importance in the experts’ view is variable.
Expert representation at various levels, as well as a two-stage assessment approach with feedback, were important for obtaining the most accurate and consistent set of opinions. Thus, the expert survey empirically narrows the broad, literature-based theoretical framework of 177 NFPIs to a more focused and prioritised set tailored to the context of manufacturing companies, linking the conceptual development presented in the previous sections with a practically applicable indicator system.
The experts’ ratings showed a clear convergence regarding the importance of sus-tainability-related indicators, especially in the areas of innovation, environmentally friendly materials and technologies, waste management efficiency and product-related environmental impacts, all of which achieved an average rating of 4 or 5 with low variance. At the same time, small differences emerged in indicators such as sustainable development, employee turnover and psychological climate, where higher standard deviations reflected differences in organisational practices and the experts’ professional experience.
5.6. Consensus and Interpretation of Expert Evaluation
The results of the expert assessment of the indicators in the NFPI theoretical framework indicate a multidimensional view of manufacturing enterprises, but nevertheless concentrate on the main sustainability elements. The 16 indicators selected had the highest average rating, reflecting the consensus of experts on the importance of certain areas, especially environmental aspects, which are represented by 9 out of 16 indicators. This trend is consistent with modern global trends in environmental sustainability and responsible use of resources. The economic and social areas were less represented, but relate to important aspects of sustainability, such as innovation, employee safety, and satisfaction with a company’s psychological climate. These indicators show that the internal capacity of the company and employee well-being should be integrated as important elements of sustainability. Taken together, these findings demonstrate how the theoretically derived NFPI categories are differently emphasised in expert practice, providing an empirical basis for refining the initial framework and informing its subsequent application in reporting and performance evaluation.
The dominance of the environmental sphere in the list of indicators in the NFPI theoretical framework indicates its strategic importance in the context of sustainability. The inclusion of areas such as waste management, emissions reduction, and the use of environmentally friendly materials may be related to the specifics of the manufacturing sector that was the focus here.
Indicators from the social and economic spheres, especially innovation and the quality of working conditions, emphasise the importance of human resources and internal business processes in sustainability. The expert assessment reflects the relative insignificance of management-related indicators in this framework, but does not exclude their significance in the future, especially taking into account changes in the ESG regulatory environment.
5.7. Alignment with Sustainability Standards (ISO 14031)
ISO 14031:2021 (ISO, 2021) provides guidelines for assessing the environmental performance of companies (Environmental Performance Evaluation) and applies to any type of company regardless of their size, location, or complexity. The standard enhances organisations’ ability to monitor environmental impacts and improvements, such as in relation to cli-mate neutrality, emission reduction, efficient resource use, and management. (https://www.iso.org/standard/81453.html, accessed on 10 December 2025).
The 16 indicators obtained from expert surveys include an assessment of environ-mental, economic, social, and governance aspects, with an emphasis on organisations’ sustainable development, resource efficiency, emission reduction, work environment quality, and information transparency. This indicator structure is comparable to the environmental performance assessment principles provided by ISO 14031:2021, which focus on transparent data collection, indicator definition, and regular performance analysis. Thus, the indicators obtained from expert surveys not only reflect the theoretical ISO 14031 guidelines but also help ensure a practical and context-appropriate evaluation of environmental, social, and economic performance for organisations striving for strategic development planning and the enhancement of environmental management systems.
The results serve as a basis for the integration of NFPIs into corporate sustainability reports, promoting transparency, comparability, and strategic development. In summary, despite expectations of a greater balance of non-ESG and ESG indicators, the expert-validated NFPI set remains focused on sustainability-related metrics. This reflects the still-developing information infrastructure for calculating and assessing NFPIs and indicates that corporate practices continue to prioritise compliance with sustainability reporting requirements in the manufacturing sector.
As a result of the study, the NFPI theoretical framework was formed and evaluated through expert interviews. The 16 most important indicators in the theoretical framework were identified as applicable to the sustainability assessment of manufacturing enterprises.
6. Discussion
The aim of this study was to develop a theoretical framework for non-financial performance indicators (NFPIs) and to evaluate its applicability in the context of manufacturing companies through expert feedback. The findings reveal a significant divergence between the broad theoretical concept of NFPIs presented in academic literature and the more limited, practice-oriented perspective of the experts. While the theoretical framework included a wide range of non-financial indicators—spanning economic factors, employee-related metrics, ethical values and standards, as well as broader social and governance aspects—the experts’ feedback showed a predominant focus on the environmental components of the ESG (Environmental, Social, Governance) framework. This contradicts the opinions of Arianpoor and Salehi (2020); Zimon et al. (2022); Salehi and Arianpoor (2021); Hálek et al. (2020); Noja et al. (2024); Gutiérrez-Ponce et al. (2022); Al-Mawali (2023); Xu and Zhao (2024); Mishchuk et al. (2022). It suggests that, despite calls from scholars to incorporate a broader set of non-financial metrics in performance evaluation—such as innovation, human capital, and stakeholder relationships—current practices in manufacturing companies are still primarily focused on environmental sustainability.
As results confirm that, in the current regulatory and stakeholder environment, manufacturing companies perceive environmental performance as a central dimension of non-financial reporting and evaluation, sometimes at the expense of economic, social, and governance indicators that are also highlighted in the literature. The tendency of experts to emphasise environmental indicators may stem from existing regulatory pressures or the prominence of environmental issues in public discussions; however, this could lead to an inadequate representation of other essential aspects of non-financial performance.
The prioritisation of environmental and operational indicators observed in the expert assessment aligns closely with previous findings in the sustainable performance measurement literature for the industrial sector. Scholars have shown that manufacturing companies tend to emphasise environmental performance due to its high measurability, regulatory pressures, and the direct financial implications of resource efficiency and emissions management (Hálek et al., 2020; Noja et al., 2024). In this respect, our results confirm existing research, demonstrating that environmental metrics—such as waste management efficiency, energy use, and emissions reduction—remain the most institutionally embedded components of sustainability assessment in manufacturing. At the same time, the lower prioritisation of social and governance indicators partly contradicts broader theoretical expectations found in the NFPI literature, which advocates for a more balanced approach that integrates human capital development, ethical practices, and governance quality into performance frameworks (Arianpoor & Salehi, 2020; Mishchuk et al., 2022). Our findings, therefore, complement the literature by showing that, while theoretical models promote multidimensional sustainability performance, practical decision-making in manufacturing continues to gravitate toward environmental and operational domains where standardised measurement routines and regulatory mandates are already well-developed. This divergence underscores the need for further institutional and methodological support to strengthen the relevance and measurability of social and governance indicators in industrial sustainability reporting.
The tendency of industry experts to prioritise tangible environmental indicators can be explained by several interrelated drivers grounded in the operational realities of manufacturing. First, environmental indicators—such as emissions, waste-management efficiency, and resource consumption—are highly measurable, traceable, and auditable, aligning with well-established regulatory frameworks such as the EU Corporate Sustainability Reporting Directive and global sustainability reporting standards (European Parliament and Council of the European Union, 2022; Global Reporting Initiative, 2021; Sustainability Accounting Standards Board, 2022). The maturity of environmental data infrastructures in manufacturing organisations reinforces experts’ confidence in these metrics (Hálek et al., 2020). Second, environmental performance is strongly linked to direct financial implications, including energy savings, resource efficiency, pollution fees, and compliance risks, which strengthen managers’ incentive structures and explain their prioritisation of concrete environmental indicators (Paula Monteiro et al., 2022). Third, environmental outcomes are highly visible to external stakeholders—investors, regulators, communities—who increasingly expect transparency and demonstrable environmental responsibility (Richard & Odendaal, 2021). By contrast, governance and social indicators often involve intangible constructs, heterogeneous definitions, and less standardised data, leading to greater variation in expert judgments (Disli et al., 2022; Mishchuk et al., 2022). Taken together, these drivers illustrate why manufacturing professionals consistently elevate environmental metrics: they offer clearer measurement boundaries, institutional legitimacy, and stronger alignment with regulatory, financial, and reputational pressures.
Overall, the analysis of median values and standard deviations across the validated indicators reveals clear areas of expert consensus as well as dimensions where opinions remained more fragmented. The strongest convergence was observed in the environmental dimension, with indicators such as green materials and technologies, waste-management efficiency, product-related environmental impact, and greenhouse-gas emission reduction all receiving very high median scores (4–5), coupled with low dispersion, indicating a stable and shared understanding of their centrality in manufacturing sustainability. Moderate consensus also emerged for innovation and workplace safety, which experts consistently evaluated as significant. By contrast, greater divergence was observed in social and strategic-economic indicators—such as sustainable development, employee turnover, and psychological climate—which exhibited higher standard deviations. These divergences suggest heterogeneity in organisational practices and differing interpretations of their sustainability relevance. Taken together, these patterns confirm that expert agreement is strongest where regulatory expectations and measurement practices are well-institutionalised, while a more fragile consensus remains in areas where empirical routines, data availability, and conceptual boundaries are less developed.
Although governance- and social-related indicators received lower average prioritisation compared with environmental indicators, this should not be interpreted as a lack of substantive importance. Rather, the expert responses reflect the current stage of NFPI institutionalisation in manufacturing companies, where environmental reporting is more mature due to regulatory pressures and compliance obligations under instruments such as the EU Corporate Sustainability Reporting Directive (CSRD) (European Parliament and Council of the European Union, 2022) and globally established disclosure frameworks (Global Reporting Initiative, 2021; Sustainability Accounting Standards Board, 2022). Governance indicators—including risk management policies, transparency of information disclosure, and tax reporting—play a critical role in ensuring accountability, reducing information asymmetry, and strengthening stakeholder trust (Disli et al., 2022; Richard & Odendaal, 2021). Similarly, social indicators such as employee turnover, workplace safety, and psychological climate are well-documented determinants of organisational resilience and long-term competitiveness (Mishchuk et al., 2022; Juliana et al., 2021). Their lower prioritisation by experts therefore reflects practical implementation challenges, including limited data availability, a lack of standardised metrics, and the relatively underdeveloped measurement infrastructure in these NFPI domains (Hálek et al., 2020; Paula Monteiro et al., 2022). Consequently, the divergence between theoretical importance and expert prioritisation is itself an analytically meaningful result, indicating the areas where methodological refinement, organisational capability development, and regulatory encouragement are most needed to move toward a balanced NFPI system that captures the full breadth of sustainability performance in manufacturing.
The Conclusions section outlines the methodological limitations and suggests directions for future research.
7. Conclusions
This study aimed to develop a comprehensive theoretical framework for non-financial performance indicators (NFPIs) in the manufacturing sector and to evaluate its practical applicability through expert validation. Utilising bibliometric and systematic literature analysis and an in-depth examination of 40 full-text studies, the research identified a total of 177 theoretically grounded indicators that encompass economic, social, ethical, environmental, and governance dimensions. The subsequent expert assessment allowed for the empirical refinement of this framework, resulting in a final set of 16 indicators deemed most relevant and actionable for manufacturing companies.
The findings underscore a strong emphasis on environmental sustainability, with nine out of the sixteen expert-validated indicators categorised as environmental. This predominance reflects regulatory pressures, stakeholder expectations, and the significant impact that environmental performance has on the manufacturing sector. While there are fewer indicators related to innovation, workplace safety, and psychological climate, these still highlight the importance of internal capabilities and human-centred practices for achieving long-term sustainability. Economic and managerial indicators were deemed less critical by experts in this context; however, their significance may grow as ESG regulations evolve and companies improve their reporting capabilities.
From a practical perspective, the validated NFPI set offers manufacturing companies a concise and operational tool for enhancing their sustainability and performance reporting. The indicators can be integrated into existing management accounting and reporting systems, supporting internal decision-making, external transparency, and alignment with ESG-related regulatory requirements. Policymakers and regulators may also draw on the results when designing guidelines and standards that reflect both theoretical insights and the priorities of practitioners. For auditors and other assurance providers, the proposed indicator set helps to clarify which non-financial dimensions are currently considered most salient in the manufacturing sector.
From a scientific perspective, the study contributes to the NFPI literature by bridging the gap between broad theoretical conceptualisations and practice-based priorities through the development of a unified, empirically validated framework tailored to the manufacturing sector. It demonstrates how a structured expert-elicitation approach can be used to refine an extensive theoretical indicator universe into a manageable and context-sensitive set, and it highlights areas of mismatch between academic proposals and the indicators that practitioners are willing and able to implement. The identified dominance of environmental indicators suggests that further research is needed to understand the conditions under which economic, social, and governance-related NFPIs gain prominence in corporate practice.
Overall, the results suggest that, in the current regulatory and market environment, manufacturing companies still tend to interpret non-financial performance primarily through the lens of environmental sustainability. While this focus is understandable, it risks underplaying other critical dimensions of long-term value creation, such as human capital, innovation capability, and governance quality.
The findings of this research should be interpreted with consideration of several limitations. First, the data are derived from a purposive sample of 15 experts from a single country and sector. This limitation may lead to selection and response bias, which affects how applicable the results are to other institutions and industries. Second, although the self-administered questionnaire was presented as an expert interview, it is still subject to typical survey-related issues. These include potential misunderstandings of the questions and the possibility that respondents may provide socially desirable answers. Third, while a multi-stage procedure with controlled feedback was implemented to refine expert judgments, no formal reliability statistics, such as internal consistency coefficients, were calculated for the indicator set. As a result, the proposed NFPI system should be regarded as a validated starting point rather than a conclusive measurement tool, providing a basis for further empirical testing and refinement. Fourth, the research design is cross-sectional, capturing expert opinions at a specific moment in time and not considering the spatial and temporal changes in sustainability practices or regulatory requirements. Lastly, the methodological approaches employed—such as bibliometric and systematic literature analysis—carry limitations such as dependence on database coverage, sensitivity to keywords, and interpretive judgments made by researchers during the selection process.
The measurement choices in the expert survey also entail certain methodological constraints. The use of a 3-point response scale in the initial screening of 177 indicators, while appropriate for supporting clear inclusion/exclusion decisions in a cognitively demanding task, may have compressed response variability and increased the risk of central tendency biases. This risk was mitigated by introducing a 5-point Likert scale for the subsequent importance rating of the reduced indicator set and by providing iterative feedback to experts, but it cannot be fully eliminated.
This study faces several inherent limitations related to the bibliometric and systematic literature review methods employed, as well as the methodological constraints associated with the interview stage. Similarly to other bibliometric mapping studies (e.g., Taques, 2025), relying solely on a single primary database, such as Web of Science, can introduce coverage bias. Each citation database has its own indexing practices and focuses on different disciplines, which may result in the exclusion of relevant work cited in other databases, such as Scopus or Google Scholar. Bibliometric indicators, including publication and citation counts, provide quantitative insights into scientific activity. However, they do not measure the qualitative significance or contextual influence of individual studies, which can result in an incomplete understanding of the intellectual landscape. Additionally, the systematic literature review is constrained by the specific search terms, inclusion and exclusion criteria, and screening decisions made beforehand. Although following structured protocols can guide this process, it is still influenced by interpretive judgement, which may result in unintentionally omitting relevant contributions. While automated tools (e.g., RAYYAN.AI) can assist in transparent screening, they do not completely eliminate subjective influences during eligibility assessments. The retrospective identification of studies through backward reference checking further illustrates how outcomes can be sensitive to decisions made during the full-text review. Recognising these limitations highlights potential avenues for future research, including the use of multiple data sources, alternative bibliometric indicators, and complementary qualitative syntheses to strengthen the robustness of evidence in this field.
These limitations do not undermine the value of the findings but highlight the need for continued refinement, contextualization, and broader empirical testing of the proposed framework across different institutional and regulatory settings.
Future research could examine the roles of investors and other external stakeholders in the development of reporting of non-financial information, the practical implementation of the NFPI set, and companies’ internal capabilities to collect, systematise, and evaluate NFPI—thereby refining the set itself. It could also analyse the demand for non-financial performance information across countries and firm categories, and evaluate the non-financial information presented in companies’ reports under different criteria. The comprehensive theoretical framework consisting of 177 non-financial performance indicators serves as a valuable resource for future research. This framework can be expanded and used as a foundation for other scholars to test, refine, or adapt to various sectors, countries, and organisational contexts, thereby broadening the applicability of this study. Future studies could also incorporate longitudinal and cross-country comparisons, expand expert samples, and test the framework in real organisational settings to better address temporal, sectoral, and spatial variations in NFPI adoption and relevance.
Unlike existing NFPI frameworks, which typically focus on isolated ESG dimensions or rely on secondary disclosure data, this study presents a unified and empirically grounded framework specifically developed for the manufacturing sector. The framework is developed through the systematic synthesis of the literature and validated with expert judgement, thus enhancing both the conceptual clarity and practical relevance of NFPI research. By combining thorough theoretical analysis with validation from practitioners, the proposed NFPI framework establishes a solid foundation for a more balanced assessment of non-financial performance. This framework not only holds significant potential for future research and supports managerial decision-making but also contributes to a robust foundation for the ongoing development of sustainability reporting and non-financial performance assessment in the manufacturing sector.
Supplementary Materials
The following supporting information can be downloaded at: https://www.mdpi.com/article/10.3390/admsci16010017/s1, Supplementary Materials File S1: Table S1. Detailed analysis of papers; Table S2. Theoretical Framework of the System of NFPI. Supplementary Materials File S2: Reports of Bibliometrix.
Author Contributions
Conceptualization, R.S., I.A., I.M., I.K., A.A.-E. and N.L.; Methodology, R.S., I.A., I.M., I.K., A.A.-E. and N.L.; Software, R.S., I.A., I.M., I.K., A.A.-E. and N.L.; Validation, R.S., I.A., I.M., I.K., A.A.-E. and N.L.; Formal analysis, R.S., I.A., I.M., I.K., A.A.-E. and N.L.; Investigation, R.S., I.A., I.M., I.K., A.A.-E. and N.L.; Resources, R.S.; Data curation, R.S., I.A., I.M., I.K., A.A.-E. and N.L.; Writing—original draft, R.S., I.A., I.M., I.K., A.A.-E. and N.L.; Writing—review & editing, R.S., I.A. and I.M.; Visualization, R.S., I.A., I.M., I.K., A.A.-E. and N.L.; Supervision, R.S., I.A. and I.M.; Project administration, I.M.; Funding acquisition, I.M. All authors have read and agreed to the published version of the manuscript.
Funding
This research was funded by research and development grant No. RTU-PA-2024/1-0039 under the EU Recovery and Resilience Facility funded project No. 5.2.1.1.i.0/2/24/I/CFLA/003 “Implementation of consolidation and management changes at Riga Technical University, Liepaja University, Rezekne Academy of Technology, Latvian Maritime Academy and Liepaja Maritime College for the progress to-wards excellence in higher education, science, and innovation”.
Institutional Review Board Statement
The study was conducted in accordance with the Declaration of Helsinki and approved by the Research Ethics Committee of the Research Ethics Committee of Riga Technical University, Code: No. 04000-10.2.3-e/2, Date 7 March 2025.
Informed Consent Statement
Informed consent was obtained from all subjects involved in the study.
Data Availability Statement
The data presented in this study are available on request from the corresponding author. The data are not publicly available due to confidentiality requirements and the need to protect the anonymity of the participating experts.
Acknowledgments
During the preparation of this manuscript, the authors used ChatGPT (version 5.2) and Grammarly to assist with proofreading and style revision. The authors have reviewed and edited the content and take full responsibility for the final version of the manuscript. RAYYAN.AI tool was used for literature screening, detecting duplicates, automated selection, and preparation of the PRISMA Flow Diagram.
Conflicts of Interest
The authors declare no conflicts of interest. The funders had no role in the design of the study; in the collection, analyses, or interpretation of data; in the writing of the manuscript; or in the decision to publish the results.
References
- Abulela, M. A. A., & Khalaf, M. A. (2024). Does the number of response categories impact validity evidence in self-report measures? A scoping review. SAGE Open, 14(1), 1–15. [Google Scholar] [CrossRef]
- Al-Mawali, H. (2023). Proposing a strategy map based on sustainability balanced scorecard and DEMATEL for manufacturing companies. Sustainability Accounting, Management and Policy Journal, 14(3), 565–590. [Google Scholar] [CrossRef]
- Alodat, A. Y., Salleh, Z., Hashim, H. A., & Sulong, F. (2024). Sustainability disclosure and firms’ performance in a voluntary environment. Measuring Business Excellence, 28(1), 105–121. [Google Scholar] [CrossRef]
- Aria, M., & Cuccurullo, C. (2017). Bibliometrix: An R-tool for comprehensive science mapping analysis. Journal of Informetrics, 11(4), 959–975. [Google Scholar] [CrossRef]
- Arianpoor, A., & Salehi, M. (2020). A framework for business sustainability performance using meta-synthesis. Management of Environmental Quality: An International Journal, 32(2), 175–192. [Google Scholar] [CrossRef]
- Aybek, E. C., & Toraman, C. (2022). How many response categories are sufficient for Likert type scales? An empirical study based on the Item Response Theory. International Journal of Assessment Tools in Education, 9(2), 534–547. [Google Scholar] [CrossRef]
- Barrios, M., Guilera, G., Nuño, L., & Gómez-Benito, J. (2020). Consensus in the Delphi method: What makes a decision change? Technological Forecasting and Social Change, 163, 120484. [Google Scholar] [CrossRef]
- Bassyouny, H., & Machokoto, M. (2024). Does negativity matter under the principle-based approach? Evidence from narrative reporting in the UK. International Journal of Accounting & Information Management, 32(2), 207–227. [Google Scholar] [CrossRef]
- Beleneși, M., Bogdan, V., & Popa, D. N. (2021). Disclosure dynamics and non-financial reporting analysis. The case of Romanian listed companies. Sustainability, 13(9), 4732. [Google Scholar] [CrossRef]
- Ben Saad, S., Laouiti, M., & Ajina, A. (2024). Corporate social responsibility and credit rating: Evidence from French companies. Review of Accounting and Finance, 23(3), 330–352. [Google Scholar] [CrossRef]
- Calvo-Centeno, E., Gragera-Pizarro, E., Romero-Ramos, E., & Ropero-Moriones, E. (2022). Comparative analysis of the contribution to the united nations sustainable development goals through non-financial information disclosed by IBEX 35 companies. Financial Internet Quarterly, 18(1), 16–30. [Google Scholar] [CrossRef]
- Castilla-Polo, F., Ruiz-Rodríguez, M. d. C., & Delgado-Marfil, C. (2020). La técnica Delphi para la validación de escalas de medida: Las variables innovación y reputación dentro de almazaras cooperativas. REVESCO. Revista de Estudios Cooperativos, 136, e71852. [Google Scholar] [CrossRef]
- Chi, D.-J., & Chu, C.-C. (2021). Artificial intelligence in corporate sustainability: Using LSTM and GRU for going concern prediction. Sustainability, 13(21), 11631. [Google Scholar] [CrossRef]
- Danisch, C. (2021). The relationship of CSR performance and voluntary CSR disclosure extent in the German DAX indices. Sustainability, 13(9), 4904. [Google Scholar] [CrossRef]
- Disli, M., Yilmaz, M. K., & Mohamed, F. F. M. (2022). Board characteristics and sustainability performance: Empirical evidence from emerging markets. Sustainability Accounting, Management and Policy Journal, 13(4), 929–952. [Google Scholar] [CrossRef]
- Donthu, N., Kumar, S., Mukherjee, D., Pandey, N., & Lim, W. M. (2021). How to conduct a bibliometric analysis: An overview and guidelines. Journal of Business Research, 133, 285–296. [Google Scholar] [CrossRef]
- Erena, O. T., Kalko, M. M., & Debele, S. A. (2022). Corporate governance mechanisms and firm performance: Empirical evidence from medium and large-scale manufacturing firms in Ethiopia. Corporate Governance: The International Journal of Business in Society, 22(2), 213–242. [Google Scholar] [CrossRef]
- European Parliament and Council of the European Union. (2022). Directive (EU) 2022/2464 of the European parliament and of the council of 14 December 2022 amending Regulation (EU) No 537/2014, directive 2004/109/EC, directive 2006/43/EC and directive 2013/34/EU, as regards corporate sustainability reporting. Official Journal of the European Union Law, 322, 15–80. Available online: http://data.europa.eu/eli/dir/2022/2464/oj (accessed on 9 December 2025).
- Gadhoum, M. A., Muhamad Sori, Z. B., Ramadilli, S., & Mahomed, Z. (2022). Communicated ethical identity disclosure (CEID) of Islamic banks under the AAOIFI and IFRS accounting regimes: A global evidence. Journal of Islamic Accounting and Business Research, 13(5), 737–759. [Google Scholar] [CrossRef]
- Ghosh, S., Pareek, R., & Sahu, T. N. (2024). Do carbon performance and disclosure practices effect companies’ financial performance: A non-linear perspective. Asia-Pacific Financial Markets, 31(3), 733–754. [Google Scholar] [CrossRef]
- Global Reporting Initiative. (2021). GRI standards. Available online: https://www.globalreporting.org/standards (accessed on 9 December 2025).
- Gong, Y., & Girma, S. (2021). Top management gender diversity and performance: In search of threshold effects. Cambridge Journal of Economics, 45(1), 109–127. [Google Scholar] [CrossRef]
- Guizani, M., & Abdalkrim, G. (2023). Does gender diversity on boards reduce the likelihood of financial distress? Evidence from Malaysia. Asia-Pacific Journal of Business Administration, 15(2), 287–306. [Google Scholar] [CrossRef]
- Gutiérrez-Ponce, H., Chamizo-González, J., & Arimany-Serrat, N. (2022). Disclosure of environmental, social, and corporate governance information by Spanish companies: A compliance analysis. Sustainability, 14(6), 3254. [Google Scholar] [CrossRef]
- Hamad, H. A., & Cek, K. (2023). The moderating effects of corporate social responsibility on corporate financial performance: Evidence from OECD countries. Sustainability, 15(11), 8901. [Google Scholar] [CrossRef]
- Hálek, V., Borkovcová, A., & Hašek, F. (2020). Non-financial indicators in the valuation process—Actual trends. E+M Ekonomie a Management, 23(1), 60–74. [Google Scholar] [CrossRef]
- International Organization for Standardization (ISO). (2021). Environmental management—Environmental performance evaluation—Guidelines (Standard ISO 14031:2021). International Organization for Standardization (ISO).
- Juliana, C., Gani, L., & Jermias, J. (2021). Performance implications of misalignment among business strategy, leadership style, organizational culture and management accounting systems. International Journal of Ethics and Systems, 37(4), 509–525. [Google Scholar] [CrossRef]
- Koo, M., & Yang, S.-W. (2025). Likert-type scale. Encyclopedia, 5(1), 18. [Google Scholar] [CrossRef]
- Krasodomska, J., & Zarzycka, E. (2021). Key performance indicators disclosure in the context of the EU directive: When does stakeholder pressure matter? Meditari Accountancy Research, 29(7), 1–30. [Google Scholar] [CrossRef]
- Kumar, S., Lim, W. M., Sureka, R., Jabbour, C. J. C., & Bamel, U. (2024). Balanced scorecard: Trends, developments, and future directions. Review of Managerial Science, 18, 2397–2439. [Google Scholar] [CrossRef]
- Kyere, M., & Ausloos, M. (2021). Corporate governance and firms’ financial performance in the United Kingdom. International Journal of Finance and Economics, 26, 1871–1885. [Google Scholar] [CrossRef]
- Lombardi, R., Schimperna, F., Paoloni, P., & Galeotti, M. (2022). The climate-related information in the changing EU directive on non-financial reporting and disclosure: First evidence by Italian large companies. Journal of Applied Accounting Research, 23(1), 250–273. [Google Scholar] [CrossRef]
- Loprevite, S., Raucci, D., & Rupo, D. (2020). KPIs reporting and financial performance in the transition to mandatory disclosure: The case of Italy. Sustainability, 12(12), 5195. [Google Scholar] [CrossRef]
- Melović, B., Dabić, M., Vukčević, M., Ćirović, D., & Backović, T. (2021). Strategic business decision making: The use and relevance of marketing metrics and knowledge management. Journal of Knowledge Management, 25(11), 175–202. [Google Scholar] [CrossRef]
- Mishchuk, H., Štofková, J., Krol, V., Joshi, O., & Vasa, L. (2022). Social capital factors fostering the sustainable competitiveness of enterprises. Sustainability, 14(19), 11905. [Google Scholar] [CrossRef]
- Molenda, P., Groneberg, H., Schötz, S., & Döpper, F. (2023). Resilience balanced scorecard: Measuring resilience of manufacturing companies at multiple levels. Procedia CIRP, 120, 189–194. [Google Scholar] [CrossRef]
- Noja, G. G., Baditoiu, B. R., Buglea, A., Munteanu, V. P., & Gligor Cimpoieru, D. C. (2024). The impact of environmental, social and governance policies on companies’ financial and economic performance: A comprehensive approach and new empirical evidence. E+M Ekonomie a Management, 27(1), 121–144. [Google Scholar] [CrossRef]
- Nworie, J. (2011). Using the Delphi technique in educational technology research. TechTrends, 55(5), 24–30. [Google Scholar] [CrossRef]
- Özer, G., Aktaş, N., & Çam, İ. (2023). Environmental, social, and governance (ESG) scores and financial performance of publicly listed companies in Turkey. Eskişehir Osmangazi Üniversitesi İktisadi ve İdari Bilimler Dergisi, 18(2), 337–353. [Google Scholar] [CrossRef]
- Page, M. J., McKenzie, J. E., Bossuyt, P. M., Boutron, I., Hoffmann, T. C., Mulrow, C. D., Shamseer, L., Tetzlaff, J. M., Akl, E. A., Brennan, S. E., Chou, R., Glanville, J., Grimshaw, J. M., Hróbjartsson, A., Lalu, M. M., Li, T., Loder, E. W., Mayo-Wilson, E., McDonald, S., … Moher, D. (2021). The PRISMA 2020 statement: An updated guideline for reporting systematic reviews. International Journal of Surgery 88, 105906. [Google Scholar] [CrossRef]
- Paula Monteiro, A., Vale, J., Leite, E., Lis, M., & Kurowska-Pysz, J. (2022). The impact of information systems and non-financial information on company success. International Journal of Accounting Information Systems, 45, 100557. [Google Scholar] [CrossRef]
- Petryk, O., Basok, A., Marenych, T., Yatsenko, N., & Kalinichenko, S. (2021). Management report as a component of nonfinancial reporting in Ukraine: Theory and practice of drafting. Independent Journal of Management & Production, 12(3), s054–s070. [Google Scholar] [CrossRef]
- Prayanthi, I., & Budiarso, N. S. (2022). The effect of social responsibility disclosure on financial performance in the COVID-19 pandemic era. Cogent Business & Management, 9(1), 2147412. [Google Scholar] [CrossRef]
- Raucci, D., & Tarquinio, L. (2020). Sustainability performance indicators and non-financial information reporting. Evidence from the Italian case. Administrative Sciences, 10(1), 13. [Google Scholar] [CrossRef]
- Richard, G., & Odendaal, E. (2021). Credibility-enhancing mechanisms, other than external assurance, in integrated reporting. Journal of Management and Governance, 25(1), 61–93. [Google Scholar] [CrossRef]
- Saini, E., Singhania, M., Hasan, M., Yadav, M. P., & Abedin, M. Z. (2022). Non-financial disclosures and sustainable development: A scientometric analysis. Journal of Cleaner Production, 381(Pt 1), 135173. [Google Scholar] [CrossRef]
- Salehi, M., & Arianpoor, A. (2021). The relationship among financial and non-financial aspects of business sustainability performance: Evidence from Iranian panel data. The TQM Journal, 33(6), 1447–1468. [Google Scholar] [CrossRef]
- Sarkar, A., Wang, H., Rahman, A., Memon, W. H., & Qian, L. (2022). A bibliometric analysis of sustainable agriculture: Based on the Web of Science (WOS) platform. Environmental Science and Pollution Research, 29, 38928–38949. [Google Scholar] [CrossRef]
- Sánchez-Alegría, S., Lizarraga-Dalloa, F., & Marín-Vinuesa, L. M. (2022). Is quality management a competitive advantage? A study after the Spanish financial crisis in the furniture industry. Total Quality Management & Business Excellence, 33(11–12), 1344–1365. [Google Scholar] [CrossRef]
- Serbinenko, I., & Ludviga, I. (2025). Operationalising organisational performance in the scope of Industry 4.0 and Industry 5.0 in manufacturing companies. Sustainability, 17(14), 6314. [Google Scholar] [CrossRef]
- Shang, Z. (2023). Use of Delphi in health sciences research: A narrative review. Medicine, 102(7), e32829. [Google Scholar] [CrossRef]
- Sun, S., Schmidt, K. M., & Henry, T. R. (2025). Don’t let your Likert scales grow up to be visual analog scales: Understanding the relationship between number of response categories and measurement error. Psychological Methods. Advance online publication. [Google Scholar] [CrossRef]
- Sustainability Accounting Standards Board. (2022). SASB standards overview. Available online: https://sasb.ifrs.org/standards (accessed on 9 December 2025).
- Taques, F. H. (2025). Mapping scientific knowledge on patents: A bibliometric analysis using PATSTAT. FinTech, 4(3), 32. [Google Scholar] [CrossRef]
- Traxler, A. A., Greiling, D., Freinbichler, M., & Mayerhofer, P. (2023). Does the directive of the European Union on disclosure of non-financial and diversity information improve reporting? Journal of Accounting & Organizational Change, 19(6), 70–90. [Google Scholar] [CrossRef]
- Williamson, C., Kelly, P., Tomasone, J. R., Bauman, A., Mutrie, N., Niven, A., Richards, J., & Baker, G. (2021). A modified Delphi study to enhance and gain international consensus on the Physical Activity Messaging Framework (PAMF) and Checklist (PAMC). International Journal of Behavioral Nutrition and Physical Activity, 18(1), 108. [Google Scholar] [CrossRef] [PubMed]
- Wu, N., Zhao, J., Musah, M., Ma, Z., Zhang, L., Zhou, Y., Su, Y., Agyemang, J. K., Asiamah, J. A., Cao, S., Yao, L., & Li, K. (2023). Do liquidity and capital structure predict firms’ financial sustainability? A panel data analysis on quoted non-financial establishments in Ghana. Sustainability, 15(3), 2240. [Google Scholar] [CrossRef]
- Xu, X., & Zhao, H. (2024). An empirical study on ESG evaluation of Chinese energy enterprises based on high-quality development goals—A case study of listed company data. Sustainability, 16(15), 6602. [Google Scholar] [CrossRef]
- Yawson, R. M., & Paros, A. K. B. (2023). Systems perspective of the use of the balanced scorecard for organization development and change. SAGE Open, 13(4), 1–15. [Google Scholar] [CrossRef]
- Zarzycka, E., & Krasodomska, J. (2022). Non-financial key performance indicators: What determines the differences in the quality and quantity of the disclosures? Journal of Applied Accounting Research, 23(1), 139–162. [Google Scholar] [CrossRef]
- Zimon, G., Arianpoor, A., & Salehi, M. (2022). Sustainability reporting and corporate reputation: The moderating effect of CEO opportunistic behavior. Sustainability, 14(3), 1257. [Google Scholar] [CrossRef]
Disclaimer/Publisher’s Note: The statements, opinions and data contained in all publications are solely those of the individual author(s) and contributor(s) and not of MDPI and/or the editor(s). MDPI and/or the editor(s) disclaim responsibility for any injury to people or property resulting from any ideas, methods, instructions or products referred to in the content. |
© 2025 by the authors. Licensee MDPI, Basel, Switzerland. This article is an open access article distributed under the terms and conditions of the Creative Commons Attribution (CC BY) license.