Abstract
Mainstreaming gender analysis into all aspects of policy making, including infrastructure and economic policy, is a key aspect to achieving gender equality. The main objective of this paper is to examine the impact of several public infrastructures on well-being by gender, applying the Capability and Subjective Well-being approaches. An index of access to infrastructure is constructed and its effect on well-being is estimated using a new survey dataset from Spain. The results from the logistic regression model show that access to infrastructure positively affects subjective well-being, particularly of female respondents. All dimensions of infrastructure matter more for women’s well-being than men’s. Important differences in the impact on well-being by the types of infrastructures analyzed and the impact differs significantly by age are obtained. The findings suggest that designing public infrastructure policies can contribute to reducing gender well-being gap.
Keywords:
benefits of gender equality through infrastructure provision survey; capabilities; gender; indicators; infrastructure; logistic regression; subjective well-being JEL Classification:
C51; I31; J16
1. Introduction
Urban planning and communities are much more than just housing areas where people sleep and eat. Since a city is the habitat where the inhabitants carry out most of their activities (Muxí et al. 2011), it has a direct impact on its inhabitants’ well-being (Parikh et al. 2014; Ravagnan et al. 2022). In this sense, there is a growing consensus that urbanization offers enormous potential to improve people’s lives, but also that inadequate urban management, often based on inaccurate or biased information and perceptions, can turn opportunity into disaster (Amoroso 2020; De Henau and Himmelweit 2020; Gutiérrez-Mozo et al. 2020; Gutiérrez-Mozo 2021; Parra-Martínez et al. 2021; Levin and Faith-Ell 2019; Sultana 2020; Truelove and Ruszczyk 2022; UNFPA 2007).
The influence on infrastructure on life subjective well-being is studied in several papers (e.g., Asadullah and Chaudhury 2012) include a village level composite index of infrastructure and report a positive effect on lie satisfaction scores in Bangladesh. Although there is little research that analyses the effect of urban policies on people’s well-being, most of it stresses the differences based on gender (e.g., Bofill 2012; Sánchez de Madariaga 2004a, 2004b; Sánchez de Madariaga and Novella 2019; Sánchez de Madariaga and Neuman 2020; Tacoli 2012; Carpio-Pinedo et al. 2019; Morgan et al. 2020; Siemiatycki et al. 2020). Sánchez de Madariaga (2004a, 2004b) analyses how the changes in the gender relationships and the traditional work division between men and women have changed the needs for family support services (e.g., senior centers, nursery homes) in the occidental countries. This change has given a bigger relevance to urban design, since it becomes a key element for men and women to reach a state of well-being. More recently, Bofill (2012) points out how communication connections, both transport and media communications, have been designed attending only to men’s needs and ignoring women’s’ needs. Meanwhile, Tacoli (2012) posits that urbanisation does not necessarily result in a more equitable distribution of wealth and well-being. For example, for women, urbanisation is associated with greater access to employment opportunities, lower fertility levels and increased independence. Ferguson and Harman (2015) critized the World Bank’s current infrastructure strategy from a feminist perspective, arguing that failures to define gender and set meaningful targets and indicators have meant that gender has not been integrated into the implementation of infrastructure projects.
These researchers defend the need of integrating the gender dimension in public infrastructures to reach the desired socio-economic development.
There are two reasons that justify the need of this study. In the first place, although previous research mentioned that the difference between men and women has its origin in their different roles, they only focus on gender, ignoring the roles that citizens perform. Second, there are different well-being theories (e.g., subjective well-being and the theory of capabilities approach) which suggest different measures for well-being. Hence, there is no consensus on how to measure citizens’ well-being. Therefore, given the fact that the gender imbalance is based on the differentiated roles assigned to men and women, and that there are different theories which suggest different indicators to measure citizens well-being, this study intends to close these research gaps with an empirical study in which (1) different well-being theories are integrated, (2) a measurement of well-being based on the capabilities approach is used and (3) the differences are analyzed based on both citizens’ roles and gender.
In sum, an attempt is made to estimate the importance of basic infrastructures (nursery schools up to 5 years; centers for elderly; health centers; sidewalks and pedestrians paths; street lighting and parks and green areas) in the development of several key capabilities from a gender perspective. The method used combines the Capability Approach and Subjective Well-Being theories and allows analyzing the impact the infrastructures have on well-being of individuals and studying whether the improvement of infrastructures may contribute to gender equality.
In the next section, a review of the well-being theories’literature and its relationship with urban policies and its incorporation within this analysis is presented. In addition, in this section the research focuses on the relevance of the roles versus gender. Section 3 describes the methodology and data used, the principal results are given in Section 4 and conclusions are presented in Section 5. Finally, Section 6 concludes.
2. Literature Review
2.1. Subjective Well-Being, Capability Approach Theories and Urban Policies
Citizens’ well-being is becoming a goal for many governments of developed countries. According to the model pursued by the United Nations (UNDP 2010), human development and achievements must be measured by considering citizens’ living standards, well-being, equality and capability development. Consequently, it is becoming more common the measurement of citizens’ well-being by governments in order to take better decisions to generate a positive impact on their citizens’ satisfaction levels. Despite the great effort made to measure countries’ development, including a well-being indicator, there is no consensus related to which well-being measurement is better to use. In fact, different theories make completely different suggestions. In Table 1, two of these theories, subjective well-being theory and capability approach theory, are compared, which makes it possible to see their differences.

Table 1.
Differences between two well-being theories.
Veenhoven (1991, 1996) considers that the best method for finding out about a person’s well-being is to ask him or her directly; in other words, to ask about well-being concept without being judgemental, as it is the people that experience well-being in a vital way. Therefore, the subjective well-being (SWB) theory states that the best way to know about well-being is by directly asking people. In this sense, the direct question provides observations on the well-being concept and its measurement. This theory has been defended by numerous researchers, even in the context of urban policies (e.g., Dolan et al. 2008; Marans and Stimson 2011; Kweon and Marans 2011; McCrea et al. 2011; Bergstad et al. 2012). For example, previous research using this theory suggests that reducing community-provided resources would have negative effects on SWB. One such resource is transport services affecting the quality of daily travel (Ettema et al. 2010; Bergstad et al. 2011; Diener et al. 2009).
As for the capability approach (CA) theory, it focuses on the empowerment of the citizens capabilities (Sen 1980, 1985a, 1985b; Nussbaum 2000, 2003, 2009; Deneulin 2009), rather than on the available resources. Hence, it analyzes public policies to identify their impact on human capabilities. In order to the define CA and measure the well-being in a society, Nussbaum (2009) elaborated a list of 10 capabilities, and also Robeyns (2005) a list of 14. Following this theory, Villota et al. (2009) study suggested the need for recognizing the differentiated situations of men and women in relation to their well-being and capability development when it comes to deciding on public policies.
Regarding infrastructures, Sen (2008, 2009) warned that urban planning is a little-researched field but it is strongly relevant to the capability approach. Moreover, as suggested by Irish (2014), although conventionally, urban and environmental policy is in a separate category than social and cultural policy and rarely appears at all. However, all four are essential to human well-being.
Therefore, as Table 1 shows, comparing the theories of SWB (Veenhoven 1991, 1996; Rojas 2008, 2013; Rojas and Veenhoven 2013) and CA1, Sen (1980, 1985a, 1985b); Nussbaum (2000, 2003, 2009) put forward different sets of indicators for evaluating the countries’ development.
As shown in Figure 1, the conceptual model presented in this paper is original since it is a combination of both the SWB and CA theories. Based on the CA theory, 10 capabilities are identified: Physical and mental health, Integrity and security, Social Relationships, Education and culture, Unpaid work (Care and domestic works), Labor market, Environment, Mobility Leisure, and Emotions. The elaborated list has been pre-selected by Nussbaum (2011) and Robeyns (2005) to a total of 10 capabilities based on the work of Nussbaum and Robeyns. In addition, based on the SWB theory, a subjective indicator of well-being is used. This allowed the use of indicators, which provide direct information on the well-being, the satisfaction level of the individual and collective needs and freedoms they might enjoy by asking directly to the citizens instead of using a theoretical perspective.
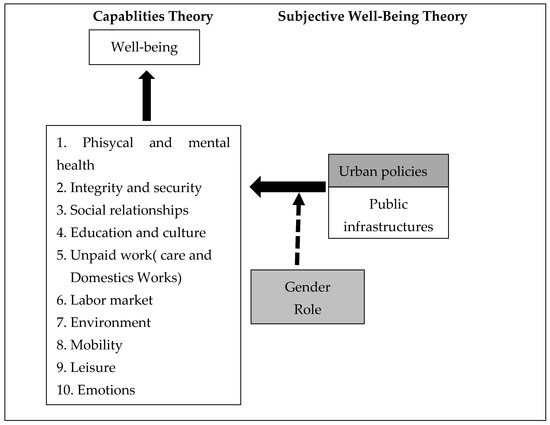
Figure 1.
Conceptual model. Source: Own elaboration.
Recent research points out that an improvement in basic capabilities could supply a greater objective and subjective well-being (Muffels and Headey 2013). On the other hand, an improvement in basic infrastructures increases the subjective well-being and the quality of life (Wang 2022) due to its positive influence on a range of capabilities. For instance, improvements in Public Transport increases the subjective well-being as several capabilities related to mobility, improvement of economic situation, access to a job, leisure, social equality or social relationships (e.g., Banister and Bowling 2004; Cuthill et al. 2019; Delbosc and Currie 2011; Delbosc 2012; Mollenkopf et al. 2005; Spinney et al. 2009; Stanley et al. 2011; Vella-Brodrick and Stanley 2013).
Although traditionally urban planning has not been related to well-being, the fact is that infrastructures are fundamental to meet citizens structural needs (Wang 2022). Urban policies can provide citizens with the structural conditions that not only allow but also promote a new socio-economic model no gender differences (Borderías and Carrasco 1994). In this sense, Bofill (2012) suggest that urban planning must take into account not only the needs derived from paid work, but also unpaid work, education, leisure, physical and mental health or personal autonomy, among others.
2.2. Role, Gender and Urban Policies
Some researchers (e.g., Villota et al. 2009) suggest the need of analyzing distinct situation of women and men in terms of well-being and development of their capabilities as a key input in the public policies decision process. One step further is taken by analyzing the different evaluations not only based on the gender but also on the citizens role distinguishing among: fathers, mothers, and children (sons/daughters). In order to do this, the literature that relates to gender and how it links to urban policies has been first reviewed.
There are many architectural studies that have examined urban planning (Hayden 1981; Birch 1982; Sánchez de Madariaga 2004a, 2004b; Sánchez de Madariaga and Novella 2019; Sánchez de Madariaga and Neuman 2020; Rodríguez-García and Donati 2021), city (Bofill 1998) and housing design, as well as transport and mobility (Miralles-Guasch and Martínez 2012; Miralles-Guasch et al. 2016) from a gender point of view. Meanwhile, the economic literature shows that there is little attention paid to the sphere of public actions and policies on infrastructure, as there are few studies dealing with this issue. Further, little attention is paid to public infrastructures from a gender perspective in developed countries. In fact, there are large differences in women’s needs and perceptions should be expected compared to results in non-developed countries. One of the reasons why gender has been ignored in the field of urban policies is because that area has traditionally been a man’s domain. Further, the total percentage of women in the students, professors, researchers and managers in technological careers is low (Agudo and Sánchez de Madariaga 2011), which may be extrapolated to their presence in professional associations and in the decision-making public service. Therefore, there is a weak participation of women in the identification, planning, execution, monitoring and assessment of policies, programs and projects on infrastructure development.
More recently, some research on the expenditure on infrastructures from the gender perspective has been published (Alarcón and Colino 2011; Alarcón et al. 2012; Alarcón and Colino 2013; Alarcón-García 2018; Alarcón-García et al. 2020a, 2020b, 2020c, 2020d).
Previous studies that have related gender with urban policies note that urban planning from the gender perspective results in more accessible, comfortable and safe cities (Bofill 2012). Less time is wasted and men and women, and also children, become more autonomous in labour-market incorporation. Additionally, public urban policies are expected to play a key role in the existence or absence of changes in the current gender division of labour or the right to health and leisure, among others.
The reasoning behind the assumptions of the aforementioned studies is that men and women have different duties, opportunities, needs and interests. In fact, women have an excessive time load because of their different roles: reproduction, production and community. Therefore, although there are no studies, to our knowledge, that relate role and urban policies, the same reasoning should apply here. That is, an urban policy is going to have a different impact on a mother than in a young daughter. Both are women, but they have different needs, duties, opportunities and interests. Previous studies usually use the term “female role” but it is believed that the big change in the duties and therefore in their needs comes with fatherhood. Both fathers and mothers have different needs compared to young children who are still in education.
3. Materials and Methods
3.1. Measurement Variable and Data Collection
The data for measuring the impact of infrastructure on the well-being carried out in this paper is from opinions and attitudes shown by the citizens regarding the well-being provided by certain public infrastructures.
All variables at an individual level come from the survey about “Public infrastructures and gender” created and developed at Fiscal Observatory of the University of Murcia (FOUM) in 2015. In this survey population both genders, over the age of 18 and are residents from the national territory are represented with a total of 1200 individuals. The survey was designed, and the subsequent field work was carried out, in the frame of a research project funded by the Institute for Women of the Ministry of Equality of the Government of Spain in 2014, constituting the pilot survey for the subsequent research work carried out for EIGE in 2016 in the 28 countries of the EU2. In both cases, the national and European research work was led by some of the authors of this paper. The survey gathers up information on the following aspects:
- General Background Information: gender, age, place of living and employment status.
- The perception of these individuals about how accessible they find for them each infrastructure. The infrastructures considered are: nursery schools up to 5 years; centers for elderly; health centers; sidewalks and pedestrians paths; street lighting and parks and green areas.
- The value that different infrastructures have in the main capabilities gathered from the literature of well-being. The capabilities considered are: physical and mental health; personal safety; social relationships; education; care and domestic work; employment; pleasant and healthy environment; mobility; leisure and emotions.
- The grade of satisfaction individuals feel about their lives.
- Other aspects such in/dependent living with the respondents, time use, education and income level, etc.
The data for the individual-specific independent variables used in the econometric model come from several questions of the survey and include:
- The sex of the respondent (Gender).
- The age in years (Age).
- The importance of the access to the infrastructure h is for his/her capability k, (S_hk). As above indicated, the capabilities considered are (k = 1 to 10): (1) physical and mental health; (2) personal safety; (3) social relationships; (4) education; (5) care and domestic work; (6) employment; (7) pleasant and healthy environment; (8) mobility; (9) leisure and (10) emotions. The variable Shk is the score of infrastructure h at capability k. This variable takes its values according to the answer to the question Ph_k, which asked the respondent how he/she considers that the infrastructure h is important for his/her capability k. Question Ph_k states as follows: rate from 1 to 5 how you consider that infrastructure h is important for your well-being k, knowing that 5 = very important and 1 = not important at all.
- The access to infrastructure h (A_h) corresponds to the value obtained in question P6.h, which requires an assessment from 1 to 5 of the satisfaction with respect to the current allocation of the infrastructure h in the place of residence of the respondent. 1 = not all satisfied and 5 = very satisfied.
- The subjective well-being (SWB), this variable is constructed on the basis of the answers of the respondents to Question P68, which states: “Could you please tell me on a scale of 1 to 10 where 1 means that you are not satisfied at all and 10 means that you are very satisfied how satisfied are you with the infrastructure provided by public Administration”. The variable used is a dichotomous variable taking value 0 for the respondents who choose Answer 1, 2, 3, 4 or 5 to this question and 1 if the Answer is 6, 7, 8, 9 or 10.
- Education (Education).
- Labour situation (Lab_sit).
- Income (Income).
Table 2 describes the variables and their coding.
Table 2.
Description of variables used in the econometric model.
3.2. Demographic Information of the Data
The characteristics of the survey attending to the distribution by sex and age of individuals surveyed is shown in Figure 2. It is observed that 52.4% corresponds to women, being those from 40 to 64 years old the ones with more representation in the sample, being 21.3% of all. The greatest difference of representation by sex is among the people from 65 years old and elders, where women rose up to 14% of the total of people surveyed, being 4 points over men. It is only in the range between 18 and 39 years old where men have more participation than women.
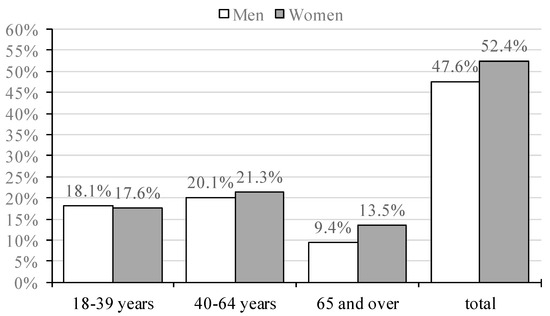
Figure 2.
Distribution by sex and age of the respondents. Source: Own elaboration based on FOUM.
Table 3 shows the statistical summary of the individual demographic variables.
Table 3.
Statistical summary of the demographic variables.
3.3. Methodology
3.3.1. The Model of the Index of Well-Being
In order to measure the impact of infrastructure on well-being by gender, the method proposed by Alarcón and Ayala-Gaytán (2018) is used. This method aims at assessing the impact of access to infrastructure on the subjective well-being of men and women through capabilities. The basic intuition of this method is to assume that estimating the influence of access to infrastructure on capabilities may be used to calculate the effect of this access on subjective well-being. Therefore, the effect of access to infrastructure on subjective well-being is calculated via its impact on the capabilities set. In order to address this effect, an index of the effect of access and importance of infrastructure on subjective well-being through the development of basic capabilities is built.
The underlying conceptual model considers access to infrastructure as an exogenous variable, while the endogenous variables are the capabilities and subjective well-being. Access to infrastructure is a good measure of the quantity of infrastructure available to citizens. The other important variable is quality of infrastructure; however, the Survey trunks the cases when the individuals have not used the different types of infrastructure in the recent past, making it impossible to use it especially for specific gender and age groups. The meaning of the proposal is that access to infrastructure helps individuals achieve more capabilities, for women in particular, which ought to result in higher levels of life satisfaction relating their economic situation, relationships and subjective well-being in general. This requires estimating two types of parameters. The first corresponds to those that measure the impact that the infrastructure h has on the k capacity, denoted by . The second type is formed by the coefficients that capture the influence of an increase of the different capabilities in subjective well-being, SWB, denoting the coefficient for the capability k. Therefore, it is considered that infrastructure affects well-being indirectly through the capabilities, and the measure proposed to estimate the effect of access to infrastructure on well-being is the product of the two types of estimated parameters, which is, . The aforementioned index is constructed from these elements, whose detailed description and algebraic formulation is presented in the next subsection.
3.3.2. Mathematical Formulation of the Well-Being and Infrastructure Index from a Gender Perspective
In order to measure the impact that infrastructures have on the well-being of individuals, the Well-being and Infrastructure Index is used. The procedure followed for the construction of this index is described below.
Step (1)
To estimate the weights,, of the infrastructure h in the capability k, the scores of the question Ph.k are used. Let be the score of the importance of the infrastructure h in the capability k, which takes values from 1 to 10. Then, these values are transformed so that they vary in the range from 0 to 1 using the following expression:
Then, a coefficient is calculated, which measures the “level” that is reached in the k capability caused by access to infrastructures. As each infrastructure affects different capabilities, this value is calculated by means of the weighted average (using the weights) of the access that the individuals have to the different infrastructures. This is done by the equation:
where is the score of access to the infrastructure h, which as indicated above, is obtained in the question P6h.
Step (2)
In this step, the coefficients that relate the capabilities to the subjective well-being are obtained. For this, for each capability k, logistic regression models are carried out in which the dependent variable is subjective well-being, SWB, and the independent variables are and a vector of control variables. Thus, this process is carried out by means of a logistic regression analysis, estimated in a GLM framework, using a binomial link function.
The resulting logistic model is:
where π is the mean function, is the ith element of the dependent variable SWB (the subjective well-being), is the ith row of the matrix containing the total set of explanatory variables used, α is a constant, is a constant and γ is a vector of constants, and i = 1, 2, …, 1200 is the individual to which the observation belongs. is a vector of socio-economic control variables: income, education and labour situation. The dependent variable, , is constructed from the survey data, as detailed in Section 3.1. Its description, as well as that of the independent variables, is presented in Table 2.
Step (3)
In this final step of construction of the index, the weights are multiplied by the coefficients of the regression. It can be considered that a measure of the contribution to the subjective well-being of the infrastructure h through the capability k, is given by:
Finally, the total effect on the subjective well-being of access to the infrastructure h is obtained by adding the values obtained in Equation (4) for all the capabilities. Therefore, the measure of this effect, the index, is calculated as follows:
Finally, to facilitate the interpretation of the index, the values are normalized so that 100 corresponds to the average index for the whole sample.
3.4. Data Analysis
Figure 3 shows the distribution of responses to the degree of well-being provided by the infrastructures made by the Public Administrations to the respondents (question 68). This variable measures the degree of well-being of respondents on a scale from 1 to 10, where 1 means they are “not satisfied at all” and 10 means they are “very satisfied”. Within a larger category, “not satisfied at all or little”, all responses from “1 to 5” are considered. In a larger category, “very satisfied”, all responses from “6 to 10” are considered.
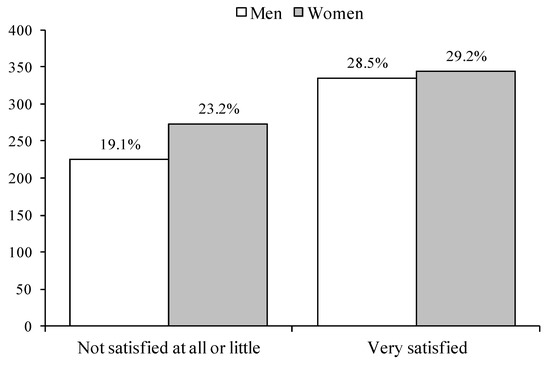
Figure 3.
Distribution of the variable Subjective Well-being by sex of the respondents. Source: Own elaboration based on FOUM.
As observed, 42% of the respondents declare that they are “not satisfied or little” with the infrastructures provided by the Public Administration, being women 4 percentage points over men. However, those who declare that they are “very satisfied” represent 58%, in which women obtain a percentage very similar to that of men, 29.2% and 28.5%, respectively.
Table 4 shows the statistical summary of responses to the to the degree of well-being provided by the infrastructures made by the Public Administrations to the respondents and the satisfaction regarding to the current allocation of the infrastructures analyzed.
Table 4.
Statistical summary of the variables Subjective Well-being and Access to the infrastructures.
In summary, the survey allows to make use of respondents’ assessment about the importance of each infrastructure in each dimension of well-being. In this regard, respondents were asked to rank the importance of each infrastructure from 1 (not important) to 5 (very important) in terms of how helpful each one was in their everyday life or in making neighborhoods more friendly. The infrastructures can be considered as conversion factors affecting the conversion of capabilities into observable functionings and as well as having a direct effect on the development of the different dimensions of well-being.
4. Results
The results of the survey showed the existence of gender differences regarding the importance assigned to the infrastructure affecting different dimensions of well-being.
Considering the importance of each infrastructure on the different capabilities by gender (Figure 4), the survey provides the following results. Regarding the impact of nursery schools up to 5 years infrastructure, women consider this one to be the most important on average in relation to education, whereas for men there was a similar impact on education, social relationships and physical and mental health. More accurately, for women, nursery schools are more relevant (from highest to lowest importance) in education, physical and mental health and environment, whereas men consider education and physical and mental health to be affected to the same extent by nursery schools.
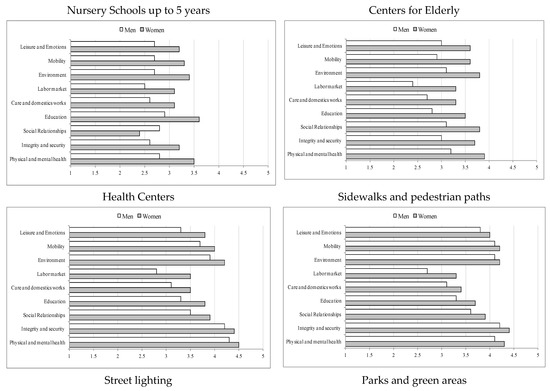
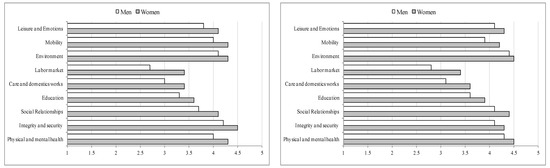
Figure 4.
Importance of infrastructure on capabilities by gender. Source: Own elaboration based on FOUM.
The centers for the elderly infrastructure have the highest importance for physical and mental health and environment for both women and men, with a greater average level of importance for women than for men. The observed difference about gender can be related to women’s higher life expectancy and their higher likelihood to survive their partners.
The main results of the estimation of the subjective well-being index are exposed in Table 5 (the significance of the coefficients of the regressions used to construct the index is shown in the Appendix A). Each row shows the subjective well-being index for men, women and the difference between them. The subjective well-being index is presented as a percentage of the average valuation of all the infrastructures on the sample and reaches the value 0.53. All the indexes have a value greater than zero, reflecting a positive assessment of the different types of infrastructure on the well-being of citizens, whether in the case of men or women, showing a positive correlation between the infrastructure provided by Public Administration and the level of subjective well-being.
Table 5.
Subjective Well-being Index for infrastructure from a gender perspective (mean = 100).
According to the construction procedure of the index, its values indicate the degree of well-being provided respondents by accessing to the different Public Administrations’ infrastructures and show the increase in well-being generated from an increase in one additional unit for each type of infrastructure.
5. Discussion
The main results point out that the infrastructures that provide greater and lesser well-being for both genders are parks and green areas and nursery schools up to 5 years, respectively. However, the infrastructures that provide greater differences in the well-being to women in comparison with men are those related to centers for elderly (24.2 pp) and nursery schools up to 5 years (19.3 pp). This finding is consistent with the fact that lower availability of nursery schools up to 5 years is associated with lower participation of women in the labor market. Nursery schools up to 5 years services can also play a positive role in gender equality as they promote the distribution of care work and promote fathers’ participation in care activities as well as contributing to increasing fathers’ positive parenting attitudes.
On average, women have higher indexes than men, which means that the provision of infrastructure by Public Administrations generates greater well-being for women and, therefore, an increase in public investment in this type of infrastructure benefits women more. Men’s indexes are in the range 60.9–119.9 while for women that range is set at 80.3 and 132.1. The indexes of women are higher in all types of infrastructure, with differences between 14.1 pp and 24.2 pp.
The results by age range show that the indexes of young women are very high in the case of infrastructures relating to design of public spaces in parks and green areas or street lights. Women of childbearing age and with children benefit more from investing in these public services. They also point out that the provision of street lights is more important than the provision of sidewalks and pedestrian paths while for men it is the opposite. Nursery schools are more important than centers for the elderly among young women. In general, younger women have a greater improvement in well-being due to a greater access to infrastructure.
Regarding the age range between 40 and 64 years old, for both men and women lower index values than the average are registered with the exception of access to infrastructure park and green areas and street lighting for women. Sidewalks and pedestrian paths show low index values, with a slight advantage for women.
In the age range of the elderly, women obtain greater well-being with health centers, walks and pedestrian areas and street lighting infrastructure. However, for men the order of importance is the opposite.
Based on the age differences, it is observed that the centers for elderly have low indexes (below the general average) for men while they are high for women over 65. Health centers provide greater well-being to women than men, especially in the age group of 65 and over. Street lighting is generally more important than sidewalks, although it seems to contribute more to young women and older men; however, the well-being of older men is also greatly affected by sidewalks and pedestrian paths.
Regarding the differences between women and men by age range, for the younger individuals, nursery schools up to 5 years provide the greatest difference between women and men, while the lowest corresponds to parks and green areas. Centers for elderly are the infrastructure with highest difference between woman and men between 40 and 64 years old, and the one that presents lowest difference is health centers. Regarding the elderly, centers for elderly and street lighting are, respectively, the infrastructures with highest and lowest difference between women and men.
The highest average of the differences between women and men corresponds to the age range over 65, while the other age groups this averages are similar.
For respondents, the greatest well-being improvement is reported by parks and green areas infrastructure in young women, while sidewalks and pedestrian paths generate greater well-being in women than in men, especially in young people and the elderly. Likewise, street lights produce greater well-being than sidewalks and pedestrians paths, especially in young women and men.
The results also show that the investment in infrastructures in centers for elderly and nursery schools up to 5 years are the ones that provide a greater difference of well-being in favor of women, which contributes to a great extent to reduce gender inequality. Consistent with the different role in care played by women, the impact is higher for them.
In summary, the results obtained reveal that access to infrastructures improves the subjective well-being of men and women, and that the improvement in well-being is greater in women than in men. Parks, green areas and health centers are the areas with a greater subjective well-being improvement for both groups.
The finding that women recorded higher rates than men means that access to the provision of infrastructure provided by the government generates greater well-being for them and therefore an increase in spending on public investment in this type of infrastructure benefits women more. Therefore, designing public infrastructure policies can contribute to reducing gender inequality.
Finally, it is necessary to point out that perceptions are not measured in the ratio scale, but in the ordinal scale with non-uniform "real" distances, as usual. Therefore, the interpretations of the index values, as well as the regression coefficients, are not based on precise measurements, so the results obtained must be interpreted with the necessary reservations.
6. Conclusions
This work uses the survey “Public Infrastructure and Gender” from 2015 by the Fiscal Observatory of the University of Murcia to a sample of 1200 people residing in Spain to estimate the subjective well-being that different types of infrastructure report from a gender perspective. Participants’ responses show the existence of gender differences with respect to the importance assigned to the infrastructure that affects the different dimensions of well-being.
This study supplies evidence of the importance of incorporating a gender perspective to the improvement of access to infrastructures as a tool, so as to improve gender equality related to subjective well-being.
The results of the estimation of the subjective well-being index reveal that access to infrastructure increases the subjective well-being of men and women, that this increase in well-being is greater in women than men and the infrastructure of parks and green areas and health centers are those that generate greater subjective well-being for both men and women.
All in all, this study reveals that policies that intend to achieve gender equality should not consider infrastructures as neutral regarding gender differences. By incorporating a gender perspective into the expenses from infrastructures, there comes progresses about gender equality regarding well-being.
Furthermore, integrating gender analysis and gender equality through public infrastructures, by adopting an approach that takes into account the needs and the reality concerning gender role for men and women, boosts a better economic and social situation and women’s policies. Profits obtained from an eventual reduction in gender gap accessing and using infrastructure come with a gain in women’s autonomy for their professional and personal development and in security, which has a positive impact on their autonomy and integrity.
Therefore, policymakers should take into account gender differences in the allocation of resources for public infrastructures, trying to identify the needs related to the gender gap. Likewise, other general measures within the framework of economic policy should be targeted to reduce gender inequality and to raise well-being.
Finally, it should be noted that even with the necessary caution about the validity of the results obtained due to the existence of bias in respondents’ answers, it is believed that they are sufficiently solid to establish that infrastructures promote well-being and are not neutral, since when a gender perspective is adopted, its impact discriminates in favor of women, reducing gender inequality.
Possible improvements to this work can be suggested under different lines: by extending the analysis to other types of infrastructure, such as transport, sports or culture, for instance, that are clearly meaningful to well-being, but have not been covered here and that need to be researched. In addition, improvements could be suggested by extending the analysis to the measurement and development of other relevant capabilities such as, for instance, emotion, integrity and security.
Author Contributions
Conceptualization, G.A.-G.; methodology, G.A.-G., J.D.B.-A. and M.d.M.S.-d.-l.-V.; software, M.d.M.S.-d.-l.-V.; investigation, G.A.-G., J.D.B.-A. and M.d.M.S.-d.-l.-V.; supervision, M.d.M.S.-d.-l.-V. All authors have read and agreed to the published version of the manuscript.
Funding
The data used in this work come from a survey which was carried out in the frame of a research project funded by the Institute for Women of the Ministry of Equality of the Government of Spain. Project 154/10 (2013).
Institutional Review Board Statement
Not applicable.
Informed Consent Statement
Not applicable.
Data Availability Statement
The data that support the findings of this study are available from the corresponding author upon reasonable request.
Conflicts of Interest
The authors declare no conflict of interest.
Appendix A
Table A1.
Significance of coefficients of regressions with different capabilities. Women.
Table A1.
Significance of coefficients of regressions with different capabilities. Women.
| Variables a,b | C1 Physical and Mental Health | C2 Personal Safety | C3 Social Relationships | C4 Education | C5 Care and Domestic Work | C6 Employment | C7 Nice and Healthy Environment | C8 Mobility | C9 Leisure | C10 Emotions |
|---|---|---|---|---|---|---|---|---|---|---|
| (Intercept) | −1.31 * | −1.30 * | −0.02 | 0.27 | 0.69 | 1.03. | −0.59 | −0.683 | 0.01 | −0.379 |
| Ck (k = 1 to 10) | 0.176 ** | 0.16 *** | 0.11 *** | 0.08 *** | 0.06 *** | 0.02 | 0.14 *** | 0.13 *** | 0.12 *** | 0.11 *** |
| Education_2 | −0.26 | −0.11 | −0.09 | −0.07 | −0.07 | −0.08 | −0.09 | −0.13 | −0.15 | −0.15 |
| Education_3 | −0.15 | −0.06 | −0.03 | −0.08 | −0.13 | −0.20 | −0.06 | −0.09 | −0.12 | −0.09 |
| Education_4 | 0.20 | 0.33 | 0.39 | 0.28 | 0.24 | 0.11 | 0.32 | 0.29 | 0.28 | 0.30 |
| Lab_Sit2 | −0.73 | −0.67 | −0.74 | −0.68 | −0.71 | −0.68 | −0.64 | −0.74 | −0.69 | −0.68 |
| Lab_Sit3 | −1.22 ** | −1.16 * | −1.26 ** | −1.29 ** | −1.34 ** | −1.34 ** | −1.20 ** | −1.32 ** | −1.23 ** | −1.26 ** |
| Lab_Sit4 | −0.49 | −0.41 | −0.52 | −0.45 | −0.46 | −0.42 | −0.401 | −0.50 | −0.42 | −0.44 |
| Lab_Sit5 | −1.27 * | −1.20 * | −1.23 | −1.17 * | −1.17 * | −1.16 * | −1.07 * | −1.23 * | −1.17 | −1.20 * |
| Lab_Sit6 | −0.64 | −0.51 | −0.56 | −0.56 | −0.59 | −0.58 | −0.53 | −0.62 | −0.51 | −0.55 |
| Income_2 | 0.11 | 0.05 | 0.03 | 0.09 | 0.02 | 0.02 | 0.12 | 0.11 | 0.07 | 0.02 |
| Income_3 | 1.14 | 1.23 * | 1.17 * | 1.24 * | 1.26 * | 1.23 * | 1.16 | 1.33 * | 1.25 * | 1.30 * |
| Income_4 | 0.24 | 0.24 | −0.03 | 0.09 | 0.15 | 0.23 | −0.05 | 0.11 | 0.22 | 0.25 |
| McFadden’s R2 | 0.13 | 0.12 | 0.08 | 0.06 | 0.05 | 0.04 | 0.1 | 0.09 | 0.08 | 0.08 |
| Sensitivity | 0 | 0 | 0 | 0 | 0 | 1 | 0 | 0 | 0 | 0 |
| Specificity | 1 | 1 | 1 | 1 | 1 | 0 | 1 | 1 | 1 | 1 |
| misClass Error | 0.43 | 0.43 | 0.43 | 0.43 | 0.43 | 0.43 | 0.43 | 0.43 | 0.43 | 0.43 |
Significance: ‘***’ 0.001, ‘**’ 0.01, ‘*’ 0.05. a The dependent variable is SWB and independents ones are Ck, education, labour situation and income. b Regression for the capability Ck, k = 1 to 10.
Table A2.
Significance of coefficients of regressions with different capabilities. Men.
Table A2.
Significance of coefficients of regressions with different capabilities. Men.
| Variables a,b | C1 Physical and Mental Health | C2 Personal Safety | C3 Social Relationships | C4 Education | C5 Care and Domestic Work | C6 Employment | C7 Nice and Healthy Environment | C8 Mobility | C9 Leisure | C10 Emotions |
|---|---|---|---|---|---|---|---|---|---|---|
| (Intercept) | −0.23 | −0.40 | −0.08 | 0.37 | 0.439 | 0.67 | −0.40 | −0.10 | −0.00 | 0.14 |
| Ck (k = 1 to 10) | 0.14 *** | 0.15 *** | 0.12 *** | 0.07 *** | 0.06 *** | 0.02 | 0.14 *** | 0.12 *** | 0.12 *** | 0.10 *** |
| Education_2 | −0.01 | 0.03 | 0.14 | 0.26 | 0.33 | 0.39 | 0.04 | 0.06 | 0.05 | 0.16 |
| Education_3 | −0.15 | −0.06 | 0.07 | 0.16 | 0.26 | 0.29 | −0.05 | −0.01 | −0.02 | 0.097 |
| Education_4 | 0.12 | 0.15 | 0.30 | 0.41 | 0.51 | 0.51 | 0.16 | 0.24 | 0.23 | 0.313 |
| Lab_Sit2 | −1.28 * | −1.32 * | −1.16 | −0.98 | −1.04 | −0.82 | −1.27 * | −1.24 | −1.19 | −1.280 |
| Lab_Sit3 | −1.33 ** | −1.28 ** | −1.28 ** | −1.22 ** | −1.21 ** | −1.14 * | −1.16 * | −1.20 ** | −1.284 | −1.293 |
| Lab_Sit4 | −1.06 * | −0.98 ** | −0.89 * | −0.73 | −0.73 | −0.62 | −0.80. | −0.86. | −0.913 * | −0.861 |
| Lab_Sit5 | −1.75 *** | −1.65 ** | −1.65 ** | −1.60 ** | −1.64 *** | −1.58 ** | −1.55 ** | −1.62 ** | −1.634 ** | −1.663 *** |
| Lab_Sit6 | −1.25 ** | −1.21 ** | −1.17 ** | −1.13 ** | −1.10 ** | −1.04 * | −1.11 * | −1.10 * | −1.155 ** | −1.185 ** |
| Income_2 | 0.30 | 0.37 | 0.33 | 0.34 | 0.31 | 0.30 | 0.35 | 0.31 | 0.312 | 0.352 |
| Income_3 | 0.48 | 0.49 | 0.51 | 0.51 | 0.46 | 0.41 | 0.39 | 0.49 | 0.497 | 0.604 |
| Income_4 | 0.17 | 0.32 | 0.29 | 0.16 | 0.13 | 0.12 | 0.34 | 0.25 | 0.27 | 0.22 |
| McFadden’s R2 | 0.10 | 0.10 | 0.08 | 0.05 | 0.05 | 0.03 | 0.10 | 0.09 | 0.09 | 0.07 |
| Sensitivity | 0 | 0 | 0 | 0 | 0 | 1 | 0 | 0 | 0 | 0 |
| Specificity | 1 | 1 | 1 | 1 | 1 | 0 | 1 | 1 | 1 | 1 |
| misClass Error | 0.37 | 0.37 | 0.37 | 0.37 | 0.37 | 0.37 | 0.37 | 0.37 | 0.37 | 0.37 |
Significance: ‘***’ 0.001 ‘**’ 0.01 ‘*’ 0.05. a The dependent variable is SWB and independents ones are Ck, education, labour situation and income. b Regression for the capability Ck, k = 1 to 10.
Table A3.
Significance of coefficients of regressions with different capabilities. Women and age 18 to 39.
Table A3.
Significance of coefficients of regressions with different capabilities. Women and age 18 to 39.
| Variables a,b | C1 Physical and Mental Health | C2 Personal Safety | C3 Social Relationships | C4 Education | C5 Care and Domestic Work | C6 Employment | C7 Nice and Healthy Environment | C8 Mobility | C9 Leisure | C10 Emotions |
|---|---|---|---|---|---|---|---|---|---|---|
| (Intercept) | 12.65 | 13.85 | 14.34 | 14.72 | 15.45 | 16.28 | 13.68 | 14.68 | 14.18 | 14.38 |
| Ck (k = 1 to 10) | 0.24 *** | 0.21 *** | 0.17 *** | 0.13 *** | 0.10 ** | 0.08 ** | 0.19 *** | 0.17 *** | 0.18 *** | 0.17 *** |
| Education_2 | −15.16 | −15.96 | −15.69 | −15.54 | −15.68 | −15.61 | −15.46 | −16.02 | −15.65 | −15.77 |
| Education_3 | −14.82 | −15.77 | −15.42 | −15.34 | −15.63 | −15.52 | −15.30 | −15.83 | −15.52 | −15.49 |
| Education_4 | −14.49 | −15.38 | −14.99 | −15.00 | −15.19 | −15.16 | −14.89 | −15.50 | −15.15 | −15.06 |
| Lab_Sit2 | −0.23 | −0.19 | −0.27 | −0.22 | −0.31 | −0.33 | −0.19 | −0.32 | −0.14 | −0.13 |
| Lab_Sit3 | −0.86 | −0.79 | −0.83 | −0.90 | −1.04 | −1.06 | −0.91 | −1.01 | −0.92 | −0.99 |
| Lab_Sit4 | 16.20 | 16.07 | 15.95 | 16.57 | 15.60 | 16.17 | 16.06 | 15.94 | 16.20 | 16.22 |
| Lab_Sit5 | −1.00 | −0.82 | −1.01 | −0.89 | −1.02 | −1.03 | −0.77 | −0.94 | −0.95 | −1.03 |
| Lab_Sit6 | −0.37 | −0.21 | −0.16 | −0.21 | −0.24 | −0.31 | −0.22 | −0.25 | −0.08 | −0.11 |
| Income_2 | 0.23 | 0.27 | 0.29 | 0.45 | 0.32 | 0.33 | 0.32 | 0.26 | 0.25 | 0.06 |
| Income_3 | 1.54 | 1.46 | 1.58 | 1.51 | 1.79 | 1.85 | 1.61 | 1.73 | 1.94 | 1.91 |
| Income_4 | 16.79 | 17.16 | 16.02 | 16.21 | 16.45 | 16.63 | 16.29 | 16.39 | 17.06 | 17.35 |
| McFadden’s R2 | 0.11 | 0.19 | 0.15 | 0.13 | 0.11 | 0.10 | 0.16 | 0.15 | 0.16 | 0.16 |
| Sensitivity | 1 | 1 | 1 | 1 | 1 | 1 | 1 | 1 | 1 | 1 |
| Specificity | 0 | 0 | 0 | 0 | 0 | 0 | 0 | 0 | 0 | 0 |
| misClass Error | 0.29 | 0.29 | 0.29 | 0.29 | 0.29 | 0.29 | 0.29 | 0.29 | 0.29 | 0.29 |
Significance: ‘***’ 0.001 ‘**’ 0.01. a The dependent variable is SWB and independents ones are Ck, education, labour situation and income. b Regression for the capability Ck, k = 1 to 10.
Table A4.
Significance of coefficients of regressions with different capabilities. Women and age 40 to 64.
Table A4.
Significance of coefficients of regressions with different capabilities. Women and age 40 to 64.
| Variables a,b | C1 Physical and Mental Health | C2 Personal Safety | C3 Social Relationships | C4 Education | C5 Care and Domestic Work | C6 Employment | C7 Nice and Healthy Environment | C8 Mobility | C9 Leisure | C10 Emotions |
|---|---|---|---|---|---|---|---|---|---|---|
| (Intercept) | −1.53 | −1.48 | −0.39 | −0.02 | 0.45 | 0.93 | −0.95 | −0.86 | −0.26 | −0.15 |
| Ck (k = 1 to 10) | 0.14 *** | 0.15 *** | 0.09 ** | 0.07 * | 0.04 | 0.00 | 0.11 *** | 0.11 *** | 0.09 ** | 0.07 ** |
| Education_2 | −0.07 | −0.18 | −0.15 | −0.04 | −0.03 | −0.04 | −0.14 | −0.04 | −0.22 | −0.24 |
| Education_3 | −0.38 | −0.55 | −0.49 | −0.45 | −0.51 | −0.55 | −0.52 | −0.42 | −0.61 | −0.63 |
| Education_4 | −0.01 | −0.10 | −0.02 | −0.04 | −0.10 | −0.25 | −0.10 | 0.04 | −0.14 | −0.24 |
| Lab_Sit2 | −0.45 | −0.39 | −0.65 | −0.69 | −0.72 | −0.77 | −0.40 | −0.53 | −0.62 | −0.49 |
| Lab_Sit3 | −1.01 | −0.93 | −1.32 | −1.40 | −1.45 | −1.47 | −1.01 | −1.14 | −1.24 | −1.16 |
| Lab_Sit4 | −0.19 | −0.09 | −0.50 | −0.59 | −0.71 | −0.80 | −0.18 | −0.35 | −0.47 | −0.40 |
| Lab_Sit5 | −0.75 | −0.69 | −0.98 | −1.01 | −1.04 | −1.07 | −0.66 | −0.83 | −0.90 | −0.82 |
| Lab_Sit6 | −0.04 | 0.08 | −0.34 | −0.39 | −0.48 | −0.50 | −0.08 | −0.21 | −0.28 | −0.21 |
| Income_2 | 0.03 | −0.03 | 0.03 | 0.09 | 0.05 | 0.10 | 0.10 | 0.09 | 0.05 | 0.07 |
| Income_3 | 0.64 | 0.78 | 0.85 | 0.97 | 0.91 | 0.99 | 0.81 | 1.00 | 0.83 | 0.95 |
| Income_4 | −0.93 | −1.24 | −1.10 | −0.91 | −0.86 | −0.62 | −1.17 | −0.95 | −1.03 | −1.02 |
| McFadden’s R2 | 0.11 | 0.12 | 0.08 | 0.06 | 0.05 | 0.04 | 0.09 | 0.09 | 0.07 | 0.07 |
| Sensitivity | 0 | 0 | 0 | 0 | 0 | 0 | 0 | 0 | 0 | 0 |
| Specificity | 1 | 1 | 1 | 1 | 1 | 1 | 1 | 1 | 1 | 1 |
| misClass Error | 0.57 | 0.57 | 0.57 | 0.57 | 0.57 | 0.57 | 0.57 | 0.57 | 0.57 | 0.57 |
Significance: ‘***’ 0.001 ‘**’ 0.01 ‘*’ 0.05. a The dependent variable is SWB and independents ones are Ck, education, labour situation and income. b Regression for the capability Ck, k = 1 to 10.
Table A5.
Significance of coefficients of regressions with different capabilities. Women and age 65 and over.
Table A5.
Significance of coefficients of regressions with different capabilities. Women and age 65 and over.
| Variables a,b | C1 Physical and Mental Health | C2 Personal Safety | C3 Social Relationships | C4 Education | C5 Care and Domestic Work | C6 Employment | C7 Nice and Healthy Environment | C8 Mobility | C9 Leisure | C10 Emotions |
|---|---|---|---|---|---|---|---|---|---|---|
| (Intercept) | −2.44 ** | −2.45 ** | −1.25 | −0.45 | −0.31 | 0.20 | −1.78 * | −1.72 * | −1.36 | −1.47 * |
| Ck (k = 1 to 10) | 0.22 *** | 0.21 *** | 0.12 ** | 0.07 | 0.06 | 0.03 | 0.16 *** | 0.16 *** | 0.14 ** | 0.15 *** |
| Education_2 | −0.40 | −0.15 | −0.12 | −0.14 | −0.14 | −0.11 | −0.15 | −0.15 | −0.23 | −0.23 |
| Education_3 | 0.41 | 0.84 | 0.79 | 0.81 | 0.87 | 0.86 | 0.74 | 0.85 | 0.74 | 0.80 |
| Education_4 | −0.46 | 0.00 | 0.05 | 0.06 | 0.05 | −0.04 | −0.14 | −0.02 | 0.04 | 0.04 |
| Lab_Sit2 | ||||||||||
| Lab_Sit3 | ||||||||||
| Lab_Sit4 | −0.14 | −0.13 | −0.03 | 0.00 | 0.06 | −0.01 | −0.05 | −0.04 | 0.04 | −0.01 |
| Lab_Sit5 | ||||||||||
| Lab_Sit6 | ||||||||||
| Income_2 | 1.52 | 1.15 | 0.64 | 0.40 | 0.38 | 0.24 | 0.92 | 0.83 | 0.66 | 0.75 |
| Income_3 | 16.32 | 16.25 | 15.77 | 15.78 | 15.84 | 15.65 | 15.72 | 15.97 | 15.90 | 16.05 |
| Income_4 | ||||||||||
| McFadden’s R2 | 0.16 | 0.15 | 0.09 | 0.06 | 0.06 | 0.04 | 0.12 | 0.12 | 0.11 | 0.12 |
| Sensitivity | 1 | 1 | 1 | 1 | 1 | 1 | 1 | 1 | 1 | 1 |
| Specificity | 0 | 0 | 0 | 0 | 0 | 0 | 0 | 0 | 0 | 0 |
| misClass Error | 0.33 | 0.33 | 0.33 | 0.33 | 0.33 | 0.33 | 0.33 | 0.33 | 0.33 | 0.33 |
Significance: ‘***’ 0.001, ‘**’ 0.01, ‘*’ 0.05. a The dependent variable is SWB and independents ones are Ck, education, labour situation and income. b Regression for the capability Ck, k = 1 to 10.
Table A6.
Significance of coefficients of regressions with different capabilities. Men and age 18 to 39.
Table A6.
Significance of coefficients of regressions with different capabilities. Men and age 18 to 39.
| Variables a,b | C1 Physical and Mental Health | C2 Personal Safety | C3 Social Relationships | C4 Education | C5 Care and Domestic Work | C6 Employment | C7 Nice and Healthy Environment | C8 Mobility | C9 Leisure | C10 Emotions |
|---|---|---|---|---|---|---|---|---|---|---|
| (Intercept) | 16.47 | 16.42 | 16.50 | 17.22 | 17.19 | 16.96 | 16.02 | 17.23 | 16.87 | 17.08 |
| Ck (k = 1 to 10) | 0.21 *** | 0.21 *** | 0.16 *** | 0.13 *** | 0.10 ** | 0.07 * | 0.23 *** | 0.18 *** | 0.19 *** | 0.15 *** |
| Education_2 | −17.23 | −17.20 | −16.75 | −17.00 | −16.73 | −16.17 | −17.31 | −17.73 | −17.29 | −17.05 |
| Education_3 | −17.36 | −17.35 | −16.75 | −17.06 | −16.67 | −16.22 | −17.25 | −17.79 | −17.37 | −17.19 |
| Education_4 | −17.34 | −17.36 | −16.78 | −17.07 | −16.73 | −16.28 | −17.25 | −17.76 | −17.29 | −17.25 |
| Lab_Sit2 | −19.34 | −18.89 | −17.93 | −18.27 | −18.31 | −18.05 | −19.48 | −18.73 | −18.33 | −18.60 |
| Lab_Sit3 | −1.16 * | −1.04 | −1.05 | −1.11 * | −1.02 * | −1.02 * | −0.79 | −0.97 | −1.12 * | −1.21 * |
| Lab_Sit4 | −1.02 | −0.92 | −0.76 | −0.80 | −0.62 | −0.39 | −0.64 | −0.81 | −0.87 | −1.01 |
| Lab_Sit5 | −1.34 | −1.30 | −1.44 | −1.32 | −1.45 | −1.40 | −1.24 | −1.31 | −1.33 | −1.47 |
| Lab_Sit6 | −0.65 | −0.60 | −0.61 | −0.63 | −0.63 | −0.55 | −0.37 | −0.49 | −0.56 | −0.67 |
| Income_2 | −0.07 | 0.02 | 0.04 | 0.09 | 0.08 | 0.11 | −0.10 | 0.00 | −0.12 | 0.14 |
| Income_3 | 1.03 | 1.00 | 1.53 | 1.60 | 1.62 | 1.67 | 1.06 | 1.59 | 1.52 | 1.61 |
| Income_4 | −0.35 | −0.20 | 0.46 | 0.56 | 0.62 | 0.55 | 0.69 | 0.31 | 0.67 | 0.65 |
| McFadden’s R | 0.19 | 0.18 | 0.15 | 0.14 | 0.12 | 0.10 | 0.21 | 0.17 | 0.17 | 0.16 |
| Sensitivity | 1 | 1 | 1 | 1 | 1 | 1 | 1 | 1 | 1 | 1 |
| Specificity | 0 | 0 | 0 | 0 | 0 | 0 | 0 | 0 | 0 | 0 |
| misClass Error | 0.32 | 0.32 | 0.32 | 0.32 | 0.32 | 0.32 | 0.32 | 0.32 | 0.32 | 0.32 |
Significance: ‘***’ 0.001 ‘**’ 0.01 ‘*’ 0.05. a The dependent variable is SWB and independents ones are Ck, education, labour situation and income. b Regression for the capability Ck, k = 1 to 10.
Table A7.
Significance of coefficients of regressions with different capabilities. Men and age 40 to 64.
Table A7.
Significance of coefficients of regressions with different capabilities. Men and age 40 to 64.
| Variables a,b | C1 Physical and Mental Health | C2 Personal Safety | C3 Social Relationships | C4 Education | C5 Care and Domestic Work | C6 Employment | C7 Nice and Healthy Environment | C8 Mobility | C9 Leisure | C10 Emotions |
|---|---|---|---|---|---|---|---|---|---|---|
| (Intercept) | 12.46 | 12.50 | 12.84 | 13.28 | 12.84 | 13.45 | 12.83 | 12.50 | 12.90 | 12.91 |
| Ck (k = 1 to 10) | 0.11 *** | 0.11 *** | 0.10 ** | 0.05 * | 0.06 * | 0.02 | 0.10 ** | 0.10 *** | 0.09 ** | 0.08 ** |
| Education_2 | −0.10 | −0.19 | −0.06 | 0.12 | 0.21 | 0.33 | −0.08 | −0.13 | −0.02 | 0.04 |
| Education_3 | 0.39 | 0.35 | 0.47 | 0.66 | 0.76 | 0.87 | 0.40 | 0.40 | 0.48 | 0.59 |
| Education_4 | 0.65 | 0.57 | 0.68 | 0.87 | 1.00 | 1.08 | 0.58 | 0.65 | 0.69 | 0.80 |
| Lab_Sit2 | −13.63 | −13.64 | −13.83 | −13.89 | −13.64 | −13.78 | −13.93 | −13.63 | −13.89 | −13.86 |
| Lab_Sit3 | −14.05 | −14.08 | −14.29 | −14.35 | −14.08 | −14.28 | −14.32 | −13.98 | −14.23 | −14.20 |
| Lab_Sit4 | −13.86 | −13.86 | −14.02 | −14.05 | −13.73 | −14.02 | −14.08 | −13.71 | −13.99 | −13.93 |
| Lab_Sit5 | −14.69 | −14.64 | −14.83 | −15.01 | −14.74 | −15.02 | −14.88 | −14.63 | −14.87 | −14.84 |
| Lab_Sit6 | −14.30 | −14.30 | −14.46 | −14.62 | −14.28 | −14.59 | −14.56 | −14.20 | −14.46 | −14.46 |
| Income_2 | 0.59 | 0.68 | 0.64 | 0.65 | 0.65 | 0.61 | 0.67 | 0.65 | 0.67 | 0.66 |
| Income_3 | 0.18 | 0.20 | 0.14 | 0.16 | 0.14 | 0.05 | 0.14 | 0.14 | 0.15 | 0.19 |
| Income_4 | 0.37 | 0.49 | 0.42 | 0.30 | 0.30 | 0.26 | 0.46 | 0.43 | 0.42 | 0.34 |
| McFadden’s R2 | 0.08 | 0.08 | 0.08 | 0.05 | 0.06 | 0.04 | 0.07 | 0.08 | 0.07 | 0.07 |
| Sensitivity | 1 | 0 | 1 | 1 | 1 | 1 | 1 | 1 | 1 | 1 |
| Specificity | 0 | 1 | 0 | 0 | 0 | 0 | 0 | 0 | 0 | 0 |
| misClass Error | 0.52 | 0.52 | 0.52 | 0.52 | 0.52 | 0.52 | 0.52 | 0.52 | 0.52 | 0.52 |
Significance: ‘***’ 0.001 ‘**’ 0.01 ‘*’ 0.05. a The dependent variable is SWB and independents ones are Ck, education, labour situation and income. b Regression for the capability Ck, k = 1 to 10.
Table A8.
Significance of coefficients of regressions with different capabilities. Men and age 65 and over.
Table A8.
Significance of coefficients of regressions with different capabilities. Men and age 65 and over.
| Variables a,b | C1 Physical and Mental Health | C2 Personal Safety | C3 Social Relationships | C4 Education | C5 Care and Domestic Work | C6 Employment | C7 Nice and Healthy Environment | C8 Mobility | C9 Leisure | C10 Emotions |
|---|---|---|---|---|---|---|---|---|---|---|
| (Intercept) | 14.87 | 13.91 | 15.21 | 15.44 | 15.70 | 15.81 | 14.60 | 15.26 | 15.60 | 15.72 |
| Ck (k = 1 to 10) | 0.20 ** | 0.23 *** | 0.13 * | 0.04 | 0.00 | −0.02 | 0.18 ** | 0.12 * | 0.15 ** | 0.09 |
| Education_2 | 0.83 | 0.86 | 1.03 | 1.19 | 1.22 | 1.24 | 0.95 | 1.00 | 0.92 | 1.09 |
| Education_3 | −0.82 | −0.56 | −0.58 | −0.53 | −0.48 | −0.45 | −0.71 | −0.59 | −0.55 | −0.49 |
| Education_4 | −0.08 | −0.11 | 0.31 | 0.47 | 0.53 | 0.58 | 0.10 | 0.24 | 0.32 | 0.37 |
| Lab_Sit2 | ||||||||||
| Lab_Sit3 | ||||||||||
| Lab_Sit4 | −17.19 | −16.50 | −16.58 | −15.79 | −15.78 | −15.77 | −16.45 | −16.54 | −17.01 | −16.60 |
| Lab_Sit5 | ||||||||||
| Lab_Sit6 | ||||||||||
| Income_2 | 0.84 | 0.81 | 0.68 | 0.63 | 0.58 | 0.56 | 0.82 | 0.61 | 0.54 | 0.58 |
| Income_3 | 2.02 | 2.11 | 1.95 | 1.72 | 1.65 | 1.64 | 1.74 | 1.95 | 1.92 | 2.01 |
| Income_4 | ||||||||||
| McFadden’s R2 | 0.22 | 0.24 | 0.18 | 0.13 | 0.12 | 0.13 | 0.22 | 0.17 | 0.19 | 0.16 |
| Sensitivity | 1 | 1 | 1 | 1 | 1 | 1 | 1 | 1 | 1 | 1 |
| Specificity | 0 | 0 | 0 | 0 | 0 | 0 | 0 | 0 | 0 | 0 |
| misClass Error | 0.36 | 0.36 | 0.36 | 0.36 | 0.36 | 0.36 | 0.36 | 0.36 | 0.36 | 0.36 |
Significance: ‘***’ 0.001, ‘**’ 0.01, ‘*’ 0.05. a The dependent variable is SWB and independents ones are Ck, education, labour situation and income. b Regression for the capability Ck, k = 1 to 10.
Notes
| 1 | This way of understanding development is evidenced by the Human Development Index (HDI). |
| 2 | The methodological report and the data are also available: Benefits of gender equality through infrastructure provision: An EU-wide survey. Gender statistics database: Gender equality and public infrastructure. |
References
- Agudo, Yolanda, and Inés Sánchez de Madariaga. 2011. Construyendo un lugar en la profesión: Trayectorias de las arquitectas españolas. Feminismo/s 17: 155–81. [Google Scholar] [CrossRef] [Green Version]
- Alarcón, Gloria, and Edgardo Ayala-Gaytán. 2018. Índice de Bienestar e Infraestructura desde una perspectiva de Género. La metodología de construcción del Índice del Observatorio Fiscal: Análisis de las Políticas Públicas, Murcia: Universidad de Murcia. [Google Scholar] [CrossRef]
- Alarcón, Gloria, and José Colino. 2011. La perspectiva de género en los gastos en infraestructuras públicas: Los equipamientos educativos y deportivos en el FEIL. Presupuesto y Gasto Público 64: 155–78. [Google Scholar]
- Alarcón, Gloria, and José Colino. 2013. Infrastructure and Gender: Right and Left, Mayors and Mayoresses. Wulfenia 11: 423–61. [Google Scholar]
- Alarcón, Gloria, Carolina Arias, and José Colino. 2012. Infraestructuras y género. Revista de Investigaciones Feministas 2: 151–74. [Google Scholar]
- Alarcón-García, Gloria, Tindara Addabbo, Edgardo Ayala-Gaytan, Estela Fernandez, María Rubio, Andreu Castellet, Angela O’Hagan, and José Manuel Mayor. 2020a. Benefits of Gender Equality through Infrastructure Provision: An EU-Wide Survey. Available online: https://eige.europa.eu/publications/benefits-gender-equality-through-infrastructure-provision-eu-wide-survey (accessed on 14 December 2021).
- Alarcón-García, Gloria, Tindara Addabbo, Edgardo Ayala-Gaytan, Estela Fernandez, María Rubio, Andreu Castellet, Angela O’Hagan, and José Manuel Mayor. 2020b. Gender Equality and Care Infrastructure. Available online: https://eige.europa.eu/publications/gender-equality-and-care-infrastructure (accessed on 14 December 2021).
- Alarcón-García, Gloria, Tindara Addabbo, Edgardo Ayala-Gaytan, Estela Fernandez, María Rubio, Andreu Castellet, Angela O’Hagan, and José Manuel Mayor. 2020c. Gender Equality and Health Service Infrastructure. Available online: https://eige.europa.eu/publications/gender-equality-and-health-service-infrastructure (accessed on 14 December 2021).
- Alarcón-García, Gloria, Tindara Addabbo, Edgardo Ayala-Gaytan, Estela Fernandez, María Rubio, Andreu Castellet, Angela O’Hagan, and José Manuel Mayor. 2020d. Gender Equality and Urban Mobility. Available online: https://eige.europa.eu/publications/gender-equality-and-urban-mobility (accessed on 14 December 2021).
- Alarcón-García, Gloria. 2018. The benefits of gender equality by the expenditures on public infrastructure and transport. In Retos en materia de igualdad de género en el siglo XXI. Edited by Alejandra Selma. Madrid: Dykinson, pp. 27–48. [Google Scholar]
- Amoroso, Serafina. 2020. Urbanismo con perspectiva de género. Crítica Urbana. Revista de Estudios Urbanos y Territoriales 11: 8–10, Mujeres y ciudad. A Coruña: Crítica Urbana. [Google Scholar]
- Asadullah, Mohammad Niaz, and Nazmul Chaudhury. 2012. Subjective well-being and relative poverty in rural Bangladesh. Journal of Economic Psychology 33: 940–50. [Google Scholar] [CrossRef] [Green Version]
- Banister, David, and Ann Bowling. 2004. Quality of life for the elderly: The transport dimension. Transport Policy 11: 105–15. [Google Scholar] [CrossRef]
- Bergstad, Cecilia, Amelie Gamble, Tommy Gärling, Olle Hagman, Merrit Polk, Dick Ettema, Margareta Friman, and Lars Olsson. 2011. Subjective well-being related to satisfaction with daily travel. Transportation 38: 1–15. [Google Scholar] [CrossRef]
- Bergstad, Cecilia, Amelie Gamble, Tommy Gärling, Olle Hagman, Merrit Polk, Dick Ettema, Margareta Friman, and Lars Olsson. 2012. Influences of Affect Associated with Routine Out-of-Home Activities on Subjective Well-Being. Applied Research Quality Life 7: 49–62. [Google Scholar] [CrossRef]
- Birch, Eugenie L. 1982. The Grand Domestic Revolution: A History of Feminist De-signs for American Homes, Neighborhoods, and Cities Dolores Hayden. The Journal of the Society of Architectural Historians, 258–88. [Google Scholar] [CrossRef]
- Bofill, Anna. 1998. De la Ciudad Actual a la Ciudad Habitable. Available online: http://www.lamujerconstruye.org/encuentros/es/iiencuentro.htm (accessed on 14 December 2021).
- Bofill, Anna. 2012. Hacia modelos alternativos de ciudad compatibles con una sociedad inclusiva. Estudios urbanos, género y feminismos. In Teorías y experiencias. Edited by Blanca Gutiérrez and Adriana Ciocoletto. Barcelona: Col. lectiu Punt 6, pp. 421–33. [Google Scholar]
- Borderías, Cristina, and Cristina Carrasco. 1994. Las mujeres y el trabajo: Aproximaciones históricas, sociológicas y económicas. In Las mujeres y el trabajo, rupturas conceptuales. Edited by Cristina Borderías, Cristina Carrrasco and Carme Alemany. Barcelona: Economía Critica, pp. 15–110. [Google Scholar]
- Carpio-Pinedo, José, Sonia De Gregorio, and Inés Sánchez De Madariaga. 2019. Gender mainstreaming in urban planning: The potential of geographic information systems and open data sources. Planning Theory & Practice 20: 221–40. [Google Scholar]
- Cuthill, Neil, Mengqiu Cao, Yuqi Liu, Xing Gao, and Yueron Zhang. 2019. The Association between Urban Public Transport Infrastructure and Social Equity and Spatial Accessibility within the Urban Environment: An Investigation of Tramlink in London. Sustainability 11: 1229. [Google Scholar] [CrossRef] [Green Version]
- De Henau, Jerome, and Susan Himmelweit. 2020. The Gendered Employment Gains of Investing in Social vs. Physical Infrastructure: Evidence from Simulations across Seven OECD Countries. IKD Working Paper No. 84. Milton Keynes: Faculty of Arts and Social Sciences, The Open University. [Google Scholar]
- Delbosc, Alexa. 2012. The role of well-being in transport policy. Transport Policy 23: 25–33. [Google Scholar] [CrossRef]
- Delbosc, Alexa, and Graham Currie. 2011. Exploring the relative influences of transport disadvantage and social exclusion on well-being. Transport Policy 18: 555–62. [Google Scholar] [CrossRef]
- Deneulin, Severine. 2009. The Human Development and Capabilities Approach. London: Earthscan. [Google Scholar]
- Diener, Ed, Marisa Diener, and Carol Diener. 2009. Factors Predicting the Subjective Well-Being of Nations. In Culture and Well-Being Social Indicators. Research Series. Edited by Ed Diener. Dordrecht: Springer, vol. 38, pp. 43–70. [Google Scholar]
- Dolan, Paul, Tessa Peasgood, and Mathew White. 2008. Do we really know what makes us happy A review of the economic literature on the factors associated with subjective well-being. Journal of Economic Psychology 29: 94–122. [Google Scholar] [CrossRef]
- Ettema, Dick, Tommy Gärling, Lars E. Olsson, and Margareta Friman. 2010. Out-of-home activities, daily travel, and subjective well-being. Transportation Research Part A: Policy and Practice 44: 723–32. [Google Scholar] [CrossRef]
- Ferguson, Lucy, and Sophie Harman. 2015. Gender and Infrastructure in the World Bank. Development Policy Review 33: 653–71. [Google Scholar] [CrossRef] [Green Version]
- Gutiérrez-Mozo, María Elia, José Parra-Martínez, and Ana Gilsanz-Díaz. 2020. Gestión de infraestructuras con perspectiva de género. Caso: El Campus de la Universidad de Alicante. Ciudad y territorio estudios territoriales LII: 103–20. [Google Scholar]
- Gutiérrez-Mozo, María Elia. 2021. Engendering cities: Designing sustainable urban spaces for all. Journal of Urban Design 26: 260–62. [Google Scholar] [CrossRef]
- Hayden, Dolores. 1981. The Grand Domestic Revolution. Cambridge: MIT Press. [Google Scholar]
- Human Development Report. 2010. The Real Wealth of Nations: Pathways to Human Development, United Nations Development Programme (UNDP). Available online: http://www.undp.org/publications/hdr2010/es/HDR_2010_ES_Complete.pdf (accessed on 14 December 2021).
- Irish, Aiden J. 2014. An Ethos of Sustainability: Integrated Sustainability for Urban Development. International Journal of Undergraduate Research and Creative Activities 6: 1. [Google Scholar] [CrossRef]
- Kweon, Byoung-Suk, and Robert W. Marans. 2011. Disaggregating the Measurement of Quality of Urban Life Dimensions Across a Complex Metro Region: The Case of Metro Detroit. In Investigating Quality of Urban Life. Social Indicators Research Series. Edited by Robert Marans and Robert Stimson. Dordrecht: Springer, vol. 45, pp. 369–84. [Google Scholar]
- Levin, Lena, and Charlotta Faith-Ell. 2019. How to Apply Gender Equality Goals in Transport and Infrastructure Planning. In Integrating Gender into Transport Planning. Edited by Christina Lindkvist Scholten and Tanja Joelsson. Cham: Palgrave Macmillan. [Google Scholar]
- Marans, Robert W., and Robert J. Stimson. 2011. Challenges for Quality of Urban Life Research. In Investigating Quality of Urban Life. Edited by Robert W. Marans and Robert J. Stimson. Dordrecht: Springer, vol. 45, pp. 437–44. [Google Scholar]
- McCrea, Rod, John Western, and Robert Stimson. 2011. Modelling Determinants of Subjective Quality of Urban Life at Different Geographic Scales: The Case of the Brisbane-SEQ Region. In Investigating Quality of Urban Life. Edited by Robert W. Marans and Robert J. Stimson. Dordrecht: Springer, vol. 45, pp. 347–67. [Google Scholar]
- Miralles-Guasch, Carme, and Monserrat Martínez. 2012. Las divergencias de género en las pautas de movilidad en Cataluña, según edad y tamaño del municipio. Revista Latino-Americana de Geografía y Género 3: 49–60. [Google Scholar] [CrossRef] [Green Version]
- Miralles-Guasch, Carme, Monserrat Martínez, and Oriol Marquet. 2016. A gender analysis of everyday mobility in urban and rural territories: From challenges to sustainability. Gender, Place & Culture 23: 398–417. [Google Scholar]
- Mollenkopf, Heidrun, Stephan Baas, Fiorella Marcellini, and Frank Oswald. 2005. Mobility and Quality of Life. Amsterdan: IOS Press. [Google Scholar]
- Morgan, G., A. Bajpai, P. Ceppi, A. Al-Hinai, T. Christensen, S. Kumar, S. Crosskey, and N. O’Regan. 2020. Infrastructure for Gender Equality and the Empowerment of Women. Copenhagen: UNOPS. [Google Scholar]
- Muffels, Ruud, and Bruce Headey. 2013. Capabilities and Choices: Do They Make Sen’se for Understanding Objective and Subjective Well-Being? An Empirical Test of Sen’s Capability Framework on German and British Panel Data. Social Indicators Research 110: 1159–85. [Google Scholar] [CrossRef] [PubMed] [Green Version]
- Muxí, Zaida, Roser Casano, Adriana Ciocoletto, Marta Fonseca, and Blanca Gutiérrez. 2011. Qué aporta la perspectiva de género al urbanismo? Feminismo/s 17: 105–29. [Google Scholar] [CrossRef]
- Nussbaum, Martha C. 2000. Women and Human Development: The Capabilities Approach. Cambridge: Cambridge University Press. [Google Scholar]
- Nussbaum, Martha C. 2003. Capabilities as Fundamental Entitlements: Sen and Social Justice. Feminist Economics 9: 33–59. [Google Scholar] [CrossRef]
- Nussbaum, Martha C. 2009. Creating capabilities: The human development approach and its implementation. Hypatia, Special Issue: Transgender Studies and Feminism: Theory, Politics, and Gendered Realities 24: 211–15. [Google Scholar] [CrossRef]
- Nussbaum, Martha C. 2011. Creating Capabilities. Cambridge: Harvard University Press. [Google Scholar]
- Parikh, Priti, Kun Fu, Himanshu Parikh, Allan McRobie, and Gerard George. 2014. Infrastructure Provision, Gender, and Poverty in Indian Slums. World Development 66: 468–86. [Google Scholar] [CrossRef] [Green Version]
- Parra-Martínez, José, María Elia Gutiérrez-Mozo, and Ana Gilsanz-Díaz. 2021. Inclusive Higher Education and the Built Environment. A Research and Teaching Agenda for Gender Mainstreaming in Architecture Studies. Sustainability 13: 2565. [Google Scholar] [CrossRef]
- Ravagnan, Chiara, Francesca Rossi, and Masoumeh Amiriaref. 2022. Sustainable Mobility and Resilient Urban Spaces in the United Kingdom. Practices and Proposals. Transportation Research Procedia 60: 164–71. [Google Scholar] [CrossRef]
- Robeyns, Ingrid. 2005. The capability Approach: A theoretical survey. Journal of Human Development 6: 93–114. [Google Scholar] [CrossRef]
- Rodríguez-García, María Jesús, and Francesca Donati. 2021. European Integral Urban Policies from a Gender Perspective. Gender-Sensitive Measures, Transversality and Gender Approaches. Sustainability 13: 9543. [Google Scholar] [CrossRef]
- Rojas, Mariano, and Ruut Veenhoven. 2013. Contentment and affect in the estimation of happiness. Social Indicators Research 110: 415–31. [Google Scholar] [CrossRef] [Green Version]
- Rojas, Mariano. 2008. Experienced Poverty and Income Poverty in Mexico: A Subjective Well-being Approach. World Development 36: 1078–93. [Google Scholar] [CrossRef]
- Rojas, Mariano. 2013. Hacia una Sociedad más feliz. In Ranking de felicidad en México 2012: ¿En qué municipios viven con mayor calidad de vida los mexicanos? Edited by Fernando Manzanilla. Mexico: Universidad Popular del Estado de Puebla, pp. 222–38. [Google Scholar]
- Sánchez de Madariaga, Inés, and Inés Novella. 2019. A new generation of gender mainstreaming in spatial and urban planning under the new international framework of policies for sustainable development. In Gendered Approaches to Spatial Development in Europe. Edited by Barbara Zibell, Doris Damyanovic and Ulrike Sturm. Oxon: Routledge, pp. 181–203. [Google Scholar]
- Sánchez de Madariaga, Inés, and Michael Neuman. 2020. Planning the Gendered City. In Engendering Cities Designing Sustainable Urban Spaces for All. Edited by Inés Sánchez de Madariaga and Michael Neuman. Oxon: Routledge, pp. 1–15. [Google Scholar]
- Sánchez de Madariaga, Inés. 2004a. Infraestructuras para la vida cotidiana y la calidad de vida. Ciudades 8: 101–33. [Google Scholar] [CrossRef] [Green Version]
- Sánchez de Madariaga, Inés. 2004b. Urbanismo con perspectiva de género. Sevilla: Instituto Andaluz de la Mujer, Consejería de Economía y Hacienda. [Google Scholar]
- Sen, Amartya. 1980. Equality of What. In Tanner Lectures on Human Values. Edited by Sterling McMurrin. Cambridge: Cambridge University Press, pp. 196–220. [Google Scholar]
- Sen, Amartya. 1985a. Commodities and Capabilities. Amsterdam: North Holland. [Google Scholar]
- Sen, Amartya. 1985b. Well-being, Agency and Freedom: The Dewey Lectures 1984. Journal of Philosophy 82: 169–221. [Google Scholar] [CrossRef]
- Sen, Amartya. 2008. The Idea of Justice. Journal of Human Development 9: 331–42. [Google Scholar] [CrossRef]
- Sen, Amartya. 2009. The Idea of Justice. London: Allen Lane. [Google Scholar]
- Siemiatycki, Matti, Theresa Enright, and Mariana Valverde. 2020. The gendered production of infrastructure. Progress in Human Geography 44: 297–314. [Google Scholar] [CrossRef]
- Spinney, Jamie E., Darren M. Scott, and Bruce Newbold. 2009. Transport mobility benefits and quality of life: A time-use perspective of elderly Canadians. Transport Policy 16: 1–11. [Google Scholar] [CrossRef]
- Stanley, John Kenneth, David A. Hensher, Janet R. Stanley, and Dianne Vella-Brodrick. 2011. Mobility, social exclusion and well-being: Exploring the links. Transport Research Part A 45: 789–801. [Google Scholar] [CrossRef]
- Sultana, Farhana. 2020. Embodied Intersectionalities of Urban Citizenship: Water, Infrastructure, and Gender in the Global South. Annals of the American Association of Geographers 110: 1407–24. [Google Scholar] [CrossRef]
- Tacoli, Cecilia. 2012. Urbanization, gender and urban poverty: Paid work and unpaid carework in the city, International Institute for Environment and Development United Nations Population, Fund Urbanization and Emerging Population. Issues Working Paper 7. New York: United Nations Population Fund (UNFPA). [Google Scholar]
- Truelove, Y., and H. A. Ruszczyk. 2022. Bodies as urban infrastructure: Gender, intimate infrastructures and slow infrastructural violence. Political Geography 92. [Google Scholar] [CrossRef]
- UNFPA. 2007. State of the World Population. In Unleashing the Potential of Urban Growth. New York: United Nations Population Fund. [Google Scholar]
- Veenhoven, Ruut. 1991. Questions on Happiness: Classical Topics, Modern Answers, Blind Spots. In Subjective Well-being. An Inter-Disciplinary Perspective. Edited by Fritz Strack, Michael Argyle and Norbert Schwarz. London: Pergamon Press, pp. 7–26. [Google Scholar]
- Veenhoven, Ruut. 1996. Developments in Satisfaction Research. Social Indicators Research 37: 1–45. [Google Scholar] [CrossRef]
- Vella-Brodrick, Dianne, and Janet Stanley. 2013. The significance of transport mobility in predicting well-being. Transport Policy 29: 236–42. [Google Scholar] [CrossRef]
- Villota, Paloma, Jubeto Yolanda, and Ignacio Ferrari. 2009. Estrategias para la integración de la perspectiva de género en los presupuestos públicos. Madrid: Instituto de la Mujer, Ministerio de Igualdad. [Google Scholar]
- Wang, His-Chuan. 2022. Prioritizing compactness for a better quality of life: The case of U.S. cities. Cities 123: 103566. [Google Scholar] [CrossRef]
Publisher’s Note: MDPI stays neutral with regard to jurisdictional claims in published maps and institutional affiliations. |
© 2022 by the authors. Licensee MDPI, Basel, Switzerland. This article is an open access article distributed under the terms and conditions of the Creative Commons Attribution (CC BY) license (https://creativecommons.org/licenses/by/4.0/).