Abstract
Agroecosystems, accounting for more than one-third of arable land worldwide, play an essential role in the terrestrial carbon (C) cycle. The development of agricultural practices, which maximize soil C sequestration from the atmosphere, is receiving growing attention due to the recognition of agroecosystems’ great potential to serve as sinks of atmospheric carbon dioxide (CO2). In particular, cover crop and soil amendment applications are generating much interest in mitigating climate change and enhancing agricultural ecosystem services. The objective of this study was to evaluate the effects of winter cover crop and soil amendments, including broiler litter (BL), flue gas desulfurization (FGD) gypsum and lignite, on soil CO2 flux from cropping systems in southeastern USA, where related studies were limited. A field study was conducted from 2019 to 2021 in a Mississippi upland corn cropping system with measurements of soil CO2 flux, moisture and temperature during cash crop growing seasons. We observed high temporal variability in soil CO2 flux with flux peaks between late June and early July, which is likely due to the temporal changes in soil moisture. A significant increase in soil CO2 flux was found with BL application (p < 0.05). Co-application of FGD gypsum and lignite with BL-reduced soil CO2 flux by 15–23% but did not fully eliminate the rising effects. Significantly higher soil CO2 flux and lower soil temperature were observed from fields with cover crops than those without cover crops in the third year of this study (p < 0.05), which is likely attributed to the higher organic C content accumulated in soil with cover crops. Future research should assess year-round soil greenhouse gas fluxes in both cash crop and cover crop growing seasons using a high temporal resolution measurement scheme.
1. Introduction
Agroecosystems in southeastern USA are the economic platform for a largely agriculture-based society. Corn is the 3rd ranked cash crop in southeastern USA, with approximately 1,746,000 ha (4,315,000 acres) planted in 2016 [1]. In Mississippi, the average yield gap between the potential and actual yield for corn production was 4.1 Mg ha−1 from 2012 to 2021 [2]. Developing regionally tailored agricultural management practices, which are safe, effective, economical and sustainable, is necessary to close the crop yield gap and increase food security, as well as to improve soil health, reduce environmental degradation, and increase cropping system carbon (C) storage to mitigate global climate change [3].
Upland soils are generally low in nutrient content, organic matter (OM), and basic cations, and they are vulnerable to water and nutrient losses through soil erosion and runoff [4]. Fertilizer application, especially nitrogen (N), is required for cropping systems in upland soils in order to reach the desired crop yield. Currently, only 47% of N fertilizer applied to the cropping systems is converted into crop products, meaning more than half of the N is lost into the environment and producing threats to air, water, soil and biodiversity [5]. Interest in using broiler litter (BL) as an organic fertilizer has been increasing due to escalating fertilizer prices. More than two-thirds of USA broiler production originates in southeastern USA, making BL increasingly used as a fertilizer source in this area. Studies have shown that crop production, such as corn and cotton, from the fields applied with BL at an appropriate rate is as good as or even better than those from systems subjected to commercial N fertilizers [6,7,8]. BL provides essential nutrients for crop growth, including N, phosphorus (P), potassium (K), copper (Cu) and zinc (Zn). However, it also leads to nutrient accumulation in the surface soils and increases potential nutrient transport, such as P and dissolved organic C in runoff [9,10,11]. Moreover, the large quantity of readily mineralizable N in BL is highly susceptible to the volatilization of ammonia (NH3), surface runoff, and leaching [12,13,14]. Integrating one or more agricultural practices to prevent these adverse environmental effects while maintaining crop production is essential for upland soils.
Cover crop is an agronomically and environmentally sound management practice that is recognized for its benefits in reducing nutrient loss from the agroecosystem to the environment, as well as improving soil quality, and providing pest and weed controls [15,16]. A meta-analysis covering 372 sites in different countries and climate zones demonstrated that cover crops significantly decreased N leaching and increased soil organic C sequestration, while one potential drawback of cover crops was grain yield reduction of approximately 4%, which could be avoided by planting mixed legume and non-legume cover crops [17]. The adoption of cover crops in the southeast of the USA has been low, due to limited region-specific research and resistance to unproven practices. A few existing studies in this area revealed that integrating cover crops in the upland cropping systems increased surface soil total C content, cumulative infiltration, water aggregate stability, heterotrophic plate count bacteria and reduced bulk density and penetration resistance, while the effects on crop lint yield were not consistent [18,19]. The integration of winter cover crops into a cotton system in Mississippi upland soil has been reported to significantly reduce nitrate (NO3−) leaching (by 21–45%) during the cover crop growing period, but the cover crop residues increased P runoff during cotton growing season [4].
The co-application of soil amendments, flue gas desulfurization (FGD) gypsum and lignite with cover crops could be a potential solution to further mitigate agricultural pollutants as these industrial by-products have been proposed as sustainable practices to reduce nutrient loss, especially for P and N. FGD gypsum is a coal combustion by-product of the coal industry, which has been applied in soil systems to reduce nutrient losses and improve soil physical properties (e.g., increase soil infiltration) [20]. High calcium ions (Ca2+) in gypsum can form insoluble complexes with nutrients, especially P [21,22], and promote soil aggregates, stabilize soil structure and increase water infiltration [23]. Lignite (brown coal) is a low-grade coal with low heating values, high recalcitrant C content, and an acidic nature. The application of lignite with manure-based fertilizer reduces NH3 volatilization and soluble P and N in surface runoff by lowing soil pH and chelating nutrients with organic acids [24,25,26].
Limited studies have investigated the interactive effects of winter cover crops and soil amendments on the naturally vulnerable and nutrient-deficient upland soils in southeastern USA with a humid subtropical climate. Available studies mainly focus on crop growth and yield [7,19,27], soil physical and biological properties [18,27], and nutrient loss [4,28], while the effects on greenhouse gas flux are largely unknown. In addition, data on greenhouse gas flux from agricultural management practices in southeastern USA are very scarce [29]. Soil CO2 flux, a major component determining agroecosystem net CO2 flux, is likely to be influenced by cover crop, soil amendment and their combined effects, since these management practices can alter soil biogeochemical properties (such as organic C content and quality, nutrient availability, pH, water content, aeration, microbial communities, etc.), which are important factors regulating soil CO2 production and flux [30,31,32,33,34]. Thus, the objective of this study was to evaluate the effects of winter cover crops and soil amendments (including BL, FGD gypsum and lignite) on soil CO2 flux from an upland corn cropping system in southeastern USA.
2. Materials and Methods
2.1. Study Site and Experimental Design
The study site was located at the Mississippi Agricultural and Forestry Experiment Station near Pontotoc, MS (34°14′ N, 88°99′ W). The soil is classified as Falkner silt loam soil (fine-silty, siliceous, active, thermic Aquic Paleudalfs). The site is comprised of marginally productive upland soil with approximately 3% slope and managed under rainfed conditions with no tillage. The climate is subtropical and humid with annual mean precipitation of 1483 mm and annual mean air temperature of 15.9 °C [35]. Monthly temperature and precipitation of the study site in 2019, 2020, and 2021 are shown in Figure 1.
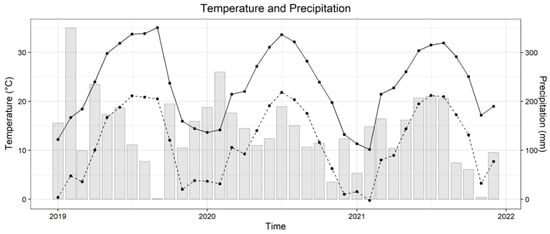
Figure 1.
Monthly temperature and precipitation from January 2019 to December 2021. The solid line is the average daily maximum temperature of the month; the dashed line is the average daily minimum temperature; grey bars are monthly precipitation (Data source: Mississippi State University Extension, Delta Agricultural Weather Center).
In spring 2019, before initiating the experiment and to provide baseline characterization, 20 soil cores were randomly taken at 0–15 cm depth using a 2.5 cm diameter soil probe and thoroughly mixed to form one composite sample from the experimental area. This composite soil sample was air-dried, ground to pass a 2.0 mm mesh, and analyzed for soil chemical properties (Table 1). Soil pH was measured on a 1:1 soil:calcium chloride solution (0.05 M) using a combination electrode (Accuphast electrode, Fisher Scientific, Pittsburg, PA, USA). Total C and N were measured using a Vario Max Cube Elemental CNS Analyzer (Elementar Americas, Inc. Mt. Laurel, NJ, USA). Soil P, K, Ca and Mg were extracted with Mehlich 3 procedure [36], and elements were quantified using inductively coupled plasma spectroscopy (ICP, Varian Analytical Instruments, Walnut Creek, CA, USA). Cation exchange capacity (CEC) was determined with the modified ammonium acetate compulsory displacement method [37].

Table 1.
Background chemical characteristics of soil at 0–15 cm depth and the mean of chemical properties of poultry litter, FGD gypsum and lignite across years.
In 2019, a study with a split-plot block design (Figure 2) was applied to the site in a 2 × 7 factorial scheme (considering cover crop vs. no cover crop as main plot and 7 rates of soil amendment and fertilizer as subplot) with three replicates (Figure 1). Three main plots (blocks) assigned for cover crop treatment (WCC) were planted with deep-rooted, winter cover crop mixture of daikon radish (Raphanus sativus var.), wheat (T. aestivum L.), crimson clover (Trifolium incarnatum) with the rate of 28, 67 and 3.9 kg ha−1, respectively, soon after the cash crop was harvested for grain and the stalks shredded. Cover crops were killed chemically 2 to 3 weeks before planting main crops. Three other main plots assigned for no cover crop treatment (NCC) were left fallow between cash crop growing seasons. Seven subplots in each block were assigned to treatments with different rates and combinations of soil amendments and fertilizers, including control; three rates of FGD gypsum and lignite (2:1 ratio) with urea ammonium nitrate (UAN); BL only; BL mixed with FGD and lignite; and UAN only (Table 2). The size of each subplot was 3.8 × 9 m2. The alleyways between blocks were 6 m wide.
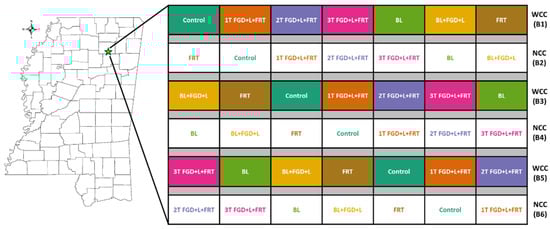
Figure 2.
Study site located in Pontotoc, MS (left), and the experiment design plot showing the cover crop main plots and soil amendments subplots (right, not to scale). WCC: with cover crop; NCC: no cover crop.
Table 2.
Application rates of soil amendment and fertilizer of seven treatments.
The cash crop corn (Zea maize L.) was planted in April and harvested in September (Table 3). In each subplot, four rows of corn were planted with 0.75 m row spacing. Poultry litter and UAN solution (urea ammonium nitrate, 33% N) were applied in early May. Poultry litter was collected fresh from the local broiler chicken operation each year. The FGD gypsum was obtained from a southern company power plant and had fine-grain, white and sand-like texture. Lignite was received from the Mississippi Coal Company. Major chemical characteristics of BL, FGD gypsum and lignite are provided in Table 1.
Table 3.
Field operations information during three years of study.
2.2. Soil CO2 Flux
During the cash crop seasons of 2019–2021, soil CO2 flux was measured from each subplot on 30 May, 19 June, 9 July, 1 and 21 August in 2019, 16 June, 6 and 22 July; 12 August in 2020; and 26 May, 30 June, and 16 August in 2021. Polyvinyl chloride collars (20 cm diameter, 11.4 cm height) were GPS-located and pre-placed in the 3rd crop row and centered lengthwise in each subplot after corn was planted. Collars were inserted into the soil and approximately 5 cm remained above the soil surface, with no corn growing within collars. The collars stayed in the field during corn growing season, were removed for harvest, and replaced in the same position the following year. Twenty-four hours prior to gas measurement, plant material within collars was clipped to less than 5 cm height to exclude the effects of plant respiration and photosynthesis. Before each measurement, collar height above the soil surface was taken at every 90° for 4 locations inside each collar and the mean was used to correct the actual volume within each chamber for flux calculation.
To take soil CO2 flux measurements, a semi-automated chamber (8200-01S, LiCor Inc., Lincoln, NE, USA) was situated tightly on top of the pre-placed collars. The chamber was paired with an infrared analyzer, the LI-8100A soil CO2 flux system (LiCor Inc., Lincoln, NE, USA), to monitor CO2 concentration inside the chamber once every second for 90 s. The chamber was pre-purged with air for 5 s before analysis and post-purged for 30 s with air between measurements to avoid cross-contamination between subplots. The automated chamber closing/opening, purge and analysis period were controlled via Wi-Fi-connected computer software provided by LiCor. SoilFluxProTM (LiCor Inc., Lincoln, NE, USA) was used to calculate soil CO2 flux over time based on the exponential increase in CO2 concentration. All flux measurements were taken from approximately 9 a.m. to noon to minimize inter-day variation caused by the diurnal pattern of soil CO2 flux.
2.3. Soil Temperature and Moisture
Soil temperature at 5 cm depth was measured in the field along with each gas measurement event using the LI-8100A temperature probe attached to the CO2 flux system. The probe was inserted into the soil within 20 cm outside of the collar and temperature was recorded by the system at the same intervals that it measured CO2 and H2O vapor concentrations.
Along with the flux measurements, triplicate soil samples (0–15 cm) were taken within 6 m of soil collars near plant roots from each subplot using a soil probe with an inner diameter of 4 cm. Soil samples from the same subplot were placed in a sterile plastic bag and transported in a cooler to the laboratory in the USDA-ARS Genetics and Sustainable Agriculture Research Unit for analysis. After arriving in the laboratory, soil samples were mixed and homogenized in the plastic bag with root and recognizable organic fragments greater than 2 mm in diameter removed. Soil moisture (gravimetric water content; water weight/dry soil weight × 100%) was determined from mass loss of 10 g subsample oven dried at 104 °C for 24 h.
2.4. Data and Statistical Analysis
Data and statistical analyses were performed using the R program (v 4.2.0, R Core Team and the R Foundation for Statistical Computing, Vienna, Austria). Cumulative CO2 flux between the first and last measurements of each year was calculated, that is, 30 May–21 August in 2019 (in total 84 days), 16 June–12 August in 2020 (in total 58 days) and 26 May–16 August in 2021 (in total 83 days). Briefly, the CO2 flux was first converted to daily flux with a unit of g C m−2 d−1. Linear data interpolation was applied between flux measurements using na.approx function in the R package “zoo” v. 1.8-9 [38]. The cumulative flux during the measurement period of each year was then calculated as the sum of the interpolated daily CO2 flux.
Due to the distinct gas and soil sampling schedules in different years, the statistical analyses were conducted for three years separately. For each year, soil CO2 flux, soil temperature, and soil moisture were analyzed by a three-way repeated measurements ANOVA with cover crop, soil amendment and sampling time as independent variables, using lmer function in R package “lmerTest” v. 3.1-3 [39]. The same function was applied for the two-way ANOVA of cumulative CO2 flux with cover crops and soil amendments as independent variables. Q-Q plots were made to visually check data normality. Data were transformed with a natural logarithm function to meet the assumptions of ANOVA where needed. Tukey’s tests were then conducted for multiple means comparisons, using the emmeans function in R package “emmeans” v 1.7.5 [40]. The relationships between soil CO2 flux and temperature and moisture were tested using Pearson’s product-moment correlation. Data plots were generated using R package “ggplot2” v. 3.3.6 [41].
3. Results
3.1. Soil Temperature and Moisture
Soil temperature showed significant temporal variation among measurement days for all three years (p < 0.001, Table 4), ranging from 26.7–35.5, 24.9–29.1 and 24.7–27.7 °C in 2019, 2020 and 2021, respectively (Figure 3). The effects of amendment treatment on soil temperature were not as evident as that of the measurement day but were significant in all three years (p < 0.01). The highest soil temperature was found between control and FRT treatment, while the lowest was among treatments with BL (BL and BL + FGD + L), and 3T FGD + L+FRT in the three years. The cover crops did not have significant effects on soil temperature in 2019 and 2020, but a notable difference between WCC (25.6 ± 0.1 °C, mean ± standard error) and NCC (26.2 ± 0.1 °C) was seen in 2021 (p < 0.05). Significant interactions among cover crop, amendment treatment and measurement day were not found, except for the interaction of cover crops and measurement days in 2021 (p < 0.001, Table 4). Notably, high soil temperature values were observed during the first measurement event in 2019, possibly due to the high air temperature of late May in 2019 (Figure 1), and the canopy of cash crops was not fully developed to provide shade to lower soil temperature.
Table 4.
Effects of cover crop, amendments, time and their interactions on soil parameters. The numbers presented in the table are p values from the ANOVA test. *—p < 0.05, **—p < 0.01, ***—p < 0.001, and NS—not significant.
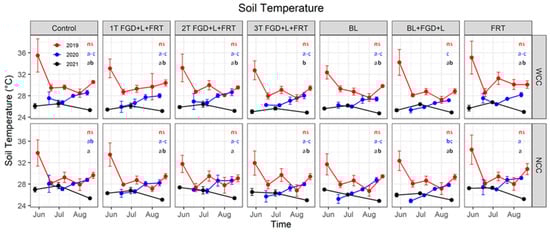
Figure 3.
Soil temperature at sampling events. Red, blue and blacklines represent soil temperature in 2019, 2020 and 2021, respectively. Solid cycles are the mean of replicates, and error bars are standard errors (n = 3). Red, blue and black letters show the results of Tukey’s multiple comparison tests for 2019, 2020 and 2021, respectively, with no letter in common denoting significant differences at α = 0.05 (ns: no significant difference). WCC: with cover crop; NCC: no cover crop.
Significant differences in soil moisture were only observed among measurement days (p < 0.001) but not found either with or without cover crops or among amendment treatments (Table 4). The interactive effects of cover crop, soil amendment and measurement day on soil moisture were not significant. Soil moisture ranged 6.4–13.6, 10.3–22.2 and 14.7–21.9% in 2019, 2020 and 2021, respectively (Figure 4), with the highest soil moisture generally observed in late July and early August.
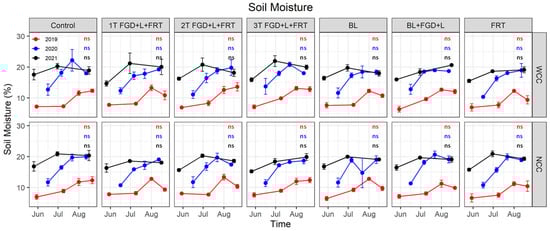
Figure 4.
Soil moisture at sampling events. Red, blue and black lines represent soil moisture in 2019, 2020 and 2021, respectively. Solid cycles are the mean of replicates, and error bars are standard errors (n = 3). Red, blue and black letters show the results of Tukey’s multiple comparison tests for 2019, 2020 and 2021, respectively, with no letter in common denoting significant differences at α = 0.05 (ns: no significant difference). WCC: with cover crop; NCC: no cover crop.
3.2. Soil CO2 Flux
Similar to soil temperature and moisture, significant differences in soil CO2 flux were constantly observed among measurement days (p < 0.001, Table 4). Averaged across the cover crop and soil amendment treatment, the soil CO2 flux in 2019 was significantly higher on 19 June (14.6 ± 3.0 µmol m−2 s−1, p < 0.05) and significantly lower on 21 August (1.6 ± 0.2 µmol m−2 s−1, p < 0.05) compared to flux on the other measurement days, ranging from 4.7 to 7.5 µmol m−2 s−1; in 2020, the flux significantly decreased (p < 0.05) in the order of 7.5 ± 0.2 µmol m−2 s−1 on 6 July, 6.5 ± 0.2 µmol m−2 s−1 on 22 July, 5.9 ± 0.2 µmol m−2 s−1 on 12 August, and 4.7 ± 0.2 µmol m−2 s−1 on 16 June; in 2021, the order was 9.9 ± 1.0 µmol m−2 s−1 on 30 June, 6.9 ± 0.4 µmol m−2 s−1 on 26 May, and 4.7 ± 0.3 µmol m−2 s−1 on 16 August.
The interaction between soil amendments and measurement days was also found to be significant for all three years (p < 0.001, Table 4), indicating that temporal changes in CO2 flux from plots that received various soil amendments were different, which can be seen in Figure 5. CO2 flux peaks are evident in the plots under BL treatment on 19 June 2019 both with and without cover crops (51.0 ± 24.3 and 41.8 ± 5.6 µmol m−2 s−1). The peak flux was 25% (with cover crop) and 39% (without cover crop) lower by integrating FGD gypsum and lignite with BL application. This pattern was not observed in 2020; moderate flux peaks appeared on 30 June 2021 for BL and BL + FGD + L treatments with and without cover crop, ranging from 14.6 to 23.7 µmol m−2 s−1.
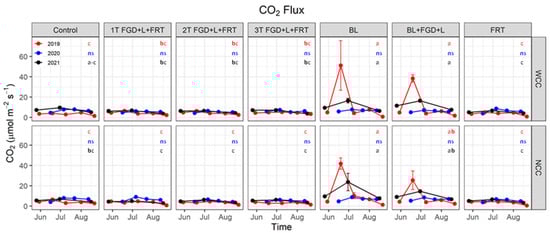
Figure 5.
Soil CO2 flux. Red, blue and black lines represent soil CO2 flux in 2019, 2020 and 2021, respectively. Solid cycles are the mean of replicates, and error bars are standard errors (n = 3). Red, blue and black letters show the results of Tukey’s multiple comparison tests for 2019, 2020 and 2021, respectively, with no letter in common denoting significant differences at α = 0.05 (ns: no significant difference). WCC: with cover crop; NCC: no cover crop.
The significant effects of soil amendment on soil CO2 flux were observed in 2019 and 2021 (p < 0.001) but not in 2020 (Table 4). Averaged flux across cover crops and measurement days for BL and BL + FGD + L treatments were 13.7 ± 3.9 and 10.5 ± 2.5 µmol m−2 s−1, respectively, in 2019, which were significantly higher (p < 0.05) than flux under other amendments (3.6–4.0 µmol m−2 s−1, Table S1). Similar differences were found in 2021 with flux for BL and BL + FGD + L treatments of 12.2 ± 1.9 and 11.0 ± 0.9 µmol m−2 s−1, respectively, and other treatments in the range of 4.8–6.4 µmol m−2 s−1. The effects of cover crops on soil CO2 flux were not shown until the third year (Table 4), with a significantly higher flux of 7.5 ± 0.5 µmol m−2 s−1 with cover crops (average across amendment treatments and measurement days) than 6.9 ± 0.7 µmol m−2 s−1 without cover crops.
3.3. Cumulative CO2 Flux
Analysis of variance for the cumulative CO2 flux showed no significant interaction of cover crops and soil amendments (p > 0.05, Table 5, Figure 6). The strong effects of soil amendment on flux were observed in 2019 and 2021 (p < 0.001) but not in 2020. Averaged across cover crops and no cover crops, cumulative CO2 flux for treatments BL were 22.44 ± 4.23 and 20.11 ± 17.15 g CO2-C m−2 in 2019 and 2021, respectively. Integration with FGD gypsum and lignite reduced the cumulative flux to 15.90 ± 1.88 and 17.15 ± 1.02 g CO2-C m−2 in 2019 and 2021, respectively. The two treatments that received BL had significantly higher cumulative flux than other treatments without BL, which had cumulative flux in the range of 5.58–5.92 g CO2-C m−2 in 2019 and 7.81–9.77 CO2-C m−2 in 2021. Cover crops marginally increased cumulative soil CO2 flux in 2019 and 2021 (p < 0.1). Averaged cumulative flux in 2019 was 10.25 ± 1.86 g CO2-C m−2 with cover crop, and 8.86 ± 1.44 g CO2-C m−2 without cover crop, while the values were 11.45 ± 1.01 and 10.83 ± 1.56 g CO2-C m−2 in 2021. Cover crops did not affect cumulative soil CO2 flux in 2020.
Table 5.
Effects of cover crop, amendment and their interactions on cumulative CO2 flux. The numbers presented in the table are p values from the ANOVA test. ***—p < 0.001, and NS—not significant.
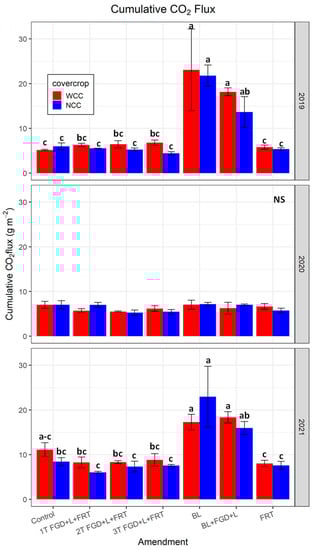
Figure 6.
Cumulative CO2 flux. Red and blue bars represent the mean of replicates, and error bars are standard errors (n = 3). Lower case letters with no common letters denoting significant differences of Tukey’s multiple comparison tests at α = 0.05 (NS: no significant difference). WCC: with cover crop; NCC: no cover crop.
3.4. Relationships between Soil CO2 Flux and Soil Parameters
Soil temperature and moisture are the most common abiotic variables affecting soil CO2 flux. The relationships between the natural logarithm of flux and soil temperature and moisture from each plot on all the measurement days are shown in Figure 7. The Pearson product-moment correlation revealed a significantly positive correlation between soil CO2 flux and moisture (r = 0.382, p < 0.001). The correlation of CO2 flux with soil temperature was not as strong as that with moisture (p = 0.054), and the flux tended to decrease when soil temperature increased.
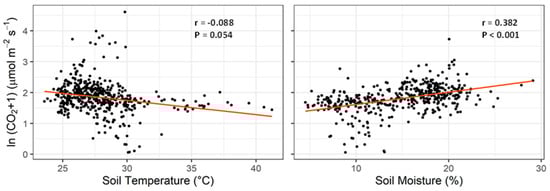
Figure 7.
Correlations between CO2 flux and soil temperature (left) and soil moisture (right).
4. Discussion
Accounting for more than one-third of arable land worldwide, agroecosystems play an important role in C storage and release of terrestrial C cycle [42,43]. Soil CO2 flux, together with plant photosynthesis and respiration, determines ecosystem net CO2 flux and whether an agroecosystem serves as a sink or source for atmospheric CO2. It is predicted that the agroecosystems can store up to 1 GT C per year, which offsets approximately 10% of annual global greenhouse gas emissions [44]. Recognizing the great potential of agroecosystems to serve as sinks of atmospheric CO2 and mitigate climate change, the development of agricultural practices maximizing agricultural soil C sequestration from the atmosphere is receiving growing attention. The implementation of these practices should be adapted to local soil and climate conditions, management opportunities and site-specific trade-offs [3]. Soil CO2 flux is the product of microbial-mediated decomposition of organic matter [30,31], and it is very sensitive to agricultural practices and varies with climatic conditions [45,46].
Our work is one of the few studies that evaluate the effects of sustainable practices on soil CO2 flux in southeastern USA agroecosystems. Excluding the extreme values at flux peaks, soil CO2 flux in this study ranged between 0.6–11.5 µmol m−2 s−1, which is within the same order of magnitude as the reported values in other southeastern USA cropping system: 0.8–5.8 µmol m−2 s−1 in a corn cropping system in northeast Alabama [47], 0.1 to 6 µmol m−2 s−1 in cotton cropping systems in northern Alabama [45], 7–14 µmol m−2 s−1 in a soybean cropping system in Mississippi [48] and 1.3–10.4 µmol m−2 s−1 in a corn and cotton rotation field in Mississippi [49]. Another study conducted in the subtropical climate but located in New South Wales, Australia had soil CO2 flux ranging between 2–16 µmol m−2 s−1 from corn fields, similar to the values in our study [50].
4.1. Temporal Change in Soil CO2 Flux
Temporal variability in soil CO2 flux has been widely reported in the field studies of both natural and managed ecosystems [45,48,49,51,52]. Similar with previous studies, the measurement day has the most significant effect (p < 0.001) on soil CO2 flux of our study, more so than cover crops and soil amendments (Table 4 and Figure 5). In cropping systems, temporal variation in soil CO2 flux occurs mainly due to changes in environmental drivers, as well as fertilizer application, crop harvest, tillage and other management events [45]. In our study, the flux temporal variability was likely attributed to the environmental drivers (e.g., temperature and precipitation) but not agricultural management as major management events did not occur during our measurement period (Table 3). This assumption is further supported by the observed correlations between CO2 flux and soil moisture (p < 0.001) and soil temperature (p = 0.0054, Figure 7). In our three-year study, the highest flux of each year occurred between late June and early July (Figure 5), consistent with another study in Mississippi [48].
Soil moisture and temperature, which are strongly regulated by air temperature and precipitation, are considered the two most common abiotic variables affecting soil CO2 flux [31,53]. Soil moisture exerts influences on CO2 flux by regulating both biotic (microbial aerobic and anaerobic respiration) and abiotic (nutrient transport and diffusion, and CO2 movement in the soil profile) processes [53,54]. Different correlations between CO2 flux and soil moisture have been reported in previous studies [45,52,55]. It is generally accepted that soil has the highest CO2 flux when soil-water-filled pore space (WFPS) is 60–75%, and WFPS increases CO2 flux when it is below this optimal range (water limiting) but decreases flux when above (aeration limiting) [54,55]. Soil moisture content during our measurement period was 4.5–29%, equivalent to the WFPS of 11.5–74% (using soil bulk density of 1.30 g cm−3 [18], and particle density of 2.65 g cm−3 for the conversion calculation), which falls in the water-limiting range [54], agreeing with the proportional relationship between soil CO2 flux and soil moisture in our study (Figure 7). Soil temperature is often considered to account for a large portion of seasonal and diurnal CO2 variation [53]. A marginal negative correlation was observed between soil temperature and CO2 flux in our study (Figure 7). Soil temperature during our measurement period ranged from 23.6 to 41.2 °C in which CO2 production was unlikely to be suppressed by high temperature as the optimal temperature for soil microbial respiration is reported between 38.5 to 46.0 °C and the respiration rate increases with temperature below the optimal temperature [56]. We hold the view that the negative correlation between soil CO2 flux and temperature is attributed to the lower soil moisture content under higher temperature conditions (r = −0.554, p < 0.001; Pearson product-moment correlation). Water availability is the primary limiting factor controlling dryland production in southeastern USA [18].
4.2. Effects of Fertilizer and Soil Amendment
In 2019 and 2021, clearly increased soil CO2 flux was found when BL was applied to the fields (Figure 5 and Figure 6), agreeing with previous studies in the southeast region, which reported higher soil CO2 flux in corn and cotton fields with BL application than those that received commercial fertilizers, such as UAN and ammonium nitrate [45,47]. The BL application rate is typically determined by the N rate, which often brings the excessive co-application of organic C, P and other macro- and micro-nutrients [10,11]. The concurrent large amount of bioavailable organic C, N and P in the BL provides abundant C, energy sources and substrates to the microorganisms for their growth and also increases microbial activities, leading to higher microbial respiration and cascading larger soil CO2 flux [30]. This notion is supported by greater microbial biomass C (28%), phosphatase (12%) and invertase (17%) in corn cropping systems with BL application than those receiving urea [6]. In our study, compared to the control treatment, which received neither commercial N fertilizer nor BL, treatments with UAN applications, including 1T FGD + L+FRT, 2T FGD + L+FRT, 3T FGD + L+FRT and FRT, did not show any increase in soil CO2 flux (Figure 5 and Figure 6). Together with significantly higher values from treatments with BL, our results indicate that the soil CO2 flux in this corn system is likely limited by labile organic C or co-limited by both C and N, which is reflected by the low TC content in our soil (Table 1).
The co-application of FGD gypsum and lignite with BL-reduced cumulative soil CO2 flux by 15–23% in 2019 and 2021 compared to those from treatment with BL alone but did not completely eliminate the rising effects of BL on soil CO2 flux (Figure 6). This reduction in flux is likely due to there being fewer available nutrients to microorganisms as FGD gypsum and lignite application can promote soil aggregations and the formation of insoluble complexes with nutrients in BL, which limit the nutrient accessibility both physically and chemically [23,24]. Pretreatments on the BL to reduce or stabilize C could be potential solutions to further avoid the increase in CO2 evolution from the low C content soil systems after BL applications. Caution also needs to be paid to management practices that would introduce a great amount of labile organic C into the upland cropping systems with low C content that can possibly result in substantial soil CO2 flux. Low C/N ratio and high content of mineral N in BL are also likely to create a favorable soil environment for producing nitrous oxide (N2O) [50,57,58], a potent greenhouse gas with a global warming potential of 298 times greater than CO2. Further studies need to include N2O flux measurement to provide a more holistic understanding of the effects of BL application on greenhouse gas flux.
The above differences in soil CO2 flux between treatments with and without BL were observed in 2019 and 2021 but not in 2020 (Figure 5 and Figure 6). If we look in more detail, differences in 2019 and 2021 were mainly triggered by the high flux peaks between late June and early July from plots that received BL, which were not observed in 2020 (Figure 5). We acknowledge the inter-year variation in soil CO2 flux caused by distinct climate conditions between years [48,49]. However, we are more inclined to reason that we might have missed the flux peaks of CO2 from the BL treatment in 2020, which warrant a measurement scheme with higher temporal resolution in future studies.
4.3. Effects of Cover Crop
The idea of sequestering atmospheric CO2 in agricultural soil by introducing cover crops has been generating interest in mitigating climate change and enhancing other ecosystem services [59]. Due to the lack of region-specific research and resistance to unproven practices, the adoption of cover crops in the southeast USA has been low [48]. Specific studies on the effects of cover crops on soil CO2 flux in this area are sorely lacking. In this study, we observed a significantly higher (8.7% higher, p < 0.05) averaged soil CO2 flux from the plots with cover crops than without cover crops in the third year but not in the first two years (Table 4 and Figure 5). Concurrently, significantly lower (p < 0.05) soil temperature was observed in the plots with cover crops than without cover crops in the third year (Table 4 and Figure 3). These phenomena are likely caused by the higher organic C accumulated in the soil systems with cover crops over three years. Cover crop has been reported to accumulate 0.32–0.56 Mg ha−1 y−1 soil organic C in the upper 30 cm soil depth across different regions [16]. As we mentioned earlier, soil respiration in our study site is possibly limited by C or co-limited by C and N, and higher organic C sequestered in soil by the introduction of cover crops leads to higher soil CO2 flux. Soil organic C also acts as an insulator and cools the soil during the high temperature period [60]. We cannot simply conclude that cover crops could increase soil CO2 flux in the upland cropping systems in the southeast area, as our results only account for the cash crop growing season. The pattern could be altered after including the soil CO2 flux during the winter cover crop growing season because it is reasonable to hypothesize that cover crops compete for available nutrients with soil microorganisms and lead to lower soil CO2 flux in cover crops than in fallow systems. Therefore, year-around studies, including both cash crop and cover crop seasons, are needed to provide a robust assessment to discern cover crop effects on soil CO2 flux.
5. Conclusions
Our work is one of the few studies evaluating the interactive effects of cover crops and soil amendments on soil CO2 flux in southeastern USA agroecosystems. Excluding the extreme values at flux peaks observed between late June and early July, soil CO2 flux in this study ranged from 0.6 to 11.5 µmol m−2 s−1. The application of BL led to a clear increase in cumulative CO2 flux during the cash crop growing season. The incorporation of FGD gypsum and lignite with BL application reduced soil CO2 flux but did not completely eliminate the rising effects of BL. Higher soil CO2 flux and lower soil temperature were observed from fields with cover crops than without cover crops in the third year of this study. Future research should assess year-round soil CO2 flux, as well as other greenhouse gases, especially N2O, with a high temporal resolution measurement scheme.
Supplementary Materials
The following supporting information can be downloaded at: https://www.mdpi.com/article/10.3390/environments10020019/s1, Table S1: Means and standard errors (SE) for CO2 fluxes of each year. Values followed by letters with no letter in common denote significantly different CO2 fluxes (Tukey’s test, α = 0.05).
Author Contributions
Conceptualization, J.H., D.M.M., A.A. and J.P.B.; methodology, D.M.M. and F.A.P.; formal analysis, J.H.; investigation, J.H. and D.M.M.; resources, D.M.M.; data curation, D.M.M., F.A.P. and R.S.; writing—original draft preparation, J.H.; writing—review and editing, D.M.M., A.A., J.P.B., F.A.P., F.L., X.L. and R.J.M.II; visualization, J.H., F.L. and X.L.; project administration, J.N.J. and R.J.M.II; funding acquisition, J.N.J. and R.J.M.II; All authors have read and agreed to the published version of the manuscript.
Funding
This work is supported by the United States Department of Agriculture Agricultural Research Service (USDA-ARS) NACA Award (58-6064-9-007): Advancement of UAS/UAV Application Systems.
Institutional Review Board Statement
Not applicable.
Informed Consent Statement
Not applicable.
Data Availability Statement
The data presented in this study are available on request from the corresponding author.
Conflicts of Interest
The authors declare no conflict of interest.
References
- Reiter, M.S. Chapter 7: Cash Crop Selection and Rotation. In Conservation Tillage Systems in the Southeast; Bergtold, J., Sailus, M., Eds.; Sustainable Agriculture Research and Education (SARE) Program; 2020; pp. 88–102. Available online: https://www.sare.org/wp-content/uploads/Conservation-Tillage-Systems-in-the-Southeast_compressed.pdf (accessed on 14 December 2022).
- Dhillon, J.; Li, X.; Bheemanahalli, R.; Reed, V. Mississippi State and County Level Yield Gap in Corn Production. Agric. Environ. Lett. 2022, 7, e20092. [Google Scholar] [CrossRef]
- Amelung, W.; Bossio, D.; de Vries, W.; Kögel-Knabner, I.; Lehmann, J.; Amundson, R.; Bol, R.; Collins, C.; Lal, R.; Leifeld, J.; et al. Towards a Global-Scale Soil Climate Mitigation Strategy. Nat. Commun. 2020, 11, 5427. [Google Scholar] [CrossRef] [PubMed]
- Adeli, A.; Brooks, J.P.; Read, J.J.; Miles, D.M.; Shankle, M.W.; Jenkins, J.N. Impact of Cover Crop on Nutrient Losses in an Upland Soil. Commun. Soil Sci. Plant Anal. 2021, 52, 536–550. [Google Scholar] [CrossRef]
- Lassaletta, L.; Billen, G.; Grizzetti, B.; Anglade, J.; Garnier, J. 50 Year Trends in Nitrogen Use Efficiency of World Cropping Systems: The Relationship between Yield and Nitrogen Input to Cropland. Environ. Res. Lett. 2014, 9, 105011. [Google Scholar] [CrossRef]
- Fereidooni, M.; Raiesi, F.; Fallah, S. Ecological Restoration of Soil Respiration, Microbial Biomass and Enzyme Activities through Broiler Litter Application in a Calcareous Soil Cropped with Silage Maize. Ecol. Eng. 2013, 58, 266–277. [Google Scholar] [CrossRef]
- Adeli, A.; Brooks, J.P.; Miles, D.; Misna, T.; Feng, G.; Jenkins, J.N. Combined Effects of Organic Amendments and Fertilization on Cotton Growth and Yield. Agron. J. 2022, 114, 3445–3456. [Google Scholar] [CrossRef]
- Tewolde, H.; Adeli, A.; Sistani, K.R.; Rowe, D.E.; Johnson, J.R. Equivalency of Broiler Litter to Ammonium Nitrate as a Cotton Fertilizer in an Upland Soil. Agron. J. 2010, 102, 251–257. [Google Scholar] [CrossRef]
- Adeli, A.; Read, J.J.; Brooks, J.P.; Miles, D.; Feng, G.; Jenkins, J.N. Broiler Litter × Industrial By-Products Reduce Nutrients and Microbial Losses in Surface Runoff When Applied to Forages. J. Environ. Qual. 2017, 46, 339–347. [Google Scholar] [CrossRef]
- Veum, K.S.; Goyne, K.W.; Motavalli, P.P.; Udawatta, R.P. Runoff and Dissolved Organic Carbon Loss from a Paired-Watershed Study of Three Adjacent Agricultural Watersheds. Agric. Ecosyst. Environ. 2009, 130, 115–122. [Google Scholar] [CrossRef]
- Sistani, K.R.; Torbert, H.A.; Way, T.R.; Bolster, C.H.; Pote, D.H.; Warren, J.G. Broiler Litter Application Method and Runoff Timing Effects on Nutrient and Escherichia Coli Losses from Tall Fescue Pasture. J. Environ. Qual. 2009, 38, 1216–1223. [Google Scholar] [CrossRef]
- Adeli, A.; Shankle, M.W.; Tewolde, H.; Sistani, K.R.; Rowe, D.E. Nutrient Dynamics from Broiler Litter Applied to No-till Cotton in an Upland Soil. Agron. J. 2008, 100, 564–570. [Google Scholar] [CrossRef]
- Adeli, A.; Tewolde, H.; Shankle, M.W.; Way, T.R.; Brooks, J.P.; McLaughlin, M.R. Runoff Quality from No-Till Cotton Fertilized with Broiler Litter in Subsurface Bands. J. Environ. Qual. 2013, 42, 284–291. [Google Scholar] [CrossRef]
- Sharpe, R.R.; Schomberg, H.H.; Harper, L.A.; Endale, D.M.; Jenkins, M.B.; Franzluebbers, A.J. Ammonia Volatilization from Surface-Applied Poultry Litter under Conservation Tillage Management Practices. J. Environ. Qual. 2004, 33, 1183–1188. [Google Scholar] [CrossRef]
- Halde, C.; Gulden, R.H.; Entz, M.H. Selecting Cover Crop Mulches for Organic Rotational No-till Systems in Manitoba, Canada. Agron. J. 2014, 106, 1193–1204. [Google Scholar] [CrossRef]
- Blanco-Canqui, H.; Ruis, S.J.; Holman, J.D.; Creech, C.F.; Obour, A.K. Can Cover Crops Improve Soil Ecosystem Services in Water-Limited Environments? A Review. Soil Sci. Soc. Am. J. 2022, 86, 1–18. [Google Scholar] [CrossRef]
- Abdalla, M.; Hastings, A.; Cheng, K.; Yue, Q.; Chadwick, D.; Espenberg, M.; Truu, J.; Rees, R.M.; Smith, P. A Critical Review of the Impacts of Cover Crops on Nitrogen Leaching, Net Greenhouse Gas Balance and Crop Productivity. Glob. Chang. Biol. 2019, 25, 2530–2543. [Google Scholar] [CrossRef]
- Adeli, A.; Brooks, J.P.; Read, J.J.; Feng, G.; Miles, D.; Shankle, M.W.; Barksdale, N.; Jenkins, J.N. Management Strategies on an Upland Soil for Improving Soil Properties. Commun. Soil Sci. Plant Anal. 2020, 51, 413–429. [Google Scholar] [CrossRef]
- Adeli, A.; Brooks, J.P.; Read, J.J.; Shankle, M.W.; Feng, G.; Jenkins, J.N. Poultry Litter and Cover Crop Integration into No-till Cotton on Upland Soil. Agron. J. 2019, 111, 2097–2107. [Google Scholar] [CrossRef]
- Norton, L.D. Gypsum Soil Amendment as a Management Practice in Conservation Tillage to Improve Water Quality. J. Soil Water Conserv. 2008, 63, 46A–48A. [Google Scholar] [CrossRef]
- Reddy, K.R.; Hu, J.; Villapando, O.; Bhomia, R.K.; Vardanyan, L.; Osborne, T. Long-Term Accumulation of Macro- and Secondary Elements in Subtropical Treatment Wetlands. Ecosphere 2021, 12, e03787. [Google Scholar] [CrossRef]
- Reddy, K.R.; Vardanyan, L.; Hu, J.; Villapando, O.; Bhomia, R.K.; Smith, T.; Harris, W.G.; Newman, S. Soil Phosphorus Forms and Storage in Stormwater Treatment Areas of the Everglades: Influence of Vegetation and Nutrient Loading. Sci. Total Environ. 2020, 725, 138442. [Google Scholar] [CrossRef]
- Palumbo, A. v.; McCarthy, J.F.; Amonette, J.E.; Fisher, L.S.; Wullschleger, S.D.; Lee Daniels, W. Prospects for Enhancing Carbon Sequestration and Reclamation of Degraded Lands with Fossil-Fuel Combustion by-Products. Adv. Environ. Res. 2004, 8, 425–438. [Google Scholar] [CrossRef]
- Kalaichelvi, K.; Chinnusamyl, C.; Swaminathan, A.A. Exploiting the Natural Resource -Lignite Humic Acid in Agriculture-A Review. Agric. Rev. 2006, 27, 276–283. [Google Scholar]
- Chen, D.; Sun, J.; Bai, M.; Dassanayake, K.B.; Denmead, O.T.; Hill, J. A New Cost-Effective Method to Mitigate Ammonia Loss from Intensive Cattle Feedlots: Application of Lignite. Sci. Rep. 2015, 5, 1–5. [Google Scholar] [CrossRef]
- Qian, J.; Shen, M.; Wang, P.; Wang, C.; Hu, J.; Hou, J.; Ao, Y.; Zheng, H.; Li, K.; Liu, J. Co-Adsorption of Perfluorooctane Sulfonate and Phosphate on Boehmite: Influence of Temperature, Phosphate Initial Concentration and PH. Ecotoxicol. Environ. Saf 2017, 137, 71–77. [Google Scholar] [CrossRef]
- Pokhrel, S.; Kingery, W.L.; Cox, M.S.; Shankle, M.W.; Shanmugam, S.G. Impact of Cover Crops and Poultry Litter on Selected Soil Properties and Yield in Dryland Soybean Production. Agronomy 2021, 11, 119. [Google Scholar] [CrossRef]
- Adeli, A.; Sheng, J.; Jenkins, J.N.; Feng, G. Composting and Gypsum Amendment of Broiler Litter to Reduce Nutrient Leaching Loss. J. Environ. Qual. 2015, 44, 676–683. [Google Scholar] [CrossRef]
- Franzluebbers, A.J. Soil Organic Carbon Sequestration and Agricultural Greenhouse Gas Emissions in the Southeastern USA. Soil Tillage Res 2005, 83, 120–147. [Google Scholar] [CrossRef]
- Reddy, K.R.; DeLaune, R.D. Biogeochemistry of Wetlands: Science and Applications; CRC Press: Boca Raton, FL, USA, 2008; ISBN 9781566706780. [Google Scholar]
- Hu, J.; VanZomeren, C.M.; Inglett, K.S.; Wright, A.L.; Clark, M.W.; Reddy, K.R. Greenhouse Gas Emissions under Different Drainage and Flooding Regimes of Cultivated Peatlands. J. Geophys. Res. Biogeosci. 2017, 122, 3047–3062. [Google Scholar] [CrossRef]
- Hu, J.; Liao, X.; Vardanyan, L.G.; Huang, Y.; Inglett, K.S.; Wright, A.L.; Reddy, K.R. Duration and Frequency of Drainage and Flooding Events Interactively Affect Soil Biogeochemistry and N Flux in Subtropical Peat Soils. Sci. Total Environ. 2020, 727, 138740. [Google Scholar] [CrossRef]
- Hu, J.; Inglett, K.S.; Wright, A.L.; Clark, M.W.; Reddy, K.R. Nitrous Oxide Dynamics during Denitrification along a Hydrological Gradient of Subtropical Grasslands. Soil Use Manag. 2020, 36, 682–692. [Google Scholar] [CrossRef]
- Qian, J.; Liu, J.; Wang, P.; Wang, C.; Hu, J.; Li, K.; Lu, B.; Tian, X.; Guan, W. Effects of Riparian Land Use Changes on Soil Aggregates and Organic Carbon. Ecol. Eng. 2018, 112, 82–88. [Google Scholar] [CrossRef]
- WorldClimate Pontotoc, Mississippi Climate. Available online: http://www.worldclimate.com/climate/us/mississippi/pontotoc (accessed on 4 October 2022).
- Mehlich, A. Mehlich 3 Soil Test Extractant: A Modification of Mehlich 2 Extractant. Commun. Soil Sci. Plant Anal. 1984, 15, 1409–1416. [Google Scholar] [CrossRef]
- Havlin, J.; Tisdale, S.; Nelson, W.; Beaton, J. Soil Fertility and Fertilizers: An Introduction to Nutrient Management, 8th ed.; Pearson: London, UK, 2013; ISBN 978-0135033739. [Google Scholar]
- Zeileis, A.; Grothendieck, G. Zoo: S3 Infrastructure for Regular and Irregular Time Series. J. Stat. Softw. 2005, 14, 1–27. [Google Scholar] [CrossRef]
- Kuznetsova, A.; Brockhoff, P.B.; Christensen, R.H.B. LmerTest Package: Tests in Linear Mixed Effects Models. J. Stat. Softw. 2017, 82, 1–26. [Google Scholar] [CrossRef]
- Searle, S.R.; Speed, F.M.; Milliken, G.A. Estimated Marginal Means, Aka Least-Squares Means [R Package Emmeans Version 1.8.1-1]. Am. Stat. 2022, 34, 216–221. [Google Scholar]
- Wickham, H. Ggplot2: Elegant Graphics for Data Analysis; Springer: New York, NY, USA, 2016. [Google Scholar]
- Carbon Cycle Institute Carbon Farming. Available online: www.carboncycle.org (accessed on 22 March 2022).
- Lal, R. Soil Carbon Sequestration Impacts on Global Climate Change and Food Security. Science (1979) 2004, 304, 1623–1627. [Google Scholar] [CrossRef]
- Jansson, C.; Faiola, C.; Wingler, A.; Zhu, X.G.; Kravchenko, A.; de Graaff, M.A.; Ogden, A.J.; Handakumbura, P.P.; Werner, C.; Beckles, D.M. Crops for Carbon Farming. Front. Plant Sci. 2021, 12, 938. [Google Scholar] [CrossRef]
- Roberson, T.; Reddy, K.C.; Reddy, S.S.; Nyakatawa, E.Z.; Raper, R.L.; Reeves, D.W.; Lemunyon, J. Carbon Dioxide Efflux from Soil with Poultry Litter Applications in Conventional and Conservation Tillage Systems in Northern Alabama. J. Environ. Qual. 2008, 37, 535–541. [Google Scholar] [CrossRef]
- Huang, Y.; Ciais, P.; Luo, Y.; Zhu, D.; Wang, Y.; Qiu, C.; Goll, D.S.; Guenet, B.; Makowski, D.; de Graaf, I.; et al. Tradeoff of CO2 and CH4 Emissions from Global Peatlands under Water-Table Drawdown. Nat. Clim Chang. 2021, 11, 618–622. [Google Scholar] [CrossRef]
- Smith, K.; Watts, D.; Way, T.; Torbert, H.; Prior, S. Impact of Tillage and Fertilizer Application Method on Gas Emissions in a Corn Cropping System. Pedosphere 2012, 22, 604–615. [Google Scholar] [CrossRef]
- Firth, A.G.; Brooks, J.P.; Locke, M.A.; Morin, D.J.; Brown, A.; Baker, B.H. Dynamics of Soil Organic Carbon and CO2 Flux under Cover Crop and No-Till Management in Soybean Cropping Systems of the Mid-South (USA). Environments 2022, 9, 109. [Google Scholar] [CrossRef]
- Miles, D.M.; Hu, J.; Adeli, A.; Brooks, J.P.; Podrebarac, F.; Smith, R.; Jenkins, J.N.; Moorhead, R.J. Soil Respiration within a Corn and Cotton Rotation: Effects of Cover Cropping Strategy in the Humid Southeastern United States. Environments 2022. submitted. [Google Scholar]
- van Zwieten, L.; Kimber, S.W.L.; Morris, S.G.; Singh, B.P.; Grace, P.R.; Scheer, C.; Rust, J.; Downie, A.E.; Cowie, A.L. Pyrolysing Poultry Litter Reduces N2O and CO2 Fluxes. Sci. Total Environ. 2013, 465, 279–287. [Google Scholar] [CrossRef] [PubMed]
- Imer, D.; Merbold, L.; Eugster, W.; Buchmann, N. Temporal and Spatial Variations of Soil CO2, CH4 and N2O Fluxes at Three Differently Managed Grasslands. Biogeosciences 2013, 10, 5931–5945. [Google Scholar] [CrossRef]
- Adams, T.; Ashworth, A.J.; Sauer, T. Soil CO2 Evolution Is Driven by Forage Species, Soil Moisture, Grazing Pressure, Poultry Litter Fertilization, and Seasonality in Silvopastures. Agrosystems Geosci. Environ. 2021, 4, e20179. [Google Scholar] [CrossRef]
- Davidson, E.A.; Belk, E.; Boone, R.D. Soil Water Content and Temperature as Independent or Confounded Factors Controlling Soil Respiration in a Temperate Mixed Hardwood Forest. Glob. Chang Biol. 1998, 4, 217–227. [Google Scholar] [CrossRef]
- Linn, D.M.; Doran, J.W. Effect of Water-Filled Pore Space on Carbon Dioxide and Nitrous Oxide Production in Tilled and Nontilled Soils. Soil Sci. Soc. Am. J. 1984, 48, 1267–1272. [Google Scholar] [CrossRef]
- Ding, W.; Yu, H.; Cai, Z.; Han, F.; Xu, Z. Responses of Soil Respiration to N Fertilization in a Loamy Soil under Maize Cultivation. Geoderma 2010, 155, 381–389. [Google Scholar] [CrossRef]
- Liu, Y.; He, N.; Wen, X.; Xu, L.; Sun, X.; Yu, G.; Liang, L.; Schipper, L.A. The Optimum Temperature of Soil Microbial Respiration: Patterns and Controls. Soil Biol. Biochem. 2018, 121, 35–42. [Google Scholar] [CrossRef]
- Hu, J.; Inglett, K.S.; Wright, A.L.; Reddy, K.R. Nitrous Oxide Production and Reduction in Seasonally-Flooded Cultivated Peatland Soils. Soil Sci. Soc. Am. J. 2016, 80, 783–793. [Google Scholar] [CrossRef]
- Hu, J.; Inglett, K.S.; Clark, M.W.; Inglett, P.W.; Ramesh Reddy, K. Nitrous Oxide Production and Consumption by Denitrification in a Grassland: Effects of Grazing and Hydrology. Sci. Total Environ. 2015, 532, 702–710. [Google Scholar] [CrossRef] [PubMed]
- Blanco-Canqui, H. Cover Crops and Carbon Sequestration: Lessons from U.S. Studies. Soil Sci. Soc. Am. J. 2022, 86, 501–519. [Google Scholar] [CrossRef]
- Zhu, D.; Ciais, P.; Krinner, G.; Maignan, F.; Jornet Puig, A.; Hugelius, G. Controls of Soil Organic Matter on Soil Thermal Dynamics in the Northern High Latitudes. Nat. Commun. 2019, 10, 1–9. [Google Scholar] [CrossRef]
Disclaimer/Publisher’s Note: The statements, opinions and data contained in all publications are solely those of the individual author(s) and contributor(s) and not of MDPI and/or the editor(s). MDPI and/or the editor(s) disclaim responsibility for any injury to people or property resulting from any ideas, methods, instructions or products referred to in the content. |
© 2023 by the authors. Licensee MDPI, Basel, Switzerland. This article is an open access article distributed under the terms and conditions of the Creative Commons Attribution (CC BY) license (https://creativecommons.org/licenses/by/4.0/).