Abstract
Methane and other hydrocarbons are major components of the mantle regions of icy planets. Several recent computational studies have investigated the high-pressure behaviour of specific hydrocarbons. To develop a global picture of hydrocarbon stability, to identify relevant decomposition reactions, and probe eventual formation of diamond, a complete study of all hydrocarbons is needed. Using density functional theory calculations we survey here all known C-H crystal structures augmented by targeted crystal structure searches to build hydrocarbon phase diagrams in the ground state and at elevated temperatures. We find that an updated pressure-temperature phase diagram for methane is dominated at intermediate pressures by CH:H van der Waals inclusion compounds. We discuss the P-T phase diagram for CH and CH (i.e., polystyrene and polyethylene) to illustrate that diamond formation conditions are strongly composition dependent. Finally, crystal structure searches uncover a new CH(H van der Waals compound, the most hydrogen-rich hydrocarbon, stable between 170 and 220 GPa.
1. Introduction
The current understanding of the interiors of icy planets such as Neptune and Uranus involves a mantle region formed by methane, ammonia and water ice, present roughly in solar abundances, which is exposed to pressures up to several 100s GPa and temperatures of thousands of Kelvin [1]. Ammonia and water can form hydrogen-bonded compounds, by themselves and as mixtures, and under extreme conditions exhibit structural transitions characterised by hydrogen bond rearrangements and symmetrisation, auto-ionisation, and superionicity [2,3,4,5,6,7,8,9]. Methane and heavier saturated hydrocarbons, on the other hand, contain no lone pairs, can not form hydrogen bonds and therefore will have different high pressure responses, perhaps favouring decomposition reactions instead. Methane itself has a complex phase diagram [10,11,12,13,14,15] which is crucial for describing the convection processes within planetary interiors. It has long been suggested that methane will undergo decomposition into diamond and hydrogen at temperatures and pressures found in icy planets [16,17,18]. If methane were to decompose to form diamond, the latter would precipitate whereas any remaining hydrocarbons might dissipate into the atmosphere [16], potentially providing a missing hydrocarbon production mechanism in atmospheric models [19]. Static room temperature compression experiments using optical absorption measurements [20], X-ray diffraction [21] and Raman spectroscopy [22] found no such decomposition up to 288 GPa. However experiments performed at higher temperatures suggest a gradual polymerisation beginning at around 1100 K leading to diamond formation at 3000 K at pressures above just 10 GPa [23,24], indicating not a pressure but temperature induced polymerisation. First-principles molecular dynamics calculations of methane at high pressure and temperature indicate a decomposition path via a mixture of hydrocarbons plus excess hydrogen, with the former eventually decomposing to diamond above 300 GPa and 4000 K [17].
Upon cooling at atmospheric pressure, methane crystallises into an orientationally disordered phase I [25], with molecules on the sites of a face centered cubic lattice. Upon further cooling, it gains partial orientational order in the phase II structure of symmetry. The ordering continues, along with some reorientation, with increasing pressure as it transitions to a tetragonal phase III [10] followed by an even more ordered phase IV. Phases V and VI exhibit a hexagonal close packed structure and are found at low temperatures above 0.5 and 1 GPa respectively [13]. At higher temperatures exist phases A, a strongly distorted form of phase I [14], and B, in which the structure mimics that of -Mn [15]. A crystal structure prediction study aimed to extend methane’s phase diagram to higher pressures at low temperatures [18]. It reported a series of orthorhombic high-pressure phases of methane; above 95 GPa the decomposition into a series of increasingly longer hydrocarbon chains (CH, CH, and CH) plus excess molecular hydrogen; and above 287 GPa at 0 K (225 GPa at 1400 K) the decomposition into pure H and diamond.
Beyond methane, longer hydrocarbons could have facilitated the production of organic molecules on the early Earth through impact-shock events [26,27,28,29]. It is important to understand their response to the extreme pressure and temperature conditions present in such events, in particular the creation of specific reaction products. However, hydrocarbon chemistry is driven by kinetic effects, which also applies to reactions under high pressure: compressed benzene, CH, can polymerise under specific experimental conditions to form carbon nanothreads [30,31,32], which have promising mechanical properties and can be recovered to ambient conditions despite being clearly metastable. While exciting for materials science purposes, this path-dependence and longevity of metastable phases further complicates our understanding of hydrocarbons under pressure.
Dynamic compression experiments on hydrocarbons are used to probe their properties at combined high-pressure and -temperature conditions [33,34,35,36,37,38,39,40], both to investigate their potential decomposition, but also to better understand a critical ablator material used in inertial confinement fusion experiments. The thermal equation of state of hydrocarbons has therefore been a subject of several ab initio molecular dynamics studies [41,42,43,44,45,46]. Recent shock experiments on polystyrene ([CH]) [37,38] reported its decomposition into diamond, however only above 140 GPa and 4000 K in an apparent disagreement with diamond anvil cell experiments [23,24]. On the other hand, compressed polyethylene did not form diamond up to 200 GPa and 5000 K, instead retaining a crystalline polyethylene structure up to 190 GPa and 3500 K [40]. Kraus et al. [37] compare their polystyrene measurements to the diamond formation conditions found in static methane compression as well as an extrapolation of the diamond formation line (CH + 3 H 4 C + 8 H) obtained in first-principles calculations [18]. However, diamond formation in carbon rich samples like [CH] could begin at significantly lower pressures than in CH, because the global stoichiometry suggests that decomposition into long hydrocarbons and excess carbon could be a viable reaction pathway.
There is then scope to revisit the C-H phase diagram and its stable compounds as obtained from first-principles calculations. This will allow us to predict more precisely the conditions upon which diamond should form from various initial hydrocarbon species. It is also timely to update the methane phase diagram reported by Gao et al., as several potentially stable C-H species have been proposed in the intervening period. These comprise a new stable phase for CH [47] and various van der Waals inclusion compounds of the type (CH)(H). A series of 1:1 compounds (stoichiometry CH) have been reported to be more stable than methane and hydrogen above 28 GPa, before decomposing above 233 GPa [48]. A 2:3 compound (CH) was found to be stable between 10 and 215 GPa [49]. However, none of these recent works consider all of the other reported structures, and it is therefore unclear at present which hydrocarbons are in fact stable.
Here, we construct an updated picture of the C-H binary phase diagram by compiling all known CH structures present in the literature [18,47,48,49,50]. We also include results from new structure searching calculations that are motivated by the presence of stoichiometric van der Waals inclusion compounds. A recent experimental study reported the van der Waals compound Ar(H) to be stable at least up to 358 GPa [51]. Since Ar is of similar size to the CH molecule, it is conceivable that a 1:2 inclusion compound (CH)(H) can form at high pressure; and we find indeed that such a compound is stable. With stoichiometry CH this is not only the most hydrogen-rich hydrocarbon compound known, but also with 20 wt% releasable hydrogen content one of the most efficient hydrogen storage materials. In addition, we find another new inclusion compound with composition 2:1 (CH stoichiometry) that is very close to stability at lower pressures. Overall, the picture that emerges for compressed hydrocarbons is notably more complex than previously thought. Several inclusion compounds are stable (or close to stability) up to 200 GPa. Methane’s decomposition involves a sequence of the recently reported inclusion compounds, making the disintegration of the CH molecule an unusually prolonged process. In addition, we point out that for a sample of polystyrene stoichiometry, diamond should form already at pressures below 40 GPa, while the persistence of polyethylene beyond 200 GPa can be rationalized by the small free energy gain available in decomposition reactions.
2. Materials and Methods
We considered all hitherto proposed C-H structures in electronic structure calculations, geometry optimisations, and phonon calculations with the CASTEP code [52]. Specifically, we included the following structures (see Figure 1 and Figure 2):
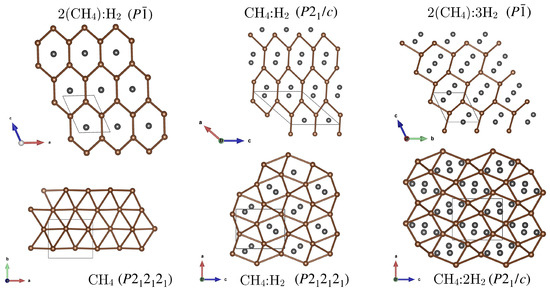
Figure 1.
Illustrations of methane sublattice connectivities in van der Waals inclusion compounds. Carbon atoms are indicated in brown, H molecules in dark grey; methane hydrogen atoms are omitted. The methane network is indicated by brown lines connecting carbon vertices. (CH)H-, CH(H)-, and (CH)(H)- have a common methane network. Both the CH(H)- and CH(H)- phases correspond to increasing distortions of the pure methane CH- network.
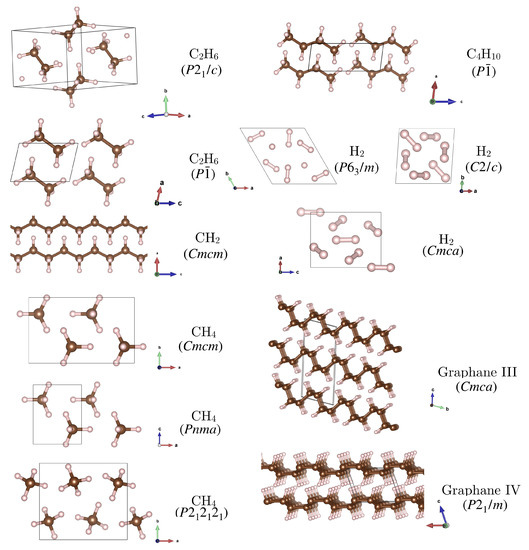
Figure 2.
Hydrocarbon structures (other than inclusion compounds) considered in this work. These were first reported in the following references: CH (): [47,49]; CH (), CH, CH, CH: [18]; H: [53]; graphane III and IV: [50].
- For methane, CH, we included the three high pressure phases reported by Gao et al. [18]: a phase which was reported to be stable up to 78 GPa, where it is succeeded by a phase, and a phase stable above 90 GPa. The latter two are very similar: has two of the CH molecules flipped compared to , such that it has two molecules in the unit cell.
- For ethane, CH, we include the phase that was found relevant in the methane phase diagram above 90 GPa [18], as well as a phase reported later [49], where the molecules are arranged in an energetically favoured herringbone formation.
- For butane, CH, we considered a triclinic phase with molecules in the unit cell [18].
- For polyethylene, infinite chains of CH, we considered a phase [18]. We also considered three phases of , , and symmetry reported in an earlier study up to 40 GPa [54], but found the most stable of those () unstable against the phase at 40 GPa and beyond.
- For the stoichiometry CH the arrangement in graphane sheets is more favourable at high pressure than, e.g., formation of a molecular benzene crystal [50]. We consider two of the most stable high-pressure structures, graphane III () and IV (), with a transition III → IV predicted to occur at 220 GPa [50]. These structures feature distinct layers with graphane III consisting of ‘chair’ shaped sheets and graphane IV consisting of ‘boat’ shaped sheets.
- Finally, several hydrogen-rich hydrocarbons, in the form of (CH)(H) inclusion compounds, have been reported in the literature [48,49]. We consider the 1:1 compounds with space groups and [48] and a 2:3 compound with space group [49].
In all calculations, exchange-correlation effects were described within the generalised gradient approximation (GGA) using the Perdew-Burke-Ernzerhof (PBE) functional [55] and ultrasoft pseudopotentials as generated ‘on-the-fly’ by CASTEP with cut-off radii of 1.4 Bohr for carbon, with valence space 2s2p, and 0.6 Bohr for hydrogen. Geometry optimisations were performed with plane wave cut-offs of 1000 eV and Monkhorst-Pack k-point spacings [56] of no more than Å.
Phonon calculations were performed using the supercell finite displacement method [57] with supercells forming the closest possible fits to cubic boxes, with lattice lengths at least 10 Å. The phonon calculations were performed with plane wave cut-offs of 700 eV and k-point spacings of around Å. These were found to give sufficiently converged energies, forces and phonon densities of states.
Zero point energy (ZPE) and entropy calculations were performed using the harmonic approximation by which the Gibbs free energy can be calculated as . There, where is the phonon frequency averaged over the Brillouin zone and where is the phonon density of states, and is the reciprocal of the thermodynamic temperature. Full phonon calculations were performed at pressures in intervals of 20 GPa and the entropy integral was computed in temperature intervals of 50 K. Using these contributions, the free energy surface as a function of pressure and temperature can be calculated for each phase at a specific stoichiometry and interpolated onto a grid of 0.1 K by 0.1 GPa. Stability regions can then be estimated by finding the phase with the lowest free energy at a given condition. Phase transition lines are found as the intersects of these free energy surfaces.
We performed structure searches for various hydrogen-rich hydrocarbons. Unbiased particle swarm optimisation searches were carried out using the CALYPSO code [58] interfaced with CASTEP on a range of CH stoichiometries () at 100 and 200 GPa for unit cells containing a range from 2–16 formula units (fu.) dependant on resulting system size. Specifically, this includes generating between 800 and 6000 structures for the following stoichiometries: CH (4,8,16 fu. 4500 struct.), CH (2,4 fu. 3500 struct.), CH (4,8,16 fu. 4500 struct.), CH (2,4,8 fu. 6000 struct), CH (1,2 fu. 800 struct.), CH (2,4 fu. 6000 struct.), CH (2,4 fu. 4500 struct.), CH (2,4 fu. 4500 struct.). For most stoichiometries these searches recovered the best structures known in the literature. In addition, two new van der Waals compounds of stoichiometry CH and CH were found. More details about the outcomes of these searches are given in Appendix A of this paper.
3. Results
3.1. Ground State Phase Evolution of CH
An initial estimation of stable phases and their transition pressures in the CH phase diagram can be made by considering simply the ground state enthalpies of all candidate structures. While we anticipate that the stability of C-H compounds will depend heavily on the zero point energy (ZPE), these calculations provide a good first approximation. Figure 3 shows the relative enthalpies of methane phases or decomposition products, calculated using the PBE functional, and without considering ZPE. In this work we only discuss phases above 20 GPa. At lower pressures, weak dispersion-type interactions would be expected to contribute significantly to the cohesive energies, and these are not captured with the semilocal PBE functional. Note, however, that both empirical and density-based dispersion-corrected functionals can severely overbind interactions in hydrogen-rich molecular systems at low pressures, to the extent that PBE gives qualitatively better results [59,60]. In addition, at 20 GPa and above the van der Waals space is effectively squeezed out in all compounds—see Appendix B for a geometrical analysis of intermolecular separations. Taken together, we expect PBE to perform satisfactorily in the pressure range studied here and across the range of structural motifs that emerge in the different hydrocarbons.
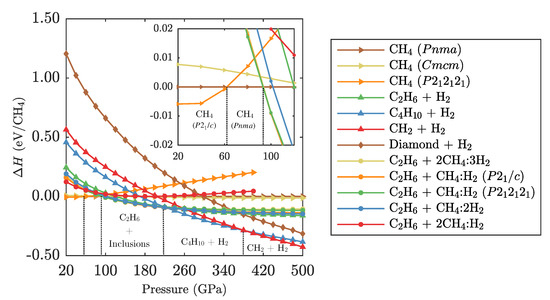
Figure 3.
Ground state PBE enthalpies of relevant CH phases and phase mixtures relative to CH-. Enthalpies are normalised per unit of CH. For example, “Diamond + H” refers to . Inset shows the low pressure region in more detail.
The methane phase sequence of , followed above 62 GPa by , agrees with the literature [18]. Over the relevant pressure range the and phases of methane are within 6 meV of each other and are as such effectively degenerate.
Considering the (CH)(H) inclusion compounds is crucial at higher pressures: the methane phases are unstable above 95 GPa against a decomposition into CH () and an appropriate amount of any of the three inclusion compounds CH(H)- or -, or (CH)(H). This result is in agreement with the statement by Saleh et al. [49] who noted that the presence of the (CH)(H) inclusion compound reduces the onset pressure of methane decomposition. Liu et al. presented the CH:H compounds [48], but did not consider their influence on the methane phase diagram. It is a coincidental result that the decomposition reactions involving either of the inclusion compounds are energetically very close, and as such the decomposition pressure estimate of 95 GPa is correct in either case.
These phases are stable up to 220 GPa—again in agreement with Saleh et al. Above that pressure, we find a decomposition into CH and pure H more stable. At higher pressures, there are no new features compared to the methane phase evolution presented in the work by Gao et al. [18]; we reproduce a transition from CH + H to CH + H at 380 GPa, and see no decomposition into diamond and hydrogen up to at least 500 GPa.
In Figure 4 we compare calculated Birch-Murnaghan equations of state (EOS) to measurements for methane (see Appendix C for EOS fit details). Sun et al. and Umemoto et al. measured equation of state data of a cubic methane phase B containing a reported 21 molecules [12,21]. However, more recent measurements by Maynard-Casely et al. suggest that in fact the correct structure solution for this phase is an -Mn arrangement in a unit cell that is a factor of larger in volume and contains 58 molecules [15]. Adjusting for this re-interpretation, the data by Sun et al. and Umemoto et al. below 50 GPa do not coincide, instead exhibit a pressure difference of around 8 GPa.
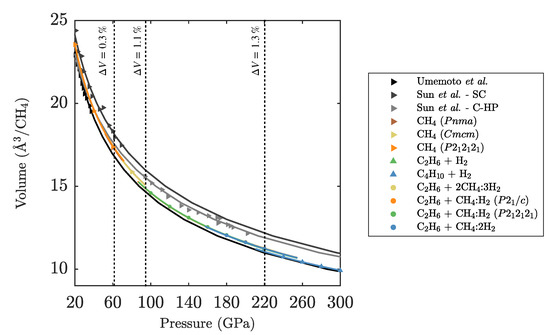
Figure 4.
Pressure-volume equation of state for CH. Gray-shaded symbols are experimental data points from Sun et al. [21] and Umemoto et al. [12]. Coloured data points are calculated in this work. Vertical lines indicate PBE transition pressures as per Figure 3. Solid lines are EOS fits to the respective data sets.
The overall agreement with corrected data from Umemoto et al., for pressures to 40 GPa, is very good. At high pressures the calculated volumes are below the data by Sun et al., possibly indicating that the measured methane phase is kinetically stabilised against the (more compact) decomposition reactions. At 95 GPa, we predict a 1.1% volume collapse from methane to CH + CH(H). The volume collapse from CH + CH(H) to CH + H at 220 GPa is 1.3%. Note that the calculated EOS data implies that CH + H has a 0.5% smaller volume than the thermodynamically stable CH + CH(H) at 160 GPa. This represents an example where the enthalpy gain through volume reduction does not compensate for the internal energy increase .
The last point is illustrated more broadly in Figure 5, where we show separately the internal energy differences and volume terms for all relevant CH compounds, next to the formation enthalpies . Note that the inclusion compounds that are most stable above 95 GPa have neither the lowest internal energy (which is found in the pure methane phases, due to the internal stability of the CH molecule) nor the highest density (which is obtained by the full decomposition of CH into CH and hydrogen). However, on balance, retaining some stable methane molecules in the inclusion compounds together with some very compact ethane molecules, gives the most stable combination in a wide pressure region from 95 to 220 GPa.
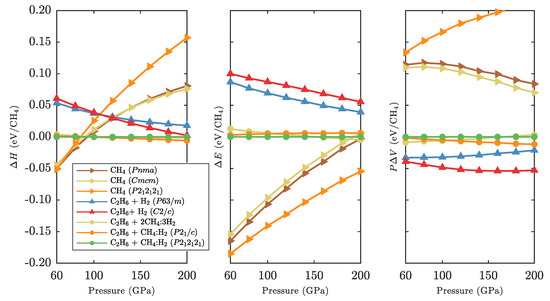
Figure 5.
Relative formation enthalpies (left), internal energies (middle), and volume terms (right) for various hydrocarbons of global CH stoichiometry in the pressure region 60–200 GPa.
Eventually, however, the presence of CH molecules becomes unstable. This is less due to volume effects (the terms in Figure 5 do not show drastic changes) and more due to loss of the internal energy advantage by the CH-containing phases. A local analysis of all structures that contain methane molecules reveals increasingly distorted CH molecules under pressure, with all four bonds of slightly different lengths and bond angles. We quantify the tetrahedrality of a methane molecule as
where is the angle between the jth and kth C-H bonds in the ith molecule. for an ideal tetrahedron, and for a square-planar arrangement. A general trend is for the unit cell-averaged measure to decrease monotonously with increasing pressure, see Figure A3 in Appendix D. The tetrahedral distortions are largest in the more compact and methane structures whereas the associated bond lengths remain more uniform. The less compact structure has less tetrahedral distortion but much less uniform bond lengths. The inclusion compounds, particularly CH(H)- and (CH)H, have a less dramatic response in total distortion under pressure. Where the former rely on optimising the packing of the CH units alone (and need to compromise on the molecular structure), the latter benefit from the presence of H “buffers” that enable the CH molecules to remain closer to their ideal structure. The molecular distortions correspond to an increase in internal energy of 10–50 meV/CH, see Figure A3.
3.2. Ground State Hydrocarbon Phase Diagram
Considering now all CH structures, we construct a series of relative formation enthalpy diagrams across the full hydrocarbon composition range. Then, the convex hull of given as
represents all C-H phases that are stable against any decomposition reactions. In Figure 6 we show a series of these convex hulls for different pressure points, together with a phase stability bar chart for all hydrocarbons based on an interpolation of the convex hull data. For each compound, formation/decomposition pressures are calculated by linear interpolation between successive convex hulls.
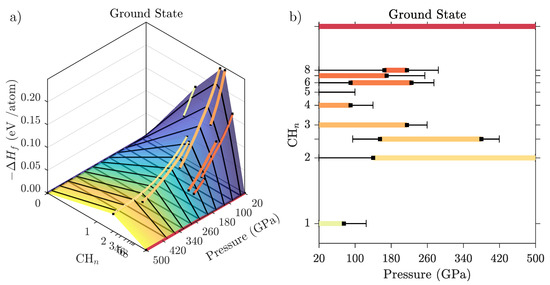
Figure 6.
(a) Convex hulls for C-H compounds at high pressure from ground state PBE calculation, showing formation enthalpies as function of hydrocarbon composition and for a series of pressures (black lines). Phases on the convex hull are indicated by thick coloured lines. (b) Resulting hydrocarbon phase diagram as function of pressure and composition. Metastable phases (that are within 5 meV of the convex hull) are indicated by thin black lines.
The enthalpy values in Figure 6a refer to the energy cost associated with full decomposition of a hydrocarbon into pure carbon and hydrogen. In that sense, the most stable hydrocarbons are CH and CH (i.e., ethane, CH) at low pressures, and CH (CH) and CH at high pressures. For instance, CH is stable against decomposition by 0.21 eV/atom (101 kJ/mole CH) at 40 GPa, and CH is stable by 0.04 eV/atom (11.6 kJ/mole CH) at 500 GPa. The 1:1 stoichiometry of benzene, polystyrene, or graphane becomes unstable above 75 GPa, while CH and CH become unstable at 90 and 215 GPa, respectively. A series of hydrogen-rich van der Waals inclusion compounds (nominally CH to CH) are stable between 20 and 220 GPa. Part of that set is a new compound found in this work, CH(H). While inspired by the recent synthesis of a Ar(H) inclusion compound [51], we found that a straightforward replacement of Ar with a methane molecule led to a very unstable structure (see Figure A1 for details). However, our own structure searches at the same stoichiometry found a new phase of symmetry (see Appendix E for structural details). This new inclusion compound does not play a role in the methane decomposition sequence as calculated at the PBE level, because it is too hydrogen-rich. However, it is stable in its own right as the most hydrogen-rich hydrocarbon phase with global stoichiometry CH between 170 and 220 GPa, and could be of importance in very hydrogen-rich environments.
Many hydrocarbon phases are metastable over wide pressure ranges, with formation enthalpies very close to the convex hull. Phases that are less than 5 meV/atom removed from stability are indicated by thin black lines in Figure 6b. Among those is another new van der Waals compound, (CH)H- (overall stoichiometry CH), that emerged from our structure searches and is metastable below 110 GPa. It is a relatively methane-rich compound, with a methane sublattice topology that is very similar to CH(H)- (see Figure 1) and also (CH)(H); all three of these compounds differ in the amount of H molecules incorporated between the methane molecules. By comparison, the methane sublattice of the new CH(H) phase is a distorted version of that found in CH- and CH(H)-, such that it can accommodate an additional two hydrogen molecules in a new vacancy channel present in the distorted network.
3.3. Zero-Point and Finite Temperature Effects
For methane, the inclusion of zero-point effects alters the phase evolution considerably, as shown in Figure 7a. Firstly, the initial decomposition of methane into CH + van der Waals compounds occurs at 65 GPa, a reduction by 30 GPa from the ground state results. Again, no single inclusion compound is more favourable than any other by more than around 5 meV/molecule. Above 145 GPa the methane molecules contained in inclusion compounds are predicted to decompose as well, resulting in a binary mixture of CH and pure H. Above 190 GPa, longer hydrocarbon chains of CH + H are the most stable phase. Finally at 285 GPa, the decomposition of butane into pure hydrogen and diamond is the most stable.
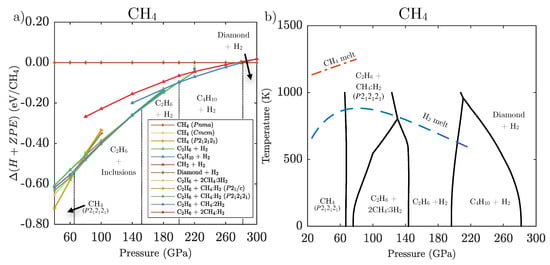
Figure 7.
(a) Zero temperature free energies including ZPE calculated for relevant CH phases and phase mixtures relative to decomposition into diamond and H. (b) Pressure-temperature phase diagram for CH calculated using the harmonic approximation. Black lines indicate predicted phase transitions between phases, the blue dashed line indicates the H melt line as calculated by Bonev et al. [61], the red dashed line indicates the CH melting line as determined by Hirai et al. [23].
Combining the ZPE with finite temperature entropy estimates from the harmonic approximation results in the methane phase diagram shown in Figure 7b. The enthalpy differences along some reactions, e.g., CH + CH(H)- → CH + (CH)(H) are small over a large pressure range, which makes entropy differences quite important and leads to strong temperature dependencies of the phase boundaries. Even at elevated temperatures the free energies associated with CH and the appropriate combination of any of the three inclusion compounds are within 5 meV/molecule. In contrast, at around 140 GPa, CH + H becomes energetically favourable over all inclusion compounds with a large enthalpy-pressure gradient and as such the phase boundary is essentially independent of temperature. In agreement with Gao et al. [18] we find the eventual stabilisation of diamond with a negative Clapeyron slope, which suggests methane’s decomposition at much lower pressures if the temperature is sufficiently high.
We then determined the full binary C–H phase diagram based on free energies at the harmonic level. In Figure 8, we show as examples the predicted stability of hydrocarbons at K and K. Pure methane decomposes relatively quickly (around 65 GPa, as discussed above and shown in Figure 7), but CH molecules persist in various hydrogen-rich van der Waals compounds to much higher pressures. Among those we find (CH)(H) (overall CH) to be the most stable. However, CH:(H) (overall CH), CH(H) (CH) and, to a lesser extent, (CH)H (CH) remain within 10 meV/atom from the convex hull over a wide pressure range, with an intermediate pressure region of stability for CH. Beyond 140 GPa (both at 0 and 500 K) all inclusion compounds are unstable against decomposition to CH + H.
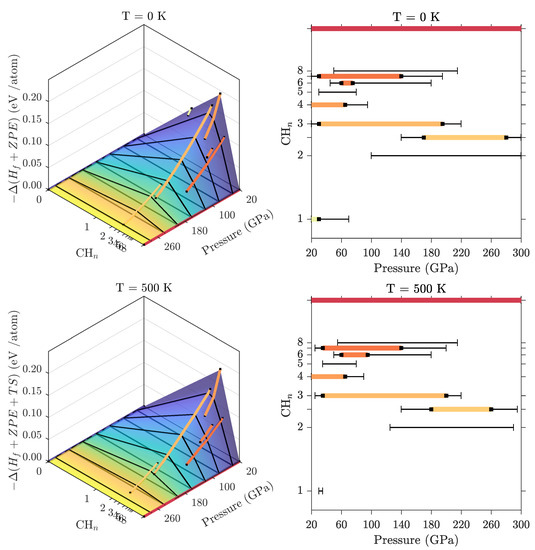
Figure 8.
Convex hulls of relative free energies for C–H compounds at high pressure and resulting phase stability charts at K (i.e., incl. ZPE, top), and at K (bottom) from the harmonic approximation. For clarity on the convex hulls, only the stable phases are indicated by coloured lines. In the stability bar charts, coloured horizontal lines represent the stability regions of different phases, with metastability (less than 10 meV/atom from the convex hull) indicated by thin black lines.
For carbon-rich phases we find that longer hydrocarbon chains are stable to successively higher pressures. Our data suggests there are no stable hydrocarbon phases on the carbon-rich side of CH above 30 GPa so diamond formation should always be energetically favourable above that pressure in samples with more than 33 at% carbon.
3.4. Polystyrene and Polyethylene under Pressure
To illustrate the last point above, we constructed the phase diagram of CH, the stoichiometry of benzene, graphane, and polystyrene, using the harmonic approximation. The results are shown in Figure 9c. Graphane IV, the most stable 1:1 compound we are aware of at high pressure, is stable against decomposition until 30 GPa at low temperatures only; at higher temperatures it should decompose at even lower pressures. This suggests that diamond formation could begin almost immediately upon compression and/or heating due to partial decomposition of CH. Diamond appearance in a sample of polystyrene stoichiometry [37] should not coincide with a complete breakdown of hydrocarbons, i.e., the presence of only diamond and hydrogen. In fact, we find that graphane initially decomposes into ethane (CH) and diamond, while at high temperatures it should form methane and diamond. Above 170 GPa, ethane becomes unstable against formation of longer hydrocarbon chains, which would in fact reduce the amount of diamond; we discuss the non-trivial variation of the diamond ‘reservoir’ in Appendix F. Eventually these hydrocarbons also decompose fully into pure hydrogen and diamond. However, while the enthalpic driving force towards the breakdown of graphane steadily increases with pressure (see Figure 9a) it is not necessarily large: at 100 GPa, the formation of ethane and diamond is favoured by only 31 meV/CH over graphane IV (this includes ZPE effects). The formation of pure hydrogen and diamond comes with a much stronger enthalpy bias, which could explain why diamond formation conditions in experiments correlate well with the final decomposition reaction conditions, and not the initial decomposition reaction [37].
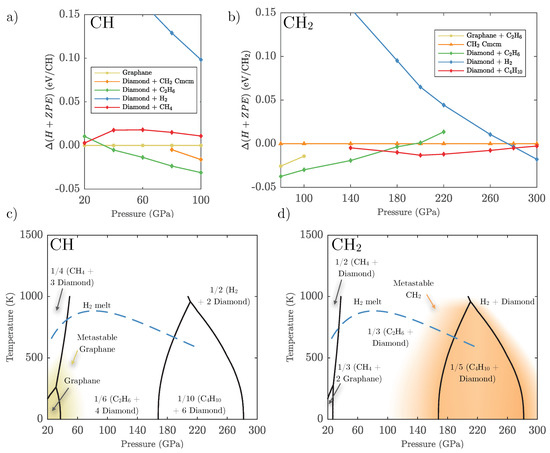
Figure 9.
Upper panel: zero temperature free energies including ZPE calculated for relevant phases and mixtures of (a) CH composition relative to graphane, and (b) CH composition relative to CH-. Lower panel: pressure-temperature phase diagrams for (c) CH and (d) CH calculated using the harmonic approximation. Black lines indicate predicted transitions between labelled phases, the blue dashed line indicates the H melt line as calculated by Bonev et al. [61]. Shaded coloured areas represent the metastability region (within 10 meV/atom) of both graphane and polyethylene.
We can illustrate the same point on a more hydrogen-rich example, CH, or polyethylene. In Figure 9b we show the enthalpy of CH (including ZPE) and the most relevant decomposition reactions, for pressures above 80 GPa. As already seen from Figure 8, CH is metastable in this pressure region: the formation of diamond, first together with longer hydrocarbons and then with pure hydrogen, is always more stable. However, these decompositions are not favoured by much: 30 meV/CH at 100 GPa, and only 13 meV/CH at 260 GPa. These small enthalpy differences might explain why compressed CH in experiments cannot overcome kinetic barriers towards diamond formation, and remains in a polyethylene phase up to almost 200 GPa [40]. However, diamond and pure hydrogen have a much larger enthalpy-pressure gradient, and the enthalpic drive towards decomposition of CH increases strongly above 280 GPa; this should make diamond formation in polyethylene samples much more likely above 300 GPa. The calculated phase diagram of CH, shown in Figure 9d, highlights the large region of metastability for CH (again defined as being unstable by less than 10 meV/atom) and its rapid destabilisation beyond the decomposition into diamond and pure hydrogen.
4. Discussion
A full revision of the known C-H structures has resulted in an updated phase diagram for hydrocarbons at high pressure and low temperature.
We find that the phase diagram of methane is dominated by a series of van der Waals inclusion compounds between 70 and 150 GPa. At least four such compounds, with CH:H stoichiometries of 2:1, 1:1, 2:3, and 1:2, are competitive in this pressure range. This suggests that the decomposition of the methane molecule is a very protracted process: some CH molecules will react to form CH, and the excess H molecules created in this process will form a van der Waals compound with some of the remaining CH molecules. The ratio of “surviving” CH molecules ranges from 50% (in a 2:1 inclusion compound) to 20% (in a 1:2 inclusion compound). Since the different inclusion compounds are so close in free energy, it is possible that a methane sample can form more than one of these compounds simultaneously due to local pressure fluctuations or kinetic effects, thus further differentiating the amount of methane molecules in this intermediate pressure regime. Such a quasi-continuous decomposition across a large pressure range is unusual, but not without parallels among the small molecules relevant in planetary interiors. Water, HO, is presumed to be stable to multi-TPa pressures [5], but suggested to partially decompose into HO and an intercalation compound HO:xH [62], at conditions that are likely beyond those found inside icy planets. Hydrogen itself forms a partially atomic/molecular phase-IV [63], presumably on the route towards a fully atomic phase, but at elevated temperatures only. In contrast ammonia, NH, is reported in calculations to decompose into other hydronitrogens in a single reaction above 450 GPa [64].
Methane’s subsequent evolution, beyond the van der Waals compounds, is through hydrocarbon chains of length 2 (CH—ethane), 4 (CH—butane) and then infinite (CH)—the latter seen in ground state enthalpies only. It seems natural to expect a series of crystalline structures formed of increasingly long hydrocarbon chains, i.e., CH—hexane, CH—octane and so on [18]. In their solid state these would necessarily form increasingly large unit cells and be much harder to access by unbiased structure searching [65]. For this reason and due to the small energy differences between the competing phases, the phase transition between CH and CH (or diamond) in the methane phase diagram should serve as a substitute for a series of cascading hydrocarbon chain formation reactions.
The hydrogen-rich inclusion compound CH(H) reported here, its less hydrogen-rich variant CH(H)-, and the CH- phase are all structurally similar and all stable or close to stability around P = 80–100 GPa. Likewise, (CH)H, CH(H)- and (CH)(H) share very similar methane sublattice topologies. It would not be surprising if other inclusion compounds could be synthesised based on the shared methane network structure of these compounds, but with a variable filling range of hydrogen, where perhaps the most stable stoichiometry is CH(H) with . This is especially likely at finite temperatures, where configurational entropy gains will stabilise such inclusion compounds through the presence of vacancies or other defects on the hydrogen sites.
While many of the crystalline structures presented here are thermodynamically stable, it is unsurprising that they are not seen consistently in experiments. The chemical reactivity of molecular systems at high pressure has several contributing factors [66]. In the solid state, the molecules have reduced mobility and large energy barriers resulting from the crystal field. This means in experiment, metastable structures with a ‘kinetics-driven’ stability will be present; arguably most of organic chemistry relies on this fact. Under high pressure, benzene (CH) can polymerise under specific conditions to form carbon nanothreads that remain stable at ambient pressure [30]. Similarly, DFT calculations suggest that any of the best pure methane phases are far from thermodynamically stable above 100 GPa in contrast to experiment in which methane in its pure form is found in a cubic phase at these pressures [21,22]. The high pressure chemistry of this process should be studied carefully, either highlighting this as failure of DFT, a failure to predict the correct cubic structure of methane, or as restrictions present in experiments.
Experiments aiming for the formation of diamonds in compressed C–H mixtures have used the decomposition curve of methane [37], similar to that found in Figure 7. A more appropriate phase diagram for the experimental stoichiometry is shown here, in Figure 9c. The thermodynamics of CH phases such as polystyrene imply excess carbon (diamond) production already at 25 GPa at room temperature and above, when longer hydrocarbons become more stable than graphane. Only parts of the carbon atoms present are able to form diamond, and full decomposition occurs at higher pressures.
Diamond nucleation rates depend heavily on the composition of the sample as well as the pressure and temperature conditions [67]. It is certainly intriguing that shock experiments on a carbon-rich sample such as polystyrene do not produce diamond until much higher pressures and temperatures [37] when there is clear computational evidence for a non-zero amount of excess carbon in the system following the formation of hydrocarbon chains. However, the free energy gain for these reactions is quite small, and only with the full decomposition into diamond and hydrogen comes a strong free energy gradient towards decomposition. This could explain the differences between the experiment and the calculation results. A similar experiment on polyethylene ([CH]) should in principle give very different answers from polystyrene: the stability of CH should prevent diamond formation up to 280 GPa at low temperature. Indeed that seems the case, as polystyrene has been reported as a stable solid up to 190 GPa [40]. The interpretation of dynamic compression experiments and static lattice calculations is further compounded by possible time scale effects: the formation of stable reaction products (diamond or other hydrocarbons) might not be possible on the experimental time scale (about 10 ns), as it involves major rearrangements of carbon-carbon and carbon-hydrogen bonds.
5. Conclusions
In conclusion, we present an internally consistent computational study of all known hydrocarbon compounds, and discuss their stability as function of pressure, temperature, and composition, based on semilocal DFT calculations and the harmonic approximation. In addition, we predict two new methane-hydrogen van der Waals inclusion compounds that are relevant at high-pressure conditions. One of these (CH, or CH(H)) is the most hydrogen-rich hydrocarbon compound known, and contains 20 wt% releasable hydrogen, on par with the best known hydrogen storage materials.
For methane, we present an updated P-T phase diagram, where the various van der Waals compounds appear prominently in an intermediate pressure region, between 60 and 150 GPa. This suggests that purely on thermodynamic grounds, the decomposition of methane with increased pressure is quite a protracted process with several intermediate stages.
We also present phase diagrams for more carbon-rich phases, CH and CH, which have been studied in recent dynamic compression experiments. These phase diagrams disagree with experimental findings regarding diamond formation (similar to methane), but we explore possible explanations around the metastability of the hydrocarbon phases and the lack of enthalpic gains unless full decomposition into diamond and hydrogen is favourable.
The interiors of icy planets are chemically very diverse, and a more realistic description requires consideration of other molecular ices such as water and ammonia. In addition, the temperatures that correspond to the pressure regime studied here will require studies beyond the harmonic approximation. Nonetheless, this study presents a step forward in our understanding of hydrocarbon diversity and their evolution with pressure, and enables follow-up studies to focus on relevant hydrogen-carbon mixtures.
Author Contributions
Conceptualization, A.H.; formal analysis, L.J.C.; investigation, L.J.C.; resources, A.H.; data curation, L.J.C.; writing–original draft preparation, A.H. and L.J.C.; writing–review and editing, A.H. and L.J.C.; visualization, L.J.C.; supervision, A.H.; project administration, A.H.
Funding
L.J.C. acknowledges studentship funding from EPSRC under grant No. EP/L015110/1. Computing resources provided by the UK national high performance computing service, ARCHER, and the UK Materials and Molecular Modelling Hub, which is partially funded by EPSRC (EP/P020194), and for which access was obtained via the UKCP consortium funded by EPSRC grant No. EP/P022561/1, are gratefully acknowledged.
Conflicts of Interest
The authors declare no conflict of interest.
Appendix A. Structure Search Results
The energies of the stable structures for the explored stoichiometries are presented in Figure A1.

Figure A1.
Convex hulls of low enthalpy structures found in the structure searches performed in this work at 100 and 200 GPa (black circles). Red circles denote enthalpies of hydrocarbon structures from the literature. Notable CH(H) structures and the Ar(H) inspired compound are indicated in green and blue, respectively. Of these, a star symbol indicates thermodynamic stability.
Appendix B. Intermolecular Distances
For C-H phases that contain molecular units, we show the nearest neighbour separations in Figure A2. We compare these to H-H and CH-CH distances seen in low-pressure free rotator phases of hydrogen (phase I at 5.4 GPa [68]) and methane (methane I at 1.6 GPa [25]). The separations are determined for all optimised geometries by finding at every pressure the shortest separation between any of the carbon atoms in the hydrocarbon units and, if present, the mid-points of any H molecules.
In Figure A2 one can clearly differentiate compounds where nearest neighbours are formed between hydrocarbons (CH CH, CH, CH), between methane and hydrogen ((CH)H) or between hydrogen molecules ((CH)(H), CHH, CH(H)). However, in all compounds, in the pressure region studied here (20 GPa and above), the molecular units are always much closer than their respective separations in the low-pressure phases.

Figure A2.
Calculated nearest neighbour distances as function of pressure, for all molecular crystals studied in this work. Experimental data points for hydrogen phase I from Mao et al. [68] and for methane I from Hazen et al. [25].
Appendix C. Equation of State Parameters
The equation of state data in Figure 4 is fitted to Birch-Murnaghan equations of state of the form
The fit parameters for calculated and experimental measurements are listed in Table A1. Our fits to the experimental data from Sun et al. have significantly larger uncertainties then those quoted in the original text [21].

Table A1.
Birch-Murnaghan equations of state fit parameters for experimental and theoretical phases of CH stoichiometry. All values are normalised per unit of CH. For example, the “Diamond + H” volume corresponds to . Errors are associated with 90% confidence limits of fits.
Table A1.
Birch-Murnaghan equations of state fit parameters for experimental and theoretical phases of CH stoichiometry. All values are normalised per unit of CH. For example, the “Diamond + H” volume corresponds to . Errors are associated with 90% confidence limits of fits.
| Structure | ||
|---|---|---|
| Umemoto et al. CH [12] | ||
| Sun et al. CH SC [21] | ||
| Sun et al. CH C-HP [21] | ||
| CH () | ||
| CH () | ||
| CH () | ||
| CH + H | ||
| CH + 2CH:3H | ||
| CH + CH:H () | ||
| CH + CH:H () | ||
| CH + CH:2H | ||
| CH + H | ||
| Diamond + H |
Appendix D. Methane Molecular Distortion
We defined the tetrahedrality measure Q in Equation (1). Figure A3a shows the unit cell averages for various phases that contain CH molecules. At the highest pressure, the values range from 0.999 to 0.988. To quantify the energy costs typical for such distortions, we created randomly angularly distorted single methane molecules and calculated their energies in Å boxes with a Monkhorst-Pack k-point grid of . In Figure A3b we show the energy difference from the ground state against the corresponding tetrahedrality measure . There is a strong linear trend of increasing energy with increasing tetrahedral distortion. For example, CH- changes by 0.01 between 60 and 220 GPa, corresponding to a change in internal energy of around 50 meV/CH.

Figure A3.
(a): Tetrahedrality averaged over molecules in the unit cell for structures containing methane. (b): Estimated increase in internal energy for the same range of .
Appendix E. New van der Waals Compounds
Table A2 contains structural information about the most relevant new compounds of CH and CH stoichiometry. Figure A4 shows phonon-DOS’s for both compounds, which illustrate their dynamical stability.
Table A2.
Crystallographic information for the new CH(H) (top) and (CH)H phases (bottom).
Table A2.
Crystallographic information for the new CH(H) (top) and (CH)H phases (bottom).
| Phase | CH(H) | Atom | Wyckoff Position | x | y | z |
| Space Group | H1 | 4 e | 0.19196 | 0.10868 | −0.06364 | |
| Pressure | 200 GPa | H2 | 4 e | 0.44939 | 0.16238 | 0.39952 |
| Lattice Parameters | H3 | 4 e | 0.27257 | 0.12932 | 0.65204 | |
| a | 3.96446 | H4 | 4 e | 0.87835 | 0.54359 | 0.31216 |
| b | 3.94406 | H5 | 4 e | 0.09105 | 0.78918 | 0.46179 |
| c | 5.108100 | H6 | 4 e | 0.67736 | 0.25401 | 0.18750 |
| 90.000 | H7 | 4 e | 0.63765 | −0.05446 | −0.04190 | |
| 111.2178 | H8 | 4 e | 0.06088 | 0.37230 | 0.78998 | |
| 90.000 | C1 | 4 e | 0.69085 | 0.37449 | 0.86797 | |
| Phase | (CH)H | Atom | Wyckoff Position | x | y | z |
| Space Group | H1 | 2 i | 0.50567 | 0.12379 | 0.22215 | |
| Pressure | 100 GPa | H2 | 2 i | 0.15009 | 0.20191 | 0.58464 |
| Lattice Parameters | H3 | 2 i | 0.51137 | 0.33990 | 0.76335 | |
| a | 2.84033 | H4 | 2 i | −0.01370 | 0.40669 | 0.20115 |
| b | 3.19376 | H5 | 2 i | −0.09011 | −0.01841 | −0.04194 |
| c | 4.24946. | C1 | 2 i | 0.28534 | 0.34724 | 0.30943 |
| 68.11570 | ||||||
| 74.64800 | ||||||
| 89.75400 |

Figure A4.
Phonon DOS of CH(H) at 200 GPa (left) and (CH)H at 60 GPa (right).
Appendix F. Diamond Reservoirs in Polystyrene
The amount of carbon available to form diamond in a sample of global stoichiometry CH (e.g., polystyrene) varies with pressure in a non-trivial way. Defining as the percentage of carbon atoms locked up in hydrocarbon chains (as opposed to forming diamond) we can characterise the hydrocarbon content in the CH phase diagram as function of pressure, as shown in Figure A5. Firstly, at 40 GPa and K, graphane () decomposes into 1/6 CH + 2/3 diamond, with . At the onset of formation of 1/10 CH + 3/5 diamond, increases to . Finally the transition to diamond + hydrogen () occurs at 280 GPa. In the low temperature regime has a local minimum between 30 and 160 GPa, which corresponds to a local maximum in diamond prevalence. At higher pressures it is energetically favourable to form fewer diamonds and longer hydrocarbon chains until eventually the longest hydrocarbon chain (CH) is no longer favourable against complete decomposition.

Figure A5.
The amount of carbon locked into hydrocarbons and therefore unable to form diamond, as a function of pressure, for a graphane/polystyrene sample.
References
- Hubbard, W.B.; Nellis, W.J.; Mitchell, A.C.; Holmes, N.C.; Limaye, S.S.; McCandless, P.C. Interior Structure of Neptune: Comparison with Uranus. Science 1991, 253, 648–651. [Google Scholar] [CrossRef]
- Cavazzoni, C.; Chiarotti, L.; Scandolo, S.; Tosatti, E.; Bernasconi, M.; Parrinello, M. Superionic and Metallic States of Water and Ammonia at Giant Planet Conditions. Science 1999, 283, 44–46. [Google Scholar] [CrossRef]
- Pickard, C.J.; Needs, R.J. Highly compressed ammonia forms an ionic crystal. Nat. Mater. 2008, 7, 775–779. [Google Scholar] [CrossRef]
- Ninet, S.; Datchi, F.; Saitta, A.M. Proton disorder and superionicity in hot dense ammonia ice. Phys. Rev. Lett. 2012. [Google Scholar] [CrossRef]
- Hermann, A.; Ashcroft, N.W.; Hoffmann, R. High pressure ices. Proc. Natl. Acad. Sci. USA 2012, 109, 745–750. [Google Scholar] [CrossRef] [PubMed]
- Palasyuk, T.; Troyan, I.; Eremets, M.; Drozd, V.; Medvedev, S.; Zaleski-Ejgierd, P.; Magos-Palasyuk, E.; Wang, H.; Bonev, S.A.; Dudenko, D.; et al. Ammonia as a case study for the spontaneous ionization of a simple hydrogen-bonded compound. Nat. Commun. 2014, 5. [Google Scholar] [CrossRef] [PubMed]
- Ninet, S.; Datchi, F.; Dumas, P.; Mezouar, M.; Garbarino, G.; Mafety, A.; Pickard, C.J.; Needs, R.J.; Saitta, A.M. Experimental and theoretical evidence for an ionic crystal of ammonia at high pressure. Phys. Rev. B Condens. Matter Mater. Phys. 2014, 89, 174103. [Google Scholar] [CrossRef]
- Naden Robinson, V.; Wang, Y.; Ma, Y.; Hermann, A. Stabilization of ammonia-rich hydrate inside icy planets. Proc. Natl. Acad. Sci. USA 2017, 114, 201706244. [Google Scholar] [CrossRef]
- Naden Robinson, V.; Marqués, M.; Wang, Y.; Ma, Y.; Hermann, A. Novel phases in ammonia-water mixtures under pressure. J. Chem. Phys. 2018, 149, 234501. [Google Scholar] [CrossRef] [PubMed]
- Neumann, M.A.; Press, W.; Nöldeke, C.; Asmussen, B.; Prager, M.; Ibberson, R.M. The crystal structure of methane phase III. J. Chem. Phys. 2003, 119, 1586–1589. [Google Scholar] [CrossRef]
- Press, W. Structure and Phase Transitions of Solid Heavy Methane (CD4). J. Chem. Phys. 1972, 56, 2597–2609. [Google Scholar] [CrossRef]
- Umemoto, S.; Yoshii, T.; Akahama, Y.; Kawamura, H. X-ray diffraction measurements for solid methane at high pressures. J. Phys. Condens. Matter 2002, 14, 10675–10678. [Google Scholar] [CrossRef]
- Bini, R.; Pratesi, G. High-pressure infrared study of solid methane: Phase diagram up to 30 GPa. Phys. Rev. B 1997, 55, 14800–14809. [Google Scholar] [CrossRef]
- Maynard-Casely, H.E.; Bull, C.L.; Guthrie, M.; Loa, I.; McMahon, M.I.; Gregoryanz, E.; Nelmes, R.J.; Loveday, J.S. The distorted close-packed crystal structure of methane A. J. Chem. Phys. 2010, 133, 064504. [Google Scholar] [CrossRef]
- Maynard-Casely, H.E.; Lundegaard, L.F.; Loa, I.; McMahon, M.I.; Gregoryanz, E.; Nelmes, R.J.; Loveday, J.S. The crystal structure of methane B at 8 GPa-An alpha-Mn arrangement of molecules. J. Chem. Phys. 2014, 141, 234313. [Google Scholar] [CrossRef] [PubMed]
- Ross, M. The ice layer in Uranus and Neptune—Diamonds in the sky? Nature 1981, 292, 435–436. [Google Scholar] [CrossRef]
- Ancilotto, F.; Chiarotti, G.L.; Scandolo, S.; Tosatti, E. Dissociation of Methane into Hydrocarbons at Extreme (Planetary) Pressure and Temperature. Science 1997, 275, 1288–1290. [Google Scholar] [CrossRef] [PubMed]
- Gao, G.; Oganov, A.R.; Ma, Y.; Wang, H.; Li, P.; Li, Y.; Iitaka, T.; Zou, G. Dissociation of methane under high pressure. J. Chem. Phys. 2010, 133, 144508. [Google Scholar] [CrossRef]
- Bézard, B.; Romani, P.N.; Conrath, B.J.; Maguire, W.C. Hydrocarbons in Neptune’s stratosphere from Voyager infrared observations. J. Geophys. Res. 1991, 96, 18961. [Google Scholar] [CrossRef]
- Sun, L.; Ruoff, A.L.; Zha, C.S.; Stupian, G. Optical properties of methane to 288 GPa at 300 K. J. Phys. Chem. Solids 2006, 67, 2603–2608. [Google Scholar] [CrossRef]
- Sun, L.; Yi, W.; Wang, L.; Shu, J.; Sinogeikin, S.; Meng, Y.; Shen, G.; Bai, L.; Li, Y.; Liu, J.; et al. X-ray diffraction studies and equation of state of methane at 202GPa. Chem. Phys. Lett. 2009, 473, 72–74. [Google Scholar] [CrossRef]
- Proctor, J.E.; Maynard-Casely, H.E.; Hakeem, M.A.; Cantiah, D. Raman spectroscopy of methane (CH4) to 165 GPa: Effect of structural changes on Raman spectra. J. Raman Spectrosc. 2017, 48, 1777–1782. [Google Scholar] [CrossRef]
- Hirai, H.; Konagai, K.; Kawamura, T.; Yamamoto, Y.; Yagi, T. Polymerization and diamond formation from melting methane and their implications in ice layer of giant planets. Phys. Earth Planet. Inter. 2009. [Google Scholar] [CrossRef]
- Benedetti, L.R.; Nguyen, J.H.; Caldwell, W.A.; Liu, H.; Kruger, M.; Jeanloz, R. Dissociation of CH4 at High Pressures and Temperatures: Diamond Formation in Giant Planet Interiors? Science 2000, 286, 100–102. [Google Scholar] [CrossRef]
- Hazen, R.M.; Mao, H.K.; Finger, L.W.; Bell, P.M. Structure and compression of crystalline methane at high pressure and room temperature. Appl. Phys. Lett. 1980, 37, 288–289. [Google Scholar] [CrossRef]
- Chyba, C.; Sagan, C. Endogenous production, exogenous delivery and impact-shock synthesis of organic molecules: An inventory for the origins of life. Nature 1992, 355, 125–132. [Google Scholar] [CrossRef]
- Furukawa, Y.; Sekine, T.; Oba, M.; Kakegawa, T.; Nakazawa, H. Biomolecule formation by oceanic impacts on early Earth. Nat. Geosci. 2009, 2, 62–66. [Google Scholar] [CrossRef]
- Goldman, N.; Reed, E.J.; Fried, L.E.; William Kuo, I.F.; Maiti, A. Synthesis of glycine-containing complexes in impacts of comets on early Earth. Nat. Chem. 2010, 2, 949–954. [Google Scholar] [CrossRef] [PubMed]
- Martins, Z.; Price, M.C.; Goldman, N.; Sephton, M.A.; Burchell, M.J. Shock synthesis of amino acids from impacting cometary and icy planet surface analogues. Nat. Geosci. 2013, 6, 1045–1049. [Google Scholar] [CrossRef]
- Fitzgibbons, T.C.; Guthrie, M.; Xu, E.S.; Crespi, V.H.; Davidowski, S.K.; Cody, G.D.; Alem, N.; Badding, J.V. Benzene-derived carbon nanothreads. Nat. Mater. 2015, 14, 43–47. [Google Scholar] [CrossRef] [PubMed]
- Chen, B.; Hoffmann, R.; Ashcroft, N.W.; Badding, J.; Xu, E.; Crespi, V. Linearly Polymerized Benzene Arrays As Intermediates, Tracing Pathways to Carbon Nanothreads. J. Am. Chem. Soc. 2015, 137, 14373–14386. [Google Scholar] [CrossRef]
- Zhan, H.; Zhang, G.; Tan, V.B.C.; Gu, Y. The best features of diamond nanothread for nanofibre applications. Nat. Commun. 2017, 8, 14863. [Google Scholar] [CrossRef] [PubMed]
- Nellis, W.J.; Ree, F.H.; Trainor, R.J.; Mitchell, A.C.; Boslough, M.B. Equation of state and optical luminosity of benzene, polybutene, and polyethylene shocked to 210 GPa (2.1 Mbar). J. Chem. Phys. 1984, 80, 2789–2799. [Google Scholar] [CrossRef]
- Cauble, R.; Da Silva, L.B.; Perry, T.S.; Bach, D.R.; Budil, K.S.; Celliers, P.; Collins, G.W.; Ng, A.; Barbee, T.W., Jr.; Hammel, B.A.; et al. Absolute measurements of the equations of state of low-Z materials in the multi-Mbar regime using laser-driven shocks. Phys. Plasmas 1997, 4, 1857–1861. [Google Scholar] [CrossRef]
- Barrios, M.A.; Hicks, D.G.; Boehly, T.R.; Fratanduono, D.E.; Eggert, J.H.; Celliers, P.M.; Collins, G.W.; Meyerhofer, D.D. High-precision measurements of the equation of state of hydrocarbons at 1–10 Mbar using laser-driven shock waves. Phys. Plasmas 2010, 17, 056307. [Google Scholar] [CrossRef]
- Kraus, D.; Chapman, D.A.; Kritcher, A.L.; Baggott, R.A.; Bachmann, B.; Collins, G.W.; Glenzer, S.H.; Hawreliak, J.A.; Kalantar, D.H.; Landen, O.L.; et al. X-ray scattering measurements on imploding CH spheres at the National Ignition Facility. Phys. Rev. E 2016, 94, 011202. [Google Scholar] [CrossRef] [PubMed]
- Kraus, D.; Vorberger, J.; Pak, A.; Hartley, N.J.; Fletcher, L.B.; Frydrych, S.; Galtier, E.; Gamboa, E.J.; Gericke, D.O.; Glenzer, S.H.; et al. Formation of diamonds in laser-compressed hydrocarbons at planetary interior conditions. Nat. Astron. 2017, 1, 606–611. [Google Scholar] [CrossRef]
- Kraus, D.; Hartley, N.J.; Frydrych, S.; Schuster, A.K.; Rohatsch, K.; Rödel, M.; Cowan, T.E.; Brown, S.; Cunningham, E.; Van Driel, T.; et al. High-pressure chemistry of hydrocarbons relevant to planetary interiors and inertial confinement fusion. Phys. Plasmas 2018, 25. [Google Scholar] [CrossRef]
- Hartley, N.J.; Vorberger, J.; Döppner, T.; Cowan, T.; Falcone, R.W.; Fletcher, L.B.; Frydrych, S.; Galtier, E.; Gamboa, E.J.; Gericke, D.O.; et al. Liquid Structure of Shock-Compressed Hydrocarbons at Megabar Pressures. Phys. Rev. Lett. 2018, 121, 245501. [Google Scholar] [CrossRef]
- Hartley, N.J.; Brown, S.; Cowan, T.E.; Cunningham, E.; Döppner, T.; Falcone, R.W.; Fletcher, L.B.; Frydrych, S.; Galtier, E.; Gamboa, E.J.; et al. Evidence for Crystalline Structure in Dynamically-Compressed Polyethylene up to 200 GPa. Sci. Rep. 2019, 9, 4196. [Google Scholar] [CrossRef]
- Mattsson, T.R.; Lane, J.M.D.; Cochrane, K.R.; Desjarlais, M.P.; Thompson, A.P.; Pierce, F.; Grest, G.S. First-principles and classical molecular dynamics simulation of shocked polymers. Phys. Rev. B 2010, 81, 054103. [Google Scholar] [CrossRef]
- Hu, S.X.; Collins, L.A.; Goncharov, V.N.; Kress, J.D.; McCrory, R.L.; Skupsky, S. First-principles equation of state of polystyrene and its effect on inertial confinement fusion implosions. Phys. Rev. E 2015, 92, 043104. [Google Scholar] [CrossRef]
- Hu, S.X.; Collins, L.A.; Goncharov, V.N.; Kress, J.D.; McCrory, R.L.; Skupsky, S. First-principles investigations on ionization and thermal conductivity of polystyrene for inertial confinement fusion applications. Phys. Plasmas 2016, 23, 042704. [Google Scholar] [CrossRef]
- Colin-Lalu, P.; Recoules, V.; Salin, G.; Plisson, T.; Brambrink, E.; Vinci, T.; Bolis, R.; Huser, G. Dissociation along the principal Hugoniot of the Laser Mégajoule ablator material. Phys. Rev. E 2016, 94, 023204. [Google Scholar] [CrossRef]
- Zhang, S.; Driver, K.P.; Soubiran, F.; Militzer, B. First-principles equation of state and shock compression predictions of warm dense hydrocarbons. Phys. Rev. E 2017, 96, 013204. [Google Scholar] [CrossRef] [PubMed]
- Zhang, S.; Militzer, B.; Benedict, L.X.; Soubiran, F.; Sterne, P.A.; Driver, K.P. Path integral Monte Carlo simulations of dense carbon-hydrogen plasmas. J. Chem. Phys. 2018, 148, 102318. [Google Scholar] [CrossRef]
- Liu, H.; Naumov, I.I.; Hemley, R.J. Dense Hydrocarbon Structures at Megabar Pressures. J. Phys. Chem. Lett. 2016, 7, 4218–4222. [Google Scholar] [CrossRef]
- Liu, Y.; Duan, D.; Tian, F.; Huang, X.; Li, D.; Zhao, Z.; Sha, X.; Chu, B.; Zhang, H.; Liu, B.; et al. Crystal structures and properties of the CH4H2compound under high pressure. RSC Adv. 2014, 4, 37569–37574. [Google Scholar] [CrossRef]
- Saleh, G.; Oganov, A.R. Novel Stable Compounds in the C-H-O Ternary System at High Pressure. Sci. Rep. 2016, 6, 32486. [Google Scholar] [CrossRef]
- Wen, X.D.; Hand, L.; Labet, V.; Yang, T.; Hoffmann, R.; Ashcroft, N.W.; Oganov, A.R.; Lyakhov, A.O. Graphane sheets and crystals under pressure. Proc. Natl. Acad. Sci. USA 2011, 108, 6833–6837. [Google Scholar] [CrossRef]
- Ji, C.; Goncharov, A.F.; Shukla, V.; Jena, N.K.; Popov, D.; Li, B.; Wang, J.; Meng, Y.; Prakapenka, V.B.; Smith, J.S.; et al. Stability of Ar(H2)2 to 358 GPa. Proc. Natl. Acad. Sci. USA 2017, 114, 3596–3600. [Google Scholar] [CrossRef] [PubMed]
- Clark, S.J.; Segall, M.D.; Pickard, C.J.; Hasnip, P.J.; Probert, M.J.; Refson, K.; Payne, M.C. First principles methods using CASTEP. Z. Krist. 2005, 220, 567–570. [Google Scholar] [CrossRef]
- Pickard, C.J.; Needs, R.J. Structure of phase III of solid hydrogen. Nat. Phys. 2007, 3, 473–476. [Google Scholar] [CrossRef]
- Fontana, L.; Vinh, D.Q.; Santoro, M.; Scandolo, S.; Gorelli, F.A.; Bini, R.; Hanfland, M. High-pressure crystalline polyethylene studied by x-ray diffraction and ab initio simulations. Phys. Rev. B Condens. Matter Mater. Phys. 2007, 75, 174112. [Google Scholar] [CrossRef]
- Perdew, J.P.; Burke, K.; Ernzerhof, M. Generalized gradient approximation made simple. Phys. Rev. Lett. 1996, 77, 3865–3868. [Google Scholar] [CrossRef]
- Monkhorst, H.J.; Pack, J.D. Special points for Brillouin-zone integrations. Phys. Rev. B 1976, 13, 5188–5192. [Google Scholar] [CrossRef]
- Frank, W.; Elsässer, C.; Fähnle, M. Ab initio force-constant method for phonon dispersions in alkali metals. Phys. Rev. Lett. 1995, 74, 1791–1794. [Google Scholar] [CrossRef] [PubMed]
- Wang, Y.; Lv, J.; Zhu, L.; Ma, Y. CALYPSO: A method for crystal structure prediction. Comput. Phys. Commun. 2012, 183, 2063–2070. [Google Scholar] [CrossRef]
- Teeratchanan, P.; Hermann, A. Computational phase diagrams of noble gas hydrates under pressure. J. Chem. Phys. 2015, 143. [Google Scholar] [CrossRef] [PubMed]
- Košata, J.; Merkl, P.; Teeratchanan, P.; Hermann, A. Stability of Hydrogen Hydrates from Second-Order Møller–Plesset Perturbation Theory. J. Phys. Chem. Lett. 2018, 9, 5624–5629. [Google Scholar] [CrossRef]
- Bonev, S.A.; Schwegler, E.; Ogitsu, T.; Galli, G. A quantum fluid of metallic hydrogen suggested by first-principles calculations. Nature 2004, 431, 669–672. [Google Scholar] [CrossRef]
- Pickard, C.J.; Martinez-Canales, M.; Needs, R.J. Decomposition and Terapascal Phases of Water Ice. Phys. Rev. Lett. 2013, 110, 245701. [Google Scholar] [CrossRef]
- Howie, R.T.; Guillaume, C.L.; Scheler, T.; Goncharov, A.F.; Gregoryanz, E. Mixed Molecular and Atomic Phase of Dense Hydrogen. Phys. Rev. Lett. 2012, 108, 125501. [Google Scholar] [CrossRef] [PubMed]
- Qian, G.R.; Hu, C.H.; Oganov, A.R.; Zeng, Q.; Zhou, H.Y.; Niu, H.; Hu, C.H.; Oganov, A.R.; Zeng, Q.; Zhou, H.Y. Diverse Chemistry of Stable Hydronitrogens, and Implications for Planetary and Materials Sciences. Sci. Rep. 2016, 6, 25947. [Google Scholar] [CrossRef] [PubMed]
- Reilly, A.M.; Cooper, R.I.; Adjiman, C.S.; Bhattacharya, S.; Boese, A.D.; Brandenburg, J.G.; Bygrave, P.J.; Bylsma, R.; Campbell, J.E.; Car, R.; et al. Report on the sixth blind test of organic crystal structure prediction methods. Acta Crystallogr. Sect. B 2016, 72, 439–459. [Google Scholar] [CrossRef] [PubMed]
- Bini, R.; Ceppatelli, M.; Citroni, M.; Schettino, V. From simple to complex and backwards. Chemical reactions under very high pressure. Chem. Phys. 2012, 398, 262–268. [Google Scholar] [CrossRef]
- Ghiringhelli, L.M.; Valeriani, C.; Meijer, E.J.; Frenkel, D. Local structure of liquid carbon controls diamond nucleation. Phys. Rev. Lett. 2007, 99, 055702. [Google Scholar] [CrossRef]
- Mao, H.K.; Jephcoat, A.P.; Hemley, R.J.; Finger, L.W.; Zha, C.S.; Hazen, R.M.; Cox, D.E. Synchrotron X-ray Diffraction Measurements of Single-Crystal Hydrogen to 26.5 Gigapascals. Science 1988, 239, 1131–1134. [Google Scholar] [CrossRef] [PubMed]
© 2019 by the authors. Licensee MDPI, Basel, Switzerland. This article is an open access article distributed under the terms and conditions of the Creative Commons Attribution (CC BY) license (http://creativecommons.org/licenses/by/4.0/).