Article

Mapping a Subsurface Water Channel with X-Band and C-Band Synthetic Aperture Radar at the Iron Age Archaeological Site of ‘Uqdat al-Bakrah (Safah), Oman

1
School of Civil and Environmental Engineering, The University of New South Wales, UNSW SYDNEY, Kingsford, NSW 2052, Australia
2
Department of Near Eastern Studies, Johns Hopkins University, Baltimore, MD 21218, USA
3
Department of Geological Sciences and Geological Engineering, Queen’s University, Kingston, ON K7L 3N6 Canada
4
Johns Hopkins University, Sheridan Libraries and Museums, Baltimore, MD 21218, USA
5
Department of Archaeology, The University of Sydney, Sydney, NSW 2006, Australia
6
Center for Advanced Spatial Technologies, University of Arkansas, Fayetteville, AR 72701, USA
7
Jet Propulsion Laboratory, Pasadena, CA 91109 USA
8
Department of Archaeology and Anthropology, University of Saskatchewan, Saskatoon, SK S7N 5C9 Canada
*
Author to whom correspondence should be addressed.
Geosciences 2018, 8(9), 334; https://doi.org/10.3390/geosciences8090334
Submission received: 10 July 2018 / Revised: 25 August 2018 / Accepted: 29 August 2018 / Published: 5 September 2018

Abstract

:
Subsurface imaging in arid regions is a well-known application of satellite Synthetic Aperture Radar (SAR). Archaeological prospection has often focused on L-band SAR sensors, given the ability of longer wavelengths to penetrate more deeply into sand. In contrast, this study demonstrates capabilities of shorter-wavelength, but higher spatial resolution, C-band and X-band SAR sensors in archaeological subsurface imaging at the site of ‘Uqdat al-Bakrah (Safah), Oman. Despite having varying parameters and acquisitions, both the X-band and C-band images analyzed were able to identify a subsurface paleo-channel that is not visible on the ground surface. This feature was first identified through Ground Penetrating Radar (GPR) survey, then recognized in the SAR imagery and further verified by test excavations. Both the GPR and the excavations reveal the base of the paleo-channel at a depth of 0.6 m–0.7 m. Hence, both X-band and C-band wavelengths are appropriate for subsurface archaeological prospection in suitable (dry silt and sand) conditions with specific acquisition parameters. Moreover, these results offer important new insights into the paleo-environmental context of ancient metal-working at ‘Uqdat al-Bakrah and demonstrate surface water flow roughly contemporary with the site’s occupation.

1. Introduction

1.1. Context of Research

The use of Synthetic Aperture Radar (SAR) as a tool for archaeological prospection has a limited history, commencing in the 1980s when NASA’s (National Aeronautics and Space Administration) airborne L-Band sensor detected Mayan irrigation channels and cultivated wetlands in the Yucatán peninsula [1,2,3,4] and the SIR-A (Shuttle Imaging Radar-A) sensor identified subsurface paleo-channels in North Africa [5,6,7]. These early examples present an alternative to optical imagery as they exploit the ability of SAR microwaves to penetrate through different media, whether tropical foliage in the Yucatán Peninsula or aeolian sands in the Sahara Desert. Because of this capability, SAR is now being used for prospection of archaeological sites and/or paleo-environmental features that are not discernable in the visible or infrared portions of the electromagnetic spectrum used by multi-spectral satellites [8,9,10].
A SAR system transmits electromagnetic pulses to illuminate a portion of the earth’s surface and subsurface and then receives the backscattered returning pulse, which provides information about the surface and subsurface characteristics in the illuminated scene [10,11]. Subsurface imaging is dependent on having a fine-grained (relative to the radar wavelength), physically homogenous medium through which the microwaves can propagate, with the target providing a contrasting surface that allows the microwaves to reveal a change in scattering processes. In addition to wavelength and grain size, the interaction between radar waves and subsurface materials is further governed by physical parameters, such as the soil’s dielectric permittivity and conductivity (directly related to soil moisture), incidence angle and polarization [6,10,11,12,13].
Research into microwave propagation in arid environments has been undertaken with varying results. Early theoretical work proposed that longer wavelengths (L-band) were able to penetrate deeper than 5 m in dry sand [6,12,14] while later investigations supported more conservative penetration depths of 0.05–0.3 m for X-band, 0.1–0.5 m for C-band and 0.4–2.0 m for L-band in the silica blow sand and alluvium of Egypt’s Western desert [15]. Because of their ability to penetrate further, longer wavelengths such as P-band (270–430 MHz frequency or 80–110 cm wavelength) and L-Band (1–2 GHz frequency or 15–30 cm wavelength) are often chosen for archaeological subsurface prospection in these environments [8,13,16,17,18]. However, C-band (4–8 GHz frequency or 3.75–7.5 cm wavelength) [17,19] and X-band (8–12.5 GHz frequency or 2.5–3.75 cm wavelength) [20,21] have also been used.
Further parameters that affect subsurface imaging include the look direction from the sensor and angle from the sensor to the ground (incidence angle), as targets are more likely to be visible if they have a strong profile that is perpendicular to the direction of radar propagation [17]. Microwave sensors are also configured to transmit and receive electromagnetic waves with specific polarizations, the simplest and most common being the single polarizations: Horizontal (HH) or vertical (VV) linear, in which the same polarization is transmitted and received. Different polarizations can provide additional information about a target and are another advantage of SAR imaging [11], although multi-polarization observations are often not available at the same fine resolution as single polarized data.
Despite the promising capabilities of SAR, archaeological applications have been hindered by the relatively low spatial resolution of early sensors, the limited availability and high costs of SAR data and software, as well as difficulties involved in processing and interpreting SAR images compared to optical imagery. Over the past few years many of these obstacles have diminished. There are an increasing number of higher spatial resolution C-band and X-band satellite missions (TerraSAR-X, TanDEM-X, COSMO-SkyMed, Sentinel series, RADARSAT-2) that acquire imagery in different modes (e.g., strip-map, spotlight) with different spatial resolutions, and different polarizations (single-pol, dual-pol, quad-pol). The Sentinel SAR data are freely available to the general public, while TerraSAR-X, TanDEM-X, COSMO-SkyMed and RADARSAT-2 data are available free of charge for research purposes from the respective space agencies upon successful application to specific Announcements of Opportunities. These data are greatly complemented by user-friendly open-source software (e.g., the SNAP toolbox from the European Space Agency). Additionally, more accessible historical data archives, expanding research, and forums on image interpretation [11,22] are making C-band and X-band SAR increasingly valuable tools for archaeological prospection.

1.2. The Archaeological Site of ‘Uqdat al-Bakrah

The recently discovered (2012) Iron Age archaeological site of ‘Uqdat al-Bakrah (also known as Safah) is situated on the eastern border of the Rub al-Khali Desert in Oman, approximately 50 km west of the town of Dhank. This location is at the periphery of the (ancient and contemporary) Wadi Bakrah alluvial fan and the fringe of the desert with its overlying aeolian sand veneer (Figure 1). The climate in this area is hyper-arid with an average rainfall of less than 100 mm/year [23].
‘Uqdat al-Bakrah has yielded hundreds of bronze objects and pits that could have been used for producing charcoal or as furnaces for melting and finishing/recycling bronze objects [24]. In 2013, excavations of a small number of pits undertaken by an Italian team sponsored by the Sultanate of Oman Ministry of Heritage and Culture demonstrated that they were buried under a shallow layer of sand at depths ranging from 0.4 to 1.5 m [25].
In January 2017, investigations of the Archaeological Water Histories of Oman (ArWHO) Project at ‘Uqdat al-Bakrah incorporated a geophysical survey, which included Ground Penetrating Radar (GPR). In addition to discovering a large number of new subsurface pit features, the survey also led to the identification of a shallowly buried channel-like feature with a northeast/southwest trajectory [26]. The results of this geophysical survey and excavations at ‘Uqdat al-Bakrah will be published in greater detail elsewhere; this paper specifically assesses C-band and X-band SAR subsurface imaging.
GPR is commonly used for archaeological prospection and is analyzed in conjunction with SAR data as it can provide complementary information and/or be used to verify SAR interpretation. There are examples of this in the tropical environment of Angkor Wat [27], as well as in Egypt’s Western Desert [13].
Located in dry aeolian and alluvial deposits, the shallowly buried features at ‘Uqdat al-Bakrah provide a valuable opportunity for evaluating and clarifying the proficiency of SAR subsurface imaging. The identification of subsurface features at ‘Uqdat al-Bakrah with SAR is also valuable in revealing details about human activities at the site, its paleo-environmental context, and is helpful in directing future research (remote sensing and excavation). In addition to clarifying the capabilities of C-band and X-band SAR, the discovery and mapping of a subsurface channel is highly significant as it shows water flow that may have supported vegetation. Many of the hundreds of pits at ‘Uqdat al-Bakrah are thought to have been used for producing charcoal, which would have required large amounts of wood as fuel. If woody vegetation was available near the site (a possibility we are working to evaluate), this might help explain the presence of the site and hundreds of valuable metal objects in such a remote and otherwise hyper-arid desert location. These observations and resultant hypotheses to be tested by future archaeobotanical and archaeometallurgical research are also significant in considering the similarly remote and hyper-arid context of other recently discovered desert metal-working sites in southeast Arabia, including the impressive finds at Saruq al-Hadid, UAE [28].

2. Materials and Methods

2.1. Data

The data used for this research included SAR products, a Digital Elevation Model (DEM) product, and multispectral satellite imagery. Details of these data are outlined in Table 1, Table 2 and Table 3.

2.2. Processing

Both the TanDEM-X bistatic products and RADARSAT-2 products were provided as Single Look Complex data, in which the product is minimally processed to maintain the complex information required for specific types of processing as well as the optimum resolution [29]. The difference for the TanDEM-X products was their bistatic acquisition from the TanDEM-X and TerraSAR-X satellites orbiting in tandem and acquiring image pairs. This meant that the Coregistered Single look Slant Range Complex (CoSSC) data were already processed so that the image pairs could be coregistered and did not require further calibration [30]. This radiometric correction step is required in order to interpret the data quantitatively (for comparing against other SAR images) as the calibration ensures that the pixel values correctly represent radar backscatter of the scene [29].
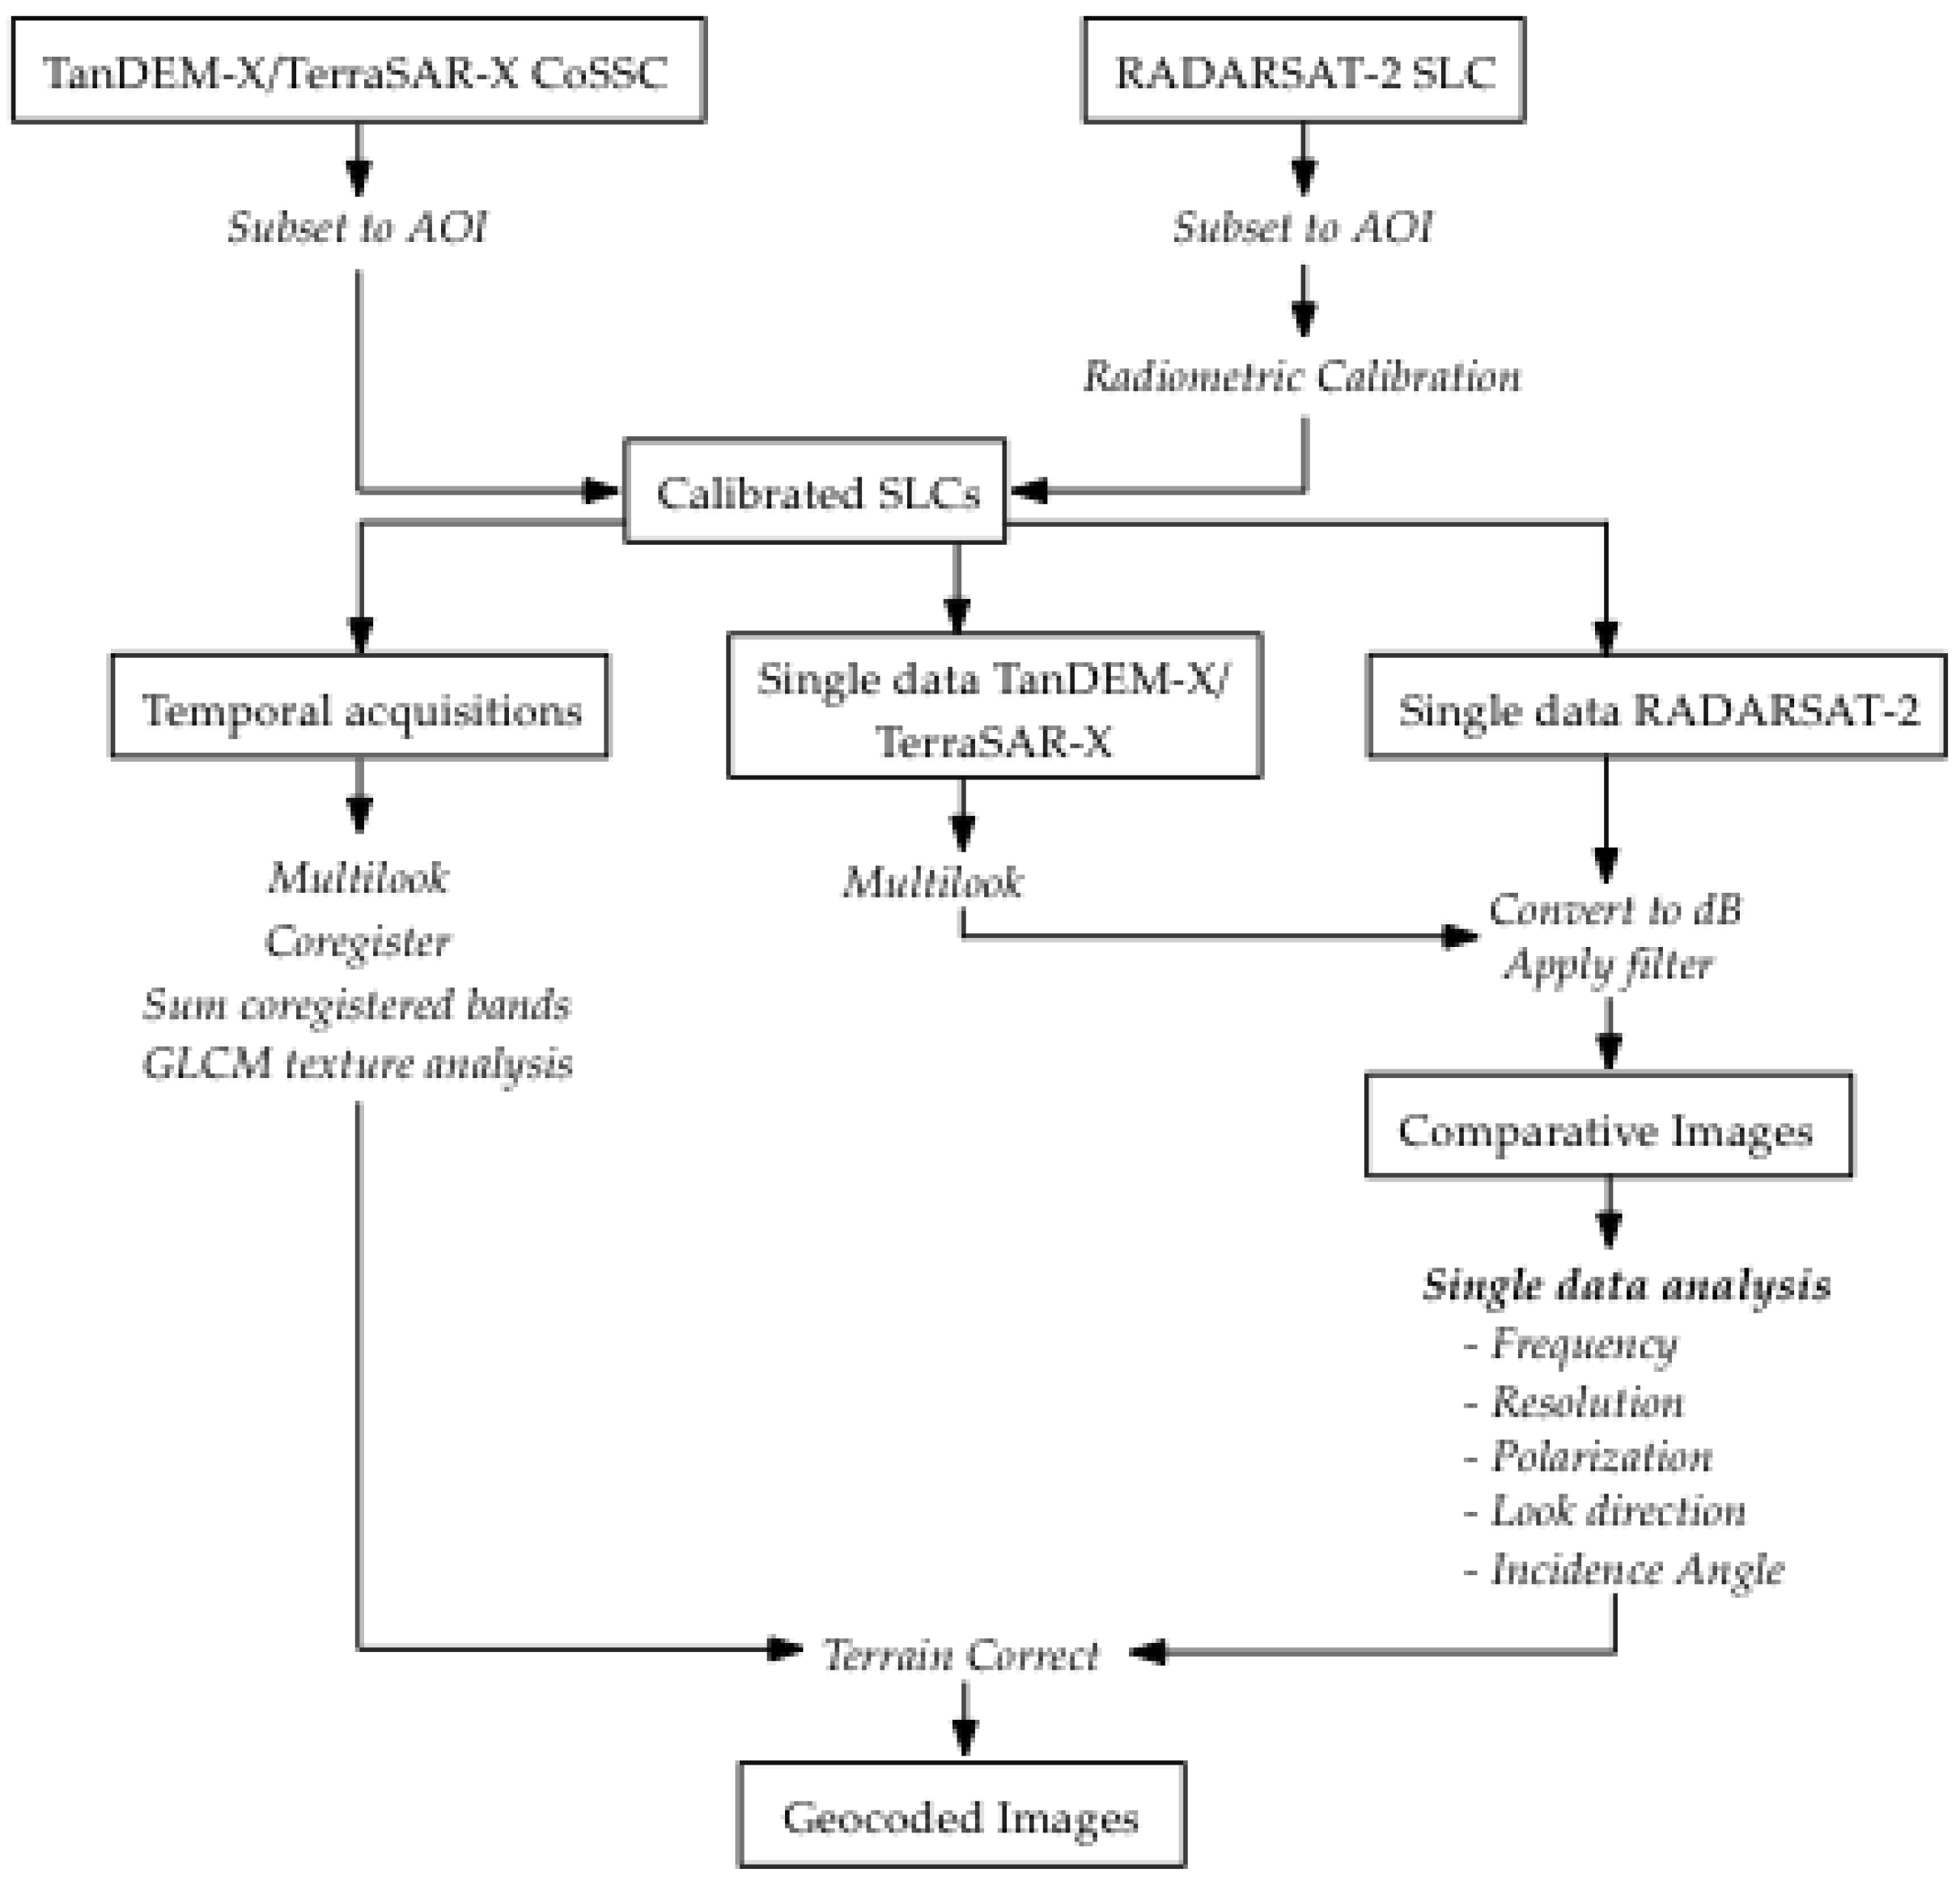
The processing of the X-band and C-band data was undertaken with a two-pronged approach during which the single data products were processed differently than the multi-temporal products. This allowed for all products to be assessed individually but also took advantage of the multi-temporal data to be coregistered and stacked. Figure 2 details the processing chain used with the Sentinel 1 toolbox software (SNAP—European Space Agency (ESA) Sentinel Application Platform v6.0) to produce comparative and geocoded images.
For the single data processing chain, all products were first subsetted for the area of interest (AOI). Calibration was applied to the RADARSAT-2 products so that the images were comparable. Then the TanDEM-X bistatic complex products were detected and multilooked. Since the pixel dimensions were already nearly square, this step converted the data from CoSSC products to real valued and interpretable intensity images by computing the modulus squared of the complex value. Both the TanDEM-X and RADARSAT-2 intensity images were then converted to decibel (dB), thereby reducing the dynamic range between the brightest and darkest pixels and making the images more interpretable. A low pass filter was applied to reduce speckle noise level, with the 3 × 3 pixel window size to preserve texture and enhance the subsurface channel, thus better facilitating identification of subsurface features [17,29]. These processed images could then be assessed in terms of radar frequency, spatial resolution, polarization, look direction and incidence angle. Terrain correction was applied to geocode the images to the Universal Transverse Mercator (UTM) projection (Zone 40 North WGS1984) using the Shuttle Radar Topographic Mission (SRTM) [31] DEM version 3, at 1 arc second (30 m) resolution.
The multi-temporal products (with the same acquisition parameters) were also subsetted for the area of interest and multilooked to produce detected intensity images. The sets of images (HH and VV) were then coregistered into two stacks. For the VV images, the 1 July 2017 scene was used as the master and the remaining four bistatic pairs were resampled to the master using the cubic convolution method. For the HH product, the 3 August 2017 scene was the master with two other pairs as slaves. The bands in each stack were summed to reduce image speckle and improve the signal-to-noise ratio thus enhancing subtle features [16,17,20]. The Gray Level Co-occurrence Matrix (GLCM) texture analysis (with a 5 × 5 pixel window, utilizing all angles, for 32 quantization levels and with a probabilistic quantizer) was then applied to the summed images. This analysis measures the pattern of intensity variations in an image based on the probability of occurrence of two gray levels at a given distance in specific direction(s) [29,32]. These measurements are then categorized into contrast, orderliness and statistics groups [29]. As with the single data images, the stacks were terrain corrected in the same manner.
The WorldView-3 (WV-3) product was not processed, as it was provided as a geocoded image, with georeferencing accuracy of 5 m [33]. In conjunction with field investigations, the high spatial resolution panchromatic band of WV-3 (0.3 m) was used to pansharpen other WV-3 bands and evaluate if any features identified in the GPR and SAR imagery were visible on the surface.

3. Results

3.1. SAR Analysis and Results

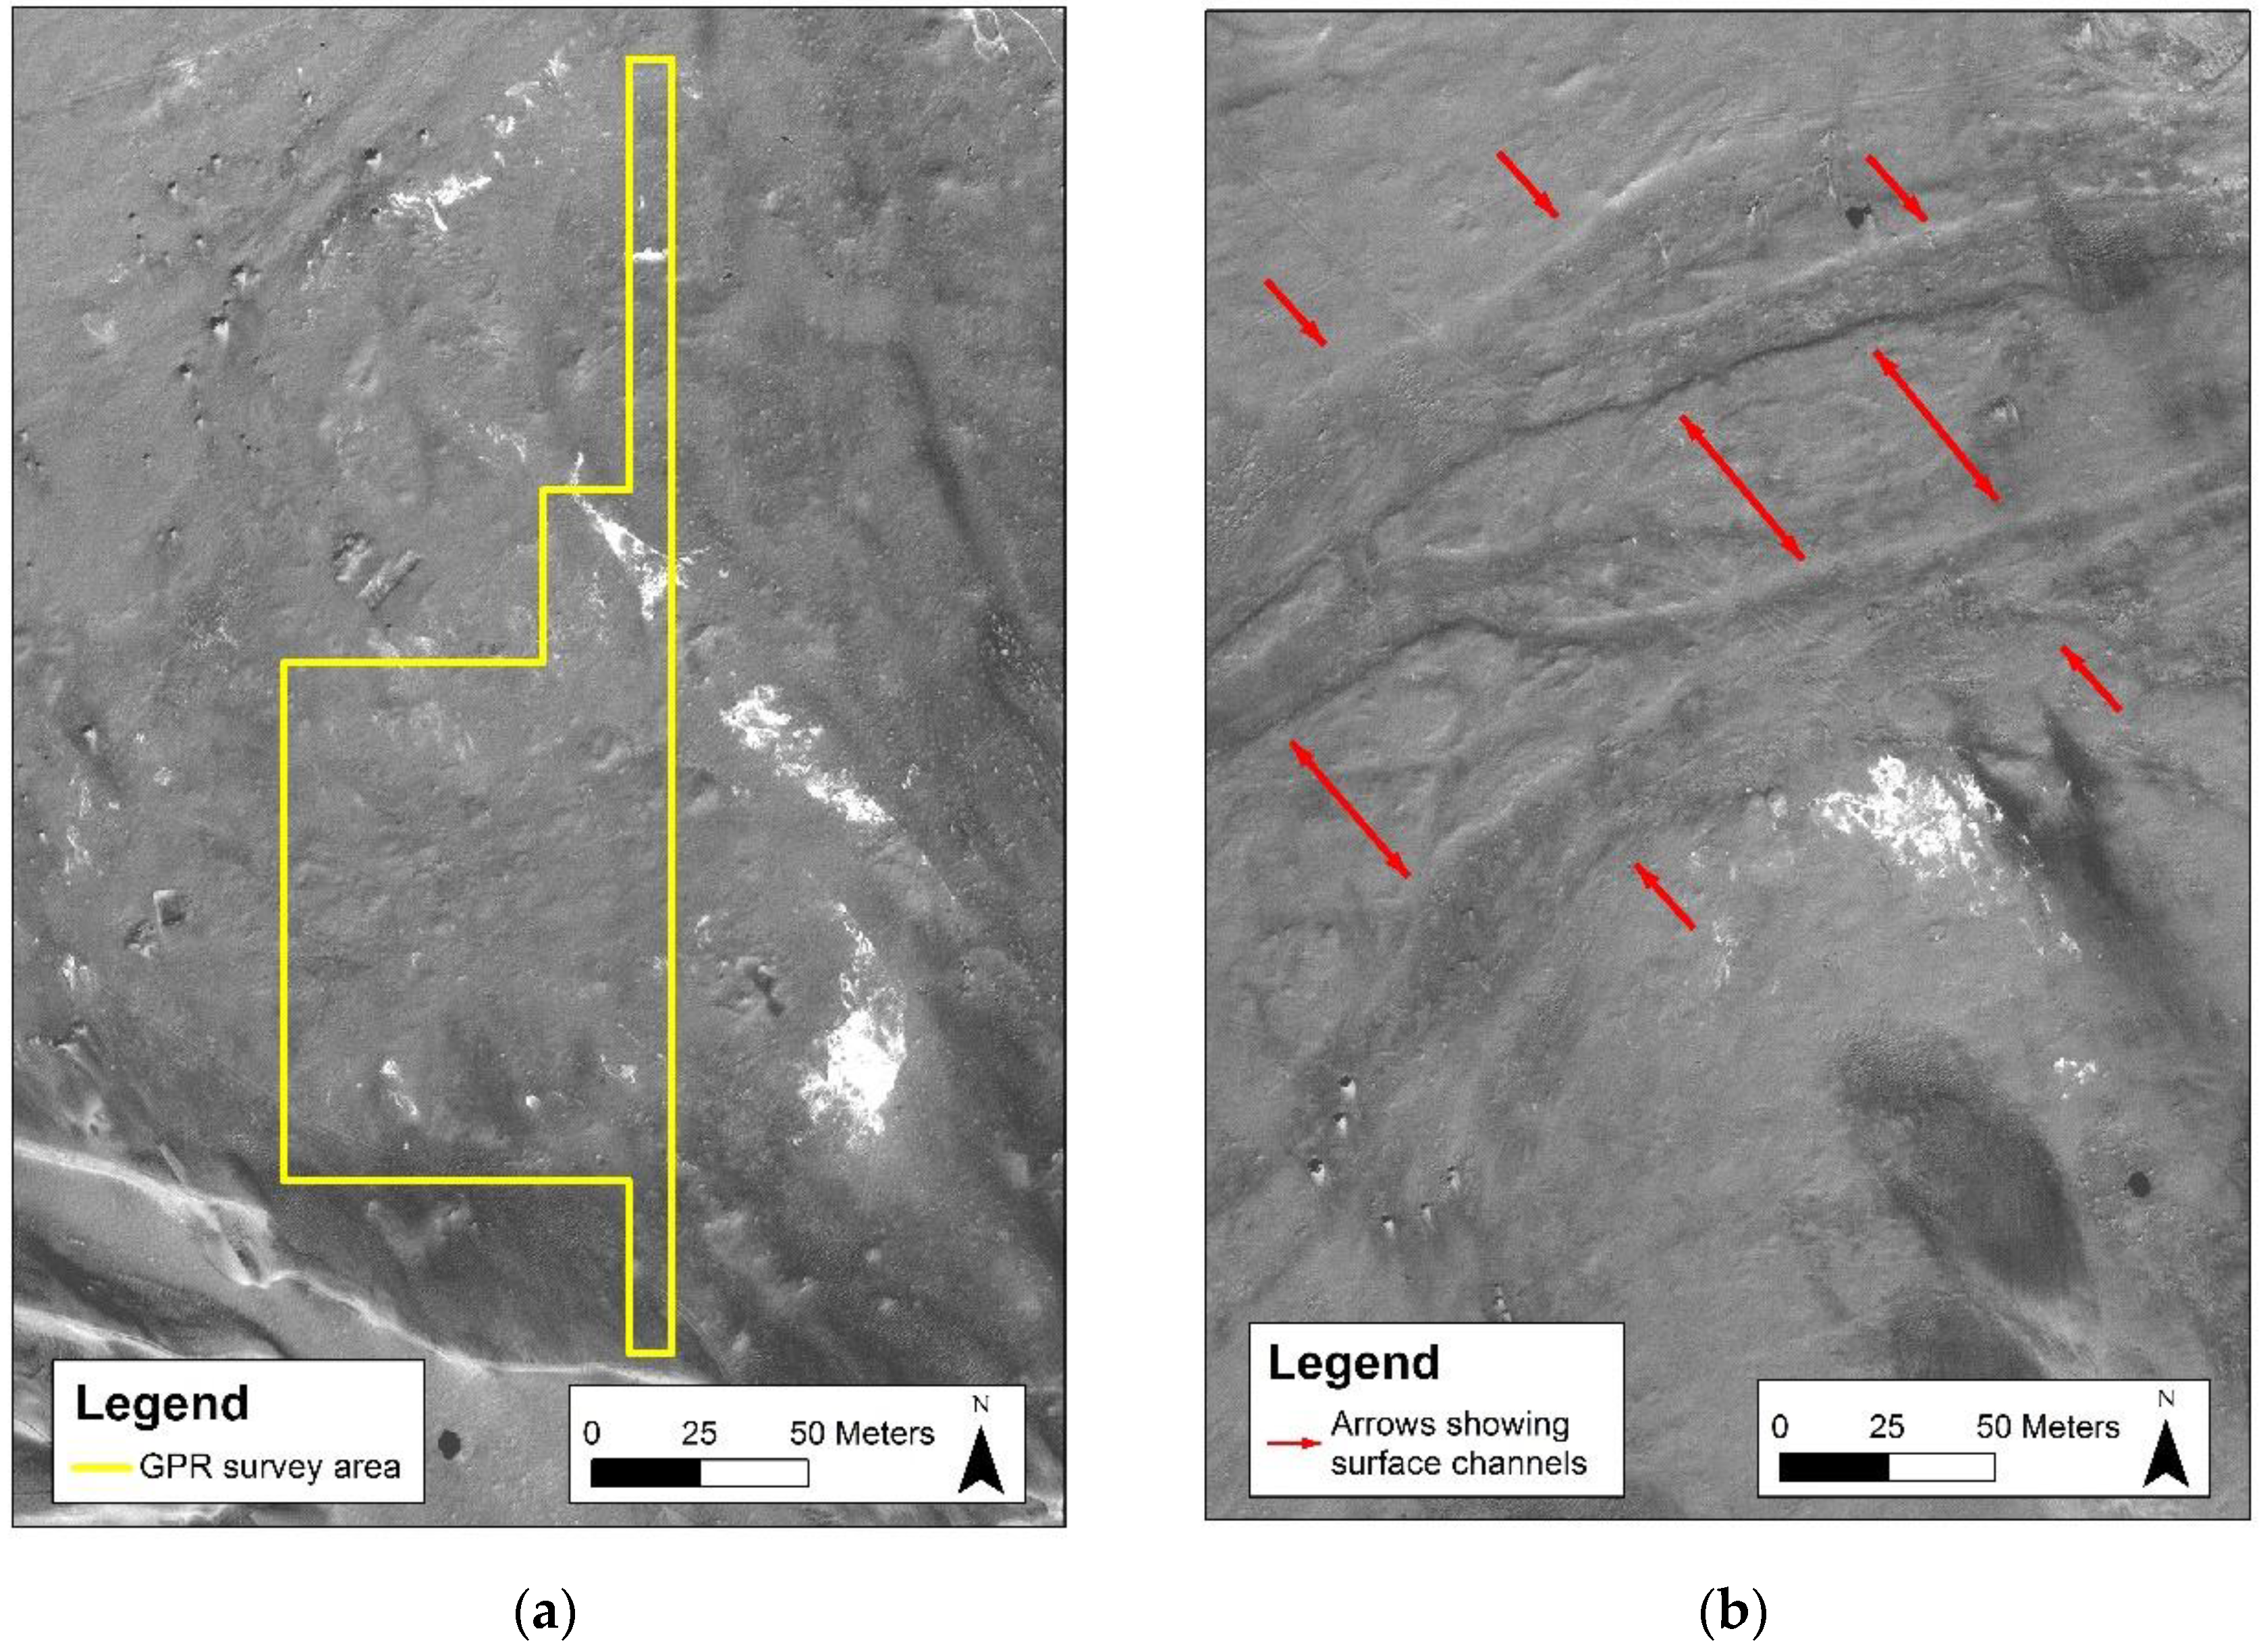
As shown in Figure 3a, no drainage channels are visible in the WV-3 image within the area surveyed by GPR in 2017. However, there are contemporary northeast/southwest drainage channels visible on the desert surface ~800 m to the northeast of the GPR survey area (Figure 3b).
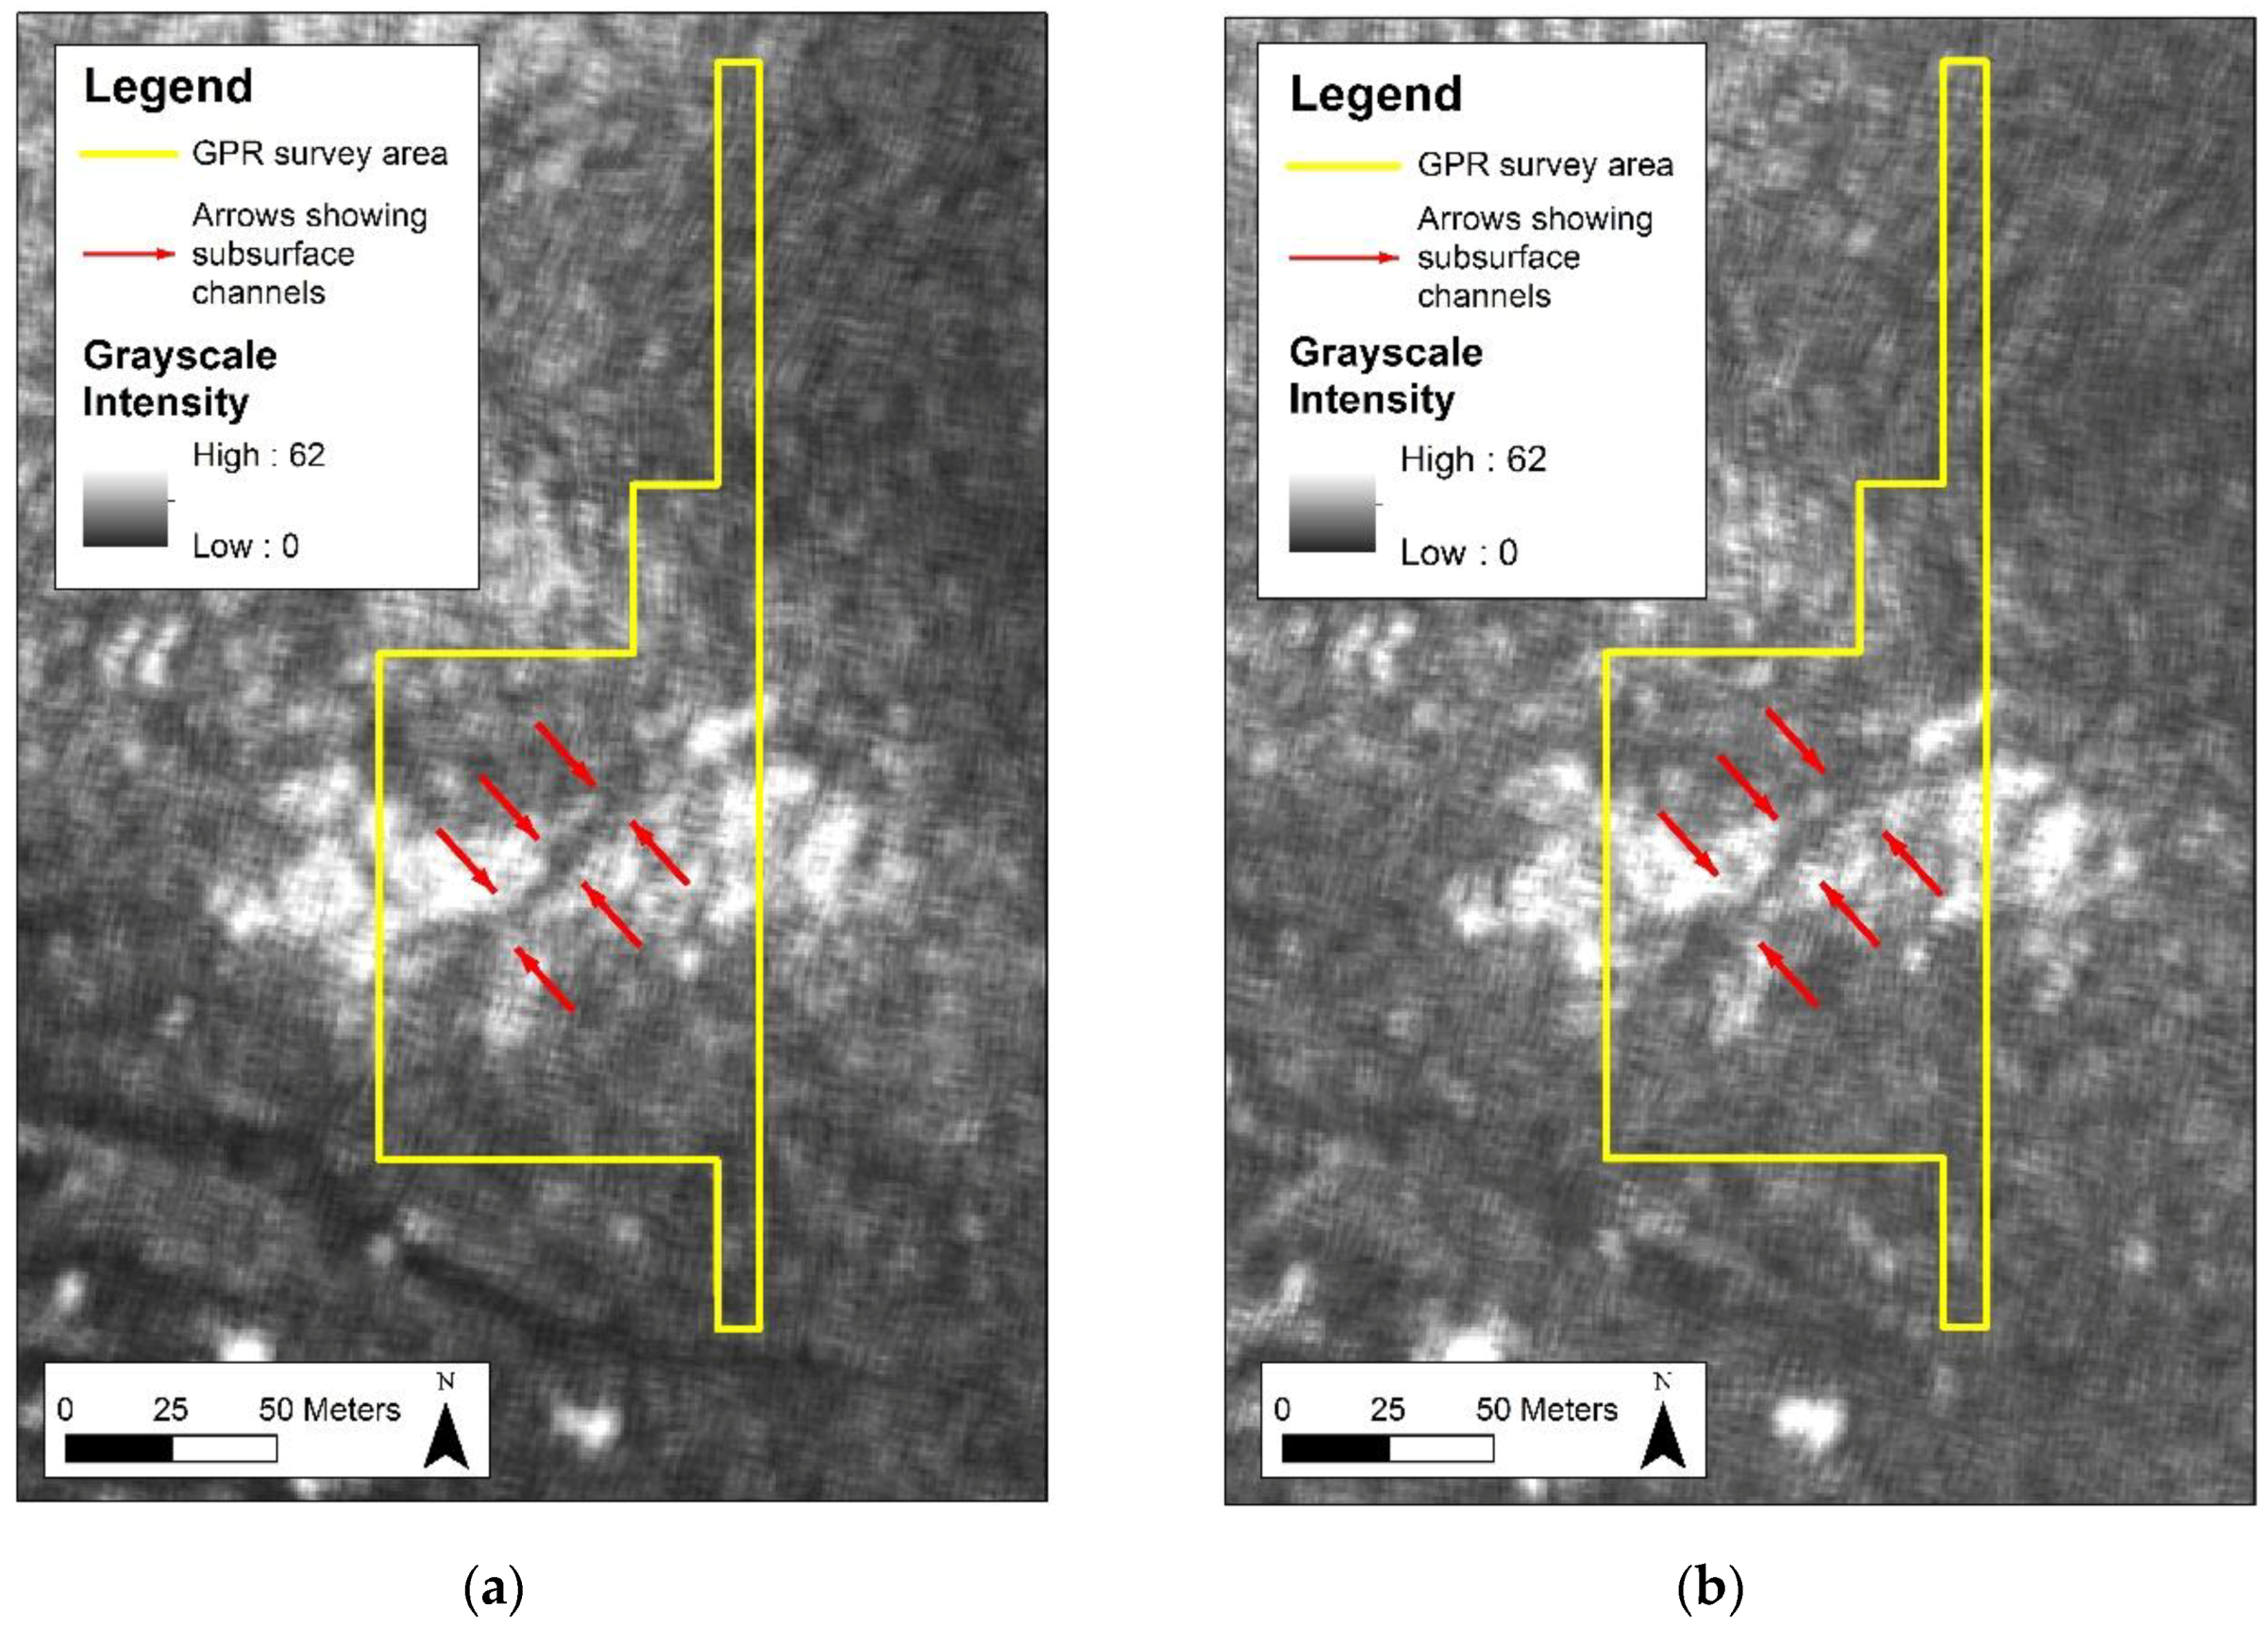
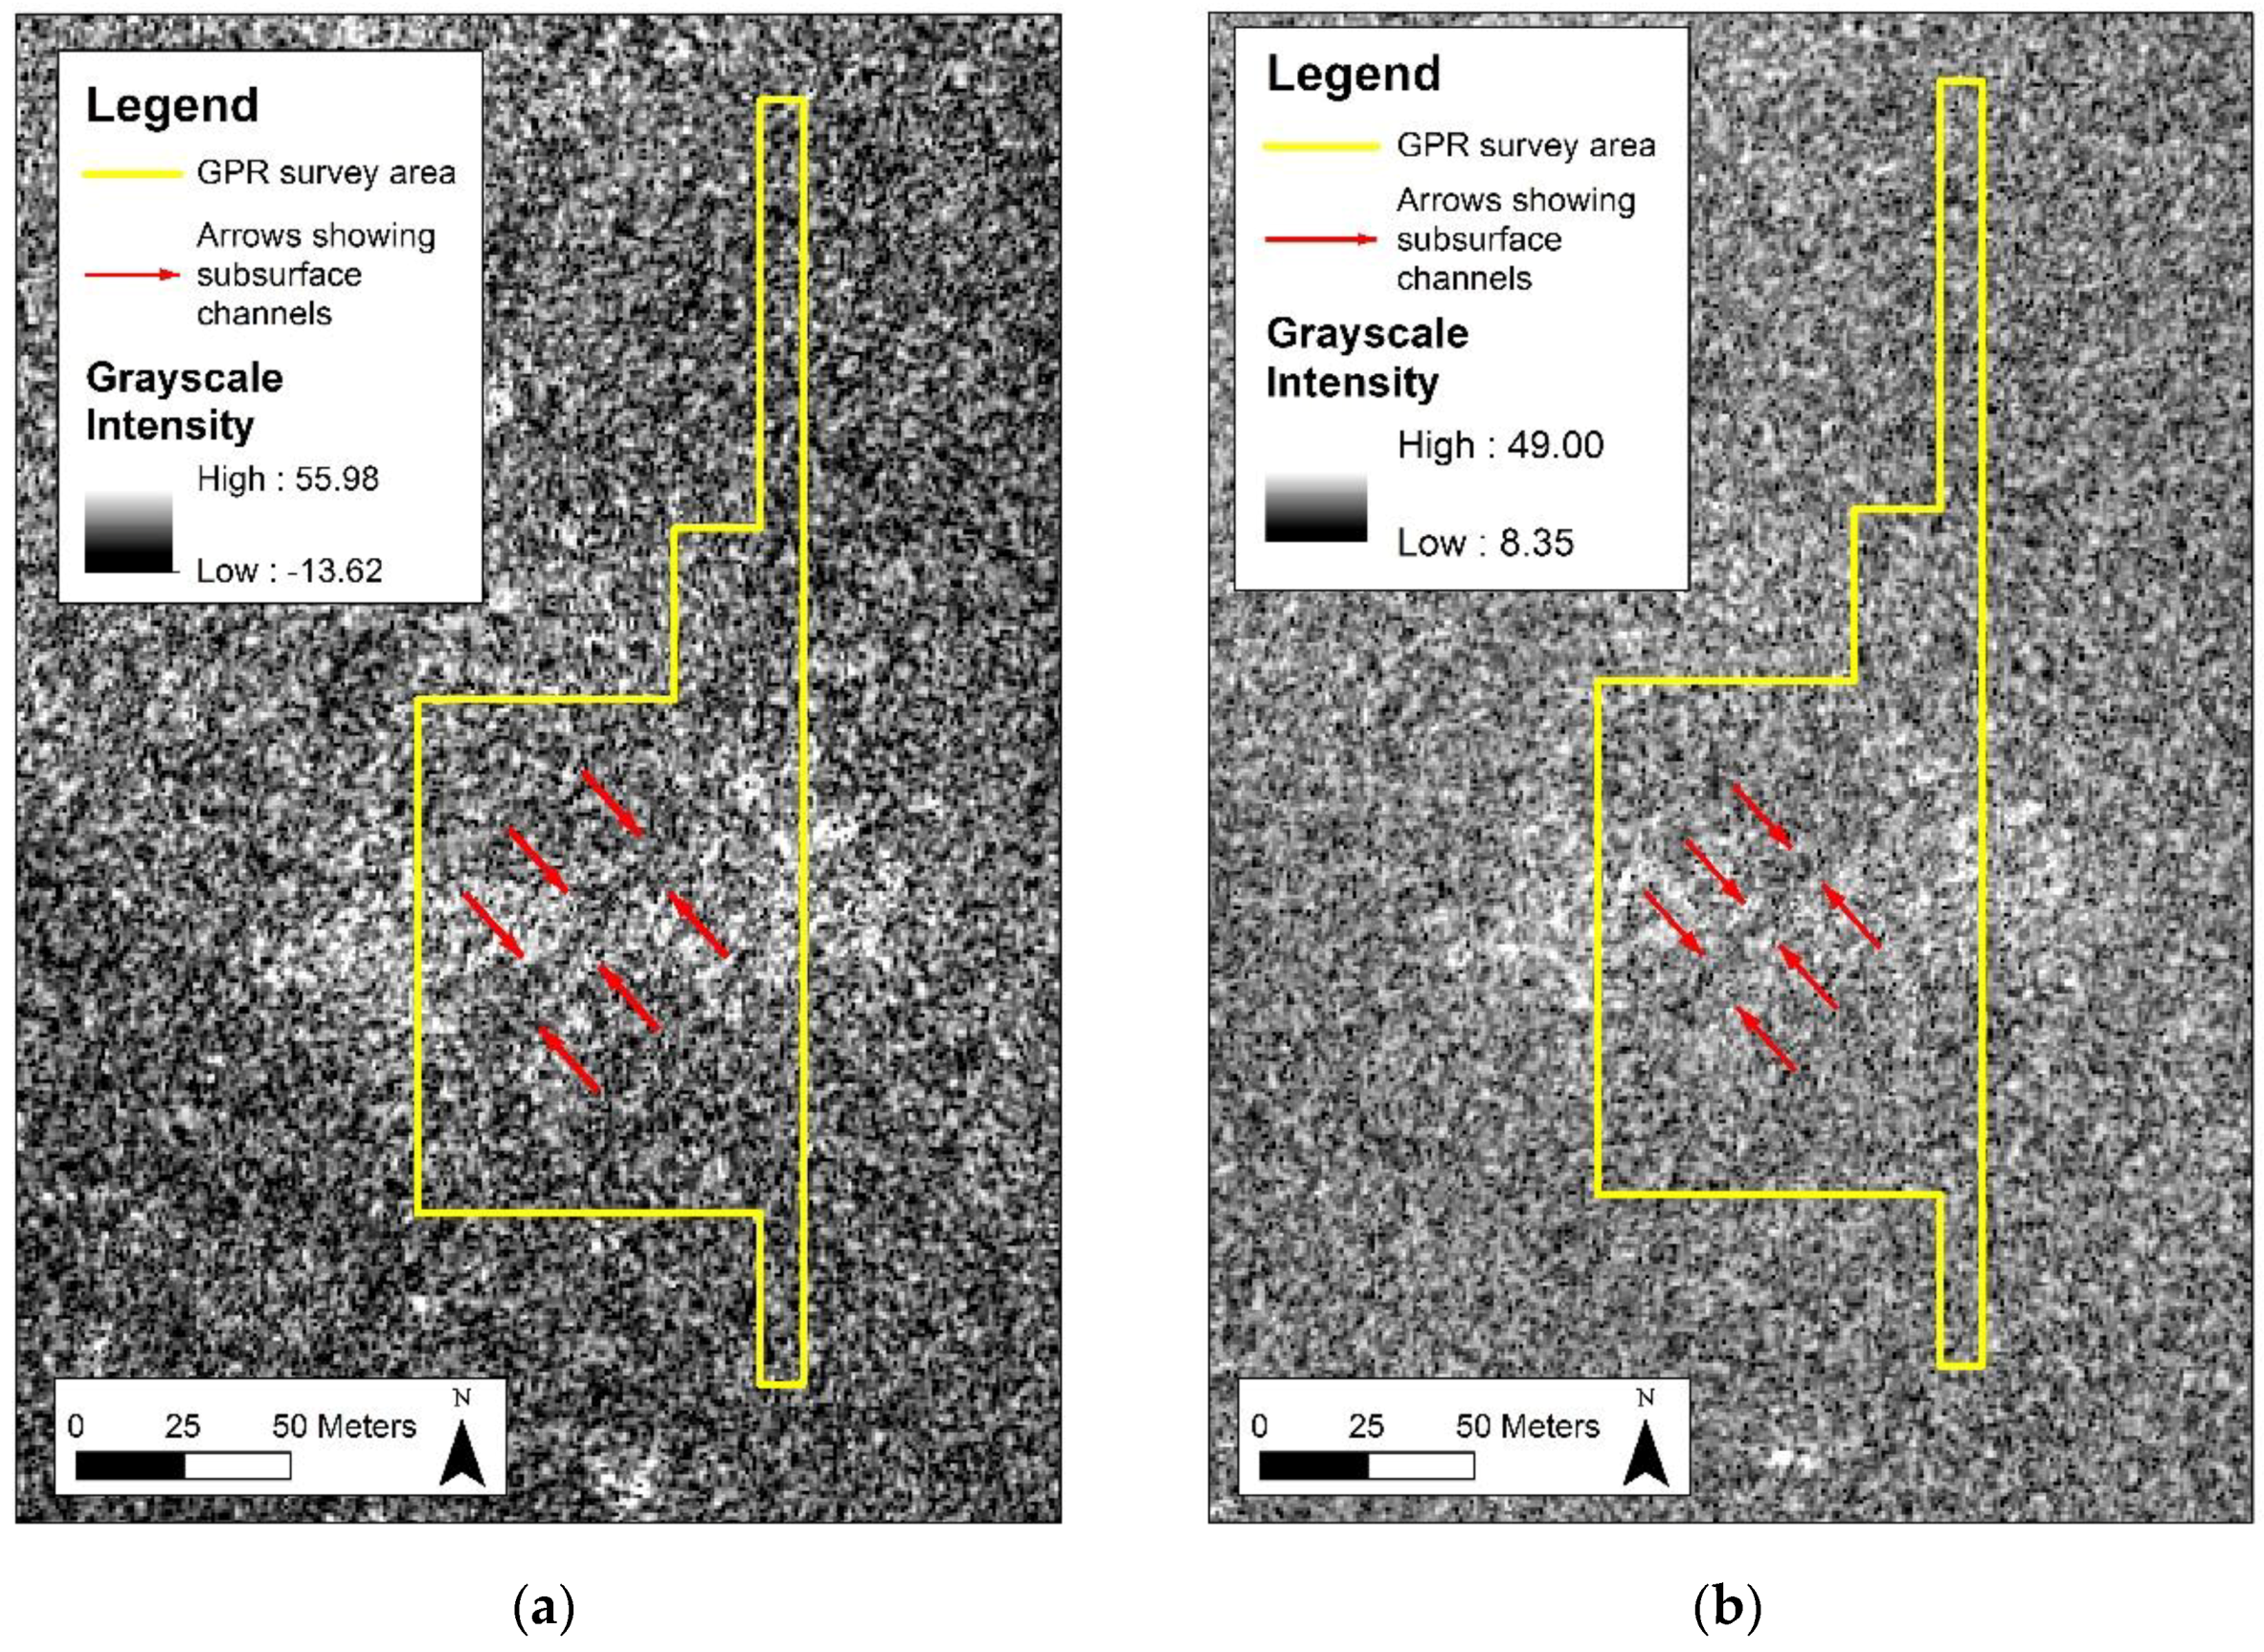
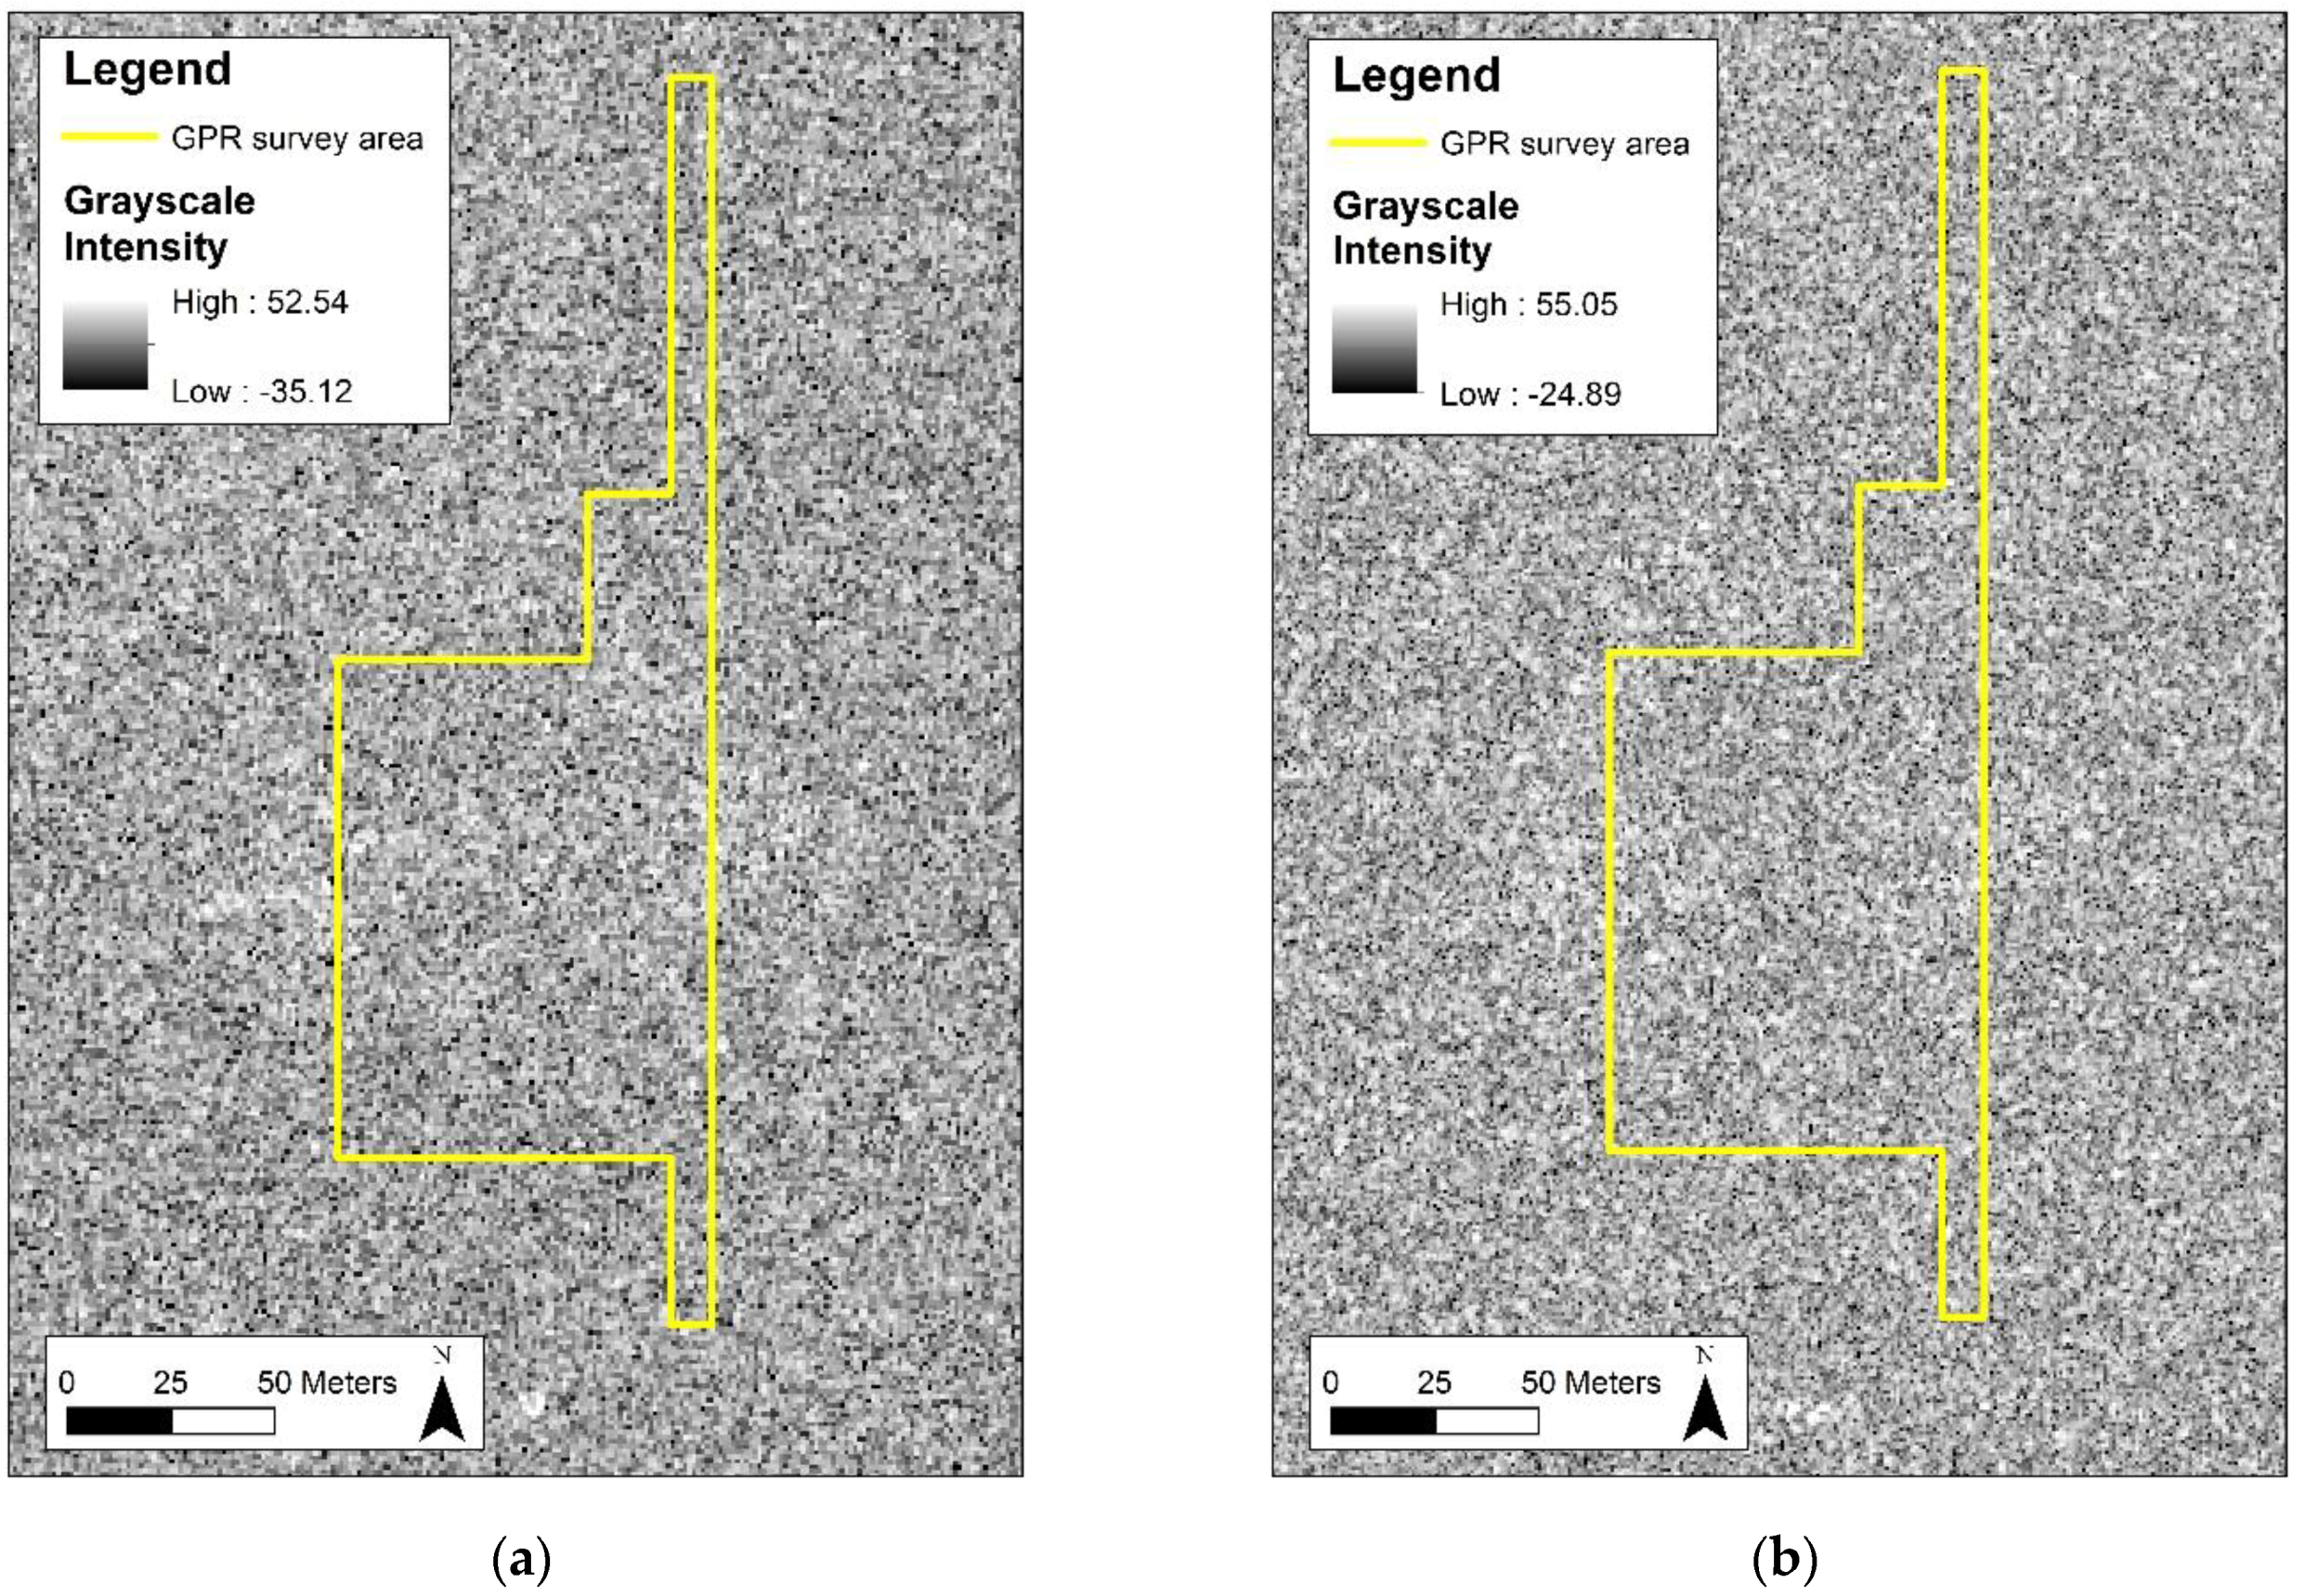
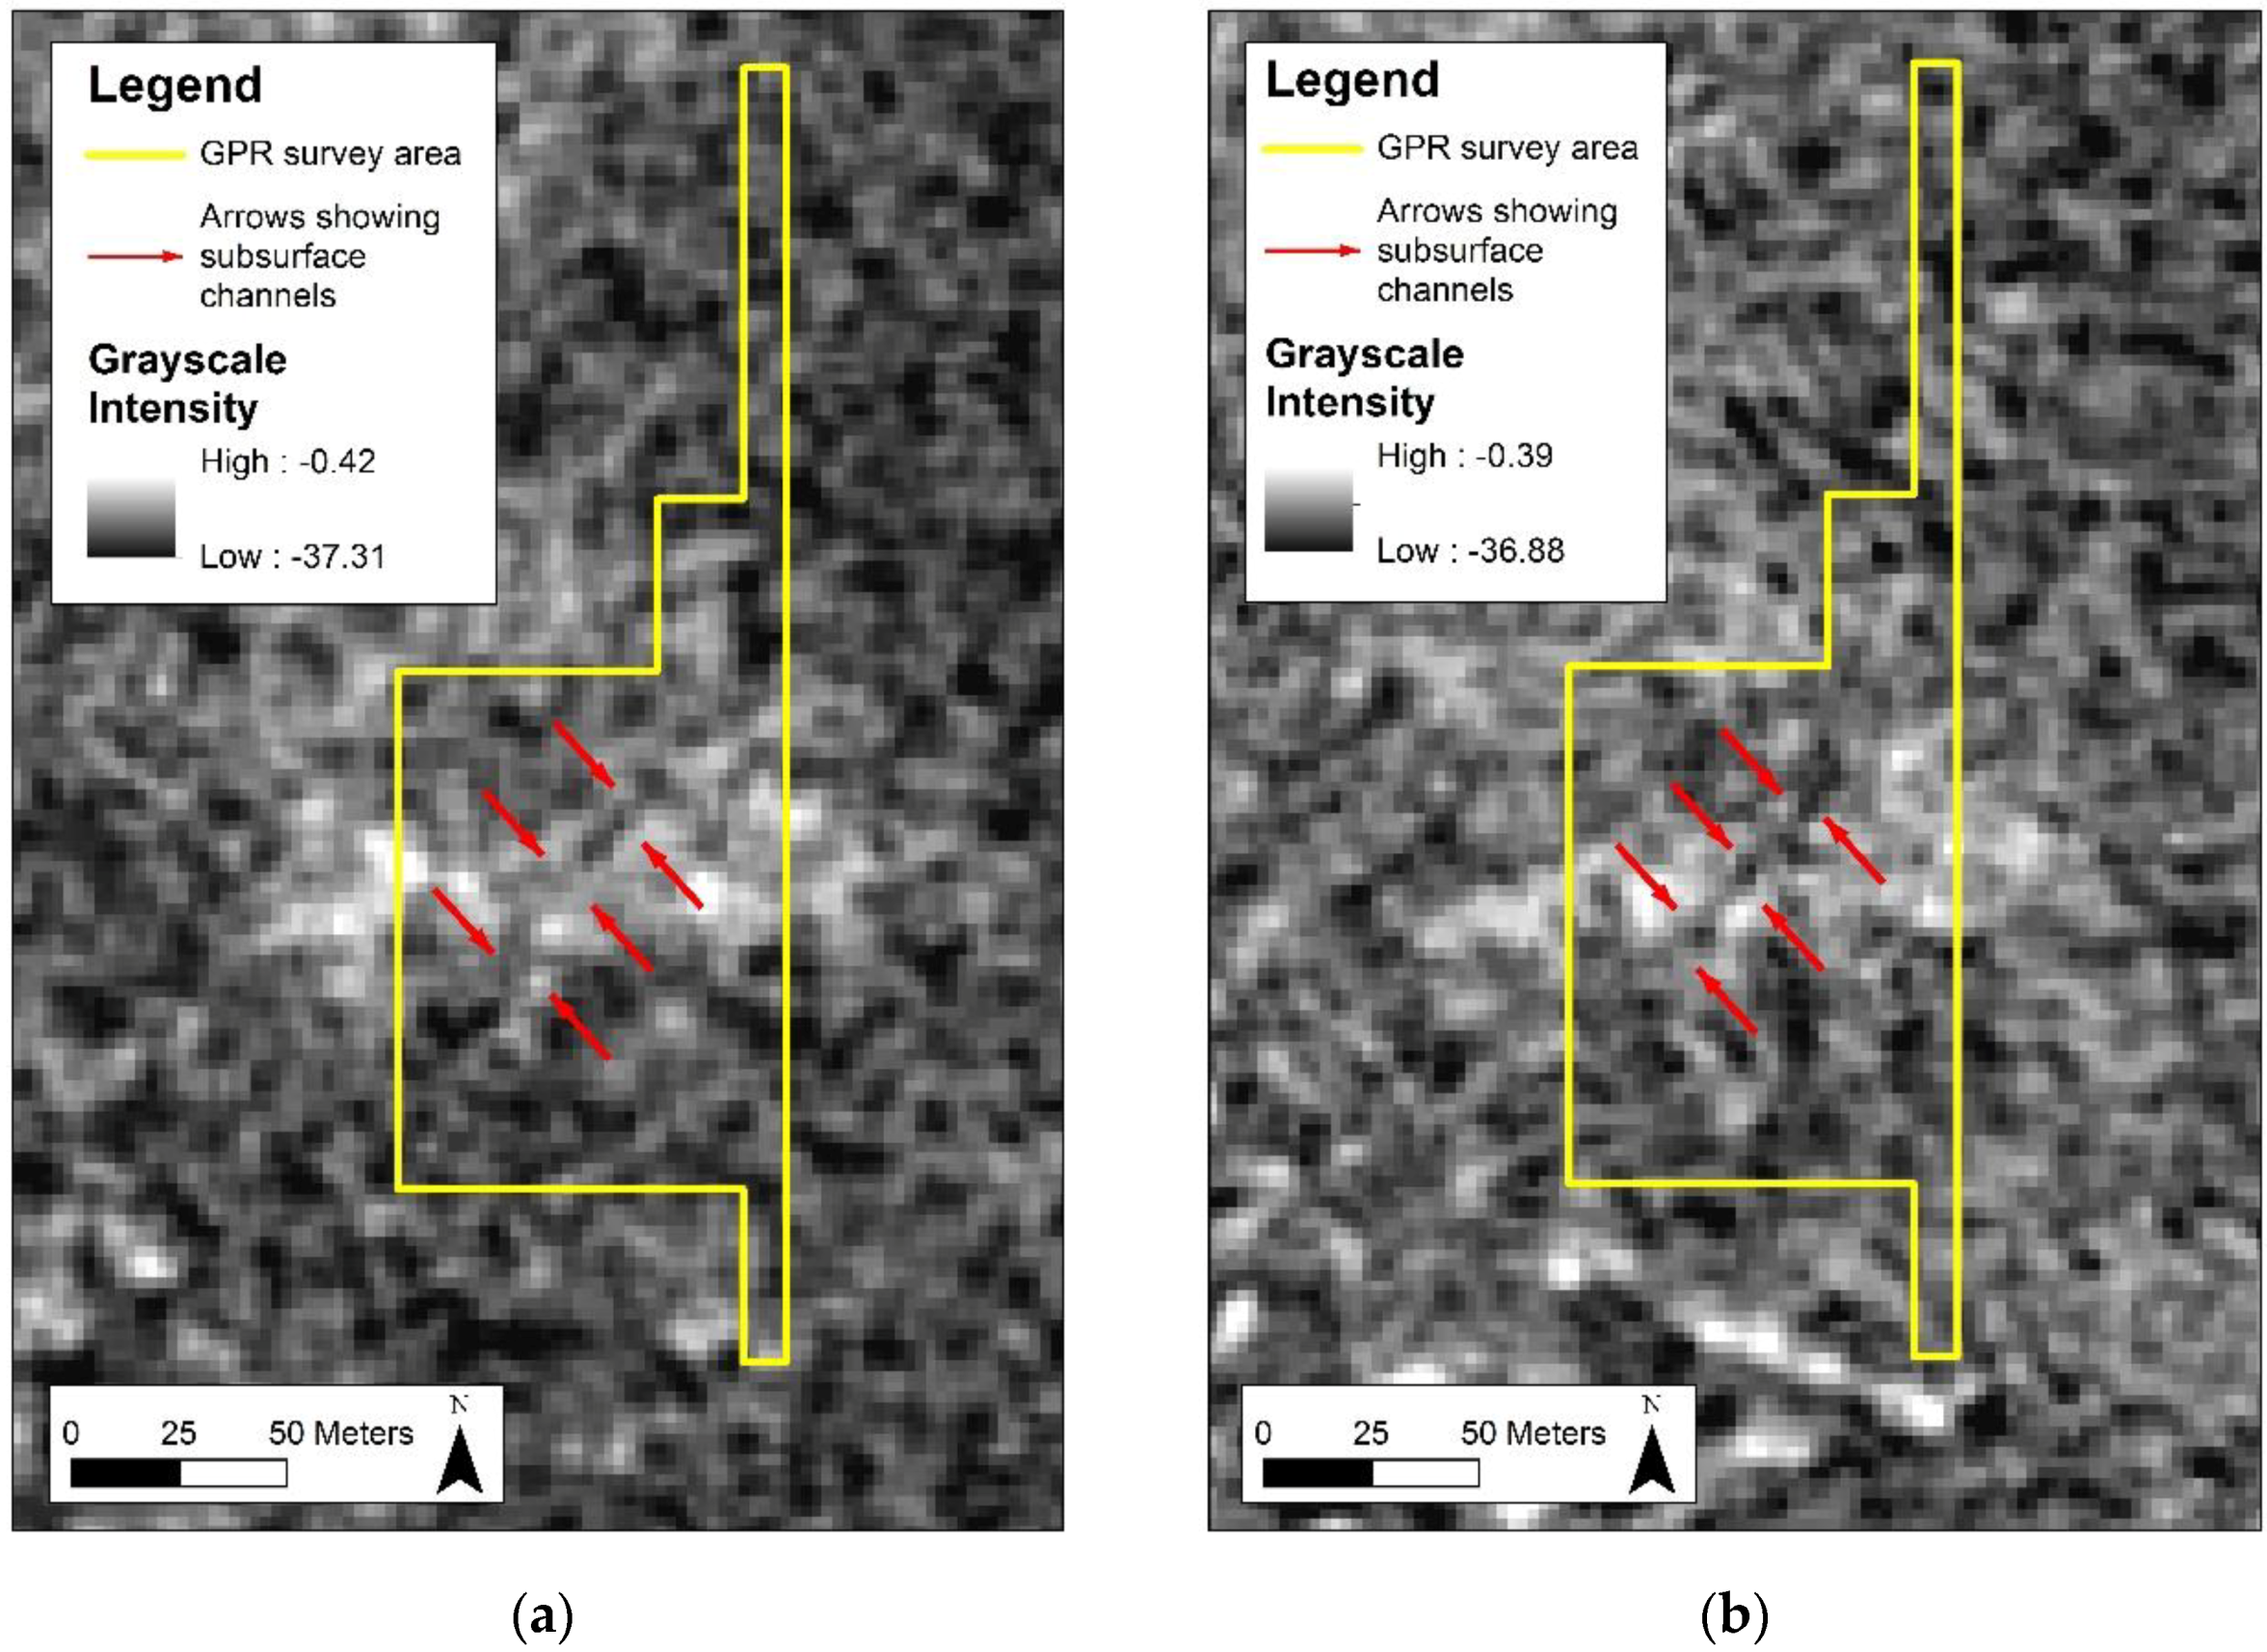
Delineation of a northeast/southwest trending linear feature first identified by GPR was most evident in the TanDEM-X bistatic image multi-channel stacks (Figure 4), although it is also detectable in many (Figure 5), but not all (Figure 6) of the single data TanDEM-X bistatic images as well as some of the RADARSAT-2 images (Figure 7).
This linear feature is very similar in appearance to the drainage channels occasionally visible on the surface in areas surrounding ‘Uqdat al-Bakrah (Figure 3b). However, during repeated visits to the site over multiple years there were no discernable differences in color, texture, or surface topography that would indicate a subsurface linear feature at ‘Uqdat al-Bakrah in this location (Figure 3a). Due to its sinewy appearance and backscatter properties, this feature was interpreted as a natural subsurface paleo-channel, which was later confirmed by excavation.
The channel is visible in all the co-polarized TanDEM-X bistatic images that have an incidence angle of 30 to 40 degrees, across different linear polarizations and look directions (Figure 4 and Figure 5 and Table 1). In contrast, the co-polarized images with incidence angles of 52 or 53 degrees (Figure 6a) changed the backscatter behavior between the channel and its surroundings to such a degree that the feature could not be distinguished. These images were similar in appearance to the VH and HV images (Figure 6b) with their high speckle, suggesting a comparable low signal-to-noise ratio, which provides poor imaging for archaeological prospection [8,10,17].
While the paleo-channel is visible in the individual TanDEM-X bistatic processed images (Figure 5), it becomes more discernable with the GLCM mean variance texture analyses on the stacked images (Figure 4) due to the improved signal-to-noise ratio achieved with the coregistration and summing of a temporal series [8,20].
Although not as clearly delineated, this channel is also visible in three of the seven analyzed RADARSAT-2 images. It is best imaged in the HH and VV descending images at a 33-degree incidence angle (Figure 7) but is also visible in the VV polarized image with the 27-degree incidence angle. It was not discernable in the HH polarization images with the 27-degree or 39-degree incidence angle as the lower signal-to-noise ratio in these images obscured any identification of this subsurface feature. In contrast to the TanDEM-X bistatic images, the backscatter behavior that allows identification of the channel is limited to smaller incidence angles (27 to 33 degrees) with the VV polarization also affecting identification. Due to the slightly coarser resolution, the paleo-channel is better displayed with the low pass 3 × 3 pixel window filter rather than the GLCM texture analysis.
This analysis demonstrates that the identification of this subsurface channel in both the TerraSAR-X bistatic and RADARSAT-2 images is highly dependent on a low radar incidence angle. However, despite the positive identification of this subsurface channel, it is unclear what exactly is responsible for the changed scattering mechanism: remnant moisture in the stratigraphy, differences in the geometric size of the pebbles in the channel base relative to the radar wavelengths, or other chemical/physical properties of the soils in the stratigraphy that provide a contrast against the surrounding medium. In contrast, the loss of sensitivity to the subsurface feature in the higher and lower incidence angle images is likely a result of a decreasing signal-to-noise ratio (whether from wave attenuation [34] or increased surface roughness due to the change in viewing geometry [10,12,17]), which does not allow differentiation of the feature from its surroundings [8,10,11,17].
Although successful in identifying the subsurface channel, neither dataset could identify the pits at the site, likely due to their small size (~0.8 m–3 m), relative to either SAR mode resolution. While some pits have a pebble base or lining, many appear to be degraded, leaving an insubstantial base and charcoal layer, thus providing only a subtle contrast to the background medium of alluvial, aeolian and calcrete sands.

3.2. Ground Verification

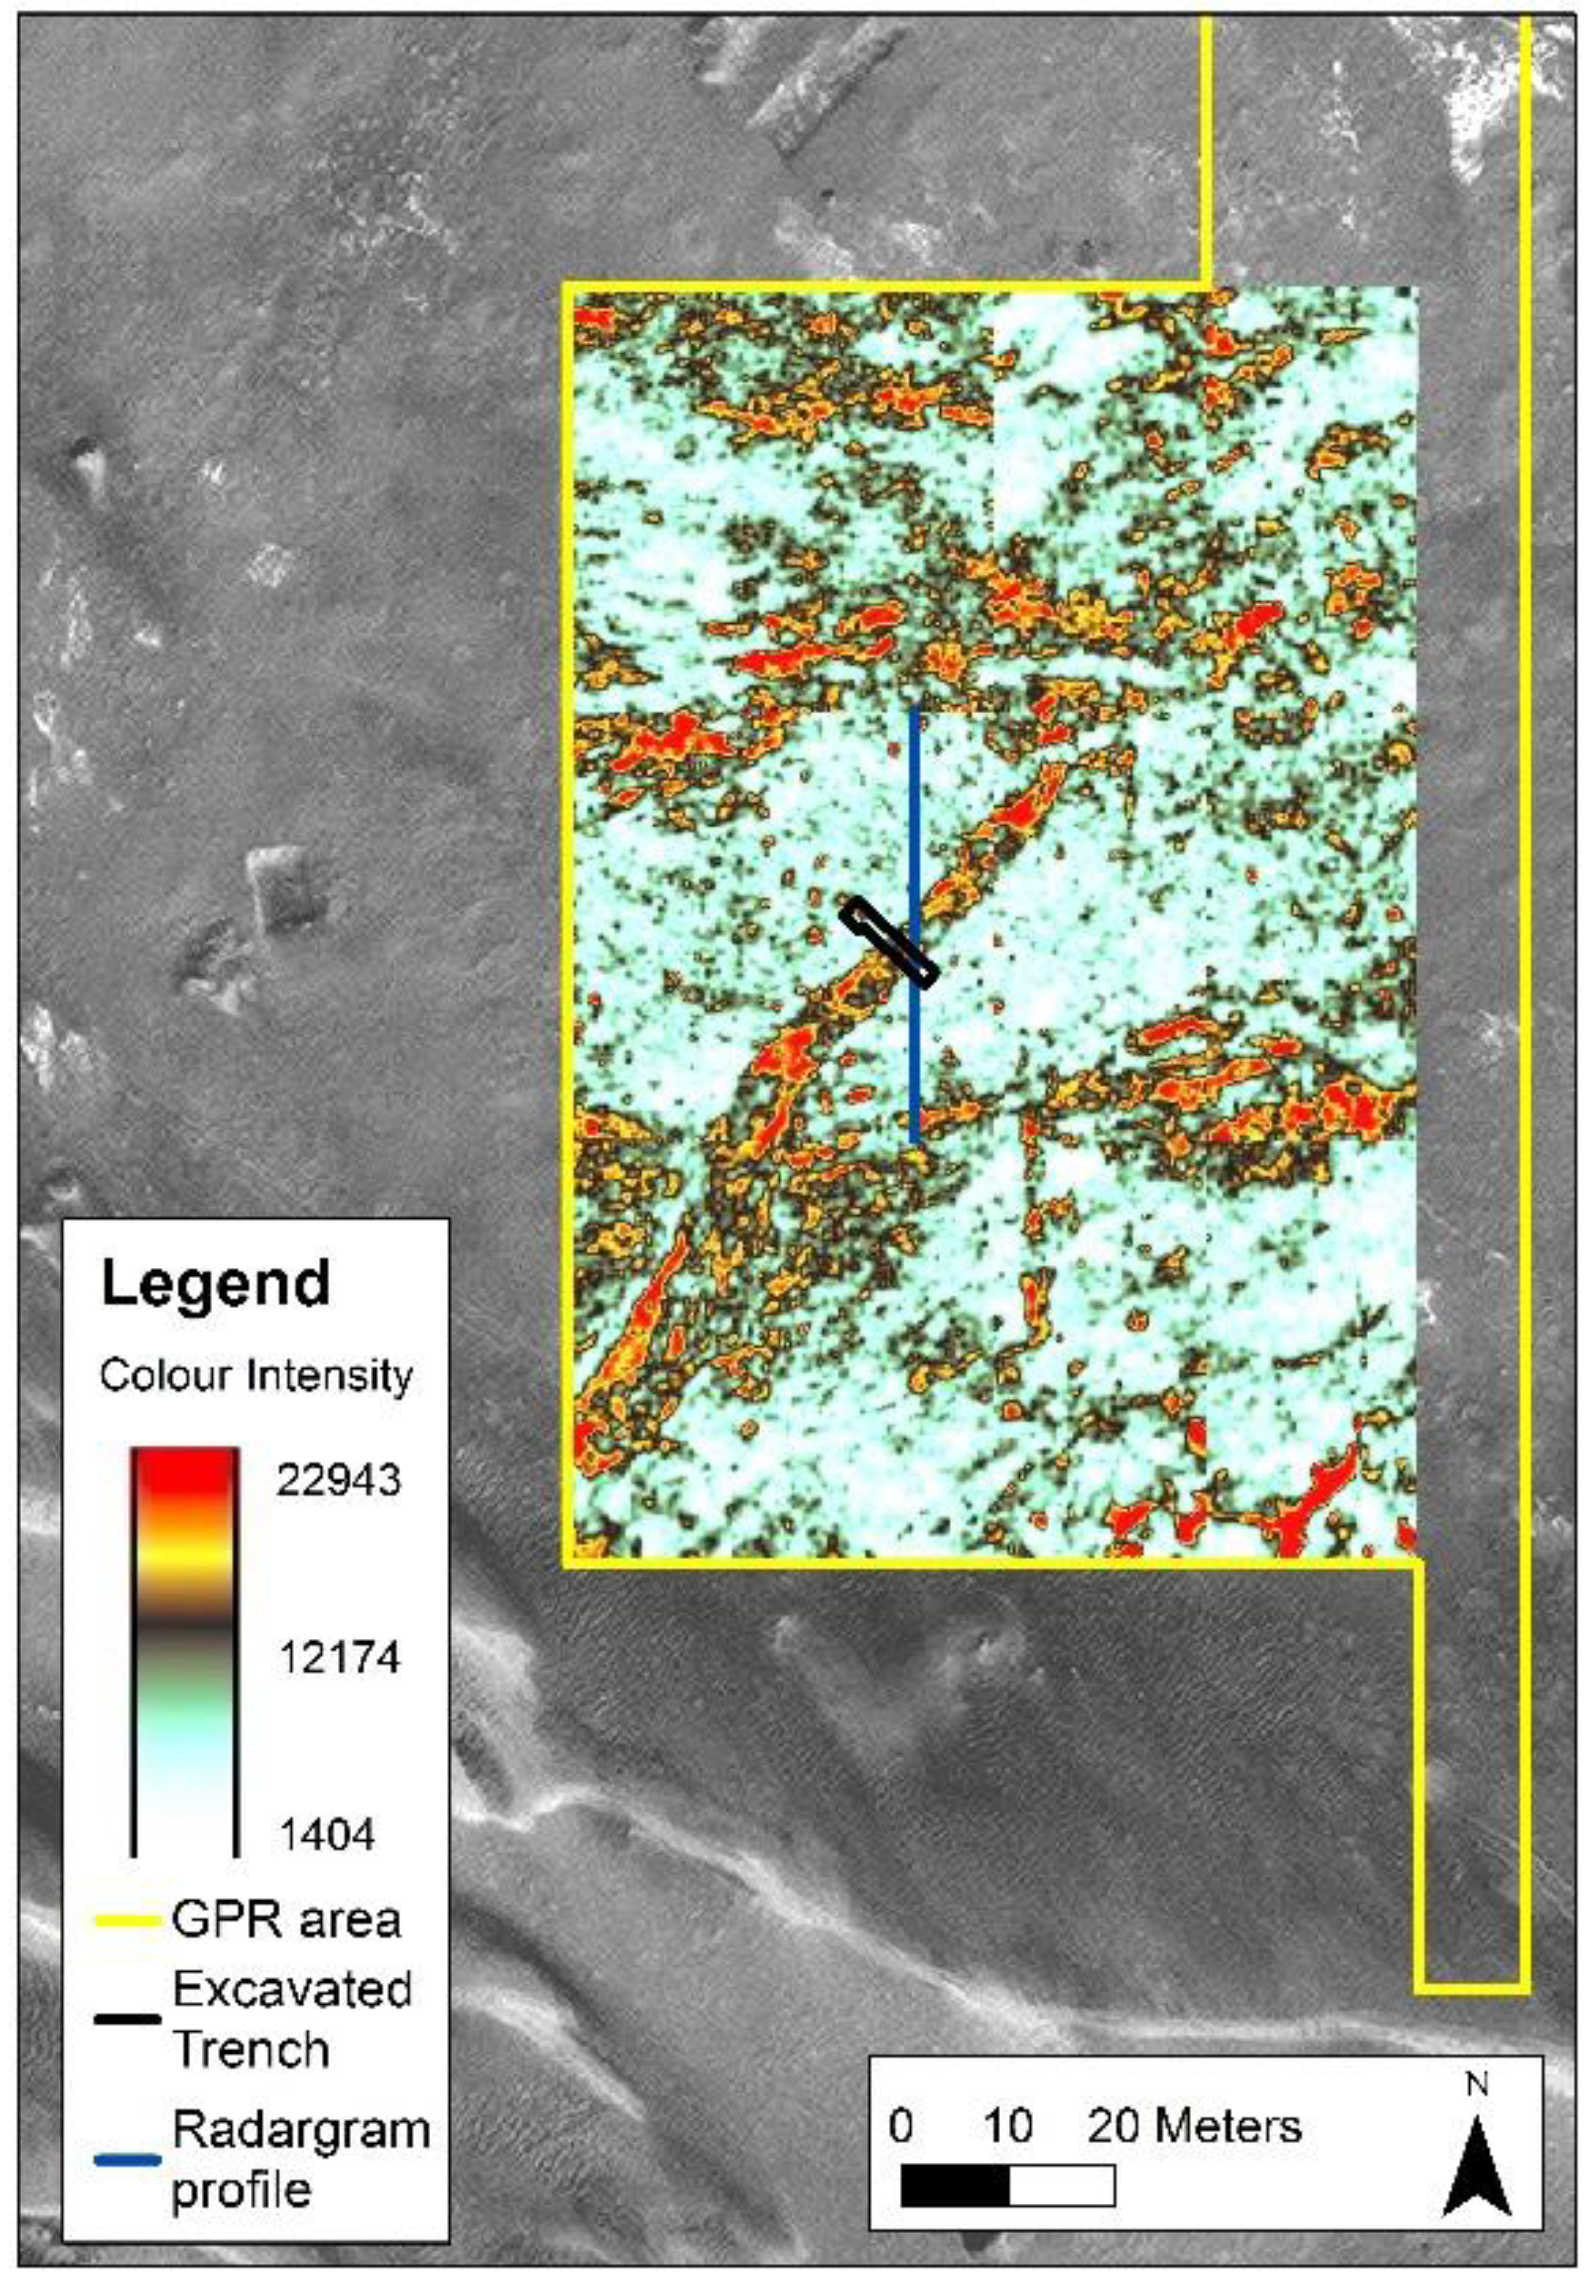
The subsurface linear feature described above was first identified in GPR data (Figure 8 and Figure 9) collected at the site of ‘Uqdat al-Bakrah. This geophysical survey was undertaken in January 2017, during which 620 GPR profiles were acquired with an average spacing of 0.50 m. A GSSI SIR-3000 GPR system (Geophysical Survey Systems, Nashua, NH, USA) was used with a 400 MHz antenna. Confirmatory identification of the feature in SAR prompted heightened scrutiny of the GPR data, which were processed using GPR Slice (version 7.0, Geophysical Archaeometry Laboratory Inc., Woodland Hills, CA, USA). Velocity analysis for the site revealed an average relative dielectric permittivity of 4, which converts to a depth of approximately 0.75 m/ns.
Due to the nature of the GPR processing in north/south transects, the subsurface channel is displayed as approximately 8 m wide in the radargram profile as it is not perpendicular to the channel like the excavated trench. Additionally, the depth is slightly shallower (approximately 0.6 m) in Figure 9. Of the ten radargrams produced along this profile the subsurface channel depth varies from 0.6 m to 0.7 m.
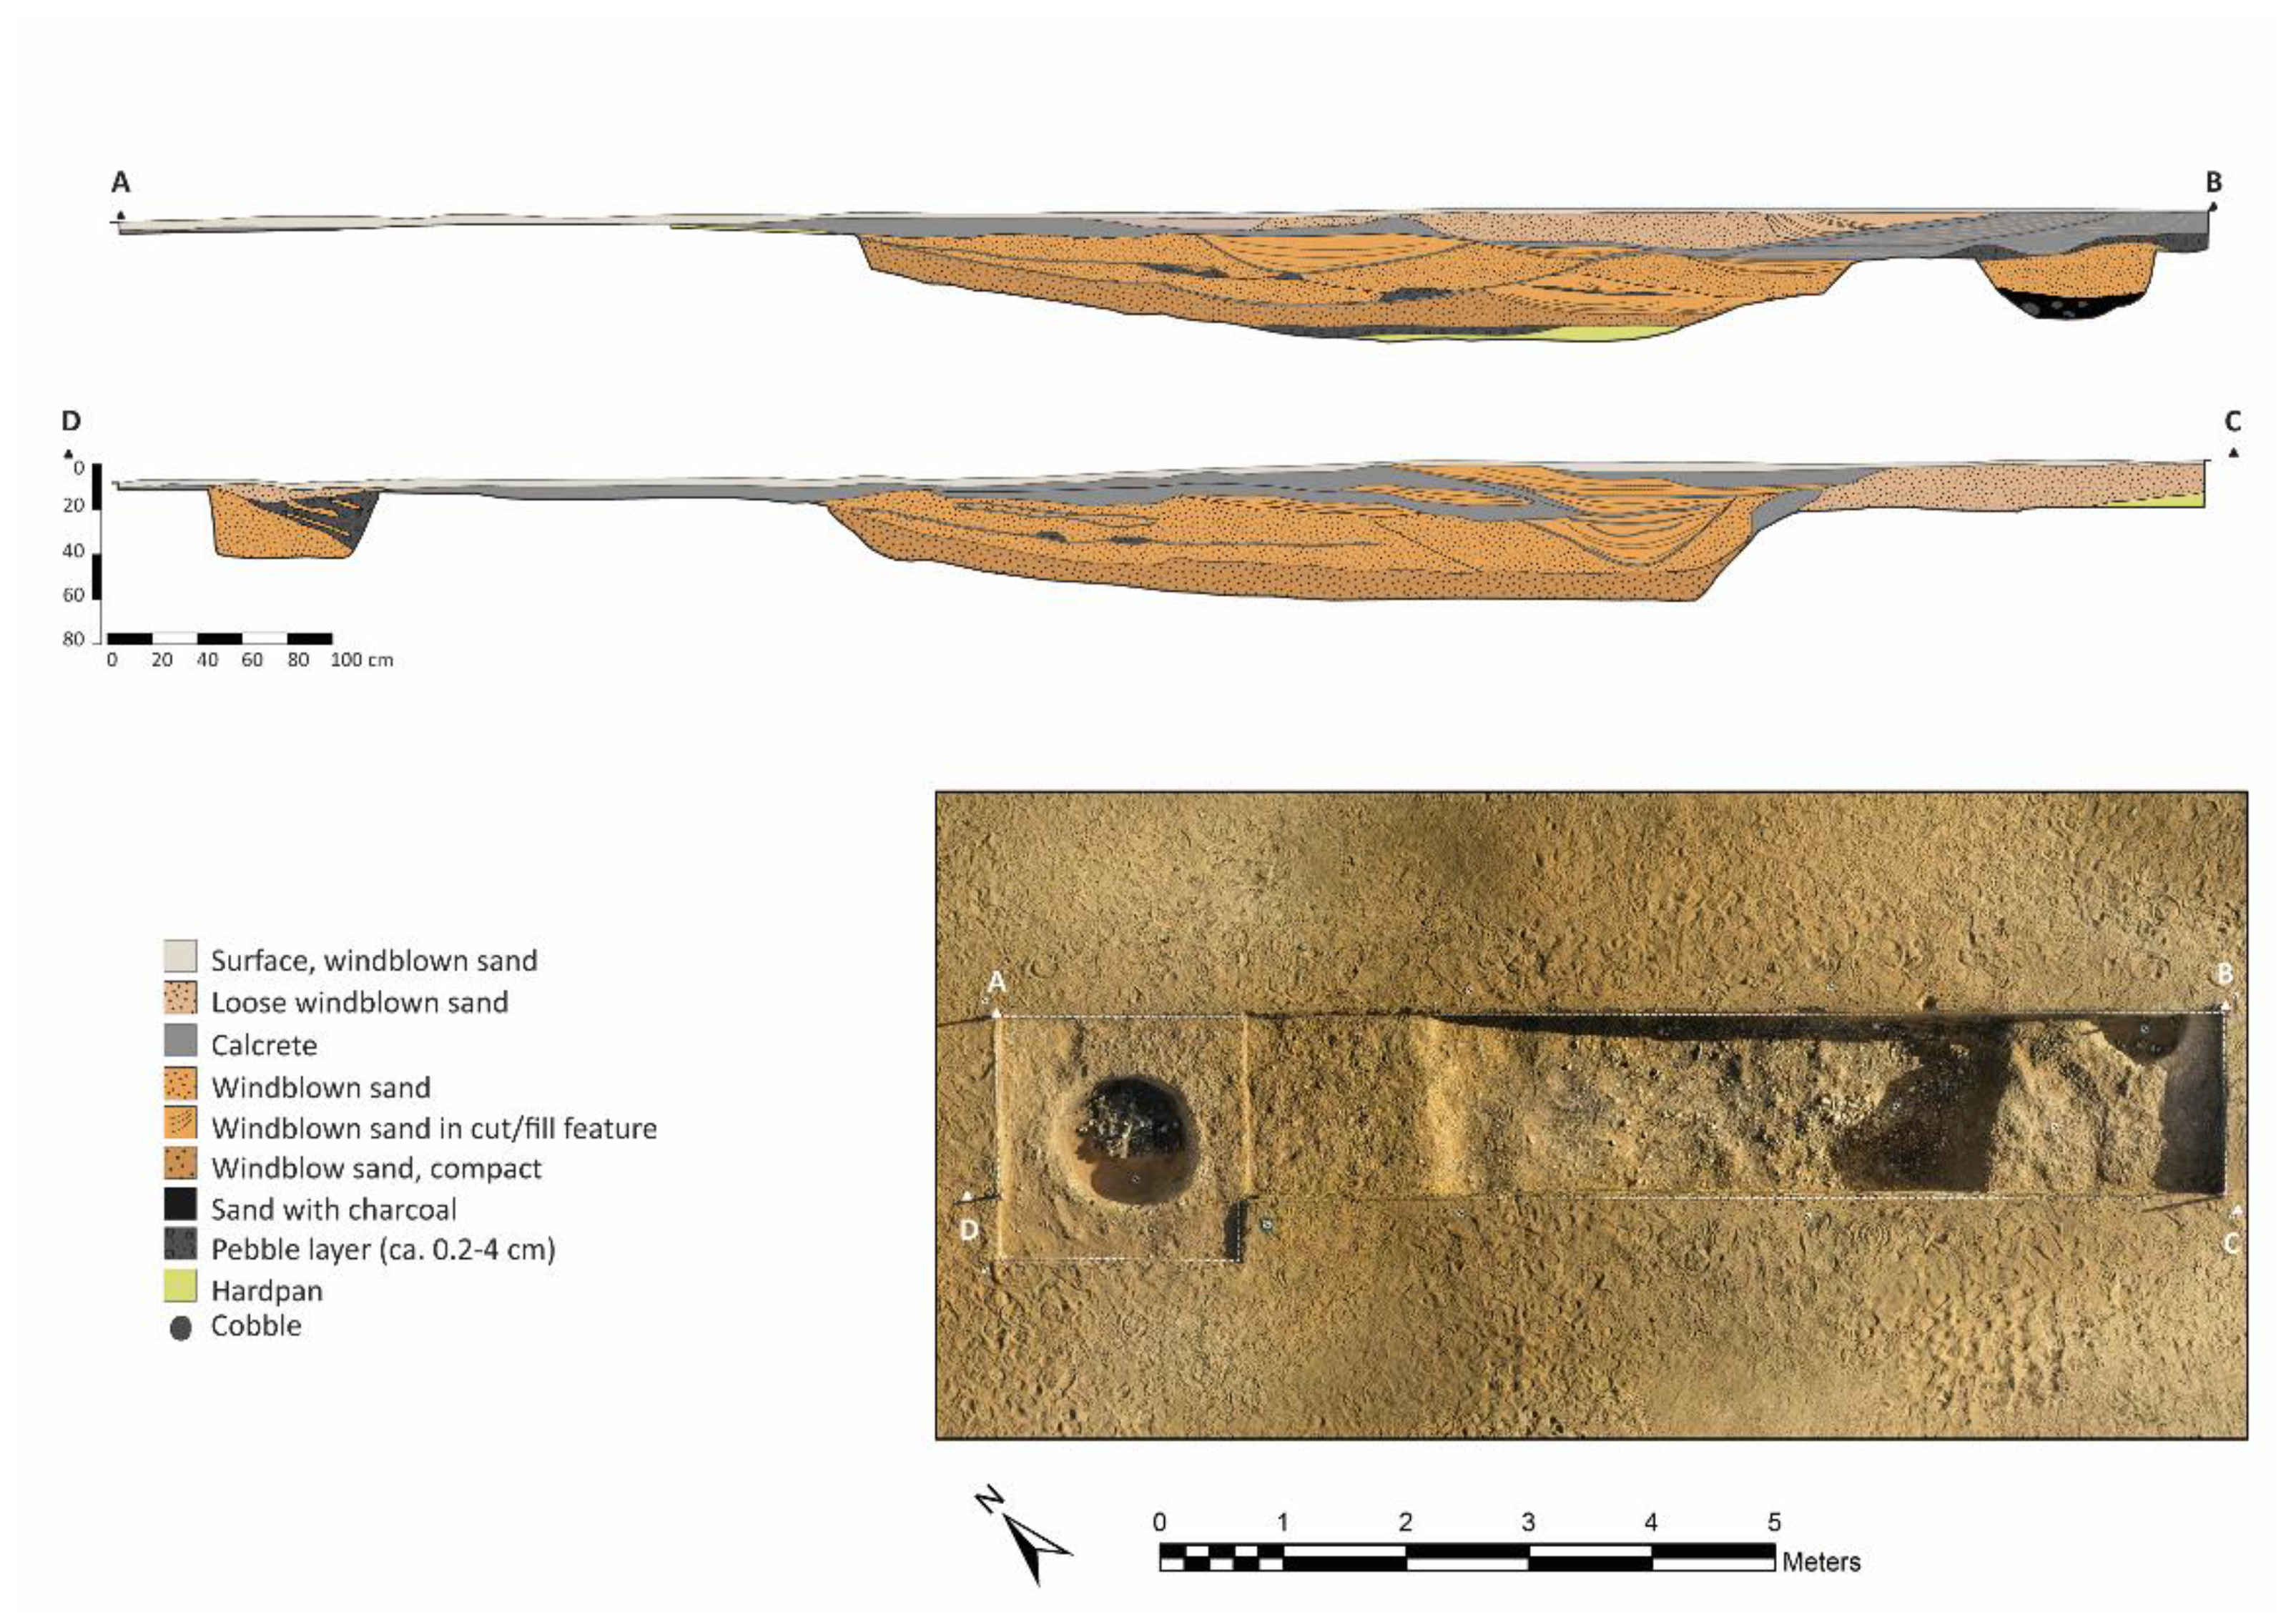
Excavations conducted by the ArWHO Project in January 2018 included a trench dug perpendicular to the linear feature identified in GPR and SAR, confirming its interpretation as a natural subsurface paleo-channel. The channel cuts into a hardened unit of concreted pebbles and was covered in deposits of calcrete, compact and loose windblown sand, and cut-fill sedimentary units over a loose pebble-layer bed. The depth of the channel is approximately 0.7 m below ground surface (Figure 10).
Subsurface imaging at ‘Uqdat al-Bakrah indicates that both X-band and C-band microwaves are able to identify this channel, the base of which has been measured to a depth of 0.6 m–0.7 m below ground surface, as validated through GPR survey and excavation. In this case, the lower frequency wavelength provided the best subsurface image. The look direction does not seem to affect the interpretability of the subsurface feature, likely because the channel is a sinewy shaped feature with indistinct edges rather than a solid feature that would create a strong profile from the sensor. Although the VV polarization displays a slightly clearer image, the HH polarization is also adequate for imaging this channel. In addition to the polarization, the incidence angle seems to be the deciding factor for imaging the subsurface channel. For both X-band and C-band, the feature was visible in images with incidence angles between 33 and 40 degrees (except for the RADARSAT-2 VV image at 27 degrees).

4. Discussion

Penetration depth of X-band microwaves in arid environments has not been extensively studied or verified with quantitative fieldwork. The foundational work on subsurface penetration focused on the Mojave Desert with the SEASAT sensor and the Sahara with the SIR-A sensor, both of which provided measured L-band penetration depths of up to 2 m in arid environments [14,35]. Ongoing study in the Sahara with the SIR-C/X sensor further substantiated Schaber’s [15] calculated imaging depths of 0.4–2 m for L-band, 0.1–0.5 m for C-band and 0.05–0.3 m for X-band, but through comparative analysis only, with later investigations in this region using GPR data to confirm similar imaging depths for both C-band and L-band [36].
Based on this foundational work, identifying larger subsurface features with SAR data has become relatively common in arid environments. However, verification for the depths of penetration has often only been explained comparatively (versus other SAR sensor imaging penetration depths or in comparison to optical imagery) rather than empirically measured [18,37,38,39,40]. This lack of verification is especially evident regarding shorter wavelengths and in archaeological contexts. One exception to this would be a recent investigation at the Roman fortress Qreiye in Syria where the authors claimed an X-band penetration depth of ca. 25 cm [20,21]. Unfortunately, other recent C-band archaeological investigations have not been verified due to political tensions in subject regions [19], lack of confirmatory fieldwork [17] or lack of success in identifying subsurface features due to the limits in ground resolution of the available sensor [41]. Hence, while the depths of penetration into desert sands have been calculated for different wavelengths, empirical testing of these depths is limited, especially for shorter wavelengths.
The discovery and verification of a subsurface paleochannel at ‘Uqdat al-Bakrah is significant as it demonstrates the ability of shorter wavelengths for subsurface imaging in arid environments. However, although the depth of the channel has been measured at 0.6 to 0.7 m (in the GPR and the excavation), it is unclear whether the microwaves are penetrating to this specific depth. In attempting to determine the subsurface interface that will help us understand the depth of microwave penetration there are a few possibilities that require further investigation and will be addressed in future work. Surface/subsurface moisture and dielectric permittivity could be affecting the penetration depth and will be measured during upcoming field seasons. The relationship between this channel or other potential subsurface features with the ubiquitous calcrete soils at the site will be further considered as this type of soil is known to have properties that affect microwave backscattering [14,15]. The effect of the incidence angle from refraction of the microwave into the soil will also be considered, as this factor may have enhanced the subsurface backscatter [42].
Despite the continued research required in order to understand how exactly the X-band and C-band microwaves are interacting with this subsurface feature, it is still clear that these sensors can be useful for subsurface imaging in archaeological applications of arid environments. This work also contributes to the lack of investigation regarding microwave penetration of shorter wavelengths.

5. Conclusions

Our results show that X-band and C-band data are suitable for subsurface archaeological mapping of small hydrological features in arid contexts. While the subsurface channel is visible in the TanDEM-X bistatic individual images, the sum of these images increased the signal-to-noise ratio and allowed a better representation of the area [20]. Subsequently applying the GLCM texture analysis further reduced the speckle and better articulated the channel. Single data images (both TanDEM-X bistatic and RADARSAT-2) display the channel best with a low pass 3 × 3 pixel window filter to reduce the speckle.
The identification of a paleo-channel at the Iron Age site of Uqdat al-Bakrah is integral to the understanding of water resources in arid environments of the Arabian Peninsula. Water availability, including small paleo-channels, were crucial to past human activity and are therefore important targets of archaeological prospection. The assessment of data with varying acquisition parameters has provided informative results, with VV polarization and incidence angles of 30 to 40 degrees being the most successful for subsurface imaging of this channel. Ideally, the successful results of this investigation will be replicated in similar environments, providing archaeologists with more useful prospection tools.
Further work on this site will include the use of TerraSAR-X data; the staring spotlight mode offered by this data is the highest resolution satellite SAR data available. This imagery has been used successfully in archaeological applications for detecting remains of historical land-use on intertidal flats on the German North Sea Coast [43] as well as monitoring heritage looting over time at Apamea in western Syria [44]. Our work will expand on this repertoire of case studies with subsurface prospection at ‘Uqdat al-Bakrah. We expect that a stack of these products will improve the signal-to-noise ratio and provide a higher quality image [8,16,20] that will allow further subsurface imaging of features at the site. At this stage it is difficult to trace the path of the paleo-channel, but an improved image may support a more precise delineation. In addition, it is a primary goal of this further work to identify the small pits or other possible features. Despite the fact that many of these pits are degraded, the staring spotlight mode may be sensitive enough to reveal changes in the backscatter behavior that will differentiate some of the pits from their surroundings if they have a solid pebble base and/or walls or are spatially clustered. Multi-polarized products also potentially offer additional subsurface information if their resolution is fine enough for the scale of the features at this site. Ongoing excavations will continue to be integral to interpreting GPR and SAR results.

Author Contributions

F.W. conceptualized the research and methodology, carried out all the SAR data processing and prepared the original draft. Technical editing was provided by M.J.H., A.B., S.H., J.T., J.O.S. and K.M.S., M.J.H., S.N., J.W.L., I.A.D. and T.C. contributed archaeological expertise. Field validation was conducted by F.W., M.J.H., S.N., J.W.L., K.M.S. and J.O.S. Supervision was provided by M.J.H., J.T. and S.H.

Funding

The SAR data for this research was granted by the German Aerospace Center (DLR) Science Program, (Proposal ID: Other7038) and the SOAR-E (Science and Operational Applications Research—Education Initiative) of the Canada Space Agency (Project #5410). RADARSAT-2 Data and Products © MacDonald Dettwiler and Associates Ltd. (2017)—All Rights Reserved. RADARSAT is an official trademark of the Canadian Space Agency. Funding for fieldwork and analysis included a NASA ROSES (Research Opportunities in Space and Earth Sciences) Grant (#NNX13AO48G), a Johns Hopkins University Catalyst Grant, a Space@Hopkins Grant, an Australian Research Council Discovery Early Career Researcher Award (Project ID: DE180101288), and a grant from the University of Arkansas, Centre for Advanced Spatial Technologies, Spatial Archaeometry Research Collaborations (CAST/SPARC) Program.

Acknowledgments

We are very grateful to the Sultanate of Oman, Ministry of Heritage and Culture for permission and collaborative support for our research, in particular His Excellency Salim M. Almahruqi, Sultan Al-Bakri, Khamis Al-Asmi, Mohammed Al-Waili, and Suleiman Al-Jabri deserve special thanks for their professionalism, support, and collegiality. Our investigations also rely on the gracious hospitality of the general public in Oman, including Shafi and Mutaab Al-Shukri who have long contributed crucial logistical assistance to our team. CSA is gratefully acknowledged for providing the RADARSAT-2 data as is the German Space Agency (DLR) for providing the TanDEM-X bistatic products.

Conflicts of Interest

The authors declare no conflicts of interest.

References

  1. Adams, R.E.W. Swamps, canals, and the locations of ancient Maya cities. Antiquity 1980, 54, 10. [Google Scholar] [CrossRef]
  2. Adams, R.E.W.; Brown, W.E.J.; Culbert, P.T. Radar mapping, archaeology and ancient maya land use. Science 1981, 213, 6. [Google Scholar] [CrossRef] [PubMed]
  3. Adams, R.E.W.; Culbert, P.T.; Brown, W.E.J. News and short contributions: Rebuttal to pope and dahlin. J. Field Archaeol. 1990, 17, 4. [Google Scholar] [CrossRef]
  4. Pope, K.O.; Dahlin, B.H. Ancient maya wetland agriculture: New insights from ecological and remote sensing research. J. Field Archaeol. 1989, 16, 19. [Google Scholar]
  5. Elachi, C. Seeing under the sahara: Spaceborne imaging radar. Eng. Sci. 1983, 47, 4–8. [Google Scholar]
  6. McCauley, J.F.; Schaber, G.G.; Breed, C.S.; Grolier, M.J.; Haynes, C.V.; Issawi, B.; Elachi, C.; Blom, R.G. Subsurface valleys and geoarchaeology of the eastern sahara revealed by shuttle radar. Science 1982, 218, 1004–1020. [Google Scholar] [CrossRef] [PubMed]
  7. McCauley, J.F.; Breed, C.S.; Schaber, G.G.; McHugh, P.W.; Issawi, B.; Haynes, C.V.; Grolier, M.J.; Kilani, A.E. Paleodrainages of the Eastern Sahara—The radar rivers revisited (SIR-A/B implications for a mid-tertiary trans—African drainage system). IEEE Trans. Geosci. Remote Sens. 1986, 24, 24. [Google Scholar]
  8. Stewart, C.; Montanaro, R.; Sala, M.; Riccardi, P. Feature extraction in the North Sinai Desert using spaceborne synthetic aperture radar: Potential archaeological applications. Remote Sens. 2016, 8, 825. [Google Scholar] [CrossRef]
  9. Tapete, D.; Cigna, F. Trends and perspectives of space-borne SAR remote sensing for archaeological landscape and cultural heritage applications. J. Archaeol. Sci. 2017, 14, 11. [Google Scholar] [CrossRef]
  10. Chen, F.; Lasaponara, R.; Masini, N. An overview of satellite synthetic aperture radar remote sensing in archaeology: From site detection to monitoring. J. Cult. Herit. 2017, 21, 7. [Google Scholar] [CrossRef]
  11. Lasaponara, R.; Masini, N. Satellite synthetic aperture radar in archaeology and cultural landscape: An overview. Archaeol. Prospect. 2013, 20, 71–78. [Google Scholar] [CrossRef]
  12. Elachi, C.; Granger, J. Spaceborne imaging radars probein depth. IEEE Spectr. 1982, 19, 24–29. [Google Scholar] [CrossRef]
  13. Gaber, A.; Koch, M.; Griesh, M.H.; Sato, M.; El-Baz, F. Near-surface imaging of a buried foundation in the Western Desert, Egypt, using space-borne and ground penetrating radar. J. Archaeol. Sci. 2013, 40, 1946–1955. [Google Scholar] [CrossRef]
  14. Schaber, G.G.; McCauley, J.F.; Breed, C.S.; Olhoeft, G.R. Shuttle imaging radar: Physical controls on signal penetration and subsurface scattering in the Eastern Sahara. IEEE Trans. Geosci. Remote Sens. 1986, 24, 603–623. [Google Scholar] [CrossRef]
  15. Schaber, G.G.; McCauley, J.F.; Breed, C.S. The use of multifrequency and polarimetric SIR-C/X-SAR Data in geologicstudies of Bir Safsaf, Egypt. Remote Sens. Environ. 1997, 59, 337–363. [Google Scholar] [CrossRef]
  16. Stewart, C.; Lasaponara, R.; Schiavon, G. ALOS PALSAR nalysis of the Archaeological Site of Pelusium. Archaeol. Prospect. 2013, 20, 109–116. [Google Scholar] [CrossRef]
  17. Chen, F.; Masini, N.; Liu, J.; You, J.; Lasaponara, R. Multi-frequency satellite radar imaging of cultural heritage: the case studies of the Yumen Frontier Pass and Niya ruins in the Western Regions of the Silk Road Corridor. Int. J. Digit. Earth 2016, 9, 19. [Google Scholar] [CrossRef]
  18. Paillou, P. Mapping paleohydrography in deserts: Contributions from space-borneimaging radar. Water 2017, 9, 194. [Google Scholar] [CrossRef]
  19. Patruno, J.; Dore, N.; Crespi, M.; Pottier, E. Polarimetric multifrequency and multi-incidence SAR sensors analyis for archaeological purposes. Archaeol. Prospect. 2013, 20, 89–96. [Google Scholar] [CrossRef]
  20. Linck, R.; Busche, T.; Buckreuss, S.; Fassbinder, J.W.E.; Seren, S. Possibilities of archaeological prospection by high-resolution X-band Satellite Radar—A case study from Syria. Archaeol. Prospect. 2013, 20, 97–108. [Google Scholar] [CrossRef]
  21. Linck, R.; Busche, T.; Buckreuss, S. Possibilities of TerraSAR-X Data for the Prospection of Archaeological Sites by SAR. In Proceedings of the 5th TerraSAR-X/4th TanDEM-X Science Team Meeting, Oberpfaffenhofen, Germany, 10–14 June 2013; German Aerospace Centre (DLR): Oberpfaffenhofen, Germany, 2013; p. 4. [Google Scholar]
  22. Tapete, D. Remote sensing and geosciences for archaeology. Geosciences 2018, 8, 41. [Google Scholar] [CrossRef]
  23. Kwarteng, A.Y.; Dorvlo, A.S.; Kumar, G.T.V. Analysis of a 27-year rainfall data (1977–2003) in the Sultanate of Oman. Inter. J. Climatol. 2009, 29, 13. [Google Scholar] [CrossRef]
  24. Yule, P.A.; Gernez, G. Early Iron Age Metal-Working Workshop in the Empty Quarter, al-Zahira Province, Sultanate of Oman; Habelt-Verlag: Bonn, Germany, 2018. [Google Scholar]
  25. Genchi, F.; Giardino, C. The field work. In Early Iron Age Metal-Working Workshop in the Empty Quarter, al-Zahira Province, Sultanate of Oman; Yule, P.A., Gernez, G., Eds.; Habelt-Verlag: Bonn, Germany, 2018; pp. 11–31. [Google Scholar]
  26. Harrower, M.J.; Dumitru, I.A.; Wiig, F.; David-Cuny, H.; Taylor, S.P.; Sivitskis, A.J.; Simon, K.M.; Sturm, J.O.; Mazzariello, J.C.; Lehner, J.W.; et al. Archaeological Water Histories of Oman (ArWHO) Project; Field Report for the Ministry of Heritage and Culture; Sultanate of Oman: Muscat, Oman, 2017; p. 151. [Google Scholar]
  27. Sonnemann, T.F. Spatial configurations of water management at an early angkorian capital—combining GPR and TerraSAR-X data complement an archaeological map. Archaeol. Prospect. 2015, 22, 11. [Google Scholar] [CrossRef]
  28. Weeks, L.; Cable, C.; Franke, K.; Newton, C.; Karacic, S.; Roberts, J.; Stepanov, I.; David-Cuny, H.; Price, D.; Bukhash, R.M.; et al. Recent archaeological research at Saruq al-Hadid, Dubai, UAE. Arab. Archaeol. Epigr. 2017, 28, 30. [Google Scholar] [CrossRef]
  29. ESA. SNAP_ESA Sentinel Application Platform Help; Eurpoean Space Agency: Paris, France, 2018. [Google Scholar]
  30. Institute, R.S.T. TanDEM-X Payload Ground Segment: CoSSC Generation and Interferometric Considerations; German Aerospace Centre (DLR): Cologne, German, 2012; p. 31. [Google Scholar]
  31. Farr, T.G.; Rosen, P.A.; Caro, E.; Crippen, R.; Duren, R.; Hensley, S.; Kobrick, M.; Paller, M.; Rodriguez, E.; Roth, L.E.; et al. The shuttle radar topography mission. Rev. Geophys. 2007, 45, 33. [Google Scholar] [CrossRef]
  32. Haralick, R.M.; Shanmugam, K.; Its’Hak, D. Textural features for image classification. IEEE Trans. Syst. Man Cybern. 1973, SMC-3, 21. [Google Scholar] [CrossRef]
  33. Digital Globe. Accuracy of WorldView Products; Digital Globe: Westminster, CO, USA, 2016; p. 11. [Google Scholar]
  34. O’Grady, D.; LeBlanc, M.; Gillieson, D. Relationship of local incidence angle with satellite radar backscatter for different surface conditions. Inter. J. Appl. Earth Obs. Geoinf. 2013, 24, 12. [Google Scholar] [CrossRef]
  35. Blom, R.G.; Cripper, R.E.; Elachi, C. Detection of subsurface features in SEASAT radar images of Means Valley, Mojave Desert, California. Geology 1984, 12, 346–349. [Google Scholar] [CrossRef]
  36. Paillou, P.; Grandjean, G.; Baghdadi, N.; Heggy, E.; August-Bernex, T.; Achache, J. Subsurface imaging in South-Central Egypt using low-frequency radar: Bir safsaf revisited. IEEE Trans. Geosci. Remote Sens. 2003, 41, 1672–1684. [Google Scholar] [CrossRef]
  37. Ghoneim, E.; El-Baz, F. The application of radar topographic data to mapping of a mega-paleodrainage in the Eastern Sahara. J. Arid Environ. 2007, 69, 658–675. [Google Scholar] [CrossRef]
  38. Paillou, P.; Schuster, M.; Tooth, S.; Farr, T.; Rosenqvist, A.; Lopez, S.; Malezieux, J.-M. Mapping of a major paleodrainage system in eastern Libya using oribital imaging radar: The Kufrah River. Earth Planetary Sci. Lett. 2009, 277, 327–333. [Google Scholar] [CrossRef]
  39. Robinson, C.A.; El-Baz, F.; Al-Saud, T.S.M.; Jeon, S.B. Use of radar data to delineate paleodrainage leading to the Kufra Oasis in the eastern Sahara. J. Afr. Earth Sci. 2006, 44, 229–240. [Google Scholar] [CrossRef]
  40. Dabbagh, A.E.; Al-Hinai, K.G.; Asif Khan, M. Detection of sand-covered geologic features in the Arabian peninsula using SIR-C/X-SAR data. Remote Sens. Environ. 1997, 59, 375–382. [Google Scholar] [CrossRef]
  41. Tapete, D.; Cigna, F.; Masini, N.; Lasaponara, R. Prospection and monitoring of the archaeological heritage of Nasca, Peru, with ENVISAT ASAR. Archaeol. Prospect. 2013, 20, 15. [Google Scholar] [CrossRef]
  42. Elachi, C.; Roth, L.E.; Schaber, G.G. Spaceborne radar subsurface imaging in hyperarid regions. IEEE Transact. Geosci. Remote Sens. 1984, 22, 383–388. [Google Scholar] [CrossRef]
  43. Gade, M.; Kohlus, J.; Kost, C. SAR imaging of archaeological sites on intertidal flats in the German Wadden Sea. Geosciences 2017, 7, 105. [Google Scholar] [CrossRef]
  44. Tapete, D.; Cigna, F.; Donoghue, D.N.M. Looting marks in space-borne SAR imagery: Measuring rates of archaeological looting in Apamea (Syria) with TerraSAR-X Staring Spotlight. Remote Sens. Environ. 2016, 178, 17. [Google Scholar] [CrossRef]
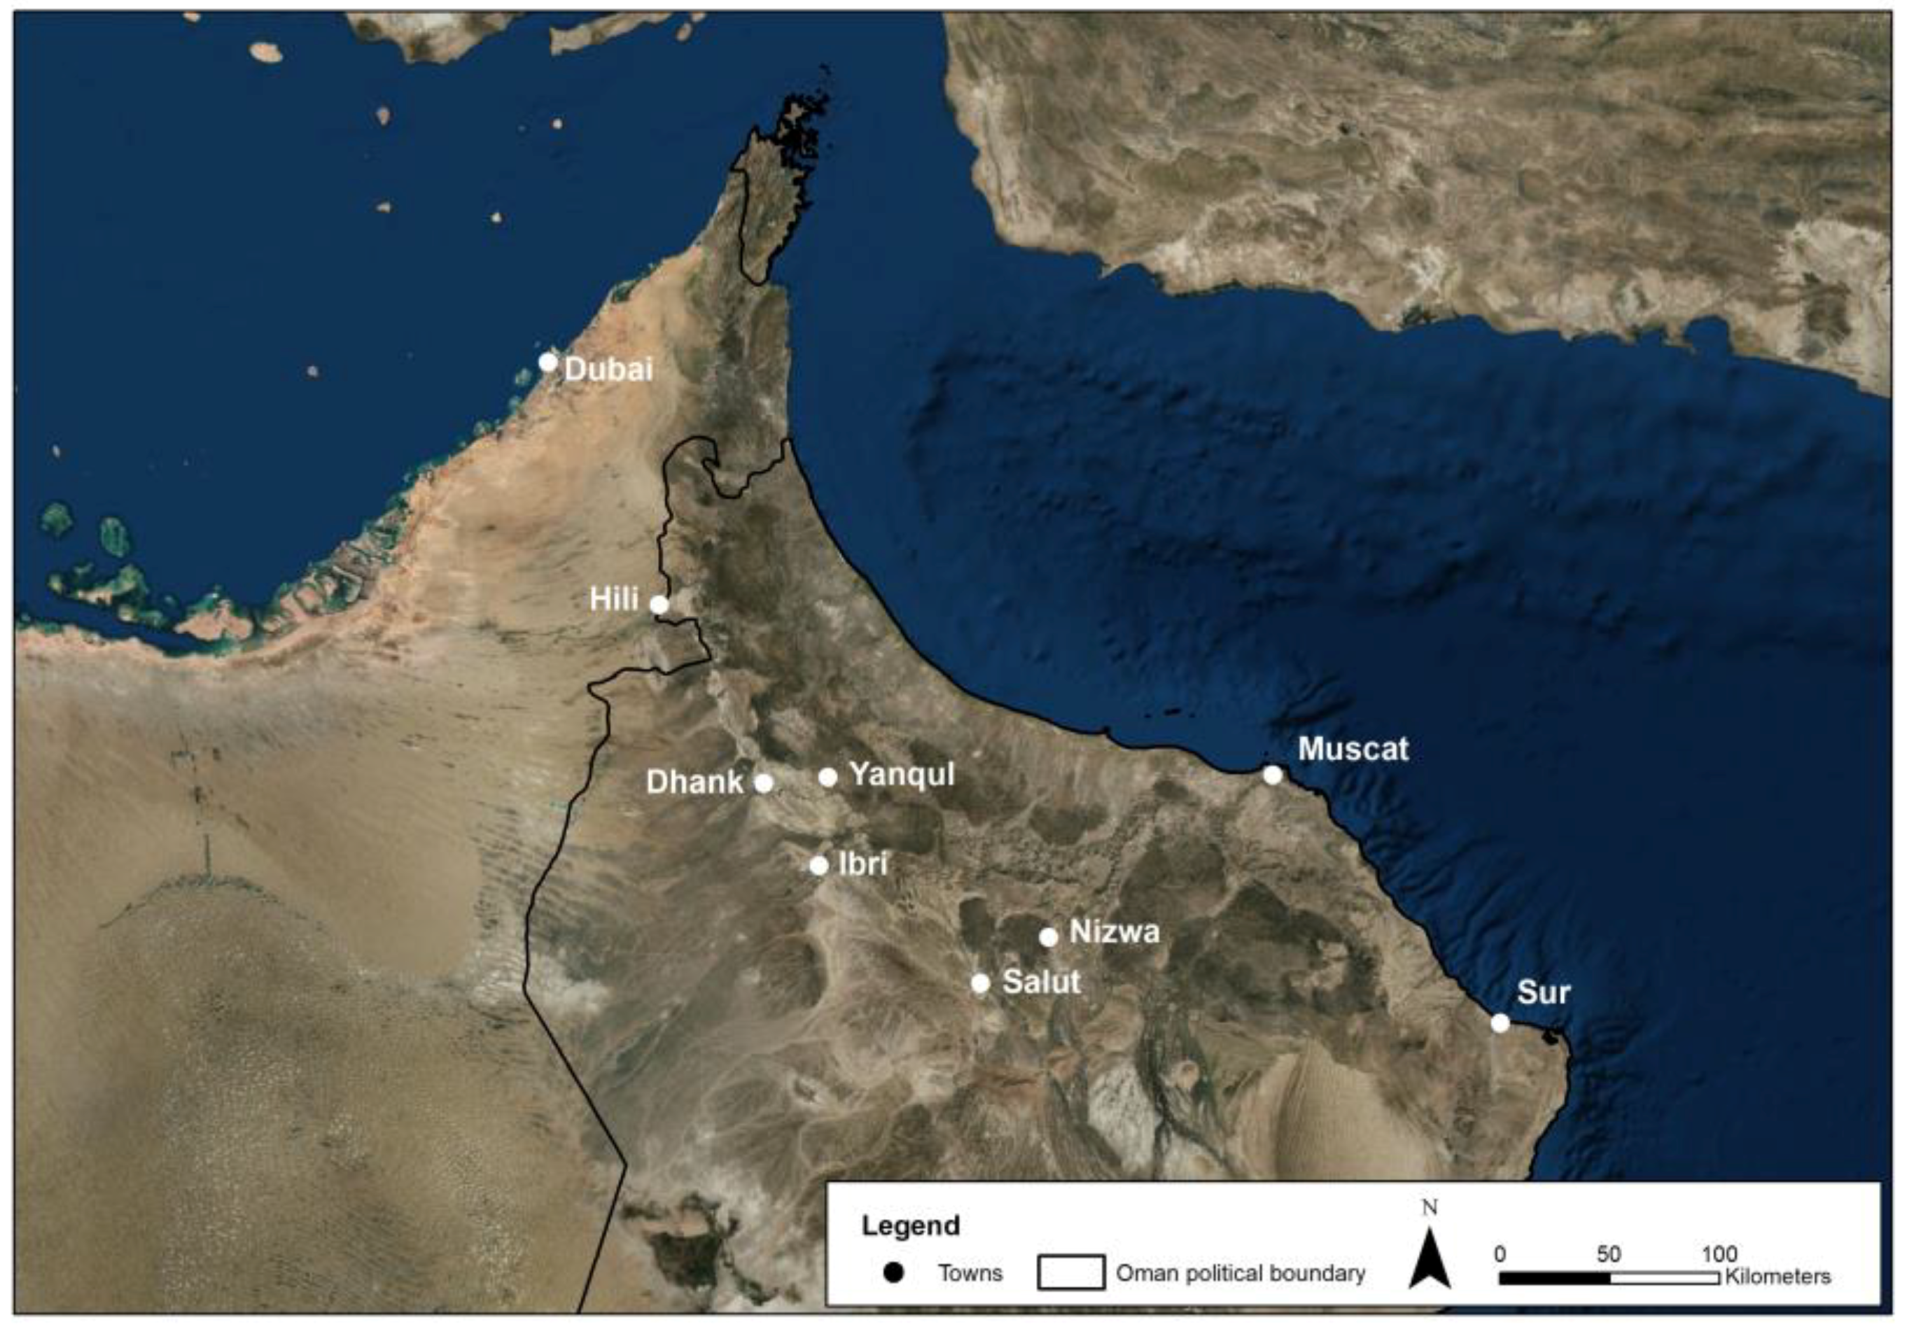
Figure 1. Regional map showing the contemporary town of Dhank. The exact location of ’Uqdat al-Bakrah is not indicated given its sensitivity and need for cultural heritage protection.
Geosciences 08 00334 g001
Figure 2. Flowchart of processing chain.
Geosciences 08 00334 g002
Figure 3. WorldView 3 panchromatic images. (a) No channels are visible within the GPR survey area. (b) Surface channels visible ~800 m to the northeast of the survey area.
Geosciences 08 00334 g003
Figure 4. TanDEM-X bistatic image coregistered stacks (grayscale intensity images processed with Gray Level Co-occurrence Matrix ((GLCM)) variance texture analysis), with black representing low intensity values and white representing high intensity values. (a) Summed stack of 10 VV images. (b) Summed stack of 6 HH images.
Geosciences 08 00334 g004
Figure 5. TanDEM-X bistatic grayscale intensity images (dB) with black representing low intensity values and white representing high intensity values. (a) 23 July 2017 VV image. (b) 25 August 2017 HH image.
Geosciences 08 00334 g005
Figure 6. TanDEM-X bistatic grayscale intensity images (dB) with black representing low intensity values and white representing high intensity values. (a) 13 May 2017 VV image. (b) 15 April 2017 HV image.
Geosciences 08 00334 g006
Figure 7. RADARSAT-2 processed grayscale intensity images (db) (low pass 3 × 3 speckle filter applied) with black representing low intensity values and white representing high intensity values. (a) 30 October 2017 VV image. (b) 2 July 2017 HH image.
Geosciences 08 00334 g007
Figure 8. Ground Penetrating Radar (GPR) time slice color intensity image (with red representing high intensity and white representing low intensity) at 6.2–12.2 ns/44.5–89.1 cm depth with location of excavated trench and radargram profile.
Geosciences 08 00334 g008
Figure 9. GPR radargram showing the subsurface channel in vertical profile.
Geosciences 08 00334 g009
Figure 10. Illustrated profile and plan view photo of trench dug perpendicular to channel with adjacent pit. Base of channel approximately 4–5 m wide in center of trench (deepest part).
Geosciences 08 00334 g010
Table 1. Product Specifications of TanDEM-X bistatic acquisitions (German Aerospace Center (DLR)) used in the analysis. All scenes were acquired in the 300 MHz High Resolution spotlight mode, right looking, with a range and azimuth resolution of 0.6 m × 1.1 m, resulting in a processed pixel spacing of 0.87 m–1.14 m (dependent on the incidence angle).
Image Acquisition Date RangeIncidence Angle at Scene Centre (Degrees)Number of ScenesSensor Mode (Polarization)Orbit (Ascending or Descending)Channel Visible in Image
15 April and 29 May 201738–526HV and VHA and DNo
9 June 25 September and 20 June 2017383HH (× 2), VVAYes
7 May and 14 August 2017395VVDYes
18 May and 25 August 2017395HHDYes
9 June 2017401VVDYes
3 June and 14 June 2017522HH and VVANo
13 May and 20 August 2017535VVDNo
2 May and 9 August 2017 536HHDNo
Table 2. Product Specifications of RADARSAT-2 acquisitions (Canadian Space Agency (CSA)) used in the analysis. All scenes were acquired in the Ultrafine mode, right looking, with a range and azimuth resolution of 1.3 m × 2.1 m, resulting in a processed pixel spacing of 2.1 m–2.95 m (dependent on the incidence angle).
Image Acquisition Date(s)Incidence Angle at Scene Centre (Degrees)Number of ScenesSensor Mode (Polarization)Orbit (Ascending or Descending)Channel Visible in Image
17 July 2017391HHANo
2 July 2017331HHDYes
30 October 2017331VVDYes
14 April and 8 May 2017272HHDNo
26 April 2017271HHANo
16 November 2017271VVDYes
Table 3. Product Specifications of Digital Elevation Model (DEM) product and optical imagery used in the analysis.
SensorAcquisition DateResolution
SRTMFebruary 200030 m
Worldview-322 April 20161.2 m multispectral and 0.3 m panchromatic