Abstract
Through geological time, cyanobacterial picoplankton have impacted the global carbon cycle by sequestrating CO2 and forming authigenic carbonate minerals. Various studies have emphasized the cyanobacterial cell envelopes as nucleation sites for calcium carbonate formation. Little is known, however, about how environmental conditions (e.g., nutrient content) trigger a cell surface and its properties and, consequently, influence biomineralization. Our study aims to understand how phosphorus (P) concentration impacts the properties of cell surfaces and cell–mineral interactions. Changes to the surface properties of marine Synechococcus strains grown under various P conditions were characterized by potentiometric titrations, X-ray photoelectron spectroscopy (XPS), and tip-enhanced Raman spectroscopy (TERS). Biomineralization experiments were performed using cyanobacterial cells, which were grown under different P concentrations and exposed to solutions slightly oversaturated with respect to calcium carbonate. We observed the changes induced by different P conditions in the macromolecular composition of the cyanobacteria cell envelope and its consequences for biomineralization. The modified properties of cell surfaces were linked to carbonate precipitation rates and mineral morphology from biomineralization experiments. Our analysis shows that the increase of phosphoryl groups and surface charge, as well as the relative proportion of polysaccharides and proteins, can impact carbonate precipitation by picocyanobacteria.
1. Introduction
Laboratory experiments have shown that, besides metabolic activity triggering environmental changes leading to changes in the saturation state of mineral formation, cell surfaces—namely, functional groups such as carboxyl, hydroxyl and phosphoryl, and amino groups—may also serve as templates for the nucleation of biominerals (e.g., Reference [1]). To date, much attention has been focused on a biomineralization model that emphasises metabolic activity, or photosynthesis in the case of cyanobacteria, leading to carbonate precipitation (e.g., see Reference [2]). A number of studies have focused on how the cell surface charge changes depending on the pH and ionic strength, as well as the hydrophobic and hydrophilic capacities of cell surfaces (e.g., Reference [3]). The cyanobacterial Synechococcus cell surface contains various proton-active functional groups with a negative charge [4,5], which deprotonate and bind metal ions to form metal–ligand surface complexes [6,7]. Even more intriguing is the observation of carbonates formation on the negatively charged proteinaceous S-layer (surface layer), which surrounds the cells of the freshwater strain Synechococcus GL24 [8]. In contrast, others have reported [9] that the metabolically active cyanobacteria Synechococcus sp. and Planktothrix sp. can develop a positive surface potential in alkaline suspensions, which can deter cell encrustation [9], which has been part of a controversial discussion around the role of cyanobacterial cell surface reactivity in biomineralization.
Uncertainty still remains around the impact of environmental conditions on regulating cell surface properties [10]. However, macronutrients such as phosphorus and nitrogen are crucial in the cyanobacterial life cycle since cyanobacterial growth may be limited by phosphorus (P), and some cyanobacterial strains are even capable of fixing atmospheric nitrogen (N) [11]. Comparing the titration data and infrared spectra for a Synechococcus grown in a wide range of N/P ratios [12] indicated that whereas the nitrogen source is a great determinant of ligand concentration, phosphorus limitation has a greater impact on Synechococcus cellular and extracellular properties than does nitrogen limitation.
Phosphorus can strongly impact the synthesis of cyanobacterial extracellular polymeric substances (EPS) [13] and also appears to induce significant changes in the synthesis of polysaccharides [14,15], as well as membrane lipids [16]. Under P-limiting conditions, many cyanobacterial cells store polyphosphate reserves and increase the production of extracellular phosphatases to obtain phosphate from organic substrates [17]. In turn, the changes in the capsular EPS determine the ability of the cell surface to promote the nucleation of calcium carbonate [3,18,19].
Despite the findings that nutrients and light are driving forces that govern the cyanobacterial surface properties and performance, studies of how these factors affect microbial-driven geochemical processes, especially biomineralization, are very scarce [20]. This is even more astonishing in view of the fact that cyanobacteria are significant primary producers: For example, picocyanobacteria genera Synechococcus and Prochlorococcus provide up to 50% of the primary production in oceans and lakes, dominating the phytoplankton of different areas of the ocean and contributing significantly to the global carbon cycle [6,21,22,23,24,25,26]. Notably, a recently proposed hypothesis stated that given an increase of nutrients exported to coastal areas of oceans and lakes as a result of climate change, a higher abundance of picocyanobacteria is expected [26]. Understanding how Synechococcus cell surface properties adjust to environmental changes is highly relevant for carbon biogeochemistry in the photic zone. Cyanobacterial calcification may reflect a link between phosphorus, calcium, and carbon cycles that can be enhanced during changes in nutrient levels in aquatic systems.
The impact of nutrient conditions on cyanobacteria cell surfaces, especially with regard to P in the frame of experimental setup, as well as the inherent consequences for biomineralization, have been overlooked in most studies. For example, high concentrations of P are commonly applied to cyanobacterial culture media for biomineralization studies, creating artifacts such as phosphate minerals, (e.g., BG-11 has 2.47 mg P/L) [11,27,28]. The concentration of P in these experiments was higher than those measured in marine Synechococcus natural environments, where phosphate concentrations have a range of 3.2 × 10⁻³–10−1 mg P/L [26] and, therefore, conclusions about the role of cell surfaces versus bulk oversaturation conditions with respect to carbonate biomineralization could not be drawn. A commonly used strategy is to modify the culture media used in precipitation experiments in order to avoid calcium–phosphate precipitation (for example, a 10-fold dilution of BG-11 used in experiments with Gloeocapsa sp. [29]. Thus, the biomineralization experiments in this study were performed in solutions without a P addition, allowing us to avoid artifacts.
Although it has been shown that concentrations of P are critical for cell surface properties [10], little is known about the impact of cell surfaces on cyanobacteria calcification. In this study, we explored the impact of P concentrations from 45 to 180 μM on the molecular properties of the cell surface of a marine Synechococcus strain and the consequence on the CaCO3 formation mechanism. A combination of spectroscopy, potentiometric titration, and microscopy techniques were applied to investigate the cell envelope properties. Potentiometric titrations were used to estimate the acid dissociation constants (pKa) and the overall cell surface charge, whereas various spectroscopy methods, such as Fourier transform infrared (FTIR) spectroscopy, tip-enhancement Raman spectroscopy (TERS), and X-ray photoelectron spectroscopy (XPS) were used to assess the changes in macromolecular structures induced on the outer layers of Synechococcus cells by different P exposures. Finally, in vitro biomineralization experiments were performed in the darkness to determine the impact of the molecular properties of picocyanobacteria cells on CaCO3 nucleation. The experimental results elaborated on the interactions between the nutrient concentrations, the molecular properties of picocyanobacteria surface, and the CaCO3 formation.
2. Materials and Methods
2.1. Synechococcus Growth in Different Phosphorus Concentrations
Cultures of the marine Synechococcus sp. PCC8806 (hereafter Syn. PCC8806) [23] were cultured in ASN-III medium. Axenic cultures were inoculated in 150 mL flasks (Falcon Erlenmeyer flasks, five replicates each) containing medium spiked with K2HPO4 × 3H2O, so that the P concentrations were 45, 90, and 180 μM at the beginning of the experiments (Supplementary Information). These p-values were chosen to mimic those found at environmental levels (45 μM), levels in growth media (180 μM), and an intermediate level (90 μM). The cultures were grown at room temperature (25 °C) and under constant light exposure for 45 days. The light irradiance was kept constant at values of 32 μmol photon m−2 s−1 (HOBO Micro Station H21-002 light sensor, Hoskin Scientific, Burlington, ON, Canada). Growth curves for each culture were monitored through optical-density (OD650) measurements at 650 nm (GENESYS 5 UV-Vis, Thermo Fisher Scientific, Rochester, NY, USA), and growth rates were determined by curve-fitting to a Gompertz model [30] (Supplementary Information: Figures S1 and S2, Table S1). Cell pellets were harvested at an early stationary growth phase by centrifugation (15 min, 7303× g, at 20 °C). Afterward, the cells were washed in sterile 0.1 M NaNO3 four times, and cell pellets were resuspended in 0.1 M·NaNO3.
2.2. Cell Envelope Molecular Properties
2.2.1. Potentiometric Titrations and Their Combination with Attenuated Total Reflectance (ATR)-FTIR Spectroscopy
The washed cell suspensions were transferred to a sterilized glass vial and freeze-dried overnight at −50 °C on a Labconco FreeZone 2 (Labconco, Kansas City, MO, USA). The biomass was stored in an excicator before spectroscopy measurements were taken. Potentiometric titrations were conducted under an N2 atmosphere by resuspending freeze-dried cells in a 0.1 M NaCl solution (0.5–0.8 g/L) and allowing them to equilibrate with the solution for 30 min. Prior to the titration, the electrolyte, a 0.1 M NaNO3 solution, was bubbled with N2 for 1 h in order to purge CO2 contributions from the atmosphere. Before the commencement of the titration, the pH of the bacterial suspensions was raised to 9, and then aliquots of HCl were added to titrate the suspension to pH 3 (Supplementary Information, Figure S5). The control titration of the electrolyte was performed before each titration. Whereas dissolved organic matter can be released during the titration of freeze-dried cells, the reverse and forward titration did not show a hysteresis, indicating that the main impact on the titration curve originated from the freeze-dried cells. These experiments were repeated in triplicate using an autotitrator (Titrino plus 877, Metrohm, Herisau, Switzerland). For the jth addition of acid or base titrant during the titration, the charge balance expression could be expressed as
where Caj and Cbj are the concentrations of acid and base for the jth addition of the titrant, and [H+]j and [OH−]j are obtained from measuring the proton concentration at the jth addition. The surface-binding sites are considered as a sum of n monoprotonic ligands [LTi] with acidity constants and total concentration. S is a constant term analogous to the acid-neutralizing capacity or initial protonation state of the cell surfaces.
Titration data were modeled using a linear programming method (LPM) for the quantification of site densities and the determination of ligand functional groups acid-ionization constants (pKa), as previously demonstrated [4,5,10].
Aliquots of the freeze-dried bacterial suspensions were removed during the titration and attenuated total reflectance Fourier transform infrared (ATR-FTIR) spectroscopy was used to determine the identity of the functional groups modeled from the titration. The aliquots were deposited onto a single-reflection ZnSe 45° ATR accessory (Harrick Scientific Products, Inc., Umeå, Sweden) and allowed to dry onto the crystal at 25 °C under an N2 atmosphere. Before the cells were dried onto the ATR crystal, a background spectrum (512 scans) of only the ATR crystal was collected under an N2 atmosphere. Infrared spectra (512 scans, between 1900 and 800 cm−1, spectral resolution of 1 cm−1) were then taken of the dried cells, using a Bruker IFS 66v/S equipped (Umeå, Sweden) with a deuterated triglycine sulphate (DTGS) detector and a water-cooled Globar source. All spectra were baseline-corrected and normalized to the amide II band.
2.2.2. Tip-Enhanced Raman Spectroscopy
Tip-enhanced Raman spectroscopy (TERS) was conducted on an NTEGRA Spectra system (NT-MDT, Moscow, Russia) equipped with an inverted optical microscope (Olympus IX71, Tokyo, Japan) coupled with an atomic force microscope (AFM) NTEGRA Platform and Solar TII spectrometer. TERS was performed using top visual noncontact AFM silicon cantilevers (VIT-P series, NT-MDT, Russia), gold-coated (Polaron E5000C-PS3, Quorum Technologies, Laughton, UK) 2 h before the analysis. Raman spectra were obtained at room temperature and at ambient pressure using a 532 nm wavelength laser with a maximal power of 8.7 mV. The laser power was attenuated with neutral-density filters built into the NTEGRA Spectra system (NT-MDT, Moscow, Russia) to reduce fluorescence and sample damage. The backscattered light was collected through a 100× oil-immersion objective and 0.7 numerical aperture (NA) and redirected to a high-resolution 1600 × 200 pixel CCD camera (cooled at −70 °C). Single TERS spectra were acquired for 0.18 s and accumulated 30 times. The spectral resolution of the spectra was 0.44 cm−1 for 1800 lines/mm grating. All spectra processing was done using NT-MDT SPM software (NT-MDT, Moscow, Russia).
2.2.3. X-ray Photoelectron Spectroscopy (XPS)
Complementary information about the cell surface macromolecules (proteins, lipids, and carbohydrates) was obtained using XPS [31,32]. The XPS analyses were performed with a Thermo Scientific K-Alpha photoelectron spectrometer with monochromatized A1 Kα X-ray radiation. For each sample, a survey analysis and individual peak analysis spectrum was obtained with the pass energy of 150 eV and with a 0.2 eV step. High-resolution spectra of C1s, O1s, and N1s were recorded. These spectra were measured using a pass energy of 25 eV (0.1 eV step). To fix the C1s component due to C–C bonds, 284.8 eV was set as the binding energy scale. The atomic concentration ratios were calculated from peak areas (linear background subtraction) normalized on the basis of the acquisition parameters and of sensitivity factors and transmission functions provided by the manufacturer.
Although XPS does not detect individual compounds, the spectral information obtained corresponds solely to the outermost cell surface (10 nm) [31]. In 1997, Dufrene et al. [29] compared the biochemical analysis and XPS analysis of isolated cell walls of several bacterial strains [31] and documented a strong relationship between the XPS results and the macromolecular composition of the bacterial cell surface. The combined XPS technique and surface speciation approach have successfully been applied to quantify the proportion of the major organic compounds in the diatom cell wall [33]. Thus, in this study, we used a similar approach to estimate the weight fraction of the macromolecular content from the measured XPS concentration ratios of N/C and O/C in a system of equations calibrated with respect to the carbon content of model compounds.
2.3. Calcium Carbonate Precipitation Experiments with Synechococcus Cells
Calcium carbonate (CaCO3) saturated solutions were prepared by mixing 24.8 mL of 3 mM NaHCO3 with 0.2 mL of 400 mM CaCl2 in sterilized conical falcon tubes. All solutions were prepared from analytical-grade reagents (puriss. p.a., ACS reagent, Sigma Aldrich, St.Louis, MO, USA)) dissolved in autoclaved Milli-Q grade water. A total of 18 replicates were set for each condition (i.e., a blank solution without cells addition) and for each Synechococcus biomass grown in different P concentrations. The vials were capped and placed on a rotating shaker on a temperature-controlled incubator set at 25.0 ± 0.01 °C for a period of 24 h under dark conditions. Synechococcus cell biomasses (0.22 ± 0.05 g/L dry weight) were added and placed on a rotating shaker 2 h after the preparation of the mineral-saturated solutions.
In order to monitor the onset of calcite nucleation, sampling was performed after 7 and 24 h preceding the preparation of the solution. For each sampling period, three replicates were taken from each of the conditions tested. The solution pH and total alkalinity were measured immediately after sampling. All measurements were performed in a Metrohm GP 736 Titrino unit interfaced by TITRINET software (Metrohm, Herisau, Switzerland). In addition, 5 mL of solution were collected with sterilized syringes and filtered through a polytetrafluoroethylene (PTFE) membrane filter (pore size 200 nm) and washed rapidly with Milli-Q grade water to remove the excess of salt. The filters were stored in sterile petri dishes at room temperature for scanning electron microscopy (SEM) and energy-dispersive X-ray spectroscopy (EDX) analysis. The filters were sputtered with platinum (Pt) for the SEM observations. The cells suspensions were used to prepare the transmission electron microscopy (TEM) sections (Supplementary Information).
Total dissolved calcium concentrations were determined from filtrate solutions using the benchtop total reflection X-ray fluorescence (TXRF) spectrometer S2 PICOFOX (Bruker, Middlesex County, MA, USA). This instrument is equipped with an air-cooled low-power X-ray tube (Mo target), a multilayer monochromator with 80% reflectivity, and the liquid nitrogen-free XFlash® Silicon Drift Detector (SDD) with an energy resolution of <150 eV (Mn Kα). The quantification of Ca was made by internal standardization (Gallium, 10 mg/L).
The concentration of calcium in the sample was determined as
where CCa is the concentration of calcium, Cis is the concentration of the internal standard (Gallium), Ni is the net signal of the internal standard element, Nis is the net signal of the analyte, Sis is the relative sensitivity of the analyte, and Si is the relative sensitivity of the internal standard element. All instrument parameters were set at the factory, and the coefficient of variability (CV) based on the triplicate analysis of each sample was calculated as <1%, indicating good analytical precision. A multi-element standard (Bernd Kraft GmbH, Duisburg, Germany) was used to determine the method accuracy. All values were found to be within 10% of the actual value, and the detection limit for calcium in samples was determined as approximately 20 μg/L.
3. Results
3.1. Functional Groups at Picocyanobacterial Surfaces
The experimental data showed that the cell surfaces contained at least three functional groups (Table 1), related to carboxyl (pKa = 3–5.5), phosphoryl (pKa = 6–8), and amine and hydroxyl (pKa = 8–10) groups [5] (Table 1). The concentrations of phosphoryl groups increased with P for cultures grown in 90 μM of phosphorus (1.15 ± 0.7 for Syn. PCC8806, 90 μM). On the other hand, the carboxyl concentrations appeared to decrease with increasing P (Table 1). A higher concentration of amine and hydroxyl groups was found to increase with P for Syn. PCC8806, 90 μM.

Table 1.
Functional groups assignment (pKa) and ligands concentrations determined from titration experiments by means of the linear programming method.
A qualitative analysis of the ATR-FTIR spectral data (Figure 1) indicated that several FTIR bands were dependent on the solution pH within the spectral regions related to polysaccharides (900–1200 cm−1) and proteins (1700–1500 cm−1). For Syn. PCC8806, the spectral variation with pH was mostly observed at ~1022 cm−1 (vC–O–C of polysaccharides), ~1150 cm−1 (v(CO) of the C–O–C glycosidic bridge). We also observed the spectral variations at ~1737 and ~1723 cm−1 (C = O) and ~1395 cm−1 (vC–O), which reflected the deprotonation of carboxylic acid groups (Figure 1).
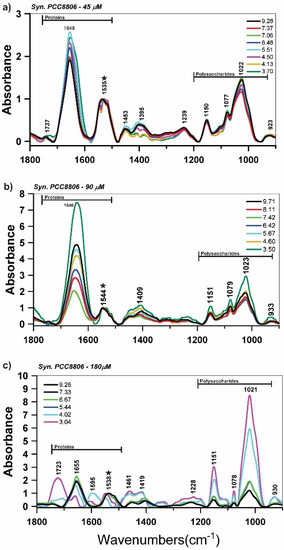
Figure 1.
Attenuated total reflectance Fourier transform infrared (ATR-FTIR) spectroscopy spectra of Synechococcus sp. PCC8806 (Syn. PCC8806) at different pH values in the titration experiments with the freeze-dried cells grown in (a) 45 μM, (b), 90 μM, and (c) 180 μM of P concentrations. The ★ indicates the amide II band used for spectra normalization.
The combination of the titration technique with ATR-FTIR analysis can be used as a tool to monitor and quantify active functional groups in a wide range of pH. Yet, the technique’s limitation is the penetration depth of ATR-FTIR that is similar to the cell thickness, which is maximal at 1–2 μm, and hence intracellular spectral features can mask the surface interaction. Thus, a combination of the titration and ATR-FTIR methods provided promising results that could be interpreted as the changes in surface properties. Furthermore, surface characterization techniques such as XPS and TERS were also applied to accompany the titration and ATR-FTIR experiments.
Principal component analysis of the FTIR spectra at different pH revealed that the polysaccharide bands (900–1200 cm−1) and proteins (1555 and 1563 cm−1) in the spectra of Syn. PCC8806 (90 μM) and PCC8806 (180 μM) largely controlled the sample variance (Supplementary Information, Figure S9). The analysis indicated a high relevance of phosphorus groups in Syn. PCC8806 (180 μM), which may have been related to a presence of P–OH and P–O–P vibrations of phosphate oligomers or glycosidic linkage (≈923 cm−1).
3.2. Surface Spectroscopy and Morphology of Synechococcus Cells
Complementary to the ATR-FTIR analysis with a penetration depth around 1 μm, XPS and TERS techniques were used and represented well-established surface characterization methods with penetration depths at the sample surface around nm or even at the atomic scale [29]. The peaks in the XPS spectra of the core levels associated with the cell surface macromolecules included carbon (285 eV), oxygen (532 eV), and nitrogen (400 eV, Table 2 and Supplementary Information, Figure S6). The atomic elemental composition showed that total carbon on the cell surface was, on average, constant (71.44 ± 0.04)% in terms of mass fraction, but differences were detected for oxygen (O) and nitrogen (N) (Table 2). Nitrogen content was found to be higher with the increase of P in the growth media.
Table 2.
Energy (eV) of the low and high-resolution X-ray photoelectron spectroscopy (XPS) spectral bands, mass fractions (%), and band assignment.
The peaks in the XPS spectra linked to specific functional groups were convoluted to their components, and their molar ratio relative to total carbon (C1s) was estimated in order to define relative proportion (Supplementary Information, Figure S6). For carbon (C1s), the most significant peak was found at the binding energy of ~284.8 eV, which was linked to carbon and hydrogen, C–(C,H) in amino acids or lipids (Table 2). The lowest value for this peak was found to be associated with cells cultured in ~90 μM of P. The other C1s components were found at ~286.3 eV, assigned to carbon singly bound to oxygen or nitrogen (C–(O,N)), including ether, alcohol, amine, and amide; at ~287 eV, assigned to carbon forming a double bond with oxygen C = O or two single bonds O–C–O attributed to carbonyl, carboxyl groups, amide, acetyl, and hemiacetal; and at ~288 eV, associated with carbon forming one double bond and one single bond with oxygen C = O–O, including the carboxyl group, and C = O–OR, including esters [31,32,34]. The other C1s components were found at ~286.3, ~287 eV, and ~288 eV and were found to be higher for cells cultured in 90 μM of P, in particular the peak at ~288 eV (Table 2).
The oxygen peak (O1s) was deconvolved into three components: A peak at 531.1 eV corresponding to oxygen forming a double bond with carbon O = C and oxygen forming a double bond with phosphate P = O or oxygen forming a single bond with phosphate P–O–ring in the esters, amides, and phosphate group; a peak at 532.1 eV attributed to hydroxide, acetal, and hemiacetal; and a peak at 533.5 eV associated with oxygen forming a single bond with hydrogen (HO–C), including the hydroxyl group, or carbon (C–O–C), including acetals and hemiacetals [31,32,34]. We observed a decrease of O1s at 286.28 eV (O1s A) and an increase of O1s at 287.9 eV (O1s B) in the Syn. PCC8860 (90 μM), with respect to the other treatments (Table 2).
We assumed that the surface composition of cell walls could be presented in terms of three classes of basic constituents: Polysaccharides, peptides, and hydrocarbon-like compounds [31]. Hydrocarbon-like compounds refer here to the main features of lipidic compounds. Compounds such as peptidoglycans are considered a combination of basic constituents, peptides plus polysaccharides. This corresponds to C6H10O5 for polysaccharides and to CH2 for hydrocarbon-like compounds. The amino acid composition considered for peptides is that of the major outer membrane protein OE 28.3. The weight fraction ratios of protein (CPr/C), polysaccharide (CPS/C), and hydrocarbon-like compounds (CHC/C) to total carbon were estimated according to the following equations:
[N/C]obs = 0.279(CPr/C),
[O/C]obs = 0.325(CPr/C) + 0.833(CPs/C),
1 = (CPr/C) + (CPs/C) + (CHC/C).
Solving this system of equations provided the proportion of carbon associated with each molecular constituent: (CPs/C), (CPt/C), and (CHC/C). We converted these proportions into weight fractions, using the carbon concentration of each constituent [31]. The lipid composition of the cell envelope was similar between strains, but it tended to decrease with the increase of P in the culture media (Figure 2). This decrease was accompanied by changes in the weight fraction of proteins and polysaccharides. The dominant macromolecules of the Syn. PCC8806 cell envelope were proteins, and their weight fraction tended to increase with P in the media (Figure 2, Table 2). Quantitative variations of the functional groups associated with carboxylic functions C–(O,N)/C (286.3 eV) and O = C, P = O or P–O–P (531.3 eV), and hydroxide (C–OH) or (C–O–C) (532.7 eV) were observed [31,32,34]. The discrepancy between these bands in the different cells was mostly noted in Syn. PCC8806 at P = 90 μM.
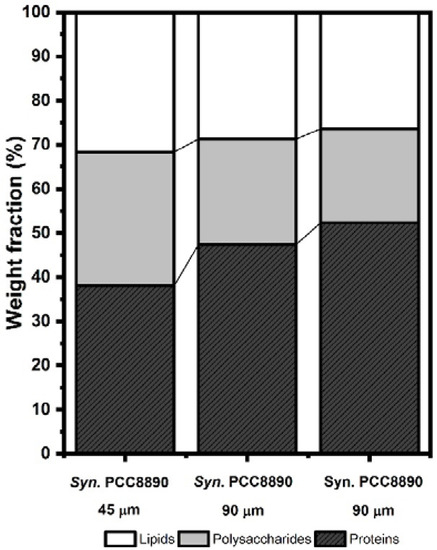
Figure 2.
Weight fractions of the predominant macromolecules in the Synechococcus cell envelope. Calculation made from XPS-measured ratios of N/C and O/C. XPS spectra of Synechococcus strains at the different P concentrations for the C1s, O1s, and N1s regions are shown in Supplementary Information, Figure S6.
TERS (Figure 3) highlighted spectral variations in the wavenumber region 800–1700 cm−1, where most of the vibrational features linked to polysaccharides and proteins can be detected [35]. Raman spectrum of cyanobacteria is typically dominated by bands linked to the molecular vibrations of photosynthetic pigments such as β-Carotene [36], and carotenoids bands at the wavenumbers ~1003, ~1150, and ~1506 cm−1 were observed in all spectra. TERS on the cell surface also revealed a broad band in the region 1000–1125 cm−1 for higher P concentrations, and bands at ~1300 cm−1 and ~1415 cm−1 indicating the presence of glycosidic ring breathing modes and carboxylate stretching vibration modes for higher P concentrations [35,37,38]. The differences in P concentrations were reflected in the TERS spectra: The peaks at 1061 and 1081 cm−1 for carotenoids C–H bending and carbohydrate C–O–H bending were more representative for higher P concentrations (Table 3). In contrast, a peak at 1413 cm−1 for P = O and a peak at 1210 cm−1 for amide III C–H vibrations were more intensive at high P compared to low P concentrations.
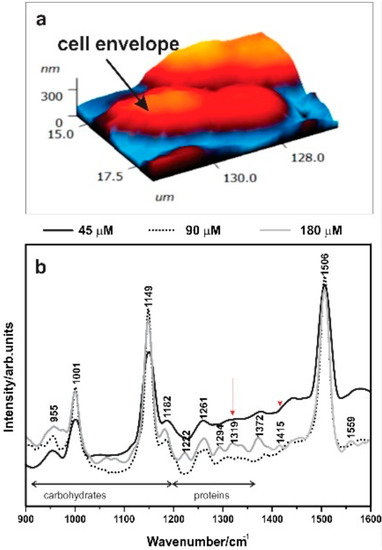
Figure 3.
(a) Atomic force microscopy (AFM) of Synechococcus cells. (b) Tip-enhanced Raman spectroscopy (TERS) spectra of Syn. PCC8806 grown under different P.
Table 3.
Raman wavenumbers (cm−1) and band vibrational assignments of TERS analysis of Syn. PCC8806 for three P treatments: 45 μM, 90 μM, and 180 μM.
Statistically significant differences in the thicknesses of the cell envelope of the Synechococcus cells were detected between cells exposed to different P (ANOVA: Syn. PCC8806 F (2,69) = 3.31, p = 0.04), Supplementary Information, Table S2, Figure S4). The ratio between the carbohydrates’ most intense peak and their amide II peak is indicated as (C/A) and was used to assess the variation of polysaccharides with respect to proteins in cells. Interestingly, the average thickness of the cell envelope decreased with increasing P, and to some extent with the increase of the C/A ratio (Supplementary Information, Figures S3 and S4).
3.3. Variations in CaCO3 Precipitation
The initial pH of the experiments was 8.21 ± 0.04, and this was stable for 7 h (Figure 4a). After the additions of the cell biomass to the solutions, the pH was changed. An increase of 0.2–0.3 pH units was measured in the solutions containing biomass exposed to P concentrations higher than 90 μM, whereas in the experiments with the cells cultured in 45 μM, the pH increase did not exceed 0.1 pH units. After 24 h, all solutions reached pH values that were lower than the initial values. The largest decrease was observed for the abiotic conditions (final pH 7.59 ± 0.08), whereas for solutions containing Synechococcus biomass, the final pH was measured in the range of 7.88–8.02 (Figure 4a). Syn. PCC8806 strains caused larger Ca removal in solutions when compared to the abiotic conditions (Figure 5b). The changes in Ca in the experiments with Syn. PCC8806-90μM were found to be statistically significant (Supplementary Information, Figure S7, Table S3) compared to the abiotic system (p = 0.02).
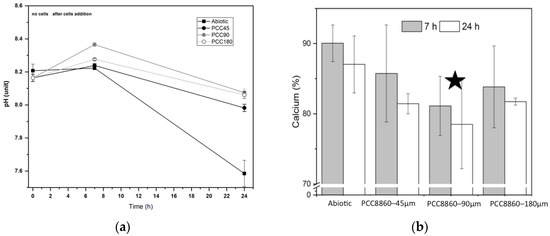
Figure 4.
(a) Dynamics of pH in the abiotic conditions and in the presence of Syn. PCC8806 biomass. Data collected after 7 and 24 h. (b) Measured dissolved calcium (%) of the initial calcium concentration at different stages of the experiment (3 replicates). The initial molar concentration of calcium was 2.52 mM. The changes in Syn. PCC8806-90μm solutions were found to be statistically significant: A star indicates this.
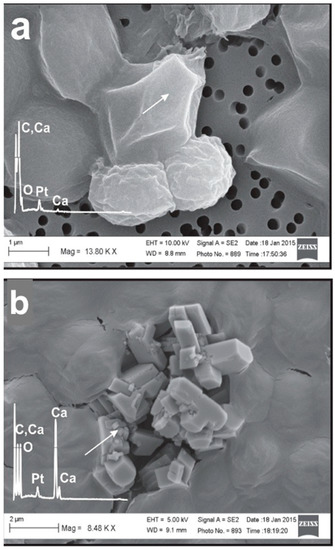
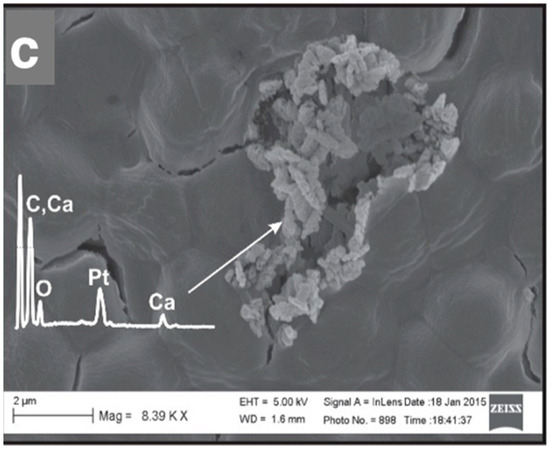
Figure 5.
SEM micrographs of the CaCO3 particles formed in picocyanobacteria biomass Syn. PCC8806 at (a) 45 μM, (b) 90 μM, and (c) 180 μM. The energy-dispersive X-ray spectroscopy (EDX) spectra obtained from the precipitates are presented in all images. The platinum (Pt) peak was due to the sputtering with platinum (see “Materials and Methods”). More images and spectra are presented in Supplementary Information Figures S10 and S11.
SEM micrographs showed that the formation of particles containing calcium, oxygen, and carbon after 24 h was strongly impacted by the presence of Synechococcus cells (Figure 6, Supplementary Information, Figure S11). The morphology, size, and distribution of the mineral particles were linked to the cell surface properties. First, all cells were covered with calcium. EDX analysis of the cell surface revealed that calcium was always present, either integrated in the precipitate particles or adsorbed to the cell surface, as in the case of Syn. PCC8806 cultured in 45 μM of phosphorus. In the cells exposed to higher P values, we observed different morphologies, namely on Syn. PCC8806 cultured at P = 90 μM with well-defined crystals and on Syn. PCC8806 cultured at P = 180 μM with small granular aggregates.
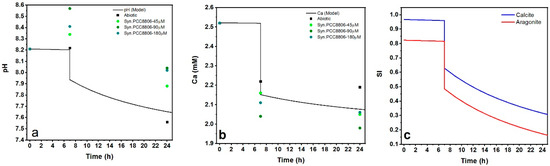
Figure 6.
Dynamics of pH: (a) [Ca2+] and (b,c) saturation indices in the precipitation reactions predicted with PHREEQC Interactive. The dots represent the experimental data used in comparisons to the model output: Abiotic ( ); Syn. PCC8806 biomass (
 45 μM,
  90 μM,
  180 μM).
); Syn. PCC8806 biomass ( 45 μM, 90 μM, 180 μM).
4. Discussion
4.1. Effect of Phosphorus in Growth Media on Surface Molecular Composition of Synechococcus Cells
The cell envelope of cyanobacteria consists of the cell membrane, a peptidoglycan layer, and an outer membrane, with the envelope’s total average thickness rarely exceeding 40 nm [39,40]. The titration experiments showed that the increase of P in the growth media led to a nonlinear rise of phosphoryl (pKa 6–8) groups on cells. The Synechococcus cultured in 90 μM of P showed the highest concentration when compared to the other settings used in this study (Table 1). In general, high concentrations of phosphoryl groups are typically found in the external layers of cyanobacteria envelopes, such as in the cyanobacterial sheath, in the muramic acid in the peptidoglycan, and in the lipopolysaccharide [41]. Amine groups are linked to membrane proteins and the peptide component of peptidoglycan [41]. Thus, the increase of the contribution of phosphoryl groups for the total charge (ΣLT) implies changes in macromolecular composition at the cell envelope level and, consequently, the reactivity of the cells in respect to the adsorption of protons and metals.
This variation was further confirmed by Raman spectroscopy (TERS), where an increase of protein bands in cells grown at higher P concentrations was observed (Figure 3, Table 3). Moreover, the presence of a broad Raman band in the region 1000–1125 cm−1, and bands at ~1300 cm−1 and ~1415 cm−1, indicated the presence of glycosidic ring breathing modes and carboxylate stretching vibration modes often associated with polyanionic molecules common in microbial EPS molecules [35,37,38]. These facts support the interpretation of FTIR titration experiments, where the increase of the C/A ratio with P was associated with vC–O–C of polysaccharides. These results are in agreement with XPS analysis, which showed that in the Syn. PCC8806 cell envelope, the weight fraction of protein increased with P in a growth media (Figure 2). Furthermore, an outcome of the different environmental conditions on the macromolecule variations could be directly observed in the cell envelope thickness. Indeed, the outer membrane of the cells seemed to be surrounded by the S-layer (Figure S3), which consisted of a single (glyco-) protein. Generally, the S-layer moves to the cell surface and gets assembled there [8]. Interestingly, our results suggest that changes in the P of growth media impacted the properties of the S-layer. Even though we did not chemically characterize it, an increase in P was most probably accompanied by changes in the properties of the S-layer, since we observed an elevated amount of protein bands and in the C/A ratio in the TERS and XPS analyses, respectively.
The cell surface reactivity with respect to proton and metal adsorption depends largely on the concentration of proton-active functional groups [10,42]. These concentrations are known to vary between species of cyanobacteria [5,41,43] and depend upon environmental conditions (e.g., pH values, ionic strength, and salinity). Our data confirmed this: For Syn. PCC8806, vC–O–C of polysaccharides and v(CO) of the C–O–C glycosidic bridge were most sensitive to pH changes. The impact of carboxylic function groups was consistent with the results from the titration and FTIR observations previously described [31,32,34].
Indeed, the titration experiments demonstrated that the point of zero charge for the marine strain Syn. PCC8806 occurred at pH = 8.6. Consequently, the cells of Syn. PCC8806 were negatively charged at a pH lower than 8.6, in the range between 6.0 and 8.5. This is in agreement with FTIR and XPS results, suggesting the presence of the amine and hydroxyl (pKa 8–10) groups and the carboxylic groups (pKa 4–5.5). Similar conclusions have been obtained in experiments with axenic Anabaena cultures, where nitrogen assimilation from different sources had a large influence in the ligand distribution [10].
The use of spectral information obtained from the microbial cells is still, however, challenging. The lack of reference data for microbial surface structures significantly limits the interpretation of the spectral data to the identification of functional groups and to the relative peaks variations in the regions assigned to major macromolecules groups such as lipids, proteins, and carbohydrates, without any specificity. Moreover, the bands identification is often performed by comparison with databases on synthetic organic molecules. Consequently, combined approaches are required to provide a detailed reliable characterization of the intact cell envelope.
4.2. Linking CaCO3 Biomineralization with Surface Properties of Cells
Nucleation of CaCO3 on Synechococcus has previously been documented [1,5,23,44]. In 2010, Martinez et al. reported that active cyanobacteria Synechococcus sp. and Planktothrix sp. could develop a positive surface potential with the consequence of deterring cell encrustation (Martinez et al., 2010). In contrast, the cyanobacterial Synechococcus elongatus cell surface was shown to have a negative charge and to be associated with carbonate precipitation [4,5]. Experiments with an inhibition of photosynthesis, especially Photosystem II, showed that when sufficient CO2 was supplied (i.e., cells took up CO2 and not HCO3_), the nucleation of calcite was independent of photosynthesis [45].
In the presented biomineralization experiments, we used freeze-dried cells and performed the experiments under dark conditions, and thus we excluded the role of photosynthesis. The biomineralization experiments were conducted in CaCl2 and NaHCO3 solutions without phosphate, and the experiments lasted 24 h. Consequently, phosphate-related artifacts in the carbonate mineralization experiments were eliminated (Gallagher et al., 2013), and conclusions could be drawn about a possible environmental control over cell surfaces on the biomineralization process. We simulated the typical media conditions used in batch and chemostate cyanobacteria cultures from most carbonate biomineralization laboratory studies [27,46]. In ASN-III media, P concentration is by far much higher than that found in natural environments [11,28]. Similarly to the previous biomineralization experiments, only cells in the stationary stage were investigated, as that can largely reduce the variability of the cell envelope composition observed in the exponential stages [43,47].
Modeling of the pH and Ca2+ dynamics by PHREEQC (Wateq4f database) [48] during the biomineralization experiments was based on the Plummer, Wigley, and Parkhurst settings (Table 4, Reference [49], Supplementary Information). The calculated pH for the abiotic conditions showed good agreement with the experimental data (Figure 6a). After the initial 7 h of the metastable period, the pH dropped simultaneously with a decrease in [Ca2+] and saturation indices of CaCO3 (reaction (4), Supplementary Information 5, Figure 6b,c). This behavior was observed in all experiments, even though the rates of Ca removal in the experiments with Synechococcus cells differed from those in the abiotic conditions.
Table 4.
Summary of the precipitation experiments results.
The initial increase of pH in our experiment was in agreement with the observations made in the laboratory in experiments with Synechococcus cells with blocked photosynthesis [5,45] and demonstrates the crucial role of the ligand properties of cyanobacteria in biomineralization. An increase of pH in the presence of cells could be interpreted as possible enzyme activities that were triggered by changing the environmental conditions, namely adding cells to the precipitation solution. In this study, the presence of phosphoryl groups was associated with the pH changes toward higher values and, consequently, the favorable conditions for calcite supersaturation [1].
At the end of the experiments, Ca dropped more in the presence of the marine cells Syn. PCC8806 than in the abiotic experiments (Table 4). Calcium carbonate precipitation for cells cultured in 90 μM P was significantly distinguishable compared to the abiotic experiments. This could have been related to the different surface properties of Syn. PCC8806 (90 μM). Interestingly, these cells also contained the highest amount of phosphoryl groups at their surfaces. The titration experiments showed that the total concentration of the surface functional groups at Syn. PCC8806 (90 μM) was also three times as much as in other strains (Table 1). This link between biomineralization and surface properties could be interpreted as an enhanced effect of surface reactivity due to the presence of functional groups and most specifically the phosphoryl groups.
Exposing Synechococcus cells to different P conditions led to changes in a proportion of phosphoryl and carboxyl groups as a consequence of variations in the protein and carbohydrate proportions in the cell surfaces (Table 1 and Table 2, Supplementary Information Figures S4–S6). Notably, we observed a co-linked effect on the biomineralization of CaCO3 on cell surfaces. Cell envelope macromolecules, particularly proton-active functional groups, have been shown to trigger metal adsorption onto microbial cells [3,13,42,50]. The carboxyl groups associated with cyanobacterial external structures are often referred to as the main contributors to CaCO3 nucleation on cyanobacteria [51,52]. Furthermore, most of the organo-template calcification occurs in highly carboxylated macromolecules (polysaccharides or proteins) [51,52,53,54]. In our experiment, we also observed an important role of phosphorus groups in cell surfaces as well as N content.
Additives rich in carboxylic and phosphorus functional groups are known to impact the morphology of calcite [55,56]. Little is known, however, about how bacteria control the polymorphism of CaCO3. In previous biomineralization studies with picocyanobacteria, polymorphism was attributed to strain-specific cell envelope properties or to the presence or absence of EPS, which can be attached to cell surfaces or released in a surrounding environment [5,45]. Gallagher et al. (2013) showed that high P concentrations in precipitation solutions could induce differences in the EPS template composition and promote carbonate formation in the presence of sulfate-reducing bacteria (SRB) [28]. So far, no link has been documented, however, between initial P in growth media and the surface properties of cyanobacteria.
Our findings show that the differences detected in the Synechococcus cell envelope grown under different P levels influenced the Ca removal rates, and the morphology of CaCO3 crystals formed. We observed a correlation between Ca removal during the first 7 h and the nitrogen content of the cell surface functional groups obtained from XPS spectra (where penetration depths were a few nm (Supplementary Information, Figure S8)). Additionally, this correlation also existed after 24 h of the precipitation process. Nitrogen content in the cell surfaces reflected mostly a portion of amine and amide functional groups. During the nucleation and precipitation phases, Ca removal was dependent on an amount of double bonds O = C and P = O and carboxylic acids, esters, amides, and phosphate groups, as well as a portion of single bonds with hydrogen (OH–C) or carbon (C–O–C) confirmed by TERS, supporting a proposed role of phosphorus and carboxylic groups in calcium carbonate nucleation on cyanobacterial cells. This interpretation benefits from the advantage of the combination of XPS and FTIR analysis techniques in the characterization of cell surfaces.
The SEM images show that precipitates, which contained Ca, C, and O, were formed preferentially attached to cells based on our observations (Figure S10). All precipitates we analyzed were attached to the cells, with the EDX spectra of the precipitates confirming the C, O, and Ca chemistries of the precipitates (Supplementary Information, Figure S11). Based on the chemical composition of the precipitating solution, which contained CaCl2 and NaHCHO3, and by using the geochemical modeling program PHREEQC (Figure 7), we assumed that calcium carbonates precipitated in the system. No precipitates were found in the abiotic samples after 24 h, which was possibly due to the low saturation state.
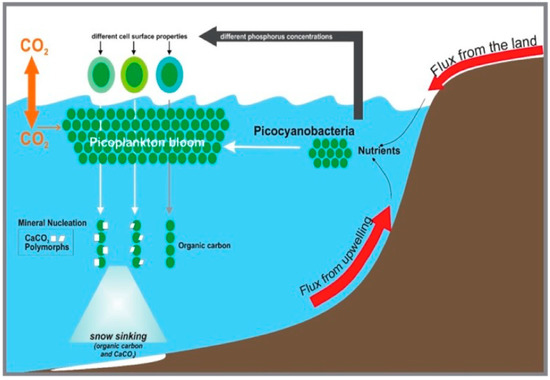
Figure 7.
Conceptual model of the contribution of cyanobacteria envelopes to authigenic calcium carbonate formation in environments spiked with nutrients.
4.3. Implications for Marine Systems
There are many lines of evidence that aquatic systems respond to global changes due to their closed link to the lithosphere through the physical exchange of water and biogeochemical cycling [20]. By the conversion of atmospheric CO2 into biomass and the formation of authigenic carbonate minerals, cyanobacteria contribute to carbon sequestration [27]. In a global warming scenario, with higher surface temperatures and increasing extreme weather events, with pulses of nutrient and sediment resuspension a rise of Synechococcus abundance of up to 14% in the ocean has been predicted [26,57,58]. High levels of phosphate and the geographical distribution of marine Synechococcus have been correlated [26]. Investigations of interactions between abiotic factors, particularly nutrients and microbes in aquatic systems from geochemical perspectives such as cell surface properties and calcification, are still rare [12]. Our study shows that ongoing global changes in abiotic parameters in aquatic ecosystems can affect cell surface reactivity, which drives cell-mediated geochemical changes such as precipitation-dissolution, sorption-desorption reactions, and contaminant transport.
This study highlighted that microbial cell surface properties are responsive to changes in nutrient levels. Thus, changes in phosphate can trigger different surface properties of Synechococcus, which in turn impacts CaCO3 precipitation. Therefore, we can assume that P input into coastal regions will spur changes in Synechococcus envelope reactivity. This can translate into the rearrangement of the envelope molecules and the determination of the proton-active functional groups available, as well as their ion sorption ability (Figure 7) and their biomineralization potential. Since Synechococcus accounts for a substantial fraction of marine primary production, an increase in their worldwide abundance will have an impact on the carbon export to sediments (Figure 7) and, consequently, on the carbon biogeochemical cycle [24,26,57].
5. Conclusions
We investigated the impact of P concentration in growth media on the cell surface properties of marine picocyanobacteria from the genus Synechococcus. It has been recognized that the outer layers of the microbial cell control both ion adsorption and carbonate mineral nucleation. Combining a wide range of experimental techniques (microscopy, spectroscopy, and potentiometric titrations) and biomineralization experiments, we found a direct effect of P concentrations of growth media on the cell envelope reactivity and, subsequently, biomineralization. Shifts in the functional groups concentration and total charge, as well as in the relative proportions of polysaccharides and proteins in the cell envelope of marine cyanobacteria, were identified. The increase of phosphoryl groups in the cells cultured in 90 μM of P was linked to higher levels of Ca removal in biomineralization experiments and has been interpreted as an increase of surface reactivity. The impact of modified cell surfaces on CaCO3 precipitation experiments was revealed by variations in the Ca removal and, to some extent, by mineral polymorphism. Our findings show that ongoing global changes in abiotic parameters in aquatic ecosystems affect cell surface reactivity, which drives geochemical conditions as well as precipitation dissolution, sorption-desorption reactions, and contaminant transport. Our research reveals how the adaptation of picocyanobacteria to environmental changes is relevant to inorganic carbon capture and why the differences in the cell surface properties are crucial for the kinetics and polymorphism of carbonates.
Supplementary Materials
The following are available online at http://www.mdpi.com/2076-3263/8/12/471/s1, Table S1: Predicted carrying capacity value, or the maximum microbial population reached at the stationary phase (a, as OD650 and cells L−1), specific growth rate (k, as d−1) obtained from Gompertz model curve fitting (confidence interval (R2) of 0.99). Table S2: ANOVA analysis of the thickness of cell surfaces under different P conditions. Table S3: ANOVA analysis of the Ca variation in precipitation experiments. Figure S1: Calibration curves of Synechococcus sp. optical densities to cell enumeration by image-analyzed epifluorescence microscope. Figure S2: Growth curves of Syn. PCC8806 under constant light. Each data point was obtained from the average of five replicates. Figure S3: Example of the transmission electron microscopy (TEM) micrographs of single cells, the single used for thickness measurements. The red arrows indicate the cell membrane structure in the zoomed areas. Figure S4: Variation of (a) the growth-rate constant (d-1), (b) the C/A ratio, and (c) the average thickness of Syn. PCC8806 under different P concentrations. Figure S5: The results of the potentiometric titrations. The circles plots represent the average of three potentiometric titrations for each strain and P condition. Fitted charge excess (see Equation (1) in the main text) obtained through LPM is represented by lines (dashed and continuous) with the same color as the corresponding P conditions. Figure S6: High resolution (0.1 eV step-size) XPS spectra of Synechococcus PCC8806 deconvoluted to C1s, O1s, and N1s peaks to determine their chemistry. Figure S7: (a) Dynamics of pH in abiotic conditions (control) and in the presence of Syn. PCC8806 biomasses. Data collected after 7 and 24 h. (b–d) Dynamics of dissolved calcium at different stages of the experiment. The initial Ca concentration was 2.52 mM. Figure S8: Ca removal rates and N content of cell surface (a) and surface functional groups (b). Figure S9: Principal components (PC1 vs. PC2) score plots (a) and loading plots (b) of the FTIR spectra of Syn. PCC8806 obtained at different pH (indicated in the figure). Figure S10: SEM micrographs of the precipitates (a–c) formed in the presence of cells of Syn. PCC8806 cultured at 90 μM P. Figure S11: The SEM images and respective EDX spectra obtained from the precipitates in the biomineralization experiments: (a,b) With PCC8806 (40 μM), (c,d) with Syn. PCC8806 (90 μM), (e,f) with Syn. PCC8806 (180 μM).
Author Contributions
M.D. and C.P. contributed to the concept of this manuscript and performed the experiments on the culture growth, FTIR, TERS, SEM, and biomineralization experiments. J.P.L.K. and P.P. performed titration experiments combined with FTIR. All authors contributed to writing, review, and editing. M.D. and C.P. contributed to the first draft. M.D. was responsible for funding acquisition.
Funding
This research was funded by the National Sciences and Engineering Research Council of Canada (Discovery grant) and the Canada Foundation for Innovation and Ontario Research (Leaders Opportunity Fund, grant number 22404) to M.D.
Acknowledgments
We acknowledge the support of the National Sciences and Engineering Research Council of Canada (Discovery grant) and the Canada Foundation for Innovation and Ontario Research (Leaders Opportunity Fund, grant number 22404) to M.D. We would like to thank Bob Temkin for his support with the TEM investigations, Joerg Bollmann for the help with the SEM studies, Tony Adamo from the University of Toronto Scarborough Traces Lab for his support with the PicoFox chemical analysis, and Rana Sodhi from the Surface Centre at the University of Toronto for his help with the XPS data acquisition and analysis. The authors would like to thank AnQi Liang for her help in the cell number calculation, and the students in the MD groups, Rebecca Paul, Muhammad Adeel Khan, and Ruslan Palin, for their help in the laboratory. The potentiometric titrations and some FTIR experiments were conducted at the Vibrational Spectroscopy Core Facility at the Chemical Biological Centre (KBC) and the Department of Chemistry at Umeå University. The authors acknowledge the editorial suggestions by Jennifer Krissilas. We highly appreciate the efforts and time of two anonymous reviewers, whose comments and suggestions helped us to improve the manuscript.
Conflicts of Interest
The authors declare no conflicts of interest.
References
- Obst, M.; Wehrli, B.; Dittrich, M. CaCO3 nucleation by cyanobacteria: Laboratory evidence for a passive, surface-induced mechanism. Geobiology 2009, 7, 324–347. [Google Scholar] [CrossRef] [PubMed]
- Riding, R. Cyanobacterial calcification, carbon dioxide concentrating mechanisms, and Proterozoic–Cambrian changes in atmospheric composition. Geobiology 2006, 4, 299–316. [Google Scholar] [CrossRef]
- Pokrovsky, O.S.; Martinez, R.E.; Golubev, S.V.; Kompantseva, E.I.; Shirokova, L.S. Adsorption of metals and protons on Gloeocapsa sp. cyanobacteria: A surface speciation approach. Appl. Geochem. 2008, 23, 2574–2588. [Google Scholar] [CrossRef]
- Dittrich, M.; Sibler, S. Calcium carbonate precipitation by cyanobacterial polysaccharides. Geol. Soc. Lond. Spec. Publ. 2010, 336, 51–63. [Google Scholar] [CrossRef]
- Liang, A.; Paulo, C.; Zhu, Y.; Dittrich, M. CaCO3 biomineralization on cyanobacterial surfaces: Insights from experiments with three Synechococcus strains. Colloids Surf. B Biointerfaces 2013, 111, 600–608. [Google Scholar] [CrossRef] [PubMed]
- Baptista, M.S.; Vasconcelos, M.T. Cyanobacteria metal interactions: Requirements, toxicity, and ecological implications. Crit. Rev. Microbiol. 2006, 32, 127–137. [Google Scholar] [CrossRef] [PubMed]
- Jiang, W.; Saxena, A.; Song, B.; Ward, B.B.; Beveridge, T.J.; Myneni, S.C. Elucidation of functional groups on gram-positive and gram-negative bacterial surfaces using infrared spectroscopy. Langmuir 2004, 20, 11433–11442. [Google Scholar] [CrossRef]
- Schultze-Lam, S.; Beveridge, T.J. Physicochemical characteristics of the mineral-forming S-layer from the cyanobacterium Synechococcus strain GL24. Can. J. Microbiol. 1994, 40, 216–223. [Google Scholar] [CrossRef]
- Martinez, R.E.; Gardés, E.; Pokrovsky, O.S.; Schott, J.; Oelkers, E.H. Do photosynthetic bacteria have a protective mechanism against carbonate precipitation at their surfaces? Geochim. Cosmochim. Acta 2010, 74, 1329–1337. [Google Scholar] [CrossRef]
- Lalonde, S.V.; Smith, D.S.; Owttrim, G.W.; Konhauser, K.O. Acid–base properties of cyanobacterial surfaces I: Influences of growth phase and nitrogen metabolism on cell surface reactivity. Geochim. Cosmochim. Acta 2008, 72, 1257–1268. [Google Scholar] [CrossRef]
- Ernst, A.; Deicher, M.; Herman, P.M.J.; Wollenzien, U.I.A. Nitrate and Phosphate Affect Cultivability of Cyanobacteria from Environments with Low Nutrient Levels. Appl. Environ. Microbiol. 2005, 71, 3379–3383. [Google Scholar] [CrossRef] [PubMed]
- Liu, Y.; Alessi, D.S.; Owttrim, G.W.; Petrash, D.A.; Mloszewska, A.M.; Lalonde, S.V.; Martinez, R.E.; Zhou, Q.; Konhauser, K.O. Cell surface reactivity of Synechococcus sp. PCC 7002: Implications for metal sorption from seawater. Geochim. Cosmochim. Acta 2015, 169, 30–44. [Google Scholar] [CrossRef]
- Pereira, S.; Zille, A.; Micheletti, E.; Moradas-Ferreira, P.; De Philippis, R.; Tamagnini, P. Complexity of cyanobacterial exopolysaccharides: Composition, structures, inducing factors and putative genes involved in their biosynthesis and assembly. FEMS Microbiol. Rev. 2009, 33, 917–941. [Google Scholar] [CrossRef] [PubMed]
- Li, P.; Harding, S.E.; Liu, Z. Cyanobacterial exopolysaccharides: Their nature and potential biotechnological applications. Biotechnol. Genet. Eng. Rev. 2001, 18, 375–404. [Google Scholar] [CrossRef] [PubMed]
- Stehfest, K.; Toepel, J.; Wilhelm, C. The application of micro-FTIR spectroscopy to analyze nutrient stress-related changes in biomass composition of phytoplankton algae. Plant Physiol. Biochem. 2005, 43, 717–726. [Google Scholar] [CrossRef] [PubMed]
- Van Mooy, B.A.S.; Rocap, G.; Fredricks, H.F.; Evans, C.T.; Devol, A.H. Sulfolipids dramatically decrease phosphorus demand by picocyanobacteria in oligotrophic marine environments. Proc. Natl. Acad. Sci. USA 2006, 103, 8607–8612. [Google Scholar] [CrossRef] [PubMed]
- Prieto, B.; Pardo, M.A.; Garbisu, C.; Llama, M.J.; Serra, J.L. Phosphate uptake by phosphorus-starved cells of the cyanobacterium Phormidium laminosum. World J. Microbiol. Biotechnol. 1997, 13, 699–705. [Google Scholar] [CrossRef]
- Dupraz, C.; Reid, R.P.; Braissant, O.; Decho, A.W.; Norman, R.S.; Visscher, P.T. Processes of carbonate precipitation in modern microbial mats. Earth-Sci. Rev. 2009, 96, 141–162. [Google Scholar] [CrossRef]
- Kawaguchi, T.; Decho, A.W. A laboratory investigation of cyanobacterial extracellular polymericsecretions (EPS) in influencing CaCO3 polymorphism. J. Cryst. Growth 2002, 240, 230–235. [Google Scholar] [CrossRef]
- Cabrerizo, M.J.; Medina-Sánchez, J.M.; Dorado-Garciá, I.; Villar-Argaiz, M.; Carrillo, P. Rising nutrient-pulse frequency and high UVR strengthen microbial interactions. Sci. Rep. 2017, 7, 43615. [Google Scholar] [CrossRef]
- Zhao, Y.; Zhao, L.; Zhang, W.; Sun, J.; Huang, L.; Li, J.; Zhai, H.; Liu, S.; Xiao, T. Variations of picoplankton abundances during blooms in the East China Sea. Deep Sea Res. Part II Top. Stud. Oceanogr. 2016, 124, 100–108. [Google Scholar] [CrossRef]
- Ivanikova, N.V.; Popels, L.C.; McKay, R.M.L.; Bullerjahn, G.S. Lake Superior Supports Novel Clusters of Cyanobacterial Picoplankton. Appl. Environ. Microbiol. 2007, 73, 4055–4065. [Google Scholar] [CrossRef] [PubMed]
- Lee, B.D.; Apel, W.A.; Walton, M.R. Calcium carbonate formation by Synechococcus sp. strain PCC 8806 and Synechococcus sp. strain PCC 8807. Bioresour. Technol. 2006, 97, 2427–2434. [Google Scholar] [CrossRef]
- Jiao, N.; Robinson, C.; Azam, F.; Thomas, H.; Baltar, F.; Dang, H.; Hardman-Mountford, N.J.; Johnson, M.; Kirchman, D.L.; Koch, B.P.; et al. Mechanisms of microbial carbon sequestration in the ocean—future research directions. Biogeosciences 2014, 11, 5285–5306. [Google Scholar] [CrossRef]
- Worden, A.Z.; Follows, M.J.; Giovannoni, S.J.; Wilken, S.; Zimmerman, A.E.; Keeling, P.J. Rethinking the marine carbon cycle: Factoring in the multifarious lifestyles of microbes. Science 2015, 347, 1257594. [Google Scholar] [CrossRef]
- Flombaum, P.; Gallegos, J.L.; Gordillo, R.A.; Rincón, J.; Zabala, L.L.; Jiao, N.; Karl, D.M.; Li, W.K.W.; Lomas, M.W.; Veneziano, D.; et al. Present and future global distributions of the marine Cyanobacteria Prochlorococcus and Synechococcus. Proc. Natl. Acad. Sci. USA 2013, 110, 9824–9829. [Google Scholar] [CrossRef] [PubMed]
- Kamennaya, N.; Ajo-Franklin, C.; Northen, T.; Jansson, C. Cyanobacteria as Biocatalysts for Carbonate Mineralization. Minerals 2012, 2, 338–364. [Google Scholar] [CrossRef]
- Gallagher, K.L.; Braissant, O.; Kading, T.J.; Dupraz, C.; Visscher, P.T. Phosphate-Related Artifacts In Carbonate Mineralization Experiments. J. Sediment. Res. 2013, 83, 37–49. [Google Scholar] [CrossRef]
- Bundeleva, I.A.; Shirokova, L.S.; Pokrovsky, O.S.; Bénézeth, P.; Ménez, B.; Gérard, E.; Balor, S. Experimental modeling of calcium carbonate precipitation by cyanobacterium Gloeocapsa sp. Chem. Geol. 2014, 374–375, 44–60. [Google Scholar] [CrossRef]
- Çelekli, A.; Yavuzatmaca, M. Predictive modeling of biomass production by Spirulina platensis as function of nitrate and NaCl concentrations. Bioresour. Technol. 2009, 100, 1847–1851. [Google Scholar] [CrossRef]
- Dufrene, Y.F.; van der Wal, A.; Norde, W.; Rouxhet, P.G. X-ray photoelectron spectroscopy analysis of whole cells and isolated cell walls of gram-positive bacteria: Comparison with biochemical analysis. J. Bacteriol. 1997, 179, 1023–1028. [Google Scholar] [CrossRef] [PubMed]
- Ojeda, J.J.; Romero-González, M.E.; Bachmann, R.T.; Edyvean, R.G.J.; Banwart, S.A. Characterization of the Cell Surface and Cell Wall Chemistry of Drinking Water Bacteria by Combining XPS, FTIR Spectroscopy, Modeling, and Potentiometric Titrations. Langmuir 2008, 24, 4032–4040. [Google Scholar] [CrossRef] [PubMed]
- Gélabert, A.; Pokrovsky, O.S.; Schott, J.; Boudou, A.; Feurtet-Mazel, A.; Mielczarski, J.; Mielczarski, E.; Mesmer-Dudons, N.; Spalla, O. Study of diatoms/aqueous solution interface. I. Acid-base equilibria and spectroscopic observation of freshwater and marine species. Geochim. Cosmochim. Acta 2004, 68, 4039–4058. [Google Scholar] [CrossRef]
- Buszewski, B.; Dziubakiewicz, E.; Pomastowski, P.; Hrynkiewicz, K.; Ploszaj-Pyrek, J.; Talik, E.; Kramer, M.; Albert, K. Assignment of functional groups in Gram-positive bacteria. J. Anal. Bioanal. Tech. 2015, 6, 1. [Google Scholar] [CrossRef]
- Ivleva, N.; Wagner, M.; Horn, H.; Niessner, R.; Haisch, C. Towards a nondestructive chemical characterization of biofilm matrix by Raman microscopy. Anal. Bioanal. Chem. 2009, 393, 197–206. [Google Scholar] [CrossRef] [PubMed]
- Vítek, P.; Osterrothová, K.; Jehlička, J. Beta-carotene—A possible biomarker in the Martian evaporitic environment: Raman micro-spectroscopic study. Planet. Space Sci. 2009, 57, 454–459. [Google Scholar] [CrossRef]
- Schmid, T.; Sebesta, A.; Stadler, J.; Opilik, L.; Balabin, R.M.; Zenobi, R. Tip-enhanced Raman spectroscopy and related techniques in studies of biological materials. Proc. SPIE 2010, 7586. [Google Scholar] [CrossRef]
- Schmid, T.; Messmer, A.; Yeo, B.S.; Zhang, W.; Zenobi, R. Towards chemical analysis of nanostructures in biofilms II: Tip-enhanced Raman spectroscopy of alginates. Anal. Bioanal. Chem. 2008, 391, 1907–1916. [Google Scholar] [CrossRef]
- Hoiczyk, E.; Hansel, A. Cyanobacterial Cell Walls: News from an Unusual Prokaryotic Envelope. J. Bacteriol. 2000, 182, 1191–1199. [Google Scholar] [CrossRef]
- Samuel, A.; Petersen, J.; Reese, T. Envelope structure of Synechococcus sp. WH8113, a nonflagellated swimming cyanobacterium. BMC Microbiol. 2001, 1, 4. [Google Scholar] [CrossRef]
- Yee, N.; Benning, L.G.; Phoenix, V.R.; Ferris, F.G. Characterization of metal-cyanobacteria sorption reactions: A combined macroscopic and infrared spectroscopic investigation. Environ. Sci. Technol. 2004, 38, 775–782. [Google Scholar] [CrossRef] [PubMed]
- Tourney, J.; Ngwenya, B.T. The role of bacterial extracellular polymeric substances in geomicrobiology. Chem. Geol. 2014, 386, 115–132. [Google Scholar] [CrossRef]
- Dittrich, M.; Sibler, S. Cell surface groups of two picocyanobacteria strains studied by zeta potential investigations, potentiometric titration, and infrared spectroscopy. J. Colloid Interface Sci. 2005, 286, 487–495. [Google Scholar] [CrossRef] [PubMed]
- Obst, M.; Dynes, J.J.; Lawrence, J.R.; Swerhone, G.D.W.; Benzerara, K.; Karunakaran, C.; Kaznatcheev, K.; Tyliszczak, T.; Hitchcock, A.P. Precipitation of amorphous CaCO3 (aragonite-like) by cyanobacteria: A STXM study of the influence of EPS on the nucleation process. Geochim. Cosmochim. Acta 2009, 73, 4180–4198. [Google Scholar] [CrossRef]
- Kosamu, I.B.M.; Obst, M. The influence of picocyanobacterial photosynthesis on calcite precipitation. Int. J. Environ. Sci. Technol. 2009, 6, 557–562. [Google Scholar] [CrossRef]
- Benzerara, K.; Skouri-Panet, F.; Li, J.; Férard, C.; Gugger, M.; Laurent, T.; Couradeau, E.; Ragon, M.; Cosmidis, J.; Menguy, N.; et al. Intracellular Ca-carbonate biomineralization is widespread in cyanobacteria. Proc. Natl. Acad. Sci. USA 2014, 111, 10933–10938. [Google Scholar] [CrossRef] [PubMed]
- Daughney, C.J.; Fowle, D.A.; Fortin, D. The effect of growth phase on proton and metal adsorption by Bacillus subtilis. Geochim. Cosmochim. Acta 2001, 65, 1025–1035. [Google Scholar] [CrossRef]
- Parkhurst, D.L.; Appelo, C.A.J. Description of Input and Examples for PHREEQC Version 3—A Computer Program for Speciation, Batch-Reaction, One-Dimensional Transport, and Inverse Geochemical Calculations; U.S. Geological Survey Techniques and Methods, Book 6; U.S. Geological Survey: Reston, VA, USA, 2013.
- Appelo, C.A.J.; Postma, D. Carbonates and Carbon Dioxide. In Geochemistry, Groundwater and Pollution, 2nd ed.; Taylor & Francis: Oxfordshire, UK, 2005; pp. 175–240. [Google Scholar]
- Pereira, S.; Micheletti, E.; Zille, A.; Santos, A.; Moradas-Ferreira, P.; Tamagnini, P.; De Philippis, R. Using extracellular polymeric substances (EPS)-producing cyanobacteria for the bioremediation of heavy metals: Do cations compete for the EPS functional groups and also accumulate inside the cell? Microbiology 2011, 157, 451–458. [Google Scholar] [CrossRef]
- Sleytr, U.B.; Schuster, B.; Egelseer, E.-M.; Pum, D. S-layers: Principles and applications. Fems Microbiol. Rev. 2014, 38, 823–864. [Google Scholar] [CrossRef]
- Roberts, J.A.; Kenward, P.A.; Fowle, D.A.; Goldstein, R.H.; González, L.A.; Moore, D.S. Surface chemistry allows for abiotic precipitation of dolomite at low temperature. Proc. Natl. Acad. Sci. USA 2013. [Google Scholar] [CrossRef]
- Giuffre, A.J.; Hamm, L.M.; Han, N.; De Yoreo, J.J.; Dove, P.M. Polysaccharide chemistry regulates kinetics of calcite nucleation through competition of interfacial energies. Proc. Natl. Acad. Sci. USA 2013, 110, 9261–9266. [Google Scholar] [CrossRef] [PubMed]
- Wang, D.; Wallace, A.F.; De Yoreo, J.J.; Dove, P.M. Carboxylated molecules regulate magnesium content of amorphous calcium carbonates during calcification. Proc. Natl. Acad. Sci. USA 2009, 106, 21511–21516. [Google Scholar] [CrossRef] [PubMed]
- Meldrum, F.C.; Colfen, H. Controlling mineral morphologies and structures in biological and synthetic systems. Chem. Rev. 2008, 108, 4332–4432. [Google Scholar] [CrossRef] [PubMed]
- Henderson, G.E.; Murray, B.J.; McGrath, K.M. Controlled variation of calcite morphology using simple carboxylic acids. J. Cryst. Growth 2008, 310, 4190–4198. [Google Scholar] [CrossRef]
- Capone, D.G.; Hutchins, D.A. Microbial biogeochemistry of coastal upwelling regimes in a changing ocean. Nat. Geosci. 2013, 6, 711–717. [Google Scholar] [CrossRef]
- Vincent, W.F.; Laurion, I.; Pienitz, R.; Walter Anthony, K.M. Climate Impacts on Arctic Lake Ecosystems. In Climatic Change and Global Warming of Inland Waters; John Wiley & Sons, Ltd.: Hoboken, NJ, USA, 2012; pp. 27–42. [Google Scholar]
© 2018 by the authors. Licensee MDPI, Basel, Switzerland. This article is an open access article distributed under the terms and conditions of the Creative Commons Attribution (CC BY) license (http://creativecommons.org/licenses/by/4.0/).