Abstract
Pockmarks are ubiquitous seafloor depressions formed by the fluid/gas seepage through marine sediments, with implications for geohazards, benthic ecosystems, and climate-related processes. Despite extensive research, the mechanisms controlling the formation and spatial distribution of pockmarks are not completely understood, owing to the diverse and site-specific geo-environmental conditions. In this study, we provide a first review of over 7500 pockmarks mapped across the Mediterranean and Black seas, showing their relationship with depth range, slope gradient, seafloor lithology, proximity to tectonic faults, and sediment thickness. Our analysis reveals that pockmarks are predominantly located at intermediate water depths (100–700 m), with two main clusters around 100–200 and 500–700 m. They are commonly found on gently sloping seafloor (<4°), often clustering around slope breaks. In detail, two slope-related peaks around 1.5° and 3.5° suggest distinct geological settings for pockmark formation: sediment-rich and low-energy environments versus more dynamic slope domains. Fault proximity plays a critical role, with over 40% of pockmarks occurring within 1 km of mapped faults, indicating that structural discontinuities act as preferential fluid pathways. Pockmarks concentrate in areas with moderate Plio-Quaternary sediment thickness (300–600 m), suggesting an optimal window for overpressure generation and fluid expulsion. A strong lithological control is evident: 74% of pockmarks occur on muddy sand or sand-rich substrates. In terms of ongoing to recent seepage/activity, ~27% of pockmarks show evidence of ongoing fluid seepage (e.g., acoustic gas flares, seismic wipeouts), particularly in regions such as the Black Sea, Aegean, and Central Tyrrhenian, where faulting, salt tectonics, or hydrothermal systems enhance permeability. Conversely, pockmarks in the Western Mediterranean appear to be generally inactive and buried. These findings underscore the influence of tectono-sedimentary architecture on seafloor fluid escape and provide essential insight into methane seepage, slope stability, and benthic habitats. This pedagogic review enhances our understanding of pockmark systems and establishes a foundation for future geohazard assessment, climate studies, and marine resource exploration.
1. Introduction
Fluids within marine sediments are generally less dense than the surrounding solid particles and, as a result, tend to migrate upward toward the seafloor due to buoyant forces [1]. This phenomenon, known as migration, involves the movement of fluids through sedimentary layers and is referred to as fluid flow [2]. Fluid emissions at the seafloor are typically categorized into two main types: cold seeps, characterized by low-temperature discharges (generally below a few tens of degrees Celsius), and hydrothermal vents, which may reach temperatures between 200 °C and 400 °C. This review focuses primarily on pockmarks associated with cold seeps and freshwater environments, where the emitted gases are mostly composed of methane (CH4), and occasionally hydrogen sulfide (H2S), carbon dioxide (CO2), or nitrogen (N2), occurring either as free gas or dissolved in pore waters [3]. Methane (CH4) is generally produced either by microbial degradation of organic matter at low temperatures (microbial gas) [4], or through thermogenic processes involving the breakdown of organic precursors at elevated pressures and temperatures [5,6,7]. CO2 and N2 are commonly associated with hydrocarbon systems in proximity to subduction zones or in the final phases of thermogenic gas generation, and also occur in mixed sedimentary-volcanic basins [8,9,10].
Fluid flow processes are responsible for a variety of seafloor morphologies (Figure 1), including mud volcanoes [11,12,13], brine pools [14,15,16] and pockmarks [16,17,18,19], and they trigger a range of geological, geochemical, and biological processes. These processes can also include the precipitation of methane-derived authigenic carbonates through anaerobic oxidation of methane (AOM), mediated by microbial consortia [1,20,21].
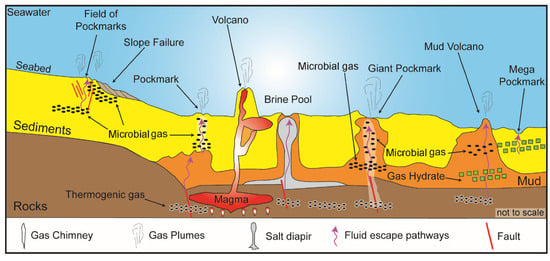
Figure 1.
Simplified cartoon summarizing the typical fluid flow processes, and relative seafloor morphologies (e.g., pockmarks, mud volcanoes, brine pools), acoustic anomalies (both in the water column and in the sub-seabed) and potential sources. Modified from Ma et al. (2021) [22] pockmark; slope failure; gas flare; volcano; brine pool; giant pockmark; mud volcano; gas hydrate.
1.1. Definition and Morphological Characteristics of Pockmarks
Pockmarks are significant geomorphological features directly associated with fluid flow phenomena. The term “pockmark” was for the first time used to mapped seafloor depressions on the Nova Scotian shelf using echo-sounder records [23]. Pockmarks can reach several km in diameter and up to 150 m in internal depth, with circular to elliptical planforms, steep flanks, and flat or cone-shaped bottoms. They show U- or V-shaped cross-sections (Figure 2), with average flank slopes of approximately 9°, ranging from 6° to 18° [24]. Fresh pockmarks are often cone-shaped depressions that tend to become more rounded or flat-bottomed over time due to slumping or progressive infill by hemipelagic sedimentation [20].
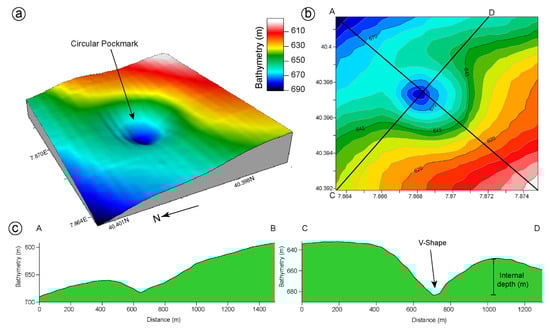
Figure 2.
(a) 3D perspective view of a giant pockmark mapped on the western Sardinian margin. (b) Bathymetric map showing the circular shape of the pockmark. (c) Bathymetric profiles crossing the center of the pockmark. Bathymetric data source: EMODnet Bathymetry (pixel grid resolution 25 m). Note the map is projected in EPSG:32633—WGS 84/UTM zone 33N.
Pockmarks can be classified according to their size. Hovland et al. (2002) [20] defined Unit Pockmarks as small (1–10 m in diameter and up to 0.6 m deep), isolated or clustered depressions that may occur in association with larger pockmarks [25,26] (Table 1). Normal pockmarks range from 10 to 250 m in diameter and up to 45 m in internal depth [27,28]. These features often align in strings or chains extending for km along sedimentary weakness zones, and they are frequently linked to near-vertical faults, fractures, or flexures [20,29,30,31] and in some cases to seafloor channels [25,26,32]. Pockmarks larger than 250 m in diameter are referred to as giant pockmarks [33]. First documented off the California margin [34], these features have since been reported along several continental margins. For instance, the Gulf of Cádiz hosts pockmarks ranging from 125 to 850 m in diameter (commonly 300–500 m) and internal depths from 1 to 16 m (typically 3–12 m). Giant pockmarks can appear randomly or in clusters and are typically associated with subsurface geological structures such as fault systems such as the irregular pockmarks identified in the Palaeogene strata of the Outer Moray Firth Basin, UK North Sea [35]. At the upper extreme, mega-pockmarks have diameter bigger than 1000 m [24]. Recently mega pockmarks have been documented and described by using high-resolution marine data in the northern South China Sea [36] and from the Chatham Rise (New Zealand) [37], where they can reach diameters of up to 3000 m.

Table 1.
Summary of the Morpho-dimensional classification of pockmarks.
Pockmarks are further categorized based on their activity. Active pockmarks are those with observable fluid or gas emissions often in the form of bubbles, whereas inactive or dormant pockmarks lack current outgassing evidence [38,39,40,41]. Distinguishing between active and dormant pockmarks remains a significant challenge, particularly in the absence of direct visual or acoustic evidence of fluid release. The most reliable indicator of ongoing activity is the presence of gas bubbles emanating into the water column (Figure 3).
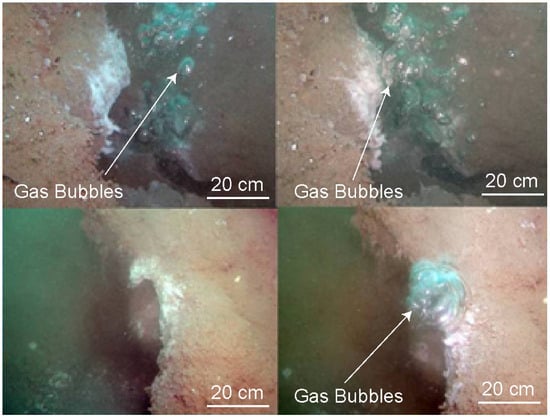
Figure 3.
Gas bubbles (20–30 cm) escaping from fissures in the seabed, partially covered by white bacterial mats, in Katakolo bay (Greece) (from Oceanus-Lab archives, University of Patras, Greece).
Marine geophysical techniques such as high- and very high-resolution seismic reflection and hydroacoustic surveys have proven effective in detecting such emissions from shallow to deep marine environments as acoustic anomalies [1,42,43,44]. Acoustic anomalies in the water column (e.g., flares) are characterized by high-amplitude, vertically or obliquely oriented scattered signals resulting from the acoustic impedance contrast between gas bubbles and surrounding seawater [1,45]. On seismic reflection profiles, these features often appear as dark hyperbolic reflectors (Figure 4) or vertical columns extending from the seafloor sometimes reaching the sea surface [10]. However, similar acoustic signatures may also be caused by fish shoals, suspended sediment clouds, or even anthropogenic debris such as metal or plastic objects [46,47], highlighting the need for complementary ground-truthing and in situ observations.
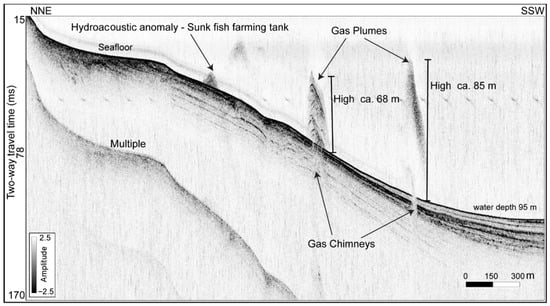
Figure 4.
Sub bottom profile (Chirp system working at 1.5–13 kHz) collected at the Campi Flegrei caldera in the central Tyrrhenian Sea (Naples, Italy), showing hydroacoustic amplitude anomalies in the water column, and gas chimneys as acoustic turbidity zones in the subseafloor (from Earth and Marine Sciences Department, University of Palermo, Italy).
1.2. Potential Factors Driving the Formation of Pockmarks
1.2.1. Geological
Despite many years of study and review of extensive worldwide data, the general mechanisms for the formation of pockmarks and their growth are still not completely understood. However geophysical, morphological, sedimentological, and geochemical data acquired in marine areas with pockmarks provide valuable insights into the factors that control their genesis and development at the seafloor.
In recent decades, several conceptual models have been proposed to explain the formation of pockmarks, which involve either continuous processes (seeps) or sudden and episodic releases and blowout (vents) of fluids [48]. Many theories on the origin of pockmarks have been put forward, ranging from biogenic gas generation and overpressure-driven fluid escape to thermogenic seepage [49,50], groundwater discharge [2], and localized sediment dewatering processes [51].
However, the integrated analysis of high-resolution marine geophysical records with core and borehole samples taken from inside pockmarks, suggests that the pockmarks are formed when fluid (gas or water) escaping through the seafloor lifts the fine sediment into suspension [50,52]. Laboratory experiments, theoretical models, and field studies of both active and fossil pockmarks support the hypothesis that these features form abruptly when pockets of locally overpressured fluids or gas erupt through the seafloor sediments [50,53,54].
Ma et al. (2021) [22] proposed that various combined geological factors can lead to overpressure release and the formation of pockmarks. These include seafloor morphology, sediment type and relative thickness [55], tectonics [56], salt diapirism [57], hydrocarbons and gas hydrates dissociation [58,59] and seismic activity [60]. A study conducted in the South China Sea showed that the mechanisms of pockmark formation are also influenced by exogeneous geological process (e.g., denudation, transportation, sedimentation, bottom currents, and channels) [61,62], endogenous geological process (e.g., tectonics) [63] and occurrence of other fluid flow features (e.g., gas chimneys, mud diapirs, mud volcanoes, and faults providing pathways for gas seepage) [64].
Many studies also suggested a role of the water depth range and the sea-level changes as factors driving the formation of pockmarks [65,66,67]. Relative sea-level changes modify hydrostatic pressure and when the sea level falls (e.g., during the Messinian Salinity Crisis [68,69]), gas volume in fluid reservoir increases, resulting in overpressured pore water and thereby favoring an upward migration of gas-rich fluids [49,70]. It is not known how fast gas exsolution/dissolution and related fluid escape responds to decreases/increases in the hydrostatic pressure during sea-level fall/rise [71]. The Late Quaternary sea-level changes with 100-kyr cyclicity are one of the main driving factors in pockmark formation [49]. This control of 100-kyr cyclicity in pockmarks development is deduced from the observation that pockmarks affect well-identified and discrete stratigraphic units.
Faults and/or fractures have been often interpreted as preferential pathways for fluid migration in a variety of settings [72,73]. On the other hand, faults (including blind faults) are also known to be physical barriers to horizontal fluid flow movement. Examples are known in the siliciclastic sedimentary aquifers as well as in the offshore hydrocarbon reservoirs [74,75]. Fluid flow is a physical phenomenon that usually is related to fault activity since it leads to poorly cemented fault breccias and an increase in fault zone permeability [76,77]. Fault damage zones that in the seismic reflection data appear as acoustic turbidity zones have a permeability depending on the faulted lithology, shear strain, dilatation, and fracture development, and can change as a function of burial depth, fault offset, and mineralization [78,79]. Recently, a number of papers have described how pockmarks are maintained due to authigenic carbonate occurrence [80], and bottom current action [25,81,82].
Salt diapirs facilitate fluid migration along faults and fractures. In the Levant Basin (offshore Israel), fluid escape features occur along ridge crests and flanks above deformed overburden and Messinian evaporite withdrawal zones, indicating structurally and stratigraphically controlled fluid flow [83].
Many studies have reported a relationship between pockmark activity and earthquakes [60,84]. Large ground-shaking event, by earthquakes or sedimentary instabilities, modifying the geotechnical characteristic of the sedimentary layers below the seafloor could cause interstitial gas bubbles to be suddenly expelled into the water column [85]. In the recent literature, earthquakes have been interpreted as trigger both for gas venting and pockmark formation in the Northern California [86], and the Arabian Gulf [87,88].
1.2.2. Alternative Hypothesis
Recent high-resolution multibeam data from the German Bight (North Sea) revealed tens of thousands of shallow seafloor depressions previously interpreted as pockmarks [89]. However, no evidence of methane seepage or gas-related features was found. Instead, the study that these depressions were produced by harbor porpoises (Phocoena phocoena), small, toothed cetaceans that forage on benthic fish by bottom grubbing, called pits and pit-scours. During feeding, porpoises orient their bodies vertically, direct their sonar toward the sediment, and dig into the seabed with their snouts, excavating shallow pits about 0.1–0.2 m deep [89]. These initial feeding pits act as nuclei for further modification by tidal currents and storms, evolving into larger scour structures. Comparable biogenic depressions have also been described elsewhere, such as those formed by gray whales (Eschrichtius robustus) in the Bering Sea during suction feeding on benthic prey [90]. These observations demonstrate that cetaceans can act as active erosional agents on the seafloor, creating morphologies that can mimic classic pockmarks but have a purely biological origin.
1.3. Importance and Scientific Objectives of the Review
Despite decades of regional studies, no comprehensive synthesis has yet been compiled and quantitatively analyzed for all mapped pockmarks across the Mediterranean and Black seas. Until now, published reviews have generally addressed fluid flow phenomena in broad terms or focused on the use of high-resolution seismic data for detecting and characterizing fluid-related features [91]; in contrast, the present review specifically concentrates on pockmarks, the most widespread seafloor morphology associated with fluid flow [92]. This review addresses the current lack of a comprehensive and standardized synthesis of Mediterranean present-day pockmarks (at the seafloor) by systematically compiling and harmonizing published data to identify basin-scale spatial patterns, morphometric trends, and suggesting geological controls, thereby highlighting methodological inconsistencies and under-explored areas for future research.
The geological, ecological and societal relevance of seabed pockmarks makes a focused review of these features for the Mediterranean Sea both timely and necessary. Several lines of argument support why such a review is particularly important in the Mediterranean region, densely studied basin. Pockmarks are relevant for submarine infrastructure planning (e.g., pipelines, cables, offshore wind farms) [27,92], for benthic ecology (with unique communities) [93], and for resource and hazard assessments involving gas systems [6] or fluid-related slope instabilities [94,95].
This study is conceived as a pedagogical review, intended to be a baseline study for researchers or students approaching the study of these features, as well as for those seeking a deeper understanding of the mechanisms governing their formation and evolution as well as their hazard implication. This pedagogical style reinforces the broader accessibility and long-term utility of the work. Furthermore, such a synthesis would bridge the academic and applied domains. By consolidating the available literature, a Mediterranean pockmark review would not only be a scientific reference for specialists in marine geomorphology, but also as an educational and methodological resource for students, early-career researchers, and stakeholders engaged in the Blue Economy [96].
In view of what was discussed above, this review is based on a dataset comprising more than 7500 examples of pockmarks located in various sectors of the Mediterranean Sea and surrounding basins (Table S1 in Supplementary Material). The dataset includes information on geographic distribution, bathymetry, proximity to geological faults, and sedimentary characteristics. The objectives of this study are:
- (i)
- To investigate the spatial distribution of pockmarks in relation to key controlling factors, including:
- Physical environmental parameters (e.g., water depth range, slope gradients, and sediment lithology),
- Geological features and processes (e.g., faulting, sediment thickness, and salt diapirism).
- (ii)
- To highlight the implications of pockmarks in terms of geohazards, influence on benthic ecosystems and their relevance to past and present climate processes.
2. Geological Framework
The geology of the Mediterranean region is a result of the evolution of the Tethys Ocean, which formed in the late Palaeozoic, reached its maximum opening in the Mesozoic, and finally closed in the Cenozoic [97]. The convergence of the Eurasian and African plates played a crucial role in shaping the circum-Mediterranean thrust belts and forming back-arc basins [97]. These tectonic interactions resulted in significant geological complexities, extensive volcanism, and a relatively high level of seismic activity in the area. Remnants of the Tethys Ocean remain in the Ionian Sea and the Eastern Mediterranean [98,99]. Consequently, the diverse seas within the Mediterranean region are characterized by a range of lithospheric structures, including: (I) remnants of Tethyan oceanic domains (Ionian and Libyan Seas), (II) Neogene oceanic crust (Algero-Provençal Basin and Tyrrhenian Sea), (III) thinned continental lithosphere (Strait of Sicily, Alboran Sea, Valencia Trough, Aegean Sea), and (IV) thick continental lithosphere (Adriatic Sea) [100]. In this paper, we briefly review the geology of the Mediterranean Sea by dividing it into three main basins: Western, Central, and Eastern (Figure 5).
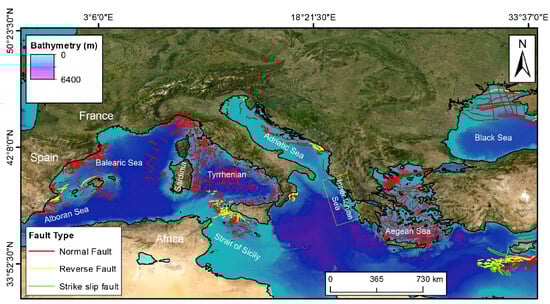
Figure 5.
Bathymetric map showing the main faults used in this paper (data from EMODnet Geology (https://www.emodnet-geology.eu/ (accessed on 24 November 2025)). Note that the map lacks data for the Inner Ionian Sea. Due to the presence of numerous major and active faults, it was difficult to represent this area clearly in the figure. Background bathymetry from EMODnet website (http://www.emodnet-bathymetry.eu (accessed on 24 November 2025)).
Messinian Salinity Crisis was an extraordinary, short-term, and extreme geological event that occurred between 5.97 and 5.33 Ma [101]. During this time, the Mediterranean Sea became disconnected from the Atlantic Ocean due to uplift of the Gibraltar Strait region and underwent partial desiccation due to an excess of evaporation of marine and freshwater inflow [102]. As a result, more than a million cubic km of salts (carbonates, gypsum, halite and K-salts), representing about 6% of the total dissolved oceanic salt, was deposited, locally exceeding 2–3 km in thickness [101].
The Western Mediterranean Sea was formed by the extensional collapse of an orogen after the collision of a lithospheric fragment with the Eurasian margins in the Eocene. Since the Oligocene, this collapse produced the rupture of this orogen into various fragments and their radial dispersion to the east and south [103,104,105]. The main features correspond to the rotation of the Corsica-Sardinian block and the migration of the Kabilas towards Africa with respect to Eurasia, which led to the formation of the Ligurian Sea and the Algero-Balearic Ocean floored basin [106,107]. For the purpose of this summary, the Western Mediterranean has been divided into four geographic sectors: (i) the Gulf of Lion and Northeast Iberian margins characterized by a relevant Plio-Quaternary sedimentation, which contributed to the formation in the Gulf of Lion of the widest continental shelf in the western Mediterranean [108]; (ii) the Southeast Iberia margins corresponding to the prolongation of the Betic structures on the continental margin and later affected by transtensional or extensional structures [109]; (iii) the Balearic Promontory, a structural high whose present-day configuration is due to the clockwise rotation of the Mallorca and Eivissa blocks resulting from the westward migration of the Alboran microplate; and (iv) the Alboran Sea, a semi-enclosed and tectonically active basin in the westernmost part of the Mediterranean Sea and, characterized by a first extensional stage followed by a compression since the Late Tortonian.
The Central Mediterranean Sea is a complex region shaped by a combination of tectonic, sedimentary, and erosional processes over millions of years. This region encompasses a variety of geological features, including basins, ridges, and volcanic structures [110]. The Central Mediterranean is dominated by the Italian Peninsula, whose present-day morphology is dominated by the Alpine and Apennine orogens, and the surrounding seas [111,112]. For the purpose of this summary, the Central Mediterranean Sea has been divided into four main sectors: (i) the back-arc Tyrrhenian Sea, whose opening occurred from NW to SE in the last 7 millions of years [113]; (ii) the Adriatic basin acting as foreland and foredeep of the Apennines and Dinarides mountain belts [114], (iii) the western part of the deep Ionian Sea, representing the remnants of the Meso-Cenozoic Tethys Ocean and (iv) the Strait of Sicily considered to represent an example of intraplate rift, with the superimposition of extensional and contractional phases [115,116].
The Eastern Mediterranean Sea stands as a geological relic of the Neotethys Ocean, shaped by a complex interplay of tectonic processes over millions of years. During the late Permian to early Middle Jurassic epochs, the Neotethys Ocean began its formation through extensive rifting of the Tauride-Anatolian plate and the Eratosthenes continental fragment from Gondwana’s northern margin [117,118]. This rifting activity ceased by the Bajocian, giving way to post-rift thermal subsidence in the Eastern Mediterranean basin and the subsequent development of passive continental margins in the Levant and Egypt [119].
As a result, much of our geological knowledge focuses on post-Miocene events, including the Messinian salinity crisis [120], the Dead Sea Transform Fault System, the evolution of the Nile delta, and the Cyprus Arc [101]. Recent scientific exploration efforts have unveiled the Eastern Mediterranean Sea significant hydrocarbon potential [38,83]. With a sedimentary cover exceeding 10 km in thickness [121], the basin hosts abundant hydrocarbon resources [122]. The discovery of numerous gas fields in the Nile delta of Egypt and offshore areas of Israel and Sinai underscores the basin’s importance as a hydrocarbon province [123]. For this summary, based on the available pockmark information, the eastern Mediterranean Sea is divided into three sectors: (i) the Nile Delta deep-sea fan, representing a thick sedimentary wedge that accumulated riverine sediments since the late Miocene [124], (ii) the Aegean Sea, one of the Mediterranean Cenozoic back arc basins and characterized by active tectonic [125], and (iii) the Black Sea, a semi-enclosed basin formed as the result of back-arc extension, with the development of two basins that coalesced in a single depocenter during their post-rift phase in the Pliocene [126].
3. Data and Methods
3.1. Dataset
The background bathymetry (e.g., multibeam data with a cell size of ~100 m), and geology data (e.g., faults and seafloor sediments) utilized in this study were obtained from the EMODnet data infrastructure. The infrastructure encompasses seven sub-portals, covering bathymetry, geology, physics, chemistry, biology, seafloor habitats, and human activities. The EMODnet Central Portal serves as a unified access point for these services, all of which are freely accessible and open for use (https://emodnet.ec.europa.eu/geoviewer/#!/ (accessed on 24 November 2025)) [127]. Where available, these data were complemented with high-resolution bathymetric data (e.g., multibeam data with a cell size of ~20 m), collected during various oceanographic cruises conducted between 2007 and 2013 as part of the Magic Project (Marine Geohazards along the Italian Coasts). The access to this additional data is provided by the Italian National Civil protection at the following link: https://www.protezionecivile.gov.it/it/approfondimento/progetto-magic-marine-geohazards-along-italian-coasts/ (accessed on 24 November 2025). The final Digital Elevation Model (DEM) was exported as ASCII ESRI files to ArcMap (https://www.esri.com/en-us/home (accessed on 24 November 2025)). Subsequently, the ASCII ESRI files were converted into raster files, forming the basis for generating the primary map and figures presented in this review.
Starting from the public repository of pockmarks published by Spatola et al. (2025) [92] with 7516 valid pockmark records (Figure 6). Each pockmark entry includes up to 31 attributes, although not all fields are fully populated. The most complete and statistically relevant fields include: (i) Geographic location (Latitude, Longitude), (ii) Bathymetry (water depth in m), (iii) Slope of the seafloor (degrees), (iv) Distance from major faults, (v) Sediment thickness (Messinian, Plio-Quaternary, Pre-Messinian), (vi) Pockmark morphology (Mean axis, Internal depth, Shape), (vii) State of activity and fluid type (where available). This above-mentioned information was derived either from the reference articles or extracted from publicly available datasets (as raster, e.g., Sampietro et al. 2023 [128]) using the Extract Values to Points tool in ArcMap 10.8. General geomorphometric parameters (e.g., slope) were extracted from the bathymetric data by using ArcMap 10.8. The distance from two features (e.g., distance from pockmarks and faults) was calculated by using the tool Euclidian distance in ArcMap 10.8 (https://desktop.arcgis.com/en/arcmap/latest/tools/spatial-analyst-toolbox/Euclidean-distance.htm (accessed on 24 November 2025)). A summary table is reported below (Table 2). It is important to note that the sediment thickness data were derived from low-resolution raster datasets [128]. The authors locally calibrated the dataset using available seismic profiles, thereby improving its reliability in selected areas. This data is currently the only available dataset that provides full coverage of the Mediterranean region. Although the limited spatial resolution represents a constraint, it is generally acceptable for regional-scale analyses.
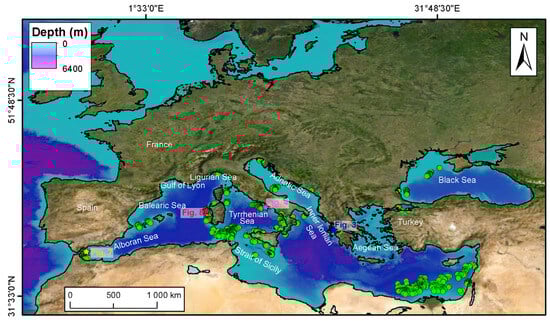
Figure 6.
Bathymetric map showing the distribution of pockmarks (green dot) on the seafloor across the Mediterranean and Black seas. Bathymetric data source: EMODnet Bathymetry. Note. The map is certainly incomplete and may depict areas containing pockmarks as zones without them; this limitation arises from the fact that only studies reporting the precise location of each individual pockmark were used to compile the dataset. The stars indicate the location of Figure 3, Figure 4, Figure 7 and Figure 8.
Table 2.
Summary table of the main information of the pockmarks mapped in the Mediterranean and Black seas.
Descriptive statistics such as mean, median, standard deviation, and variance were computed to summarize morphometric attributes of the pockmarks. Further analytical procedures included the construction of correlation matrices to assess relationships between variables, and visual representations including histograms, scatter plots and boxplots. In particular, the statistical assessment focused on identifying spatial trends and relationships between pockmark occurrence and state of activity with geophysical variables such as bathymetry, slope gradient, seafloor sediment lithology, and proximity to fault systems.
Limitations
We recall that some limitations should be considered regarding the resolution of the bathymetric data and the size of the identified pockmarks. These two parameters are not necessarily dependent on each other. The grid size represents the mapping unit used to partition the bathymetric surface, and each cell was assigned a label indicating the presence or absence of pockmarks. Therefore, a 100 m grid resolution does not introduce a bias toward larger pockmarks, since even the smallest mapped features would still mark their intersected cell as “present.” In fact, this limitation is partly mitigated by the fact that the database was compiled, whenever possible by using morphological information extracted from literature sources where pockmarks had been mapped at much higher resolutions. This ensures that the dataset integrates the most accurate positional data currently available. Overall, the adopted 100 m resolution represents a reasonable compromise between spatial detail and computational efficiency. In this sense, the present review aims to provide a synthesis of all published pockmark cases for which the precise geographic location is known. Nevertheless, future mapping efforts could benefit from the application of downscaling techniques in a pre-processing phase to enhance DEM resolution and produce more detailed maps.
For the fault and seafloor lithology layers, we used data from EMODnet Geology (https://emodnet.ec.europa.eu/geoviewer/ (accessed on 24 November 2025)) as baseline information. Although these public databases provide valuable regional coverage, their relatively low spatial resolution remains a significant limitation. To mitigate this, we integrated additional datasets from scientific sources such as the Modello Strutturale d’Italia [129].
All pockmark information was manually tabulated and independently verified by the authors through consultation of the original literature sources listed in the database (Table S1 in Supplementary Material). Rigorous validation procedures were implemented to ensure data consistency, including the detailed examination of published metadata in public repositories (e.g., EMODnet Bathymetry). Potential outliers or duplicates were identified and removed by analyzing the spatial distribution and morphological characteristics of each feature through georeferencing. Any future updates of the database [17] will undergo the same validation process to ensure reliability and reproducibility.
4. Current State of Knowledge and Case Studies
Pockmarks are probably the most common fluid flow morphology in the Mediterranean region. They are located from its western edge in the back-arc setting of the western Alboran Sea [130] to its eastern edge in the Levantine Basin [38]. They are located from shallow to deep sea areas at both passive and active continental margins such as: (i) active continental margin, e.g., north Sicily [131]; (ii) passive continental margin, e.g., Strait of Sicily [71,131]; (iii) thick sedimentary basin areas, e.g., Nile deep-sea fan [132], (iv) intraslope ridge, e.g., Paola and Palmarola ridges in the Tyrrhenian Sea [33,133]; (v) land-locked inland sea, e.g., Black Sea [44].
4.1. Western Mediterranean Sea
4.1.1. The Gulf of Lion and Northeast Iberian Margins
Fluid emissions in this region span from the shallow prodeltaic environments of major rivers Rhone, Fluvià-Muga, Ter, Besos, Llobregat, Tordera, and Ebro to the deep continental slope. Gas seepage is notably evidenced in continental shelf settings by acoustic wipeouts and acoustically turbid zones that obscure stratified prodelta deposits, suggesting microbial gas derived from organic-rich fluvial sediments [134,135,136]. In the Gulf of Lion prodelta, gas bubbling into the water column has been observed in echosounder data as acoustic plumes, typically located just above sediments showing wipeout and turbidity effects [130]. On the continental slope, more than 180 pockmarks have been identified at water depths between 200 and 500 m, particularly in the interfluve zone between the Boucart and Hérault canyons [108]. These pockmarks are circular in plan-view and V-shaped in cross-section, with diameters ranging from >10 to <200 m and reliefs of a few m. They overlie an anticline structure and show acoustic signatures such as blanking and bright spots indicative of free gas [137]. Seismic profiles further reveal vertically stacked, buried pockmarks beneath the seafloor, suggesting multiple episodes of gas migration associated with Quaternary sea-level fluctuations [49].
Other evidence of fluid escape was recognized at the Cap de Creus canyon head, where gas seepage is indicated by acoustic blanking in near-surface sediments and water column backscatter anomalies manifesting as hyperbolic echoes, possibly due to bubble rise [138]. Further south, on the slope near the Columbretes Islands (Balearic Sea), seismic data shows bright spots, wipeouts, and a mega pockmark with a maximum diameter of ~500 m linked to present-day magmatic activity [139]. On the Ebro continental slope, 3D seismic profiles identify circular and elliptical pockmarks with U-shaped cross-sections, varying from 0.1 to 1 km in diameter and tens of m in internal depth. These features were interpreted to originate from organic-rich Ebro River sediments, with vertical gas migration facilitated by palaeo-canyon incisions that create stratigraphic discontinuities [140].
4.1.2. The Southeast Iberia Margin
The Southeast Iberia Margin is characterized by numerous pockmarks, notably in the Mar Menor continental shelf where circular V-shaped depressions are aligned in NNW-SSE clusters and spatially associated with active faults and volcanic structures [109]. Near the Torrevieja graben, pockmarks on the continental slope at ~500 m water depth range from 400 to 1200 m in diameter and 4–35 m in internal depth. Potential mud volcanoes were also identified, though no mud breccias have been confirmed [141]. The Palomares margin shows many pockmarks both on the shelf and slope domains. On the shelf, distal areas of the Almanzora prodelta host circular and elongated pockmarks (~50 m in diameter, few m in internal depth), some coalescing into linear trains along gully floors and slide scarps. On the slope, the Aguilas High area (770–860 m water depth) features randomly distributed pockmarks up to 90 m wide affecting mass flow deposits.
4.1.3. The Balearic Promontory
Gas-related features are concentrated in the Ibiza Channel and between Ibiza and Mallorca. In the Ibiza Channel, pockmarks with circular plan-view geometries range from 80 to 700 m in diameter and 2–55 m in internal depth [142]. Near the Xàbia seamount, two distinct clusters were recognized: one of large (>500 m) depressions and another of small (~10 m) pockmarks [143]. Southward, consistent 100 m diameter and 15 m relief features appear at ~500 m water depth. Between Ibiza and Mallorca, pockmarks (100–500 m diameter, 10–35 m deep) show diverse morphologies from isolated depressions to linear trails and incipient gullies aligned NW-SE or NE-SW. While the fluid origin remains uncertain, thermogenic sources linked to volcanic bodies and tectonic structures are considered, along with biogenic alternatives [142,143]. In this region, the spatial distribution (alignment) of pockmarks suggests a neotectonics control on fluid migration [142,143].
4.1.4. The Alboran Sea
The Alboran Sea shows widespread pockmarks and mud volcanoes. Over 200 pockmarks have been mapped in the Ceuta Drift (350–900 m water depth), ranging from circular (~100–615 m wide) in the southeast to elliptical (240–1430 m wide) in the northwest near the Strait of Gibraltar [144,145]. These pockmarks display both V- and U-shaped morphologies with internal depths of <1 to 20 m and slopes up to 22°. U-shaped features may reflect sediment infill from slope failures [144]. Additional circular and elongated (affected by the bottom current) pockmarks organized in clusters in the westernmost Alboran Sea (Figure 7). Around Avempace Seamount, circular coalescing pockmarks (~600 m in diameter) are documented [70]. South of the Xauén Bank, ~100 pockmarks (≤400 m in diameter) with circular and elongated shapes occur in plastered drifts along the Moroccan slope [70]. These features are thought to result from shallow gas trapped in coarse contourite sediments, potentially mobilized by internal wave-induced hydraulic pumping [145,146].

Figure 7.
(a) Sub bottom profile crossing a pockmark, location in Figure 7b. (b) Shaded relief map of the Westernmost of Alboran showing the presence of circular and elongated pockmarks organized in cluster. (Data from Instituto de Ciencias del Mar, ICM-CSIC, GMC, Barcelona, Spain). Location in Figure 6.
4.2. Central Mediterranean Sea
4.2.1. Tyrrhenian Sea
In the Northern Tyrrhenian Sea, significant pockmark activity has been documented in association with mass-transport deposits (MTDs), particularly around the pressure ridges and sidewalls of the Pianosa Slump and within contourite drifts along the Corsica Trough [61,82]. Here, pockmarks are often rooted on buried MTDs and turbiditic lobes or elongated along dominant bottom current pathways. Oblique chimneys visible in seismic profiles underscore the influence of hydrodynamic processes on fluid escape features [61,147]. A noteworthy site is located near a shallow mud volcano on the Pianosa-Elba Ridge, approximately 5 km northeast of Scoglio d’Affrica, where a large field of unit pockmarks has been mapped [148,149]. Gas analyses revealed 95 vol% CH4, minor CO2, N2, and traces of He, indicating a predominantly secondary microbial origin. Isotopic compositions of CH4 (δ13C and δ2H) and CO2 also support this, alongside a clear signature of crustal-derived radiogenic helium [150].
In the central Tyrrhenian Sea (200–400 m water depth), pockmarks vary widely in size 85–830 m wide, 90–1000 m long, and 9–147 m deep. These features appear as isolated or aligned depressions, often circular or elliptical, and have been identified across abandoned slope channels and blind faults in the western Sardinian margin (Figure 8), which is tectonically passive and characterized by low sedimentation rates [33,94]. Off Cilento’s coast in the southeastern Tyrrhenian Sea, a cluster of 11 circular pockmarks lies within 12–45 m water depth. They are organized into two groups, larger ones measuring 100–200 m across and 20–25 m deep, and smaller ones of 20–40 m diameter and 3–5 m depth. Their formation is linked to turbulent plumes from submarine freshwater springs [151].

Figure 8.
Three-dimensional perspective view (vertical exaggeration 5×) of a large field of pockmarks in the western Sardinian margin. Bathymetric data source: EMODnet Bathymetry (Pixel grid resolution: 25 m). Location in Figure 6.
On the Paola Ridge (500–1000 m water depth), high-resolution acoustic and seismic data have revealed various seafloor fluid structures: (1) active venting sites with sporadic pockmarks associated with gas flares; (2) low-venting flanks showing mud flows; and (3) inactive seepage features like mud diapirs and extensive pockmark fields [133]. Fluid flow morphologies here were interpreted as hydrothermal vent complexes associated with igneous intrusions, where methane-derived siderite precipitates show δ13C and δ18O enrichment from methanogenesis and deep-sourced CO2 venting [10]. Mud diapirs host “cold seep” pockmarks (20–50 m wide, 0.5–1 m deep) with the presence of authigenic methane-derived carbonates and chemosymbiotic fauna like Lucina sp. and Acharax sp. [152].
On the northwestern Sicilian margin (260–375 m water depth), nearly 30 sub-circular to elliptical pockmarks are grouped into preferential arrays. These pockmarks (~400 m wide, ~20 m deep, 2–4° wall slope) appear isolated, in clusters, or aligned as elongated gullies. Seismic profiles depict concave-upward reflectors beneath these pockmarks, frequently accompanied by acoustic anomalies suggestive of gas presence.
4.2.2. Adriatic Sea
Fluid seepage in the northern Adriatic was first observed offshore Rovinj, Croatia, as persistent sea-surface bubbling [153]. Later studies in the Venice and Trieste Gulfs revealed pervasive gas seepage at ~10 m water depth, indicated by acoustic plumes and methane-derived carbonate concretions [154], with microbial methane sources confirmed via geochemical evidence [154]. However, the detection of pockmarks remains limited due to a lack of high-resolution bathymetry. Southward, from the Po Delta to Pescara, high-resolution sub-bottom data revealed shallow methane anomalies in both High-Stand and Transgressive System Tracts, suggesting fluid genesis independent of flooding or fluvial input [155]. At Bonaccia, offshore Ancona (~80–90 m depth), circular pockmarks (~200 m diameter, 2 m deep) were mapped using multibeam and seismic data. These features are linked with CH4-derived carbonates, chemosymbiotic fauna, and acoustic plumes rising 70 m above the seafloor into the water column. Seismic data shows gas traps in channel beds sealed by fine-grained levee deposits ideal vertical migration pathways [156,157]. The Meso-Adriatic Depression (MAD), a residual basin bounded by the Gallignani-Pelagosa Ridge, shows pockmarks potentially linked to focused fluid flow along tectonic structures. These pockmarks show alignment patterns and may date back to the Upper Pleistocene. Southeast of MAD, near Jabuka Islet, salt diapirism has uplifted Triassic igneous bodies, creating pockmarks, gas chimneys, and mud volcanoes. These features are associated with NW-SE faults developed by halokinetic and compressive tectonics since the Paleogene [158].
4.2.3. Strait of Sicily
The Strait of Sicily features extensive fluid seepage associated both with shallow and deep reservoirs [71,159,160]. Along the northeastern Malta Plateau (140–170 m water depth), over 100 small mud volcanoes and ridges occur and more than 500 pockmarks (~13 m2 area, ~0.6 m depth, max diameter 22 m) have been mapped using side scan sonar. They are clustered mainly at 140–150 m water depth and aligned NW-SE, matching local fault patterns [71]. South of Malta, >1000 circular and elliptical pockmarks (up to 100 m wide, 3 m deep) organized in dense clusters along NW-SE or WSW-ENE trends were identified using high-resolution multibeam and sub-bottom profile data (Figure 9). They are locally characterized by the presence of acoustic anomalies in the subseafloor and in the water column (Figure 9). Water and sediment analyses show high CH4 and CO2 concentrations, authigenic minerals (barite, pyrite), and carbonates, often linked with hydroacoustic anomalies and seismic chimneys beneath the seafloor [56,131]. In the NW Strait of Sicily, the Graham Bank hosts giant pockmarks (25–580 m diameter, 1.3–15 m deep) aligned NW-SE or appearing isolated [161]. These features, V-shaped in section, show upward concave reflectors and vertical hydroacoustic anomalies from gas flares [162]. Multichannel seismic profiles reveal vertical acoustic blanking interpreted as gas chimneys (VIDEPI Project, 2012). Around Linosa Island, a vast pockmark field was recently mapped, further confirming the role of Plio-Pleistocene extensional faults as key fluid migration pathways in the Strait of Sicily [163,164].
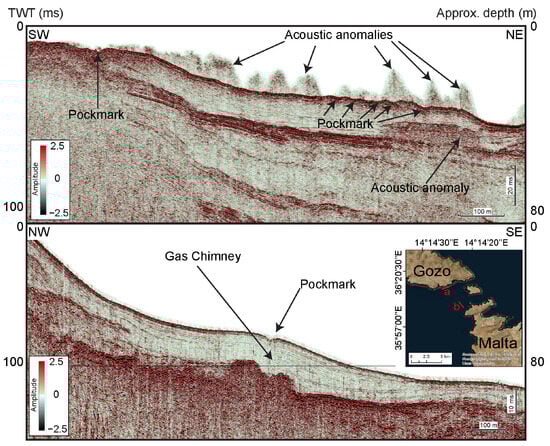
Figure 9.
Sub-bottom profiles acquired offshore Malta showing small, aligned pockmarks in the upper panel, and a larger pockmark with a well-defined gas chimney in the lower panel. (Data from University of Malta, Malta). Location in the inset.
4.3. Eastern Mediterranean Sea
4.3.1. Inner Ionian Sea and Interconnected Gulfs
In the Inner Ionian Sea (Western Greece), salt diapirs mobilized by tectonic thickening act as fluid conduits [165,166]. Cold seeps are observed in deltas, gulfs, and deep basins [166]. Amvrakikos Gulf features buried pockmarks and plumes at the Pleistocene-Holocene boundary [165,166]. Amphilochia Bay hosts fault-aligned pockmarks with microbial-thermogenic CH4 [167]. In the southern margin of Patras Gulf, an important pockmark field is situated in the coastal zone of the city of Patras, between the 17–45 m isobaths, consisting of 115 pockmarks (~7.3 m deep) (Figure 10). This field is fault-controlled and has been activated at least twice by earthquakes [84,168]. More recently, a distributed temperature sensor (DTS) system was deployed inside a shallow pockmark for monitoring seabed water temperature recording four thermal events that seem to have a causative link with the local seismicity [169].
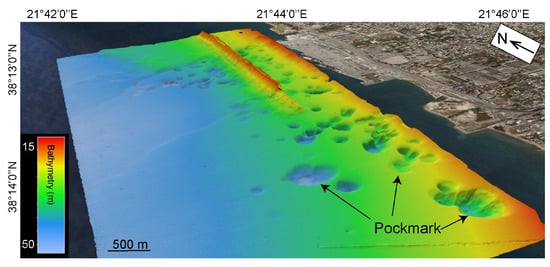
Figure 10.
Three-dimensional bathymetric view of the Patras pockmark field, Greece (Data from Oceanus-Lab archives, University of Patras, Greece and Christodoulou et al., 2023 [168]). Location in inset.
In Helike Delta and Elaionas Bay, pockmarks (10–60 m wide, 10–15 m deep) show gas-charged sediments and freshwater plumes. Biological surveys reveal dense benthic life inside pockmarks, though diversity decreases outward [168]. A deep cluster of nine pockmarks (40–132 m diameter; 2–8 m deep) lies in Kyparissiakos Gulf (~1050 m depth), with seismic chimneys indicating thermogenic gas [165].
4.3.2. NW Mediterranean Ridge to Eratosthenes Seamount
The northwestern part of the Mediterranean Ridge, including the Cobblestone area, lies at water depths between 3000 and 4000 m and hosts different mud volcanoes and pockmarks. Deep-tow side scan sonar surveys have revealed two primary pockmark groupings. The first comprises 4–5 closely spaced pockmarks approximately 75–85 m in diameter, while the second is a composite of a dozen overlapping pockmarks ranging from <20 m to ~50 m in diameter, increasing westwards [170]. In the Olimpi mud volcano field, different pockmarks genesis has been hypothesized as follows. A brine-filled pockmark (~2–3 m in diameter) is situated on the Napoli mud volcano. On the Milano mud volcano’s NW flank, larger superposed pockmarks (>300 m) contain smaller ones (~100 m), some filled with brine. Isolates brine-filled depressions, such as the 250–300 m wide, 8–10 m deep Nadir Brine Lake, occur throughout the Olimpi area [170]. In the United Nation Rise, over 60 pockmarks (>2200 m water depth) are associated with mud volcanoes and/or faults. These include: (i) 15–18 linear pockmarks (90–170 m diameter, >10 m deep); (ii) five nearby pockmarks of similar dimensions; (iii) four overlapping, flat-floored pockmarks (~100–150 m); (iv) 8–9 V-shaped pockmarks aligned with a slump scarp; (v) 15–18 varied-size pockmarks (55–130 m diameter); and (vi) a cluster around a large 350 m-wide depression [171]. At the Eratosthenes Seamount, 42 pockmarks were mapped, ranging from 40 to 200 m in diameter. These pockmarks were subdivided into three size categories: small (<80 m, average 50 m), medium (120–170 m, average 140 m), and large (~200 m). Sub-bottom profiles show these depressions extend from few m to >15 m below the seabed. Furthermore, deep-water pockmarks in this region fall into four types [170]: (i) those associated with active mud volcanoes, (ii) those linked to extinct mud volcanoes and faults, (iii) those near active faults or scarps, and (iv) those occasionally related to submarine slumps [132].
4.3.3. Aegean Sea
Despite its potential, the North Aegean Sea remains underexplored. Gas-charged sediments and wipeouts have been detected on the Thermaikos Gulf shelf-edge and Sporades shelf by using high resolution seismic reflection data [166]. Small pits, likely pockmarks, were found near active fault footwalls [166]. In the Prinos-Nestos basin (6–25 m depth), pockmarks (<25 m wide and <3 m deep) form from submarine freshwater discharge, although thermogenic gas from Greece’s only productive oil field might contribute in the genesis of such morphologies [172]. The South Aegean Sea is characterized by the back-arc volcanism of the Hellenic volcanic arc, which is responsible for many active hydrothermal manifestations both onshore and offshore. CO2-rich hydrothermal vents dominate fluid chemistry. Marine surveys along the South Aegean Sea Volcanic Arc have focused on Santorini and mainly on the Kolumbo Volcanic Chain, without, in any case, showing the presence of pockmarks [166].
4.3.4. Nile Delta Deep-Sea Fan Region
In the southeastern Mediterranean, pockmarks are widespread along the Levant margin and the eastern Nile fan, particularly at the toe of the salt-rooted Palmahim Disturbance [38]. The Nile Delta deep-sea fan, a passive margin, is characterized by widespread fluid seepage [39]. Pockmarks, recognized by sonar as high backscatter patches, have been identified in the western, central, and eastern provinces [38,39,132]. In the central province (1800–2500 m water depths), a large field of pockmark is associated with sediment destabilization [173]. Gas chimneys beneath some pockmarks suggest thermogenic origins, though others, linked to slope failure, might have mixed microbial and thermogenic sources. In the Rosetta Channel, >1500 unit pockmarks (V-shaped in cross-section) were identified (5–41 m diameter, average 17 m; 0.4–0.8 m deep) at 400–800 m depth [174].
Along the offshore of Israel, 3D seismic data-derived bathymetry data shown the occurrence of sub-circular depressions [83]. These depressions are circular to oval, 200–500 m wide and less than 50 m deep and are interpreted as pockmarks formed by fluid escape at the seabed [83]. Seismic data reveal high-amplitude reflections and fluid pathways linked to faults and folded strata, indicating both vertical and lateral gas migration [38]. ROV observations confirm active methane seepage, with microbial mats and methane-derived carbonates hosting chemosynthetic fauna. These features mark long-lived fluid flow systems and important biodiversity hotspots on the deep Levant margin [175].
4.4. Black Sea
The first recorded sampling of natural gas hydrates in the Black Sea occurred in 1974 [176]. Over the following decades, extensive geophysical and oceanographic surveys identified gas-charged sediments, bottom-simulating reflectors (BSRs), gas hydrate stability zones (GHSZ), and numerous seepage sites, including mud volcanoes and pockmarks [177,178,179]. The northwestern passive margin hosts two major organic-rich sedimentary fans, the Danube and Dniepr [180]. Periodic seafloor anoxia has created conditions favorable for gas accumulation. Over 10,100 vent sites have been mapped in the Romanian and Bulgarian sectors, linked to canyon and levee structures and often associated with gas chimneys, pockmarks, and mud volcanoes [178,181,182]. More than 340 pockmarks, mostly 40–50 m in diameter, have been documented in this margin. Some have coalesced into elongated depressions. Active gas escape is common, with sediment and water samples indicating biogenic or deep-sourced microbial gas, and minor thermogenic components [183]. Offshore Bulgaria, over 300 pockmarks were identified near the southern shelf break (160–350 m water depth), with another 160 near Cape Kaliakra (220–400 m water depth). Many pockmarks display acoustic flares. On the southeastern Turkish shelf, a large field of circular (50–120 m water depth) and elongated (200–250 m, 10–25 m deep) pockmarks occurs near the Yesilırmak Delta [177]. Buried pockmarks suggest episodic gas migration linked to seismicity. In the Tuapse area (NE Black Sea), pockmarks > 100 m diameter occur at >1500 m water depths, linked to shallow gas and faults. At the eastern basin (~2100 m water depth), fault-controlled pockmarks are observed [184]. In central sectors (~2000 m water depth), numerous 80–500 m wide, up to 8 m deep pockmarks form near mud volcano rims and may be deformed by mudflows [185].
5. Results and Discussion
This section presents a detailed statistical analysis of the 7516 pockmarks distributed across the Mediterranean Sea and Black Sea. However, it should be noted that the analysis inherently carries a number of uncertainties that cannot be fully assessed, since the information derives from heterogeneous datasets acquired with different instruments and originally mapped by different operators. The dataset reveals in the Mediterranean region, a wide range of pockmark sizes and depths. Diameters vary from 10 m to over 1000 m, with an average of ~230 m; internal depth values are up to tens of meters. We also tabulated all the pockmark parameters in Table S1 in Supplementary Material.
5.1. Statistical Analysis of Mediterranean Pockmark Dataset
Bathymetry: In the Mediterranean and Black seas, the bathymetric distribution of pockmarks reveals a bimodal trend with two primary clusters: shallow pockmarks (100–200 m) and intermediate depth pockmarks (500–700 m). However, we need to consider that this particular water depth distribution of pockmarks may also be indicative of a technological bias associated with the exponential decline in resolution of vessel-mounted multibeam bathymetry as water depth increases (Figure 11a). Alternatively, this distribution may be influenced by the scarcity of high-resolution bathymetric data available for both the deep sea and the continental shelves [92,186].
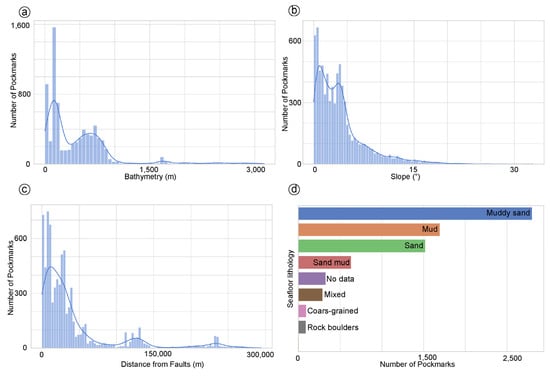
Figure 11.
Histograms showing the distribution of pockmarks vs. (a) Bathymetry, (b) Slope, (c) distance from faults and (d) Seafloor lithology in the Mediterranean and Black Seas.
Slope Gradient: Pockmarks show a strong tendency to occur in low-gradient environments (Figure 11 and Figure 12). Around 72% of the pockmarks are found on slopes gentler than 4°, suggesting a pronounced preference for relatively flat or gently inclined seabed settings. A closer examination of the slope histogram indicates a bimodal distribution, with two prominent peaks centered around 1.5° and 3.5° (Figure 11b). This pattern could reflect two principal geological contexts in which pockmarks form. The first peak is associated with gentle slope depositional zones, where fine-grained sediments and slow rates of fluid diffusion provide stable conditions for pockmark development and preservation. The second peak could correspond to slightly steeper settings along the continental slope, where more dynamic processes such as fluid migration through fractures and/or faults enhance the potential for pockmark formation. Conversely, areas with slopes greater than 8° show a marked decline in pockmark occurrence. These environments are typically characterized by higher sediment instability and active downslope transport [187], which can inhibit the formation or long-term preservation of pockmark structures.
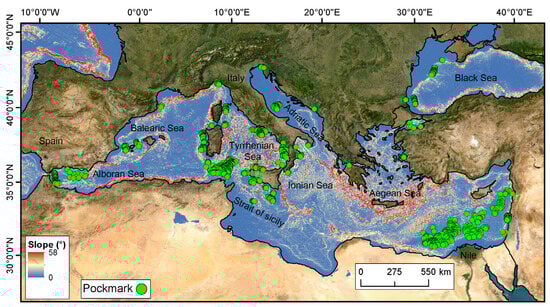
Figure 12.
Slope map of the Mediterranean Sea region with pockmarks (green dot) used in this paper.
Distance from the nearest fault: In this study, we also examined the relationship between pockmarks and fault distribution. This choice was motivated by the findings of Spatola et al. (2025) [92], where a machine-learning-based susceptibility model identified fault proximity as a key factor influencing pockmark occurrence.
The histogram of fault distances shows a left-skewed distribution, indicating that pockmarks are more concentrated near faults; indeed, approximately 40% of all pockmarks occur within 2 km away from the fault. This proximity could be the sign that even minor fractures and faults act as preferential pathway for fluids to migrate upward, breaching the seafloor and forming out the pockmarks.
Seafloor sediment lithology: The spatial distribution of pockmarks on the Mediterranean seafloor suggests a strong influence by the seafloor sediment lithology (Figure 11d and Figure 13). The analysis indicates that pockmarks are most commonly associated with substrates characterized by muddy sand, sand and mud. Specifically, muddy sand accounts for approximately 46% of the total mapped pockmarks, followed by sand at around 28% (Figure 11d). Please note that, to address this aspect of the study, we used the low-resolution seafloor sediment lithology dataset from EMODnet Geology, as it was the only publicly available source accessible to us. However, where possible, this information was cross-checked and refined using sedimentological data from the original publications. In fact, the dataset also includes a layer derived from literature-based seafloor lithology.
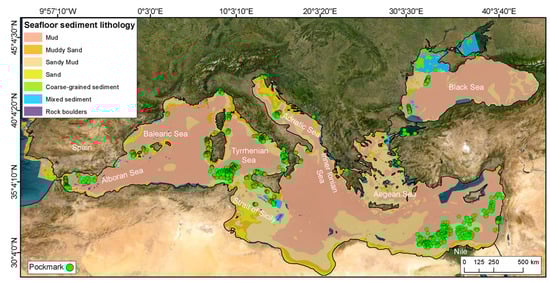
Figure 13.
Seafloor sediment lithology distribution map of the Mediterranean Sea region with pockmarks (green dot) used in this paper.
Plio-Quaternary Sediment Thickness: Pockmarks appear to cluster in areas where Plio-Quaternary sediment thickness is moderate, with a unimodal distribution peaking between 300 and 600 m (Figure 14). We recall that the thickness data were derived from low-resolution raster datasets [128]. This suggests that the critical thickness of Plio-Quaternary sediments is necessary to maintain the overpressure conditions required for fluid escape, without being so thick as to fully suppress or diffuse the flux. These sediments often consist of alternating fine-grained and coarse-grained layers, which can facilitate fluid accumulation and vertical migration through permeable horizons. This trend may suggest that thinner sediment layers are insufficient to generate the necessary overpressure, while thicker sequences might inhibit surface venting due to compaction, lithification, or increased lithostatic load [12,71].
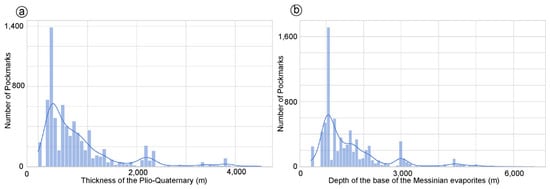
Figure 14.
Histograms showing the distribution of pockmarks vs. (a) thickness of the Plio-Quaternary sediments and (b) the base of the Messinian evaporites.
Messinian Sediment Thickness: Regarding the link with the base of the Messinian sediment, we decided to investigate the spatial correlation between pockmark distribution and the depth of the Messinian unconformity because recent findings have highlighted a weak but observable correlation between pockmarks and the Messinian sequence in the context of the Italian seas (Figure 14b). However, it is important to stress that such a correlation is unlikely to be consistent across the entire Mediterranean basin. This behavior is probably likely due to a bias in our dataset, as the majority of the mapped pockmarks are located in areas where the Messinian unit is both present and relatively shallow and thin. Pockmarks are frequently associated with areas where the base of the Messinian is at a depth between 200 and 1000 m (below the seafloor). These regions are characterized by tectonically induced deformation, such as diapirism, faulting, and differential compaction, which creates vertical conduits or enhances pre-existing fracture systems, thereby promoting focused fluid migration [68]. In some areas, the presence of a mechanically weak Messinian unit may also act as a detachment surface, further influencing the spatial distribution of overlying pockmarks [68,188]. For example, offshore Israel, thinning (welding) of the Messinian evaporites has facilitated cross-stratal fluid migration, leading to the formation of pockmarks at the seafloor [38,83]. Our interpretation is in line with a GIS-based synthesis of geological data across the Mediterranean revealing significant relationships between the distribution of mud volcanoes, the presence and thickness of Messinian evaporites, and active tectonic structures [189]. The study shows that in the eastern Mediterranean, most mud volcanoes provinces, including those on the Calabrian Arc, the Mediterranean Ridge, and the upper Egyptian margin are found in areas where Messinian evaporites are either thin, absent, or not detectable in seismic data [11,190]. This supports the interpretation that thick evaporite layers act as impermeable seals preventing their escape to the seafloor a mechanism that is well documented in salt-bearing petroleum-rich basins. An exception occurs in the northwestern Nile deep-sea fan, where mud volcanoes [11] and active fluid seeps are present despite a thick Messinian evaporite cover [11,190].
5.2. Analysis of Pockmark Activity States VS to Geomorphological and Stratigraphic Variables
In the literature used to create the Pockmarks database [17], nearly 27% of pockmark records are described as recently or presently active features since they show evidence of gas flares, acoustic wipeout zones, or seismic chimneys indicating either ongoing or recent fluid flow (Figure 3). In this section, we try to understand how the potential pockmark activity appears to vary as a function of the geological factors previously described (i.e., bathymetry, slope, fault distance, and Plio-Quaternary sediment thickness). According to the dataset used, active pockmarks or pockmarks with recent activity apparently are more frequently found at moderate water depths (~100–200 m), whereas inactive ones tend to dominate shallower (below~100 m) and deeper zones deeper than 300 m (Figure 15). We recall that this hypothesis, being derived from a limited dataset, suffers from significant bias. However, this suggests that intermediate-depth settings may provide optimal pressure-temperature conditions or sediment types favorable to active seepage. However, this contrasts with the continental shelf, where the reduced hydrostatic load due to shallow water depth corresponds to a very low number of pockmarks. So far, the only few documented cases in these shallow areas (on the continental shelf) are associated with freshwater seepage in the southern Tyrrhenian Sea [151] as well as in Inner Ionian Sea where pockmarks have been documented in water depths shallower than 40 m [84].
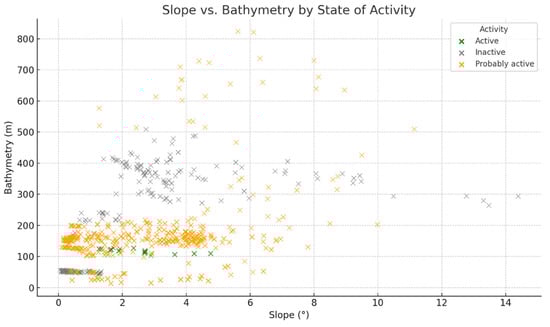
Figure 15.
Scatter Plot of the state of activity of pockmarks vs. bathymetry and slope.
As noted previously, most pockmarks occur on gentle slopes, typically < 4°. However, active pockmarks or pockmarks with recent activity show a slight tendency to occupy slightly steeper terrain (Figure 15), possibly reflecting a link between fluid migration and structural pathways such as normal faults affecting the seafloor forming breaks of slope (e.g., fault scarps) like in the offshore of the Maltese archipelago [56]. Active pockmarks are generally located closer to known tectonic faults than inactive ones (Figure 16), supporting the hypothesis that fault-related permeability enhances focused fluid escape [191], thereby sustaining pockmark activity [63,192].
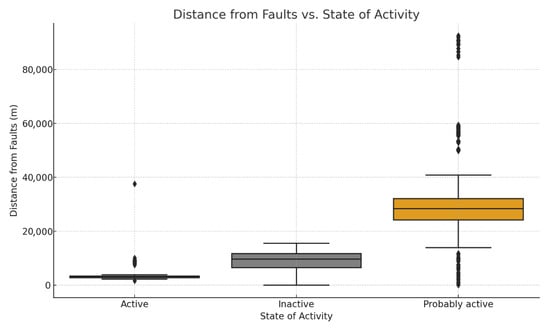
Figure 16.
Boxplot of the state of activity of pockmarks vs. distance from faults. Note that all information about the activity of pockmarks comes from the scientific papers considered in this review. These data are reported in Table S1 in Supplementary Material.
5.3. Comparative Analysis of Pockmark Morphology, Activity, and Fluid Source Across the Mediterranean
Pockmarks across the Mediterranean and Black seas vary widely in their morphology, fluid sources, geological controls, and state of activity (Figure 16). These differences are closely tied to the tectonic and sedimentary evolution of the basin and reflect a clear spatial gradient from the Western to the Eastern sub-basins. Integration of quantitative data such as bathymetry, slope, and distance from faults alongside qualitative interpretations of tectonic regime and fluid chemistry reveals coherent regional patterns (Table S1 in Supplementary Material). A further dimension, the state of activity, adds temporal context to these features, distinguishing ephemeral seepage from long-lived or persistent fluid expulsion systems. In the Western Mediterranean, pockmarks are generally shallow (typically <200 m water depth), formed in association with high fluvial sedimentation and stratigraphic controls [70]. These features, found predominantly in the Gulf of Lion and Ebro Margin, are rooted in microbial methane production from organic-rich deltaic and prodelta sediments [135]. While these pockmarks may appear active in shallow acoustic profiles, their true state is mostly episodic or inactive, consistent with subsurface evidence of buried, stacked pockmarks linked to sea-level fluctuations [49].
The Central Mediterranean presents a more geologically diverse setting, leading to greater variability in pockmark expression. In the Central Tyrrhenian Sea, pockmarks occur at greater water depths (average ~313 m), on steeper slopes (~4.2°), and in closer proximity to faults (~7.5 km; Figure 11c). In the same region shallower pockmarks are frequently associated with mass-transport deposits [193], hydrothermal systems [10], and active mud volcanoes that emit microbial methane and crustal CO2 [193,194,195]. The state of activity in this region is mixed: while some pockmarks are inactive and buried, others especially near volcanic ridges and mud mounds remain actively venting and have evidence of acoustic gas flares [196]. In the Central Adriatic Sea and on the eastern part of the Strait of Sicily, pockmarks are shallower (average ~200 m water depth) and occur on gently dipping slopes (~0.4°) and apparently located farther from faults (Figure 17). Despite the lower tectonic intensity, active or recently active pockmarks with recent activity are still observed. This supports the idea that fluid migration in passive or foredeep settings may persist under favorable sedimentological conditions especially where stratigraphic seals concentrate gas over long periods.
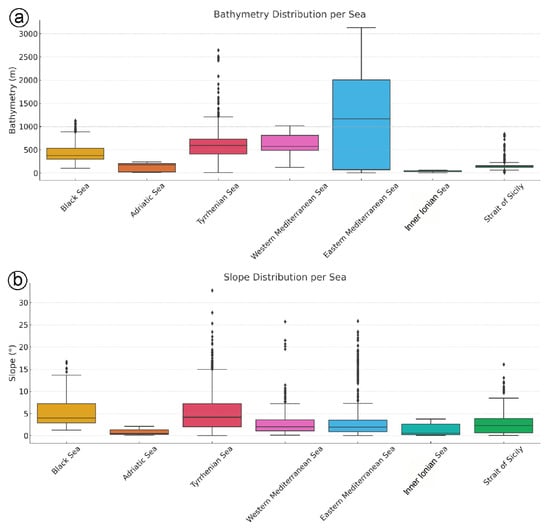
Figure 17.
Boxplots showing the distribution of (a) bathymetry and (b) slope values for each sea represented in the dataset. Each box illustrates the interquartile range (IQR), with the horizontal line indicating the median.
In the Eastern Mediterranean Sea, pockmarks are typically found at deeper water depths compared to those in the Central and Western sectors (Figure 17). The Black Sea, for example, has pockmarks with an average water depth of ~459 m, located on steep slopes (~5.2°) (Figure 17). These features are almost uniformly marked as active, consistent with ongoing seepage from overpressured, gas-charged sediments in fan systems such as the Dniepr and Danube. Acoustic plumes, methane seeps, and wipeout zones are common, and some fields contain thousands of active vent sites [178,182,197].
The South Aegean Sea is characterized by the back-arc volcanism of the Hellenic volcanic arc, which is responsible for many active hydrothermal manifestations both onshore and offshore. CO2-rich hydrothermal vents dominate fluid chemistry [198,199].
In the Inner Ionian Sea (Western Greece), diapirs were mobilized by the overlying tectonic thickening, potentially acting as preferential pathways for upwards fluid migration [132]. In this context, the Ionian Sea and the interconnected water bodies can be considered as an ideal environment for studying gas seepages and related seabed morphological features. Fluid flow sites have been observed in a variety of geological settings such as deltas, fjord-like embayments, gulfs, open shelves, lagoons but also in deep-sea environments [39,84,165,200]. In semi-enclosed gulfs (Patras, Amvrakikos), pockmarks are active and occur at shallow waters, on almost flat seabed (0–2°), and in very close proximity (<1 km) to active faults and in some cases above them (Figure 17). The state of activity, as reflected in our dataset, emphasizes this eastward intensification (Figure 16). In the Black Sea, nearly all pockmarks are listed as active, corresponding with intense subsurface gas migration and minimal structural sealing [178]. Conversely, Western Mediterranean pockmarks are mostly relict and inactive, though they remain morphologically well preserved [17].
5.4. General Implications for Pockmarks
Pockmarks are significant geomorphological features on the seafloor and have broad implications for geohazards, earthquake forecasting, marine biodiversity, climate dynamics, and resource exploitation.
5.4.1. Sedimentary Instabilities
Pockmarks influence the geotechnical properties of marine sediments and are frequently associated with submarine slope failures. Their presence is often linked to gas-charged sediments, which reduce sediment cohesion and promote instability [5,20]. Numerous studies have identified pockmarks in proximity to large sedimentary failures, such as in the Nile Delta deep-sea fan, where they coincide with gas chimneys and major slope instabilities [95,132,173]. Similarly, on the northwestern Sicilian continental margin, a cluster of pockmarks encircles an amphitheater-shaped landslide scar, suggesting a genetic relationship between gas escape features and mass movements. In the Central Black Sea, oval-shaped pockmarks appear modified by mudflows, reinforcing the interplay between fluid escape and sediment deformation [185]. These associations highlight the potential geohazard role of pockmarks, especially concerning the construction of offshore infrastructure. For instance, in Patras (Greece), part of the newly constructed city harbor was built over an active pockmark field. Twenty-three of the 115 identified pockmarks were filled with inert materials and buried beneath the harbor breakwater, which subsequently experienced approximately 1 m of subsidence [165,200].
5.4.2. Pockmarks as Earthquake Precursors?
The Patras Gulf pockmark field was reported as a precursor to the 1993 earthquake in western Greece [84], and further activation of the same site occurred during earthquakes in 1993 and 2008 [168]. Pockmarks can function as physical markers of gas outbursts, reflecting periodic activation of deep-seated fluid pathways [201]. Seismic and hydroacoustic studies suggest that these features could serve as natural laboratories for understanding earthquake precursors. Prior to seismic events, increases in seafloor temperature and gas venting activity have been observed in the western Gulf of Corinth [202]. High-resolution tools such as multibeam sonars and sub-bottom profilers effectively detect active pockmarks and associated water column anomalies like gas flares and chimneys [203]. Given the complexity of the Mediterranean tectonic environment, monitoring known pockmark fields for anomalies in temperature and gas flux could enhance earthquake risk assessments.
5.4.3. Biota
Pockmarks play a vital role in supporting unique benthic ecosystems (Figure 18) due to the release of gases primarily methane from the subsurface [93,204,205,206,207,208]. These fluid flows influences multiple environmental spheres, from hydrospheric chemistry and ocean alkalinity to atmospheric greenhouse gas concentrations [209,210].
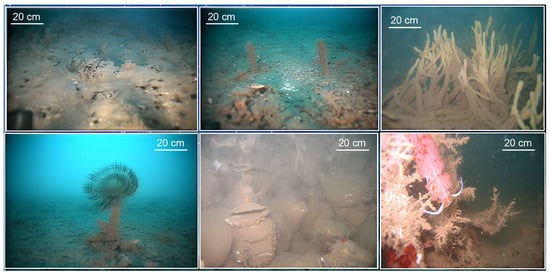
Figure 18.
Benthic megafaunal assemblages inside the Elaionas bay pockmarks (Gulf of Corinth, Greece (modified from Oceanus-Lab archives, University of Patras, Greece).
In the Mediterranean sea, a known biodiversity hotspot [211], pockmarks enhance seafloor heterogeneity, fostering chemosynthetic communities and increasing species richness. Reference [93] found that up to 25% of benthic species in studied areas were uniquely associated with pockmark sites. While some taxa are underrepresented in these environments, nematodes and microbial consortia flourish, forming the basis of highly specialized food webs [212]. Multitudes of sharks and shark eggs have also been discovered within pockmarks and/or cold seep ecosystems in the Levant Basin [213]. These ecosystems may also offer refuge from human impacts such as bottom trawling [206]. In addition, they are ecologically and economically significant as potential spawning grounds for commercial fish species [161].
5.4.4. Climate Change
Pockmarks are natural pathways for the emission of methane (CH4) and carbon dioxide (CO2), contributing to global carbon cycling and potentially influencing past and future climate dynamics [6,210]. It is estimated that seafloor fluid flow features release up to 0.05 gigatons of carbon annually, accounting for up to 5% of global methane emissions [6,210,214]. Recent geochemical studies suggest that CO2 may play a more substantial role than CH4 in some settings, particularly in promoting ocean acidification [215,216]. Understanding the temporal evolution of pockmark activity is therefore essential for reconstructing the paleoatmosphere and predicting future climate trends.
5.4.5. Economic Implications
Pockmarks often indicate the presence of subsurface hydrocarbons, making them critical features for the petroleum industry [217]. They are commonly found in hydrocarbon-rich settings and estuarine environments [64,218]. In addition, pockmarks located in regions of high groundwater discharge are potential indicators of freshwater aquifers [2,63], which are increasingly valuable in densely populated Mediterranean coastal areas where freshwater scarcity is an emerging challenge.
5.4.6. Future Research
Building upon the first susceptibility map of pockmarks along the Italian margins [92], future research should aim to extend this approach to the entire Mediterranean and Black seas. As highlighted in this review, these basins encompass a wide range of tectonic, sedimentary, and oceanographic settings that exert a strong control on the formation and spatial distribution of pockmarks. A basin-scale susceptibility analysis would provide unprecedented insights into the regional drivers of submarine fluid escape and their geological, ecological, and societal implications. This goal is now achievable thanks to the recent publication of the first open-access geodatabase of pockmarks in the Mediterranean and Black seas, which offers a robust morphometric foundation for model training, calibration, and validation. Model accuracy could be substantially enhanced if research institutions shared detailed morphometric data for individual pockmarks, rather than only average values at the cluster level as the above-mentioned public dataset.
In addition, replacing EMODnet with higher-resolution bathymetric datasets would significantly improve predictive performance, if data resolution is consistent across all mapped areas. Future work should also aim to quantify how many pockmarks are actively venting and estimate the amount of fluid escaping through them, combining regional seep mapping, data sharing, and modeling approaches despite inherent uncertainties. By integrating the geodatabase with high-resolution bathymetric, geological, and geophysical data, future susceptibility models could more accurately resolve pockmark distribution patterns and support improved risk assessments for offshore infrastructure, including wind farms, pipelines, and telecommunication cables. Furthermore, a broader susceptibility framework could help identify areas of active or incipient fluid seepage, thereby contributing to research on greenhouse gas emissions, the marine carbon cycle, and benthic ecosystem dynamics. Ultimately, the development of a Mediterranean-wide pockmark susceptibility map would represent a critical tool for marine spatial planning, environmental management, and the sustainable use of seafloor resources such as offshore freshened groundwater.
6. Conclusions
Pockmarks are the most widespread and morphologically diverse expressions of fluid flow on the seafloor of Mediterranean and Black seas, with the identification of more than 7500 features on high-resolution morpho-bathymetric and seismic data to date. Our results underscore the multi-factorial nature of pockmark formation, governed by the interplay of tectonic structures, margin architecture, and pressure regimes.
The statistical analysis reveals spatial patterns linked to both geomorphological and sedimentological controls. Pockmarks predominantly occur in low-gradient environments (typically below 4°) and show a bimodal water depth distribution, with peaks in shallow (100–200 m) and intermediate (500–700 m) settings. A key finding is the preferential clustering of active to recently active pockmarks with recent activity near tectonic structures, particularly in proximity of mapped faults, reinforcing the role of fault-controlled permeability in governing focused fluid migration. In fact, pockmarks tend to cluster along fault-controlled pathways in intermediate-depth settings, where sediment thickness and permeability can favor fluid accumulation and focused seepage.
The spatial distribution of pockmarks across the Mediterranean Basin reflects its complex tectono-sedimentary evolution from the extensional back-arc settings of the Tyrrhenian Sea to the salt-influenced basins of the Eastern Mediterranean and the organic-rich fans of the Black Sea. This variability offers a unique opportunity to investigate fluid flow dynamics in contrasting geodynamic contexts. Despite significant advances, key challenges remain. The distinction between active and relict (inactive and/or dormant) pockmarks is often hindered by the lack of long-term monitoring and in situ data. Moreover, the role of pockmarks as potential precursors to geohazards, their impact on benthic ecosystems, and their contribution to carbon cycling warrant further interdisciplinary research. Future research should prioritize high-resolution bathymetric surveys, integration of acoustic and geochemical proxies, and the application of advanced machine learning techniques to detect, classify, and model fluid flow phenomena at regional and local scale. Given the Mediterranean region’s relevance as both a geohazard prone area and a hotspot of marine biodiversity, the study of pockmarks holds critical implications not only for Earth Sciences, but also for environmental management, energy resource assessment, and climate monitoring.
Supplementary Materials
The following supporting information can be downloaded at: https://www.mdpi.com/article/10.3390/geosciences15120448/s1, Figure S1: Schematic classification of pockmarks based on the activity and size; Table S1: Summary of main morphometric parameters of pockmarks.
Author Contributions
Conceptualization, D.S. and M.T.H.; methodology, D.S., D.C. and M.R.; validation, D.S., D.C. and M.R.; formal analysis, D.S.; data curation, D.S., F.L.C., S.D., G.E., A.M., G.P., A.S. and J.T.V., writing—original draft preparation, D.S.; writing—review and editing, D.S., M.T.H., D.C., M.R., G.P., F.L.C., S.D., G.E., A.M., A.S. and J.T.V. All authors have read and agreed to the published version of the manuscript.
Funding
This research received no external funding.
Data Availability Statement
Bathymetric data used for this work are downloadable from the EMODnet BATHYMETRY website (https://emodnet.ec.europa.eu (accessed on 24 November 2025)) with a cell-size of ~100 m. The high-resolution bathymetric data (multibeam with a cell-size of ~20 m) can also be consulted at this link: https://github.com/pcm-dpc/MaGIC (accessed on 24 November 2025). Vector data can be consulted by contacting the corresponding author: D.S. daniele.spatola@uniroma1.it. Pockmarks dataset can be download by Zenodo portal (https://zenodo.org/records/15425907 (accessed on 24 November 2025)) [17].
Acknowledgments
We acknowledge the Magic Project (Marine Geohazards along the Italian Coasts) funded by the Italian Civil Protection Department, which involved the entire national scientific community working in the field of marine geology (3 institutes of the National Research Council, 7 universities and the OGS institute). We also thank “The European Marine Observation and Data Network” (EMODnet) that allow us to access European marine data, data products and metadata from diverse sources. We also thank “The METIQ project” (Modello Evolutivo del Territorio Italiano nel Quaternario) that is an Italian scientific initiative aimed at building a robust evolutionary model of the Italian territory in the Quaternary at 1:500,000 scale. We thank Simone Napoli for his help. We acknowledge that a national-scale mapping of fluid flow features along the Italian Continental margins was achieved independently by M.R. and collaborators during a project carried out by ISMAR and funded by the former Italian Ministry of Economic Development now part of the Ministry of Environment and Energy Safety, General Direction on Infrastructures and Safety, Division V. We would like to thank the two anonymous reviewers and the Editorial Board for their thoughtful and constructive comments, which greatly improved the manuscript.
Conflicts of Interest
The authors declare no conflicts of interest.
References
- Bünz, S.; Polyanov, S.; Vadakkepuliyambatta, S.; Consolaro, C.; Mienert, J. Active gas venting through hydrate-bearing sediments on the Vestnesa Ridge, offshore W-Svalbard. Mar. Geol. 2012, 332–334, 189–197. [Google Scholar] [CrossRef]
- Zhang, Z.; Shan, H.; Feng, X.; Jia, Z.; Jiang, L.; Wang, S.; Zhu, C. Review of Research Progress on the Impact of Submarine Groundwater Discharge on Pockmark Formation and Evolution. J. Mar. Sci. Eng. 2025, 13, 1070. [Google Scholar] [CrossRef]
- Claypool, G.E.; Kaplan, I.R. The Origin and Distribution of Methane in Marine Sediments. Nat. Gases Mar. Sediments 1974, 3, 99–139. [Google Scholar] [CrossRef]
- Whiticar, M.J. Carbon and hydrogen isotope systematics of bacterial formation and oxidation of methane. Chem. Geol. 1999, 161, 291–314. [Google Scholar] [CrossRef]
- Davis, A.M. Shallow gas: An overview. Cont. Shelf Res. 1992, 12, 1077–1079. [Google Scholar] [CrossRef]
- Etiope, G.; Klusman, R.W. Geologic emissions of methane to the atmosphere. Chemosphere 2002, 49, 777–789. [Google Scholar] [CrossRef]
- Etiope, G.; Milkov, A.V. A new estimate of global methane flux from onshore and shallow submarine mud volcanoes to the atmosphere. Environ. Geol. 2004, 46, 997–1002. [Google Scholar] [CrossRef]
- Etiope, G.; Schoell, M.; Hosgörmez, H. Abiotic methane flux from the Chimaera seep and Tekirova ophiolites (Turkey): Understanding gas exhalation from low temperature serpentinization and implications for Mars. Earth Planet. Sci. Lett. 2011, 310, 96–104. [Google Scholar] [CrossRef]
- Motyka, R.J.; Poreda, R.J.; Jeffrey, A.W. Geochemistry, isotopic composition, and origin of fluids emanating from mud volcanoes in the Copper River basin, Alaska. Geochim. Cosmochim. Acta 1989, 53, 29–41. [Google Scholar] [CrossRef]
- Rovere, M.; Mercorella, A.; Gamberi, F.; Zgur, F. Hydrothermal Vent Complexes Control Seepage and Hydrocarbon Release on the Overriding Plate of the Tyrrhenian-Ionian Subduction System (Paola Basin). Front. Earth Sci. 2022, 10, 852786. [Google Scholar] [CrossRef]
- Napoli, S.; Spatola, D.; Casalbore, D.; Lombardo, L.; Tanyas, H.; Chiocci, F.L. Comprehensive global inventory of submarine mud volcanoes. Sci. Data 2025, 12, 382. [Google Scholar] [CrossRef] [PubMed]
- Kopf, A.J. Significance of mud volcanism. Rev. Geophys. 2002, 40, 2-1–2-52. [Google Scholar] [CrossRef]
- Milkov, A.V. Worldwide distribution of submarine mud volcanoes and associated gas hydrates. Mar. Geol. 2000, 167, 29–42. [Google Scholar] [CrossRef]
- Herut, B.; Rubin-Blum, M.; Sisma-Ventura, G.; Jacobson, Y.; Bialik, O.M.; Ozer, T.; Lawal, M.A.; Giladi, A.; Kanari, M.; Antler, G. Discovery and chemical composition of the eastmost deep-sea anoxic brine pools in the Eastern Mediterranean Sea. Front. Mar. Sci. 2022, 9, 1040681. [Google Scholar] [CrossRef]
- Ryan, W.B.F. Decoding the mediterranean salinity crisis. Sedimentology 2009, 56, 95–136. [Google Scholar] [CrossRef]
- Hovland, M. The formation of pockmarks and their potential influence on offshore construction. Q. J. Eng. Geol. Hydrogeol. 1989, 22, 131–138. [Google Scholar] [CrossRef]
- Spatola, D.; Rovere, M.; Casalbore, D.; Chiocci, F.L. Pockmarks of the Mediterranean and Black Sea. Zenodo 2025. [Google Scholar] [CrossRef]
- Judd, A.; Hovland, M. Seabed Fluid Flow: The Impact on Geology, Biology and the Marine Environment; Cambridge University Press: Cambridge, UK, 2007. [Google Scholar]
- Spatola, D.; Rovere, M.; Casalbore, D.; Chiocci, F.L. Pockmarks of the Mediterranean region seas: A Comprehensive Geodatabase for Marine Geomorphological Analysis. Sci. Data 2025, 12, 1049. [Google Scholar] [CrossRef]
- Hovland, M.; Gardner, J.V.; Judd, A.G. The significance of pockmarks to understanding fluid flow processes and geohazards. Geofluids 2002, 2, 127–136. [Google Scholar] [CrossRef]
- Sun, X.; Yang, J.; Zheng, M.; Zhang, X. Artificial construction of the biocoenosis of deep-sea ecosystem via seeping methane. Environ. Microbiol. 2020, 23, 1186–1198. [Google Scholar] [CrossRef]
- Ma, G.; Zhan, L.; Lu, H.; Hou, G. Structures in Shallow Marine Sediments Associated with Gas and Fluid Migration. J. Mar. Sci. Eng. 2021, 9, 396. [Google Scholar] [CrossRef]
- King, L.H.; MacLean, B. Pockmarks on the Scotian Shelf. Bull. Geol. Soc. Am. 1970, 81, 3142–3148. [Google Scholar] [CrossRef]
- Pilcher, R.; Argent, J. Mega-pockmarks and linear pockmark trains on the West African continental margin. Mar. Geol. 2007, 244, 15–32. [Google Scholar] [CrossRef]
- Wang, L.; Zhao, F.; Miramontes, E. Origin and evolution of widespread crescentic pockmarks on the western South China Sea margin. Mar. Pet. Geol. 2024, 170, 107091. [Google Scholar] [CrossRef]
- Yu, K.; Miramontes, E.; Alves, T.M.; Li, W.; Liang, L.; Li, S.; Zhan, W.; Wu, S. Incision of submarine channels over pockmark trains in the South China Sea. Geophys. Res. Lett. 2021, 48, e2021GL092861. [Google Scholar] [CrossRef]
- Tsoukala, V.; Kiousi, D.; Sartampakos, P. Seabed Morphology Assessment and Pockmark Detection for Port Construction and Maintenance, Using a Multibeam Echo-sounder: A Case study in Katakolo Port, Western Peloponnese, Greece. Tech. Ann. 2024, 1. [Google Scholar] [CrossRef]
- Li, X.; Guo, X.; Tian, F.; Fang, X. The Effects of Controlling Gas Escape and Bottom Current Activity on the Evolution of Pockmarks in the Northwest of the Xisha Uplift, South China Sea. J. Mar. Sci. Eng. 2024, 12, 1505. [Google Scholar] [CrossRef]
- Birdsell, D.T.; Rajaram, H.; Dempsey, D.; Viswanathan, H.S. Hydraulic fracturing fluid migration in the subsurface: A review and expanded modeling results. Water Resour. Res. 2015, 51, 7159–7188. [Google Scholar] [CrossRef]
- Xie, X.; Li, S.; He, H.; Liu, X. Seismic evidence for fluid migration pathways from an overpressured system in the South China Sea. Geofluids 2003, 3, 245–253. [Google Scholar] [CrossRef]
- Marcon, Y.; Ondréas, H.; Sahling, H.; Bohrmann, G.; Olu, K. Fluid flow regimes and growth of a giant pockmark. Geology 2014, 42, 63–66. [Google Scholar] [CrossRef]
- Pennino, V.; Sulli, A.; Caracausi, A.; Grassa, F.; Interbartolo, F. Fluid escape structures in the north Sicily continental margin. Mar. Pet. Geol. 2014, 55, 202–213. [Google Scholar] [CrossRef]
- Ingrassia, M.; Martorelli, E.; Bosman, A.; Macelloni, L.; Sposato, A.; Chiocci, F.L. The Zannone Giant Pockmark: First evidence of a giant complex seeping structure in shallow-water, central Mediterranean Sea, Italy. Mar. Geol. 2015, 363, 38–51. [Google Scholar] [CrossRef]
- Foland, S.S.; Maher, N.; Yun, J.W. Pockmarks along the Californian Continental Margin: Implications for fluid flow. AAPG Bull. 1999, 83, 681–706. [Google Scholar]
- Cole, D.; Stewart, S.A.; Cartwright, J.A. Giant irregular pockmark craters in the Palaeogene of the outer Moray Firth basin, UK North Sea. Mar. Pet. Geol. 2000, 17, 563–577. [Google Scholar] [CrossRef]
- Sun, Q.; Wu, S.; Hovland, M.; Luo, P.; Lu, Y.; Qu, T. The morphologies and genesis of mega-pockmarks near the Xisha Uplift, South China Sea. Mar. Pet. Geol. 2011, 28, 1146–1156. [Google Scholar] [CrossRef]
- Collins, J.A.; Molnar, P.; Sheehan, A.F. Multibeam bathymetric surveys of submarine volcanoes and mega-pockmarks on the Chatham Rise, New Zealand. N. Z. J. Geol. Geophys. 2011, 54, 329–339. [Google Scholar] [CrossRef]
- Lawal, M.A.; Bialik, O.M.; Lazar, M.; Waldmann, N.D.; Foubert, A.; Makovsky, Y. Modes of gas migration and seepage on the salt-rooted Palmahim Disturbance, southeastern Mediterranean. Mar. Pet. Geol. 2023, 153, 106256. [Google Scholar] [CrossRef]
- Dupré, S.; Woodside, J.; Klaucke, I.; Mascle, J.; Foucher, J.-P. Widespread active seepage activity on the Nile Deep Sea Fan (offshore Egypt) revealed by high-definition geophysical imagery. Mar. Geol. 2010, 275, 1–19. [Google Scholar] [CrossRef]
- Krämer, K.; Holler, P.; Herbst, G.; Bratek, A.; Ahmerkamp, S.; Neumann, A.; Bartholomä, A.; van Beusekom, J.E.E.; Holtappels, M.; Winter, C. Abrupt emergence of a large pockmark field in the German Bight, southeastern North Sea. Sci. Rep. 2017, 7, 5150. [Google Scholar] [CrossRef]
- Hartwig, A.; Anka, Z.; di Primio, R. Evidence of a widespread paleo-pockmarked field in the Orange Basin: An indication of an early Eocene massive fluid escape event offshore South Africa. Mar. Geol. 2012, 332, 222–234. [Google Scholar] [CrossRef]
- Baltzer, A.; Tessier, B.; Bates, R.; Moore, C.; Menier, D.; Morbihan, G.; Missiaen, T. Seistec Seismic Profiles: A Tool To Differenciate Gas Signatures and To Determine Their Origin. Mar. Geophys. Res. 2002, 12, 235–245. [Google Scholar]
- Bünz, S.; Mienert, J. Acoustic imaging of gas hydrate and free gas at the Storegga Slide. J. Geophys. Res. Solid Earth 2004, 109. [Google Scholar] [CrossRef]
- Riedel, M.; Bellefleur, G.; Mair, S.; Brent, T.A.; Dallimore, S.R. Acoustic impedance inversion and seismic reflection continuity analysis for delineating gas hydrate resources near the Mallik research sites, Mackenzie Delta, Northwest Territories, Canada. Geophysics 2009, 74, B125–B137. [Google Scholar] [CrossRef]
- Aloisi, G.; Drews, M.; Wallmann, K.; Bohrmann, G. Fluid expulsion from the Dvurechenskii mud volcano (Black Sea). Part I. Fluid sources and relevance to Li, B, Sr, I and dissolved inorganic nitrogen cycles. Earth Planet. Sci. Lett. 2004, 225, 347–363. [Google Scholar] [CrossRef]
- Dupré, S.; Berger, L.; Le Bouffant, N.; Scalabrin, C.; Bourillet, J.-F. Fluid emissions at the Aquitaine Shelf (Bay of Biscay, France): A biogenic origin or the expression of hydrocarbon leakage? Cont. Shelf Res. 2014, 88, 24–33. [Google Scholar] [CrossRef]
- Colbo, K.; Ross, T.; Brown, C.; Weber, T. A review of oceanographic applications of water column data from multibeam echosounders. Estuar. Coast. Shelf Sci. 2014, 145, 41–56. [Google Scholar] [CrossRef]
- Schurmeier, L.R.; Brouwer, G.E.; Fagents, S.A. Formation of the Siberian Yamal gas emission crater via accumulation and explosive release of gas within permafrost. Permafr. Periglac. Process. 2024, 35, 33–45. [Google Scholar] [CrossRef]
- Lafuerza, S.; Sultan, N.; Canals, M.; Frigola, J.; Berné, S.; Jouet, G.; Galavazi, M.; Sierro, F.J. Overpressure within upper continental slope sediments from CPTU data, Gulf of Lion, NW Mediterranean Sea. Int. J. Earth Sci. 2009, 98, 751–768. [Google Scholar] [CrossRef]
- Sultan, N.; Marsset, B.; Ker, S.; Marsset, T.; Voisset, M.; Vernant, A.M.; Bayon, G.; Cauquil, E.; Adamy, J.; Colliat, J.L.; et al. Hydrate dissolution as a potential mechanism for pockmark formation in the Niger delta. J. Geophys. Res. Solid Earth 2010, 115. [Google Scholar] [CrossRef]
- Böttner, C.; Berndt, C.; Reinardy, B.T.I.; Geersen, J.; Karstens, J.; Bull, J.M.; Callow, B.J.; Lichtschlag, A.; Schmidt, M.; Elger, J. Pockmarks in the witch ground basin, central North Sea. Geochem. Geophys. Geosyst. 2019, 20, 1698–1719. [Google Scholar] [CrossRef]
- Josenhans, H.W.; King, L.H.; Fader, G.B. A side-scan sonar mosaic of pockmarks on the Scotian Shelf. J. Can. J. Earth Sci. 1978, 15, 831–840. [Google Scholar] [CrossRef]
- Andresen, K.J.; Huuse, M.; Clausen, O.R. Morphology and distribution of Oligocene and Miocene pockmarks in the Danish North Sea—Implications for bottom current activity and fluid migration. Basin Res. 2008, 20, 445–466. [Google Scholar] [CrossRef]
- Vaknin, I.; Aharonov, E.; Holtzman, R.; Katz, O. Gas seepage and pockmark formation from subsurface reservoirs: Insights from table-top experiments. J. Geophys. Res. Solid Earth 2024, 129, e2023JB028255. [Google Scholar] [CrossRef]
- Chand, S.; Rise, L.; Ottesen, D.; Dolan, M.F.J.; Bellec, V.; Bøe, R. Pockmark-like depressions near the Goliat hydrocarbon field, Barents Sea: Morphology and genesis. Mar. Pet. Geol. 2009, 26, 1035–1042. [Google Scholar] [CrossRef]
- Micallef, A.; Spatola, D.; Caracausi, A.; Italiano, F.; Barreca, G.; D’Amico, S.; Petronio, L.; Coren, F.; Facchin, L.; Blanos, R.; et al. Active degassing across the Maltese Islands (Mediterranean Sea) and implications for its neotectonics. Mar. Pet. Geol. 2019, 104, 361–374. [Google Scholar] [CrossRef]
- Serié, C.; Huuse, M.; Schødt, N.H.; Brooks, J.M.; Williams, A. Subsurface fluid flow in the deep-water Kwanza Basin, offshore Angola. Basin Res. 2017, 29, 149–179. [Google Scholar] [CrossRef]
- Praeg, D.; Migeon, S.; Mascle, J.; Unnithan, V.; Wardell, N.; Geletti, R.; Ketzer, J. Geophysical evidence of gas hydrates associated with widespread gas venting on the central Nile Deep-Sea Fan, offshore Egypt. In Proceedings of the 9th International Conference on Gas Hydrates-ICGH9 2017, Denver, CO, USA, 25–30 June 2017. [Google Scholar]
- Kumar, A.; Cook, A.E.; Lawal, M.A.; Portnov, A.; Lecours, V. Pockmark occurrence in the northern Gulf of Mexico influenced by glacial cycles and hydrate stability. Geochem. Geophys. Geosyst. 2025, 26, e2024GC011781. [Google Scholar] [CrossRef]
- Bayrakci, G.; Bull, J.M.; Minshull, T.A.; Robinson, A.H.; Lavayssiere, A.; Illsley-Kemp, F.; Henstock, T.J.; Macdonald, C.; Chapman, M. Short-Duration Events Associated With Active Seabed Methane Venting: Scanner Pockmark, North Sea. Noisy Ocean. Monit. Seism. Acoust. Signals Mar. Environ. 2024, 9, 143–159. [Google Scholar]
- Miramontes, E.; Cattaneo, A.; Jouet, G.; Théreau, E.; Thomas, Y.; Rovere, M.; Cauquil, E.; Trincardi, F. The Pianosa Contourite Depositional System (Northern Tyrrhenian Sea): Drift morphology and Plio-Quaternary stratigraphic evolution. Mar. Geol. 2016, 378, 20–42. [Google Scholar] [CrossRef]
- Spatola, D.; Sulli, A.; Casalbore, D.; Chiocci, F.L. First Evidence of Contourite Drifts in the North-Western Sicilian Active Continental Margin (Southern Tyrrhenian Sea). J. Mar. Sci. Eng. 2021, 9, 1043. [Google Scholar] [CrossRef]
- Micallef, A.; Averes, T.; Hoffmann, J.; Crutchley, G.; Mountjoy, J.J.; Person, M.; Cohen, D.; Woelz, S.; Bury, S.J.; Ahaneku, C.V.; et al. Multiple drivers and controls of pockmark formation across the Canterbury Margin, New Zealand. Basin Res. 2022, 34, 1374–1399. [Google Scholar] [CrossRef]
- Zhu, S.; Li, X.; Zhang, H.; Sha, Z.; Sun, Z. Types, characteristics, distribution, and genesis of pockmarks in the South China Sea: Insights from high-resolution multibeam bathymetric and multichannel seismic data. Int. Geol. Rev. 2020, 63, 1682–1702. [Google Scholar] [CrossRef]
- Hammer, Ø.; Webb, K.E. Piston coring of Inner Oslofjord pockmarks, Norway: Constraints on age and mechanism. Nor. J. Geol./Nor. Geol. Foren. 2010, 90, 79–91. [Google Scholar]
- Plaza-Faverola, A.; Bünz, S.; Mienert, J. Repeated fluid expulsion through sub-seabed chimneys offshore Norway in response to glacial cycles. Earth Planet. Sci. Lett. 2011, 305, 297–308. [Google Scholar] [CrossRef]
- Hovland, M.; Judd, A.G.; Burke, R.A., Jr. The global flux of methane from shallow submarine sediments. Chemosphere 1993, 26, 559–578. [Google Scholar] [CrossRef]
- Lazar, M.; Schattner, U.; Reshef, M. The great escape: An intra-Messinian gas system in the eastern Mediterranean. Geophys. Res. Lett. 2012, 39. [Google Scholar] [CrossRef]
- Garcia-Castellanos, D.; Villaseñor, A. Messinian salinity crisis regulated by competing tectonics and erosion at the Gibraltar arc. Nature 2011, 480, 359–363. [Google Scholar] [CrossRef]
- León, R.; Somoza, L.; Medialdea, T.; González, F.J.; Gimenez-Moreno, C.J.; Pérez-López, R. Pockmarks on either side of the Strait of Gibraltar: Formation from overpressured shallow contourite gas reservoirs and internal wave action during the last glacial sea-level lowstand? Geo-Mar. Lett. 2014, 34, 131–151. [Google Scholar] [CrossRef]
- Micallef, A.; Berndt, C.; Debono, G. Fluid flow systems of the Malta Plateau, Central Mediterranean Sea. Mar. Geol. 2011, 284, 74–85. [Google Scholar] [CrossRef]
- Gay, A.; Lopez, M.; Berndt, C.; Séranne, M. Geological controls on focused fluid flow associated with seafloor seeps in the Lower Congo Basin. Mar. Geol. 2007, 244, 68–92. [Google Scholar] [CrossRef]
- Wilson, R.M.; Macelloni, L.; Simonetti, A.; Lapham, L.; Lutken, C.; Sleeper, K.; D’Emidio, M.; Pizzi, M.; Knapp, J.; Chanton, J. Subsurface methane sources and migration pathways within a gas hydrate mound system, Gulf of Mexico. Geochem. Geophys. Geosyst. 2014, 15, 89–107. [Google Scholar] [CrossRef]
- Dewey, J.F.; Helman, M.L.; Knott, S.D.; Turco, E.; Hutton, D.H.W. Kinematics of the western Mediterranean. Geol. Soc. Lond. Spec. Publ. 1989, 45, 265–283. [Google Scholar] [CrossRef]
- Knott, S.D.; Beach, A.; Brockbank, P.J.; Brown, J.L.; McCallum, J.E.; Welbon, A.I. Spatial and mechanical controls on normal fault populations. J. Struct. Geol. 1996, 18, 359–372. [Google Scholar] [CrossRef]
- Burnard, P.; Bourlange, S.; Henry, P.; Geli, L.; Tryon, M.D.; Natal’in, B.; Sengör, A.M.C.; Özeren, M.S.; Çagatay, M.N. Constraints on fluid origins and migration velocities along the Marmara Main Fault (Sea of Marmara, Turkey) using helium isotopes. Earth Planet. Sci. Lett. 2012, 341, 68–78. [Google Scholar] [CrossRef]
- Dogan, T.; Mori, T.; Tsunomori, F.; Notsu, K. Soil H2 and CO2 surveys at several active faults in Japan. Pure Appl. Geophys. 2007, 164, 2449–2463. [Google Scholar] [CrossRef]
- Saffer, D.M. The permeability of active subduction plate boundary faults. Geofluids 2015, 15, 193–215. [Google Scholar] [CrossRef]
- Fisher, Q.J.; Knipe, R.J. Fault sealing processes in siliciclastic sediments. Geol. Soc. Lond. Spec. Publ. 1998, 147, 117–134. [Google Scholar] [CrossRef]
- Lawal, M.A.; Cook, A.E. Gas migration phenomena and pockmark evolution in a Gulf of Mexico minibasin. Mar. Pet. Geol. 2025, 173, 107270. [Google Scholar] [CrossRef]
- Yu, K.; Lefebvre, A.; Li, W.; Zhan, W.; Miramontes, E. Channel inception through bottom-current erosion of pockmarks revealed by numerical simulation. Earth Surf. Process. Landf. 2023, 48, 2246–2259. [Google Scholar] [CrossRef]
- Cattaneo, A.; Miramontes, E.; Samalens, K.; Garreau, P.; Caillaud, M.; Marsset, B.; Corradi, N.; Migeon, S. Contourite identification along Italian margins: The case of the Portofino drift (Ligurian Sea). Mar. Pet. Geol. 2017, 87, 137–147. [Google Scholar] [CrossRef]
- Eruteya, O.E.; Reshef, M.; Ben-Avraham, Z.; Waldmann, N. Gas escape along the Palmachim disturbance in the Levant Basin, offshore Israel. Mar. Pet. Geol. 2018, 92, 868–879. [Google Scholar] [CrossRef]
- Hasiotis, T.; Papatheodorou, G.; Kastanos, N.; Ferentinos, G. A pockmark field in the Patras Gulf (Greece) and its activation during the 14/7/93 seismic event. Mar. Geol. 1996, 130, 333–344. [Google Scholar] [CrossRef]
- Broster, B.E.; Legere, C.L. Seafloor pockmarks and gas seepages, northwestern Bay of Fundy, New Brunswick, Canada. Atl. Geol. 2018, 54, 1–20. [Google Scholar] [CrossRef]
- Field, M.E.; Jennings, A.E. Seafloor gas seeps triggered by a northern California earthquake. Mar. Geol. 1987, 77, 39–51. [Google Scholar] [CrossRef]
- Fischer, D.; Mogollón, J.M.; Strasser, M.; Pape, T.; Bohrmann, G.; Fekete, N.; Spiess, V.; Kasten, S.J.N.G. Subduction zone earthquake as potential trigger of submarine hydrocarbon seepage. Nat. Geosci. 2013, 6, 647–651. [Google Scholar] [CrossRef]
- Abdelmaksoud, A.; Al-Suwaidi, A.H.; Ali, M.; Shah, A.; Almehairbi, S.S.; Al Ali, L.M.; Ali, M.Y. Evidence of pockmarks and seafloor gas venting in the northwestern Arabian Sea. Commun. Earth Environ. 2025, 6, 41. [Google Scholar] [CrossRef]
- Schneider von Deimling, J.; Hoffmann, J.; Geersen, J.; Koschinski, S.; Lohrberg, A.; Gilles, A.; Belkin, I.; Böttner, C.; Papenmeier, S.; Krastel, S. Millions of seafloor pits, not pockmarks, induced by vertebrates in the North Sea. Commun. Earth Environ. 2023, 4, 478. [Google Scholar] [CrossRef]
- Johnson, K.R.; Nelson, C.H. Side-scan sonar assessment of gray whale feeding in the Bering Sea. Science 1984, 225, 1150–1152. [Google Scholar] [CrossRef]
- Bertoni, C.; Kirkham, C.; Cartwright, J.; Hodgson, N.; Rodriguez, K. Seismic indicators of focused fluid flow and cross-evaporitic seepage in the Eastern Mediterranean. Mar. Pet. Geol. 2017, 88, 472–488. [Google Scholar] [CrossRef]
- Spatola, D.; Dahal, A.; Lombardo, L.; Casalbore, D.; Chiocci, F.L. First Pockmark susceptibility map of the Italian continental margins. Mar. Pet. Geol. 2025, 176, 107337. [Google Scholar] [CrossRef]
- Zeppilli, D.; Canals, M.; Danovaro, R. Pockmarks enhance deep-sea benthic biodiversity: A case study in the western Mediterranean Sea. Divers. Distrib. 2012, 18, 832–846. [Google Scholar] [CrossRef]
- Dalla Valle, G.; Gamberi, F. Pockmarks and seafloor instability in the Olbia continental slope (northeastern Sardinian margin, Tyrrhenian Sea). Mar. Geophys. Res. 2011, 32, 193–205. [Google Scholar] [CrossRef]
- Liu, Z.; Wu, Z.; Liu, Y.; Shang, J.; Zhou, J.; Zhang, J. Effects of slope instability on pockmark deformation on the continental slope in the southern South China Sea. Front. Mar. Sci. 2025, 12, 1605830. [Google Scholar] [CrossRef]
- Martínez-Vázquez, R.M.; Milán-García, J.; de Pablo Valenciano, J. Challenges of the Blue Economy: Evidence and research trends. Environ. Sci. Eur. 2021, 33, 61. [Google Scholar] [CrossRef]
- Stampfli, G.M.; Borel, G. A plate tectonic model for the Paleozoic and Mesozoic constrained by dynamic plate boundaries and restored synthetic oceanic isochrons. Earth Planet. Sci. Lett. 2002, 196, 17–33. [Google Scholar] [CrossRef]
- Cita, M. Anoxic basins of the eastern Mediterranean: An overview. Paleoceanography 1991, 6, 133–141. [Google Scholar] [CrossRef]
- Hsü, K.J.; Ryan, W.B.F.; Cita, M.B. Late miocene desiccation of the mediterranean. Nature 1973, 242, 240–244. [Google Scholar] [CrossRef]
- Catalano, R.; Di Stefano, P.; Sulli, A.; Vitale, F.P. Paleogeography and structure of the central Mediterranean: Sicily and its offshore area. Tectonophysics 1996, 260, 291–323. [Google Scholar] [CrossRef]
- Roveri, M.; Flecker, R.; Krijgsman, W.; Lofi, J.; Lugli, S.; Manzi, V.; Sierro, F.J.; Bertini, A.; Camerlenghi, A.; De Lange, G.; et al. The Messinian Salinity Crisis: Past and future of a great challenge for marine sciences. Mar. Geol. 2014, 352, 25–58. [Google Scholar] [CrossRef]
- Flecker, R.; Krijgsman, W.; Capella, W.; de Castro Martíns, C.; Dmitrieva, E.; Mayser, J.P.; Marzocchi, A.; Modestu, S.; Ochoa, D.; Simon, D.; et al. Evolution of the Late Miocene Mediterranean-Atlantic gateways and their impact on regional and global environmental change. Earth-Sci. Rev. 2015, 150, 365–392. [Google Scholar] [CrossRef]
- Carminati, E.; Wortel, M.J.R.; Spakman, W.; Sabadini, R. The role of slab detachment processes in the opening of the western–central Mediterranean basins: Some geological and geophysical evidence. Earth Planet. Sci. Lett. 1998, 160, 651–665. [Google Scholar] [CrossRef]
- Faccenna, C.; Piromallo, C.; Crespo-Blanc, A.; Jolivet, L.; Rossetti, F. Lateral slab deformation and the origin of the western Mediterranean arcs. Tectonics 2004, 23. [Google Scholar] [CrossRef]
- Rosenbaum, G.; Lister, G.S.; Duboz, C. Relative motions of Africa, Iberia and Europe during Alpine orogeny. Tectonophysics 2002, 359, 117–129. [Google Scholar] [CrossRef]
- Jolivet, L.; Faccenna, C. Mediterranean extension and the Africa-Eurasia collision. Tectonics 2000, 19, 1095–1106. [Google Scholar] [CrossRef]
- Séranne, M.; Benedicto, A.; Labaum, P.; Truffert, C.; Pascal, G. Structural style and evolution of the Gulf of Lion Oligo-Miocene rifting: Role of the Pyrenean orogeny. Mar. Pet. Geol. 1995, 12, 809–820. [Google Scholar] [CrossRef]
- Gay, A.; Cavailhès, T.; Grauls, D.; Marsset, B.; Marsset, T. Repeated fluid expulsions during events of rapid sea-level rise in the Gulf of Lion, western Mediterranean Sea. BSGF-Earth Sci. Bull. 2017, 188, 24. [Google Scholar] [CrossRef]
- Acosta, J.; Fontán, A.; Muñoz, A.; Muñoz-Martín, A.; Rivera, J.; Uchupi, E. The morpho-tectonic setting of the Southeast margin of Iberia and the adjacent oceanic Algero-Balearic Basin. Mar. Pet. Geol. 2013, 45, 17–41. [Google Scholar] [CrossRef]
- Pepe, F.; Sulli, A.; Bertotti, G.; Catalano, R. Structural highs formation and their relationship to sedimentary basins in the north Sicily continental margin (southern Tyrrhenian Sea): Implication for the Drepano Thrust Front. Tectonophysics 2005, 409, 1–18. [Google Scholar] [CrossRef]
- Carminati, E.; Doglioni, C. Alps vs. Apennines: The paradigm of a tectonically asymmetric Earth. Earth-Sci. Rev. 2012, 112, 67–96. [Google Scholar] [CrossRef]
- Catalano, R.; Doglioni, C.; Merlini, S. On the Mesozoic Ionian Basin. Geophys. J. Int. 2000, 143, 49–64. [Google Scholar] [CrossRef]
- Loreto, M.F.; Zitellini, N.; Ranero, C.R.; Palmiotto, C.; Prada, M. Extensional tectonics during the Tyrrhenian back-arc basin formation and a new morpho-tectonic map. Basin Res. 2021, 33, 138–158. [Google Scholar] [CrossRef]
- Argnani, A. Subduction evolution of the Dinarides and the Cretaceous orogeny in the Eastern Alps: Hints from a new paleotectonic interpretation. Tectonics 2018, 37, 621–635. [Google Scholar] [CrossRef]
- Maiorana, M.; Artoni, A.; Le Breton, E.; Sulli, A.; Chizzini, N.; Torelli, L. Is the Sicily Channel a simple Rifting Zone? New evidence from seismic analysis with geodynamic implications. Tectonophysics 2023, 864, 230019. [Google Scholar] [CrossRef]
- Corti, G.; Cuffaro, M.; Doglioni, C.; Innocenti, F.; Manetti, P. Coexisting geodynamic processes in the Sicily Channel. Spec. Pap.-Geol. Soc. Am. 2006, 409, 83. [Google Scholar]
- Robertson, A.H.; Parlak, O.; Ustaömer, T. Overview of the Palaeozoic–Neogene evolution of neotethys in the Eastern Mediterranean region (southern turkey, cyprus, Syria). Pet. Geosci. 2012, 18, 381–404. [Google Scholar] [CrossRef]
- Gardosh, M.A.; Garfunkel, Z.; Druckman, Y.; Buchbinder, B. Tethyan rifting in the Levant Region and its role in Early Mesozoic crustal evolution. In Evolution of the Levant Margin and Western Arabia Platform Since the Mesozoic; Geological Society of London: London, UK, 2010. [Google Scholar]
- Tassy, A.; Crouzy, E.; Gorini, C.; Rubino, J.-L.; Bouroullec, J.-L.; Sapin, F. Egyptian Tethyan margin in the Mesozoic: Evolution of a mixed carbonate-siliciclastic shelf edge (from Western Desert to Sinai). Mar. Pet. Geol. 2015, 68, 565–581. [Google Scholar] [CrossRef]
- Rouchy, J.M.; Caruso, A. The Messinian salinity crisis in the Mediterranean basin: A reassessment of the data and an integrated scenario. Sediment. Geol. 2006, 188–189, 35–67. [Google Scholar] [CrossRef]
- Caméra, L.; Ribodetti, A.; Mascle, J. Deep structures and seismic stratigraphy of the Egyptian continental margin from multichannel seismic data. In Evolution of the Levant Margin and Western Arabia Platform Since the Mesozoic; Geological Society of London: London, UK, 2010. [Google Scholar]
- Bosworth, W.; El-Hawat, A.S.; Helgeson, D.E.; Burke, K. Cyrenaican “shock absorber” and associated inversion strain shadow in the collision zone of northeast Africa. Geology 2008, 36, 695–698. [Google Scholar] [CrossRef]
- Gardosh, M.; Weimer, P.; Flexer, A. The sequence stratigraphy of Mesozoic successions in the Levant margin, southwestern Israel: A model for the evolution of southern Tethys margins. AAPG Bull. 2011, 95, 1763–1793. [Google Scholar] [CrossRef]
- Dolson, J.; Boucher, P.; Shann, M.V. Exploration Potential in the Offshore Mediterranean, Egypt-Perspectives from the Context of Egypt’s Future Resources and Business Challenges. In Proceedings of the EAGE Conference on Geology and Petroleum Geology of the Mediterranean and Circum-Mediterranean Basins, 2000, St. Julians, Malta, 1 October 2000; p. cp-109-00044. [Google Scholar]
- Jolivet, L.; Faccenna, C.; Huet, B.; Labrousse, L.; Le Pourhiet, L.; Lacombe, O.; Lecomte, E.; Burov, E.; Denèle, Y.; Brun, J.-P. Aegean tectonics: Strain localisation, slab tearing and trench retreat. Tectonophysics 2013, 597, 1–33. [Google Scholar] [CrossRef]
- Robinson, A.; Rudat, J.; Banks, C.; Wiles, R.J.M.; Geology, P. Petroleum geology of the Black Sea. Mar. Pet. Geol. 1996, 13, 195–223. [Google Scholar] [CrossRef]
- Thierry, S.; Dick, S.; George, S.; Benoit, L.; Cyrille, P. EMODnet Bathymetry a Compilation of Bathymetric Data in the European Waters; IEEE: New York, NY, USA, 2019; pp. 1–7. [Google Scholar]
- Sampietro, D.; Capponi, M.; Thébault, E.; Gailler, L. An enhanced view on the Mediterranean Sea crust from potential fields data. Sci. Rep. 2023, 13, 8298. [Google Scholar] [CrossRef]
- Bigi, G.; Cosentino, D.; Parotto, M.; Sartori, R.; Scandone, P. Structural model of Italy 1:500,000. CNR Progett. Final. Geodin. 1992. [Google Scholar]
- Garcia-Garcia, A.; Orange, D.; Lorenson, T.; Radakovitch, O.; Tesi, T.; Miserocchi, S.; Berne, S.; Friend, P.L.; Nittrouer, C.; Normand, A. Shallow gas off the Rhône prodelta, Gulf of Lions. Mar. Geol. 2006, 234, 215–231. [Google Scholar] [CrossRef]
- Spatola, D.; Micallef, A.; Sulli, A.; Basilone, L.; Basilone, G. Evidence of active fluid seepage (AFS) in the southern region of the central Mediterranean Sea. Measurement 2018, 128, 247–253. [Google Scholar] [CrossRef]
- Loncke, L.; Mascle, J. Mud volcanoes, gas chimneys, pockmarks and mounds in the Nile deep-sea fan (Eastern Mediterranean): Geophysical evidences. Mar. Pet. Geol. 2004, 21, 669–689. [Google Scholar] [CrossRef]
- Rovere, M.; Gamberi, F.; Mercorella, A.; Rashed, H.; Gallerani, A.; Leidi, E.; Marani, M.; Funari, V.; Pini, G.A. Venting and seepage systems associated with mud volcanoes and mud diapirs in the southern Tyrrhenian Sea. Mar. Geol. 2014, 347, 153–171. [Google Scholar] [CrossRef]
- Aloisi, G.; Pierre, C.; Rouchy, J.M.; Foucher, J.P.; Woodside, J. Methane-related authigenic carbonates of eastern Mediterranean Sea mud volcanoes and their possible relation to gas hydrate destabilisation. Earth Planet. Sci. Lett. 2000, 184, 321–338. [Google Scholar] [CrossRef]
- Ercilla, G.; Díaz, J.I.; Alonso, B.; Farran, M. Late Pleistocene-Holocene sedimentary evolution of the northern Catalonia continental shelf (northwestern Mediterranean Sea). Cont. Shelf Res. 1995, 15, 1435–1451. [Google Scholar] [CrossRef]
- García-Gil, S.; Durán, R.; Ramírez-Pérez, A.M. Gas somero en el margen continental Ibérico. Bol. Geol. Min. 2015, 126, 575–608. [Google Scholar]
- Riboulot, V.; Thomas, Y.; Berné, S.; Jouet, G.; Cattaneo, A. Control of Quaternary sea-level changes on gas seeps. Geophys. Res. Lett. 2014, 41, 4970–4977. [Google Scholar] [CrossRef]
- Sansoucy, M. Recent sedimentary processes in the Cap de Creus canyon head and adjacent continental shelf, NE Spain: Evidence from multibeam bathymetry, sub-bottom profiles and coring. Sediments Morphol. Sediment. Process. Cont. Shelves Adv. Technol. Res. Appl. 2012, 44, 71–98. [Google Scholar]
- Muñoz, A.; Lastras, G.; Ballesteros, M.; Canals, M.; Acosta, J.; Uchupi, E. Sea floor morphology of the Ebro Shelf in the region of the Columbretes Islands, Western Mediterranean. Geomorphology 2005, 72, 1–18. [Google Scholar] [CrossRef]
- Frey-Martínez, J.; Bertoni, C.; Gerard, J.; Matías, H. Processes of submarine slope failure and fluid migration on the Ebro continental margin: Implications for offshore exploration and development. SEPM Spec. Publ. 2011, 96, 181–198. [Google Scholar]
- Maestro González, A.; Bohoyo, F.; Acosta Rivera, J.J.; Gomez-Ballesteros, M.; Llave, E.; Muñoz Cubillo, Á.; Terrinha, P.; Domínguez Morales, M.; Fernández Sáez, F.; López Martínez, J. Influencia de los procesos tectónicos y volcánicos en la morfología de los márgenes continentales ibéricos. Bol. Geol. Min. 2015, 126, 427–482. [Google Scholar]
- Acosta, J.; Muñoz, A.; Herranz, P.; Palomo, C.; Ballesteros, M.; Vaquero, M.; Uchupi, E. Pockmarks in the Ibiza Channel and western end of the Balearic Promontory (western Mediterranean) revealed by multibeam mapping. Geo-Mar. Lett. 2001, 21, 123–130. [Google Scholar]
- Lastras, G.; Canals, M.; Urgeles, R.; Hughes-Clarke, J.E.; Acosta, J. Shallow slides and pockmark swarms in the Eivissa Channel, western Mediterranean Sea. Sedimentology 2004, 51, 837–850. [Google Scholar] [CrossRef]
- Somoza, L.; Medialdea, T.; León, R.; Ercilla, G.; Vázquez, J.T.; Hernández-Molina, J.; González, J.; Juan, C.; Fernández-Puga, M.C. Structure of mud volcano systems and pockmarks in the region of the Ceuta Contourite Depositional System (Western Alborán Sea). Mar. Geol. 2012, 332, 4–26. [Google Scholar] [CrossRef]
- Ercilla, G.; Vázquez, J.-T.; Alonso, B.; Bárcenas, P.; Casas, D.; d’Acremont, E.; Estrada, F.; Fernández-Salas, L.M.; Galindo-Zaldívar, J.; Juan, C. Seafloor morphology and processes in the Alboran Sea. In Alboran Sea-Ecosystems and Marine Resources; Springer: Berlin/Heidelberg, Germany, 2021; pp. 157–205. [Google Scholar]
- Ercilla, G.; Casas, D.; Iglesias, J.; Vázquez, J.T.; Somoza, L.; León, R.; Medialdea, T.; Juan, C.; García, M. Contourites in the Galicia Bank region (NW Iberian Atlantic). GeoTemas 2010, 11, 33–34. [Google Scholar]
- Miramontes, E.; Garreau, P.; Caillaud, M.; Jouet, G.; Pellen, R.; Hernández-Molina, F.J.; Clare, M.A.; Cattaneo, A. Contourite distribution and bottom currents in the NW Mediterranean Sea: Coupling seafloor geomorphology and hydrodynamic modelling. Geomorphology 2019, 333, 43–60. [Google Scholar] [CrossRef]
- Spatola, D.; Casalbore, D.; Pierdomenico, M.; Conti, A.; Bigi, S.; Ingrassia, M.; Ivaldi, R.; Demarte, M.; Napoli, S.; Chiocci, F. Seafloor characterisation of the offshore sector around Scoglio d’Affrica islet (Tuscan Archipelago, northern Tyrrhenian Sea). J. Maps 2023, 19, 2120836. [Google Scholar] [CrossRef]
- Saroni, A.; Maurantonio, F.; Casalbore, D.; Chiocci, F.L.; Cimenti, E.; Coltorti, M.; Demarte, M.; Pierdomenico, M.; Spatola, D.; Ivaldi, R. Seafloor morphology and recent dynamics in the Scoglio d’Affrica (Northern Tyrrhenian Sea). Mar. Geol. 2025, 484, 107518. [Google Scholar] [CrossRef]
- Saroni, A.; Sciarra, A.; Grassa, F.; Eich, A.; Weber, M.; Lott, C.; Ferretti, G.; Ivaldi, R.; Coltorti, M. Shallow submarine mud volcano in the northern Tyrrhenian sea, Italy. Appl. Geochem. 2020, 122, 104722. [Google Scholar] [CrossRef]
- Nardelli, B.B.; Budillon, F.; Watteaux, R.; Ciccone, F.; Conforti, A.; De Falco, G.; Di Martino, G.; Innangi, S.; Tonielli, R.; Iudicone, D. Pockmark morphology and turbulent buoyant plumes at a submarine spring. Cont. Shelf Res. 2017, 148, 19–36. [Google Scholar] [CrossRef]
- Rovere, M.; Rashed, H.; Pecchioni, E.; Ceregato, A.; Gamberi, F.; Vaselli, O. Normal faults control fluid flow structures and cold seep habitats at the rear of the Calabrian Arc (Paola Ridge, southeastern Tyrrhenian Sea). Geophysical Research. In Geophysical Reserach Abstract; EGU: Munich, Germany, 2014; p. 1. [Google Scholar]
- Hovland, M.; Curzi, P.V. Gas seepage and assumed mud diapirism in the Italian central Adriatic Sea. Mar. Pet. Geol. 1989, 6, 161–169. [Google Scholar] [CrossRef]
- Donda, F.; Tinivella, U.; Gordini, E.; Panieri, G.; Volpi, V.; Civile, D.; Forlin, E.; Facchin, L.; Burca, M.; Cova, A. The origin of gas seeps in the Northern Adriatic Sea. Ital. J. Geosci. 2019, 138, 171–183. [Google Scholar] [CrossRef]
- Donda, F.; Forlin, E.; Gordini, E.; Panieri, G.; Buenz, S.; Volpi, V.; Civile, D.; De Santis, L. Deep-sourced gas seepage and methane-derived carbonates in the Northern Adriatic Sea. Basin Res. 2015, 27, 531–545. [Google Scholar] [CrossRef]
- Taviani, M.; Franchi, F.; Angeletti, L.; Correggiari, A.; López-Correa, M.; Maselli, V.; Mazzoli, C.; Peckmann, J. Biodetrital carbonates on the Adriatic continental shelf imprinted by oxidation of seeping hydrocarbons. Mar. Pet. Geol. 2015, 66, 511–531. [Google Scholar] [CrossRef]
- Rovere, M.; Mercorella, A.; Frapiccini, E.; Funari, V.; Spagnoli, F.; Pellegrini, C.; Bonetti, A.S.; Veneruso, T.; Tassetti, A.N.; Dell’Orso, M. Geochemical and Geophysical Monitoring of Hydrocarbon Seepage in the Adriatic Sea. Sensors 2020, 20, 1504. [Google Scholar] [CrossRef]
- Pikelj, K.; Hernitz-Kučenjak, M.; Aščić, Š.; Juračić, M. Surface sediment around the Jabuka Islet and the Jabuka Shoal: Evidence of Miocene tectonics in the Central Adriatic Sea. Mar. Geol. 2015, 359, 120–133. [Google Scholar] [CrossRef]
- Holland, C.W.; Etiope, G.; Milkov, A.V.; Michelozzi, E.; Favali, P. Mud volcanoes discovered offshore Sicily. Mar. Geol. 2003, 199, 1–6. [Google Scholar] [CrossRef]
- Maiorana, M.; Spatola, D.; Todaro, S.; Caldareri, F.; Parente, F.; Severini, A.; Sulli, A. Seismo-stratigraphic and morpho-bathymetric analysis revealing recent fluid-rising phenomena on the Adventure Plateau (northwestern Sicily Channel). Mar. Geophys. Res. 2024, 45, 15. [Google Scholar] [CrossRef]
- Spatola, D.; Sulli, A.; Basilone, L.; Casalbore, D.; Napoli, S.; Basilone, G.; Chiocci, F.L. Morphology of the submerged Ferdinandea Island, the ‘Neverland’of the Sicily Channel (central Mediterranean Sea). J. Maps 2023, 19, 2243305. [Google Scholar] [CrossRef]
- Coltelli, M.; Cavallaro, D.; D’Anna, G.; D’Alessandro, A.; Grassa, F.; Mangano, G.; Patanè, D.; Gresta, S. Exploring the submarine graham bank in the sicily channel. Ann. Geophys. 2016, 59, S0208. [Google Scholar] [CrossRef]
- Innangi, S.; Tonielli, R.; Romagnoli, C.; Budillon, F.; Di Martino, G.; Innangi, M.; Laterza, R.; Le Bas, T.; Iacono, C.L. Seabed mapping in the Pelagie Islands marine protected area (Sicily Channel, Southern Mediterranean) using Remote Sensing object based image analysis (RSOBIA). Mar. Geophys. Res. 2019, 40, 333–355. [Google Scholar] [CrossRef]
- Tonielli, R.; Innangi, S.; Di Martino, G.; Romagnoli, C. New bathymetry of the Linosa volcanic complex from multibeam systems (Sicily Channel, Mediterranean Sea). J. Maps 2019, 15, 611–618. [Google Scholar] [CrossRef]
- Papatheodorou, G.; Geraga, M.; Christodoulou, D.; Sergiou, S.; Fakiris, E.; Pagoulatos, A.; Oikonomopoulos, I.; Sotiropoulos, S.; Tripsanas, E.; Stathopoulou, A. Deep-Water Pockmarks in the Kyparissiakos Gulf (S. Ionian Sea) and Geochemical Evidence for Methane Seepage. In Proceedings of the Fourth EAGE Eastern Mediterranean Workshop, 2023, Athens, Greece, 4–6 December 2023; pp. 1–3. [Google Scholar]
- Papatheodorou, G.; Hasiotis, T.; Ferentinos, G.M.G. Gas-charged sediments in the Aegean and Ionian Seas, Greece. Mar. Geol. 1993, 112, 171–184. [Google Scholar] [CrossRef]
- Kordella, S.; Christodoulou, D.; Fakiris, E.; Geraga, M.; Kokkalas, S.; Marinaro, G.; Iatrou, M.; Ferentinos, G.; Papatheodorou, G. Gas seepage-induced features in the hypoxic/anoxic, shallow, marine environment of amfilochia bay, amvrakikos gulf (Western Greece). Geosciences 2021, 11, 27. [Google Scholar] [CrossRef]
- Christodoulou, D.; Papatheodorou, G.; Geraga, M.; Etiope, G.; Giannopoulos, N.; Kokkalas, S.; Dimas, X.; Fakiris, E.; Sergiou, S.; Georgiou, N. Geophysical and geochemical exploration of the pockmark field in the Gulf of Patras: New insights on formation, growth and activity. Appl. Sci. 2023, 13, 10449. [Google Scholar] [CrossRef]
- Fakiris, E.; Papatheodorou, G.; Christodoulou, D.; Roumelioti, Z.; Sokos, E.; Geraga, M.; Giannakopoulos, V.; Dimas, X.; Ferentinos, G. Using Distributed Temperature Sensing for Long-Term Monitoring of Pockmark Activity in the Gulf of Patras (Greece): Data Processing Hints and Preliminary Findings. Sensors 2023, 23, 8520. [Google Scholar] [CrossRef]
- Dimitrov, L.; Woodside, J. Deep sea pockmark environments in the eastern Mediterranean. Mar. Geol. 2003, 195, 263–276. [Google Scholar] [CrossRef]
- Ivanov, M.K.; Limonov, A.F.; van Weering, T.C.E. Comparative characteristics of the Black Sea and Mediterranean Ridge mud volcanoes. Mar. Geol. 1996, 132, 253–271. [Google Scholar] [CrossRef]
- Newton, R.; Smith, J.; Windley, B. Carbonic metamorphism, granulites and crustal growth. Nature 1980, 288, 45–50. [Google Scholar] [CrossRef]
- Bayon, G.; Loncke, L.; Dupré, S.; Caprais, J.C.; Ducassou, E.; Duperron, S.; Etoubleau, J.; Foucher, J.P.; Fouquet, Y.; Gontharet, S. Multi-disciplinary investigation of fluid seepage on an unstable margin: The case of the Central Nile deep sea fan. Mar. Geol. 2009, 261, 92–104. [Google Scholar] [CrossRef]
- Moss, J.L.; Cartwright, J.; Moore, R. Evidence for fluid migration following pockmark formation: Examples from the Nile Deep Sea Fan. Mar. Geol. 2012, 303, 1–13. [Google Scholar] [CrossRef]
- Sisma-Ventura, G.; Bialik, O.M.; Makovsky, Y.; Rahav, E.; Ozer, T.; Kanari, M.; Marmen, S.; Belkin, N.; Guy-Haim, T.; Antler, G. Cold seeps alter the near-bottom biogeochemistry in the ultraoligotrophic Southeastern Mediterranean Sea. Deep. Sea Res. Part I Oceanogr. Res. Pap. 2022, 183, 103744. [Google Scholar] [CrossRef]
- Korsakov, O.D.; Byakov, Y.A.; Stupak, S.N. Gas hydrates in the Black Sea basin. Int. Geol. Rev. 1989, 31, 1251–1257. [Google Scholar] [CrossRef]
- Dimitrov, L.; Dontcheva, V. Seabed pockmarks in the southern Bulgarian Black Sea zone. Bull. Geol. Soc. Den. 1994, 41, 24–33. [Google Scholar] [CrossRef]
- Riedel, M.; Hähnel, L.; Bialas, J.; Bachmann, A.K.; Gaide, S.; Wintersteller, P.; Klaucke, I.; Bohrmann, G. Controls on Gas Emission Distribution on the Continental Slope of the Western Black Sea. Front. Earth Sci. 2021, 8, 601254. [Google Scholar] [CrossRef]
- Ker, S.; Thomas, Y.; Riboulot, V.; Sultan, N.; Bernard, C.; Scalabrin, C.; Ion, G.; Marsset, B. Anomalously deep BSR related to a transient state of the gas hydrate system in the western Black Sea. Geochem. Geophys. Geosyst. 2019, 20, 442–459. [Google Scholar] [CrossRef]
- Panin, N.; Jipa, D. Danube River sediment input and its interaction with the north-western Black Sea. Estuar. Coast. Shelf Sci. 2002, 54, 551–562. [Google Scholar] [CrossRef]
- Hillman, J.I.; Klaucke, I.; Bialas, J.; Feldman, H.; Drexler, T.; Awwiller, D.; Atgin, O.; Cifci, G.; Badhani, S. Gas migration pathways and slope failures in the Danube Fan, Black Sea. Mar. Pet. Geol. 2018, 92, 1069–1084. [Google Scholar] [CrossRef]
- Riboulot, V.; Cattaneo, A.; Scalabrin, C.; Gaillot, A.; Jouet, G.; Ballas, G.; Marsset, T.; Garziglia, S.; Ker, S. Control of the geomorphology and gas hydrate extent on widespread gas emissions offshore Romania. Bull. Soc. Geol. Fr. 2017, 188, 26. [Google Scholar] [CrossRef]
- Pape, T.; Ruffine, L.; Hong, W.L.; Sultan, N.; Riboulot, V.; Peters, C.A.; Kölling, M.; Zabel, M.; Garziglia, S.; Bohrmann, G. Shallow gas hydrate accumulations at a Nigerian deepwater pockmark—Quantities and dynamics. J. Geophys. Res. Solid Earth 2020, 125, e2019JB018283. [Google Scholar] [CrossRef]
- Cifci, G.; Kruglyakov, V.; Ergun, M.; Pomomoryov, I. Acoustic anomalies in gas saturated-shallow sediments in the Eastern Black Sea. In Proceedings of the Proceedings of the 12th International Petroleum Congress and Exhibition of Turkey, Istanbul, Turkey, 12–15 October 1998; pp. 400–411. [Google Scholar]
- Limonov, A.F.; Woodside, J.M.; Cita, M.B.; Ivanov, M.K. The Mediterranean Ridge and related mud diapirism: A background. Mar. Geol. 1996, 132, 7–19. [Google Scholar] [CrossRef]
- Dupré, S.; Loubrieu, B.; Pierre, C.; Scalabrin, C.; Guérin, C.; Ehrhold, A.; Ogor, A.; Gautier, E.; Ruffine, L.; Biville, R. The Aquitaine Shelf edge (Bay of Biscay): A primary outlet for microbial methane release. Geophys. Res. Lett. 2020, 47, e2019GL084561. [Google Scholar] [CrossRef]
- Hampton, M.A.; Lee, H.J.; Locat, J. Submarine landslides. Rev. Geophys. 1996, 34, 33–59. [Google Scholar] [CrossRef]
- Bertoni, C.; Cartwright, J.; Hermanrud, C. Evidence for large-scale methane venting due to rapid drawdown of sea level during the Messinian Salinity Crisis. Geology 2013, 41, 371–374. [Google Scholar] [CrossRef]
- Mascle, J.; Mary, F.; Praeg, D.; Brosolo, L.; Camera, L.; Ceramicola, S.; Dupré, S. Distribution and geological control of mud volcanoes and other fluid/free gas seepage features in the Mediterranean Sea and nearby Gulf of Cadiz. Geo-Mar. Lett. 2014, 34, 89–110. [Google Scholar] [CrossRef]
- Napoli, S.; Spatola, D.; Casalbore, D.; Chiocci, F.L. Geomorphometric Analysis of Submarine Mud Volcanoes: Variability, Evolutionary Trends, and Geohazard Implications. J. Mar. Sci. Eng. 2025, 13, 622. [Google Scholar] [CrossRef]
- Sibson, R.H. Structural permeability of fluid-driven fault-fracture meshes. J. Struct. Geol. 1996, 18, 1031–1042. [Google Scholar] [CrossRef]
- Bonini, M. Seismic loading of fault-controlled fluid seepage systems by great subduction earthquakes. Sci. Rep. 2019, 9, 11332. [Google Scholar] [CrossRef]
- Lo Iacono, C.L.; Sulli, A.; Agate, M.; Lo Presti, V.; Pepe, F.; Catalano, R. Submarine canyon morphologies in the Gulf of Palermo (Southern Tyrrhenian Sea) and possible implications for geo-hazard. Mar. Geophys. Res. 2011, 32, 127–138. [Google Scholar] [CrossRef]
- Savini, A. Side-scan sonar as a tool for seafloor imagery: Examples from the Mediterranean Continental Margin. Sonar Syst. 2011, 14, 299–322. [Google Scholar]
- Savini, A.; Malinverno, E.; Etiope, G.; Tessarolo, C.; Corselli, C. Shallow seep-related seafloor features along the Malta plateau (Sicily channel—Mediterranean Sea): Morphologies and geo-environmental control of their distribution. Mar. Pet. Geol. 2009, 26, 1831–1848. [Google Scholar] [CrossRef]
- Spatola, D.; Micallef, A.; Sulli, A.; Basilone, L.; Ferreri, R.; Basilone, G.; Bonanno, A.; Pulizzi, M.; Mangano, S. The Graham Bank (Sicily Channel, central Mediterranean Sea): Seafloor signatures of volcanic and tectonic controls. Geomorphology 2018, 318, 375–389. [Google Scholar] [CrossRef]
- Naudts, L.; Greinert, J.; Artemov, Y.; Staelens, P.; Poort, J.; Van Rensbergen, P.; De Batist, M. Geological and morphological setting of 2778 methane seeps in the Dnepr paleo-delta, northwestern Black Sea. Mar. Geol. 2006, 227, 177–199. [Google Scholar] [CrossRef]
- Daskalopoulou, K.; D’Alessandro, W.; Longo, M.; Pecoraino, G.; Calabrese, S. Shallow Sea Gas Manifestations in the Aegean Sea (Greece) as Natural Analogs to Study Ocean Acidification: First Catalog and Geochemical Characterization. Front. Mar. Sci. 2022, 8, 775247. [Google Scholar] [CrossRef]
- Jatiault, R.; Henry, P.; Loncke, L.; Sadaoui, M.; Sakellariou, D. Natural oil seep systems in the Aegean Sea. Mar. Pet. Geol. 2024, 163, 106754. [Google Scholar] [CrossRef]
- Christodoulou, D.; Papatheodorou, G.; Ferentinos, G.; Masson, M. Active seepage in two contrasting pockmark fields in the Patras and Corinth gulfs, Greece. Geo-Mar. Lett. 2003, 23, 194–199. [Google Scholar] [CrossRef]
- Gold, T.; Soter, S. Fluid ascent through the solid lithosphere and its relation to earthquakes. Pure Appl. Geophys. 1984, 122, 492–530. [Google Scholar] [CrossRef]
- Soter, S. Macroscopic seismic anomalies and submarine pockmarks in the Corinth–Patras rift, Greece. Tectonophysics 1999, 308, 275–290. [Google Scholar] [CrossRef]
- Dupré, S.; Scalabrin, C.; Grall, C.; Augustin, J.M.; Henry, P.; Şengör, A.M.C.; Görür, N.; Çağatay, M.N.; Géli, L. Tectonic and sedimentary controls on widespread gas emissions in the Sea of Marmara: Results from systematic, shipborne multibeam echo sounder water column imaging. J. Geophys. Res. Solid Earth 2015, 120, 2891–2912. [Google Scholar] [CrossRef]
- Di Bella, L.; Pierdomenico, M.; Conte, A.M.; Cornacchia, I.; Ruspandini, T.; Spatola, D.; Beaubien, S.E.; Bigi, S.; Conti, A.; Gaglianone, G. The influence of shallow-water methane emissions on foraminiferal assemblages: The case of Scoglio d’Affrica (Northern Tyrrhenian Sea, Mediterranean Sea). Mar. Pet. Geol. 2024, 170, 107130. [Google Scholar] [CrossRef]
- Sumida, P.Y.G.; Yoshinaga, M.Y.; Madureira, L.A.S.-P.; Hovland, M. Seabed pockmarks associated with deepwater corals off SE Brazilian continental slope, Santos Basin. Mar. Geol. 2004, 207, 159–167. [Google Scholar] [CrossRef]
- Webb, K.E.; Barnes, D.K.A.; Plankea, S. Pockmarks: Refuges for marine benthic biodiversity. Limnol. Oceanogr. 2009, 54, 1776–1788. [Google Scholar] [CrossRef]
- Webb, K.E.; Barnes, D.K.; Gray, J.S. Benthic ecology of pockmarks in the Inner Oslofjord, Norway. Mar. Ecol. Prog. Ser. 2009, 387, 15–25. [Google Scholar]
- Brodecka-Goluch, A.; Łukawska-Matuszewska, K.; Idczak, J.; Borkowski, A.; Rzepa, G.; Manecki, M. Laboratory of the Biogeochemical Cycle of Elements. In How Can Activity of Deepwater Pockmarks Modify Benthic Environmental Conditions? A Case Study from the Gulf of Gdańsk; Laboratory of the Biogeochemical Cycle of Elements: Philadelphia, PA, USA, 2025. [Google Scholar]
- Dickens, G.R. Rethinking the global carbon cycle with a large, dynamic and microbially mediated gas hydrate capacitor. Earth Planet. Sci. Lett. 2003, 213, 169–183. [Google Scholar] [CrossRef]
- Saunois, M.; Bousquet, P.; Poulter, B.; Peregon, A.; Ciais, P.; Canadell, J.G.; Dlugokencky, E.J.; Etiope, G.; Bastviken, D.; Houweling, S. The global methane budget 2000–2012. Earth Syst. Sci. Data 2016, 8, 697–751. [Google Scholar] [CrossRef]
- Coll, M.; Piroddi, C.; Steenbeek, J.; Kaschner, K.; Ben Rais Lasram, F.; Aguzzi, J.; Ballesteros, E.; Bianchi, C.N.; Corbera, J.; Dailianis, T. The biodiversity of the Mediterranean Sea: Estimates, patterns, and threats. PLoS ONE 2010, 5, e11842. [Google Scholar] [CrossRef]
- Cambon-Bonavita, M.-A.; Nadalig, T.; Roussel, E.; Delage, E.; Duperron, S.; Caprais, J.-C.; Boetius, A.; Sibuet, M. Diversity and distribution of methane-oxidizing microbial communities associated with different faunal assemblages in a giant pockmark of the Gabon continental margin. Deep. Sea Res. Part II Top. Stud. Oceanogr. 2009, 56, 2248–2258. [Google Scholar] [CrossRef]
- Zvi-Kedem, T.; Martinez, S.; Shemesh, E.; Lalzar, M.; Guy-Haim, T.; Sisma-Ventura, G.; Makovsky, Y.; Tchernov, D.; Rubin-Blum, M. Shark eggs contribute to the trophic ecology of a cold-seep chemosynthetic ecosystem. Mar. Ecol. Prog. Ser. 2025, 756, 71–81. [Google Scholar] [CrossRef]
- Wang, H.; Jiang, J.; Ali, M.; Liu, X.; Wang, K.; Liu, J. Multi-parameter coupling effects on plume morphology and pockmark development induced by submarine shallow gas leakage. Front. Mar. Sci. 2025, 12, 1645893. [Google Scholar] [CrossRef]
- Stott, L.; Davy, B.; Shao, J.; Coffin, R.; Pecher, I.; Neil, H.; Rose, P.; Bialas, J. CO2 release from pockmarks on the Chatham Rise-Bounty Trough at the glacial termination. Paleoceanogr. Paleoclimatol. 2019, 34, 1726–1743. [Google Scholar] [CrossRef]
- Prabhakaran, N.; Gupta, G.V.M.; Kumar, B.S.K. A critical review on ocean acidification driven by disinfection by-products discharge from ships’ ballast water management systems: Impacts on carbon chemistry. Mar. Pollut. Bull. 2025, 217, 118029. [Google Scholar] [CrossRef]
- Böttner, C.; Hoffmann, J.J.L.; Unverricht, D.; Schmidt, M.; Spiegel, T.; Geersen, J.; Müller, T.H.; Karstens, J.; Andresen, K.J.; Sander, L. The enigmatic pockmarks of the sandy southeastern North Sea. Geochem. Geophys. Geosyst. 2024, 25, e2024GC011837. [Google Scholar] [CrossRef]
- Rise, L.; Sættem, J.; Fanavoll, S.; Thorsnes, T.; Ottesen, D.; Bøe, R. Sea-bed pockmarks related to fluid migration from Mesozoic bedrock strata in the Skagerrak offshore Norway. Mar. Pet. Geol. 1999, 16, 619–631. [Google Scholar] [CrossRef]
Disclaimer/Publisher’s Note: The statements, opinions and data contained in all publications are solely those of the individual author(s) and contributor(s) and not of MDPI and/or the editor(s). MDPI and/or the editor(s) disclaim responsibility for any injury to people or property resulting from any ideas, methods, instructions or products referred to in the content. |
© 2025 by the authors. Licensee MDPI, Basel, Switzerland. This article is an open access article distributed under the terms and conditions of the Creative Commons Attribution (CC BY) license (https://creativecommons.org/licenses/by/4.0/).