Simple Summary
The deposition of fat in beef cattle directly impacts meat yield and quality. To better understand the regulation of adipocyte (fat cell) development, this study focused on a gene called SCD5. We found that SCD5 acts as a “brake” in the formation of bovine fat cells: enhancing its activity slowed down the multiplication of fat cell precursors and their ability to store fat, whereas reducing its activity accelerated these processes. Further investigation into the mechanism revealed that SCD5 exerts this braking effect by suppressing a key signaling pathway known as WNT5B/β-catenin. In conclusion, our work identifies SCD5 as a crucial negative regulator of fat formation in cattle. This discovery provides new insights into the biology of fat deposition in livestock and suggests a novel target for future breeding strategies aimed at improving meat quality and yield.
Abstract
This study investigated the role of SCD5 in bovine preadipocyte proliferation and adipogenic differentiation. SCD5 overexpression suppressed proliferation, reducing the percentage of EdU-positive cells and overall cell viability (p < 0.05). It also downregulated proliferative factors CDK1 and CDK2 (p < 0.05), and reduced lipid accumulation (p < 0.001) along with key adipogenic markers PPARγ, C/EBPα, and FABP4 (p < 0.01). Conversely, SCD5 knockdown promoted these processes. Mechanistically, SCD5 overexpression downregulated WNT5B (p < 0.05), while knockdown had the opposite effect. Silencing WNT5B significantly decreased β-catenin transcription (p < 0.05), total protein (p < 0.05), and phosphorylation (p < 0.001). In conclusion, our findings identify SCD5 as a novel negative regulator of bovine preadipocyte proliferation and differentiation, which exerts its function through the WNT5B/β-catenin signaling axis. This discovery elucidates previously uncharacterized regulatory mechanisms underlying adipogenesis in livestock species.
1. Introduction
The intramuscular fat (IMF) content within beef serves as a pivotal factor in determining both its quality and market price. IMF denotes the adipose tissue that accumulates within the muscular structure, predominantly localized within the epimysium, perimysium, and endomysium layers. The deposition of intramuscular fat (IMF) arises from the intricate process of fat metabolism in cattle and is modulated by a multitude of factors, including breed, age, nutritional status, and gender, among which breed emerges as the most pivotal determinant [1]. The identification of key regulators of IMF deposition and the mechanistic understanding of their roles are therefore crucial for molecular breeding strategies aimed at improving beef quality.
The development of omics technologies has accelerated the discovery of genes regulating fat deposition. To identify such genes for intramuscular fat (IMF), we performed RNA sequencing using longissimus dorsi muscle samples from Xinjiang Brown cattle with varying IMF content. These findings identified a robust positive correlation between SCD5 transcript abundance and intramuscular fat content, supporting its role as a candidate gene influencing this trait [2]. Given its role as the rate-limiting enzyme in monounsaturated fatty acid synthesis, SCD5 is strategically positioned to directly regulate adipogenesis. SCD5, an enzyme termed Δ9-desaturase, governs adipogenesis by catalyzing the rate-limiting step in MUFA synthesis, namely the conversion of its substrates palmitic and stearic acids into their products palmitoleic and oleic acids, respectively [3]. In cattle, SCD is expressed in key metabolic tissues—including adipose tissue, muscle, and mammary gland—where it centrally regulates lipid metabolism and deposition. SCD1 and SCD5 represent the two primary SCD isoforms in cattle. SCD1 has an established pro-adipogenic role, in contrast to the incompletely understood function of SCD5 [4,5,6]. While existing evidence suggests the role of SCD5 may be breed-dependent [7,8], its specific function and regulatory mechanisms during bovine preadipocyte proliferation and differentiation remain incompletely understood.
Rios-Esteves and Resh demonstrated that SCD inhibition impairs WNT/β-catenin signaling by reducing palmitic acid availability, which is essential for proper pathway transduction [9,10]. The canonical WNT signaling cascade, mediated by β-catenin, plays a well-established role in suppressing adipocyte differentiation within adipose tissue [11]. The role of the non-canonical ligand WNT5B in adipogenesis remains controversial. Some studies report that WNT5B inhibits differentiation through β-catenin-independent mechanisms [12], In contrast, others propose that it promotes adipogenesis by antagonizing the β-catenin-mediated signaling cascade, thereby relieving the suppression of PPARγ [13]. We hypothesize that SCD5 regulates adipogenesis in bovine preadipocytes by modulating WNT5B expression. To test this, we conducted experiments using Xinjiang Brown cattle. This study investigates how SCD5 regulates bovine preadipocyte proliferation and differentiation, with a focus on the WNT5B-mediated mechanism. Our findings will identify a novel regulatory axis for fat deposition, providing a genetic basis for molecular breeding strategies to improve meat quality in Xinjiang Brown cattle.
2. Materials and Methods
2.1. Tissue Sample Collection
Primary adipocytes were isolated from adipose tissue obtained from the longissimus dorsi muscle of Xinjiang Brown cattle at a commercial abattoir. Approximately 500 g of tissue was collected under sterile conditions within 1–2 min post-slaughter. The samples were briefly rinsed with 75% ethanol (Jiangsu Intco Medical Products Co., Ltd., Zhenjiang, China) for 15 s, followed by 2–3 washes in hydrochloric acid-buffered PBS (Cytiva, Marlborough, MA, USA). After rinsing, the tissues were placed in a thermally insulated container with PBS (Cytiva, Marlborough, MA, USA) and promptly transferred to the lab, where cell isolation procedures were immediately initiated.
2.2. Cell Isolation, Culture, and Differentiation
Primary bovine preadipocytes were isolated by enzymatic digestion and subsequently expanded in a complete growth medium. The growth medium consisted of DMEM/F12 containing 10% FBS, 100 IU/mL penicillin, and 100 μg/mL streptomycin. Prior to induction, a 2-day period of contact inhibition (day - 2) was established by maintaining cells at full confluence. Adipogenic differentiation was initiated using a differentiation medium comprising 2 μM insulin, 0.5 mM IBMX, 1 μM dexamethasone, and 1 μM rosiglitazone. Following the 6-day induction phase, we introduced a maintenance medium (growth medium supplemented with 1 μg/mL insulin) to support terminal maturation.
2.3. Oil Red O Staining
Following 8 days of differentiation, cellular samples underwent three PBS washes and were fixed with 4% PFA (Wuhan Kanos Technology Co., Ltd., Wuhan, China) for 40 min in darkness. After fixation, cells underwent three PBS rinses to visualize lipid deposits through 30 min staining using an Oil Red O working solution (Sigma-Aldrich, St. Louis, MO, USA). Image acquisition for subsequent analysis was performed using an inverted microscope (IX73, Olympus, Tokyo, Japan). Lipid droplets were extracted with isopropanol (Jiangsu Intco Medical Products Co., Ltd., Zhenjiang, China). A microplate reader (Molecular Devices, San Jose, CA, USA) was employed to determine the lipid content based on optical density measurements at 510 nm.
2.4. siRNA and Plasmid DNA Transfection
Shanghai GenePharma Co., Ltd. (Shanghai, China) supplied all constructs, including the SCD5 overexpression vector (pcDNA3.1-SCD5), the empty control vector pcDNA3.1(+), as well as the gene-specific siRNAs targeting SCD5 and a negative control siRNA. The schematic structure of the pcDNA3.1(+) vector is illustrated in Figure 1. The SCD5 coding sequence was subcloned into the pcDNA3.1(+) plasmid via restriction enzyme digestion and ligation at its multiple cloning site. The sequences of siRNAs are shown in Table 1. For all experiments involving transfection in 6-well plates, bovine preadipocytes were seeded and transfected at approximately 70–80% confluence using Lipofectamine 2000 transfection reagent (Invitrogen, Waltham, MA, USA) according to the manufacturer’s instructions. The following standard conditions were applied: the overexpression group and the negative control group received 2.5 μg of the corresponding vector (pcDNA3.1-SCD5 or empty vector, respectively), whereas the knockdown group and the scramble control group were transfected with 100 μM of specific siRNA-SCD5 or control siRNA, respectively. After a 48 h transfection period, cells were routinely harvested for subsequent analysis.
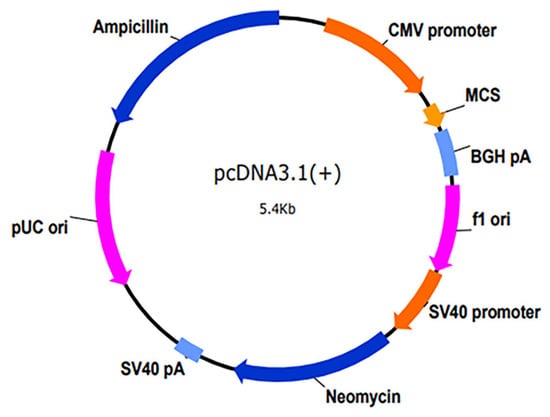
Figure 1.
Schematic diagram of the plasmid vector.

Table 1.
siRNA sequences.
2.5. Cell Proliferation Test
To determine proliferation rates, we employed the CCK-8 assay (Meilunbio, Shanghai, China) to monitor metabolic activity and the EdU assay (Beyotime Biotechnology, Shanghai, China) to evaluate DNA synthesis. Upon reaching adherence in 96-well plates, preadipocytes were transfected with either the SCD5 overexpression plasmid or a corresponding siRNA to achieve SCD5 upregulation or knockdown, respectively. After 48 h, cultures were supplemented with 20 μL CCK-8 reagent and underwent subsequent incubation (37 °C, 5% CO2) for 4 h. We measured the absorbance at 450 nm using a microplate reader from Molecular Devices (San Jose, CA, USA). Following seeding in 24-well plates and transfection with the respective plasmid or siRNA, cells were cultured for 48 h and subsequently pulsed with 5-ethynyl-2′-deoxyuridine (EdU) for 2 h prior to detection. Subsequently, Cellular fixation was carried out using a 4% paraformaldehyde solution sourced from Wuhan Canos Technology Co., Ltd. (Wuhan, China) and subjected to the Click-iT reaction by adding the mixture and incubating in the dark for 30 min, as per the manufacturer’s protocol. A 10 min DAPI staining procedure was applied to visualize the cell nuclei. Stained cells were visualized and imaged on an Olympus IX73 inverted microscope (Tokyo, Japan) featuring a U-RFL-T fluorescence illuminator.
2.6. RNA Extraction and RT-qPCR
To isolate total RNA, we employed RNAiso Plus reagent (TaKaRa Bio Inc., Dalian, China) on the collected cell samples. its concentration was then quantified on a spectrophotometer (Thermo Scientific, Waltham, MA, USA). The RNA concentration was standardized, and cDNA synthesis was carried out as outlined in the manufacturer’s protocol for the reverse transcription kit (TaKaRa Bio Inc., Dalian, China). Gene expression was quantified by real-time PCR using the SYBR Premix Ex Taq™ kit (TaKaRa Bio) on a Bio-Rad ABI platform. According to the 2−ΔΔCT method, expression levels were normalized to GAPDH as the internal control. Each sample was run in technical triplicate. All amplification primers were synthesized by Sangon Biotech (Shanghai, China), with their sequences detailed in Table 2.
Table 2.
RT-qPCR Primers.
2.7. Western Blot
On ice, cells were lysed with RIPA reagent for total protein extraction (Beyotime Biotechnology, Shanghai, China). We determined the protein concentration using a BCA protein assay kit (Thermo Fisher Scientific, Waltham, MA, USA), protein extracts were combined with 5× loading buffer and denatured at 100 °C for 10 min in a PCR system (Bio-Rad Laboratories) before electrophoresis. Protein separation was achieved by SDS-PAGE with a 4–12% GenScript ExpressPlus™ gel (GenScript, Piscataway, NJ, USA) at 90 V. The electrophoretic process was discontinued once the pre-stained protein marker (Thermo Fisher Scientific) had migrated to the gel bottom. The “sandwich” wet transfer method was employed to transfer proteins onto a PVDF membrane from Millipore (Billerica, MA, USA). A blocking step was performed by incubating the membrane for one hour at ambient temperature in a solution of 5% non-fat dry milk (Thermo Fisher Scientific, Waltham, MA, USA) prepared in 1× TBST (Solarbio Science & Technology Co., Ltd., Beijing, China). After blocking, the membrane was incubated overnight at 4 °C with the primary antibody prepared in a specialized dilution buffer: GAPDH (1:5000, Proteintech, Wuhan, China, cat #10494-1-AP), CDK1 (1:2000, Proteintech, Wuhan, China, cat #19532-1-AP), CDK6 (1:1000, Proteintech, Wuhan, China, cat #14052-1-AP), PPARγ (1:1000, Proteintech, Wuhan, China, cat #16643-1-AP), C/EBPα (1:1000, Proteintech, Wuhan, China, cat #29388-1-AP), SCD5 (1:1000, Aviva Systems Biology, San Diego, CA, USA, cat #ARP65045_P050), WNT5B (1:1000, biorbyt, Cambridge, UK, cat #orb577989), β-Catenin (1:1000, Abcam, Cambridge, UK, cat #ab32572), and p-β-Catenin (1:500, Affbiotech, Beijing, China, cat #affbiotech). Following three 10 min TBST washes, the antibody binding step was carried out at ambient temperature for 60 min using an HRP-conjugated anti-rabbit secondary antibody (1:1000 dilution, Proteintech, Wuhan, China, catalog #RGAROO4). Three sequential washes, each lasting 10 min, were performed on the membrane. We detected protein bands using an enhanced chemiluminescence (ECL) method with a chemiluminescence reagent from Beyotime Biotechnology (Shanghai, China). The resulting signals were captured using the CHAMPCHEM™ instrument (Sage Creation Science Co., Ltd., Beijing, China), and band intensities were quantified with ImageJ (version 2.14.0/1.54k, National Institutes of Health, Bethesda, MD, USA) software.
2.8. Statistical Analysis
Data were organized and preliminarily cleaned using Microsoft Excel (2021, Microsoft Corporation, WA, USA) and subsequently analyzed using SPSS (version 26.0, IBM, Armonk, NY, USA). All data are presented as the mean ± standard deviation (SD). The specific statistical tests applied were as follows: independent-samples t-tests were used for comparisons between two groups, and one-way analysis of variance (ANOVA) followed by Duncan’s post hoc test was used for comparisons among multiple groups. Statistical significance was defined as p < 0.05 for significant differences and p < 0.01 for highly significant differences.
3. Results
3.1. Expression Profile of SCD5 During Adipogenic Differentiation
As shown in Figure 2, SCD5 expression peaked at differentiation day 0. While relative elevations were also noted on day - 2, 4, and 8, the Transcript levels on day 2 and 6 were significantly lower, representing the lowest points throughout the observed period (p < 0.01).
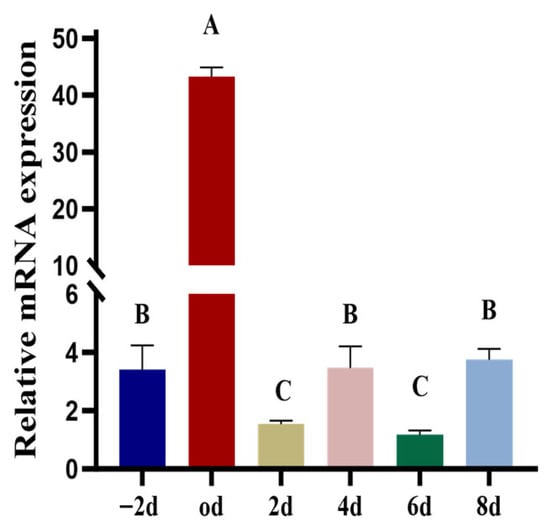
Figure 2.
Expression Profile of the SCD5. The time points were as follows: day - 2 represents two days before induction, day 0 is the initiation of induction, and day 2–8 represents the post-induction time points. Data are presented as the mean ± standard deviation (n = 3). Different uppercase letters indicate a highly significant difference (p < 0.01).
3.2. Overexpression and Knockdown of the SCD5
The results are shown in Figure 3. A marked difference in transfection efficiency was observed for the SCD5 overexpression (OE) group compared to the negative control (NC), and this difference was statistically highly significant (p < 0.001). Based on its superior transfection efficiency relative to the OE2 group, the OE1 construct was selected for all further functional experiments targeting SCD5 (Figure 3a). To identify the most effective siRNA for SCD5 knockdown, we screened three candidates (siRNA1, 2, and 3). All three siRNAs effectively silenced SCD5 expression, showing significant suppression (p < 0.001) relative to negative control cells, and siRNA1 proved most potent. Consequently, siRNA1 was employed for all subsequent interference trials targeting the SCD5 (Figure 3b). To further confirm the overexpression and knockdown effects of the SCD5, protein samples were collected from bovine preadipocytes 48 h after transfection with OE1 and siRNA1. An upregulation of SCD5 protein was evident in bovine preadipocytes following OE1 transfection, as determined by Western blot analysis (p < 0.0001), while siRNA1 transfection significantly decreased SCD5 protein abundance (p < 0.05) (Figure 3c). The full-length, uncropped blots are provided in Supplementary Figure S1. Collectively, these findings confirm the successful establishment of both SCD5 gain- and loss-of-function models, which are suitable for subsequent functional characterization.
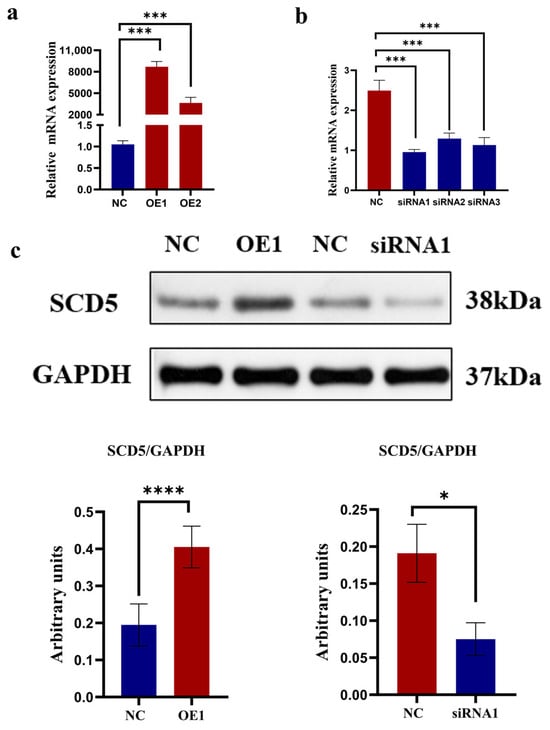
Figure 3.
Overexpression and Knockdown of the SCD5. (a) SCD5 mRNA levels 48 h after transfection with overexpression plasmids; (b) SCD5 mRNA levels 48 h after transfection with siRNA; (c) SCD5 protein levels 48 h post-transfection. Data represent the mean ± SD from three independent replicates (n = 3). Treatments: OE (pcDNA3.1-SCD5) at 2.5 μg/well (OE1) and 1.9 μg/well (OE2); siRNA-SCD5 at 100 μM/well (siRNA1, 2, 3). Statistical significance: * p < 0.05, *** p < 0.001, **** p < 0.0001.
3.3. Overexpression of SCD5 Inhibits the Proliferation of Bovine Preadipocytes
In the results, as shown in Figure 4, data from both CCK-8 and EdU assays demonstrated that SCD5 overexpression caused significant suppression of proliferation in bovine preadipocytes compared to control cells (p < 0.05, Figure 4a,b). Relative to the negative control, OE treatment significantly suppressed CDK1 and CDK2 expression (p < 0.05). Although no statistically significant alterations were observed in the mRNA levels of CDK6, CyclinB, CyclinD, and CyclinE (p > 0.05), a discernible decreasing pattern was noted (Figure 4c). Western blot analysis confirmed a marked downregulation of CDK1 and CDK6 levels in SCD5-overexpressing cells relative to negative controls (p < 0.05, Figure 4d). The full-length, uncropped blots are provided in Supplementary Figure S2. Collectively, these findings demonstrate that SCD5 overexpression inhibits the proliferative capacity of bovine preadipocytes.
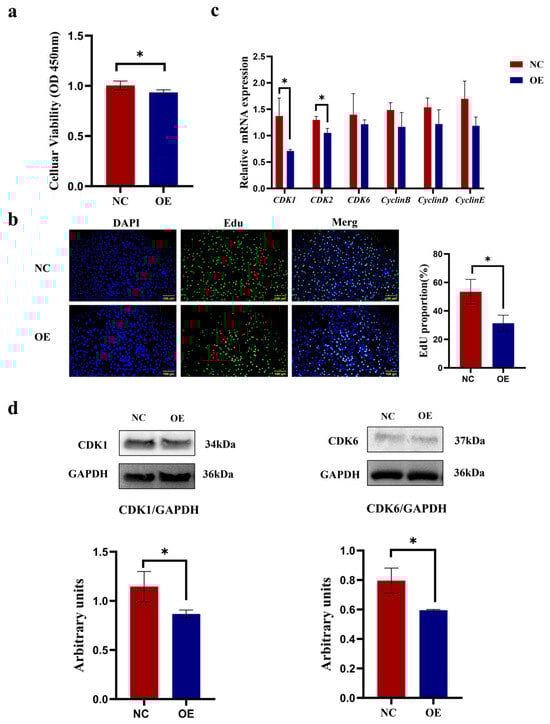
Figure 4.
Effect of SCD5 Overexpression on the Proliferation of Bovine Preadipocytes. (a) Cell viability assessed by CCK-8 assay 48 h post-transfection (n = 5); (b) EdU staining (Scale bar = 100 μm) at 48 h (n = 3); (c) mRNA levels of proliferation-related genes at 48 h (n = 3); (d) Protein levels of proliferation-related genes at 48 h (n = 3). All data are shown as mean ± SD. The overexpression group (OE) received pcDNA3.1-SCD5, compared to a negative control (NC). Asterisks indicate significant differences (* p < 0.05).
3.4. SCD5 Knockdown Promotes Bovine Preadipocyte Proliferation
As shown in Figure 5, the CCK8 assay demonstrated that the siRNA-SCD5 treatment significantly promoted the proliferation of bovine preadipocytes (p < 0.01, Figure 5a). The EdU assay further validated that the siRNA-SCD5 treatment significantly enhanced bovine preadipocyte proliferation (p < 0.05, Figure 5b). Relative to the negative control, siRNA-SCD5 significantly elevated the mRNA levels of CDK1 and CDK2 (p < 0.01), as well as those of CDK6 and CyclinB (p < 0.05). However, the expression levels of CyclinD and CyclinE genes did not show significant differences (p > 0.05), although an increasing trend was observed (Figure 5c). SCD5 knockdown induced a concomitant upregulation of CDK1 and CDK6 protein expression, as validated by immunoblot assay (p < 0.05, Figure 5d). The full-length, uncropped blots are provided in Supplementary Figure S2. Collectively, these data indicate that SCD5 knockdown promotes bovine preadipocyte proliferation.
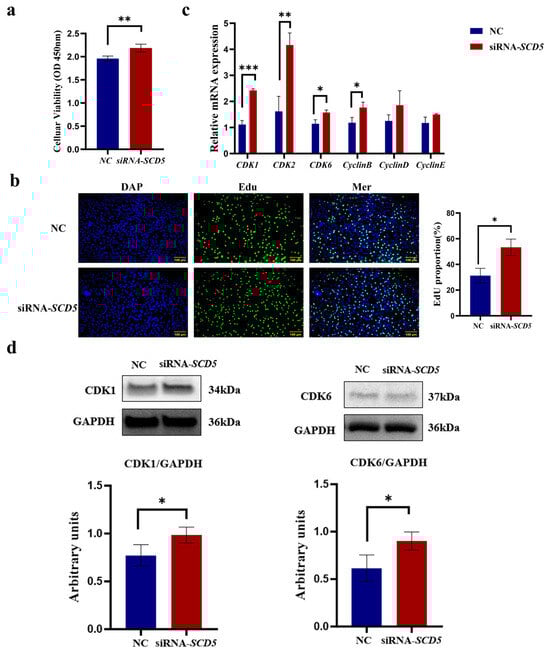
Figure 5.
Effect of SCD5 Interference on the Proliferation of Bovine Preadipocytes. (a) Cell viability (CCK-8) 48 h post-transfection (n = 6); (b) Representative EdU staining (Scale bar = 100 μm) at 48 h (n = 3); (c) mRNA expression of proliferation-related genes (n = 3); (d) Protein expression of proliferation-related genes. Values are presented as mean ± SD (n = 3 for (b–d)). Significant differences from the negative control (NC) are marked: * p < 0.05, ** p < 0.01, *** p < 0.001.
3.5. SCD5 Overexpression Suppresses Bovine Preadipocyte Differentiation
As shown in Figure 6, microscopic observation of the cells showed pronounced red lipid droplets following Oil Red O staining. The OE group exhibited notably fewer lipid deposits compared to the NC group. Upon microscopic examination, it was evident that the NC group possessed greater lipid accumulation compared to the OE group. Quantification of lipid droplets was performed after extraction with isopropanol, with the NC group showing significantly higher lipid content than the OE group (p < 0.001, Figure 6a). Compared to the negative control, SCD5 overexpression induced a marked downregulation of key adipogenic genes at both 24 h and 8 days post-differentiation. Specifically, PPARγ (p < 0.01), C/EBPα, and FABP4 (p < 0.05) were suppressed at 24 h, with a sustained suppression of all three regulators at 8 days (p < 0.01, Figure 6b). Similarly, treatment with the SCD5 plasmid significantly reduced the protein expression levels of PPARγ and C/EBPα at 24 h post-differentiation (p < 0.05), and at the day 8 time point, the protein levels of key adipogenic transcription factors PPARγ and C/EBPα were also markedly reduced (p < 0.01, Figure 6c). The full-length, uncropped blots are provided in Supplementary Figure S3. Collectively, these findings demonstrate that SCD5 overexpression suppresses adipogenesis in bovine preadipocytes.
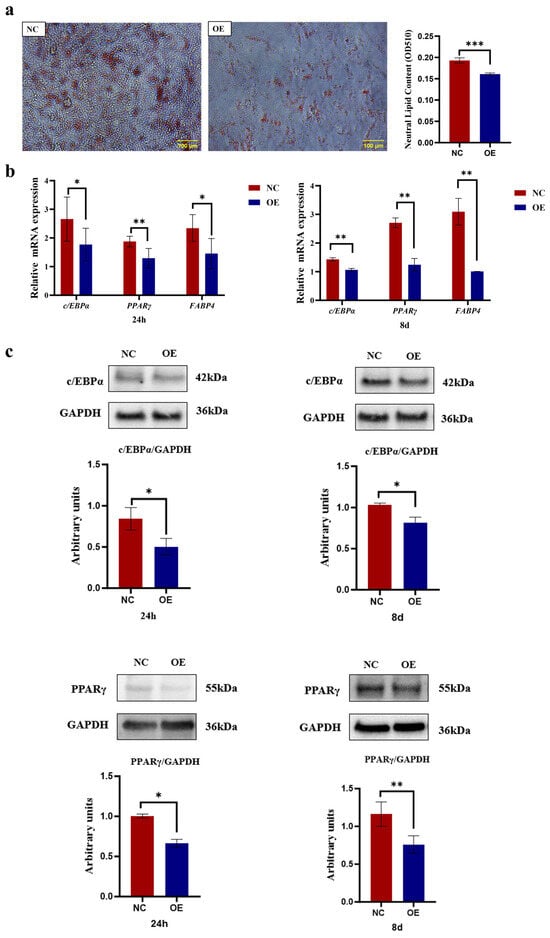
Figure 6.
Effect of SCD5 Overexpression on the Differentiation of Bovine Preadipocytes. (a) Lipid accumulation assessed by Oil Red O staining at day 8 of differentiation (Scale bar = 100 μm). The extracted Oil Red O dye was quantified by measuring its absorbance at 510 nm and the OD value represents the quantified intracellular triglyceride (TG) content (n = 3); (b) mRNA levels of differentiation markers at 24 h and 8 d (n = 3); (c) Protein levels of differentiation markers at 24 h and 8 d (n = 3). All values represent mean ± SD. OE: pcDNA3.1-SCD5; NC: negative control. * p < 0.05, ** p < 0.01, *** p < 0.001.
3.6. SCD5 Knockdown Promotes Bovine Preadipocyte Differentiation
As shown in Figure 7, microscopic analysis revealed numerous lipid droplets within cells, as presented After Oil Red O staining, the lipid droplets appeared red, and it was visually apparent that the NC group contained fewer lipid droplets compared to the siRNA group. Lipid quantification was conducted following dye extraction using isopropanol. The siRNA-SCD5 group exhibited a marked increase in lipid content compared to the negative control (NC) (p < 0.001, Figure 7a). At both 24 h and 8 days post-differentiation, SCD5 knockdown significantly elevated the mRNA levels of key adipogenic genes relative to the control. PPARγ was upregulated at the 24 h mark (p < 0.001), while PPARγ, C/EBPα, and FABP4 all showed elevated expression at day 8 (p < 0.001, Figure 7b). Additionally, siRNA-SCD5 treatment significantly increased the protein levels of PPARγ and C/EBPα at 24 h post-differentiation (p < 0.05); at 8 days, the levels of both PPARγ (p < 0.05) and C/EBPα (p < 0.01) remained significantly elevated (Figure 7c). The full-length, uncropped blots are provided in Supplementary Figure S3. In summary, our results demonstrate that SCD5 knockdown promotes adipogenic differentiation in bovine preadipocytes.
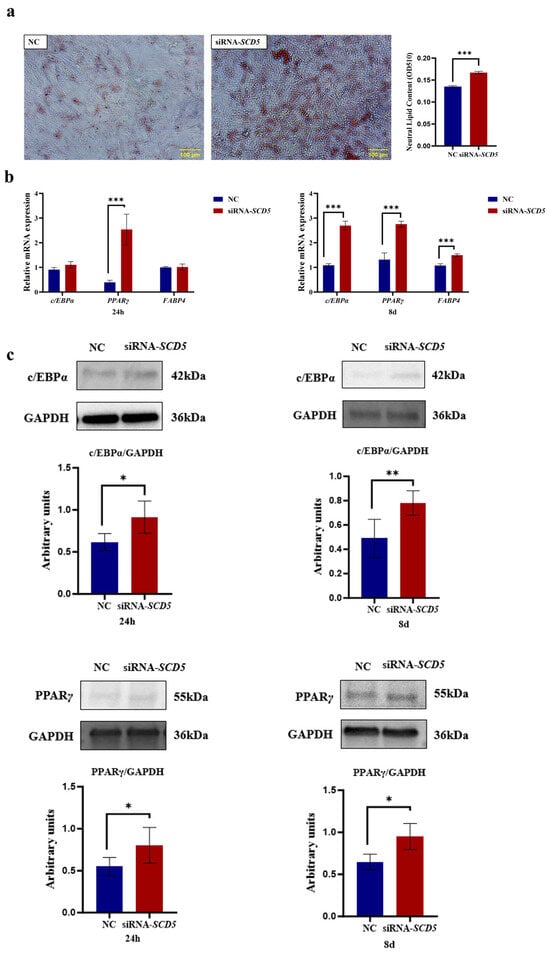
Figure 7.
Effect of SCD5 Knockdown on the Differentiation of Bovine Preadipocytes. (a) Lipid accumulation by Oil Red O staining at day 8 of differentiation (Scale bar = 100 μm). Quantification at 510 nm after extraction and the OD value represents the quantified intracellular triglyceride (TG) content (n = 3); (b) mRNA expression of differentiation-related genes at 24 h and 8 d; (c) Protein expression of differentiation-related genes at 24 h and 8 d. Data are presented as mean ± SD (n = 3). NC: negative control. * p < 0.05, ** p < 0.01, *** p < 0.001.
3.7. Effect of the SCD5 on the WNT Signaling Pathway
As demonstrated in Figure 8, relative to the negative control group, overexpression of SCD5 significantly downregulated WNT5B (p < 0.05), but upregulated WNT10B and WNT3A (p < 0.01), as well as WNT3 and WNT3A (p < 0.05). After interference with siRNA-SCD5, all tested WNTs (WNT10B, WNT5B, WNT5A, WNT3, and WNT3A) were significantly upregulated, with WNT10B/3A (p < 0.01), WNT5A/3 (p < 0.05), and WNT5B (p < 0.001) showing the most significant increases (Figure 8a). Compared to the negative control group, overexpression of SCD5 significantly downregulated WNT5B (p < 0.001), but upregulated WNT10B (p < 0.01), WNT3 (p < 0.001), and WNT3A and WNT5A (p < 0.05). After interference with siRNA-SCD5, all tested WNTs (WNT10B, WNT5B, WNT5A, WNT3, and WNT3A) were significantly upregulated, with WNT10B/3/5B (p < 0.01) and WNT3 and WNT5A (p < 0.05) showing significant increases (Figure 8b). Our findings support a bifunctional regulation of the WNT pathway by SCD5, supported by a compelling inverse correlation with WNT5B expression. The persistence of this relationship suggests that the downregulation of WNT5B is functionally integral to the inhibitory mechanism orchestrated by SCD5.
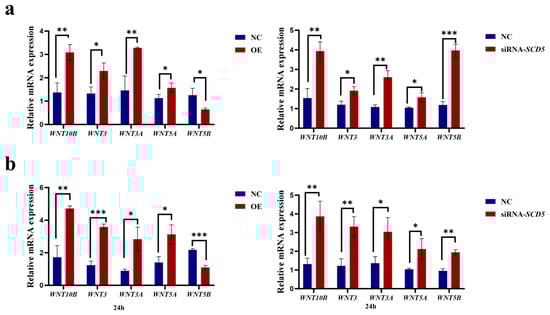
Figure 8.
Effect of the SCD5 on the WNT Signaling Pathway. (a) mRNA expression of WNT genes 48 h post-transfection; (b) mRNA expression of WNT genes 24 h after differentiation induction. Values are shown as mean ± SD (n = 3). OE: pcDNA3.1-SCD5; NC: negative control. * p < 0.05, ** p < 0.01, *** p < 0.001.
3.8. SCD5 Regulates Adipogenesis Through the WNT5B Signaling Pathway
As shown in Figure 9, knockdown of WNT5B not only effectively suppressed its own transcript abundance (p < 0.001) but also consequently reduced the mRNA expression of β-catenin, a key downstream mediator of the canonical WNT pathway (p < 0.05, Figure 9a,b). β-catenin protein levels were also significantly reduced (p < 0.01), with a concomitant decrease in phosphorylated β-catenin (p < 0.0001, Figure 9c). The full-length, uncropped blots are provided in Supplementary Figure S4. CCK-8 assay results demonstrated that siRNA-WNT5B treatment significantly inhibited the proliferation of bovine preadipocytes (p < 0.05, Figure 9d). Compared to the negative control group, WNT5B knockdown significantly reduced the expression of PPARγ (p < 0.001), C/EBPα, and FABP4 genes at 24 h post-differentiation and at 8 days post-differentiation (p < 0.01, Figure 9e). Large lipid droplets were visible within the cells, and lipid droplets were vividly stained red by Oil Red O, allowing for a visual comparison of lipid content. The NC group exhibited more lipid droplets than the siRNA-treated group. Quantification of lipid droplets, after extraction with isopropanol, showed a highly significant difference between the NC and siRNA groups (p < 0.001, Figure 9f). These findings reveal a promotional role for WNT5B in bovine preadipocyte proliferation and differentiation, while SCD5 suppresses this process through transcriptional downregulation of WNT5B.
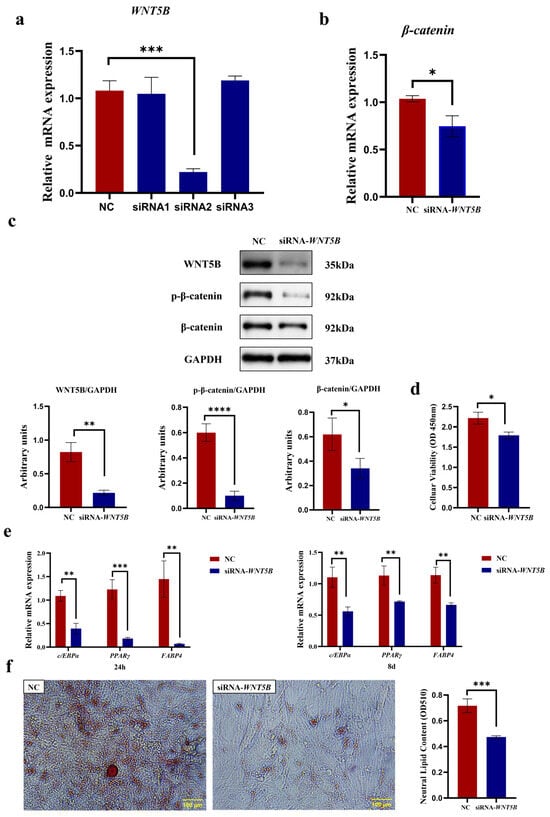
Figure 9.
The SCD5 Regulates Adipogenesis Through the WNT5B Signaling Pathway. (a) WNT5B interference efficiency 48 h post-transfection. siRNA2 was selected for subsequent experiments (n = 3). (b) β-catenin mRNA expression after WNT5B silencing (n = 3). (c) Protein levels of WNT5B, β-catenin, and phosphorylated β-catenin (p-β-catenin) as determined by Western blot 48 h post-transfection (n = 3). (d) Cell proliferation (CCK-8) 48 h post-transfection (n = 3). (e) mRNA expression of differentiation markers at 24 h and 8 d. (f) Lipid accumulation by Oil Red O staining at day 8. Quantification at 510 nm after extraction and the OD value represents the quantified intracellular triglyceride (TG) content. All data are expressed as mean ± SD. * p < 0.05, ** p < 0.01, *** p < 0.001, **** p < 0.0001.
4. Discussion
4.1. Expression and Functional Study of the SCD5 in Adipogenic Differentiation
The present study carried out an in-depth and comprehensive exploration of the expression dynamics and functional mechanisms of the SCD5 across the entire process of adipogenic differentiation. The trial results showed that SCD5 expression changed dynamically during the 8-day adipogenic differentiation. mRNA levels fluctuated substantially, and were significantly elevated at key time points: at the onset (day 0), midpoint (day 4), and termination (day 8) of the process. We detected a significant rise in SCD5 expression at the onset of differentiation (day 0). A plausible explanation for this initial increase is its direct response to the immediate activation of core adipogenic regulators, PPARγ and C/EBPα. This interpretation is supported by an established mechanistic pathway: PPARγ enhances FXR expression, which then forms a positive feedback loop to amplify SCD5 expression in a PPARγ-dependent manner, thereby promoting adipogenesis and cellular differentiation [14]. Furthermore, EGR2 and SREBP1a have been demonstrated to directly activate the bovine SCD5 promoter. This direct transcriptional regulation provides a mechanistic basis for the rapid increase in SCD5 expression during early differentiation [15]. At day 2, the expression level decreased. This decline could be indicative of an active transcriptional repression mechanism that fine-tunes the differentiation process. Consistent with this notion, growth hormone (bGH) and growth hormone-releasing factor (bGHR) have been reported to strongly suppress the SCD mRNA level in bovine adipose tissue [16]. Expression increased again by the mid-differentiation stage (day 4), a critical period marked by extensive lipid droplet formation. This resurgence likely supports the elevated demand for triglyceride (TG) synthesis and lipid accumulation. This role is corroborated by prior findings that SCD regulates both TG synthesis and fatty acid (FA) content in bovine subcutaneous adipose tissue (SAT) [17]. By the late differentiation stage (day 6), expression declined once more, possibly because sufficient lipid accumulation (e.g., oleic acid, palmitic acid, and other SCD-derived products) may have been attained. The homeostatic control of lipid synthesis may be achieved through this potential feedback inhibition. In support of this, Keating et al. confirmed that oleic acid, the primary product of the SCD-catalyzed reaction, directly suppresses SCD promoter activity in dairy cattle, providing a mechanistic basis for this regulatory loop [18]. A final upregulation was observed at the terminal stage (day 8), consistent with the established role of SCD as a marker of mature adipocyte differentiation. This is reinforced by studies confirming that SCD expression is significantly induced during adipogenesis and acts as a pivotal indicator of its completion [19]. In conclusion, the dynamic expression profile of SCD5 collectively describes a role that extends beyond that of a metabolic enzyme to a functional coordinator of the transition from proliferation to differentiation in precursor adipocytes. These findings implicate SCD5 as a promising genetic target for improving intramuscular fat (IMF) deposition, offering a viable strategy to enhance meat quality in livestock.
4.2. The SCD5 Suppresses the Proliferation of Bovine Preadipocytes
In beef cattle production, balancing lean growth with intramuscular adiposity (marbling) is a central challenge due to its direct impact on meat quality and value. Intramuscular preadipocyte proliferation represents an early-stage in marbling development, yet its regulatory mechanisms remain incompletely characterized [20]. This study aims to elucidate the specific role of Stearoyl-CoA Desaturase 5 (SCD5) during this foundational stage of adipogenesis in cattle. The capacity for fat deposition is primarily governed by the size of the adipocyte pool, which is determined by the proliferation of preadipocytes. The proliferation of adipocytes is a process governed by the cell cycle. This cycle consists of a precisely ordered series of stages, encompassing the S phase for DNA replication, the M phase for cellular division, and the intervening gap phases G1 and G2 [21,22]. As pivotal controllers of cell cycle dynamics, CDK1 and CDK2 orchestrate key phase transitions, particularly at the G1/S and G2/M checkpoints [23,24]. SCD5 overexpression significantly suppressed the proliferation of bovine preadipocytes, as indicated by a decrease in the percentage of EdU-positive cells and reduced CCK-8 activity. This anti-proliferative effect correlated with downregulation of CDK1 and CDK2 mRNA and decreased CDK1 and CDK6 protein levels. Conversely, SCD5 knockdown enhanced preadipocyte proliferation, as evidenced by increased EdU-positive cells and CCK-8 values. This pro-proliferative phenotype was consistent with the concomitant upregulation of key cell cycle genes (CDK1, CDK2, CDK6, and Cyclin B) at the mRNA level, as well as elevated CDK1 and CDK6 protein levels. Collectively, our findings define a role for SCD5 that extends beyond lipid metabolism, establishing it as a direct regulator of cell proliferation. Previous studies have reported that SCD5 suppresses proliferation in renal clear cell carcinoma, demonstrating its conserved anti-proliferative function [25]. This finding is further supported by Zhao et al., who showed that SCD5 negatively regulates the cell cycle [26]. Collectively, these two findings provide robust support for the results of this research trial. SCD5 catalyzes the biosynthesis of monounsaturated fatty acids, notably oleic acid. This same fatty acid has been demonstrated to inhibit tumor cell proliferation (Menendez et al., 2005) [27], suggesting a potential mechanistic link through which SCD5 may influence cell growth. Our findings suggest that SCD5 and SCD1 may function independently during adipogenesis: whereas SCD1 enhances lipid storage, SCD5-derived oleic acid could act as a signaling molecule to limit cell proliferation. This observation aligns with the established mechanism wherein SCD1-derived oleic and palmitoleic acids serve as endogenous ligands for PPARγ. Their binding activates this master transcriptional regulator of adipogenesis, leading to the direct upregulation of genes responsible for lipid deposition [28]. Previous studies establish that oleic acid acts as a ligand for PPARγ, a central regulator of adipose tissue development and related gene expression [29,30]. Furthermore, activation of PPARγ by its ligands can induce cell cycle arrest [31]. Our findings collectively propose a testable hypothesis: oleic acid, a product of SCD5, might function as an endogenous ligand for PPARγ in bovine preadipocytes, and its activation could thereby trigger cell cycle arrest and suppress preadipocyte proliferation.
4.3. The SCD5 Inhibits the Differentiation of Bovine Preadipocytes
This study investigated the regulatory function of SCD5 in bovine preadipocyte differentiation (adipogenesis)—the process by which these cells develop into mature adipocytes, crucial for adipose tissue development. Oil Red O staining revealed that SCD5 overexpression suppressed lipid accumulation, whereas its knockdown promoted this process. Consistent with these observations, we subsequently quantified the expression of key adipogenic master regulators to elucidate the molecular basis for this phenotypic shift. SCD5 overexpression downregulated the mRNA expression of PPARγ, C/EBPα, and FABP4, with corresponding suppression of PPARγ and C/EBPα at the protein level. Conversely, SCD5 knockdown consistently enhanced the expression of these genes. Collectively, our results define SCD5 as an inhibitor of bovine preadipocyte differentiation; whereas its knockdown accelerates adipogenesis. The promotion of bovine preadipocyte differentiation following SCD5 knockdown is consistent with reports in mouse 3T3-L1 cells [32,33]. Inhibition of tumor cell differentiation by SCD5 expression has been documented in advanced melanoma [34]. Previous studies establish that SCD-derived monounsaturated fatty acids (MUFAs) influence diverse cellular processes, including growth, survival, and differentiation. Notably, the SCD product palmitoleic acid is a recognized modulator of WNT signaling [35]. In contrast to the well-understood role of SCD1 in adipogenesis, the physiological function of SCD5 in ruminants remains limited, despite both isoforms being present in cattle. Our findings lead us to speculate that SCD5 might exert its inhibitory effect by possibly modulating the Wnt/β-catenin pathway, potentially through alterations in MUFA synthesis. This presents a testable model for future research. Canonical WNT signaling activation inhibits adipocyte differentiation through transcriptional suppression of the master adipogenic transcription factors PPARγ and C/EBPα. The physiological relevance of this inhibitory mechanism in cattle is demonstrated by its documented role in regulating intramuscular fat (IMF) content in the longissimus dorsi. Conversely, β-catenin downregulation enhances PPARγ expression, thereby promoting bone marrow-derived mesenchymal stem cells to undergo adipogenic differentiation [36]. We therefore propose a testable hypothesis: SCD5 inhibits adipogenesis primarily by modulating the Wnt/β-catenin pathway, potentially through alterations in cellular MUFA composition.
4.4. SCD5 Regulates Adipogenic Differentiation of Bovine Preadipocytes Through the WNT5B
This study focuses on the interaction between WNT signaling and SCD5 during adipogenesis in bovine preadipocytes. The WNT signaling pathway serves as a pivotal negative regulator in the process of adipogenesis, exerting a potent inhibitory effect on adipocyte differentiation through the suppression of lipid synthesis and storage mechanisms [37,38]. Our data show that SCD5 overexpression suppressed WNT5B expression, while its knockdown conversely elevated WNT5B levels. Based on their coordinated expression, we propose WNT5B as a downstream effector of SCD5. Additionally, WNT signaling pathway-related proteins such as Frizzled, GSK3β, and Axin have been established as regulators of fat deposition and adipocyte differentiation [13,38,39]. To investigate the mechanism of WNT5B, we silenced its expression in bovine preadipocytes. This attenuation suppressed proliferation, lipid accumulation, and the expression of key adipogenic markers (PPARγ, C/EBPα, and FABP4). This loss-of-function also reduced β-catenin mRNA, total protein, and phosphorylated protein levels, positioning WNT5B upstream of β-catenin regulation. Previous studies have shown that WNT5B promotes adipogenesis by inhibiting the β-catenin-dependent canonical WNT signaling pathway [40]. We hypothesize that silencing WNT5B relieves its inhibition of the canonical WNT pathway, leading to its excessive activation, which may trigger a strong negative feedback mechanism, ultimately resulting in a significant downregulation of β-catenin. Consistent with our findings, other studies have reported that WNT5B promotes adipogenesis [41]. Furthermore, demonstrated that WNT5B, as a ligand for ROR2, cooperates with ROR2 to promote the proliferation of skeletal muscle-derived mesenchymal progenitor cells (MPs) [42], leading to the accumulation of intramuscular adipose tissue. Additionally, directly confirmed that overexpression of WNT5B is sufficient to promote adipogenesis [40]. Previous studies have shown that the product of SCD catalysis, palmitoleic acid, binds to WNT proteins and activates the WNT signaling pathway. Inhibiting the phosphorylation of GSK3β prevents the degradation of β-catenin, leading to its accumulation in the nucleus [9,43]. In summation, the present study unequivocally identifies SCD5 as a pivotal negative regulator of adipogenesis in bovine preadipocytes. SCD5 exerts its anti-adipogenic effect by specifically suppressing WNT5B transcription, thereby providing direct evidence for the pro-adipogenic role of WNT5B [40,42]. This study provides evidence of an upstream regulatory association between SCD5 and WNT5B, a relationship not previously reported in this context. Our findings suggest a previously uncharacterized mechanism through which lipid metabolism enzymes may influence key developmental signaling pathways. These insights contribute novel theoretical perspectives and identify potential targets for metabolic interventions aimed at regulating fat deposition. Furthermore, while the present in vitro findings elucidate a precise mechanistic pathway, the physiological relevance of the SCD5-WNT5B axis necessitates future investigation in in vivo models to account for systemic metabolic interactions. The confirmation of this pathway in vivo would significantly strengthen its candidacy as a potential biomarker for genetic selection aimed at improving meat quality (e.g., intramuscular fat content) and modulating fat deposition patterns in agriculturally important species. The conservation of these signaling components across mammalian species suggests that our findings may extend beyond bovine biology, offering a paradigm for understanding adipogenesis in other livestock and potentially informing research into human metabolic diseases.
5. Conclusions
Our study demonstrates that SCD5 suppresses both the proliferation and adipogenic differentiation of bovine preadipocytes. Herein, we present compelling first evidence that SCD5 negatively regulates WNT5B expression. This regulatory event subsequently influences the protein stability of β-catenin, ultimately leading to the suppression of the adipogenic differentiation process. This discovery significantly deepens our comprehension of the functional attributes of the SCD protein family. Moreover, it offers novel experimental evidence that is instrumental in elucidating the distinctive regulatory mechanisms governing the WNT signaling pathway during adipose deposition in ruminants.
Supplementary Materials
The following supporting information can be downloaded at https://www.mdpi.com/article/10.3390/ani15243547/s1. Figure S1: Full-length blot for SCD5 (corresponding to Figure 3c); Figure S2: Full-length blot for CDK1 and CDK6 (corresponding to Figure 4d and Figure 5d); Figure S3: Full-length blots for PPARγ and C/EBPα (corresponding to Figure 6c and Figure 7c); Figure S4: Full-length blot for β-catenin, p-β-catenin, and WNT5B (corresponding to Figure 9c).
Author Contributions
Conceptualization, Y.W. and L.Y.; Methodology, Y.W.; Investigation, Y.W., Y.Z. and Y.L.; Formal Analysis, Y.W., J.C., F.W. and J.B.; Writing—Original Draft, Y.W.; Validation, W.R.; Data Curation, W.R.; Resources, W.S.; Writing—Review and Editing, L.Y.; Supervision, L.Y.; Project Administration, L.Y. All authors have read and agreed to the published version of the manuscript.
Funding
This work was supported by the Tian chi talent introduction program (2225ZZQRCXM), Innovation training program for college students (DXSCX2025082) and the Autonomous region livestock production development fund (2225XMYSC2025).
Institutional Review Board Statement
Ethics approval was not required for this study because all adipose tissue samples were collected post-slaughter from a nationally licensed commercial abattoir (Changji Shengyuan Designated Cattle and Sheep Slaughter Co., Ltd., Daxiqu Town, Yutang Village, Changji City, Xinjiang, China; Unified Social Credit Code: 9165230132882891XT) operating under the supervision of the Changji Hui Autonomous Prefecture Bureau of Agriculture and Rural Affairs. Sample collection was carried out with the explicit permission of the abattoir management. No live animal experimentation was conducted.
Informed Consent Statement
Written informed consent was obtained from the owner of the animals involved in this study.
Data Availability Statement
None of the data were deposited in an official repository. The data are available from the corresponding author upon reasonable request.
Conflicts of Interest
The authors declare no conflicts of interest.
Abbreviations
The following abbreviations are used in this manuscript:
| β-catenin | Beta-Catenin |
| bGH | Bovine Growth Hormone |
| C16:0 | Palmitic Acid |
| C16:1n-7 | Palmitoleic Acid |
| C18:0 | Stearic Acid |
| C18:1n-9 | Oleic Acid |
| CCK-8 | Cell Counting Kit-8 |
| CDK1/2/6 | Cyclin-Dependent Kinase 1/2/6 |
| C/EBPα | CCAAT/Enhancer-Binding Protein Alpha |
| DMEM/F12 | Dulbecco’s Modified Eagle Medium/Nutrient Mixture F-12 |
| EdU | 5-Ethynyl-2′-deoxyuridine |
| EGR2 | Early Growth Response Protein 2 |
| FA | Fatty Acid |
| FABP4 | Fatty Acid-Binding Protein 4 |
| FBS | Fetal Bovine Serum |
| FXR | Farnesoid X Receptor |
| GAPDH | Glyceraldehyde-3-Phosphate Dehydrogenase |
| IBMX | 3-Isobutyl-1-methylxanthine |
| IMF | Intramuscular Fat |
| PBS | Phosphate-Buffered Saline |
| PFA | Paraformaldehyde |
| PPARγ | Peroxisome Proliferator-Activated Receptor Gamma |
| RT-qPCR | Quantitative Reverse Transcription Polymerase Chain Reaction |
| SAT | Subcutaneous Adipose Tissue |
| SCD | Stearoyl-CoA Desaturase |
| SCD1 | Stearoyl-CoA Desaturase 1 |
| SCD5 | Stearoyl-CoA Desaturase 5 |
| SREBP1a | Sterol Regulatory Element-Binding Transcription Factor 1a |
| TG | Triglyceride |
| Wnt | Wingless-type MMTV integration site family |
| WNT3/3A/5A/5B/10B | Wnt Family Member 3/3A/5A/5B/10B |
References
- Igal, R.A.; Sinner, D.I. Stearoyl-CoA desaturase 5 (SCD5), a Δ-9 fatty acyl desaturase in search of a function. Biochim. Biophys. Acta Mol. Cell Biol. Lipids 2021, 1866, 158840. [Google Scholar] [CrossRef] [PubMed]
- Gao, Y.; Yang, L.; Yao, K.; Wang, Y.; Shao, W.; Yang, M.; Zhang, X.; Wei, Y.; Ren, W. Exploration of Genes Related to Intramuscular Fat Deposition in Xinjiang Brown Cattle. Genes 2024, 15, 1121. [Google Scholar] [CrossRef]
- Crespo-Piazuelo, D.; Criado-Mesas, L.; Revilla, M.; Castelló, A.; Noguera, J.L.; Fernández, A.I.; Ballester, M.; Folch, J.M. Identification of strong candidate genes for backfat and intra-muscular fatty acid composition in three crosses based on the Iberian pig. Sci. Rep. 2020, 10, 13962. [Google Scholar] [CrossRef] [PubMed]
- Jiang, Z.; Michal, J.J.; Tobey, D.J.; Daniels, T.F.; Rule, D.C.; Macneil, M.D. Significant associations of stearoyl-CoA desaturase (SCD1) gene with fat deposition and composition in skeletal muscle. Int. J. Biol. Sci. 2008, 4, 345–351. [Google Scholar] [CrossRef] [PubMed]
- Rezamand, P.; Watts, J.S.; Yavah, K.M.; Mosley, E.E.; Ma, L.; Corl, B.A.; McGuire, M.A. Relationship between stearoyl-CoA desaturase 1 gene expression, relative protein abundance, and its fatty acid products in bovine tissues. J. Dairy Res. 2014, 81, 333–339. [Google Scholar] [CrossRef]
- Liu, R.; Fang, X.; Lu, X.; Liu, Y.; Li, Y.; Bai, X.; Ding, X.; Yang, R. Polymorphisms of the SCD1 Gene and Its Association Analysis with Carcass, Meat Quality, Adipogenic Traits, Fatty Acid Composition, and Milk Production Traits in Cattle. Animals 2024, 14, 1759. [Google Scholar] [CrossRef]
- Miyazaki, M.; Jacobson, M.J.; Man, W.C.; Cohen, P.; Asilmaz, E.; Friedman, J.M.; Ntambi, J.M. Identification and characterization of murine SCD4, a novel heart-specific stearoyl-CoA desaturase isoform regulated by leptin and dietary factors. J. Biol. Chem. 2003, 278, 33904–33911. [Google Scholar] [CrossRef]
- Gamarra, D.; Aldai, N.; Arakawa, A.; Barron, L.J.R.; López-Oceja, A.; de Pancorbo, M.M.; Taniguchi, M. Distinct correlations between lipogenic gene expression and fatty acid composition of subcutaneous fat among cattle breeds. BMC Vet. Res. 2018, 14, 167. [Google Scholar] [CrossRef]
- Rios-Esteves, J.; Resh, M.D. Stearoyl CoA desaturase is required to produce active, lipid-modified WNT proteins. Cell Rep. 2013, 4, 1072–1081. [Google Scholar] [CrossRef]
- Bagchi, D.P.; Li, Z.; Corsa, C.A.; Hardij, J.; Mori, H.; Learman, B.S.; Lewis, K.T.; Schill, R.L.; Romanelli, S.M.; MacDougald, O.A. WNTless regulates lipogenic gene expression in adipocytes and protects against diet-induced metabolic dysfunction. Mol. Metab. 2020, 39, 100992. [Google Scholar] [CrossRef]
- Christodoulides, C.; Lagathu, C.; Sethi, J.K.; Vidal-Puig, A. Adipogenesis and WNT signalling. Trends Endocrinol. Metab. 2009, 20, 16–24. [Google Scholar] [CrossRef]
- Takada, I.; Kouzmenko, A.P.; Kato, S. WNT and PPARgamma signaling in osteoblastogenesis and adipogenesis. Nat. Rev. Rheumatol. 2009, 5, 442–447. [Google Scholar] [CrossRef] [PubMed]
- Bennett, C.N.; Ross, S.E.; Longo, K.A.; Bajnok, L.; Hemati, N.; Johnson, K.W.; Harrison, S.D.; MacDougald, O.A. Regulation of WNT signaling during adipogenesis. J. Biol. Chem. 2002, 277, 30998–31004. [Google Scholar] [CrossRef] [PubMed]
- Shinohara, S.; Fujimori, K. Promotion of lipogenesis by PPARγ-activated FXR expression in adipocytes. Biochem. Biophys. Res. Commun. 2020, 527, 49–55. [Google Scholar] [CrossRef] [PubMed]
- Lengi, A.J.; Corl, B.A. Regulation of the bovine SCD5 promoter by EGR2 and SREBP1. Biochem. Biophys. Res. Commun. 2012, 421, 375–379. [Google Scholar] [CrossRef]
- Beswick, N.S.; Kennelly, J.J. Influence of bovine growth hormone and growth hormone-releasing factor on messenger RNA abundance of lipoprotein lipase and stearoyl-CoA desaturase in the bovine mammary gland and adipose tissue. J. Anim. Sci. 2000, 78, 412–419. [Google Scholar] [CrossRef]
- Liang, H.; Xu, L.; Zhao, X.; Pan, K.; Yi, Z.; Bai, J.; Qi, X.; Xin, J.; Li, M.; Ouyang, K.; et al. RNA-Seq analysis reveals the potential molecular mechanisms of daidzein on adipogenesis in subcutaneous adipose tissue of finishing Xianan beef cattle. J. Anim. Physiol. Anim. Nutr. 2020, 104, 1–11. [Google Scholar] [CrossRef]
- Keating, A.F.; Kennelly, J.J.; Zhao, F.Q. Characterization and regulation of the bovine stearoyl-CoA desaturase gene promoter. Biochem. Biophys. Res. Commun. 2006, 344, 233–240. [Google Scholar] [CrossRef]
- Liu, L.; Wang, Y.; Liang, X.; Wu, X.; Liu, J.; Yang, S.; Tao, C.; Zhang, J.; Tian, J.; Zhao, J.; et al. Stearoyl-CoA Desaturase is Essential for Porcine Adipocyte Differentiation. Int. J. Mol. Sci. 2020, 21, 2446. [Google Scholar] [CrossRef]
- Seale, P.; Conroe, H.M.; Estall, J.; Kajimura, S.; Frontini, A.; Ishibashi, J.; Cohen, P.; Cinti, S.; Spiegelman, B.M. Prdm16 determines the thermogenic program of subcutaneous white adipose tissue in mice. J. Clin. Investig. 2011, 121, 96–105. [Google Scholar] [CrossRef]
- Matson, J.P.; Cook, J.G. Cell cycle proliferation decisions: The impact of single cell analyses. FEBS J. 2017, 284, 362–375. [Google Scholar] [CrossRef]
- Gao, S.W.; Liu, F. Novel insights into cell cycle regulation of cell fate determination. J. Zhejiang Univ. Sci. B 2019, 20, 467–475. [Google Scholar] [CrossRef]
- An, E.J.; Kim, Y.; Lee, S.H.; Ko, H.M.; Chung, W.S.; Jang, H.J. Anti-Cancer Potential of Oxalis obtriangulata in Pancreatic Cancer Cell through Regulation of the ERK/Src/STAT3-Mediated Pathway. Molecules 2020, 25, 2301. [Google Scholar] [CrossRef]
- Suski, J.M.; Ratnayeke, N.; Braun, M.; Zhang, T.; Strmiska, V.; Michowski, W.; Can, G.; Simoneau, A.; Snioch, K.; Cup, M.; et al. CDC7-independent G1/S transition revealed by targeted protein degradation. Nature 2022, 605, 357–365. [Google Scholar] [CrossRef] [PubMed]
- Ganner, A.; Philipp, A.; Lagies, S.; Wingendorf, L.; Wang, L.; Pilz, F.; Welte, T.; Grand, K.; Lienkamp, S.S.; Klein, M.; et al. SCD5 Regulation by VHL Affects Cell Proliferation and Lipid Homeostasis in ccRCC. Cells 2023, 12, 835. [Google Scholar] [CrossRef]
- Zhao, W.; Sun, L.; Li, X.; Wang, J.; Zhu, Y.; Jia, Y.; Tong, Z. SCD5 expression correlates with prognosis and response to neoadjuvant chemotherapy in breast cancer. Sci. Rep. 2021, 11, 8976. [Google Scholar] [CrossRef] [PubMed]
- Menendez, J.A.; Vellon, L.; Colomer, R.; Lupu, R. Oleic acid, the main monounsaturated fatty acid of olive oil, suppresses Her-2/neu (erbB-2) expression and synergistically enhances the growth inhibitory effects of trastuzumab (Herceptin) in breast cancer cells with Her-2/neu oncogene amplification. Ann. Oncol. 2005, 16, 359–371. [Google Scholar] [CrossRef] [PubMed]
- Cheng, X.; Xi, Q.Y.; Wei, S.; Wu, D.; Ye, R.S.; Chen, T.; Qi, Q.E.; Jiang, Q.Y.; Wang, S.B.; Wang, L.N.; et al. Critical role of miR-125b in lipogenesis by targeting stearoyl-CoA desaturase-1 (SCD-1). J. Anim. Sci. 2016, 94, 65–76. [Google Scholar] [CrossRef]
- Shao, X.; Wang, M.; Wei, X.; Deng, S.; Fu, N.; Peng, Q.; Jiang, Y.; Ye, L.; Xie, J.; Lin, Y. Peroxisome Proliferator-Activated Receptor-γ: Master Regulator of Adipogenesis and Obesity. Curr. Stem Cell Res. Ther. 2016, 11, 282–289. [Google Scholar] [CrossRef]
- Xiang, X.; Han, S.; Xu, D.; Chen, Q.; Ji, R.; Zhao, Z.; Du, J.; Mai, K.; Ai, Q. Oleic and palmitic acids induce hepatic angiopoietin-like 4 expression predominantly via PPAR-γ in Larimichthys crocea. Br. J. Nutr. 2023, 129, 1657–1666. [Google Scholar] [CrossRef]
- Cheng, H.S.; Tan, W.R.; Low, Z.S.; Marvalim, C.; Tan, N.S. Exploration and development of PPAR modulators in health and disease: An update of clinical evidence. Int. J. Mol. Sci. 2019, 20, 5055. [Google Scholar] [CrossRef]
- Jing, E.; Gesta, S.; Kahn, C.R. SIRT2 regulates adipocyte differentiation through FoxO1 acetylation/deacetylation. Cell Metab. 2007, 6, 105–114. [Google Scholar] [CrossRef]
- Wang, F.; Tong, Q. SIRT2 suppresses adipocyte differentiation by deacetylating FOXO1 and enhancing FOXO1’s repressive interaction with PPARγ. Mol. Biol. Cell 2009, 20, 801–808. [Google Scholar] [CrossRef]
- Puglisi, R.; Bellenghi, M.; Pontecorvi, G.; Gulino, A.; Petrini, M.; Felicetti, F.; Bottero, L.; Mattia, G.; Carè, A. SCD5 restored expression favors differentiation and epithelial-mesenchymal reversion in advanced melanoma. Oncotarget 2018, 9, 7567–7581. [Google Scholar] [CrossRef] [PubMed]
- Lai, K.K.Y.; Kweon, S.M.; Chi, F.; Hwang, E.; Kabe, Y.; Higashiyama, R.; Qin, L.; Yan, R.; Wu, R.P.; Lai, K.; et al. Stearoyl-CoA Desaturase Promotes Liver Fibrosis and Tumor Development in Mice via a WNT Positive-Signaling Loop by Stabilization of Low-Density Lipoprotein-Receptor-Related Proteins 5 and 6. Gastroenterology 2017, 152, 1477–1491. [Google Scholar] [CrossRef] [PubMed]
- Chen, G.; Wang, Q.; Li, Z.; Yang, Q.; Liu, Y.; Du, Z.; Zhang, G.; Song, Y. Circular RNA CDR1as promotes adipogenic and suppresses osteogenic differentiation of BMSCs in steroid-induced osteonecrosis of the femoral head. Bone 2020, 133, 115258. [Google Scholar] [CrossRef] [PubMed]
- Prestwich, T.C.; Macdougald, O.A. WNT/β-catenin signaling in adipogenesis and metabolism. Curr. Opin. Cell Biol. 2007, 19, 612–617. [Google Scholar] [CrossRef]
- Rawson, P.; Stockum, C.; Peng, L.; Manivannan, B.; Lehnert, K.; Ward, H.E.; Berry, S.D.; Davis, S.R.; Snell, R.G.; McLauchlan, D.; et al. Metabolic proteomics of the liver and mammary gland during lactation. J. Proteom. 2012, 75, 4429–4435. [Google Scholar] [CrossRef]
- Silva-García, O.; Valdez-Alarcón, J.J.; Baizabal-Aguirre, V.M. WNT/β-Catenin Signaling as a Molecular Target by Pathogenic Bacteria. Front. Immunol. 2019, 10, 2135. [Google Scholar] [CrossRef]
- van Tienen, F.H.; Laeremans, H.; van der Kallen, C.J.; Smeets, H.J. WNT5b stimulates adipogenesis by activating PPARγ, and inhibiting the β-catenin dependent WNT signaling pathway together with WNT5a. Biochem. Biophys. Res. Commun. 2009, 387, 207–211. [Google Scholar] [CrossRef]
- Bagchi, D.P.; MacDougald, O.A. WNT Signaling: From Mesenchymal Cell Fate to Lipogenesis and Other Mature Adipocyte Functions. Diabetes 2021, 70, 1419–1430. [Google Scholar] [CrossRef]
- Kamizaki, K.; Katsukawa, M.; Yamamoto, A.; Fukada, S.I.; Uezumi, A.; Endo, M.; Minami, Y. Ror2 signaling regulated by differential WNT proteins determines pathological fate of muscle mesenchymal progenitors. Cell Death Dis. 2024, 15, 784. [Google Scholar] [CrossRef]
- Liang, Z.; Li, S.; Wang, Z.; Zhou, J.; Huang, Z.; Li, J.; Bao, H.; Yam, J.W.P.; Xu, Y. Unraveling the Role of the Wnt Pathway in Hepatocellular Carcinoma: From Molecular Mechanisms to Therapeutic Implications. J. Clin. Transl. Hepatol. 2025, 13, 315–326. [Google Scholar] [CrossRef]
Disclaimer/Publisher’s Note: The statements, opinions and data contained in all publications are solely those of the individual author(s) and contributor(s) and not of MDPI and/or the editor(s). MDPI and/or the editor(s) disclaim responsibility for any injury to people or property resulting from any ideas, methods, instructions or products referred to in the content. |
© 2025 by the authors. Licensee MDPI, Basel, Switzerland. This article is an open access article distributed under the terms and conditions of the Creative Commons Attribution (CC BY) license (https://creativecommons.org/licenses/by/4.0/).