
The Thoroughbred Theory: Influence of Breed on Performance at the CCI5*-L Level of Eventing


Simple Summary
Abstract
1. Introduction
2. Materials and Methods
2.1. Overall Data Entry
2.2. Statistics
3. Results
3.1. Dressage
3.2. Cross Country
3.3. Show Jumping
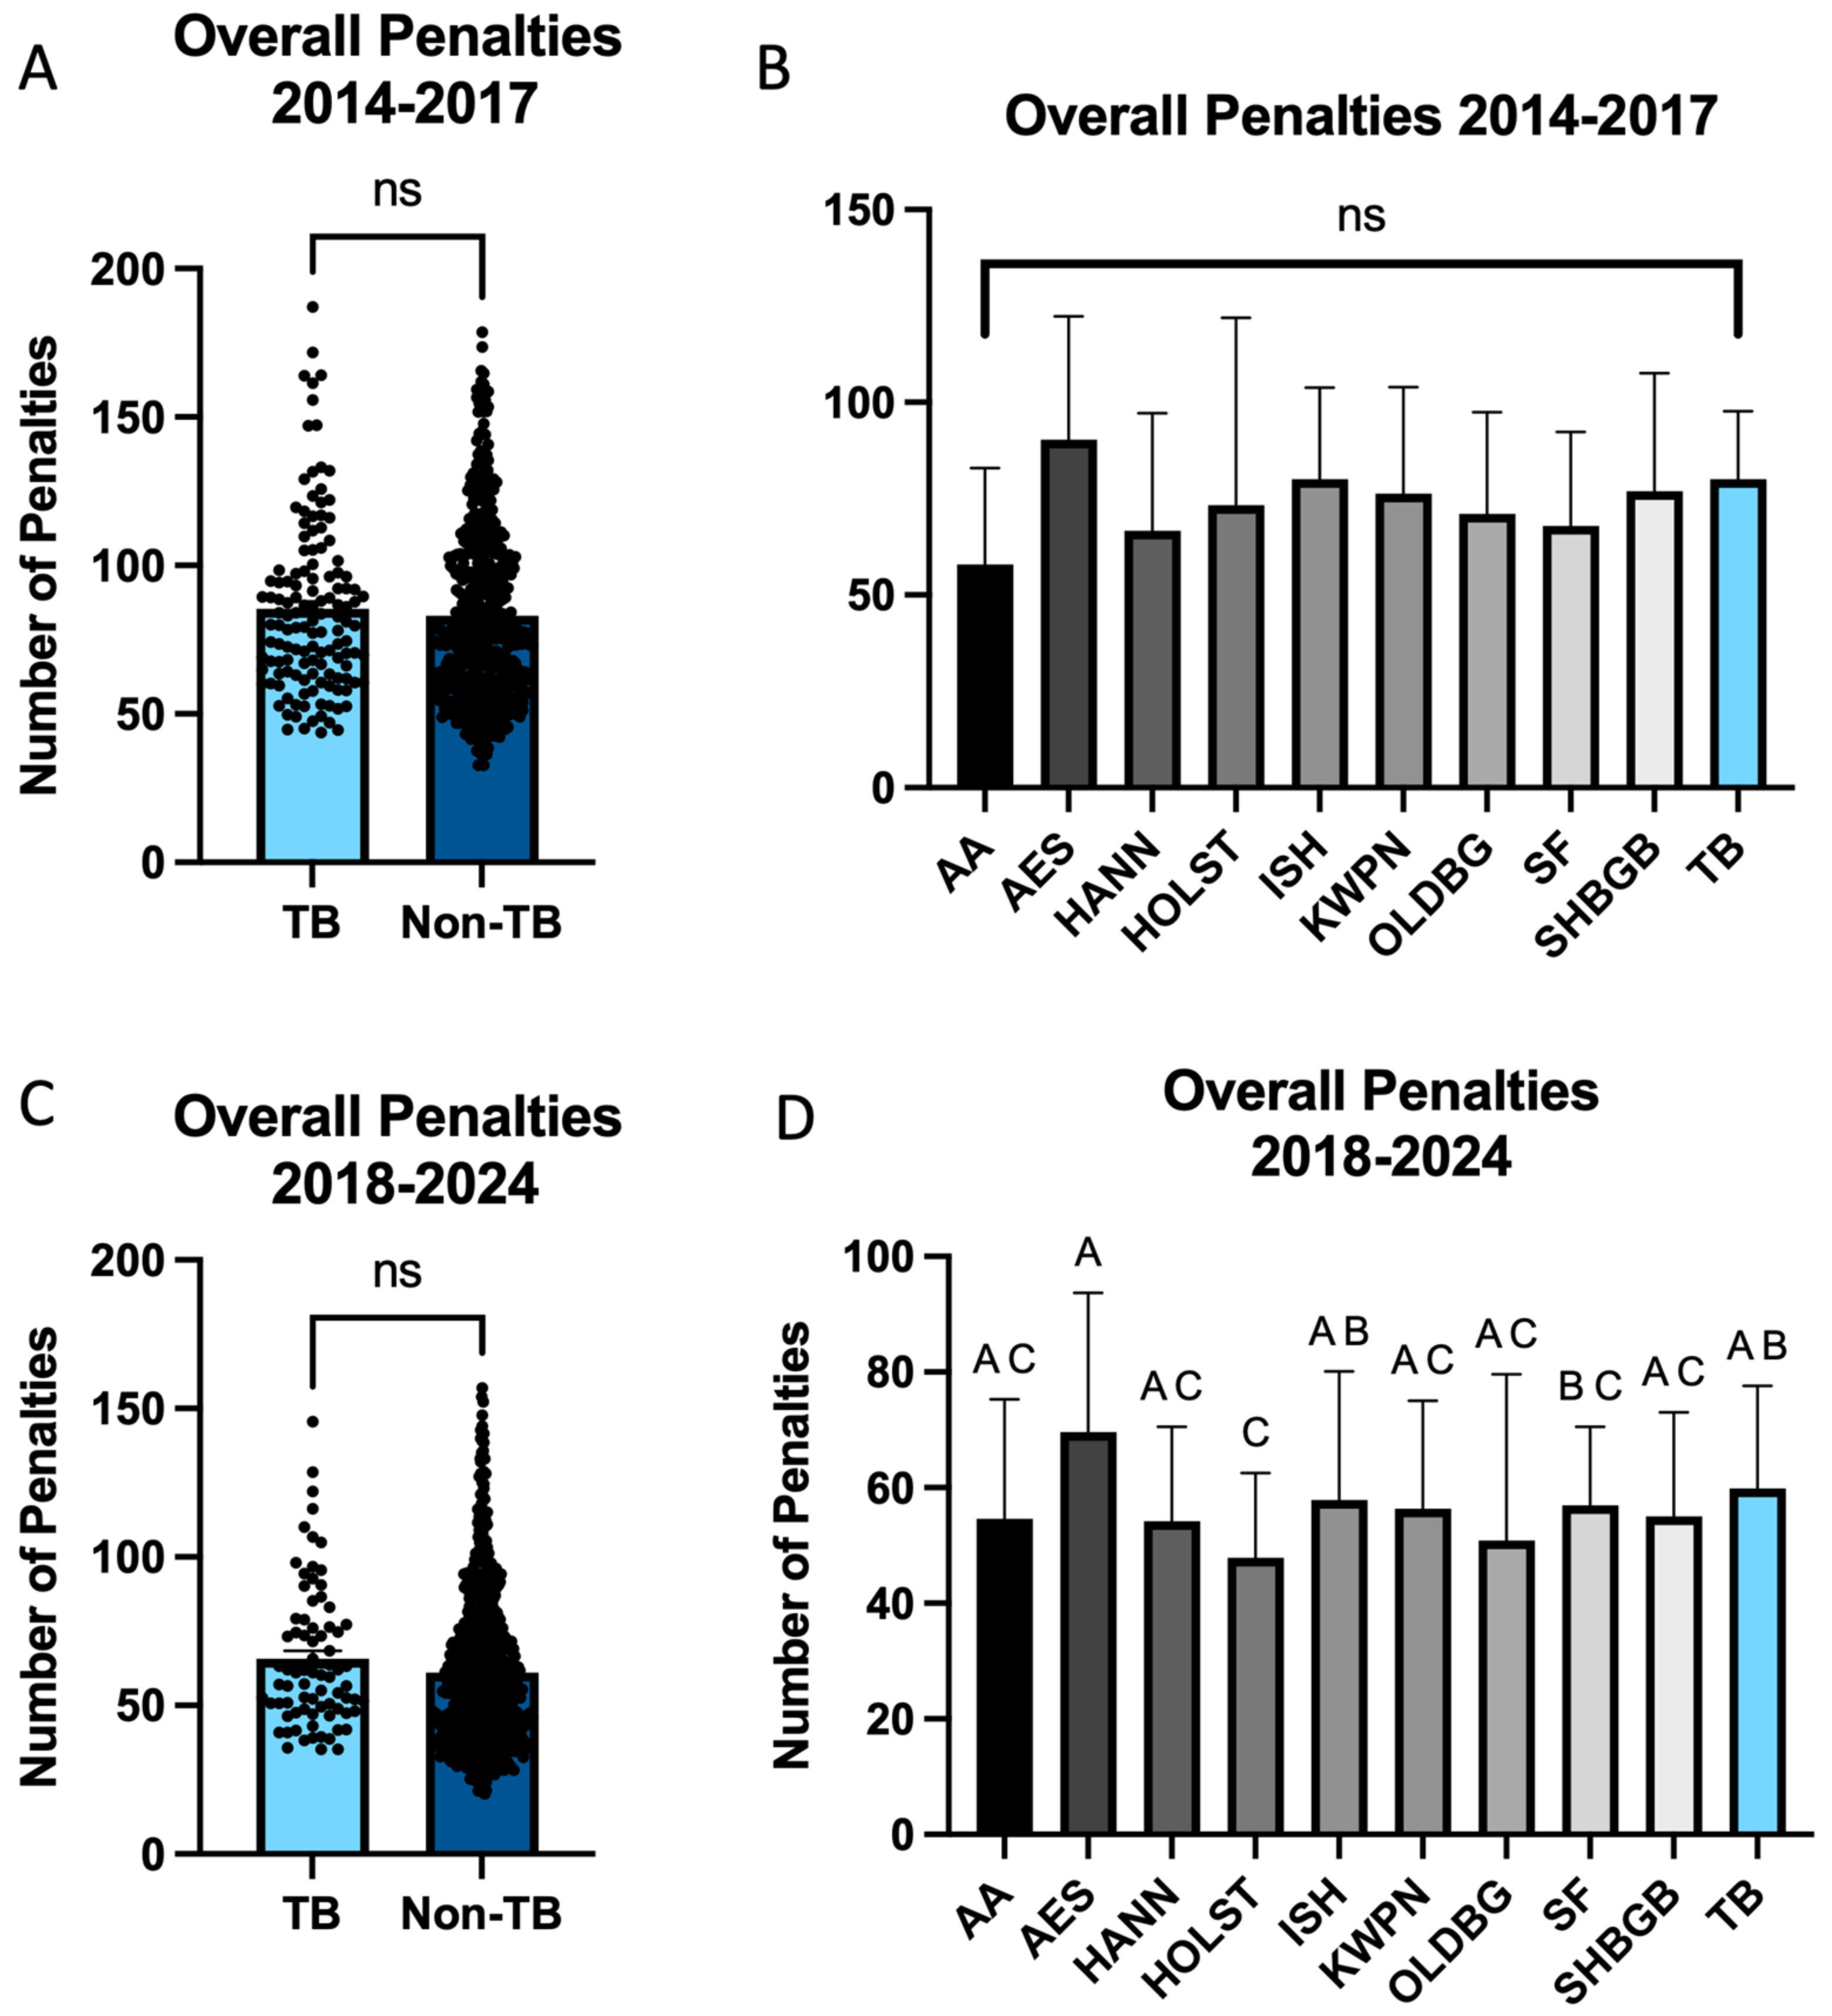
3.4. Overall
4. Discussion
5. Conclusions
Author Contributions
Funding
Institutional Review Board Statement
Informed Consent Statement
Data Availability Statement
Conflicts of Interest
Abbreviations
| AA | Anglo-Arabian |
| AES | Anglo-European Studbook |
| HANN | Hannoverian |
| HOLST | Holsteiner |
| ISH | Irish Sport Horse |
| KWPN | Dutch Warmblood |
| Non-TB | Non-Thoroughbred |
| OLDBG | Oldenburg |
| SF | Selle Francais |
| SHBGB | Sport Horse of Great Britain |
| TB | Thoroughbred |
References
- Bennet, E.D.; Cameron-Whytock, H.; Parkin, T.D.H. Federation Equestre Internationale eventing: Fence-level risk factors for falls during the cross-country phase (2008–2018). Equine Vet. J. 2023, 55, 463–473. [Google Scholar] [CrossRef] [PubMed]
- O’Connor, D.; Sinclair, G. Risk management data: 2024 Highlights of international statistics. In Proceedings of the FEI Eventing Forum, Lausanne, Switzerland, 17–19 January 2025. [Google Scholar]
- Ricard, A.; Chanu, I. Genetic parameters of eventing horse competition in France. Genet. Sel. Evol. 2001, 33, 175–190. [Google Scholar] [CrossRef] [PubMed]
- Nazari-Ghadikolaei, A.; Fikse, F.; Gelinder Viklund, A.; Eriksson, S. Factor analysis of evaluated and linearly scored traits in Swedish Warmblood horses. J. Anim. Breed. Genet. 2023, 140, 366–375. [Google Scholar] [CrossRef] [PubMed]
- Chance, A. It’s in the Blood: LRK3DE Edition. 2020. Available online: https://useventing.com/news-media/news/its-in-the-blood-lrk3de-edition (accessed on 1 February 2025).
- Chance, A. Blood Percentage: We’ve Been Doing It Wrong. 2023. Available online: https://eventingnation.com/blood-percentage-weve-been-doing-it-wrong/ (accessed on 2 February 2025).
- Pietrzak, S.; Prochniak, T.; Osinska, K. The influence of certain factors on the results obtained by horses classified in eventing ranks of the International Federation for Equestrian Sports. Ann. Univ. Mariae Curie-Sklodowska Lub.-Pol. 2013, XXXI, 34–39. [Google Scholar]
- Chapard, L.; Meyermans, R.; Gorssen, W.; Hooyberghs, K.; Meurrens, I.; De Smet, S.; Buys, N.; Janssens, S. Early life jumping traits: Are they good proxies for success in show jumping competitions in Belgian warmblood horses? J. Anim. Breed. Genet. 2024, 141, 138–152. [Google Scholar] [CrossRef]
- Chapard, L.; Van Thillo, A.; Meyermans, R.; Gorssen, W.; Buys, N.; Janssens, S. Adjusted fence height: An improved phenotype for the genetic evaluation of show jumping performance in Warmblood horses. Genet. Sel. Evol. 2023, 55, 12. [Google Scholar] [CrossRef]
- Prochniak, T.; Kasperek, K.; Knaga, S.; Rozempolska-Rucinska, I.; Batkowska, J.; Drabik, K.; Zieba, G. Pedigree Analysis of Warmblood Horses Participating in Competitions for Young Horses. Front. Genet. 2021, 12, 658403. [Google Scholar] [CrossRef]
- Ablondi, M.; Eriksson, S.; Tetu, S.; Sabbioni, A.; Viklund, A.; Mikko, S. Genomic Divergence in Swedish Warmblood Horses Selected for Equestrian Disciplines. Genes 2019, 10, 976. [Google Scholar] [CrossRef]
- Rovere, G.; Madsen, P.; Norberg, E.; van Arendonk, J.A.; Ducro, B.J. Effect of specialization on genetic parameters of studbook-entry inspection in Dutch Warmblood horses. J. Anim. Breed. Genet. 2015, 132, 441–448. [Google Scholar] [CrossRef]
- Rovere, G.; Ducro, B.J.; van Arendonk, J.A.; Norberg, E.; Madsen, P. Genetic correlations between dressage, show jumping and studbook-entry inspection traits in a process of specialization in Dutch Warmblood horses. J. Anim. Breed. Genet. 2017, 134, 162–171. [Google Scholar] [CrossRef]
- Rovere, G.; Ducro, B.J.; van Arendonk, J.A.; Norberg, E.; Madsen, P. Analysis of competition performance in dressage and show jumping of Dutch Warmblood horses. J. Anim. Breed. Genet. 2016, 133, 503–512. [Google Scholar] [CrossRef] [PubMed]
- Craig, L.; Hintz, H.F.; Soderholm, L.V.; Shaw, K.L.; Schryver, H.F. Changes in blood constituents accompanying exercise in polo horses. Cornell Vet. 1985, 75, 297–302. [Google Scholar] [PubMed]
- Bonow, S.; Eriksson, S.; Thoren Hellsten, E.; Gelinder Viklund, A. Consequences of specialized breeding in the Swedish Warmblood horse population. J. Anim. Breed. Genet. 2023, 140, 79–91. [Google Scholar] [CrossRef] [PubMed]
- Bailey, E.; Petersen, J.L.; Kalbfleisch, T.S. Genetics of Thoroughbred Racehorse Performance. Annu. Rev. Anim. Biosci. 2022, 10, 131–150. [Google Scholar] [CrossRef]
- Koenen, E.P.C.; Aldridge, L.I.; Philipsson, J. An overview of breeding objectives for warmblood sport horses. Livest. Prod. Sci. 2004, 88, 77–84. [Google Scholar] [CrossRef]
- Engel, L.; Becker, D.; Nissen, T.; Russ, I.; Thaller, G.; Krattenmacher, N. Mitochondrial DNA Variation Contributes to the Aptitude for Dressage and Show Jumping Ability in the Holstein Horse Breed. Animals 2022, 12, 704. [Google Scholar] [CrossRef]
- Nolte, W.; Thaller, G.; Kuehn, C. Selection signatures in four German warmblood horse breeds: Tracing breeding history in the modern sport horse. PLoS ONE 2019, 14, e0215913. [Google Scholar] [CrossRef]
- Brard, S.; Ricard, A. Genome-wide association study for jumping performances in French sport horses. Anim. Genet. 2015, 46, 78–81. [Google Scholar] [CrossRef]
- Rovere, G.; Madsen, P.; Norberg, E.; Van Arendonk, J.A.; Ducro, B.J. Genetic connections between dressage and show jumping in Dutch Warmbloods. Acta Agric. Scand. 2014, 64, 57–66. [Google Scholar]
- Wolframm, I. Let Them Be the Judge of That: Bias Cascade in Elite Dressage Judging. Animals 2023, 13, 2797. [Google Scholar] [CrossRef]
- Kis, J.; Rozsa, L.; Husveth, F.; Zsolnai, A.; Anton, I. Role of genes related to performance and reproduction of Thoroughbreds in training and breeding—A review. Acta Vet. Hung. 2021, 69, 315–323. [Google Scholar] [CrossRef]
- Sharman, P.; Wilson, A.J. Genetic improvement of speed across distance categories in thoroughbred racehorses in Great Britain. Heredity 2023, 131, 79–85. [Google Scholar] [CrossRef] [PubMed]
- Han, H.; McGivney, B.A.; Farries, G.; Katz, L.M.; MacHugh, D.E.; Randhawa, I.A.S.; Hill, E.W. Selection in Australian Thoroughbred horses acts on a locus associated with early two-year old speed. PLoS ONE 2020, 15, e0227212. [Google Scholar] [CrossRef] [PubMed]
- Hill, E.W.; Gu, J.; Eivers, S.S.; Fonseca, R.G.; McGivney, B.A.; Govindarajan, P.; Orr, N.; Katz, L.M.; MacHugh, D.E. A sequence polymorphism in MSTN predicts sprinting ability and racing stamina in thoroughbred horses. PLoS ONE 2010, 5, e8645. [Google Scholar] [CrossRef]
- de Oliveira Padilha, D.A.; Padilha, S.F.; Martins, R.; Scheffer, B.E.M.; Miliorini, M.R.; Dias, L.T.; Teixeira, R.A. Estimation of genetic parameters for racing time and ranking in Thoroughbred horses. J. Equine Vet. Sci. 2025, 144, 105244. [Google Scholar] [CrossRef]
- Roman-Popovici, A.; Constantin, S.D.; GIlca, I. Study regarding the percentage of English Thoroughbred blood in the last five generations for the best jumping horses in the world. Czech J. Food Sci. 2014, 63, 98–101. [Google Scholar]
- Doyle, J.L.; Carroll, C.J.; Corbally, A.F.; Fahey, A.G. An overview of international genetic evaluations of show jumping in sport horses. Transl. Anim. Sci. 2022, 6, txac038. [Google Scholar] [CrossRef]
- Sobotkova, E.; Mikule, V.; Kuritkova, D.; Jisrova, I.; Sladek, L. Analysis of the current situation in international show jumping and assessment of the influence of the proportion of Thoroughbred in the pedigree, horse demographics and sport season on the performance of horses. J. Vet. Behav. 2022, 47, 12–21. [Google Scholar] [CrossRef]

| Breed | Breed Abbreviation | Number of Entries | Age at Competition (Mean ± SEM) |
|---|---|---|---|
| Anglo-Arabian | AA | 43 | 13.98 ± 0.32 |
| Anglo-European | AES | 115 | 13.08 ± 0.21 |
| Hannoverian | HANN | 111 | 12.57 ± 0.17 |
| Holsteiner | HOLST | 126 | 12.82 ± 0.16 |
| Irish Sport Horse | ISH | 864 | 12.91 ± 0.07 |
| Dutch Warmblood | KWPN | 250 | 12.67 ± 0.11 |
| Oldenburg | OLDBG | 71 | 12.46 ± 0.24 |
| Selle Francais | SF | 197 | 13.08 ± 0.16 |
| Sport Horse of Great Britain | SHBGB | 170 | 13.00 ± 0.16 |
| Thoroughbred | TB | 330 | 13.79 ± 0.13 |
Disclaimer/Publisher’s Note: The statements, opinions and data contained in all publications are solely those of the individual author(s) and contributor(s) and not of MDPI and/or the editor(s). MDPI and/or the editor(s) disclaim responsibility for any injury to people or property resulting from any ideas, methods, instructions or products referred to in the content. |
© 2025 by the authors. Licensee MDPI, Basel, Switzerland. This article is an open access article distributed under the terms and conditions of the Creative Commons Attribution (CC BY) license (https://creativecommons.org/licenses/by/4.0/).
Share and Cite
Walz, K.R.; McCormick, M.E.; Fedorka, C.E. The Thoroughbred Theory: Influence of Breed on Performance at the CCI5*-L Level of Eventing. Animals 2025, 15, 1796. https://doi.org/10.3390/ani15121796
Walz KR, McCormick ME, Fedorka CE. The Thoroughbred Theory: Influence of Breed on Performance at the CCI5*-L Level of Eventing. Animals. 2025; 15(12):1796. https://doi.org/10.3390/ani15121796
Chicago/Turabian StyleWalz, Kianna R., Meghan E. McCormick, and Carleigh E. Fedorka. 2025. "The Thoroughbred Theory: Influence of Breed on Performance at the CCI5*-L Level of Eventing" Animals 15, no. 12: 1796. https://doi.org/10.3390/ani15121796
APA StyleWalz, K. R., McCormick, M. E., & Fedorka, C. E. (2025). The Thoroughbred Theory: Influence of Breed on Performance at the CCI5*-L Level of Eventing. Animals, 15(12), 1796. https://doi.org/10.3390/ani15121796