Simple Summary
Understanding differential mechanisms of the subcutaneous adipose tissue between indigenous breeds and modern pig breeds is important. After transcriptome sequencing and liposome detection of the subcutaneous adipose tissue in Ningxiang pigs, Berkshires and F1 offspring, we retrieved differentially expressed genes (DEGs) and significantly changed lipids (SCLs) in different groups. Integrative analysis of transcriptomic and lipidomic profiles and KEGG annotation revealed that the difference in fat deposition among Ningxiang pig, Berkshires, and F1 offspring may be caused by differences in the expression patterns of key genes in multiple enriched KEGG pathways. This study identified the key genes and lipids and also provided insights into selection for backfat thickness and the fat composition of adipose tissue for pig breeding.
Abstract
Adipose tissue composition contributes greatly to the quality and nutritional value of meat. Transcriptomic and lipidomic techniques were used to investigate the molecular mechanisms of the differences in fat deposition in Ningxiang pigs, Berkshires and F1 offspring. Transcriptomic analysis identified 680, 592, and 380 DEGs in comparisons of Ningxiang pigs vs. Berkshires, Berkshires vs. F1 offspring, and Ningxiang pigs vs. F1 offspring. The lipidomic analysis screened 423, 252, and 50 SCLs in comparisons of Ningxiang pigs vs. Berkshires, Berkshires vs. F1 offspring, and Ningxiang pigs vs. F1 offspring. Lycine, serine, and the threonine metabolism pathway, fatty acid biosynthesis and metabolism-related pathways were significantly enriched in comparisons of Berkshires vs. Ningxiang pigs and Berkshires vs. F1 offspring. The DEGs (PHGDH, LOC110256000) and the SCLs (phosphatidylserines) may have a great impact on the glycine, serine, and the threonine metabolism pathway. Moreover, the DEGs (FASN, ACACA, CBR4, SCD, ELOV6, HACD2, CYP3A46, CYP2B22, GPX1, and GPX3) and the SCLs (palmitoleic acid, linoleic acid, arachidonic acid, and icosadienoic acid) play important roles in the fatty acid biosynthesis and metabolism of fatty acids. Thus, the difference in fat deposition among Ningxiang pig, Berkshires, and F1 offspring may be caused by differences in the expression patterns of key genes in multiple enriched KEGG pathways. This research revealed multiple lipids that are potentially available biological indicators and screened key genes that are potential targets for molecular design breeding. The research also explored the molecular mechanisms of the difference in fat deposition among Ningxiang pig, Berkshires, and F1 pigs, and provided an insight into selection for backfat thickness and the fat composition of adipose tissue for future breeding strategies.
1. Introduction
Pork is a major source of amino acids and fatty acids, especially in China. Healthy, safe, and nutritious high-quality and specially flavored pork is more and more popular among consumers, and in huge demand. Adipose tissue is a dynamic metabolic and endocrine organ, which also stores fat and secretes biologically active substances, such as leptin and lipid mediators [1]. The accumulation of body fat may be the result of the balance among the absorption of fat, de novo fat synthesis, and fat metabolism and catabolism [2]. The fatty acid composition of adipose tissue contributes greatly to the flavor, quality, and nutritional value of meat [3]. The lipid content and the fatty acid composition in adipose tissue are strongly affected by the genotype and nutrient supply [4].
Chinese indigenous breeds, which have excellent meat quality and a special flavor, are more and more popular with consumers and researchers compared with modern pig breeds [5,6]. However, their low growth rate and a low proportion of lean meat limit the large-scale breeding of indigenous breeds. Fat deposition exhibits huge differences between indigenous breeds and modern pig breeds [7]. Selective breeding for a high proportion of lean meat and low backfat thickness has resulted in a reduced lipogenic potential in the modern pig breeds, while indigenous breeds have preserved a high fat deposition capacity [4]. The cultivated breeds with an indigenous pig lineage, which have a high growth rate, a high proportion of lean meat, low backfat thickness, and excellent flavor are required to meet market demand. The cultivated breeds are cultivated by hybrid breeding between indigenous breeds and modern pig breeds, such as Xiangcun Black pig (cultivated by hybrid breeding between Taoyuan Black pig and Duroc) and Sutai pig (cultivated by hybrid breeding between Taihu pig and Duroc). Nowadays, the question of how to apply multi-omics data to accelerate pig breeding is an important problem. Recently, multi-omics association analysis brought about opportunities for exploring the molecular mechanisms of complex traits and for more efficient mining of candidate genes for complex traits [8,9,10,11]. Clarifying the molecular mechanisms of certain traits and candidate gene resources may contribute to pig breeding [12]. The molecular mechanisms of the differences in adipose tissue between indigenous breeds and modern pig breeds is complex. Several studies compared the lipogenic enzyme activities of subcutaneous adipose tissue in multiple groups (Basque vs. Large White pigs, Alentejano vs. Large White pigs, Meishan vs. Large White pigs), and the results showed that the activity and gene expression of acetyl-CoA carboxylase 1 (ACACA) and glucose-6-phosphate dehydrogenase (G6PDH) are greater in Basque and Alentejano than in Large White, whereas the activity and gene expression of stearoyl-coA desaturase (SCD) is lower in Meishan pig than in Large White [13,14,15]. Thus, differences in the expression and activity of these key genes among different varieties may contribute to the phenotypic differences.
The Ningxiang pig, one of four well-known Chinese indigenous breeds, has abundant polyunsaturated fatty acid content and superior meat quality [16]. The Ningxiang pig is a typical fatty breed, with a slow growth rate and a strong fat deposition ability. The Berkshires is a typical lean pig breed, famous for its high proportion of lean meat and fast growth rate. When Ningxiang pigs acted as the male parent in a cross with Berkshires, the meat quality of the F1 pigs was superior. Compared with Ningxiang pigs, the F1 offspring had less backfat thickness. Obvious phenotypic differences existed in the subcutaneous adipose tissue among Ningxiang pig, Berkshires, and F1 offspring. Multi-omics association analysis has proven to be an effective method for investigating the molecular mechanisms of fat deposition [17]. However, there are scant multi-omics data on the differences among Ningxiang pig, Berkshires, and their offspring, and the molecular mechanisms of the difference in fat deposition among Ningxiang pig, Berkshires, and their offspring are still unknown. Therefore, this study aimed to research the molecular mechanisms of the difference in fat deposition among Ningxiang pig, Berkshires, and F1 offspring, and to identify the key genes and lipids. This study also provided insights into selection for backfat thickness and the fat composition of adipose tissue for pig breeding.
2. Materials and Methods
2.1. Ethics Statement
The animal experiments were conducted according to the animal welfare requirements and approved by the Animal Protocol Review Committee of the Institute of Subtropical Agriculture, Chinese Academy of Science (No. ISA-2023-0020).
2.2. Animals
In total, 42 pigs (14 purebred Ningxiang pigs, 14 Berkshire pigs, and 14 hybrids of Ningxiang pig × Berkshires) from the same farm were used in this study. All pigs were raised on the same farm and housed under standard management conditions by the Dalong Livestock Co. Ltd., in Changsha China, with the same diet and free access to water. All pigs were healthy. The subcutaneous adipose tissue samples from these pigs were collected from Chu Weixiang Slaughtering and Cutting Plant in Ningxiang City, Hunan Province. We randomly selected six Ningxiang pigs with a left carcass weight of 32–38 kg, six Berkshires with a left carcass weight of 41–47 kg, and six hybrid progenies of Ningxiang pig × Berkshires (F1 offspring) with a left carcass weight of 37–41 kg, and collected the subcutaneous adipose from between the 6th and 11th rib samples from each pig. The samples were crushed and packed, and then stored in a freezer at −80 °C with a constant room temperature and humidity.
2.3. RNA Extraction
We selected 12 samples of subcutaneous adipose from four Ningxiang pigs, four Berkshires, and four F1 offspring, respectively. These 12 samples of subcutaneous adipose were used to detect the transcriptomic profiles. The total RNA was extracted using the TRIzol reagent (Life Technologies, Waltham, MA, USA). The concentration and purity of the RNA was measured using NanoDrop 2000 (Thermo Fisher Scientific, Wilmington, DE, USA). RNA integrity was assessed using the RNA Nano 6000 Assay Kit of the Agilent Bioanalyzer 2100 system (Agilent Technologies, Santa Clara, CA, USA). A total of 1 μg RNA per sample was used as input material for the preparation of RNA samples.
2.4. mRNA Sequencing and Transcriptomic Data Analysis
RNA-seq was performed by Biomarker Technology Co., Ltd. (Beijing, China). Sequencing libraries were generated using the NEBNext UltraTM RNA Library Prep Kit for Illumina (NEB, San Diego, CA, USA), and then the library’s quality was assessed on the Agilent Bioanalyzer 2100 system. After cluster generation, the library preparations were sequenced on an Illumina platform, and paired-end reads were generated. The raw data were filtered using the FastQC program (http://www.bioinformatics.babraham.ac.uk/projects/fastqc/, accessed on 8 September 2022). Clean reads were obtained by removing reads containing adapters, reads containing poly-N, and low-quality reads from the raw data. At the same time, the Q20, Q30, GC-content, and sequence duplication level of the clean data were calculated to ensure the quality of the clean reads was high. These clean reads were then mapped to the pig reference genome Sus scrofa11.1 (http://www.ensembl.org/info/data/ftp/index.html, accessed on 10 September 2022), by Hisat2 software (http://www.ccb.jhu.edu/software/hisat, accessed on 10 September 2022). Only reads with a perfect match or one mismatch were analyzed further and annotated on the basis of the pig reference genome. Differential expression analysis in the subcutaneous adipose tissue group (12 samples of subcutaneous adipose from four Ningxiang pigs, four Berkshires, and four F1 offspring) was performed using the DESeq2 [18]. The differential gene screening conditions were: |log2foldchange| > 1, and false discovery rate (FDR) < 0.05. The gene ontology (GO) enrichment analysis of the DEGs was implemented by the GOseq R package [19]. Version 3.0 of KOBAS [20] software was used to test the statistical enrichment of differentially expressed genes in the KEGG pathways. p-values were adjusted by the FDR method, and adjusted p-values < 0.05 were considered significant. RT-qPCR was performed to validate the reliability of RNA-seq. Specific primers of 11 genes were designed based on the gene sequences of pigs (Table S2).
2.5. Lipids Extraction and LC-MS/MS Analysis
We selected 18 samples of subcutaneous adipose from six Ningxiang pigs, six Berkshires, and six F1 offspring, respectively. These 18 samples of subcutaneous adipose were used to detect the lipidomic profiles. A 100 μL sample was mixed with 1 mL of the extraction solvent (MTBE: MeOH = 3:1, v/v) containing an internal standard mixture, and then vortexed for 15 min and sonicated in an ice bath for 10 min. Then, 200 μL of ultra-pure water were added. Next, 200 μL of the extraction solution were collected and evaporated using a vacuum concentrator. The dry extract was reconstituted using 400 μL Mobile Phase B prior to LC-MS/MS analysis. The sample extracts were analyzed using an LC-ESI-MS/MS system (UPLC, ExionLC AD, https://sciex.com.cn/, accessed on 10 September 2022; MS, QTRAP® System, https://sciex.com/, accessed on 10 September 2022). The analytical conditions were as follows, UPLC: column, Thermo Accucore™ C30 (2.6 μm, 2.1 mm × 100 mm i.d.); Solvent System, A: acetonitrile/water (60/40, v/v, 0.1% formic acid, 10 mmol/L ammonium formate), Solvent System B: acetonitrile/isopropanol (10/90 v/v, 0.1% formic acid, 10 mmol/L ammonium formate); gradient program, A/B (80:20, v/v) at 0 min, 70:30 v/v at 2 min, 40:60 v/v at 4 min, 15:85 v/v at 9 min, 10:90 v/v at 14 min, 5:95 v/v at 15.5 min, 5:95 v/v at 17.3 min, 80:20 v/v at 17.3 min, 80:20 v/v at 20 min; flow rate, 0.35 mL/min; temperature, 45 °C; injection volume: 2 μL. The effluent was alternatively connected to an ESI-triple quadrupole-linear ion trap (QTRAP)-MS. LIT and triple quadrupole (QQQ) scans were acquired on a triple quadrupole-linear ion trap mass spectrometer (QTRAP). The ESI source operation parameters were as follows: ion source, turbo spray; source temperature, 500 °C; ion spray voltage (IS), 5500 V (Positive; −4500 V (negative)); ion source gas 1 (GS1), gas 2 (GS2), and curtain gas (CUR) were set at 45, 55, and 35 psi, respectively; the collision gas (CAD) was medium. Instrument tuning and mass calibration were performed with 10 and 100 μmol/L of polypropylene glycol solutions in QQQ and LIT modes, respectively. The QQQ scans were acquired as MRM experiments with the collision gas (nitrogen) set to five psi. The DP and CE for individual MRM transitions were carried out with further optimization of DP and CE. A specific set of MRM transitions was monitored for each period according to the lipids eluted within this period.
2.6. Statistical Analysis
Unsupervised PCA (principal component analysis) was performed by the statistical function prcomp of R (version 3.5.1, www.r-project.org, accessed on 10 September 2022). The data were unit-variance scaled before the unsupervised PCA. The variable importance in the projection (VIP) was calculated in the OPLS-DA model, and generated using the R package MetaboAnalystR (Version 1.01). Differential lipids were determined by VIP (VIP ≥ 1) and absolute log2FC (|Log2FC| ≥ 1.0). In order to avoid overfitting, a permutation test (200 permutations) was performed. Then, the differential lipids were annotated using the KEGG Compound database (http://www.kegg.jp/kegg/compound/, accessed on 10 September 2022), and mapped into biochemical pathways through KEGG enrichment analysis. Pathways with significantly regulated metabolites mapped to them were then fed into MSEA (metabolite sets enrichment analysis), and their significance was determined by the hypergeometric test’s p-values. Heat maps of DEGs were generated using the Metware Cloud, a free online platform for data analysis (https://cloud.metware.cn, accessed on 10 September 2022).
3. Results
3.1. The Backfat Thickness of Ningxiang Pigs, Berkshires and F1 Offspring
We measured the backfat thickness of pigs of the same age and found that the backfat thickness of Ningxiang pigs was significantly higher than that of Berkshires and F1 offspring, and the backfat thickness of F1 offspring was significantly higher than that of Berkshires (Figure 1).
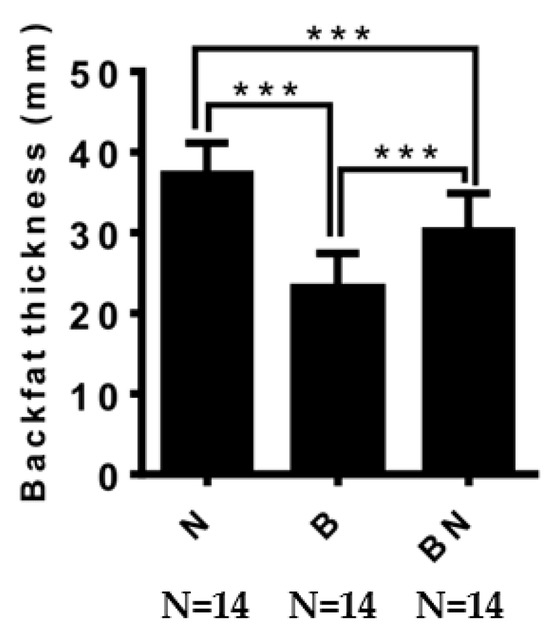
Figure 1.
The difference in backfat thickness among Ningxiang pigs, Berkshires, and F1 offspring. B, Berkshires; N, Ningxiang pig; BN, F1 offspring. *** represent p < 0.001.
3.2. Lipidomic Data Analysis
To investigate the differences in the lipid metabolite compositions of the subcutaneous adipose tissue among Ningxiang pig, Berkshires, and F1 offspring, LC-MS/MS analysis was performed. In total, 1293 lipids were detected, including 506 glycerphospholipids (GP), 421 glycerolipids (GL), 226 sphingolipids (SP), 88 triglycerides (TG), 40 fatty acyls (FA), 10 sterol lipids (ST), and two prenol lipids (PR). In the detected lipid subclasses, triglycerides (TG), diglycerides (DG), phosphatidylethanolamine (PE), phosphatidylcholine (PC), phosphatidylserine (PS), and ceramide (Cer-AS) were abundant in the subcutaneous adipose tissue (Figure S1). Principal component analysis (PCA) indicated that the three different groups were partly separated in the plots of PC1 × PC2 scores (Figure S2A). Further orthogonal partial least squares discriminant analysis (OPLS-DA) showed that there were apparent distinctions among the three groups, and small distinctions within the groups (Figure S2B–D). Moreover, the cluster heat map of the overall sample, which was derived from the Z-score for the expression levels of all samples, and K-means analysis suggested that the relative lipid content of the subcutaneous adipose tissue of Berkshires was higher than that of Ningxiang pigs and F1 offspring for the lipids detected in this study (Figures S2E and S3). Next, the SCLs were filtered and determined by their variable importance in projection (VIP) value ≥ 1.0 and |Log2(fold change)| ≥ 1.0. In total, 423 SCLs were screened in the subcutaneous adipose tissue for the group of Berkshires vs. Ningxiang pigs. Compared with Berkshires, Ningxiang pigs had 412 downregulated lipids, primarily GPs, GLs, SPs, DGs, FAs, STs, and PR (238, 93, 44, 24, 10, two, and one, respectively), but only 11 upregulated lipids, including eight TGs, two SPs and one GP, in the subcutaneous adipose tissue (Figure 2A). Moreover, 252 SCLs were markedly changed in the subcutaneous adipose tissue of F1 offspring compared with that of Berkshires. The F1 offspring had 251 downregulated lipids, containing three FAs, 13 GLs, 219 GPs, 12 SPs and four TGs, but only one SP was upregulated in the subcutaneous adipose tissue (Figure 2B). For the comparison between Ningxiang pigs and F1 offspring, 50 SCLs were screened. Compared with Ningxiang pigs, F1 offspring had just seven downregulated lipids including four GPs, one SP, one TG, and one GL, and 43 upregulated lipids containing 12 GLs, 11 GPs, 11 SPs, 4 STs, 3 FAs, and 2 TGs in the subcutaneous adipose tissue (Figure 2C).
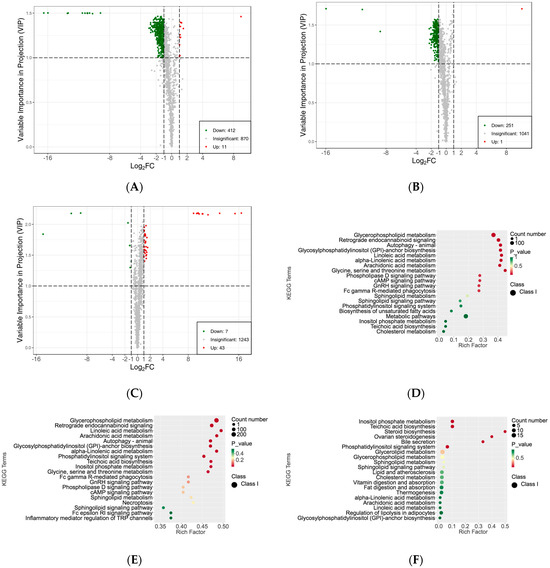
Figure 2.
Differences in the lipidomic profiles of the subcutaneous adipose tissue. (A–C) Volcano plots of SCLs for the subcutaneous adipose tissue in Berkshires vs. Ningxiang pigs (A), Berkshires vs. F1 offspring (B), Ningxiang pigs vs. F1 offspring (C), green dots represent downregulated SCLs, red dots represent upregulated SCLs. (D–F) Diagrams of the degree of KEGG pathway enrichment of SCLs in the subcutaneous adipose tissue from the group of Berkshires vs. Ningxiang pigs (D), Berkshires vs. F1 offspring (E), and Ningxiang pigs vs. F1 offspring (F). Eighteen samples of subcutaneous adipose from six Ningxiang pigs, six Berkshires, and six F1 pigs, respectively, were used to detect lipidomic profile.
Subsequently, KEGG enrichment analysis was performed to uncover the biological mechanisms of the differences in subcutaneous adipose tissue among Ningxiang pigs, Berkshires, and F1 offspring. With respect to the comparison between Berkshires and Ningxiang pigs, 423 SCLs were significantly annotated into 108 pathways, and the majority of SCLs were involved in fatty acid and amino acid metabolism-related pathways such as glycerophospholipid metabolism, linoleic acid metabolism, arachidonic acid metabolism, alpha-linolenic acid metabolism, inositol phosphate metabolism, and glycine, serine, and threonine metabolism (Figure 2D). For the comparison between Berkshires and F1 offspring, 252 SCLs were significantly annotated into 38 pathways, including glycerophospholipid metabolism, linoleic acid metabolism, arachidonic acid metabolism, alpha-linolenic acid metabolism, glycine, serine and threonine metabolism, and the cAMP signaling pathway (Figure 2E). For the comparison between Ningxiang pigs and F1 offspring, and 50 SCLs were significantly annotated into 31 pathways, including teichoic acid biosynthesis, inositol phosphate metabolism, steroid biosynthesis, ovarian steroidogenesis, glycerolipid metabolism, and the phosphatidylinositol signaling system (Figure 2F). Thus, there were 423, 252, and 50 SCLs up- or downregulated between Berkshires and Ningxiang pigs, between Berkshires and F1 offspring, and between Ningxiang pigs and F1 offspring, respectively (Figure 3A). In total, 13 SCLs were commonly identified in the three pairwise comparisons (Figure 3A). Additionally, there were 12, nine, and six KEGG pathways (p < 0.05) enriched in the comparison between Berkshires and Ningxiang pigs, between Berkshires and F1 offspring, and between Ningxiang pigs and F1 offspring, respectively (Figure 3B). Interestingly, nine pathways were commonly enriched in Berkshires vs. Ningxiang pigs and in Berkshires vs. F1 offspring, including seven pathways (KO05231, KO00563, KO00591, KO00592, KO00590, and KO00564) involved in lipid metabolism; one pathway (KO00260) involved in glycine, serine, and threonine metabolism; and one pathway (KO04723) involved in retrograde endocannabinoid signaling (Figure 3B). Moreover, three pathways were commonly enriched in Berkshires vs. Ningxiang pigs and in Ningxiang pigs vs. F1 offspring, including inositol phosphate metabolism (kO00562), teichoic acid biosynthesis (KO00552), and the phosphatidylinositol signaling system (KO04070) (Figure 3B). Moreover, three pathways were uniquely enriched in Ningxiang pigs vs. F1 offspring, including steroid biosynthesis (KO00100), ovarian steroidogenesis (KO04913), and bile secretion (KO04976).
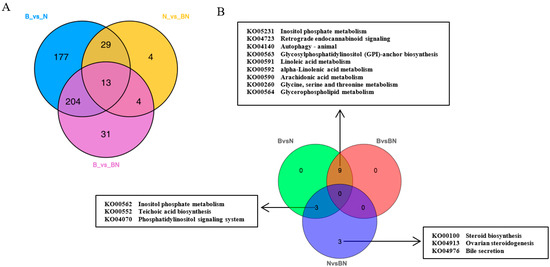
Figure 3.
(A) Venn diagram of the SCLs identified by lipidomic analysis in the groups of Berkshires vs. Ningxiang pigs, in Berkshires vs. F1 offspring, and in Ningxiang pigs vs. F1 offspring. (B) Venn diagram analysis of KEGG pathways (p < 0.05) based on the SCLs in Berkshires vs. Ningxiang pigs, in Berkshires vs. F1 offspring, and in Ningxiang pigs vs. F1 offspring. Eighteen samples of subcutaneous adipose from six Ningxiang pigs, six Berkshires and six F1 pigs, respectively, were used to detect lipidomic profile. B, Berkshires; N, Ningxiang pig; BN, F1 offspring.
3.3. Transcriptome Data Analysis
Transcriptome sequencing of the subcutaneous adipose tissue of Ningxiang pigs, Berkshires, and F1 offspring was performed, in order to verify the reliability of the results, and their correlations were analyzed. The correlation analysis indicated a strong correlation within groups, and that the correlations between the groups were slightly lower (Figure S4A). As shown in the heatmap (Figure S4B–D), the expression patterns of DEGs were consistent with the sample groups. We counted the DEGs among the three different groups. We found 395 upregulated genes and 285 downregulated genes, and a total of 680 DEGs in the subcutaneous adipose tissue of the group of Berkshires vs. Ningxiang pigs (Figure 4A). There were 317 upregulated genes, and 275 downregulated genes, and a total of 592 DEGs in the subcutaneous adipose tissue of F1 offspring compared to that of Ningxiang pigs (Figure 4B). There were 230 upregulated genes, and 154 downregulated genes, and a total of 384 DEGs in the subcutaneous adipose tissue of F1 offspring compared to that of Berkshires (Figure 4C). Interestingly, the number of DEGs from the comparison between Berkshires and Ningxiang pigs was the greatest among the three different comparisons.
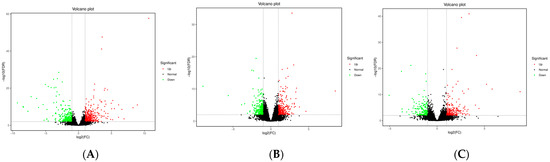
Figure 4.
Volcano plots of DEGs for the subcutaneous adipose tissue in the groups of Berkshires vs. Ningxiang pigs (A), Ningxiang pigs vs. F1 offspring (B), and Berkshires vs. F1 offspring (C). Twelve samples of subcutaneous adipose from four Ningxiang pigs, four Berkshires, and four F1 pigs, respectively, were used to detect transcriptomic profile.
On the basis of the identified DEGs, functional annotation and classification were performed via GO analysis. DEGs were classified into three primary categories, namely biological process (BP), cellular components (CC), and molecular functions (MF). For Berkshires vs. Ningxiang pigs, GO enrichment analysis of DEGs showed that the enriched biological processes were mainly enriched in the process related to xenobiotic metabolism, organic acid metabolism and L-serine biosynthesis (Figure S5A); the enriched cellular components were mainly enriched in collagen, lipid droplets and cytoplasm (Figure S5B); and the enriched molecular functions were mainly enriched in lipid binding and transmembrane receptor protein serine/threonine kinase activity (Figure S5C). For Ningxiang pigs vs. F1 offspring, GO enrichment analysis of DEGs, the enriched biological processes were mainly processes related to translation, brown fat cell differentiation and ATP synthesis coupled proton transport (Figure S5D); the enriched cellular components were mainly mitochondrial respiratory chain Complex I, collagen trimer and extracellular matrix (Figure S5E); and the enriched molecular functions were mainly for cytochrome-c oxidase activity, structural constituents of the ribosome and NADH dehydrogenase activity (Figure S5F). For the groups of Berkshires vs. F1 offspring, GO enrichment analysis of the DEGs, the enriched biological processes were mainly processes related to the response to xenobiotic stimulus, immune response and the specification of stem cell fate (Figure S5G); the enriched cellular components were mainly the extracellular region, cytoplasm, and collagen trimers (Figure S5H); the enriched molecular functions were mainly in chemokine activity, phosphoglycerate dehydrogenase activity, and sterol esterase activity (Figure S5I). Then, the DEGs were annotated with the KEGG pathways. There were 35, 22, and 19 KEGG pathways (p < 0.05) enriched in the comparison between Berkshires and Ningxiang pigs, Berkshires and F1 offspring, and Ningxiang pigs and F1 offspring, respectively (Figure 5). Interestingly, eight pathways were commonly enriched in the comparison between Berkshires and Ningxiang pigs, and between Berkshires and F1 offspring, six pathways were commonly enriched in comparison between F1 offspring and Ningxiang pigs, and between Berkshires and F1 offspring; and 11 pathways were commonly enriched in comparison between Berkshires and Ningxiang pigs and between Ningxiang pigs and F1 offspring (Figure 5). For Berkshires vs. Ningxiang pigs, KEGG analysis of the subcutaneous adipose tissue yielded significant pathways, such as the carbon metabolism, fatty acid metabolism, and fatty acid biosynthesis pathways (Figure 6A, Table S1). For Ningxiang pigs vs. F1 offspring, KEGG analysis revealed that the significant pathways were closely related to oxidative phosphorylation, thermogenesis and protein digestion and absorption (Figure 6B). For the groups of Berkshires vs. F1 offspring, KEGG analysis indicated that significant pathways were closely related to the TNF signaling pathway, cysteine and methionine metabolism and glycine, serine, and threonine metabolism (Figure 6C). Additionally, because of limitations of the small sample sizes (12 samples of subcutaneous adipose from four Ningxiang pigs, four Berkshires and four F1 offspring were used to detect the transcriptomic profiles, samples of four animals from each genetic grouping may not be sufficient for the analysis performed), the genes identified as DEGs could have occurred by chance, and, therefore, the results of the transcriptome data analysis are speculative.
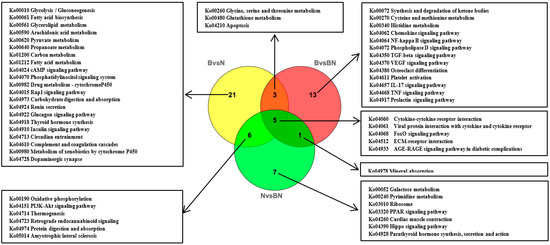
Figure 5.
Venn diagram of the KEGG pathway analysis (p < 0.05) based on DEGs in Berkshires vs. Ningxiang pigs, F1 offspring vs. Berkshires, and Ningxiang pigs vs. F1 offspring, based on transcriptomic data. B, Berkshires; N, Ningxiang pigs; BN, F1 offspring. Twelve samples of subcutaneous adipose from four Ningxiang pigs, four Berkshires, and four F1 pigs, respectively, were used to detect transcriptomic profile.
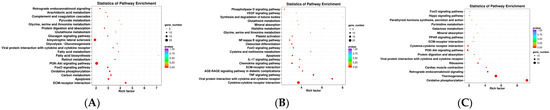
Figure 6.
The diagrams for the KEGG pathway enrichment of DEGs in Berkshires vs. Ningxiang pigs (A), Ningxiang pigs vs. F1 offspring (B), and Berkshires vs. F1 offspring (C). Twelve samples of subcutaneous adipose from four Ningxiang pigs, four Berkshires, and four F1 pigs, respectively, were used to detect the transcriptomic profile.
3.4. Joint Analysis of the Transcriptome and Lipidome Data
A joint analysis of the transcriptome and lipidome data were carried out to identify the origins of the transcriptomic and lipidomic differences among Ningxiang pigs, Berkshires, and F1 offspring. In total, 680 DEGs (395 upregulated and 285 downregulated) and 423 SCLs (11 upregulated and 412 downregulated) were identified in Berkshires vs. Ningxiang pigs, 384 DEGs (230 upregulated and 154 downregulated) and 252 SCLs (1 upregulated and 251 downregulated) were identified in the group of Berkshires vs. F1 offspring and 592 DEGs (317 upregulated and 275 downregulated) and 50 SCLs (43 upregulated and 7 downregulated) were identified in Ningxiang pigs vs. F1 offspring. Furthermore, pathway annotation was performed and the significant pathways were annotated with the DEGs and SCLs for Berkshires vs. Ningxiang pigs (Figure 7A), Berkshires vs. F1 offspring (Figure 7B), and Ningxiang pigs vs. F1 offspring (Figure 7C), respectively. Interestingly, the most significantly enriched pathways for the DEGs and SCLs in both the comparison between Berkshires and Ningxiang pigs, and between Berkshires and F1 offspring, were the glycine, serine, and threonine metabolism pathways (Figure 7A,B).
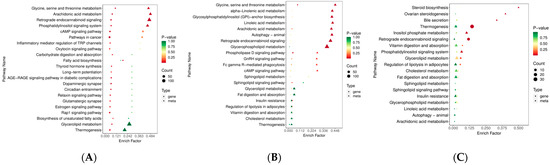
Figure 7.
The diagrams for the degree of KEGG pathway enrichment of the DEGs and SCLs in the subcutaneous adipose tissue from Berkshires vs. Ningxiang pigs (A), Berkshires vs. F1 offspring (B), Ningxiang pigs vs. F1 offspring (C).
3.5. Screening of the Candidate Genes and Lipids with the Combined Transcriptomic and Lipidomic Data
KO00260, the lycine, serine, and threonine metabolism pathways, significantly enriched in Berkshires vs. Ningxiang pigs and Berkshires vs. F1 offspring, respectively. For Berkshires vs. Ningxiang pigs, DEGs related to KO00260, the lycine, serine, and threonine metabolism pathways, such as phosphoglycerate dehydrogenase (PHGDH), phosphoglycerate dehydrogenase like protein (LOC100156167), and glycine hydroxymethyltransferase (SHMT1) were significantly downregulated, whereas phosphoserine phosphatase (PSPH) and membrane primary amine oxidase-like (LOC110256000) were significantly upregulated (Figure 8A). In addition, the content of the SCLs related to KO00260, (32 phosphatidylserines) of the subcutaneous adipose tissue were reduced in Berkshires vs. Ningxiang pigs (Figure S6A). For the group of Berkshires vs. F1 offspring, PHGDH was significantly downregulated, whereas, LOC110256000 and serine dehydratase (SDS) were significantly upregulated (Figure 8B). Moreover, the content of the SCLs related to KO00260, (31 phosphatidylserines) of the subcutaneous adipose tissue were reduced in Berkshires vs. F1 offspring (Figure S6B). PHGDH is a key enzyme of the serine synthesis pathway [21]. In this study, PHGDH was significantly downregulated in the subcutaneous adipose tissue of Ningxiang pigs and F1 offspring compared to that of Berkshires, and the content of phosphatidylserines in the subcutaneous adipose tissue of Ningxiang pigs and F1 offspring was reduced compared to that of Berkshires. The SCLs and DEGs (Pearson correlation coefficient > 0.8 and p-value < 0.05) in the KEGG pathways were selected to study the correlation between the SCLs and DEGs. The results indicated that the expression of PHGDH and LOC100156167 were positively correlated with the content of phosphatidylserines, while the expression of LOC110256000 was negatively correlated with the content of phosphatidylserines in the group of Berkshires vs. Ningxiang pigs (Figure 8C) and in Berkshires vs. F1 offspring (Figure 8D).
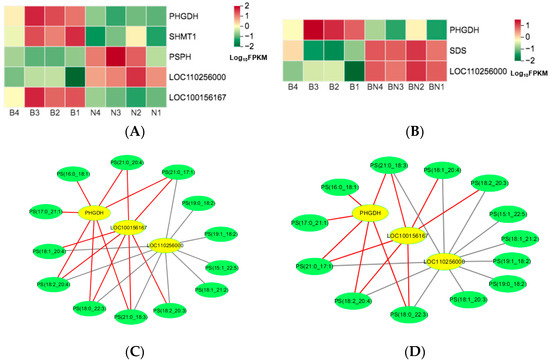
Figure 8.
Heat maps of DEGs for the KO00260 pathway in Berkshires vs. Ningxiang pigs (A) and Berkshires vs. F1 offspring (B), respectively. B, Berkshires; N, Ningxiang pigs; BN, F1 offspring. Correlation network diagram for the KO00260 (the lycine, serine and threonine metabolism) pathways in Berkshires vs. Ningxiang pigs (C) and Berkshires vs. F1 offspring (D), respectively. Yellow circles represent genes, green circles represent lipids, red lines represent positive correlations, gray lines represent negative correlations.
For Berkshires vs. Ningxiang pigs, DEGs related to the KO00061 (fatty acid biosynthesis) pathways, such as, fatty acid synthase (FASN), acetyl-CoA carboxylase (ACACA), carboxyl reductase 4 (CBR4), and medium chain acyl hydrolase (MCH) were upregulated (Figure 9A). Moreover, the content of the SCLs related to the KO00061 pathways of the subcutaneous adipose tissue, namely palmitoleic acid, was reduced in Berkshires vs. Ningxiang pigs (Figure 9B). However, KO00061 was not significantly enriched in the comparison between Ningxiang pigs and F1 offspring, and between Berkshires and F1 offspring, indicating after crossing Berkshires with Ningxiang pigs, DEGs related to the KO00061 pathway (FASN, ACACA, CBR4, MCH) of F1 offspring were upregulated and the relative content of palmitoleic acid was reduced in the subcutaneous adipose tissue of F1 offspring compared to that of Berkshires.
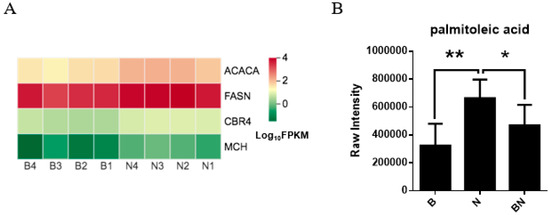
Figure 9.
(A) Heat maps of the DEGs for the KO00061 (fatty acid biosynthesis) pathways in Berkshires vs. Ningxiang pigs. B, Berkshires; N, Ningxiang pigs. (B) The column chart of palmitoleic acid, in Berkshires pigs vs. Ningxiang pigs. B, Berkshires; N, Ningxiang pigs; BN, F1 offspring. * represents p < 0.05, ** represents p < 0.01.
KO01040, the biosynthesis of unsaturated fatty acids pathway, was enriched in Berkshires vs. Ningxiang pigs. The DEGs related to KO01040, such as elongation of very long chain fatty acids protein 6 (ELOV6) and stearoyl-CoA desaturase (SCD) were upregulated, and very long-chain (3R)-3-hydroxyacyl-CoA dehydratase 2 (HACD2) was downregulated in the subcutaneous adipose tissue of Ningxiang pigs compared to that of Berkshires (Figure 10A). In addition, the content of the SCLs related to kO01040, such as palmitoleic acid, linoleic acid, icosadienoic acid, and arachidonic acid were reduced in the subcutaneous adipose tissue of Berkshires vs. Ningxiang pigs (Figure 10B). The KO00591 (linoleic acid metabolism) pathway was significantly enriched in Berkshires vs. Ningxiang pigs. There was one DEG, namely cytochrome P450 family 3 subfamily A46 (CYP3A46), and three SCLs, namely linoleic acid, arachidonic acid and 9,10-DHOME, that were involved in the linoleic acid metabolism pathway. CYP3A46 was upregulated in the subcutaneous adipose tissue of Ningxiang pigs compared to that of Berkshires.
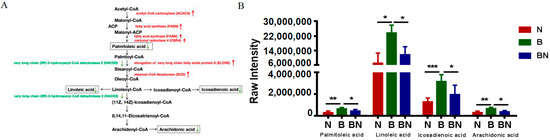
Figure 10.
(A) The DEGs and SCLs related to the KO01040 (biosynthesis of unsaturated fatty acids) in Berkshires vs. Ningxiang pigs. Red represents upregulation, green represents downregulation. (B) The column chart of the SCLs related to the KEGG pathway (kO01040) in Berkshires, Ningxiang pigs, and F1 pigs. * represents p < 0.05, ** represents p < 0.01, *** represents p < 0.001.
In KO00590 (arachidonic acid metabolism), the DEGs, namely gamma-glutamyltranspeptidase (GGT5), cytochrome P450 4F6-like (LOC110255237), microsomal prostaglandin-E synthase 1 (PTGES), salivary lipocalin (SAL1), and glutathione peroxidase 1 (GPX1), were upregulated, while cytochrome P450 family 2 subfamily B22 (CYP2B22) and glutathione peroxidase 3 (GPX3) were downregulated in the subcutaneous adipose tissue of Ningxiang pigs compared to that of Berkshires (Figure 11A). The relative content of arachidonic acid in the subcutaneous adipose tissue of Ningxiang pigs was lower compared to that of Berkshires. In Berkshires vs. F1 offspring, the DEGs related to the KO00590 pathway, namely glutathione peroxidase 1 (GPX1), prostaglandin-endoperoxide synthase 2 (PTGS2), and phospholipase A2 group IVA (PLA2G4A), were upregulated (Figure 11B). The correlation analysis of the SCLs and DEGs in the KO00590 pathway suggested that the expression of PTGES and LOC110255237 were positively correlated with the content of arachidonic acid and some phosphatidylcholines, and the expression of GPX1 was negatively correlated with the content of arachidonic acid and some phosphatidylcholines in Berkshires vs. Ningxiang pigs (Figure 11C). Moreover, the expression of GPX1 was negatively correlated with the content of some phosphatidylcholines and the expression of PLA2G4A was negatively correlated with the content of one phosphatidylcholine in Berkshires pigs vs. F1 offspring (Figure 11D).
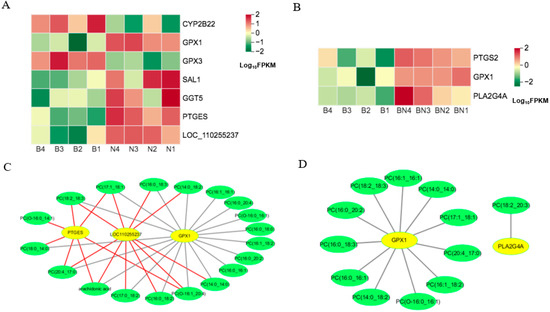
Figure 11.
(A,B) Heat maps of the DEGs for the KO00590 pathway in Berkshires vs. Ningxiang pigs (A) and Berkshires vs. F1 offspring (B). B, Berkshires; N, Ningxiang pigs; BN, F1 offspring. Correlation network diagram for the KO00590 pathway in Berkshires vs. Ningxiang pigs (C) and Berkshires vs. F1 offspring (D). Yellow circles represent genes, green circles represent lipids, red lines represent positive correlations and gray lines represent negative correlations.
The results indicated that the content of palmitoleic acid, arachidonic acid, linoleic acid, and eicosadienoic acid in the subcutaneous adipose tissue of Ningxiang pigs was lower than that of Berkshires, and the key genes of the KEGG pathways belonging to fatty acid biosynthesis and metabolism exhibited differences in their expression in the subcutaneous adipose tissue between Berkshires and Ningxiang pigs and between Berkshires and F1 offspring. The identified key genes may contribute to the improvements in the content of palmitoleic acid, arachidonic acid, linoleic acid, and eicosadienoic acid in Ningxiang pig through molecular design breeding.
For Berkshires vs. Ningxiang pigs, the DEGs related to KO00561 (glycerolipid metabolism) pathways, such as acylglycerol lipase (MGLL) and diacylglycerol O-acyltransferase 2 (DGAT2) were upregulated, whereas, glycerol kinase (GK), diacylglycerol kinase beta (DGKB), and phosphatidate phosphatase (LPIN1) were downregulated (Figure 12A). The correlation analysis of SCLs and DEGs in the KO00561 pathway suggested that the expression of DGAT2 was negatively correlated with the content of the majority of diacylglycerols and triglycerides and the expression of LPIN1 and DGKB was positively correlated with the content of the majority of diacylglycerols and triglycerides. Additionally, the expression of MGLL was negatively correlated with the content of the majority of diacylglycerols, triglycerides, and phosphatidic acids (Figure 12B).
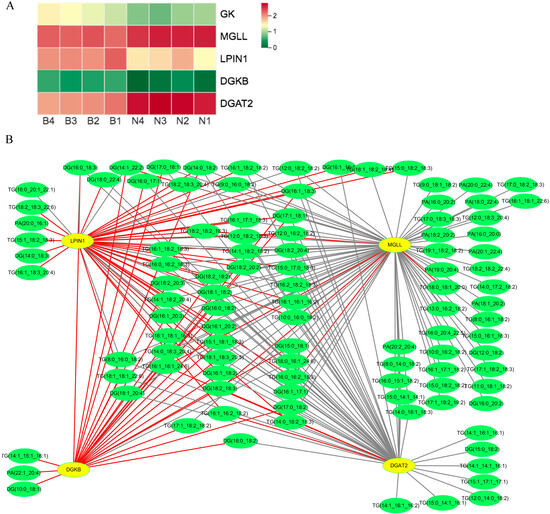
Figure 12.
(A) Heat maps of the DEGs for the KO00561 pathway in Berkshires vs. Ningxiang pigs. B, Berkshires; N, Ningxiang pigs; BN, F1 offspring. (B) Correlation network diagram for the KO00561 pathway in Berkshires vs. Ningxiang pigs. Yellow circles represent genes, green circles represent lipids, red lines represent positive correlations, and gray lines represent negative correlations.
3.6. Validation of the Results by RT-qPCR
To verify the accuracy of RNA-seq data, 12 DEGs (GPX1, GPX3, LPIN1, MGLL, CYP2B22, DGAT2, FASN, ACACA, SCD, PSPH, ELOV6, and HACD2) from the group of Berkshires vs. Ningxiang pigs were randomly selected for RT-qPCR analysis. The results showed that the expression patterns of these DEGs in RT-qPCR were consistent with RNA-seq (Figure 13A), and the correlation between the two methods was relatively strong, with a correlation coefficient of 0.94 (R2 = 0.89, Figure 13B), which indicated that the DEGs identified from RNA-seq in this study were reliable.
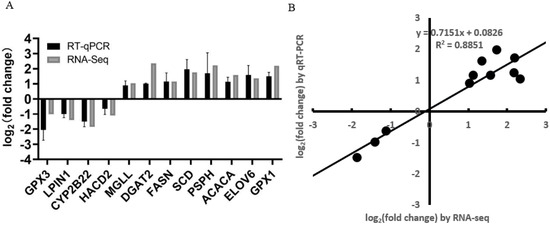
Figure 13.
(A) Histogram of RNA-seq and RT−qPCR expression levels. The X−axis represents the 12 selected DEGs, and the Y-axis represents the expression levels of DEGs from RNA−seq and RT−qPCR. (B) The linear regression analysis of expression level between RNA−seq and RT−qPCR data. Eighteen samples of subcutaneous adipose from six Ningxiang pigs, six Berkshires and six F1 pigs, respectively, were used to conduct RT−qPCR.
4. Discussion
4.1. Large Differences Existed in the Lipid Composition of the Subcutaneous Adipose Tissue among Ningxiang Pigs, Berkshires and F1 Offspring
In total, 1293 lipids were detected. Of the detected lipids, 32.48% were TGs, 6.03% were DGs, 6.19% were Cer-ASs, 6.11% were PEs, 5.88% were PCs, and 5.34% were PSs. Compared with Berkshires, Ningxiang pigs had 412 downregulated and 11 upregulated lipids, Cer(d18:0/18:0) was highly significantly upregulated, while linolenic acid and pentadecanoic acid were highly significantly downregulated (Figure S7). Correlation analysis was performed on the SCLs, mapping the top 50 VIP values, in the subcutaneous adipose tissue of Berkshires vs. Ningxiang pigs, and the majority of the lipids were positively correlated, although the Cer(d18:0/18:0) and TG(18:0_16:1_24:6) were negatively correlated (Figure S8). The F1 offspring had 251 downregulated and one SP upregulated lipids in the subcutaneous adipose tissue compared to that of Berkshires. Cer(d18:0/18:0) was highly significantly upregulated, while linolenic acid and pentadecanoic acid were not significantly downregulated in the subcutaneous adipose tissue of F1 offspring compared to that of Berkshires (Figure S9A). For the comparison of Ningxiang pigs vs. F1 offspring, 50 SCLs were screened. Compared with Ningxiang pigs, F1 offspring had just seven downregulated and 43 upregulated lipids in the subcutaneous adipose tissue, and linolenic acid and pentadecanoic acid were highly significantly downregulated, while Cer(d18:0/18:0) was not significantly upregulated (Figure S9B). The relative content of linolenic acid and pentadecanoic acid were highly significantly regulated in the subcutaneous adipose tissue of F1 offspring compared to that of Ningxiang pigs.
4.2. The DEGs and SCLs Related to the KEGG Pathways Belonging to Fatty Acids Biosynthesis and Metabolism Contributed to the Differences in Fatty Acid Composition of Adipose Tissue and Fat Deposition among Ningxiang, Berkshires, and F1 Offspring
The Ningxiang pig is a famous Chinese indigenous breed with excellent meat quality. The Berkshires is a typical lean breed, famous for its high lean meat percentage and fast growth rate. Moreover, Berkshires have been under intensive artificial selection and genetic improvement of important traits, such as growth rate, lean meat percentage and backfat thickness [22]. As knowledge about a healthy diet has grown, the consumers now prefer to increase their intake of PUFAs and reduce their SFAs [23]. Thus, we focused on backfat thickness and the fatty acid composition of subcutaneous adipose tissue. Muti-omics association analyses of local pig breeds and modern pig breeds can screen the candidate genes for backfat thickness and the fatty acid composition of the subcutaneous adipose tissue. These genes likely have undergone artificial selection. In this study, a total of 38 fatty acyls (14 SFAs, 13 MUFAs, and 11 PUFAs) were detected. Two SFAs (C(14:0), pentadecanoic acid), three MUFAs (9,10-DiHOME, palmitoleic acid, and heptadecanoic acid), and five PUFAs (linoleic acid, linolenic acid, eicosadienoic acid, arachidonic acid, and docosapentaenoic acid) were downregulated in the subcutaneous adipose tissue of Berkshires vs. Ningxiang pigs. Moreover, 9,10-DiHOME, linoleic acid and docosapentaenoic acid were downregulated in the subcutaneous adipose tissue of Berkshires vs. F1 offspring. In addition, C(14:0), pentadecanoic acid and linolenic acid were upregulated in the subcutaneous adipose tissue of the group Ningxiang pigs vs. F1 offspring. This suggested that the relative content of MUFAs and PUFAs in the subcutaneous fat of Berkshires was higher compared to that of Ningxiang pigs or F1 offspring, and the relative content of C(14:0), pentadecanoic acid, and linolenic acid of F1 offspring was higher compared to that of Ningxiang pigs. It was reported that the adipose tissue of local pig breeds contained a lower proportion of PUFAs compared with that of modern pig breeds [4,24]. This was consistent with our study. Interestingly, these MUFAs (palmitoleic acid) and PUFAs (linolenic acid, linoleic acid, arachidonic acid, and eicosadienoic acid) were involved in multiple KEGG pathways belonging to fatty acids biosynthesis and metabolism, such as the KO00061 (fatty acid biosynthesis) pathway, the KO01040 (biosynthesis of unsaturated fatty acids) pathway, the KO00590 (arachidonic acid metabolism) pathway, and KO00591 (linoleic acid metabolism) pathways. Moreover, DEGs, such as FASN, ACACA, CBR4, and MCH, ELOV6, SCD, and HACD2, GGT5, PTGES, SAL1, GPX1, GPX3, CYP2B22, PTGS2, PLA2G4A, and CYP3A46, may play vital roles in the fatty acid composition of adipose tissue and the content of MUFAs and PUFAs. FASN is a key enzyme of the de novo synthesis of fatty acids pathways. ACACA catalyzes the irreversible formation of malonyl-CoA from acetyl-CoA, and acetyl-CoA is the precursor of de novo synthesized fatty acids. These genes played important roles in the fatty acid composition of meat [25]. ELOV6, FASN, and SCD were identified by genome-wide association studies (GWAS) as candidate genes for the fatty acid composition of the backfat of multiple pig populations [26,27]. In the Alentejano fat breed, the activity of acetyl-CoA carboxylase in the dorsal subcutaneous fat was three- and ninefold higher than that in the Large White lean breed [28], which was consistent with the results of this study. Moreover, several comparative transcriptomic studies indicated that FASN and ACACA were upregulated in indigenous breeds compared with modern pig breeds [29,30,31]. FASN and ACACA play vital roles in fatty acid biosynthesis and lipid metabolism. Moreover, it was reported that the content of palmitoleic acid was closely associated with intramuscular fat, meat color, and PH24h (PH value at 24 h after slaughter), and palmitoleic acid might be a promising indicator of superior meat quality [32]. In this study, the relative content of palmitoleic acid in the subcutaneous adipose tissue of Ningxiang pigs was lower compared to that of Berkshires. ELOV6 catalyzes the elongation of fatty acids [33], and SCD is essential for the desaturation of fatty acids [34]; both ELOV6 and SCD play important roles in the synthesis of MUFAs. It has been reported that Meishan pigs show lower activity of stearoyl-coA desaturase in the subcutaneous adipose tissue compared to that of Large White [15]. This was also consistent with our study. In this study, SCD was upregulated in the subcutaneous adipose tissue for the group of Berkshires vs. Ningxiang pigs. These DEGs and SCLs contributed to the differences in the fatty acid composition of adipose tissue and fat deposition among Ningxiang pig, Berkshires, and F1 offspring.
4.3. Overlap between KEGG Pathway-Related Genes Screened by Muti-Omics Association Analysis and Artificially Selected Genes
The key genes screened by muti-omics association analysis were probably selected by humans when breeding pigs. The analysis revealed 19, 16, and seven KEGG pathways (p < 0.05) enriched in Berkshires vs. Ningxiang pigs, in Berkshires vs. F1 offspring, and in Ningxiang pigs vs. F1 offspring, respectively, according to the transcriptomics data (Figure 7B). Additionally, 52, 30, and 35 KEGG pathways (p < 0.05) were enriched in Berkshires vs. Ningxiang pigs, in Berkshires vs. F1 offspring, and in Ningxiang pigs vs. F1 offspring, respectively, according to the transcriptomics data (Figure 4). The comparative genomic analysis between indigenous breeds and modern pig breeds uncovered the selection regions and KEGG pathways related to the candidate genes in those regions [35,36,37,38]. A comparative genomic analysis indicated that the candidate genes related to KEGG pathway ‘phosphatidylinositol signaling system’, and ‘inositol phosphate metabolism’ in the selection regions indicated by the Fst statistics were significantly enriched in Duroc vs. Xiang pig, and the candidate genes related to the KEGG pathway ‘thermogenesis’ in selection regions indicated by the Fst statistics were enriched in Yorkshire vs. Xiang pigs [39]. Another study found that the KEGG pathway ‘carbohydrate digestion and absorption’ related to the candidate genes in selective regions from Fst statistics was significantly enriched in the group of Anqing six-end-white pig (ASP) vs. Asian wild boars [40]. Interestingly, the results of our study suggested that the KO04070 (phosphatidylinositol signaling system) pathway, the KO00562 (inositol phosphate metabolism) pathway, and KO04714 (thermogenesis) pathways were significantly enriched in Berkshires vs. Ningxiang pigs and in Berkshires vs. F1 offspring. The KO04973 (carbohydrate digestion and absorption) pathway was significantly enriched in the group of Berkshires vs. Ningxiang pigs. This suggested that the genes related to these KEGG pathways were probably under intense artificial selection. For instance, FASN and ACACA were the DEGs of the KO00061 (fatty acid biosynthesis) pathway, which was significantly enriched in the groups of Berkshires vs. Ningxiang pigs. The Asian allele of FASN was thought to have an important effect on backfat phenotypes and was under strong selection in modern European pig breeds [41]. ACACA is located in selected regions detected by the CLR test in Chinese indigenous breeds and Yorkshires [42].
4.4. Application of Multi-Omics Data to Pig Breeding for Improving the Backfat Thickness and Fatty Acid Composition of Adipose Tissue
With the dramatic growth of multi-omics data, its integration into analyses can reveal candidate genes for complex traits and gene regulatory networks. However, it is still a challenge to integrate the multi-omics data [43]. The identification of functional variants in candidate genes, which can be screened through the use of integrated multi-omics data, may provide more useful new functional molecular markers and biomarkers for pig breeding [23,44,45]. Intelligent algorithms were used to optimize the prediction effect of these functional molecular markers and biomarkers [46]. Thus, mining the candidate genes using multi-omics data was an important step. In this study, multiple genes related to KEGG pathways were associated with backfat thickness and the fatty acid composition of adipose tissue. Some genes, such as FASN, SCD, ACACA, and ELOV6, are considered to be important functional genes for backfat thickness and the fatty acid composition of adipose tissue. We validated the credibility of our research results in multiple dimensions. These candidate genes will be used to identify functional variants and develop functional molecular markers. We have provided a possible method of applying multi-omics data to pig breeding.
5. Conclusions
Ningxiang pig acted as the male parents in a cross with Berkshires, and the meat quality of their offspring (F1) was superior (data unpublished). In order to study the molecular mechanism of the differences in fat deposition among Ningxiang, Berkshires, and F1 offspring, transcriptomic, and lipidomic analyses were conducted. The functional enrichment analysis indicated that the pathways of the glycine, serine, and threonine metabolism, arachidonic acid metabolism, fatty acid biosynthesis, linoleic acid metabolism, alpha-linolenic acid metabolism, and glycerophospholipid metabolism were significantly enriched in comparisons of the Ningxiang pig, Berkshires, and F1 crosses vs. Berkshires. The difference in fat deposition among Ningxiang pig, Berkshires, and F1 offspring may be caused by the differences in the expression pattern of the key genes in multiple enrichment KEGG pathways. We found that the DEGs (PHGDH, LOC110256000) and the SCLs (phosphatidylserines) were significantly correlated and played a vital role in glycine, serine, and threonine metabolism. FASN, ACACA, CBR4, SCD, ELOV6, HACD, CYP3A46, CYP2B22, GPX1, and GPX3, which are related to fatty acid biosynthesis and metabolism, were identified as key genes that affect the content of palmitoleic acid, linoleic acid, arachidonic acid, and eicosadienoic acid in the subcutaneous adipose tissue. This study screened key genes and lipids, and investigated the molecular mechanisms of the differences in fat deposition among Ningxiang pig, Berkshires, and F1 offspring.
Supplementary Materials
The following supporting information can be downloaded at: https://www.mdpi.com/article/10.3390/ani13213321/s1.
Author Contributions
Conceptualization, K.X. and Y.Y.; methodology, X.D.; software, X.D.; validation, X.D., K.X., Y.Z., Y.F., Y.C. and Q.W.; formal analysis, X.D., G.S. and Z.J.; investigation, X.D., Y.Z., G.S., Y.F, Y.C., H.G., Q.W. and Z.J.; resources, Y.Y., K.X. and Y.Z.; data curation, K.X.; writing—original draft preparation, X.D.; writing—review and editing, K.X.; visualization, X.D. and H.G.; supervision, K.X. and Y.Y.; project administration, Y.Y.; funding acquisition, Y.Y.; X.D. and Y.Z. contributed equally to this work. All authors have read and agreed to the published version of the manuscript.
Funding
This work was supported by the Special Funds for the Laboratory of Lingnan Modern Agriculture Project (NT2021005), the Special Funds for the Construction of Innovative Provinces in Hunan (Grant numbers 2021NK1009 and 2021NK1012), the Natural Science Foundation of Hunan Province Project (2023JJ20043 and 2020JJ5635), the Natural Science Foundation of Guangxi Province (2020JJB130030), The science and technology innovation Program of Hunan Province (Grant numbers, 2023RC3204), and Open Fund of Key Laboratory of Agro-ecological Processes in Subtropical Region, Chinese Academy of Sciences, No. ISA2023202.
Institutional Review Board Statement
The study was conducted according to the guidelines of the Declaration of Helsinki and approved by the Animal Protocol Review Committee of the Institute of Subtropical Agriculture, Chinese Academy of Science (No. ISA-2023-0020, approval date: 20 February 2023).
Informed Consent Statement
Not applicable.
Data Availability Statement
The data presented in this study are available in the Supplementary Materials.
Acknowledgments
We thank Huang Ping (The Institute of Subtropical Agriculture, The Chinese Academy of Sciences) for the validation of RT-qPCR.
Conflicts of Interest
The authors declare no conflict of interest.
References
- Kershaw, E.E.; Flier, J.S. Adipose tissue as an endocrine organ. J. Clin. Endocrinol. Metab. 2004, 89, 2548–2556. [Google Scholar] [CrossRef] [PubMed]
- Barea, R.; Nieto, R.; Aguilera, J.F. Effects of the dietary protein content and the feeding level on protein and energy metabolism in Iberian pigs growing from 50 to 100 kg body weight. Animal 2007, 1, 357–365. [Google Scholar] [CrossRef] [PubMed]
- Wood, J.D.; Enser, M.; Fisher, A.V.; Nute, G.R.; Sheard, P.R.; Richardson, R.I.; Hughes, S.I.; Whittington, F.M. Fat deposition, fatty acid composition and meat quality: A review. Meat Sci. 2008, 78, 343–358. [Google Scholar] [CrossRef] [PubMed]
- Barea, R.; Isabel, B.; Nieto, R.; López-Bote, C.; Aguilera, J.F. Evolution of the fatty acid profile of subcutaneous back-fat adipose tissue in growing Iberian and Landrace × Large White pigs. Animal 2013, 7, 688–698. [Google Scholar] [CrossRef] [PubMed]
- Zhang, Z.W.; Liao, Q.C.; Sun, Y.; Pan, T.L.; Liu, S.Q.; Miao, W.W.; Li, Y.X.; Zhou, L.; Xu, G.X. Lipidomic and Transcriptomic Analysis of the Longissimus Muscle of Luchuan and Duroc Pigs. Front. Nutr. 2021, 8, 667622. [Google Scholar] [CrossRef] [PubMed]
- Huang, Y.N.; Ao, Q.W.; Jiang, Q.Y.; Guo, Y.F.; Lan, G.Q.; Jiang, H.S. Comparisons of different myosin heavy chain types, AMPK, and PGC-1α gene expression in the longissimus dorsi muscles in Bama Xiang and Landrace pigs. Genet. Mol. Res. 2016, 15, 15028379. [Google Scholar] [CrossRef] [PubMed]
- Poklukar, K.; Čandek-Potokar, M.; Batorek Lukač, N.; Tomažin, U.; Škrlep, M. Lipid Deposition and Metabolism in Local and Modern Pig Breeds: A Review. Animals 2020, 10, 424. [Google Scholar] [CrossRef] [PubMed]
- Subramanian, I.; Verma, S.; Kumar, S.; Jere, A.; Anamika, K. Multi-omics data integration, interpretation, and its application. Bioinform. Biol. Insights 2020, 14, 1177932219899051. [Google Scholar] [CrossRef]
- Wang, L.Y.; Zhang, Y.W.; Zhang, B.; Zhong, H.A.; Lu, Y.F.; Zhang, H. Candidate gene screening for lipid deposition using combined transcriptomic and proteomic data from Nanyang black pigs. BMC Genom. 2021, 22, 441. [Google Scholar] [CrossRef]
- Yang, Y.L.; Yan, J.Y.; Fan, X.H.; Chen, J.X.; Wang, Z.S.; Liu, X.Q.; Yi, G.Q.; Liu, Y.W.; Niu, Y.C.; Zhang, L.C.; et al. The genome varation and developmental transcriptiome maps reveal genetic differentiation of skeletal muscle in pigs. PLoS Genet. 2021, 17, e1009910. [Google Scholar] [CrossRef]
- Xie, C.L.; Teng, J.Y.; Wang, X.K.; Xu, B.Y.; Niu, Y.R.; Ma, L.B.; Yan, X.H. Multi-omics analysis reveals gut microbiota-induced intramuscular fat deposition via regulating expression of lipgenesis-associated genes. Anim. Nutr. 2021, 9, 84–99. [Google Scholar] [CrossRef] [PubMed]
- Yang, H.; Wu, J.Y.; Huang, X.C.; Zhou, Y.Y.; Zhang, Y.F.; Liu, M.; Liu, Q.; Ke, S.L.; He, M.Z.; Fu, H.; et al. ABO genotype alters the gut microbiota by regulating GalNAc levels in pigs. Nature 2022, 606, 358–367. [Google Scholar] [CrossRef] [PubMed]
- Lebret, B.; Dourmad, J.Y.; Mourot, J.; Pollet, P.Y.; Gondret, F. Production performance, carcass composition, and adipose tissue traits of heavy pigs: Influence of breed and production system. J. Anim. Sci. 2014, 92, 3543–3556. [Google Scholar] [CrossRef] [PubMed]
- Palma-Granados, P.; Seiquer, I.; Benítez, R.; Óvilo, C.; Nieto, R. Effects of lysine deficiency on carcass composition and activity and gene expression of lipogenic enzymes in muscles and backfat adipose tissue of fatty and lean piglets. Animal 2019, 13, 2406–2418. [Google Scholar] [CrossRef]
- Kouba, M.; Mourot, J.; Peiniau, P. Stearoyl-CoA desaturase activity in adipose tissues and liver of growing Large White and Meishan pigs. Comp. Biochem. Physiol. Part B Biochem. Mol. Biol. 1997, 118, 509–514. [Google Scholar] [CrossRef] [PubMed]
- Zhu, J.; Peng, Y.L.; Li, S.C.; Sun, J.B.; Liu, X.L.; Yang, S.L. Study on genetic resources and germplasm characteristics of Ningxiang pigs. J. Hunan Agric. Univ. Nat. Sci. 2008, 34, 47–51. [Google Scholar]
- Zhan, H.W.; Xiong, Y.C.; Wang, Z.C.; Dong, W.J.; Zhou, Q.C.; Xie, S.S.; Li, X.Y.; Zhao, S.H.; Ma, Y.L. Integrative analysis of transcriptomic and metabolomic profiles reveal the complex molecular regulatory network of meat quality in Enshi black pigs. Meat Sci. 2022, 183, 108642. [Google Scholar] [CrossRef]
- Love, M.I.; Huber, W.; Anders, S. Moderated estimation of fold change and dispersion for RNA-seq data with DESeq2. Genome Biol. 2014, 15, 550. [Google Scholar] [CrossRef]
- Young, M.D.; Wakefield, M.J.; Smyth, G.K.; Oshlack, A. Gene ontology analysis for RNA-seq: Accounting for selection bias. Genome Biol. 2010, 11, R14. [Google Scholar] [CrossRef]
- Mao, X.; Cai, T.; Olyarchuk, J.G.; Wei, L. Automated genome annotation and pathway identification using the KEGG Orthology (KO) as a controlled vocabulary. Bioinformatics 2005, 21, 3787–3793. [Google Scholar] [CrossRef]
- Vandekeere, S.; Dubois, C.; Kalucka, J.; Sullivan, M.R.; García-Caballero, M.; Goveia, J.; Chen, R.; Diehl, F.F.; Bar-Lev, L.; Souffreau, J.; et al. Serine Synthesis via PHGDH Is Essential for Heme Production in Endothelial Cells. Cell Metab. 2018, 28, 573–587.e513. [Google Scholar] [CrossRef] [PubMed]
- Li, M.Z.; Tian, S.L.; Yeung, C.K.L.; Meng, X.H.; Tang, Q.Z.; Niu, L.L.; Wang, X.; Jin, L.; Ma, J.D.; Long, K.R.; et al. Whole-genome sequencing of Berkshire (European native pig) provides insights into its origin and domestication. Sci. Rep. 2014, 4, 4678. [Google Scholar] [CrossRef] [PubMed]
- Schenker, S. UK recommendations for dietary fat: Should they be reassessed in light of the recent joint FAO/WHO recommendations? Nutr. Bull. 2012, 37, 37–46. [Google Scholar] [CrossRef]
- Madeira, M.S.; Pires, V.M.; Alfaia, C.M.; Costa, A.S.; Luxton, R.; Doran, O.; Bessa, R.J.; Prates, J.A. Differential effects of reduced protein diets on fatty acid composition and gene expression in muscle and subcutaneous adipose tissue of Alentejana purebred and Large White × Landrace × Pietrain crossbred pigs. Br. J. Nutr. 2013, 110, 216–229. [Google Scholar] [CrossRef] [PubMed]
- Gallardo, D.; Quintanilla, R.; Varona, L.; Díaz, I.; Ramírez, O.; Pena, R.N.; Amills, M. Polymorphism of the pig acetyl-coenzyme A carboxylase alpha gene is associated with fatty acid composition in a Duroc commercial line. Anim. Genet. 2009, 40, 410–417. [Google Scholar] [CrossRef] [PubMed]
- Crespo-Piazuelo, D.; Criado-Mesas, L.; Revilla, M.; Castelló, A.; Noguera, J.L.; Fernández, A.I.; Ballester, M.; Folch, J.M. Identification of strong candidate genes for backfat and intramuscular fatty acid composition in three crosses based on the Iberian pig. Sci. Rep. 2020, 10, 13962. [Google Scholar] [CrossRef] [PubMed]
- Ros-Freixedes, R.; Gol, S.; Pena, R.N.; Tor, M.; Ibáñez-Escriche, N.; Dekkers, J.C.; Estany, J. Genome-wide association study singles out SCD and LEPR as the two main loci influencing intramuscular fat content and fatty acid composition in duroc pigs. PLoS ONE 2016, 11, e0152496. [Google Scholar] [CrossRef]
- Freire, J.P.; Mourot, J.; Cunha, L.F.; Almeida, J.A.; Aumaitre, A. Effect of the source of dietary fat on postweaning lipogenesis in lean and fat pigs. Ann. Nutr. Metab. 1998, 42, 90–95. [Google Scholar] [CrossRef]
- Damon, M.; Wyszynska-Koko, J.; Vincent, A.; Hérault, F.; Lebret, B. Comparison of muscle transcriptome between pigs with divergent meat quality phenotypes identifies genes related to muscle metabolism and structure. PLoS ONE 2012, 7, e33763. [Google Scholar] [CrossRef]
- Zhao, S.M.; Ren, L.J.; Chen, L.; Zhang, X.; Cheng, M.L.; Li, W.Z.; Zhang, Y.Y.; Gao, S.Z. Differential expression of lipid metabolism related genes in porcine muscle tissue leading to different intramuscular fat deposition. Lipids 2009, 44, 1029–1037. [Google Scholar] [CrossRef]
- Wang, Z.X.; Li, Q.G.; Chamba, Y.Z.; Zhang, B.; Shang, P.; Zhang, H.; Wu, C.X. Identification of Genes Related to Growth and Lipid Deposition from Transcriptome Profiles of Pig Muscle Tissue. PLoS ONE 2015, 10, e0141138. [Google Scholar] [CrossRef] [PubMed]
- Duan, Y.H.; Zheng, C.B.; Zheng, J.; Ma, L.; Ma, X.R.; Zhong, Y.Z.; Zhao, X.C.; Li, F.N.; Guo, Q.P.; Yin, Y.L. Profiles of muscular amino acids, fatty acids, and metabolites in Shaziling pigs of different ages and relation to meat quality. Sci. China Life Sci. 2022, 65, 2227–22246. [Google Scholar] [CrossRef] [PubMed]
- Matsuzaka, T.; Shimano, H. Elovl6: A new player in fatty acid metabolism and insulin sensitivity. J. Mol. Med. 2009, 87, 379–384. [Google Scholar] [CrossRef] [PubMed]
- St John, L.C.; Lunt, D.K.; Smith, S.B. Fatty acid elongation and desaturation enzyme activities of bovine liver and subcutaneous adipose tissue microsomes. J. Anim. Sci. 1991, 69, 1064–1073. [Google Scholar] [CrossRef] [PubMed][Green Version]
- Zhang, Z.; Xiao, Q.; Zhang, Q.Q.; Sun, H.; Chen, J.C.; Li, Z.C.; Xue, M.; Ma, P.P.; Yang, H.J.; Xu, N.Y.; et al. Genomic analysis reveals genes affecting distinct phenotypes among different Chinese and western pig breeds. Sci. Rep. 2018, 8, 13352. [Google Scholar] [CrossRef] [PubMed]
- Yang, S.B.; Li, X.L.; Li, K.; Fan, B.; Tang, Z.L. A genome-wide scan for signatures of selection in Chinese indigenous and commercial pig breeds. BMC Genet. 2014, 15, 7. [Google Scholar] [CrossRef] [PubMed]
- Yang, W.J.; Liu, Z.; Zhao, Q.Q.; Du, H.; Yu, J.; Wang, H.W.; Liu, X.C.; Liu, H.; Jing, X.T.; Yang, H.P.; et al. Population Genetic Structure and Selection Signature Analysis of Beijing Black Pig. Front. Genet. 2022, 13, 860669. [Google Scholar] [CrossRef] [PubMed]
- Zhang, W.; Li, X.J.; Jiang, Y.; Zhou, M.; Liu, L.Q.; Su, S.G.; Xu, C.L.; Li, X.T.; Wang, C.L. Genetic architecture and selection of Anhui autochthonous pig population revealed by whole genome resequencing. Front. Genet. 2022, 13, 1022261. [Google Scholar] [CrossRef]
- Wang, X.Y.; Ran, X.Q.; Niu, X.; Huang, S.H.; Li, S.; Wang, J.F. Whole-genome sequence analysis reveals selection signatures for important economic traits in Xiang pigs. Sci. Rep. 2022, 12, 11823. [Google Scholar] [CrossRef]
- Zhang, W.; Yang, M.; Zhou, M.; Wang, Y.L.; Wu, X.D.; Zhang, X.D.; Ding, Y.Y.; Zhao, G.Y.; Yin, Z.J.; Wang, C.L. Identification of signatures of selection by whole-genome resequencing of a chinese native pig. Front. Genet. 2020, 11, 566255. [Google Scholar] [CrossRef]
- Bosse, M.; Lopes, M.S.; Madsen, O.; Megens, H.J.; Crooijmans, R.P.; Frantz, L.A.; Harlizius, B.; Bastiaansen, J.W.; Groenen, M.A. Artificial selection on introduced Asian haplotypes shaped the genetic architecture in European commercial pigs. Proc. Biol. Sci. 2015, 282, 20152019. [Google Scholar] [CrossRef]
- Wang, K.; Wu, P.X.; Yang, Q.; Chen, D.J.; Zhou, J.; Jiang, A.A.; Ma, J.D.; Tang, Q.Z.; Xiao, W.H.; Jiang, Y.Z.; et al. Detection of Selection Signatures in Chinese Landrace and Yorkshire Pigs Based on Genotyping-by-Sequencing Data. Front. Genet. 2018, 9, 119. [Google Scholar] [CrossRef]
- Shizuka, D.; Lyon, B.E. Coots use hatch order to learn to recognize and reject conspecific brood parasitic chicks. Nature 2010, 463, 223–226. [Google Scholar] [CrossRef]
- Estany, J.; Ros-Freixedes, R.; Tor, M.; Pena, R.N. A functional variant in the stearoyl-CoA desaturase gene promoter enhances fatty acid desaturation in pork. PLoS ONE 2014, 9, e86177. [Google Scholar] [CrossRef]
- Piórkowska, K.; Małopolska, M.; Ropka-Molik, K.; Szyndler-Nędza, M.; Wiechniak, A.; Żukowski, K.; Lambert, B.; Tyra, M. Evaluation of SCD, ACACA and FASN mutations: Effects on pork quality and other production traits in pigs selected based on RNA-Seq results. Animals 2020, 10, 123. [Google Scholar] [CrossRef] [PubMed]
- Kwon, W.S.; Rahman, M.S.; Ryu, D.Y.; Khatun, A.; Pang, M.G. Comparison of markers predicting litter size in different pig breeds. Andrology 2017, 5, 568–577. [Google Scholar] [CrossRef] [PubMed]


Disclaimer/Publisher’s Note: The statements, opinions and data contained in all publications are solely those of the individual author(s) and contributor(s) and not of MDPI and/or the editor(s). MDPI and/or the editor(s) disclaim responsibility for any injury to people or property resulting from any ideas, methods, instructions or products referred to in the content. |
© 2023 by the authors. Licensee MDPI, Basel, Switzerland. This article is an open access article distributed under the terms and conditions of the Creative Commons Attribution (CC BY) license (https://creativecommons.org/licenses/by/4.0/).