
Development of a Cat Behaviour Issues Assessment Scale (CABIAS) Assessing Problem Behaviours in Cats
 , ,
, ,
Abstract
:Simple Summary
Abstract
1. Introduction
2. Materials and Methods
2.1. Selection
- No reported problem behaviour.
- Problem scratching—defined as “scratching on vertical surfaces indoors other than on a scratching post (e.g., a sofa, carpet, curtains, or furniture)”.
- Problem urine marking—defined as depositing urine in a standing position, indoors, and against a vertical surface outside the litter box.
- Problem fear—defined as hiding or running away.
- Problem cohabitation—defined as difficulty cohabitating with other cats in the same household (e.g., fighting, biting, conflict, crying, chasing, staring, hissing, blocking etc.)
2.2. Inclusion and Exclusion Criteria
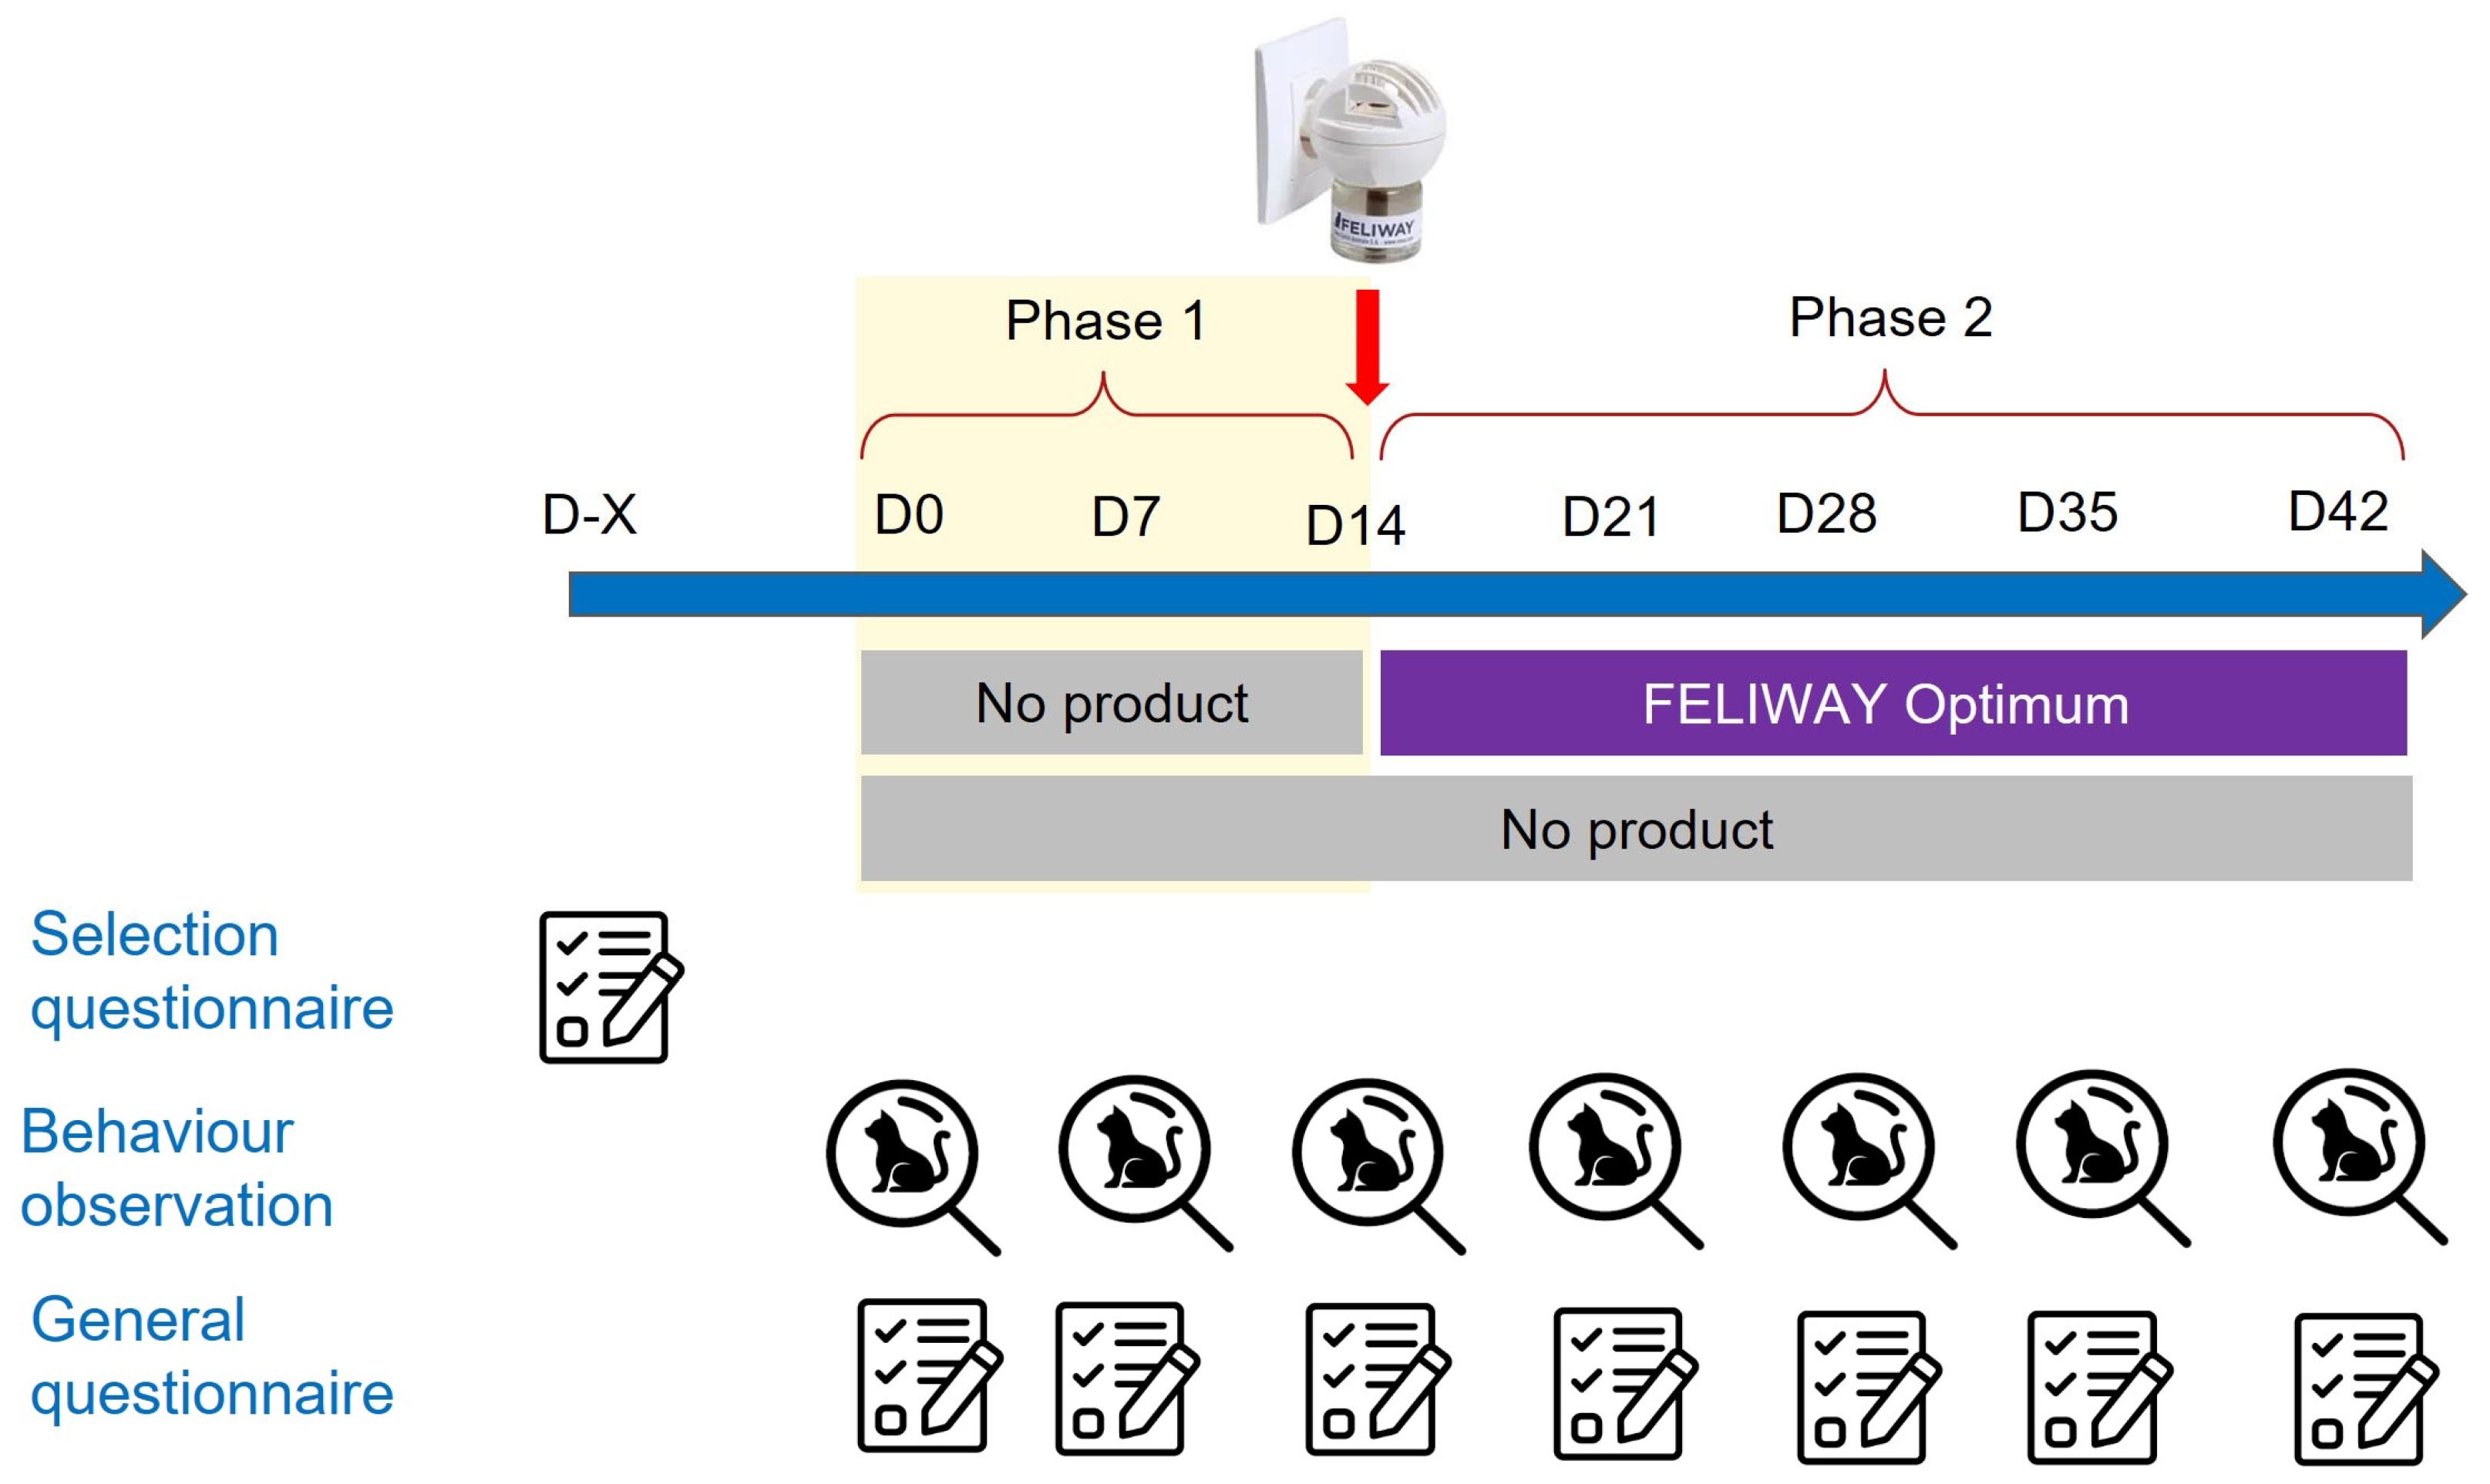
2.3. Study Protocol and Data Acquisition
2.4. Statistical Analysis
3. Results
3.1. Population Definition
3.2. Evaluation of Aspects of the Behavioural Scale (Index Score)
3.2.1. Inter-Rater Reliability
3.2.2. Aspects of Validity
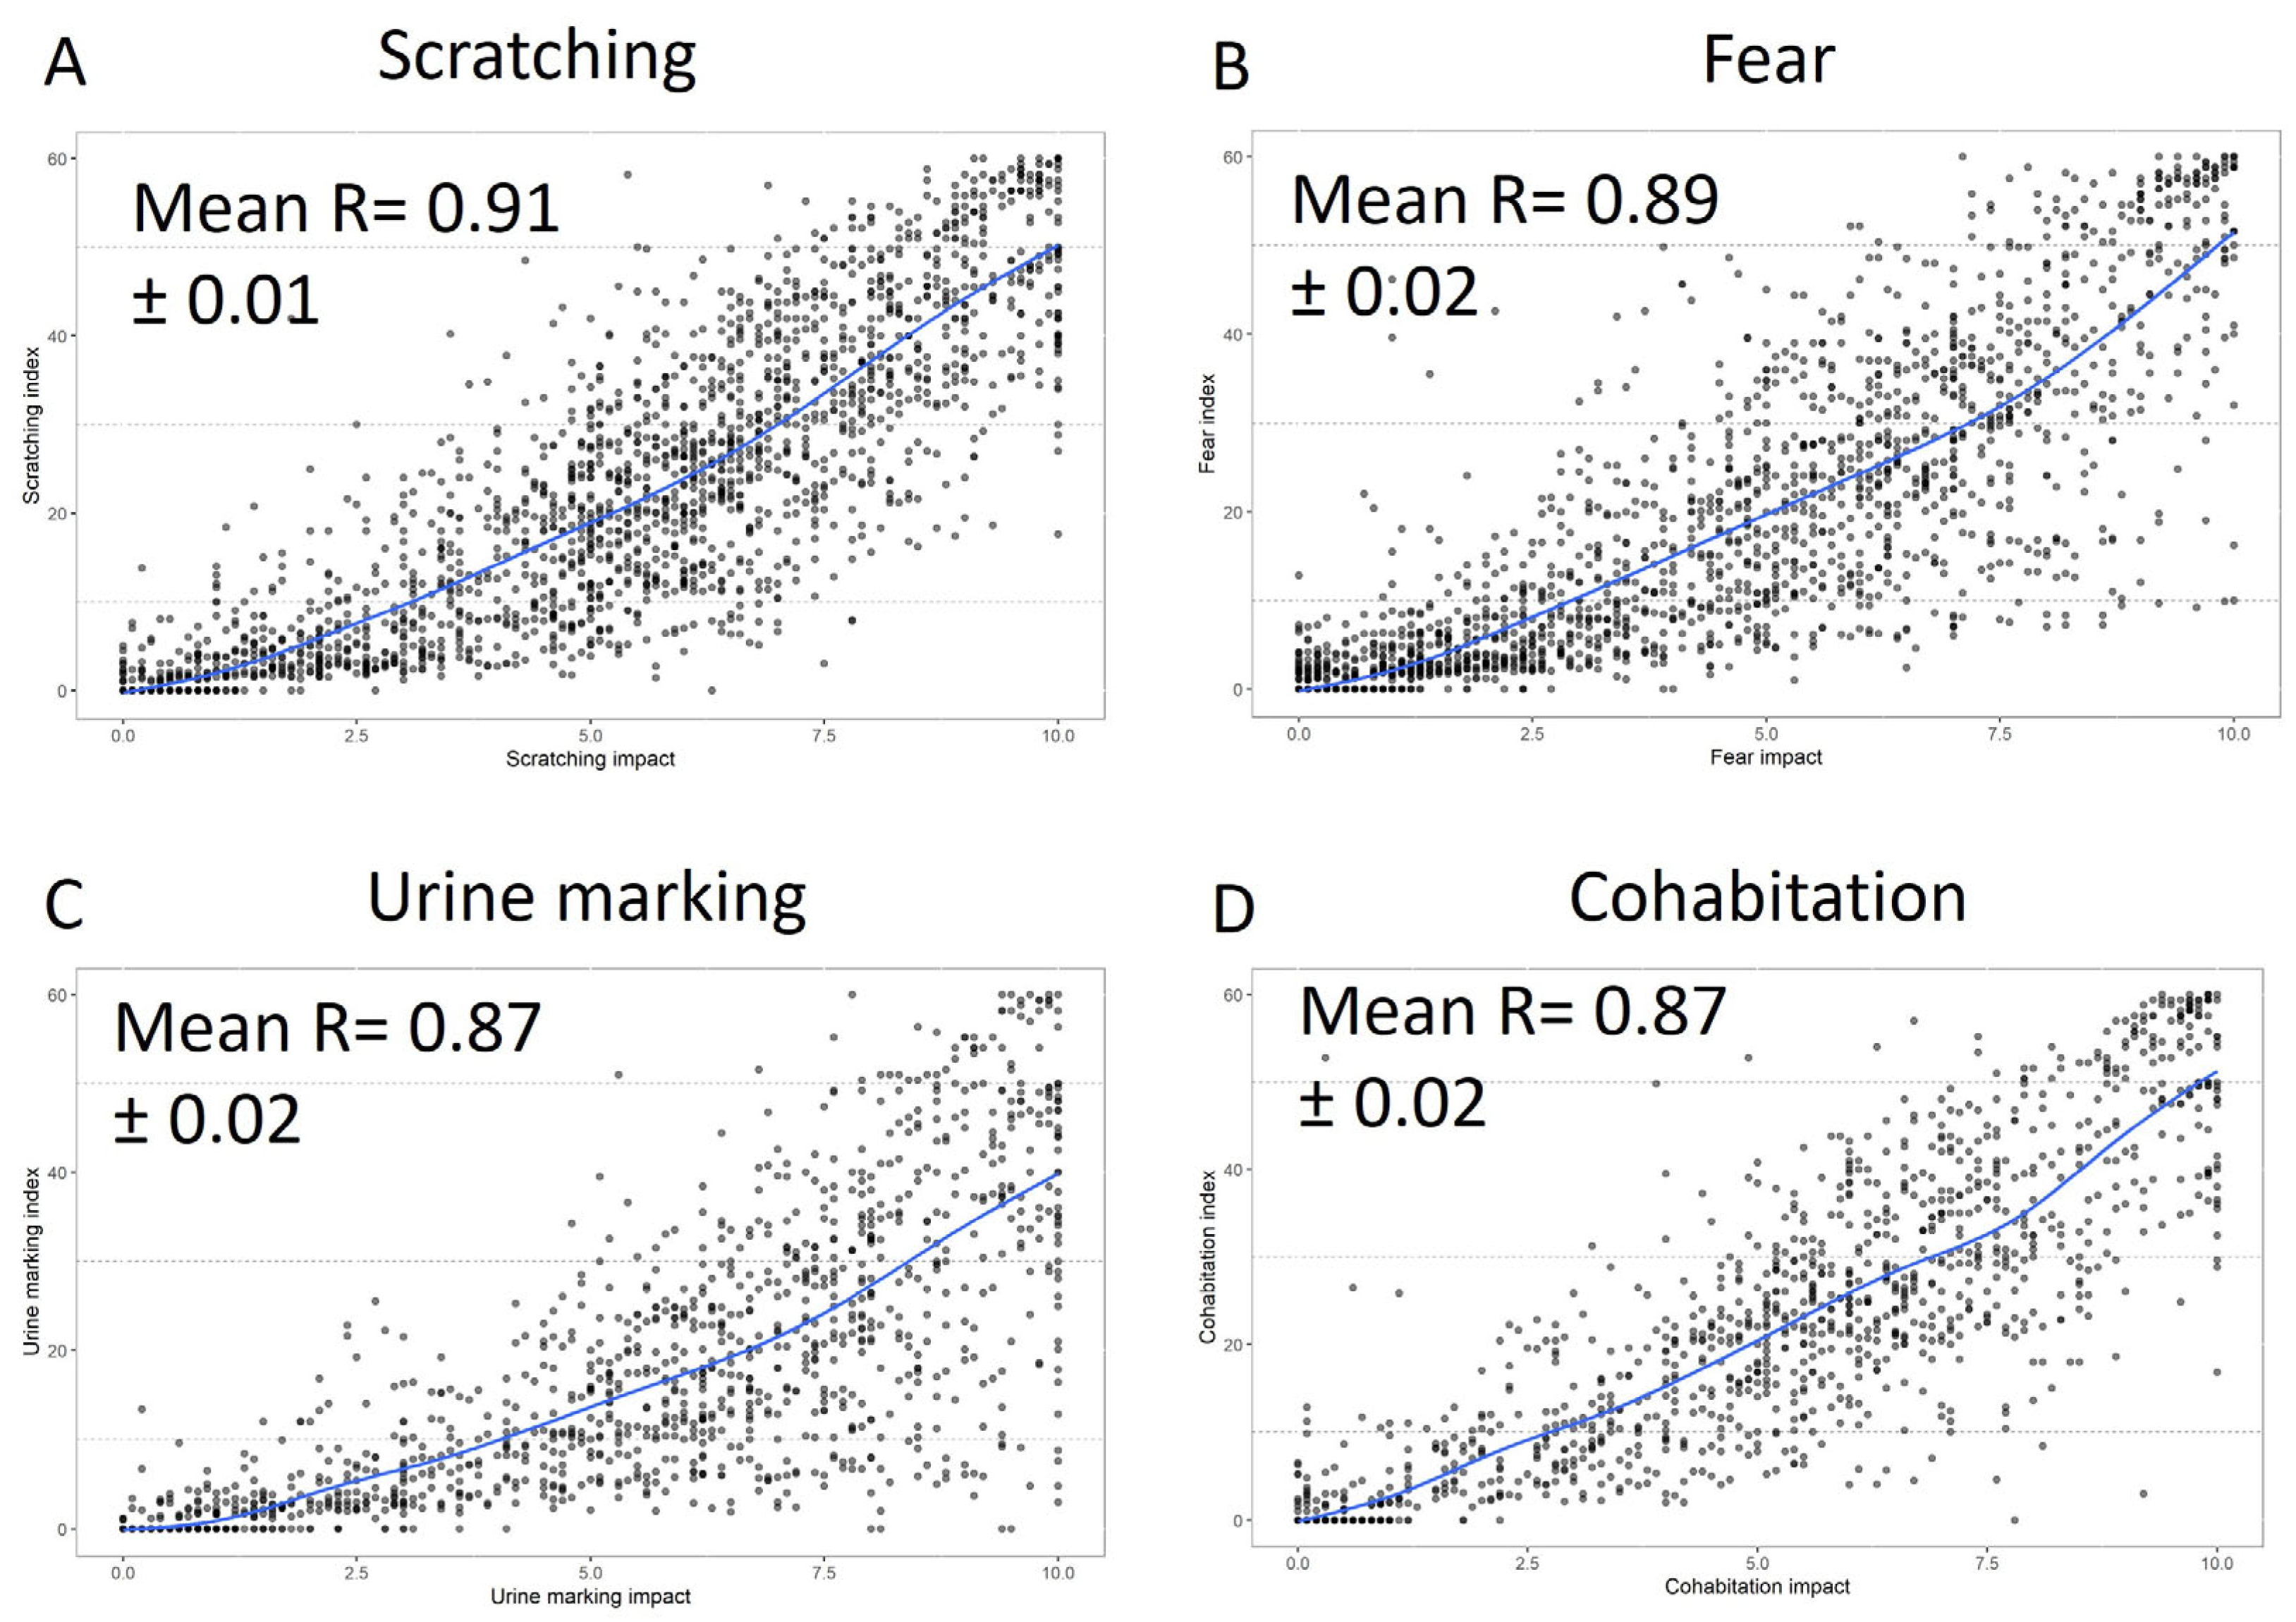
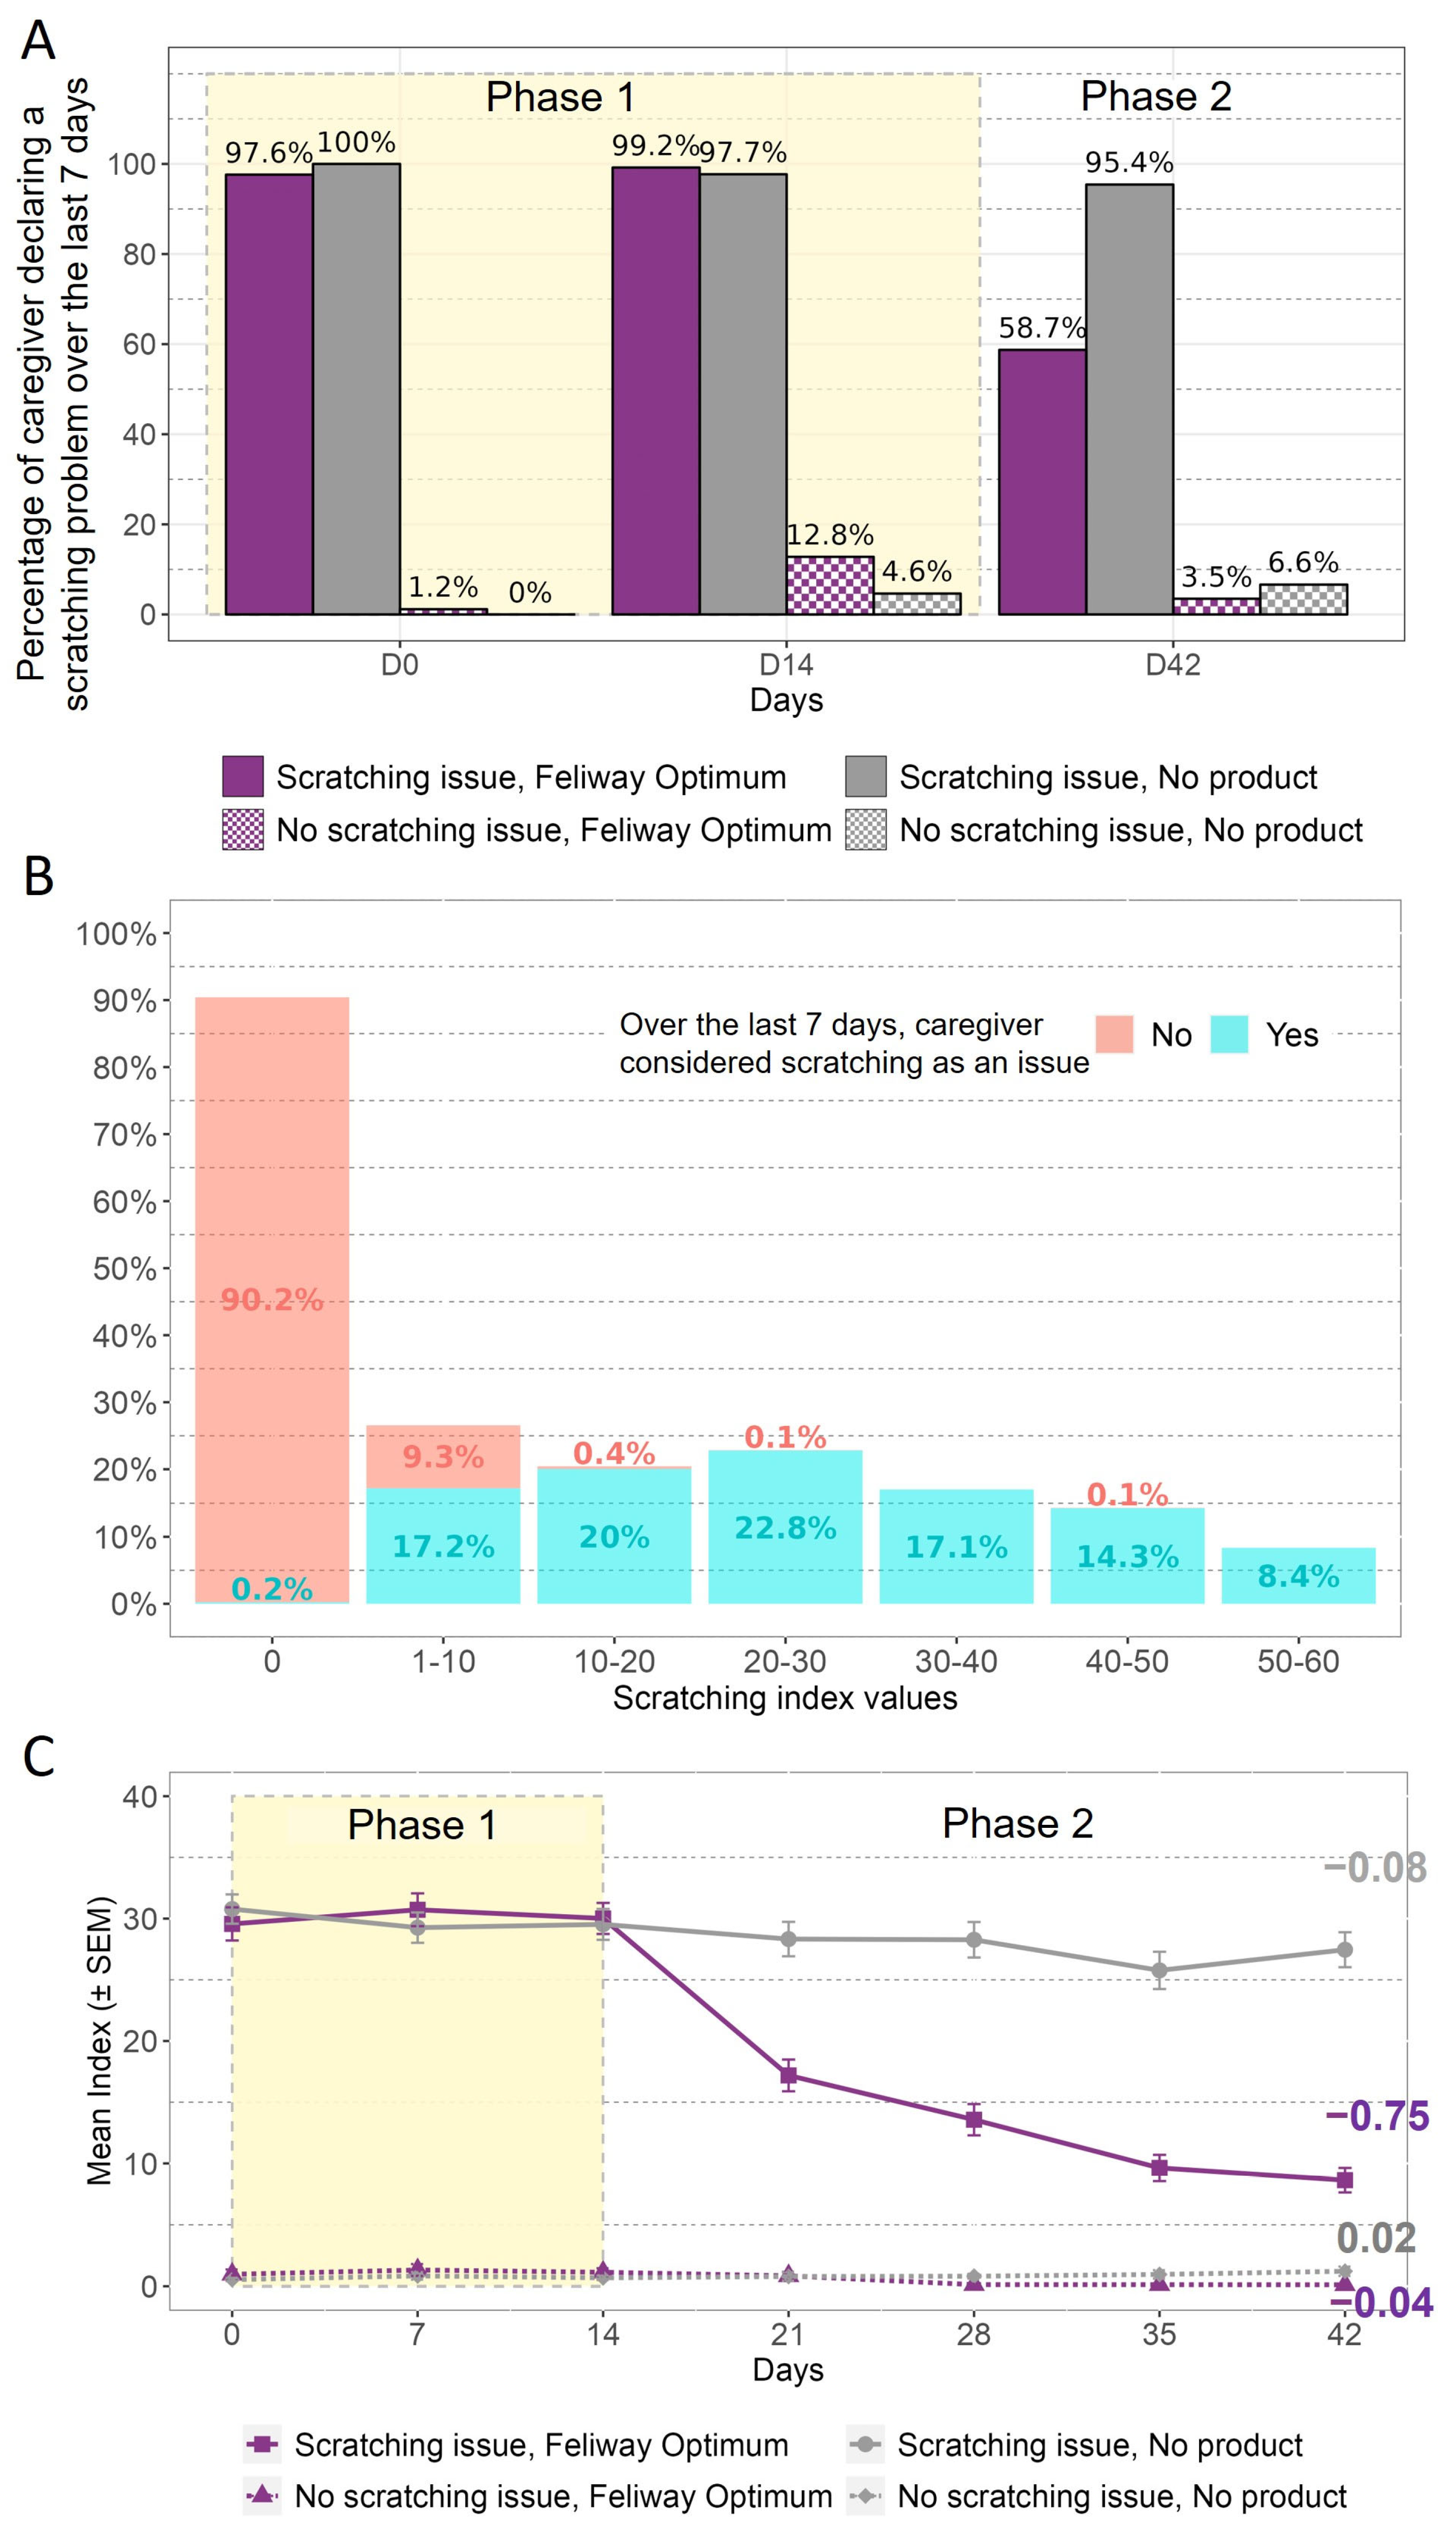
Scratching
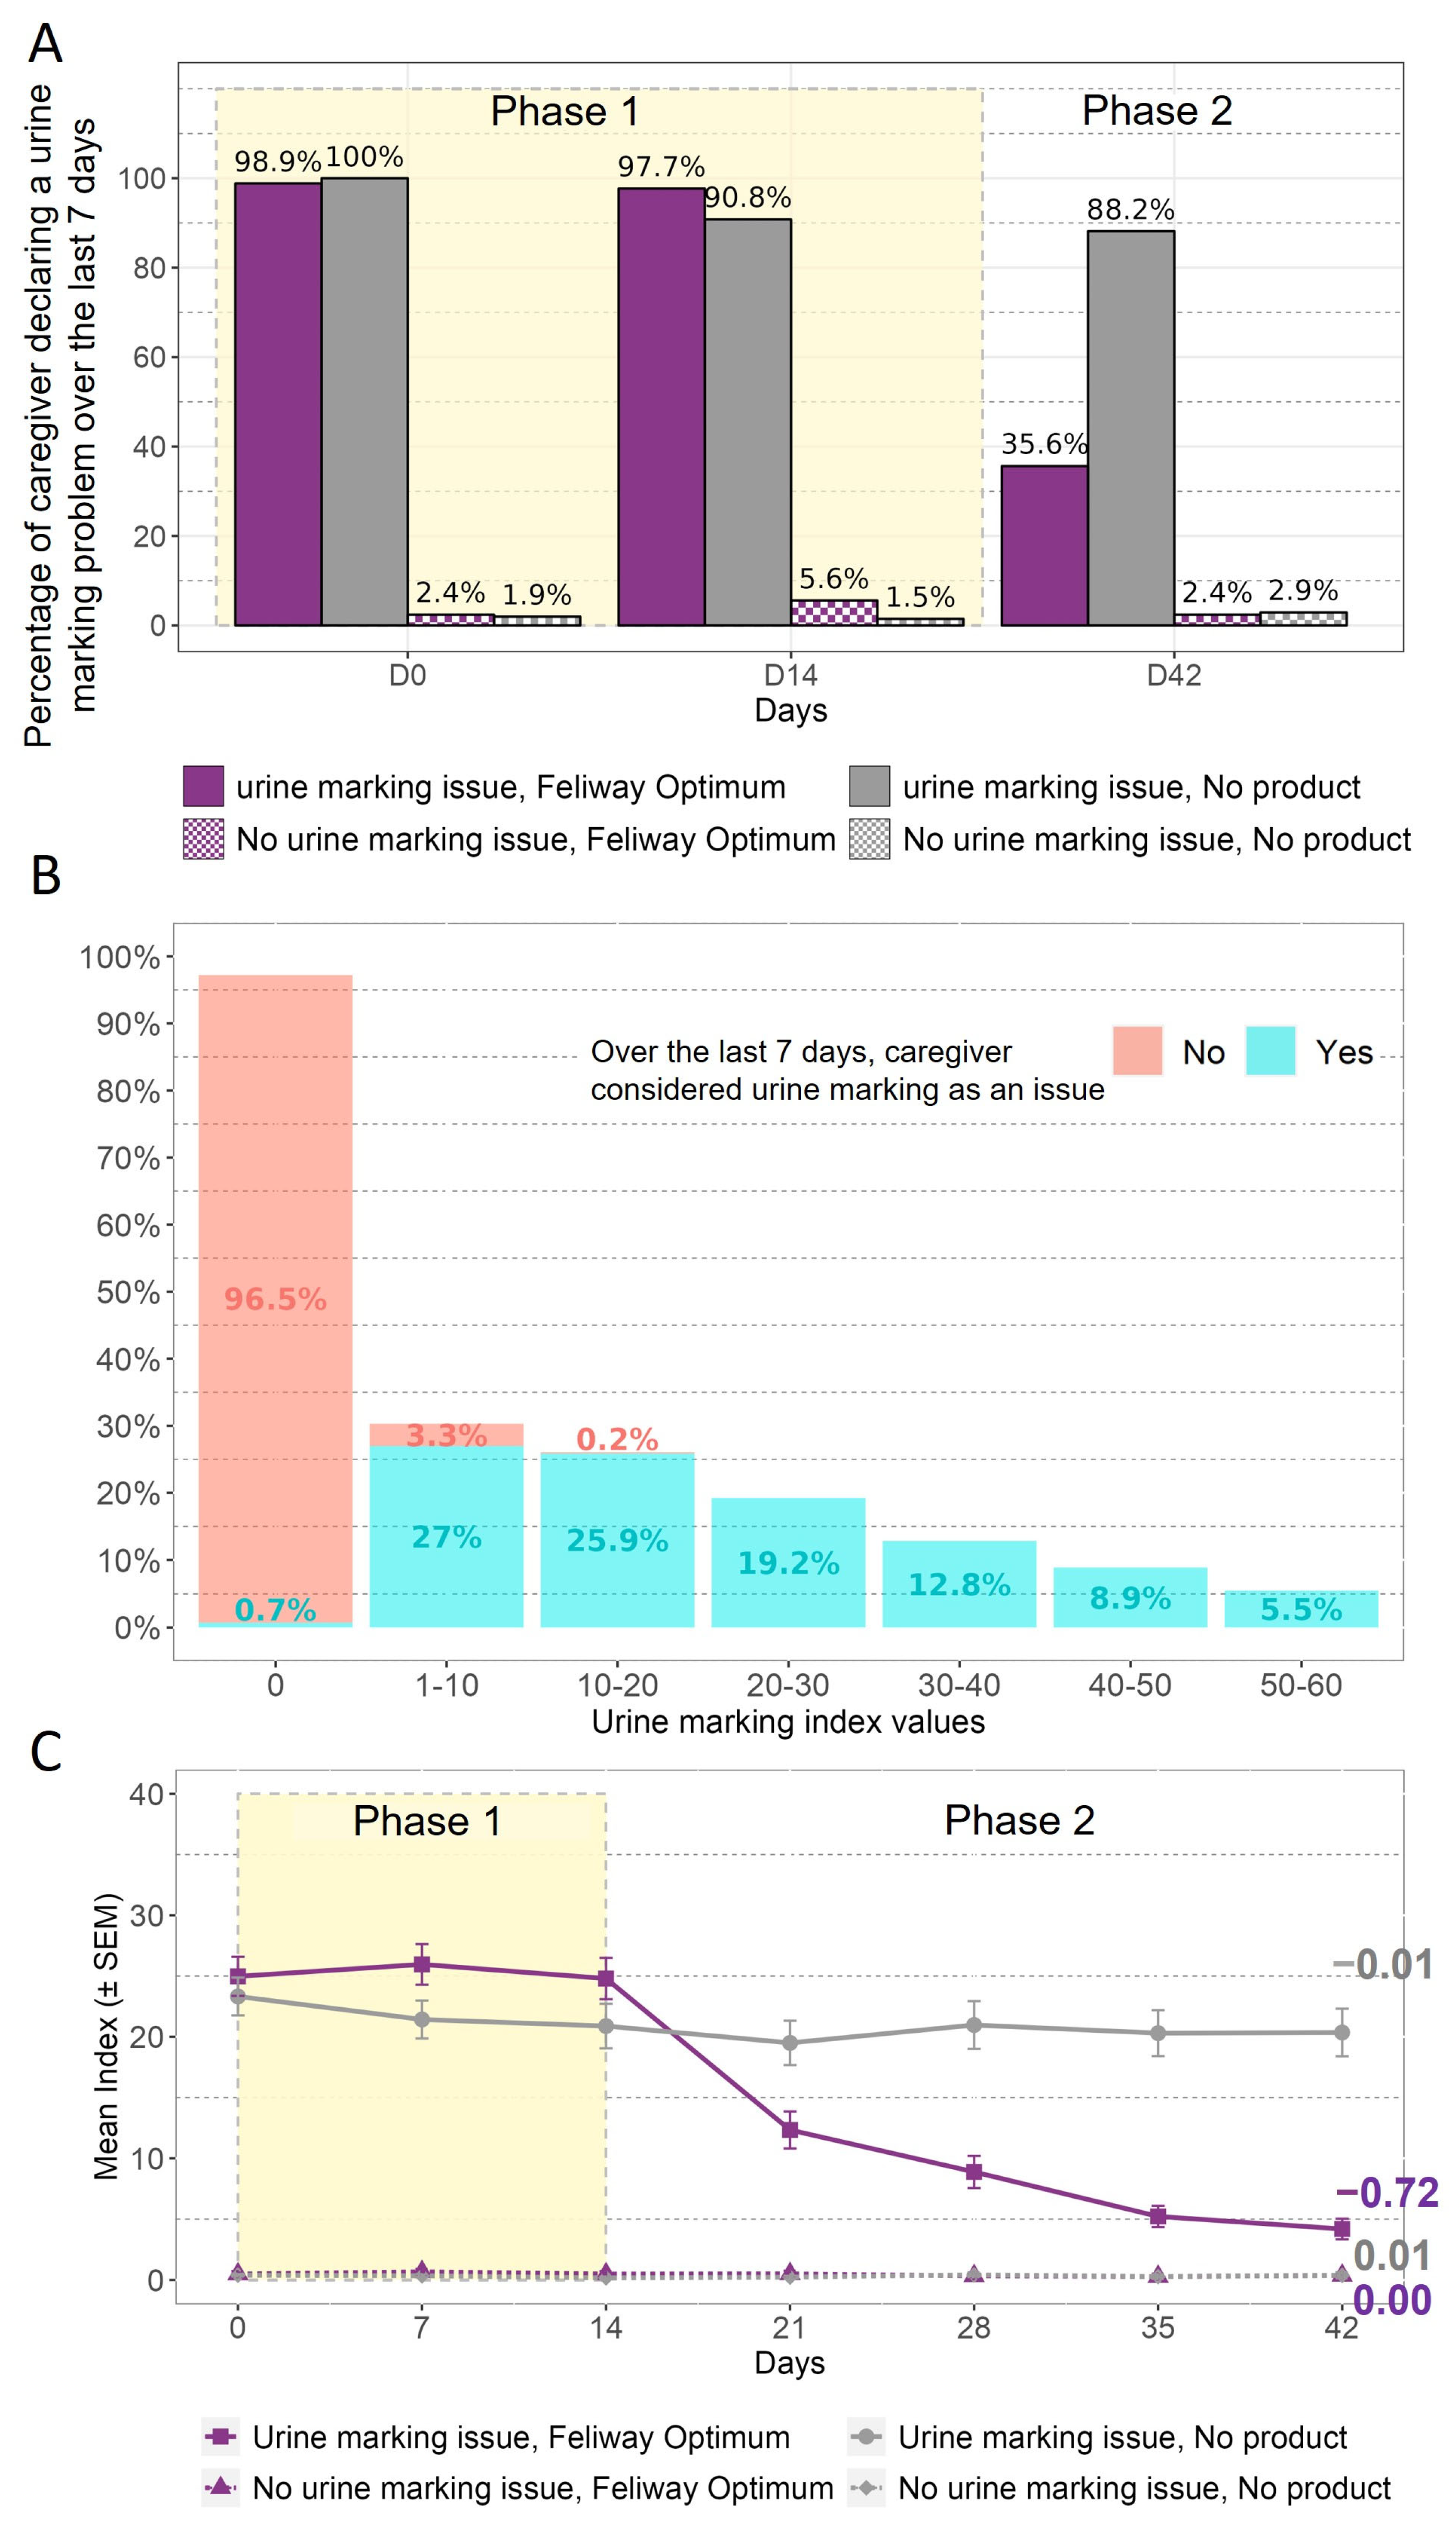
Urine Marking
Fear
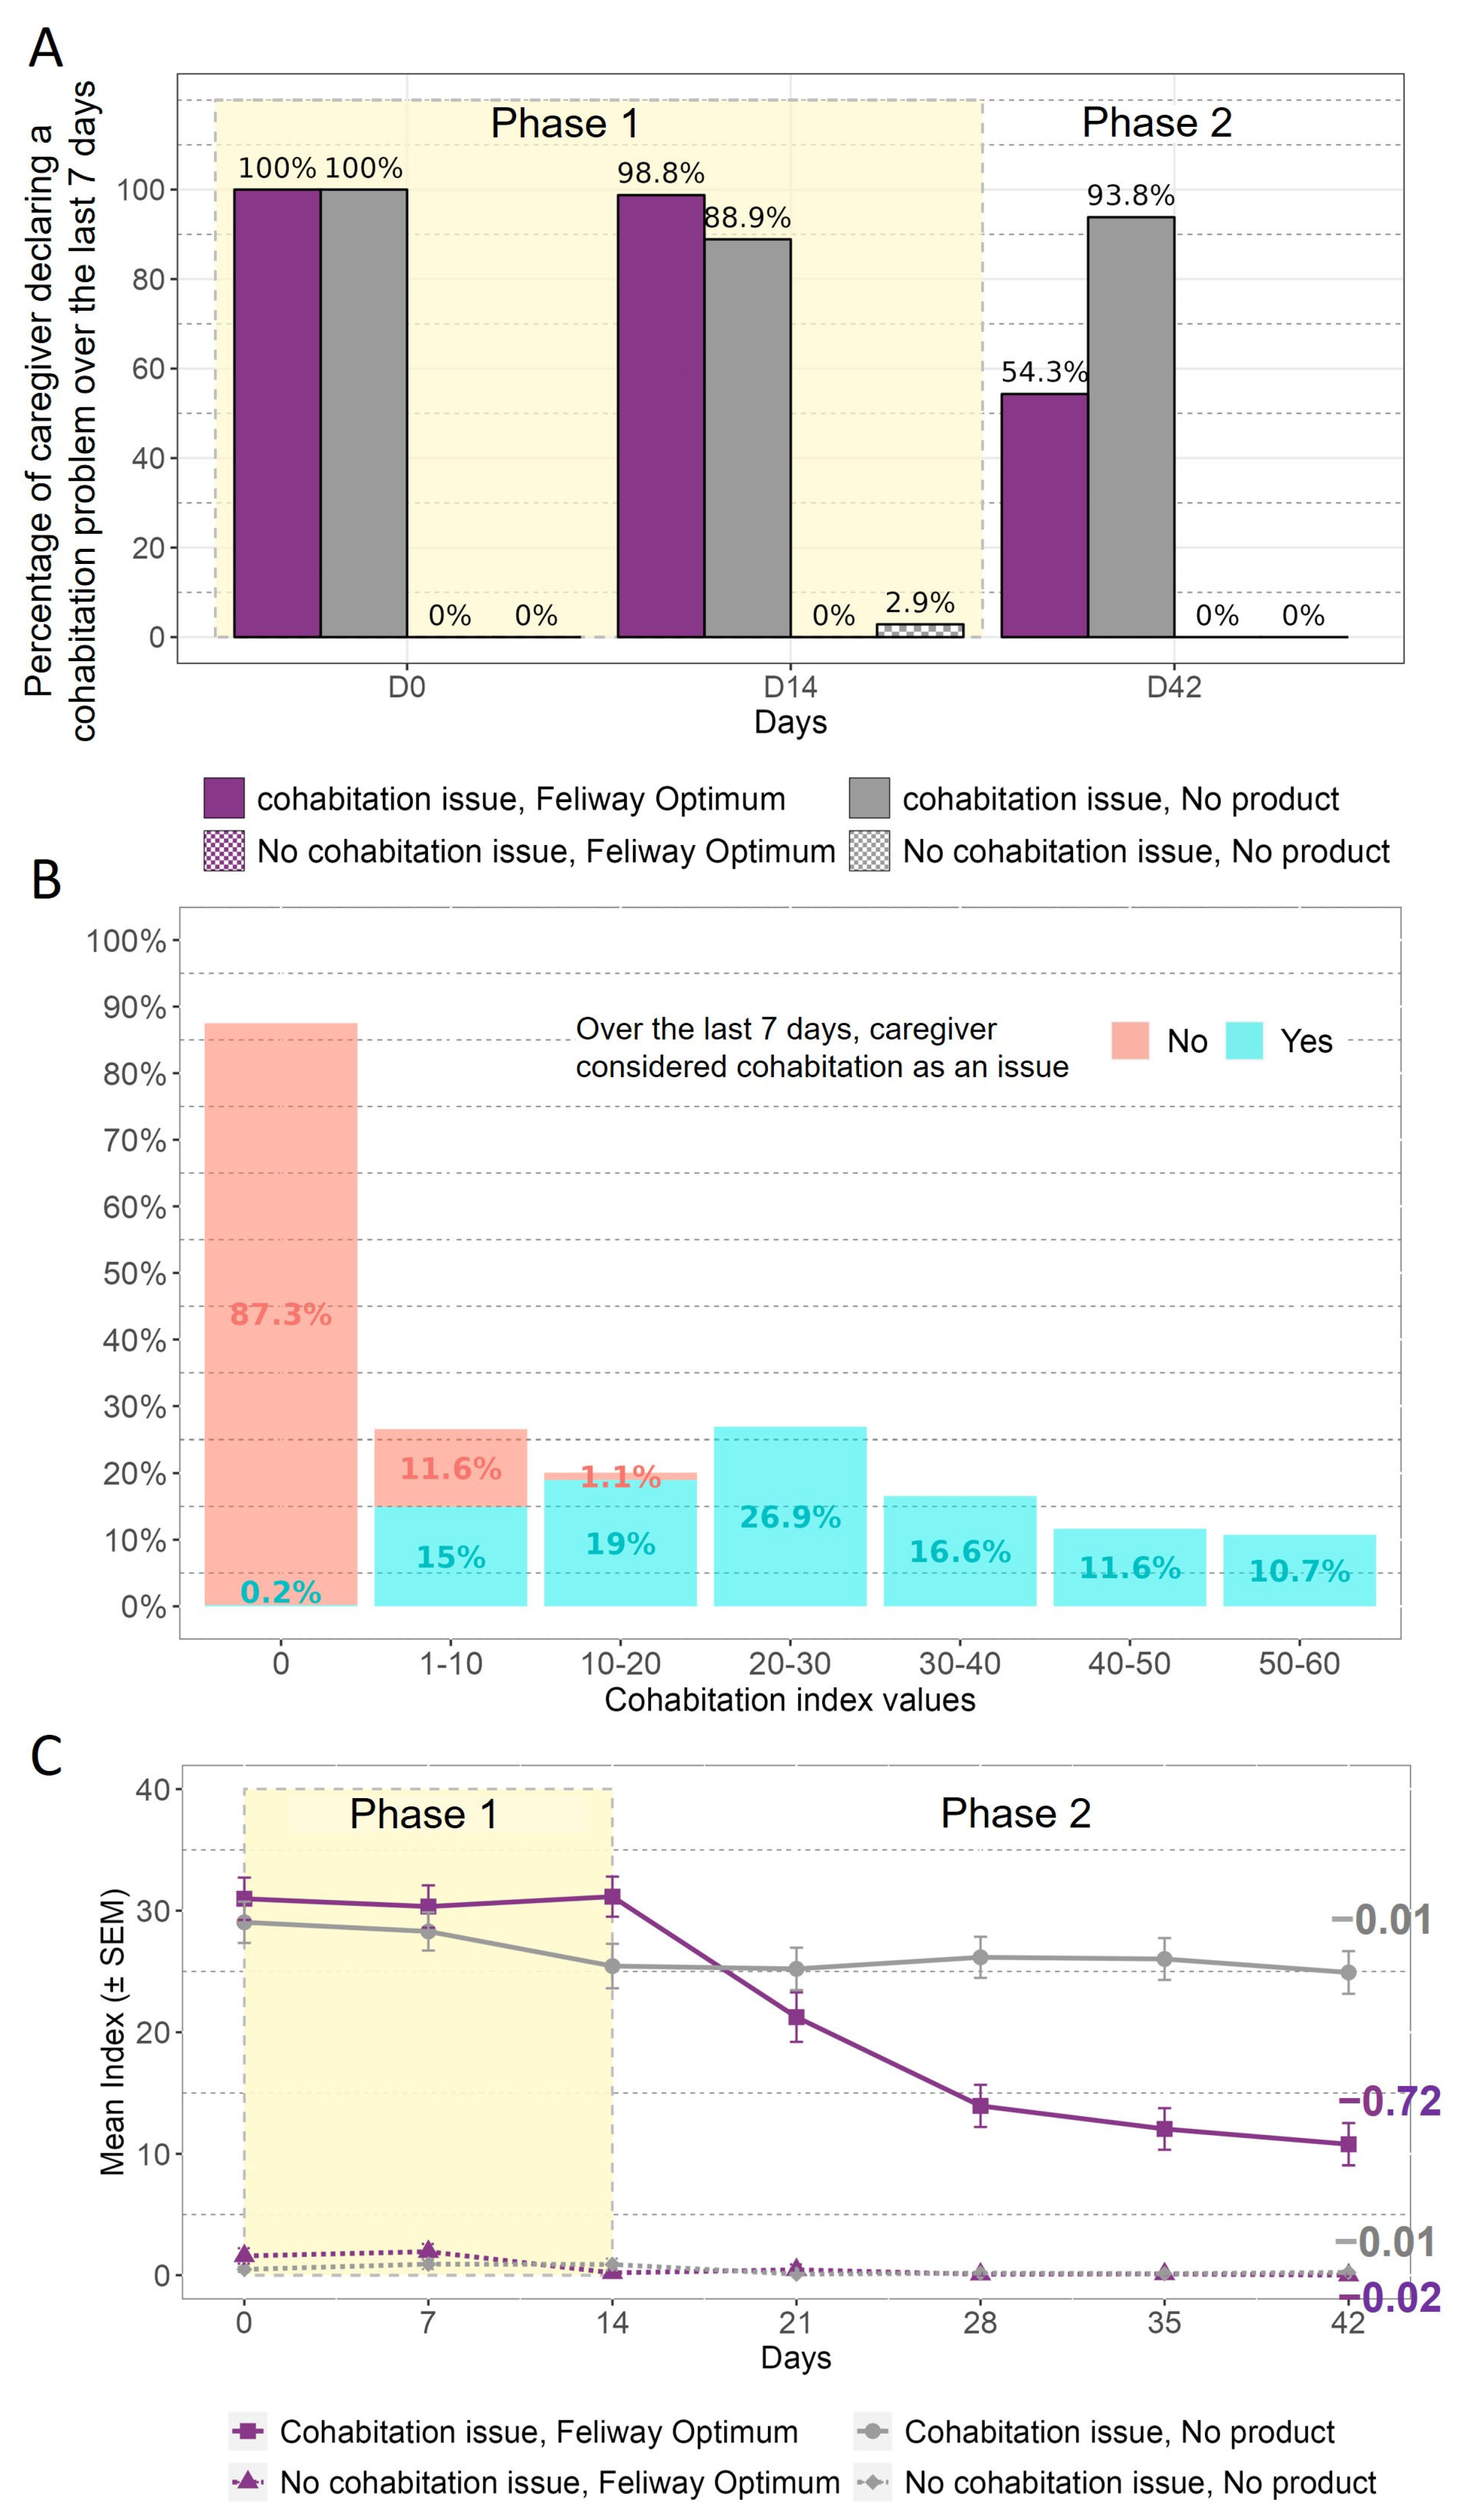
Cohabitation
4. Discussion
5. Conclusions
Author Contributions
Funding
Institutional Review Board Statement
Informed Consent Statement
Data Availability Statement
Acknowledgments
Conflicts of Interest
Appendix A

| Behaviour Declared as a Problem at Selection | Number of Cats (%) |
|---|---|
| Scratching alone | 45 (9.1%) |
| Fear alone | 44 (8.9%) |
| Urine marking alone | 30 (6.1%) |
| Cohabitation alone | 20 (4.0%) |
| Scratching + other problem behaviours | 212 (43%) |
| Fear + other problem behaviours | 203 (41%) |
| Urine marking + other problem behaviours | 133 (27%) |
| Cohabitation + other problem behaviours | 142 (29%) |
| No problem declared | 81 (16%) |

Appendix B. Weekly Questionnaire
- In the last 7 days, did you consider that your cat had a urine marking problem?
- Yes
- No
- Taking in account the last 7 days, to what extent did you consider this urine marking is impacting on your life? (from 0 “it is not impactful at all” to 10 “it is extremely impactful”)

- 3.
- In the last 7 days, how often have0 you noticed directly or indirectly (found urine deposit on vertical surface) your cat/[name completed in Q1 BASELINE] has been urine marking?
- 6.
- Every day, more than twice a day
- 5.
- Every day, once or twice a day
- 4.
- Almost every day
- 3.
- Every other day
- 2.
- Twice a week
- 1.
- Once a week
- 0.
- Never
- 4.
- (If different from 0 to frequency) Could you precise the exact number your cat has been urine marks during the past week:
- _______
- 5.
- Don’t remind exactly (If different from 0 to frequency) Still regarding [name completed in Q1 BASELINE], disregarding frequency, what do you think is the current average intensity of urinary marking? Please place the cursor on this scale to describe the current intensity of this bad habit
- 6.
- On what base did you rate the urine marking intensity? As a reminder, at the last one you said “.....” Copy the same sentence if that’s still what you think. Or answer differently if your answer today is different.
- 7.
- On which surface(s) did the urine marking occur in the last 7 days?
- Door frame
- Sofa
- Furniture
- Wall
- Curtains
- Table
- Chair
- Foot of the bed
- Other: please specify
- 8.
- In the last 7 days, in how many different new locations have you noticed that your cat {name completed in Q1 Baseline} has done urine marking? Answer: (number)
- 9.
- In the last 7 days, did you consider that your cat has a scratching problem?
- Yes
- No
- 10.
- Taking in account the last 7 days, to what extent did you consider this scratching is impacting on your life? (from 0 “it is not impactful at all” to 10 “it is extremely impactful”)

- 11.
- In the last 7 days, how often have you noticed directly or indirectly (new damage on vertical surface) your cat/[name completed in Q1 BASELINE] has been scratching?
- 6.
- Every day, more than twice a day
- 5.
- Every day, once or twice a day
- 4.
- Almost every day
- 3.
- Every other day
- 2.
- Twice a week
- 1.
- Once a week
- 0.
- Never
- 12.
- (If different from 0 to frequency) Could you precise the exact number your cat has been scratching during the past week:
- _______
- Don’t remind exactly
- 13.
- (If different from 0 to frequency) Still regarding [name completed in Q1 BASELINE], disregarding frequency, what do you think is the current average intensity of his scratching (duration/severity)? Please place the cursor on this scale to describe the current intensity of this bad habit
- 14.
- On which surface(s) has this scratching behaviour occurred in the last 7 days?
- Door frame
- Sofa
- Furniture
- Wall
- Curtains
- Table
- Chair
- Foot of the bed
- Other: please specify
- 15.
- In the last 7 days, in how many new different locations have you noticed that your cat {name completed in Q1 Baseline} has done scratching outside the scratching post? Answer: (number)
- 16.
- In the last 7 days, did you consider that your cat has a fear problem?
- Yes
- No
- 17.
- Taking in account the last 7 days, to what extent did you consider this fear is impacting on your life? (from 0 “it is not impactful at all” to 10 “it is extremely impactful”)

- 18.
- In the last 7 days, how often have you observed your cat/[name completed in Q1 BASELINE] has been displaying fear?
- 6.
- Every day, more than twice a day
- 5.
- Every day, once or twice a day
- 4.
- Almost every day
- 3.
- Every other day
- 2.
- Twice a week
- 1.
- Once a week
- 0.
- Never
- 19.
- (If different from 0 to frequency) Could you precise the exact number your cat has been displaying fear during the past week:
- _______
- Don’t remind exactly
- 20.
- (If different from 0 to frequency) Still regarding [name completed in Q1 BASELINE], disregarding frequency, what do you think is the current average intensity of his or her fears (duration/severity/number of behaviour sign of fear…)? Please place the cursor on this scale to describe the current intensity of this bad habit

- 21.
- Over the last 7 days, how long do you estimate the average time it took for your cat {name completed in Q1 Baseline} to come out of the state of fear (leaving the hiding place, stopping the immobility…)?
- Less than a minute
- A few minutes
- A quarter of an hour
- Half an hour
- An hour
- Several hours
- 22.
- In the last 7 days, what do you think is the major cause of the fear reactions you have observed in your cat {name completed in Q1 Baseline} (please do not consider fear after conflict with the other cat in the same household)?
- Noise
- Seeing/encountering another animal
- Someone visiting the household
- An animal visiting the household
- Other: please specify
- Don’t know
- 23.
- In the last 7 days, in how many different places in your home (living room, bedroom, couch, coffee table, kitchen…) have you observed your cat {name completed in Q1 BASELINE} having fearful reactions?Answer:
- 24.
- In the last 7 days, did you consider that your cat has a cohabitation problem?
- Yes
- No
- 25.
- Taking in account the last 7 days, to what extent did you consider this cohabitation problem is impacting on your life? (from 0 “it is not impactful at all” to 10 “it is extremely impactful”)

- 26.
- In the last 7 days, how often have you observed your cat/[name completed in Q1 BASELINE] has been displaying cohabitation problem?
- 6.
- Every day, more than twice a day
- 5.
- Every day, once or twice a day
- 4.
- Almost every day
- 3.
- Every other day
- 2.
- Twice a week
- 1.
- Once a week
- 0.
- Never
- 27.
- (If different from 0 to frequency) Could you precise the exact number your cat has been displaying cohabitation problem during the past week:
- _______
- Don’t remind exactly
- 28.
- (If different from 0 to frequency) Still regarding [name completed in Q1 BASELINE], disregarding frequency, what do you think is the current average intensity of his or her cohabitation problem (duration/severity/number of behaviour sign of cohabitation difficulties….)? Please place the cursor on this scale to describe the current intensity of this behavioural problem

References
- DePorter, T.L.; Elzerman, A.L. Common feline problem behaviors: Destructive scratching. J. Feline Med. Surg. 2019, 21, 235–243. [Google Scholar] [CrossRef] [PubMed]
- Ramos, D. Common feline problem behaviors: Aggression in multi-cat households. J. Feline Med. Surg. 2019, 21, 221–233. [Google Scholar] [CrossRef] [PubMed]
- Horwitz, D.F. Common feline problem behaviors: Urine spraying. J. Feline Med. Surg. 2019, 21, 209–219. [Google Scholar] [CrossRef] [PubMed]
- Yamada, R.; Kuze-Arata, S.; Kiyokawa, Y.; Takeuchi, Y. Prevalence of 17 feline behavioral problems and relevant factors of each behavior in Japan. J. Vet. Med. Sci. 2020, 82, 272–278. [Google Scholar] [CrossRef] [PubMed]
- Bradshaw, J. Normal feline behaviour: … and why problem behaviours develop. J. Feline Med. Surg. 2018, 20, 411–421. [Google Scholar] [CrossRef]
- Levine, E.D. Feline Fear and Anxiety. Vet. Clin. N. Am. Small Anim. Pract. 2008, 38, 1065–1079. [Google Scholar] [CrossRef]
- Salman, M.D.; Hutchison, J.; Ruch-Gallie, R.; Kogan, L.; New, J.C.; Kass, P.H.; Scarlett, J.M. Behavioral Reasons for Relinquishment of Dogs and Cats to 12 Shelters. J. Appl. Anim. Welf. Sci. 2000, 3, 93–106. [Google Scholar] [CrossRef]
- Heath, S. Understanding feline emotions: … and their role in problem behaviours. J. Feline Med. Surg. 2018, 20, 437–444. [Google Scholar] [CrossRef]
- Heath, S.E. Behaviour Problems and Welfare. In The Welfare Of Cats; Springer: Dordrecht, The Netherlands, 2007; Volume 3, pp. 91–118. [Google Scholar] [CrossRef]
- Taylor, K.D.; Mills, D.S. The development and assessment of temperament tests for adult companion dogs. J. Vet. Behav. 2006, 1, 94–108. [Google Scholar] [CrossRef]
- Bennett, P.C.; Rutter, N.J.; Woodhead, J.K.; Howell, T.J. Assessment of domestic cat personality, as perceived by 416 owners, suggests six dimensions. Behav. Process. 2017, 141, 273–283. [Google Scholar] [CrossRef]
- Mikkola, S.; Salonen, M.; Hakanen, E.; Sulkama, S.; Lohi, H. Reliability and Validity of Seven Feline Behavior and Personality Traits. Animals 2021, 11, 1991. [Google Scholar] [CrossRef] [PubMed]
- Duffy, D.L.; de Moura, R.T.D.; Serpell, J.A. Development and evaluation of the Fe-BARQ: A new survey instrument for measuring behavior in domestic cats (Felis s. catus). Behav. Process. 2017, 141, 329–341. [Google Scholar] [CrossRef] [PubMed]
- Mylius, V.; Perez Lloret, S.; Cury, R.G.; Teixeira, M.J.; Barbosa, V.R.; Barbosa, E.R.; Moreira, L.I.; Listik, C.; Fernandes, A.M.; de Lacerda Veiga, D.; et al. The Parkinson disease pain classification system: Results from an international mechanism-based classification approach. Pain 2021, 162, 1201–1210. [Google Scholar] [CrossRef] [PubMed]
- Pugliese, J.; Tinsley, B. Parental socialization of child and adolescent physical activity: A meta-analysis. J. Fam. Psychol. 2007, 21, 331–343. [Google Scholar] [CrossRef]
- Cracknell, N.R.; Mills, D.S. A double-blind placebo-controlled study into the efficacy of a homeopathic remedy for fear of firework noises in the dog (Canis familiaris). Vet. J. 2008, 177, 80–88. [Google Scholar] [CrossRef]
- Hasan, S.B.; Gendra, R.; James, J.; Morris, D.; Orenstein, L.A.V.; Ingram, J.R. Pain measurement in painful skin conditions and rheumatoid arthritis randomized controlled trials: A scoping review to inform pain measurement in hidradenitis suppurativa. Br. J. Dermatol. 2022, 187, 846–854. [Google Scholar] [CrossRef]
- Veiersted, K.B.; Hanvold, T.N.; Lunde, L.-K.; Koch, M.; Knardahl, S.; Wærsted, M. Do intensity of pain alone or combined with pain duration best reflect clinical signs in the neck, shoulder and upper limb? Scand. J. Pain. 2021, 21, 266–273. [Google Scholar] [CrossRef]
- Salamon, K.S.; Davies, W.H.; Fuentes, M.R.; Weisman, S.J.; Hainsworth, K.R. The Pain Frequency-Severity-Duration Scale as a Measure of Pain: Preliminary Validation in a Pediatric Chronic Pain Sample. Pain. Res. Treat. 2014, 2014, 653592. [Google Scholar] [CrossRef]
- De Jaeger, X.; Meppiel, L.; Endersby, S.; Sparkes, A.H. An Initial Open-Label Study of a Novel Pheromone Complex for Use in Cats. Open J. Vet. Med. 2021, 11, 105–116. [Google Scholar] [CrossRef]
- Koo, T.K.; Li, M.Y. A Guideline of Selecting and Reporting Intraclass Correlation Coefficients for Reliability Research. J. Chiropr. Med. 2016, 15, 155–163. [Google Scholar] [CrossRef]
- Mills, D.; Dube, M.B.; Zulch, H. Principles of Pheromonatherapy. In Stress and Pheromonatherapy in Small Animal Clinical Behaviour; John Wiley & Sons: Hoboken, NJ, USA, 2012; pp. 127–145. [Google Scholar]
- Olivry, T.; Marsella, R.; Iwasaki, T.; Mueller, R. Validation of CADESI-03, a severity scale for clinical trials enrolling dogs with atopic dermatitis. Vet. Dermatol. 2007, 18, 78–86. [Google Scholar] [CrossRef] [PubMed]
- Korpivaara, M.; Laapas, K.; Huhtinen, M.; Schöning, B.; Overall, K. Dexmedetomidine oromucosal gel for noise-associated acute anxiety and fear in dogs-a randomised, double-blind, placebo-controlled clinical study. Vet. Rec. 2017, 180, 356. [Google Scholar] [CrossRef] [PubMed]
- Mills, D.S.; Mueller, H.W.; McPeake, K.; Engel, O. Development and Psychometric Validation of the Lincoln Canine Anxiety Scale. Front. Vet. Sci. 2020, 7, 171. [Google Scholar] [CrossRef]
- Steimer, T. The biology of fear- and anxiety-related behaviors. Dialogues Clin. Neurosci. 2022, 4, 231–249. [Google Scholar] [CrossRef] [PubMed]
- Daniel-Watanabe, L.; Fletcher, P.C. Are Fear and Anxiety Truly Distinct? Biol. Psychiatry Glob. Open Sci. 2022, 2, 341–349. [Google Scholar] [CrossRef]

| Exclusion Criteria | Description of Criteria |
|---|---|
| Cat age | Cats aged <12 months |
| Outdoor access | Cats spending >50% of their time outdoors |
| Cat’s housing | Cats kept away from their home during the previous month (e.g., hospitalisation, cattery, shelter, etc.) |
| Number of cats | Household with >2 cats |
| Cat’s health | Existing current disease diagnosed by a veterinarian |
| Cat’s environment | Household without a scratching post Household without a litter box |
| Other products | Current or recent (in the past month) use of pheromone or calming products (nutraceuticals, pharmaceuticals, environmental products, etc.) |
| Caregivers’ background |
|
| Exclusion Criteria | Description of Criteria |
|---|---|
| Environmental changes | Major environmental change (examples available in Table 3) |
| Other products | Starting to use pheromone products or calming products (nutraceuticals, pharmaceuticals, environmental products, etc.) |
| Missing data | If ≥1 questionnaire was not answered, regardless of the reason |
| Observation not possible | Caregiver was not able to observe the cat for at least 4 h a day for a minimum of 5 days during every week of the study |
| Reasons for Exclusion | Number of Households |
|---|---|
| Lost during follow-up | 33 |
| Caregiver not present for the minimum amount of time | 12 |
| New pet in the household | 7 |
| Cat household change (house moving/vacation) | 3 |
| New scratching post introduction | 1 |
| Use of forbidden treatment | 1 |
| Cat welfare reason (child cut cat’s whiskers) | 1 |
| Cat sterilisation | 1 |
| New baby | 1 |
 | |||||
|---|---|---|---|---|---|
| Scratching | Urine Marking | Fear | Cohabitation | ||
| N = Number of Cats | N = 494 | N = 494 | N = 494 | N = 220 | |
| Behaviour issue declared | Feliway Optimum | 126 (26%) | 87 (18%) | 142 (29%) | 81 (37%) |
| No product | 131 (27%) | 76 (15%) | 105 (21%) | 81 (37%) | |
| No Behaviour issue Declared | Feliway Optimum | 86 (17%) | 125 (25%) | 70 (14%) | 23 (10%) |
| No product | 151 (31%) * | 206 (42%) * | 177 (36%) * | 35 (16%) ** | |
| ||||
|---|---|---|---|---|
| Scratching | Urine Marking | Fear | Cohabitation | |
| ICC of Index (Lower−Upper) | N = 494 | N = 494 | N = 494 | N = 220 |
| D0 | 0.94 (0.92−0.95) | 0.95 (0.94−0.96) | 0.93 (0.92−0.94) | 0.90 (0.86−0.92) |
| D7 | 0.93 (0.92−0.94) | 0.96 (0.95−0.97) | 0.93 (0.92−0.94) | 0.91 (0.89−0.93) |
| D14 | 0.93 (0.92−0.94) | 0.97 (0.97−0.98) | 0.93 (0.91−0.94) | 0.91 (0.88−0.93) |
| D21 | 0.94 (0.92−0.95) | 0.96 (0.95−0.96) | 0.94 (0.93−0.95) | 0.88 (0.85−0.91) |
| D28 | 0.95 (0.94−0.96) | 0.97 (0.96−0.97) | 0.93 (0.92−0.94) | 0.94 (0.92−0.95) |
| D35 | 0.95 (0.94−0.96) | 0.97 (0.97−0.98) | 0.93 (0.92−0.94) | 0.93 (0.92−0.95) |
| D42 | 0.96 (0.95−0.96) | 0.97 (0.96−0.98) | 0.95 (0.94−0.95) | 0.93 (0.91−0.95) |
| Mean ± SD | 0.94 ± 0.01 | 0.96 ± 0.01 | 0.93 ± 0.01 | 0.91 ± 0.02 |
| ||||
|---|---|---|---|---|
| Scratching | Urine Marking | Fear | Cohabitation | |
| Difference between Inter Rater in [−10;10] | N = 494 | N = 494 | N = 494 | N = 220 |
| Globally | 85.6% | 94.6% | 87.6% | 79.9% |
| ||||
|---|---|---|---|---|
| Index–Impact Correlation | Scratching | Urine Marking | Fear | Cohabitation |
| Pearson Coeficient | N = 494 | N = 494 | N = 494 | N = 220 |
| D0 | 0.91 | 0.86 | 0.89 | 0.88 |
| D7 | 0.90 | 0.86 | 0.90 | 0.86 |
| D14 | 0.92 | 0.88 | 0.87 | 0.89 |
| D21 | 0.90 | 0.85 | 0.89 | 0.88 |
| D28 | 0.91 | 0.86 | 0.87 | 0.90 |
| D35 | 0.92 | 0.88 | 0.90 | 0.93 |
| D42 | 0.92 | 0.90 | 0.91 | 0.92 |
| Mean ± SD | 0.91 ± 0.01 | 0.87 ± 0.02 | 0.89 ± 0.02 | 0.86 ± 0.02 |
Disclaimer/Publisher’s Note: The statements, opinions and data contained in all publications are solely those of the individual author(s) and contributor(s) and not of MDPI and/or the editor(s). MDPI and/or the editor(s) disclaim responsibility for any injury to people or property resulting from any ideas, methods, instructions or products referred to in the content. |
© 2023 by the authors. Licensee MDPI, Basel, Switzerland. This article is an open access article distributed under the terms and conditions of the Creative Commons Attribution (CC BY) license (https://creativecommons.org/licenses/by/4.0/).
Share and Cite
McPeake, K.; Sparkes, A.; Billy, C.; Endersby, S.; Collin, J.F.; De Jaeger, X. Development of a Cat Behaviour Issues Assessment Scale (CABIAS) Assessing Problem Behaviours in Cats. Animals 2023, 13, 2992. https://doi.org/10.3390/ani13182992
McPeake K, Sparkes A, Billy C, Endersby S, Collin JF, De Jaeger X. Development of a Cat Behaviour Issues Assessment Scale (CABIAS) Assessing Problem Behaviours in Cats. Animals. 2023; 13(18):2992. https://doi.org/10.3390/ani13182992
Chicago/Turabian StyleMcPeake, Kevin, Andrew Sparkes, Charlotte Billy, Sarah Endersby, Jean François Collin, and Xavier De Jaeger. 2023. "Development of a Cat Behaviour Issues Assessment Scale (CABIAS) Assessing Problem Behaviours in Cats" Animals 13, no. 18: 2992. https://doi.org/10.3390/ani13182992
APA StyleMcPeake, K., Sparkes, A., Billy, C., Endersby, S., Collin, J. F., & De Jaeger, X. (2023). Development of a Cat Behaviour Issues Assessment Scale (CABIAS) Assessing Problem Behaviours in Cats. Animals, 13(18), 2992. https://doi.org/10.3390/ani13182992