MyFishCheck: A Model to Assess Fish Welfare in Aquaculture

 , ,
, ,  and
and
Abstract
Simple Summary
Abstract
1. Introduction
1.1. Appropriate Methodology for Fish Welfare Assessment
1.2. Suitable Semantic Data Models for Information Management
1.3. Advantages and Disadvantages of Existing Methods
1.4. Improvement of Fish Welfare Assessment in Aquaculture
1.4.1. Comprehensiveness
1.4.2. Applicability
1.4.3. Developability
2. Model Development
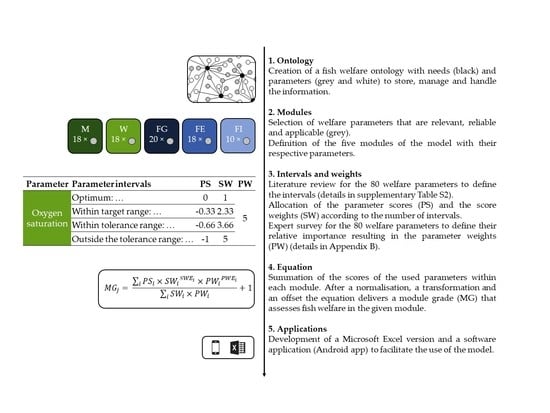
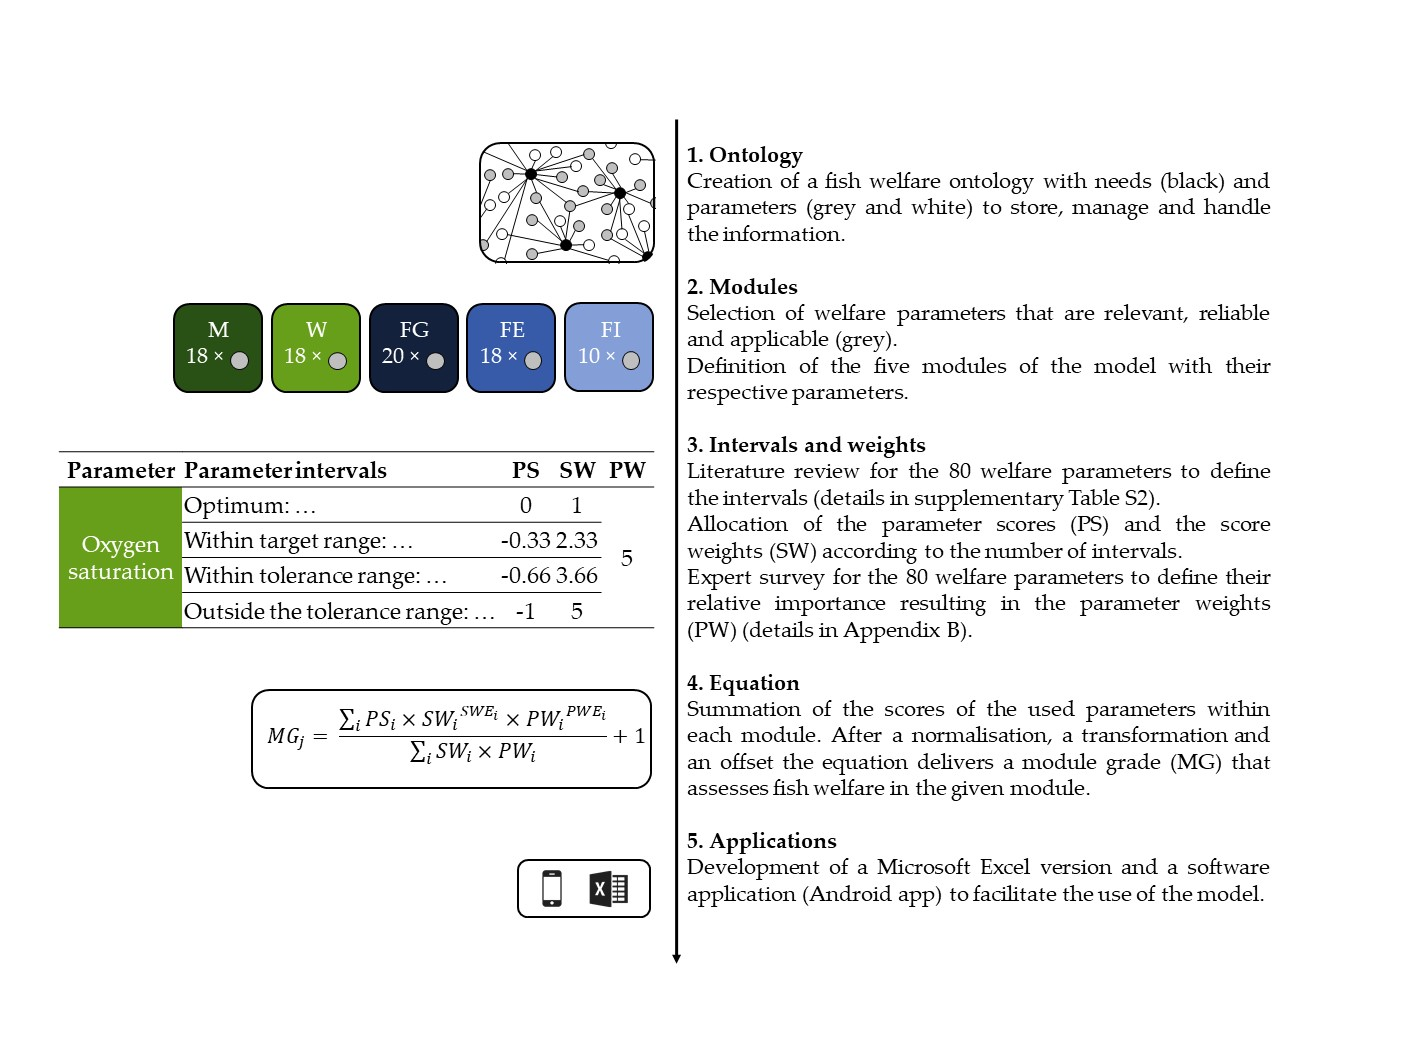
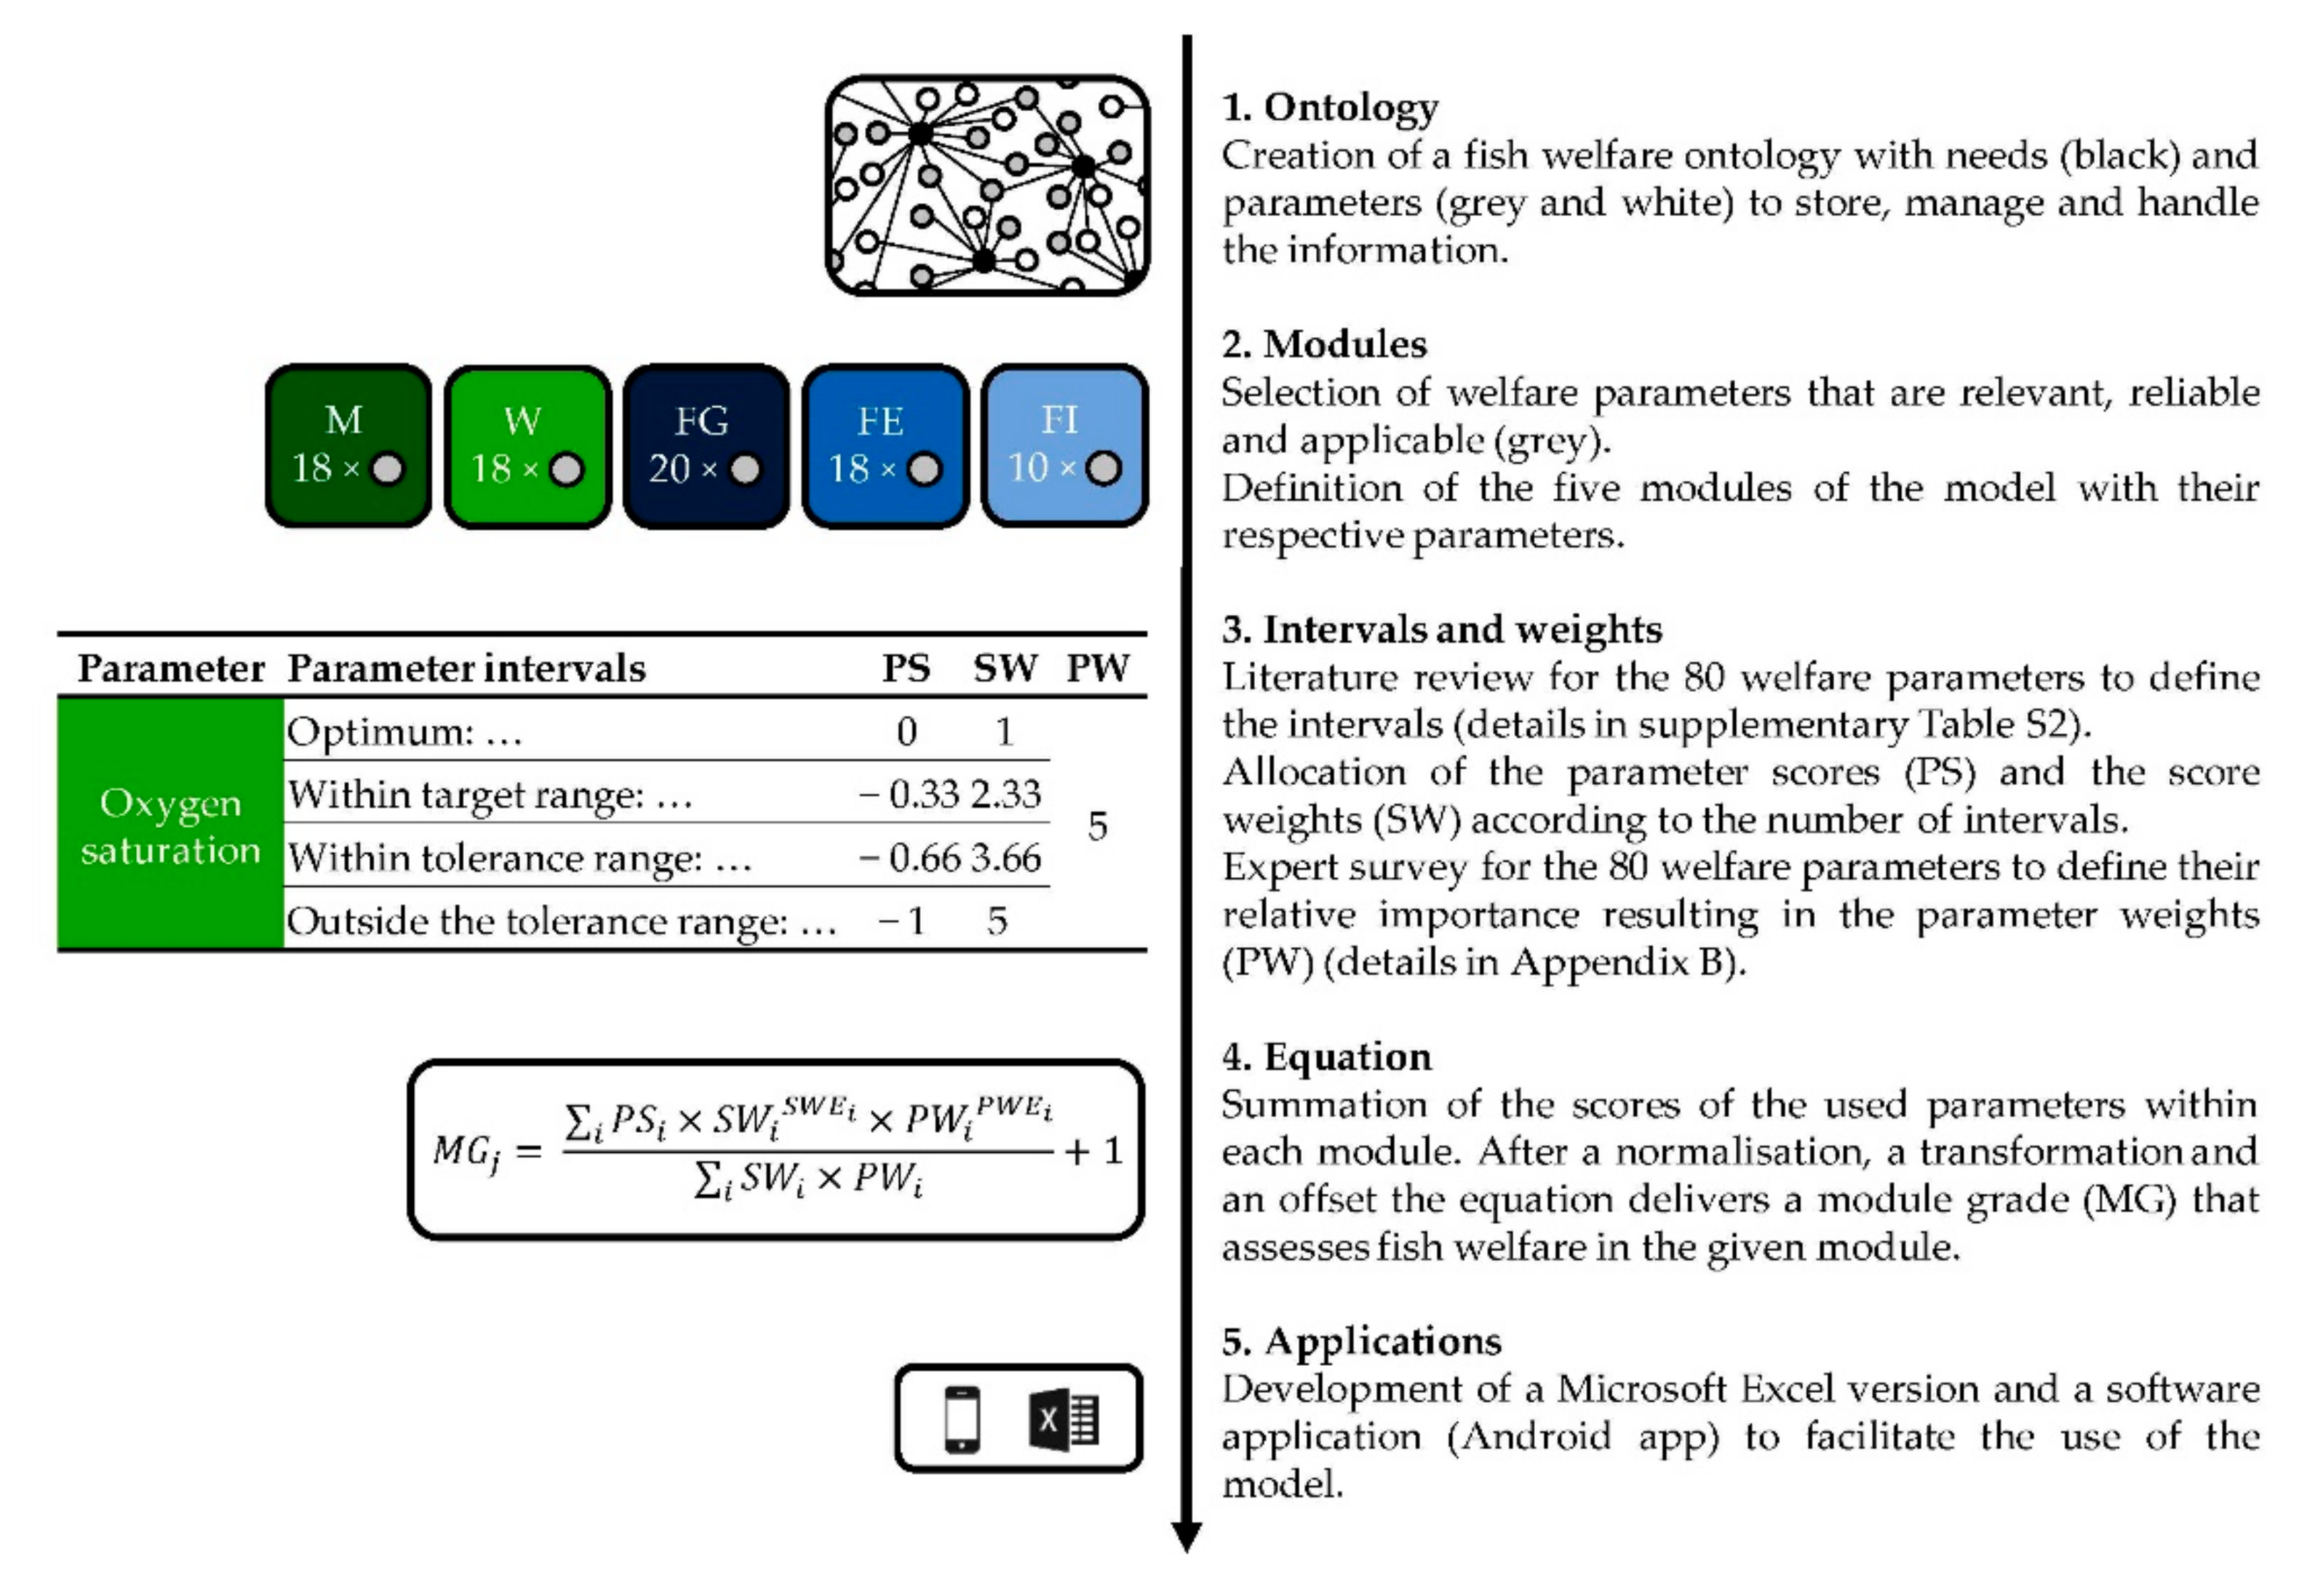
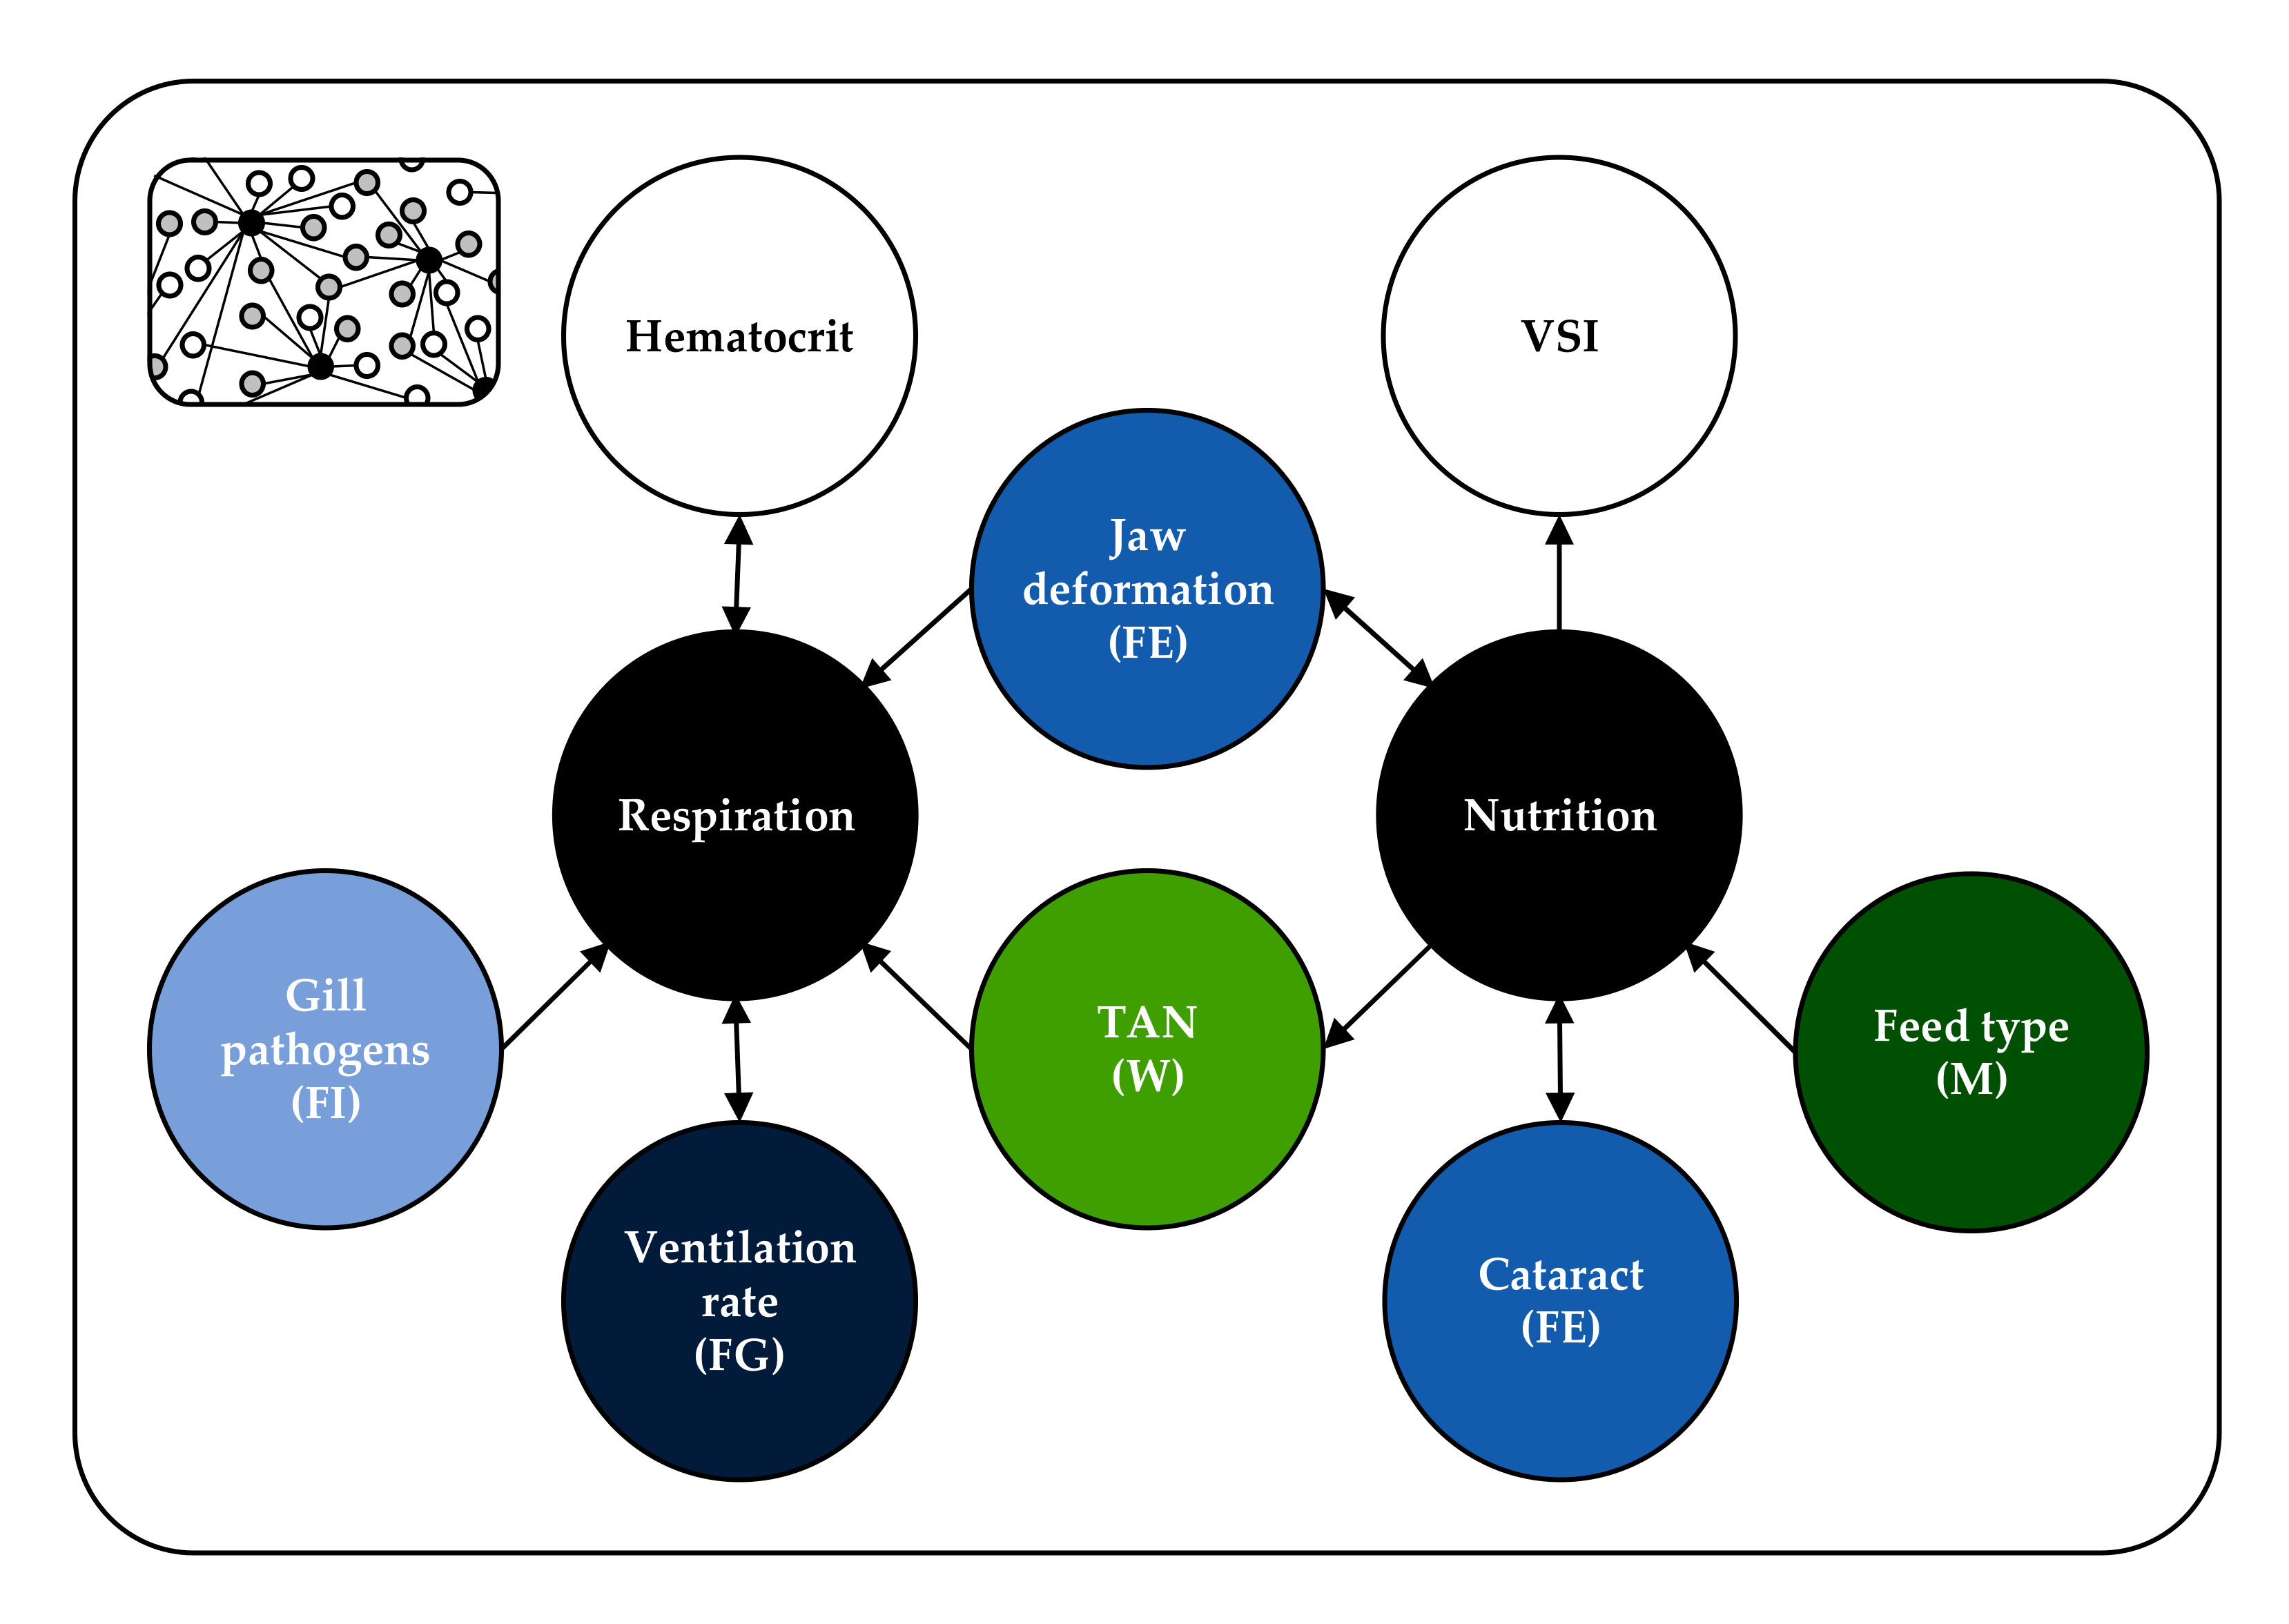
2.1. Creating an Ontology for Fish Welfare
2.2. Selecting and Grouping Parameters for the Model
2.3. Developing the Equation for the Model
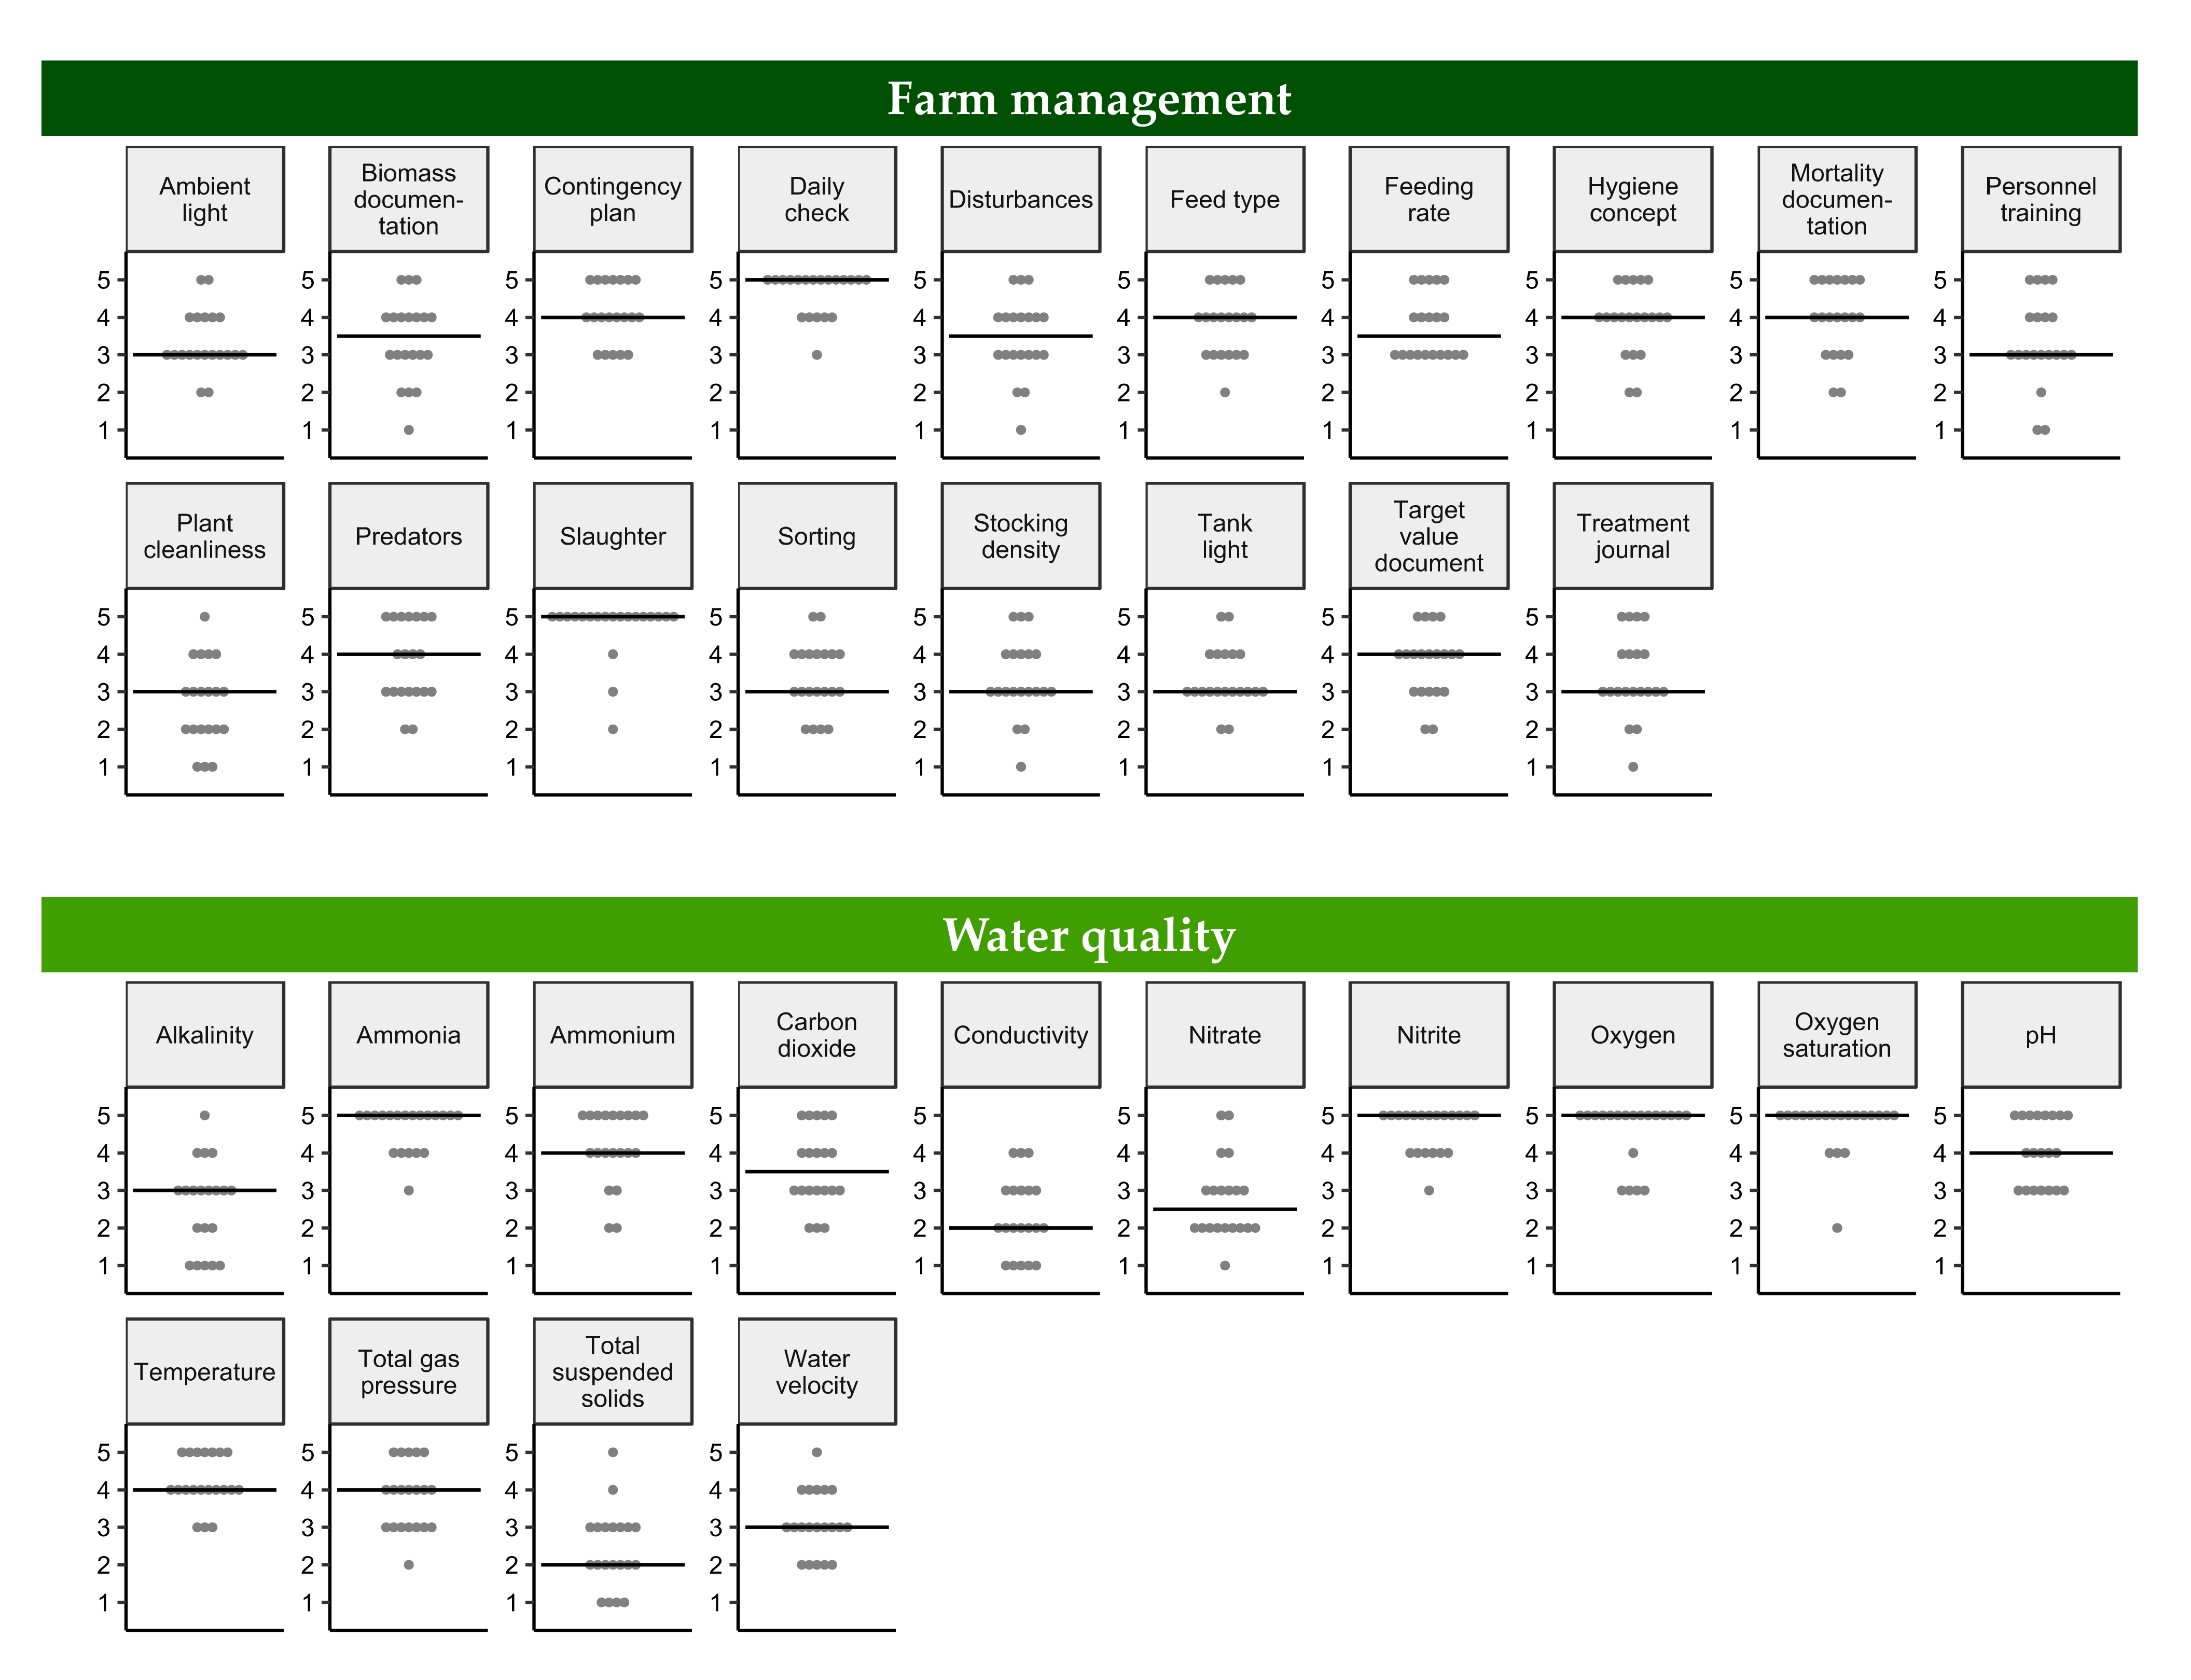
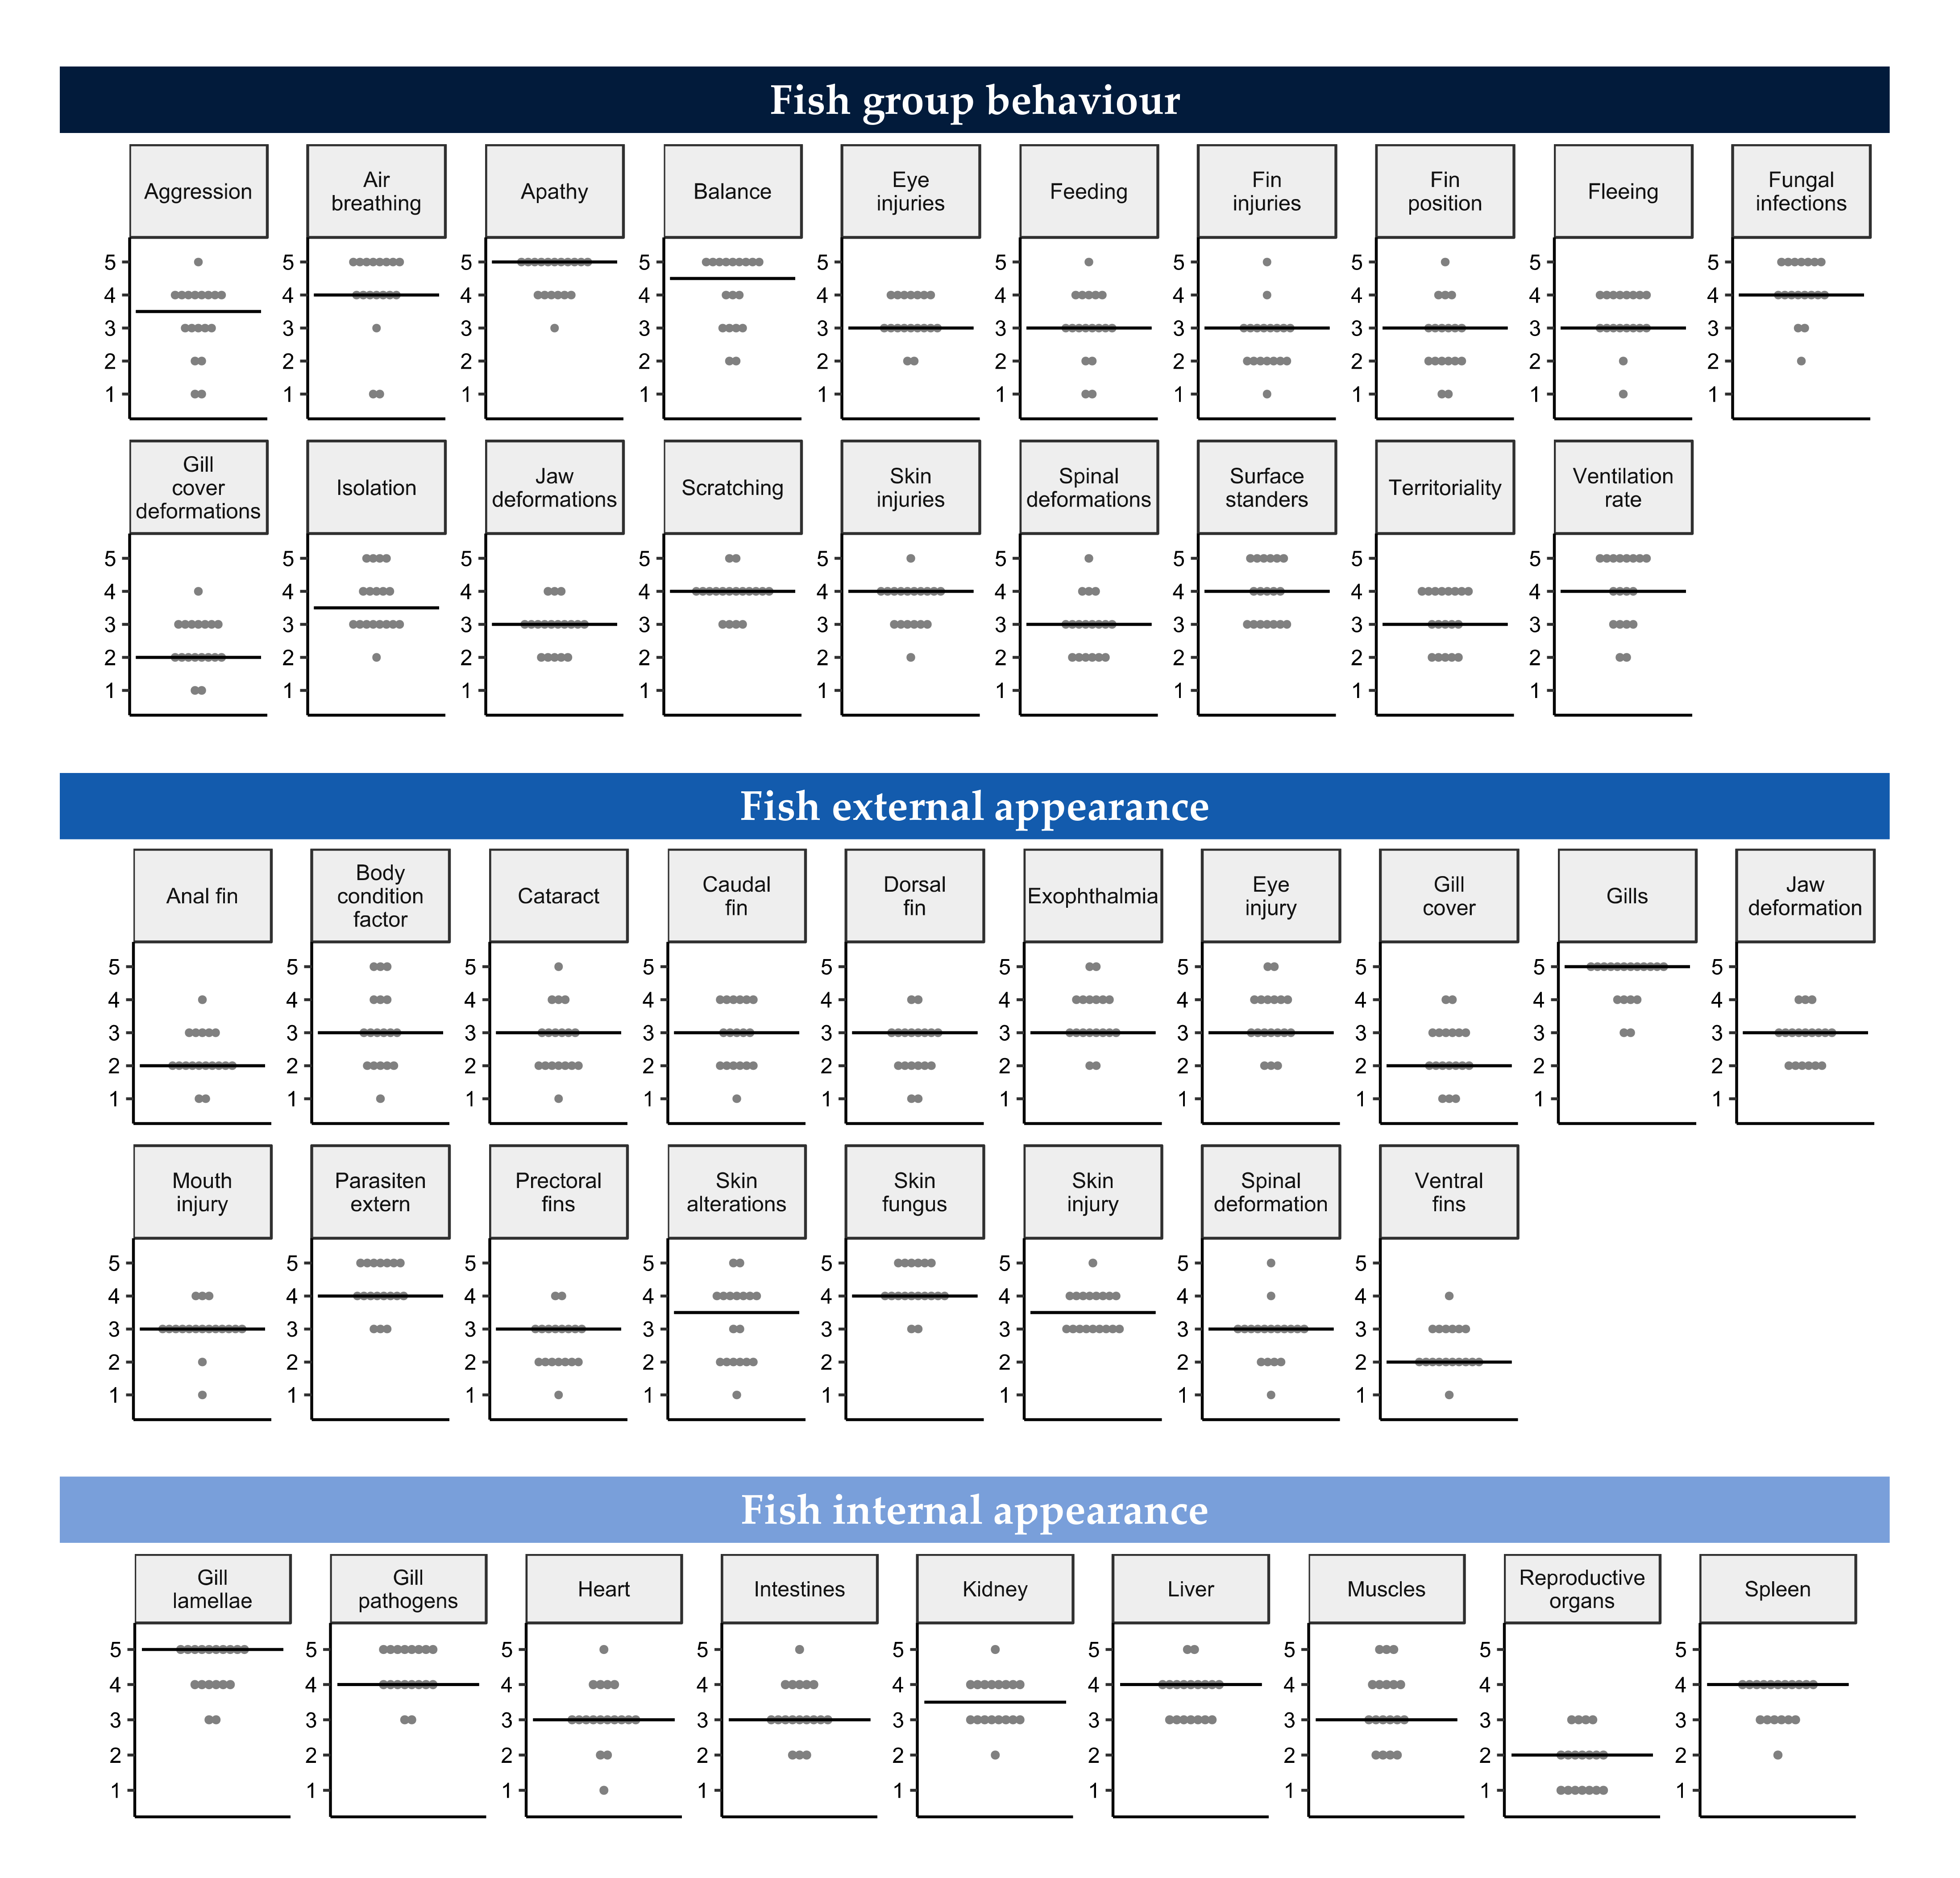
2.3.1. Parameter Intervals and Parameter Scores (PS)
2.3.2. Parameter Weights (PW)
2.3.3. Score Weights (SW)
2.4. Developing the Equation for the Model
2.4.1. Sum of Scores
2.4.2. Normalisation
2.4.3. Off-Set
2.4.4. Parametric Transformation
2.4.5. Module Grades
- [0–0.25): critical welfarewelfare is severely compromised, short- and long-term impairments are expected
- [0.25–0.5): poor welfarewelfare is affected negatively, long-term impairments are expected
- [0.5–0.75): acceptable welfaregiven the current knowledge the model is based on, the fish experience acceptable although improvable welfare
- [0.75–1]: good welfaregiven the current knowledge the model is based on, the fish are likely to experience good welfare
2.5. Developing a Software Application for the Model
3. Model Validation
4. Discussion
4.1. Implementation of Semantic Data Modelling
4.2. Use of the Concept of Allostasis
4.3. Subjectivity in the Model
4.4. Validation of the Model
4.5. Future Development and Adaptation of the Model
4.6. Value of the New Model
5. Conclusions
Supplementary Materials
Author Contributions
Funding
Institutional Review Board Statement
Informed Consent Statement
Data Availability Statement
Acknowledgments
Conflicts of Interest
Appendix A

| Location/ System/Species | Parameter | Parameter Intervals | PS | SW | PW | SWE PWE |
|---|---|---|---|---|---|---|
| In/Out RAS/FTS RT/PP | Personnel training | 0: Apprenticeship/master degree with work experience | 0 | 1 | 3 | 0 1.7 |
| 1: Apprenticeship/master degree in Aquaculture or “FBA Aquakultur” with work experience | −0.5 | 3 | ||||
| 2: “FBA Aquakultur” | −1 | 5 | ||||
| In/Out RAS/FTS RT/PP | Daily check | 0: Daily check with appropriate controls | 0 | 1 | 5 | |
| 1: Daily check | −0.5 | 3 | ||||
| 2: System is checked insufficiently | −1 | 5 | ||||
| In/Out RAS/FTS RT/PP | Disturbances | 0: No external disturbances | 0 | 1 | 3.5 | |
| 1: Little or slight disturbances | −0.5 | 3 | ||||
| 2: Frequent and/or severe disturbances | −1 | 5 | ||||
| Out RAS/FTS RT/PP | Predator protection | 0: Completely protected from predators | 0 | 1 | 4 | |
| 1: Partially protected from predators | −0.5 | 3 | ||||
| 2: Not protected | −1 | 5 | ||||
| In/Out RAS/FTS RT/PP | Plant cleanliness | 0: The farm is clean and tidy, working materials are clean and disinfected | 0 | 1 | 3 | |
| 1: The farm is clean, working materials are clean | −0.5 | 3 | ||||
| 2: The farm is chaotic and dirty, working materials dirty | −1 | 5 | ||||
| In/Out RAS/FTS RT/PP | Treatment journal | 0: Medication, extraordinary and routine (disinfection) measures are documented | 0 | 1 | 3 | |
| 1: Medication and extraordinary (disinfection) measures are documented | −0.5 | 3 | ||||
| 2: Medications are documented | −1 | 5 | ||||
| In/Out RAS/FTS RT/PP | Target value sheet | 0: Target value document and action plan are accessible | 0 | 1 | 4 | |
| 1: Target value document and an action plan are known, but not documented | −0.5 | 3 | ||||
| 2: There are no target values or specific action plan applied | −1 | 5 | ||||
| In/Out RAS/FTS RT/PP | Emergency plan | 0: An appropriate emergency plan is available and accessible | 0 | 1 | 4 | |
| 1: An appropriate emergency plan is known, but not documented | −0.5 | 3 | ||||
| 2: No emergency plan is available, or it is not appropriate | −1 | 5 | ||||
| In/Out RAS/FTS RT/PP | Hygiene concept | 0: An appropriate hygiene concept is available and accessible | 0 | 1 | 4 | |
| 1: An appropriate hygiene concept is applied, but not documented | −0.5 | 3 | ||||
| 2: No emergency hygiene is available, or it is not appropriate | −1 | 5 | ||||
| In/Out RAS/FTS RT/PP | Mortality documentation | 0: All mortalities and their cause are documented and deducted from biomass | 0 | 1 | 4 | |
| 1: All mortalities are documented and deducted from the biomass | −0.5 | 3 | ||||
| 2: All mortalities are documented | −1 | 5 | ||||
| In/Out RAS/FTS RT/PP | Biomass documentation | 0: Biomass/stocking density are documented and recalculated, sporadically interim weighings | 0 | 1 | 3.5 | |
| 1: The biomass and stocking density are documented and sporadically verified with weighings | −0.5 | 3 | ||||
| 2: The biomass is documented | −1 | 5 | ||||
| In/Out RAS/FTS RT/PP | Sorting | 0: The group is homogeneous | 0 | 1 | 3 | |
| 1: The group is slightly heterogeneous, unproblematic | −0.5 | 3 | ||||
| 2: The group is very heterogeneous, problematic | −1 | 5 | ||||
| In/Out RAS/FTS RT/PP | Slaughter | 0: Crowding: short/stunning method: effective/killing: fast/no fish shows reflexes | 0 | 1 | 5 | |
| 1: Crowding: short/stunning method: effective/killing: delayed/no fish shows reflexes | −0.5 | 3 | ||||
| 2: Crowding: long/stunning method: effective/killing: delayed/no fish shows reflexes | −1 | 5 | ||||
| In/Out RAS/FTS RT | Stocking density | 0: 0–40 kg/m3 | 0 | 1 | 3 | |
| 1: 40–60 kg/m3 | −0.5 | 3 | ||||
| 2: 60–80 kg/m3 | −1 | 5 | ||||
| In/Out RAS/FT SPP | 0: 0–30 kg/m3 | 0 | 1 | |||
| 1: 30–50 kg/m3 | −0.5 | 3 | ||||
| 2: 50–80 kg/m3 | −1 | 5 | ||||
| In/Out RAS/FTS RT/PP | Feeding interval and rate | 0: 5–6 points | 0 | 1 | 3.5 | |
| 1: 3–4 points | −0.5 | 3 | ||||
| 2: 0–2 points | −1 | 5 | ||||
| In/Out RAS/FTS RT/PP | Feed type | 0: Feed type and pellet size are adapted to the fish | 0 | 1 | 4 | |
| 1: Pellets are too small/big for the animals | −0.5 | 3 | ||||
| 2: Type and size does not match the fish | −1 | 5 | ||||
| In RAS/FTS RT/PP | Ambient light | 0: Light intensity and phases are adjusted | 0 | 1 | 3 | |
| 1: Light intensity or light phases are adjusted | −0.5 | 3 | ||||
| 2: Neither light intensity nor light phases are adjusted | −1 | 5 | ||||
| In/Out RAS/FTS RT/PP | Tank light | 0: Light intensity and light distribution adapted | 0 | 1 | 3 | |
| 1: Light intensity or light distribution adapted | −0.5 | 3 | ||||
| 2: Neither intensity nor light distribution adapted | −1 | 5 |
| Location/ System/Species | Parameter | Parameter Intervals | PS | SW | PW | SWE PWE |
|---|---|---|---|---|---|---|
| In/Out RAS/FTS RT | Temperature | Optimum: [10–16] | 0 | 1 | 4 | 1.7 1.7 |
| Within target range: [6–10) ∪ (16–18] | −0.33 | 2.33 | ||||
| Within the tolerance range: [4–6) ∪ (18–22] | −0.66 | 3.66 | ||||
| Outside the tolerance range: [0–4) ∪ (22–35] | −1 | 5 | ||||
| In/Out RAS/FT SPP | Optimum: [20–25] | 0 | 1 | |||
| Within target range: [13–20) ∪ (25–28] | −0.33 | 2.33 | ||||
| Within the tolerance range: [8–13) ∪ (28–30] | −0.66 | 3.66 | ||||
| Outside the tolerance range: [0–8) ∪ (30–40] | −1 | 5 | ||||
| In/Out RAS/FTS RT/PP | Oxygen | Optimum: [8–10] | 0 | 1 | 5 | |
| Within target range: [7–8) ∪ (10–13] | −0.33 | 2.33 | ||||
| Within the tolerance range: [6–7) ∪ (13–15] | −0.66 | 3.66 | ||||
| Outside the tolerance range: [2–6) ∪ (15–30] | −1 | 5 | ||||
| In/Out RAS/FTS RT/PP | Oxygen saturation | Optimum: [80–120] | 0 | 1 | 5 | |
| Within target range: [70–80) ∪ (120–140] | −0.33 | 2.33 | ||||
| Within tolerance range: [60–70) ∪ (140–160] | −0.66 | 3.66 | ||||
| Outside the tolerance range: [20–60) ∪ (160–300] | −1 | 5 | ||||
| In/Out RAS RT/PP | Ammonium | Optimum: [0–0.5] | 0 | 1 | 4 | |
| Within target range: (0.5–1.5] | −0.33 | 2.33 | ||||
| Within tolerance range: (1.5–5] | −0.66 | 3.66 | ||||
| Outside the tolerance range: (5–20] | −1 | 5 | ||||
| In/Out RAS RT/PP | Ammonia | Optimum: [0–0.01] | 0 | 1 | 5 | |
| Within target range: (0.01–0.02] | −0.33 | 2.33 | ||||
| Within tolerance range: (0.02–0.1] | −0.66 | 3.66 | ||||
| Outside the tolerance range: (0.1–2] | −1 | 5 | ||||
| In/Out RAS RT/PP | Nitrite | Optimum: [0–0.05] | 0 | 1 | 5 | |
| Within target range: (0.05–0.1] | −0.33 | 2.33 | ||||
| Within tolerance range: (0.1–0.5] | −0.66 | 3.66 | ||||
| Outside the tolerance range: (0.5–5] | −1 | 5 | ||||
| In/Out RAS RT/PP | Nitrate | Optimum: [0–50] | 0 | 1 | 2.5 | |
| Within target range: (50–75] | −0.33 | 2.33 | ||||
| Within tolerance range: (75–150] | −0.66 | 3.66 | ||||
| Outside tolerance range: (150–500] | −1 | 5 | ||||
| In/Out RAS/FTS RT/PP | Carbonate hardness | Optimum: [40–150] | 0 | 1 | 3 | |
| Within target range: [30–40) ∪ (150–250] | −0.33 | 2.33 | ||||
| Within tolerance range: [20–30) ∪ (250–400] | −0.66 | 3.66 | ||||
| Outside tolerance range: [0–20) ∪ (400–500] | −1 | 5 | ||||
| In/Out RAS/FTS RT/PP | Total suspended solids | Optimum: [0–25] | 0 | 1 | 2 | |
| Within target range: (25–50] | −0.33 | 2.33 | ||||
| Within tolerance range: (50–200] | −0.66 | 3.66 | ||||
| Outside tolerance range: (200–500] | −1 | 5 | ||||
| In/Out RAS/FTS RT/PP | pH | Optimum: [7–7.5] | 0 | 1 | 4 | |
| Within target range: [6.5–7) ∪ (7.5–8] | −0.33 | 2.33 | ||||
| Within the tolerance range: [6–6.5) ∪ (8–8.5] | −0.66 | 3.66 | ||||
| Outside the tolerance range: [4–6) ∪ (8.5–10] | −1 | 5 | ||||
| In/Out RAS/FTS RT/PP | Conductivity | Optimum: [500–1000] | 0 | 1 | 2 | |
| Within target range: [300–500) ∪ (1000–5000] | −0.33 | 2.33 | ||||
| Within tolerance range: [200–300) ∪ (5000–15000] | −0.66 | 3.66 | ||||
| Outside tolerance range: [0–200) ∪ (15000–30000] | −1 | 5 | ||||
| In/Out RAS/FTS RT/PP | Carbon dioxide | Optimum: [0–5] | 0 | 1 | 3.5 | |
| Within target range: (5–20] | −0.33 | 2.33 | ||||
| Within tolerance range: (20–30] | −0.66 | 3.66 | ||||
| Outside the tolerance range: (30–100] | −1 | 5 | ||||
| In/Out RAS/FTS RT/PP | Total gas pressure | Optimum: </= 100 | 0 | 1 | 4 | |
| Within target range: (100–103] | −0.33 | 2.33 | ||||
| Within tolerance range: (103–105] | −0.66 | 3.66 | ||||
| Outside tolerance range: (105–120] | −1 | 5 | ||||
| In/Out RAS/FTS RT/PP | Water velocity | Optimum: [0.5–1] | 0 | 1 | 3 | |
| Within target range: [0.3–0.5) ∪ (1–2] | −0.33 | 2.33 | ||||
| Within tolerance range: [0.2–0.3) ∪ (2–3] | −0.66 | 3.66 | ||||
| Outside the tolerance range: [0–0.2) ∪ (3–5] | −1 | 5 |
| Location/ System/Species | Parameter | Parameter Intervals | PS | SW | PW | SWE PWE |
|---|---|---|---|---|---|---|
| In/Out RAS/FTS RT/PP | Aggression | 0: No fish shows dominance or aggression | 0 | 1 | 3.5 | 1.7 1.7 |
| 1: Individual fish show dominance behaviour | −0.2 | 1.8 | ||||
| 2: Some fish show dominance behaviour | −0.4 | 2.6 | ||||
| 3: Individual fish show aggression behaviour | −0.6 | 3.4 | ||||
| 4: Some fish show aggressive behaviour | −0.8 | 4.2 | ||||
| 5: Many fish are either dominant or aggressive | −1 | 5 | ||||
| In/Out RAS/FTS RT/PP | Territoriality | 0: No fish shows territorial behaviour | 0 | 1 | 3 | |
| 1: Individual fish show territorial behaviour | −0.2 | 1.8 | ||||
| 2: Some fish show territorial behaviour | −0.4 | 2.6 | ||||
| 3: Individual fish show a territorial monopolization of key areas | −0.6 | 3.4 | ||||
| 4: Some fish show a territorial monopolization of key areas | −0.8 | 4.2 | ||||
| 5: Some fish show a territorial monopolization of key areas, part of shoal has no access to these | −1 | 5 | ||||
| In/Out RAS/FTS RT/PP | Scratching | 0: No fish jumps or scratches | 0 | 1 | 4 | |
| 1: Individual fish occasionally jump and/or scratch themselves on surfaces | −0.2 | 1.8 | ||||
| 2: Some fish occasionally jump and/or scratch themselves on surfaces | −0.4 | 2.6 | ||||
| 3: Individual fish frequently jump and/or scratch themselves on surfaces | −0.6 | 3.4 | ||||
| 4: Some fish frequently jump and/or scratch themselves on surfaces | −0.8 | 4.2 | ||||
| 5: Many fish frequently jump and/or scratch themselves on surfaces | −1 | 5 | ||||
| In/Out RAS/FTS RT/PP | Apathy | 0: No fish show signs of apathy | 0 | 1 | 5 | |
| 1: Individual fish show apathetic swimming behaviour, react normally to stimulation | −0.2 | 1.8 | ||||
| 2: Some fish show apathetic swimming behaviour, react normally to stimulation | −0.4 | 2.6 | ||||
| 3: Individual fish show apathetic swimming behaviour, do not react to stimulation | −0.6 | 3.4 | ||||
| 4: Some fish show apathetic swimming behaviour, do not respond to stimulation | −0.8 | 4.2 | ||||
| 5: Many fish show apathetic swimming behaviour, do not respond to stimulation | −1 | 5 | ||||
| In/Out RAS/FTS RT/PP | Isolation | 0: All fish are part of a shoal | 0 | 1 | 3.5 | |
| 1: Individual fish stand apart | −0.2 | 1.8 | ||||
| 2: Some fish stand apart | −0.4 | 2.6 | ||||
| 3: Individual fish stand apart and/or on the surface | −0.6 | 3.4 | ||||
| 4: Some fish stand apart and/or on the surface | −0.8 | 4.2 | ||||
| 5: Many fish stand apart and/or on the surface | −1 | 5 | ||||
| In/Out RAS/FTS RT/PP | Surfacing | 0: All fish swim normally in the water column | 0 | 1 | 4 | |
| 1: Individual fish are predominantly lying on the bottom | −0.2 | 1.8 | ||||
| 2: Some fish are constantly lying on the bottom | −0.4 | 2.6 | ||||
| 3: Individual fish are increasingly swimming on the surface | −0.6 | 3.4 | ||||
| 4: Some fish swim mainly on the surface | −0.8 | 4.2 | ||||
| 5: Many fish swim mainly on the surface | −1 | 5 | ||||
| In/Out RAS/FTS RT/PP | Air gulping | 0: No fish shows air breathing | 0 | 1 | 4 | |
| 1: Individual fish show occasional gasps | −0.2 | 1.8 | ||||
| 2: Some fish show occasional gasps | −0.4 | 2.6 | ||||
| 3: Individual fish show frequent gasps | −0.6 | 3.4 | ||||
| 4: Some fish show constant air gulping | −0.8 | 4.2 | ||||
| 5: Many fish show constant air gulping | −1 | 5 | ||||
| In/Out RAS/FTS RT/PP | Ventilation rate | 0: All fish have a normal ventilation rate | 0 | 1 | 4 | |
| 1: Individual fish show an increased ventilation rate | −0.2 | 1.8 | ||||
| 2: Some fish show increased ventilation rate | −0.4 | 2.6 | ||||
| 3: Individual fish show a greatly increased or slightly reduced ventilation rate | −0.6 | 3.4 | ||||
| 4: Some fish show a greatly increased or clearly reduced ventilation rate | −0.8 | 4.2 | ||||
| 5: Many fish show a greatly increased or clearly reduced ventilation rate | −1 | 5 | ||||
| In/Out RAS/FTS RT/PP | Fleeing | 0: All fish show normal fleeing when stimulated and calm down quickly | 0 | 1 | 3 | |
| 1: Individual fish show an increased and/or prolonged fleeing behaviour | −0.2 | 1.8 | ||||
| 2: Some fish show an increased and/or prolonged fleeing behaviour | −0.4 | 2.6 | ||||
| 3: Individual fish show no or constant fleeing behaviour | −0.6 | 3.4 | ||||
| 4: Some fish show no or constant fleeing behaviour | −0.8 | 4.2 | ||||
| 5: Many fish show no or constant fleeing behaviour | −1 | 5 | ||||
| In/Out RAS/FTS RT/PP | Fin position | 0: All fish show a normal and calm fin position | 0 | 1 | 3 | |
| 1: Individual fish occasionally have their fins pinched or splayed out | −0.2 | 1.8 | ||||
| 2: Some fishes occasionally pinch or splay out their fins | −0.4 | 2.6 | ||||
| 3: Individual fishes have the fins constantly pinched or splayed out | −0.6 | 3.4 | ||||
| 4: Some fish have the fins constantly pinched or splayed out | −0.8 | 4.2 | ||||
| 5: Many fishes have the fins constantly pinched or splayed out | −1 | 5 |
| Location/ System/Species | Parameter | Parameter Intervals | PS | SW | PW | SWE PWE |
|---|---|---|---|---|---|---|
| In/Out RAS/FTS RT/PP | Balance | 0: All fish show a normal balance and orientation | 0 | 1 | 4.5 | 1.7 1.7 |
| 1: Individual fish are sometimes misaligned | −0.2 | 1.8 | ||||
| 2: Some fish are crooked at times | −0.4 | 2.6 | ||||
| 3: Individual fish are constantly crooked | −0.6 | 3.4 | ||||
| 4: Some fish are constantly crooked | −0.8 | 4.2 | ||||
| 5: Many fish are constantly crooked | −1 | 5 | ||||
| In/Out RAS/FTS RT/PP | Body colour | 0: All the fish show a normal body coloration | 0 | 1 | 3 | |
| 1: Single fish have temporarily a conspicuously bleft or dark coloration | −0.2 | 1.8 | ||||
| 2: Some fish have temporarily a conspicuously bleft or dark coloration | −0.4 | 2.6 | ||||
| 3: Individual fish have constantly striking a bleft or dark coloration | −0.6 | 3.4 | ||||
| 4: Some fish constantly have a noticeable light or dark colour | −0.8 | 4.2 | ||||
| 5: Many fish constantly have a noticeable light or dark colour | −1 | 5 | ||||
| In/Out RAS/FTS RT/PP | Feeding | 0: All fish show normal feeding behaviour | 0 | 1 | 3 | |
| 1: Individual fish show a very hungry, hectic eating behaviour | −0.2 | 1.8 | ||||
| 2: Some fish show a very hungry, hectic eating behaviour | −0.4 | 2.6 | ||||
| 3: Individual fish show a starved, aggressive eating behaviour | −0.6 | 3.4 | ||||
| 4: Some fish show a starved, aggressive eating behaviour | −0.8 | 4.2 | ||||
| 5: Many fish show a starved, aggressive eating behaviour | −1 | 5 | ||||
| In/Out RAS/FTS RT/PP | Jaw deformations | 0: No fish has injuries/deformations of the jaw/snout | 0 | 1 | 3 | |
| 1: Individual fish have slight injuries/deformations of the jaw/snout | −0.2 | 1.8 | ||||
| 2: Some fish have slight injuries/deformations of the jaw/snout | −0.4 | 2.6 | ||||
| 3: Individual fish have severe injuries/deformations of the jaw/snout | −0.6 | 3.4 | ||||
| 4: Some fish have severe injuries/deformations of the jaw/snout | −0.8 | 4.2 | ||||
| 5: Many fish have severe injuries/deformations of the jaw/snout | −1 | 5 | ||||
| In/Out RAS/FTS RT/PP | Gill cover deformations | 0: No fish has injuries/deformations of the opercula | 0 | 1 | 2 | |
| 1: Individual fish have slight injuries/deformations of the opercula | −0.2 | 1.8 | ||||
| 2: Some fish have slight injuries/deformations of the opercula | −0.4 | 2.6 | ||||
| 3: Individual fish have severe injuries/deformations of the opercula | −0.6 | 3.4 | ||||
| 4: Some fish have severe injuries/deformations of the opercula | −0.8 | 4.2 | ||||
| 5: Many fish have severe injuries/deformations of the opercula | −1 | 5 | ||||
| In/Out RAS/FTS RT/PP | Spinal deformations | 0: No fish has injuries/deformations of the spine | 0 | 1 | 3 | |
| 1: Individual fish have a slight injuries/deformations of the spine | −0.2 | 1.8 | ||||
| 2: Some fish have a slight injuries/deformations of the spine | −0.4 | 2.6 | ||||
| 3: Individual fish have a severe injuries/deformations of the spine | −0.6 | 3.4 | ||||
| 4: Some fish have severe injuries/deformations of the spine | −0.8 | 4.2 | ||||
| 5: Many fish have a severe injuries/deformations of the spine | −1 | 5 | ||||
| In/Out RAS/FTS RT/PP | Eye injuries | 0: No fish has eye injuries/deformations | 0 | 1 | 3 | |
| 1: Individual fish have slight injuries/deformations to the eyes | −0.2 | 1.8 | ||||
| 2: Some fish have minor eye injuries/deformations | −0.4 | 2.6 | ||||
| 3: Individual fish have severe injuries/deformations to the eyes | −0.6 | 3.4 | ||||
| 4: Some fish have severe eye injuries/deformations | −0.8 | 4.2 | ||||
| 5: Many fish have severe injuries/deformations to the eyes | −1 | 5 | ||||
| In/Out RAS/FTS RT/PP | Skin injuries | 0: No fish has injuries/deformations of the skin | 0 | 1 | 4 | |
| 1: Individual fish have slight injuries/deformations of the skin | −0.2 | 1.8 | ||||
| 2: Some fish have slight injuries/deformations of the skin | −0.4 | 2.6 | ||||
| 3: Individual fish have severe injuries/deformations of the skin | −0.6 | 3.4 | ||||
| 4: Some fish have severe injuries/deformations of the skin | −0.8 | 4.2 | ||||
| 5: Many fish have severe injuries/deformations of the skin | −1 | 5 | ||||
| In/Out RAS/FTS RT/PP | Fin injuries | 0: No fish has injuries/deformations of the fins | 0 | 1 | 3 | |
| 1: Individual fish have slight injuries/deformations of the fins | −0.2 | 1.8 | ||||
| 2: Some fish have slight injuries/deformations of the fins | −0.4 | 2.6 | ||||
| 3: Individual fish have severe injuries/deformations of the fins | −0.6 | 3.4 | ||||
| 4: Some fish have severe injuries/deformations of the fins | −0.8 | 4.2 | ||||
| 5: Many fish have severe injuries/deformations of the fins | −1 | 5 | ||||
| In/Out RAS/FTS RT/PP | Fungal infections | 0: No fish has any fungus | 0 | 1 | 4 | |
| 1: Individual fish have fungal infection of the fins | −0.2 | 1.8 | ||||
| 2: Some fish have fungal infection of the fins | −0.4 | 2.6 | ||||
| 3: Individual fish have fungal infection of the fins and the body | −0.6 | 3.4 | ||||
| 4: Some fish have fungal infection of the fins and the body | −0.8 | 4.2 | ||||
| 5: Many fish have fungal infection of the fins and the body | −1 | 5 |
| Location/ System/Species | Parameter | Parameter Intervals | PS | SW | PW | SWE PWE |
|---|---|---|---|---|---|---|
| In/Out RAS/FTS RT/PP | Cataract | 0: Both eyes are clear | 0 | 1 | 3 | 1.7 1.7 |
| 1: One lens shows light clouding | −0.33 | 2.33 | ||||
| 2: Both lenses show light clouding or one lens strong clouding | −0.66 | 3.66 | ||||
| 3: Both lenses show strong clouding | −1 | 5 | ||||
| In/Out RAS/FTS RT/PP | Eye injury | 0: No indication | 0 | 1 | 3 | |
| 1: One-sided small injury, not inflamed or healing | −0.33 | 2.33 | ||||
| 2: One-sided injury or both-sided small injury, slightly inflamed | −0.66 | 3.66 | ||||
| 3: One-sided severe injury or both-sided injury, inflamed | −1 | 5 | ||||
| In/Out RAS/FTS RT/PP | Exophthalmia | 0: No indication | 0 | 1 | 3 | |
| 1: One-sided slight exophthalmia | −0.33 | 2.33 | ||||
| 2: Both-sided slight exophthalmia or one-sided exophthalmia | −0.66 | 3.66 | ||||
| 3: Both-sided exophthalmia | −1 | 5 | ||||
| In/Out RAS/FTS RT | Body condition factor | 0: 1–1.3 | 0 | 1 | 3 | |
| 1: 0.8–1.5 | −0.33 | 2.33 | ||||
| 2: > 1.5 | −0.66 | 3.66 | ||||
| 3: < 0.8 | −1 | 5 | ||||
| In/Out RAS/FT SPP | 0: 0.9–1.1 | 0 | 1 | |||
| 1: 0.7–1.3 | −0.33 | 2.33 | ||||
| 2: > 1.3 | −0.66 | 3.66 | ||||
| 3: < 0.7 | −1 | 5 | ||||
| In/Out RAS/FTS RT/PP | Spinal deformation | 0: No indication | 0 | 1 | 3 | |
| 1: Indication of deformation | −0.33 | 2.33 | ||||
| 2: Clear deformation | −0.66 | 3.66 | ||||
| 3: Strong deformation | −1 | 5 | ||||
| In/Out RAS/FTS RT/PP | Jawde formation | 0: No indication | 0 | 1 | 3 | |
| 1: Indication of deformation | −0.33 | 2.33 | ||||
| 2: Clear deformation | −0.66 | 3.66 | ||||
| 3: Strong deformation | −1 | 5 | ||||
| In/Out RAS/FTS RT/PP | Mouth injury | 0: No indication | 0 | 1 | 3 | |
| 1: A few small injuries | −0.33 | 2.33 | ||||
| 2: Several small injuries | −0.66 | 3.66 | ||||
| 3: One or more large/deep injuries | −1 | 5 | ||||
| In/Out RAS/FTS RT/PP | Mucus pathogens | 0: No parasites detectable | 0 | 1 | 4 | |
| 1: A few parasites | −0.33 | 2.33 | ||||
| 2: Considerable parasite load | −0.66 | 3.66 | ||||
| 3: Heavy parasite load | −1 | 5 | ||||
| In/Out RAS/FTS RT/PP | Skin alterations | 0: No indication | 0 | 1 | 3.5 | |
| 1: A few small alterations (tumours, swellings, rashes, bleedings) | −0.33 | 2.33 | ||||
| 2: Several small alterations (tumours, swellings, rashes, bleedings) | −0.66 | 3.66 | ||||
| 3: One or more large alterations (tumours, swellings, rashes, bleedings) | −1 | 5 | ||||
| In/Out RAS/FTS RT/PP | Skin fungus | 0: No indication | 0 | 1 | 4 | |
| 1: A few small areas infected | −0.33 | 2.33 | ||||
| 2: Several small areas infected | −0.66 | 3.66 | ||||
| 3: One or more large areas infected | −1 | 5 | ||||
| In/Out RAS/FTS RT/PP | Skin injury | 0: No indication | 0 | 1 | 3.5 | |
| 1: A few small injuries or small areas with scale loss | −0.33 | 2.33 | ||||
| 2: Several small injuries and/or small areas with scale loss | −0.66 | 3.66 | ||||
| 3: One or more large/deep injuries and/or areas with scale loss | −1 | 5 |
| Location/ System/Species | Parameter | Location/Parameter Intervals | PS | SW | PW | SWE PWE |
|---|---|---|---|---|---|---|
| In/Out RAS/FTS RT/PP | Gill cover | 0: Both-sided: undamaged opercula | 0 | 1 | 2 | 1.7 1.7 |
| 1: One-sided/both-sided: opercula covers min. 2/3 of gill area | −0.33 | 2.33 | ||||
| 2: One-sided/both-sided: opercula covers min. 1/3 of gill area | −0.66 | 3.66 | ||||
| 3: One-sided/both-sided: opercula covers less than 1/3 of gill area | −1 | 5 | ||||
| In/Out RAS/FTS RT/PP | Gills | 0: Both-sided: undamaged, red gills | 0 | 1 | 5 | |
| 1: One-sided/both-sided: indications of damaged and/or discoloured gill tissue | −0.33 | 2.33 | ||||
| 2: One-sided/both-sided: several small areas of damaged and/or discoloured gill tissue | −0.66 | 3.66 | ||||
| 3: One-sided/both-sided: extensive areas of damaged and/or discoloured gill tissue | −1 | 5 | ||||
| In/Out RAS/FTS RT/PP | Pectoral fins | 0: Undamaged fins | 0 | 1 | 3 | |
| 1: One-sided/both-sided: indications of scar tissue or small/active fin damage | −0.33 | 2.33 | ||||
| 2: One-sided/both-sided: active fin damage or of fungal infections and/or inflammation | −0.66 | 3.66 | ||||
| 3: Both-sided: extensive scar tissue/extensive active fin damage/fungal infection or fin loss | −1 | 5 | ||||
| In/Out RAS/FTS RT/PP | Ventral fins | 0: Undamaged fins | 0 | 1 | 2 | |
| 1: One-sided/both-sided: indications of scar tissue or small/active fin damage | −0.33 | 2.33 | ||||
| 2: One-sided/both-sided: active fin damage or of fungal infections and/or inflammation | −0.66 | 3.66 | ||||
| 3: Both-sided: extensive scar tissue/extensive active fin damage/fungal infection or fin loss | −1 | 5 | ||||
| In/Out RAS/FTS RT/PP | Anal fin | 0: Undamaged fin | 0 | 1 | 2 | |
| 1: Indications of scar tissue or small and active fin damage | −0.33 | 2.33 | ||||
| 2: Active fin damage or indications of fungal infections and/or inflammation | −0.66 | 3.66 | ||||
| 3: Extensive scar tissue/extensive active fin damage/extensive fungal infection or fin loss | −1 | 5 | ||||
| In/Out RAS/FTS RT/PP | Caudal fin | 0: Undamaged fin | 0 | 1 | 3 | |
| 1: Indications of scar tissue or small and active fin damage | −0.33 | 2.33 | ||||
| 2: Active fin damage or indications of fungal infections and/or inflammation | −0.66 | 3.66 | ||||
| 3: Extensive scar tissue/extensive active fin damage/or extensive fungal infection or fin loss | −1 | 5 | ||||
| In/Out RAS/FTS RT/PP | Dorsal fin | 0: Undamaged fin | 0 | 1 | 3 | |
| 1: Indications of scar tissue or small and active fin damage | −0.33 | 2.33 | ||||
| 2: Active fin damage or indications of fungal infections and/or inflammation | −0.66 | 3.66 | ||||
| 3: Extensive scar tissue/extensive active fin damage/extensive fungal infection or fin loss | −1 | 5 |
| Location/ System/Species | Parameter | Parameter Intervals | PS | SW | PW | SWE PWE |
|---|---|---|---|---|---|---|
| In/Out RAS/FTS RT/PP | Heart | 0: Inconspicuous | 0 | 1 | 3 | 1.7 1.7 |
| 1: Slight discoloration | −0.33 | 2.33 | ||||
| 2: Discoloured and/or small necrosis and/or small hemorrhages | −0.66 | 3.66 | ||||
| 3: Severely discoloured and/or necrosis and/or hemorrhages | −1 | 5 | ||||
| In/Out RAS/FTS RT/PP | Kidney | 0: Inconspicuous | 0 | 1 | 3.5 | |
| 1: Slight discoloration | −0.33 | 2.33 | ||||
| 2: Discoloured and/or slightly granular | −0.66 | 3.66 | ||||
| 3: Severely discoloured and/or granular | −1 | 5 | ||||
| In/Out RAS/FTS RT/PP | Spleen | 0: Inconspicuous | 0 | 1 | 4 | |
| 1: Slight enlargement | −0.33 | 2.33 | ||||
| 2: Discoloured and/or slightly enlarged | −0.66 | 3.66 | ||||
| 3: Severely discoloured and/or enlarged | −1 | 5 | ||||
| In/Out RAS/FTS RT/PP | Liver | 0: Inconspicuous | 0 | 1 | 4 | |
| 1: Slight discoloration | −0.33 | 2.33 | ||||
| 2: Discoloured and/or slightly enlarged and/or small necrosis | −0.66 | 3.66 | ||||
| 3: Severely discoloured and/or enlarged and/or necrosis | −1 | 5 | ||||
| In/Out RAS/FTS RT/PP | Intestines | 0: Homogeneously filled with smooth food pulp | 0 | 1 | 3 | |
| 1: Unevenly filled with food pulp | −0.33 | 2.33 | ||||
| 2: Indications of inflammation and change in tissue (discolouring, swelling, tumours) | −0.66 | 3.66 | ||||
| 3: Inflammation/change in tissue (discoloured, tumours, hemorrhages, necrosis) or foreign objects | −1 | 5 | ||||
| In/Out RAS/FTS RT/PP | Muscles | 0: Normal | 0 | 1 | 3 | |
| 1: Single small hemorrhages, small vaccination damage | −0.33 | 2.33 | ||||
| 2: Several small or single extensive hemorrhages and/or clear vaccination damage | −0.66 | 3.66 | ||||
| 3: Extensive hemorrhages and/or necrosis and/or extensive vaccination damage | −1 | 5 | ||||
| In/Out RAS/FTS RT/PP | Body cavity | 0: Inconspicuous | 0 | 1 | 3 | |
| 1: Slight bleeding into the intestine and/or abdominal fat and/or swim bladder wall | −0.33 | 2.33 | ||||
| 2: Bleeding into the intestine/abdominal fat/swim bladder wall/slight fluid accumulation | −0.66 | 3.66 | ||||
| 3: Severe bleeding into the intestine/abdominal fat/swim bladder wall/fluid accumulation | −1 | 5 | ||||
| In/Out RAS/FTS RT/PP | Reproductive organs | 0: Not developed | 0 | 1 | 2 | |
| 1: Slightly developed/enlarged | −0.33 | 2.33 | ||||
| 2: Developed/enlarged | −0.66 | 3.66 | ||||
| 3: Ready to spawn | −1 | 5 | ||||
| In/Out RAS/FTS RT/PP | Gill lamellae | 0: Normal | 0 | 1 | 5 | |
| 1: Lamellae slightly swollen | −0.33 | 2.33 | ||||
| 2: Lamellae swollen, small hemorrhages/necrosis/edema/detachment of epithelium | −0.66 | 3.66 | ||||
| 3: Lamellae severely swollen, hemorrhages/necrosis/endema/detachment of epithelium | −1 | 5 | ||||
| In/Out RAS/FTS RT/PP | Gill pathogens | 0: No parasites detectable | 0 | 1 | 4 | |
| 1: A few parasites | −0.33 | 2.33 | ||||
| 2: Considerable parasite load | −0.66 | 3.66 | ||||
| 3: Heavy parasite load | −1 | 5 |
Appendix B


References
- Hume, D. Essay X: Of the immortality of the soul. In Essays and Treatises on Several Subjects; The Huntington Library: San Marino, CA, USA, 1777. [Google Scholar]
- Bentham, J. An Introduction to the Principles of Morals and Legislation; T. Payne and Son: London, UK, 1789. [Google Scholar]
- Griffin, D.R. Animal Minds; University of Chicago Press: Chicago, IL, USA, 1992; ISBN 978-0-226-30864-7. [Google Scholar]
- Dawkins, M.S. Animal minds and animal emotions. Am. Zool. 2000, 40, 883–888. [Google Scholar] [CrossRef]
- Dawkins, M.S. Evolution and animal welfare. Q. Rev. Biol. 1998, 73, 305–328. [Google Scholar] [CrossRef]
- HSMO. Animal Welfare Act 2006; Her Majesty’s Stationary Office: London, UK, 2006.
- Sneddon, L.U. The evidence for pain in fish: The use of morphine as an analgesic. Appl. Anim. Behav. Sci. 2003, 83, 153–162. [Google Scholar] [CrossRef]
- Sneddon, L.U. Trigeminal somatosensory innervation of the head of a teleost fish with particular reference to nociception. Brain Res. 2003, 972, 44–52. [Google Scholar] [CrossRef]
- Sneddon, L.U.; Braithwaite, V.A.; Gentle, M.J. Do fishes have nociceptors? Evidence for the evolution of a vertebrate sensory system. Proc. R. Soc. London Ser. B Biol. Sci. 2003, 270, 1115–1121. [Google Scholar] [CrossRef]
- Sneddon, L.U.; Braithwaite, V.A.; Gentle, M.J. Novel object test: Examining nociception and fear in the rainbow trout. J. Pain 2003, 4, 431–440. [Google Scholar] [CrossRef]
- Ashley, P.J.; Sneddon, L.U. Pain and fear in fish. In Fish Welfare; Branson, E.J., Ed.; Blackwell Publishing Ltd: Oxford, UK, 2008; pp. 49–77. ISBN 978-0-470-69761-0. [Google Scholar]
- Ashley, P.J. Fish welfare: Current issues in aquaculture. Appl. Anim. Behav. Sci. 2007, 104, 199–235. [Google Scholar] [CrossRef]
- Huntingford, F.A.; Adams, C.; Braithwaite, V.A.; Kadri, S.; Pottinger, T.G.; Sandøe, P.; Turnbull, J.F. Current issues in fish welfare. J. Fish Biol. 2006, 68, 332–372. [Google Scholar] [CrossRef]
- Kristiansen, T.S.; Bracke, M.B.M. A Brief Look into the Origins of Fish Welfare Science. In The Welfare of Fish; Kristiansen, T.S., Fernö, A., Pavlidis, M.A., van de Vis, H., Eds.; Animal Welfare; Springer International Publishing: Cham, Switzerland, 2020; pp. 1–17. ISBN 978-3-030-41675-1. [Google Scholar]
- Huntingford, F.A.; Kadri, S. Defining, assessing and promoting the welfare of farmed fish. Rev. Sci. Tech. Int. Off. Epizoot. 2014, 33, 233–244. [Google Scholar] [CrossRef]
- Bateson, P. Assessment of pain in animals. Anim. Behav. 1991, 42, 827–839. [Google Scholar] [CrossRef]
- Fraser, D.; Weary, D.M.; Pajor, E.A.; Milligan, B.N. A scientific conception of animal welfare that reflects ethical concerns. Anim. Welf. 1997, 6, 187–205. [Google Scholar]
- Huntingford, F.A.; Kadri, S. Welfare and fish. In Fish Welfare; Branson, E.J., Ed.; Blackwell Publishing Ltd: Oxford, UK, 2008; pp. 19–31. ISBN 978-0-470-69761-0. [Google Scholar]
- Lawrence, A.B. What is animal welfare? In Fish Welfare; Blackwell Publishing Ltd: Oxford, UK, 2008; pp. 5–18. ISBN 978-0-470-69761-0. [Google Scholar]
- Bovenkerk, B.; Meijboom, F.L.B. Fish welfare in aquaculture: Explicating the chain of interactions between science and ethics. J. Agric. Environ. Ethics 2013, 26, 41–61. [Google Scholar] [CrossRef]
- Bracke, M.B.M. Animal-based parameters are no panacea for on-farm monitoring of animal welfare. Anim. Welf. 2007, 16, 229–231. [Google Scholar]
- Anonymous. Scientists’ assessment of the impact of housing and management on animal welfare. J. Appl. Anim. Welf. Sci. 2001, 4, 3–52. [Google Scholar] [CrossRef]
- Bracke, M.B.M.; Spruijt, B.M.; Metz, J.H.M. Overall animal welfare assessment reviewed. Part 1: Is it possible? NJAS Wagening J. Life Sci. 1999, 279–291. [Google Scholar]
- Collins, L. Welfare risk assessment: The benefits and common pitfalls. Anim. Welf. 2012, 21, 73–79. [Google Scholar] [CrossRef]
- Müller-Graf, C.; Berthe, F.; Grudnik, T.; Peeler, E.; Afonso, A. Risk assessment in fish welfare, applications and limitations. Fish Physiol. Biochem. 2012, 38, 231–241. [Google Scholar] [CrossRef]
- van de Vis, J.W.; Poelman, M.; Lambooij, E.; Bégout, M.-L.; Pilarczyk, M. Fish welfare assurance system: Initial steps to set up an effective tool to safeguard and monitor farmed fish welfare at a company level. Fish Physiol. Biochem. 2012, 38, 243–257. [Google Scholar] [CrossRef]
- Bracke, M.B.M.; Edwards, S.A.; Metz, J.H.M.; Noordhuizen, J.P.T.M.; Algers, B. Synthesis of semantic modelling and risk analysis methodology applied to animal welfare. Animal 2008, 2, 1061–1072. [Google Scholar] [CrossRef]
- Embley, D.W. Semantic data model. In Encyclopedia of Database Systems; Liu, L., Özsu, M.T., Eds.; Springer: Boston, MA, USA, 2009; pp. 2559–2561. ISBN 978-0-387-39940-9. [Google Scholar]
- Bracke, M.B.M. RICHPIG: A semantic model to assess enrichment materials for pigs. Anim. Welf. 2008, 17, 289–304. [Google Scholar]
- Botreau, R.; Veissier, I.; Perny, P. Overall assessment of animal welfare: Strategy adopted in Welfare Quality®. Anim. Welf. 2009, 18, 363–370. [Google Scholar]
- Shimmura, T.; Bracke, M.B.M.; Mol, R.M.D.; Hirahara, S.; Uetake, K.; Tanaka, T. Overall welfare assessment of laying hens: Comparing science-based, environment-based and animal-based assessments. Anim. Sci. J. 2011, 82, 150–160. [Google Scholar] [CrossRef] [PubMed]
- Stien, L.H.; Bracke, M.B.M.; Folkedal, O.; Nilsson, J.; Oppedal, F.; Torgersen, T.; Kittilsen, S.; Midtlyng, P.J.; Vindas, M.A.; Øverli, Ø.; et al. Salmon Welfare Index Model (SWIM 1.0): A semantic model for overall welfare assessment of caged Atlantic salmon: Review of the selected welfare indicators and model presentation. Rev. Aquac. 2013, 5, 33–57. [Google Scholar] [CrossRef]
- Gruber, T. Ontology. In Encyclopedia of Database Systems; Liu, L., Özsu, M.T., Eds.; Springer: Boston, MA, USA, 2009; pp. 1963–1965. ISBN 978-0-387-39940-9. [Google Scholar]
- Studer, R.; Benjamins, V.R.; Fensel, D. Knowledge engineering: Principles and methods. Data Knowl. Eng. 1998, 25, 161–197. [Google Scholar] [CrossRef]
- He, Q.; Zheng, Y.; Xu, J. Constructing the ontology for modeling the fish production in Pearl River basin. J. Integr. Agric. 2012, 11, 760–768. [Google Scholar] [CrossRef]
- Pettersen, J.M.; Bracke, M.B.M.; Midtlyng, P.J.; Folkedal, O.; Stien, L.H.; Steffenak, H.; Kristiansen, T.S. Salmon welfare index model 2.0: An extended model for overall welfare assessment of caged Atlantic salmon, based on a review of selected welfare indicators and intended for fish health professionals. Rev. Aquac. 2014, 6, 162–179. [Google Scholar] [CrossRef]
- Müller-Belecke, A. Aquakultur: Neues Analyseinstrument für mehr Tierwohl; Bundesamt für Landwirtschaft und Ernährung: Bonn, Germany, 2019.
- Saraiva, J.L.; Arechavala-López, P.; Castanheira, M.F.; Volstorf, J.; Studer, B.H. A global assessment of welfare in farmed fishes: The FishEthoBase. Fishes 2019, 4, 30. [Google Scholar] [CrossRef]
- Studer, B.H.; Castanheira, M.-F.; Arechavala-López, P.; Volstorf, J. Development of Practical Fish Welfare Criteria for Aquaculture; Fair-Fish International Association: Denens, Switzerland, 2020; p. 10. [Google Scholar]
- Kleingeld, D.W.; Moritz, J.; Reiser, S.; Steinhagen, D.; Wedekind, H. Leitfaden “Tierschutzindikatoren”; Arbeitskreis “Tierschutzindikatoren” des Verbandes Deutscher Fischereiverwaltungsbeamter und Fischereiwissenschaftler e.V.: Rostock, Germany, 2016; p. 30. [Google Scholar]
- Noble, E.C.; Gismervik, K.; Iversen, M.H.; Kolarevic, J.; Nilsson, J.; Stien, L.H.; Turnbull, J.F. Welfare Indicators for Farmed Atlantic Salmon—Tools for Assessing Fish Welfare; Nofima: Tromsø, Norway, 2018; p. 310. [Google Scholar]
- Noble, C.; Gismervik, K.; Iversen, M.H.; Kolarevic, J.; Nilsson, J.; Stien, L.H.; Turnbull, J.F. Welfare Indicators for Farmed Rainbow Trout: Tools for Assessing Fish Welfare; Nofima: Tromsø, Norway, 2020; p. 311. [Google Scholar]
- Folkedal, O.; Pettersen, J.; Bracke, M.; Stien, L.; Nilsson, J.; Martins, C.; Breck, O.; Midtlyng, P.; Kristiansen, T. On-farm evaluation of the Salmon Welfare Index Model (SWIM 1.0): Theoretical and practical considerations. Anim. Welf. 2016, 25, 135–149. [Google Scholar] [CrossRef]
- Bracke, M.B.M.; Spruijt, B.M.; Metz, J.H.M. Overall animal welfare reviewed. Part 3: Welfare assessment based on needs and supported by expert opinion. NJAS Wagening. J. Life Sci. 1999, 47, 307–322. [Google Scholar] [CrossRef]
- Dawkins, M.S. From an animal’s point of view: Motivation, fitness, and animal welfare. Behav. Brain Sci. 1990, 13, 1–9. [Google Scholar] [CrossRef]
- Jobling, M.; Koskela, J.; Savolainen, R. Influence of dietary fat level and increased adiposity on growth and fat deposition in rainbow trout, Oncorhynchus mykiss (Walbaum). Aquac. Res. 1998, 29, 601–607. [Google Scholar] [CrossRef]
- Bandarra, N.M.; Nunes, M.L.; Andrade, A.M.; Prates, J.A.M.; Pereira, S.; Monteiro, M.; Rema, P.; Valente, L.M.P. Effect of dietary conjugated linoleic acid on muscle, liver and visceral lipid deposition in rainbow trout juveniles (Oncorhynchus mykiss). Aquaculture 2006, 254, 496–505. [Google Scholar] [CrossRef]
- Güler, M.; Yildiz, M. Effects of dietary fish oil replacement by cottonseed oil on growth performance and fatty acid composition of rainbow trout (Oncorhynchus mykiss). Turk. J. Vet. Anim. Sci. 2011, 35, 157–167. [Google Scholar] [CrossRef]
- Barnes, M.E.; Brown, M.L.; Bruce, T.; Sindelar, S.; Neiger, R. Rainbow trout rearing performance, intestinal morphology, and immune response after long-term feeding of high levels of fermented soybean meal. N. Am. J. Aquac. 2014, 76, 333–345. [Google Scholar] [CrossRef]
- Voorhees, J.M.; Barnes, M.E.; Chipps, S.R.; Brown, M.L. Bioprocessed soybean meal replacement of fish meal in rainbow trout (Oncorhynchus mykiss) diets. Cogent Food Agric. 2019, 5. [Google Scholar] [CrossRef]
- Jawad, L.A.; Al, M.A.; Ahmed, H.K. The relationship between haematocrit and some biological parameters of the Indian shad, Tenualosa ilisha (Family Clupeidae). Anim. Biodivers. Conserv. 2004, 27, 47–52. [Google Scholar]
- Noga, E.J. Fish Disease: Diagnosis and Treatment, 2nd ed.; Wiley-Blackwell: Hoboken, NJ, USA, 2010; ISBN 978-0-8138-0697-6. [Google Scholar]
- Skov, P.V.; Larsen, B.K.; Frisk, M.; Jokumsen, A. Effects of rearing density and water current on the respiratory physiology and haematology in rainbow trout, Oncorhynchus mykiss at high temperature. Aquaculture 2011, 319, 446–452. [Google Scholar] [CrossRef]
- Phuong, L.M.; Damsgaard, C.; Huong, D.T.T.; Ishimatsu, A.; Wang, T.; Bayley, M. Recovery of blood gases and haematological parameters upon anaesthesia with benzocaine, MS-222 or Aqui-S in the air-breathing catfish Pangasianodon hypophthalmus. Ichthyol. Res. 2017, 64, 84–92. [Google Scholar] [CrossRef]
- Sterling, P.; Eyer, J. Allostasis: A new paradigm to explain arousal pathology. In Handbook of Life Stress, Cognition and Health; Fisher, S., Reason, J., Eds.; John Wiley & Sons: Oxford, UK, 1988; pp. 629–649. ISBN 978-0-471-91269-9. [Google Scholar]
- Korte, S.M.; Olivier, B.; Koolhaas, J.M. A new animal welfare concept based on allostasis. Physiol. Behav. 2007, 92, 422–428. [Google Scholar] [CrossRef]
- Segner, H.; Sundh, H.; Buchmann, K.; Douxfils, J.; Sundell, K.S.; Mathieu, C.; Ruane, N.; Jutfelt, F.; Toften, H.; Vaughan, L. Health of farmed fish: Its relation to fish welfare and its utility as welfare indicator. Fish Physiol. Biochem. 2012, 38, 85–105. [Google Scholar] [CrossRef]
- Schreck, C.B.; Tort, L. The concept of stress in fish. In Biology of Stress in Fish; Schreck, C.B., Tort, L., Farrell, A.P., Brauner, C.J., Eds.; Fish Physiology; Elsevier Academic Press: San Diego, CA, USA, 2016; Volume 35, pp. 1–34. [Google Scholar]
- Sopinka, N.M.; Donaldson, M.R.; O’Connor, C.M.; Suski, C.D.; Cooke, S.J. Stress indicators in fish. In Biology of Stress in Fish; Schreck, C.B., Tort, L., Farrell, A.P., Brauner, C.J., Eds.; Fish Physiology; Elsevier Academic Press: San Diego, CA, USA, 2016; Volume 35, pp. 405–462. [Google Scholar]
- Schreck, C.B. Stress and fish reproduction: The roles of allostasis and hormesis. Gen. Comp. Endocrinol. 2010, 165, 549–556. [Google Scholar] [CrossRef] [PubMed]
- Botreau, R.; Bonde, M.; Butterworth, A.; Perny, P.; Bracke, M.B.M.; Capdeville, J.; Veissier, I. Aggregation of measures to produce an overall assessment of animal welfare. Part 1: A review of existing methods. Animal 2007, 1, 1179–1187. [Google Scholar] [CrossRef] [PubMed]
- Miller, G.A. The magical number seven, plus or minus two: Some limits on our capacity for processing information. Psychol. Rev. 1956, 63, 81–97. [Google Scholar] [CrossRef] [PubMed]
- FAO. The State of World Fisheries and Aquaculture 2018—Meeting the Sustainable Development Goals; FAO: Rome, Italy, 2018. [Google Scholar]
- FAO. The State of World Fisheries and Aquaculture 2020—Sustainability in Action; FAO: Rome, Italy, 2020. [Google Scholar]
- Botreau, R.; Bracke, M.B.M.; Perny, R.; Butterworth, A.; Capdeville, J.; Van Reenen, C.G.; Veissier, I. Aggregation of measures to produce an overall assessment of animal welfare. Part 2: Analysis of constraints. Animal 2007, 1, 1188–1197. [Google Scholar] [CrossRef] [PubMed]
- Hahn, U. The Problem of Circularity in Evidence, Argument, and Explanation. Perspect. Psychol. Sci. 2011, 6, 172–182. [Google Scholar] [CrossRef]
- Irobi, I.S.; Andersson, J.; Wall, A. Correctness criteria for models’ validation—A philosophical perspective. In Proceedings of the International Conference on Modeling, Simulation & Visualization Methods, Las Vegas, NV, USA, 21–24 June 2004; CSREA Press: Las Vegas, NV, USA, 2004; pp. 1–8. [Google Scholar]
- Dalsgaard, J.; Lund, I.; Thorarinsdottir, R.; Drengstig, A.; Arvonen, K.; Pedersen, P.B. Farming different species in RAS in nordic countries: Current status and future perspectives. Aquac. Eng. 2013, 53, 2–13. [Google Scholar] [CrossRef]
- Goldammer, T. Fischzuchtlinien für Standortgerechte Aquakultur! Biotechnologische Prüfung auf Robustheit Selektierter Regenbogenforellen (Stamm BORN) auf Eignung als Standortlinie und Tiermodell in Differenten Regionalen Aquakulturanlagen; Leibniz-Institut für Nutztierbiologie (FBN): Dummerstorf, Germany, 2015. [Google Scholar]
- Saraiva, J.L.; Castanheira, M.F.; Arechavala-López, P.; Volstorf, J.; Heinzpeter Studer, B. Domestication and welfare in farmed fish. In Animal Domestication; Teletchea, F., Teletchea, F., Eds.; IntechOpen: London, UK, 2019; ISBN 978-1-83880-174-8. [Google Scholar]
- Conte, F.S. Stress and the welfare of cultured fish. Appl. Anim. Behav. Sci. 2004, 86, 205–223. [Google Scholar] [CrossRef]
- Sneddon, L.U.; Wolfenden, D.C.C.; Thomson, J.S. Stress management and welfare. In Biology of Stress in Fish; Schreck, C.B., Tort, L., Farrell, A.P., Brauner, C.J., Eds.; Fish Physiology; Elsevier Academic Press: San Diego, CA, USA, 2016; Volume 35, pp. 463–539. [Google Scholar]


| Need | A Fish Needs to be… |
|---|---|
| Respiration | able to perform gas exchange over the gills |
| Osmotic regulation | able to maintain homeostasis of cellular fluids |
| Thermal regulation | able to maintain body temperature for successful metabolism |
| Water quality | spared from abiotic adverse influences (toxins, particles, metabolites, ions, gases) |
| Hygiene | spared from biotic adverse influences (parasites, bacteria, viruses) |
| Health | spared from disease, illness, malfunction, or malformation |
| Body care | able to perform body care |
| Nutrition | able to take up food of right quality and quantity |
| Safety | able to avoid perceived danger and physical injury |
| Movement | able to move freely |
| Social contact | able to have contact to conspecifics |
| Rest | able to rest |
| Exploration | able to seek and find external stimuli |
| Reproduction | able to perform reproductive behaviour when sexually mature |
| Farm | 1 | 2 | 3 | 4 | 5 | 6 |
|---|---|---|---|---|---|---|
| Location | indoor | indoor | outdoor | outdoor | indoor | indoor |
| System | RAS | RAS | FTS | FTS | RAS | RAS |
| Species | RT | RT | RT | RT | PP | PP |
| Purpose | grow-out | grow-out | grow-out | restocking | grow-out | grow-out |
| Farm Management | ||||||
| Farm | 1 | 2 | 3 | 4 | 5 | 6 |
| Personnel training | 1 | 0 | 2 | 1 | 0 | 0 |
| Daily Check | 0 | 0 | 0 | 0 | 0 | 0 |
| Treatment journal | 0 | 1 | 1 | 1 | 0 | 1 |
| Target value sheet | 1 | 1 | 2 | 1 | 0 | 1 |
| Emergency concept | 1 | 1 | 2 | 1 | 0 | 1 |
| Hygiene concept | 1 | 1 | 1 | 1 | 0 | 1 |
| Mortality documentation | 1 | 1 | 2 | 2 | 0 | 1 |
| Biomass documentation | 1 | 0 | 2 | 1 | 0 | 1 |
| Predator protection | NA | NA | 2 | 1 | NA | NA |
| Plant cleanliness | 0 | 0 | 1 | 0 | 0 | 0 |
| Stocking density | 0 | 1 | 0 | 0 | 1 | 1 |
| Sorting | 0 | 0 | 0 | 1 | 0 | 0 |
| Slaughter | 0 | 0 | 1 | 0 | 0 | 0 |
| Feeding interval/rate | 0 | 0 | 0 | 0 | 0 | 0 |
| Feed type | 0 | 0 | 0 | 0 | 0 | 0 |
| Disturbances | 1 | 1 | 0 | 1 | 0 | 0 |
| Ambient light | 0 | 0 | NA | NA | 0 | 0 |
| Tank light | 0 | 0 | 1 | 1 | 0 | 0 |
| Module grade | 0.78 | 0.79 | 0.50 | 0.69 | 0.98 | 0.79 |
| Water quality | ||||||
| Farm | 1 | 2 | 3 | 4 | 5 | 6 |
| Carbonate hardness [CaCO3 in mg/L] | 194 | 310 | 347 | 128 | NA | 28.2 |
| Total suspended solids [TSS in mg/L] | 26 | 10 | 20 | 5 | 12 | 15.9 |
| Ammonium [TAN in mg/L] | 0.04 | 0.79 | NA | NA | 0.03 | 0.21 |
| Ammonia [NH3-N in mg/L] | 0.001 | 0.005 | NA | NA | 0 | 0 |
| Nitrite [NO2-N in mg/L] | 0.04 | 0.12 | NA | NA | 0.01 | 0.05 |
| Nitrate [NO3-N in mg/L] | 6.18 | 7.29 | NA | NA | 6.53 | 73.1 |
| pH [−] | 7.84 | 7.5 | 7.61 | 7.75 | 7.5 | 6.4 |
| Conductivity [µS/cm] | 487 | 711 | 640 | 254 | NA | 8030 |
| Temperature [°C] | 16.9 | 11.5 | 14.8 | 7.4 | 23.7 | 22.8 |
| Oxygen [O2 in mg/L] | 9.57 | 11 | 5.9 | 9.2 | 8.5 | 9.1 |
| Oxygen saturation [O2 in %] | 106 | 108 | 62 | 82 | 108 | 113 |
| Carbon dioxide [CO2 in mg/L] | 6.1 | 21.8 | 5.5 | 1.6 | 2 | 7.5 |
| Total gas pressure [%] | 99 | 102 | 100 | 100 | 100 | 100 |
| Water velocity [body lengths/s] | 0.3 | 0.3 | 0.3 | 0.4 | 0.3 | 0.3 |
| Module grade | 0.80 | 0.59 | 0.31 | 0.75 | 0.95 | 0.64 |
| Fish internal appearance | ||||||
| Farm | 1 | 2 | 3 | 4 | 5 | 6 |
| Heart | 0 | 0 | 0 | 0 | 0 | 0 |
| Kidney | 0 | 0 | 0 | 0 | 0 | 0 |
| Spleen | 0 | 0 | 0 | 0 | 0 | 0 |
| Liver | 1 | 0 | 0 | 0 | 0 | 0 |
| Intestines | 1 | 0 | 0 | 0 | 0 | 0 |
| Muscles | 0 | 0 | 0 | 0 | 0 | 0 |
| Reproductive organs | 1 | 0 | 0 | 0 | 0 | 0 |
| Gill lamellae | 1 | 0 | 2 | 0 | 1 | 1 |
| Gill pathogens | 0 | 0 | 1 | 0 | 0 | 0 |
| Body cavity | 0 | 0 | 0 | 0 | 0 | 0 |
| Module grade | 0.78 | 1.00 | 0.61 | 1.00 | 0.86 | 0.86 |
| Fish group behaviour | ||||||
| Farm | 1 | 2 | 3 | 4 | 5 | 6 |
| Aggression | 0 | 0 | 1 | 0 | 0 | 0 |
| Territoriality | 0 | 0 | 0 | 0 | 0 | 0 |
| Apathy | 0 | 0 | 0 | 0 | 0 | 0 |
| Isolation | 1 | 0 | 0 | 0 | 0 | 1 |
| Scratching | 0 | 0 | 1 | 0 | 0 | 0 |
| Surfacing | 0 | 2 | 0 | 0 | 0 | 0 |
| Air gulping | 0 | 0 | 1 | 0 | 0 | 0 |
| Ventilation rate | 0 | 0 | 2 | 0 | 0 | 0 |
| Fleeing | 0 | 0 | 0 | 0 | 0 | 0 |
| Fin position | 0 | 0 | 0 | 0 | 0 | 0 |
| Balance | 0 | 0 | 0 | 0 | 0 | 0 |
| Body colour | 0 | 1 | 0 | 0 | 1 | 0 |
| Feeding | 0 | 1 | 0 | 0 | 0 | 0 |
| Jaw deformations | 0 | 0 | 4 | 0 | 0 | 0 |
| Gill cover deformations | 0 | 0 | 2 | 0 | 0 | 0 |
| Spinal deformations | 0 | 0 | 0 | 0 | 0 | 0 |
| Eye injuries | 1 | 1 | 1 | 0 | 2 | 2 |
| Skin injuries | 2 | 2 | 1 | 0 | 0 | 1 |
| Fin injuries | 2 | 2 | 2 | 1 | 2 | 2 |
| Fungal infections | 0 | 0 | 0 | 0 | 0 | 0 |
| Module grade | 0.84 | 0.79 | 0.69 | 0.98 | 0.87 | 0.86 |
| Fish external appearance | ||||||
| Farm | 1 | 2 | 3 | 4 | 5 | 6 |
| Standard length [cm] | 19.5 | 19.6 | 11.6 | 25 | 25.2 | 28.7 |
| Total length [cm] | 21.7 | 21.7 | 13.5 | 27.6 | 26.1 | 32.4 |
| Body weight [g] | 132 | 111 | 25.3 | 218 | 154 | 198 |
| Body condition factor [−] | 1.8 | 1.5 | 1.6 | 1.4 | 0.96 | 0.84 |
| Mucus pathogens | 0 | 0 | 0 | 0 | 0 | 0 |
| Spinal deformation | 0 | 0 | 0 | 0 | 0 | 0 |
| Jaw deformation | 0 | 1 | 2 | 0 | 0 | 0 |
| Mouth injury | 1 | 1 | 1 | 0 | 1 | 1 |
| Skin alterations | 1 | 0 | 1 | 0 | 0 | 0 |
| Skin fungus | 0 | 0 | 0 | 0 | 0 | 0 |
| Skin injury | 0 | 0 | 0 | 0 | 0 | 0 |
| Cataract | 1 | 0 | 0 | 0 | 1 | 1 |
| Eye injury | 1 | 1 | 1 | 0 | 1 | 1 |
| Exophthalmia | 0 | 0 | 0 | 0 | 0 | 0 |
| Pectoral fins | 0 | 0 | 1 | 1 | 1 | 1 |
| Ventral fins | 1 | 1 | 0 | 1 | 1 | 1 |
| Anal fin | 0 | 0 | 0 | 1 | 1 | 1 |
| Caudal fin | 0 | 0 | 0 | 0 | 1 | 1 |
| Dorsal fin | 0 | 1 | 1 | 0 | 2 | 2 |
| Gill cover | 0 | 0 | 1 | 0 | 1 | 1 |
| Gills | 1 | 0 | 1 | 0 | 0 | 1 |
| Module grade | 0.57 | 0.78 | 0.54 | 0.82 | 0.73 | 0.68 |
Publisher’s Note: MDPI stays neutral with regard to jurisdictional claims in published maps and institutional affiliations. |
© 2021 by the authors. Licensee MDPI, Basel, Switzerland. This article is an open access article distributed under the terms and conditions of the Creative Commons Attribution (CC BY) license (http://creativecommons.org/licenses/by/4.0/).
Share and Cite
Tschirren, L.; Bachmann, D.; Güler, A.C.; Blaser, O.; Rhyner, N.; Seitz, A.; Zbinden, E.; Wahli, T.; Segner, H.; Refardt, D. MyFishCheck: A Model to Assess Fish Welfare in Aquaculture. Animals 2021, 11, 145. https://doi.org/10.3390/ani11010145
Tschirren L, Bachmann D, Güler AC, Blaser O, Rhyner N, Seitz A, Zbinden E, Wahli T, Segner H, Refardt D. MyFishCheck: A Model to Assess Fish Welfare in Aquaculture. Animals. 2021; 11(1):145. https://doi.org/10.3390/ani11010145
Chicago/Turabian StyleTschirren, Linda, David Bachmann, Ali Cem Güler, Oliver Blaser, Nicola Rhyner, Andreas Seitz, Erich Zbinden, Thomas Wahli, Helmut Segner, and Dominik Refardt. 2021. "MyFishCheck: A Model to Assess Fish Welfare in Aquaculture" Animals 11, no. 1: 145. https://doi.org/10.3390/ani11010145
APA StyleTschirren, L., Bachmann, D., Güler, A. C., Blaser, O., Rhyner, N., Seitz, A., Zbinden, E., Wahli, T., Segner, H., & Refardt, D. (2021). MyFishCheck: A Model to Assess Fish Welfare in Aquaculture. Animals, 11(1), 145. https://doi.org/10.3390/ani11010145