Article

Pan-Genome of Novel Pantoea stewartii subsp. indologenes Reveals Genes Involved in Onion Pathogenicity and Evidence of Lateral Gene Transfer

Department of Plant Pathology, Coastal Plain Experiment Station, University of Georgia, Tifton, GA 31793, USA
*
Authors to whom correspondence should be addressed.
Microorganisms 2021, 9(8), 1761; https://doi.org/10.3390/microorganisms9081761
Submission received: 15 July 2021 / Revised: 11 August 2021 / Accepted: 12 August 2021 / Published: 18 August 2021
(This article belongs to the Special Issue Global Regulatory Networks in Plant Pathogenic Bacteria)

Abstract

:
Pantoea stewartii subsp. indologenes (Psi) is a causative agent of leafspot on foxtail millet and pearl millet; however, novel strains were recently identified that are pathogenic on onions. Our recent host range evaluation study identified two pathovars; P. stewartii subsp. indologenes pv. cepacicola pv. nov. and P. stewartii subsp. indologenes pv. setariae pv. nov. that are pathogenic on onions and millets or on millets only, respectively. In the current study, we developed a pan-genome using the whole genome sequencing of newly identified/classified Psi strains from both pathovars [pv. cepacicola (n = 4) and pv. setariae (n = 13)]. The full spectrum of the pan-genome contained 7030 genes. Among these, 3546 (present in genomes of all 17 strains) were the core genes that were a subset of 3682 soft-core genes (present in ≥16 strains). The accessory genome included 1308 shell genes and 2040 cloud genes (present in ≤2 strains). The pan-genome showed a clear linear progression with >6000 genes, suggesting that the pan-genome of Psi is open. Comparative phylogenetic analysis showed differences in phylogenetic clustering of Pantoea spp. using PAVs/wgMLST approach in comparison with core genome SNPs-based phylogeny. Further, we conducted a horizontal gene transfer (HGT) study using Psi strains from both pathovars along with strains from other Pantoea species, namely, P. stewartii subsp. stewartii LMG 2715T, P. ananatis LMG 2665T, P. agglomerans LMG L15, and P. allii LMG 24248T. A total of 317 HGT events among four Pantoea species were identified with most gene transfer events occurring between Psi pv. cepacicola and Psi pv. setariae. Pan-GWAS analysis predicted a total of 154 genes, including seven gene-clusters, which were associated with the pathogenicity phenotype (necrosis on seedling) on onions. One of the gene-clusters contained 11 genes with known functions and was found to be chromosomally located.

1. Introduction

The Pantoea complex is constituted by four species, namely, P. ananatis, P. stewartii, P. allii and P. agglomerans that cause center rot of onions [1,2,3,4]. Three out of the four species in the Pantoea species complex (P. ananatis, P. agglomerans and P. stewartii subsp. indologenes) are responsible for more than 80% of the reported cases of disease in onions [5]. Earlier, Mergaert et al. [6] reclassified Eriwinia stewartii as P. stewartii and proposed two subspecies namely, P. stewartii subsp. stewartii (Pss) and P. stewartii subsp. indologenes (Psi). Recently, we phenotypically and genotypically characterized seventeen Psi strains that are either pathogenic on both onions and millets or on millets only [7]. Based on a host-range evaluation, we proposed two new pathovars of Psi, namely, Psi pv. cepacicola pv. nov. and Psi pv. setariae pv. nov. [7]. The pathovar Psi pv. cepacicola causes symptoms on the Allium species (leek, onion, chive and Japanese bunching onion) and also on foxtail millet, pearl millet, and oat. However, Psi pv. setariae pv. nov. can only infect the members of Poaceae (foxtail millet, pearl millet, and oat) [7].
There has been a huge turnaround in terms of generating genomic resources mainly driven by reduction in costs associated with next generation sequencing (NGS). As a result, several studies have been conducted to comprehensively explore features specific to each genome. The most widely explored genomic variants used in genome-wide studies are single nucleotide polymorphisms (SNPs) that are utilized in both prokaryotes [8] and eukaryotes [9,10,11,12,13,14]. Another widely used technique to explore variations in prokaryotic genomes is the use of presence and absence variants (PAVs). These PAVs capture an often evolving “accessory genome” of an organism. Another part of the genome(s), which is conserved is regarded as a “core genome”. Together, the core and the accessory genomes constitute a pan-genome of a species or sometimes across species for a given genus (also regarded as super pan-genome) [15]. Hence, the core genome refers to key genes that commonly exist in every member of a specific genome set, and the accessory genome represents dispensable genes, which only exist in some of the genomes [16]. In prokaryotes, a pan-genome can be open or closed depending on the similarity of the gene content. Genomes with highly similar gene content make a closed pan-genome and genomes with diverse gene content makes a pangenome open [17]. A pan-genome of a species is dependent on the number of genomes involved in the dataset, the ability to integrate exogenous DNA into its genome via horizontal gene transfer (HGT), and its ecological niche [18]. The gain or loss of genes in bacteria are often mediated by HGT events and are among the key processes in bacterial evolution [19]. HGT can result in the replacement of genetic segments with donor homologues, often within species via. homologous recombination, or via. the acquisition of new genetic material.
In our earlier pan-genome study, we used 81 strains of P. ananatis (including both pathogenic and non-pathogenic strains of onion) and performed pan-GWAS (pan-genome wide association study) to predict genes involved in onion pathogenicity [8]. Our pan-GWAS study was able to predict genes and gene clusters potentially involved in onion pathogenicity and predicted several HGT events that occurred between onion-pathogenic vs. onion-non-pathogenic strains. In addition, phylogeny based on PAVs was also able to differentiate onion-pathogenic vs. non-pathogenic strains. In the current study, we utilized the genome of Psi strains from both pathovars [pv. cepacicola (n = 4) and pv. setariae (n = 13)] and developed a pan-genome with a conserved core and a flexible accessory genome. Further, we performed a pan-GWAS study to identify genes in Psi pv. cepacicola that are associated with onion pathogenicity and also predicted several HGT events that occurred between Psi and other Pantoea spp. (P. stewartii subsp. stewartii LMG 2715T, P. ananatis LMG 2665T, P. agglomerans LMG L15, P. allii LMG 24248T). We further utilized SNPs and PAVs of the core-genome to assess the phylogeny of both Psi pathovars.

2. Methods

2.1. Bacterial Strains, Identification, and Culture Preparation

Seventeen Psi strains from both pathovars [pv. cepacicola (n = 4) and pv. setariae (n = 13)] (Table 1) were used in this study that were phenotypically characterized in our earlier study [7]. Out of the 17 strains, two strains, Psi pv. setariae LMG 2632T (NZ_JPKO00000000.1) and Psi pv. setariae PNA 03-3 (GCA_003201175.1), were previously sequenced. Genome assemblies of the rest of the 15 Psi strains have been submitted to NCBI under the Bioproject ID PRJNA670043 (genome submission: SUB8606059). Whole-genome sequences of four types of strains of Pantoea spp. (P. stewartii subsp. indologenes pv. setariae LMG 2632T (NZ_JPKO00000000.1); P. stewartii subsp. stewartii LMG 2715T (GCA_008801695.1); P. ananatis LMG 2665T (NZ_JMJJ00000000); P. allii LMG 24248T (NZ_NTMH00000000)) and WGS of P. agglomerans L15 (NZ_CP034148) were used. Genomic features of all 21 strains used in this study are listed in Table 1.

2.2. Identification of Presence and Absence Variations (PAVs) and Core Genome Phylogeny

The gbk (genebank format) files of the draft-assembled and annotated genomes of Psi strains [7] using gethomologues [20] were used for pan-genome analyses. These gbk files were used to acquire the syntenic sequence clusters by get_homologues.pl using the OrthoMCL (OMCL) algorithm. The syntenic clusters generated were used to develop a pan-genome matrix showing the presence and absence variants (PAVs) using compare_clusters.pl. The matrix was also used to classify genes into the core, soft-core, shell and cloud genes using the parse_pangenome_matrix.pl (auxiliary script of get_homologues.pl). Core genes are defined as those present in all 17 Psi genomes whereas accessory genes are present in a subset of the 17 genomes. The accessory gene cluster was further divided into cloud and shell gene clusters. Soft-core genes occurred in 95% of the genomes. Cloud genes were present in ≤2 genomes and shell genes were comprised of the remaining genes [20]. Distribution of cluster sizes as a function of the number of genomes these clusters contained was displayed using R with parse_pangenome_matrix.pl. Gower’s distance matrix was generated using the tab delimited pan-genome PAV file as the input and then executing shell script hcluster_pangenome_matrix.sh (auxiliary script of get_homologues) with R function hclust. A core genome phylogeny was produced using Parsnp of Harvest suite [21], which makes an alignment from localized co-linear blocks. The alignment was run using -r!, -c and -x options where, -r! was used to select a random reference genome from the list of genomes used in analysis, -c was used to include all 17 genomes forcibly in the core genome analysis, and -x flag was used to enable filtering of SNPs located in PhiPack [22]-identified regions of recombination. All polymorphic columns in the multiple alignment were flagged to identify: (1) repetitive sequence; (2) small LCB size; (3) poor alignment quality; (4) poor base quality; and (5) possible recombination. After running all filters, columns with filtered SNPs were displayed in the image. The final set of core-genome SNPs was used as an input to FastTree2 [23] for reconstruction of the whole-genome phylogeny. Since Harvest is developed to conduct intraspecific core-genome alignment studies, we used it only on the 17 Psi strains and did not include other four species/subspecies of the Pantoea complex. Gingr [21], a dynamic visual platform of Harvest, was used for visualizing the phylogenetic tree.

2.3. Horizontal Gene Transfer (HGT) and Phylogenetic Analysis of Genomes of Pantoea Complex

A phylogenetic tree was built for all input genomes using the protein sequences of universal single copy genes (SCGs). To carry out HGT analysis, we included genomes of four additional strains representing the four Pantoea species of the Pantoea complex, namely, P. stewartii subsp. stewartii LMG 2715T, P. ananatis LMG 2665T, P. allii LMG 24248T and P. agglomerans L15. Predicted protein sequences of all 21 genomes (17 Psi and four Pantoea spp. stated above; Table 1) were used to search for the HMM (PFAM and TIGRFAM) [24,25] profiles of these SCG proteins using HMMER [26]. Protein sequences for each HMM profile were aligned using HMMER and were concatenated into a single-multiple-sequence alignment using the GTDB tool kit [27]. Further, we utilized multiple-sequence alignment file to build a phylogenetic tree. The tree file was visualized in iTOL [28]. Customized groupings (A, B, C, and D) were made based on the tree. These customized groups of genomes were used as input to study HGT events among the Pantoea spp. mentioned above. MetaCHIP [29] was used to identify horizontal gene transfer (HGT) among the customized assigned groups. MetaCHIP identified putative donor and recipient transfer events within the 21 Pantoea strains (17 Psi and four Pantoea spp. stated above; Table 1) based on combined similarity and phylogenetic incongruency.
SNPs from the core genome and PAVs of Psi strains (n = 17) and other Pantoea spp. including P. stewartii subsp. stewartii LMG 2715T, P. ananatis LMG 2665T, P. allii LMG 24248T and P. agglomerans L15 were identified, and a phylogenetic tree was constructed. Pan-seq pipeline [30] was used to identify the core SNPs, and PAVs from the accessory genomes. The output phylip files were used to construct phylogenetic trees based on SNPs and PAVs. The PHYLIP files were imported into RaxML software [31] and PHYLIP trees were constructed by using the “neighbor-joining” method with a bootstrap setting of 1000. Further, a whole genome multi locus sequence typing (wgMLST) tree was also constructed. To carry out this analysis, assembled contigs files of each of the 21 Pantoea spp. strains were uploaded to PGAdb builder and a pan-genome allele database was constructed with 1000 iterations [32].

2.4. Pan-Genome-Wide Association Analysis and Annotations

We utilized phenotypic data from Koirala et al. (2021) [7] where both Psi pv. cepacicola and Psi pv. setariae strains were phenotyped based on their ability to cause symptoms on onion seedlings. Only four of the Psi pv. cepacicola strains (PNA 03-3, PNA 14-9, PNA 14-11 and PNA 14-12) strains were able to cause foliar symptoms. Scoary [33] was used to calculate associations among genes in the pan-genome and the pathogenic phenotype on onion seedlings (a qualitative assessment; pathogenic vs. non-pathogenic association). The output of this program comprised of a list of genes sorted by strength of association with these traits. Genes with a naïve p-value ≤0.005 and corrected p-value (Benjamini-Hochberg) of association < 0.25 were considered significant. The core, soft-core, shell, and cloud genes were retrieved from the P. stewartii pan-genome and subjected to blastX against the NR database. The blast output files generated in.xml format were used as input to blast2GO. First, GO mapping was performed to retrieve the GO terms associated with blast to form a pool of GO terms. Then GO annotation was carried out where the GO terms from the pool of GO terms were assigned to query sequences. All sequences with GO annotations were also annotated for enzyme code. GO term associations were classified and plotted as biological process (BP), molecular function (MF), and cellular component (CC). The FatiGO [34] package integrated into Blast2GO was used for statistical assessment of annotation differences as following: core vs accessory, soft-core vs core, shell vs core, and cloud vs core genes. This package uses the Fisher’s Exact Test and corrects for multiple testing. Adjusted p-values of each GO term were reported based on the corrected p-value by False Discovery Rate (FDR) control. Genes involved in horizontal gene transfer (HGT) were annotated using Blast2GO pipeline [35].

3. Results

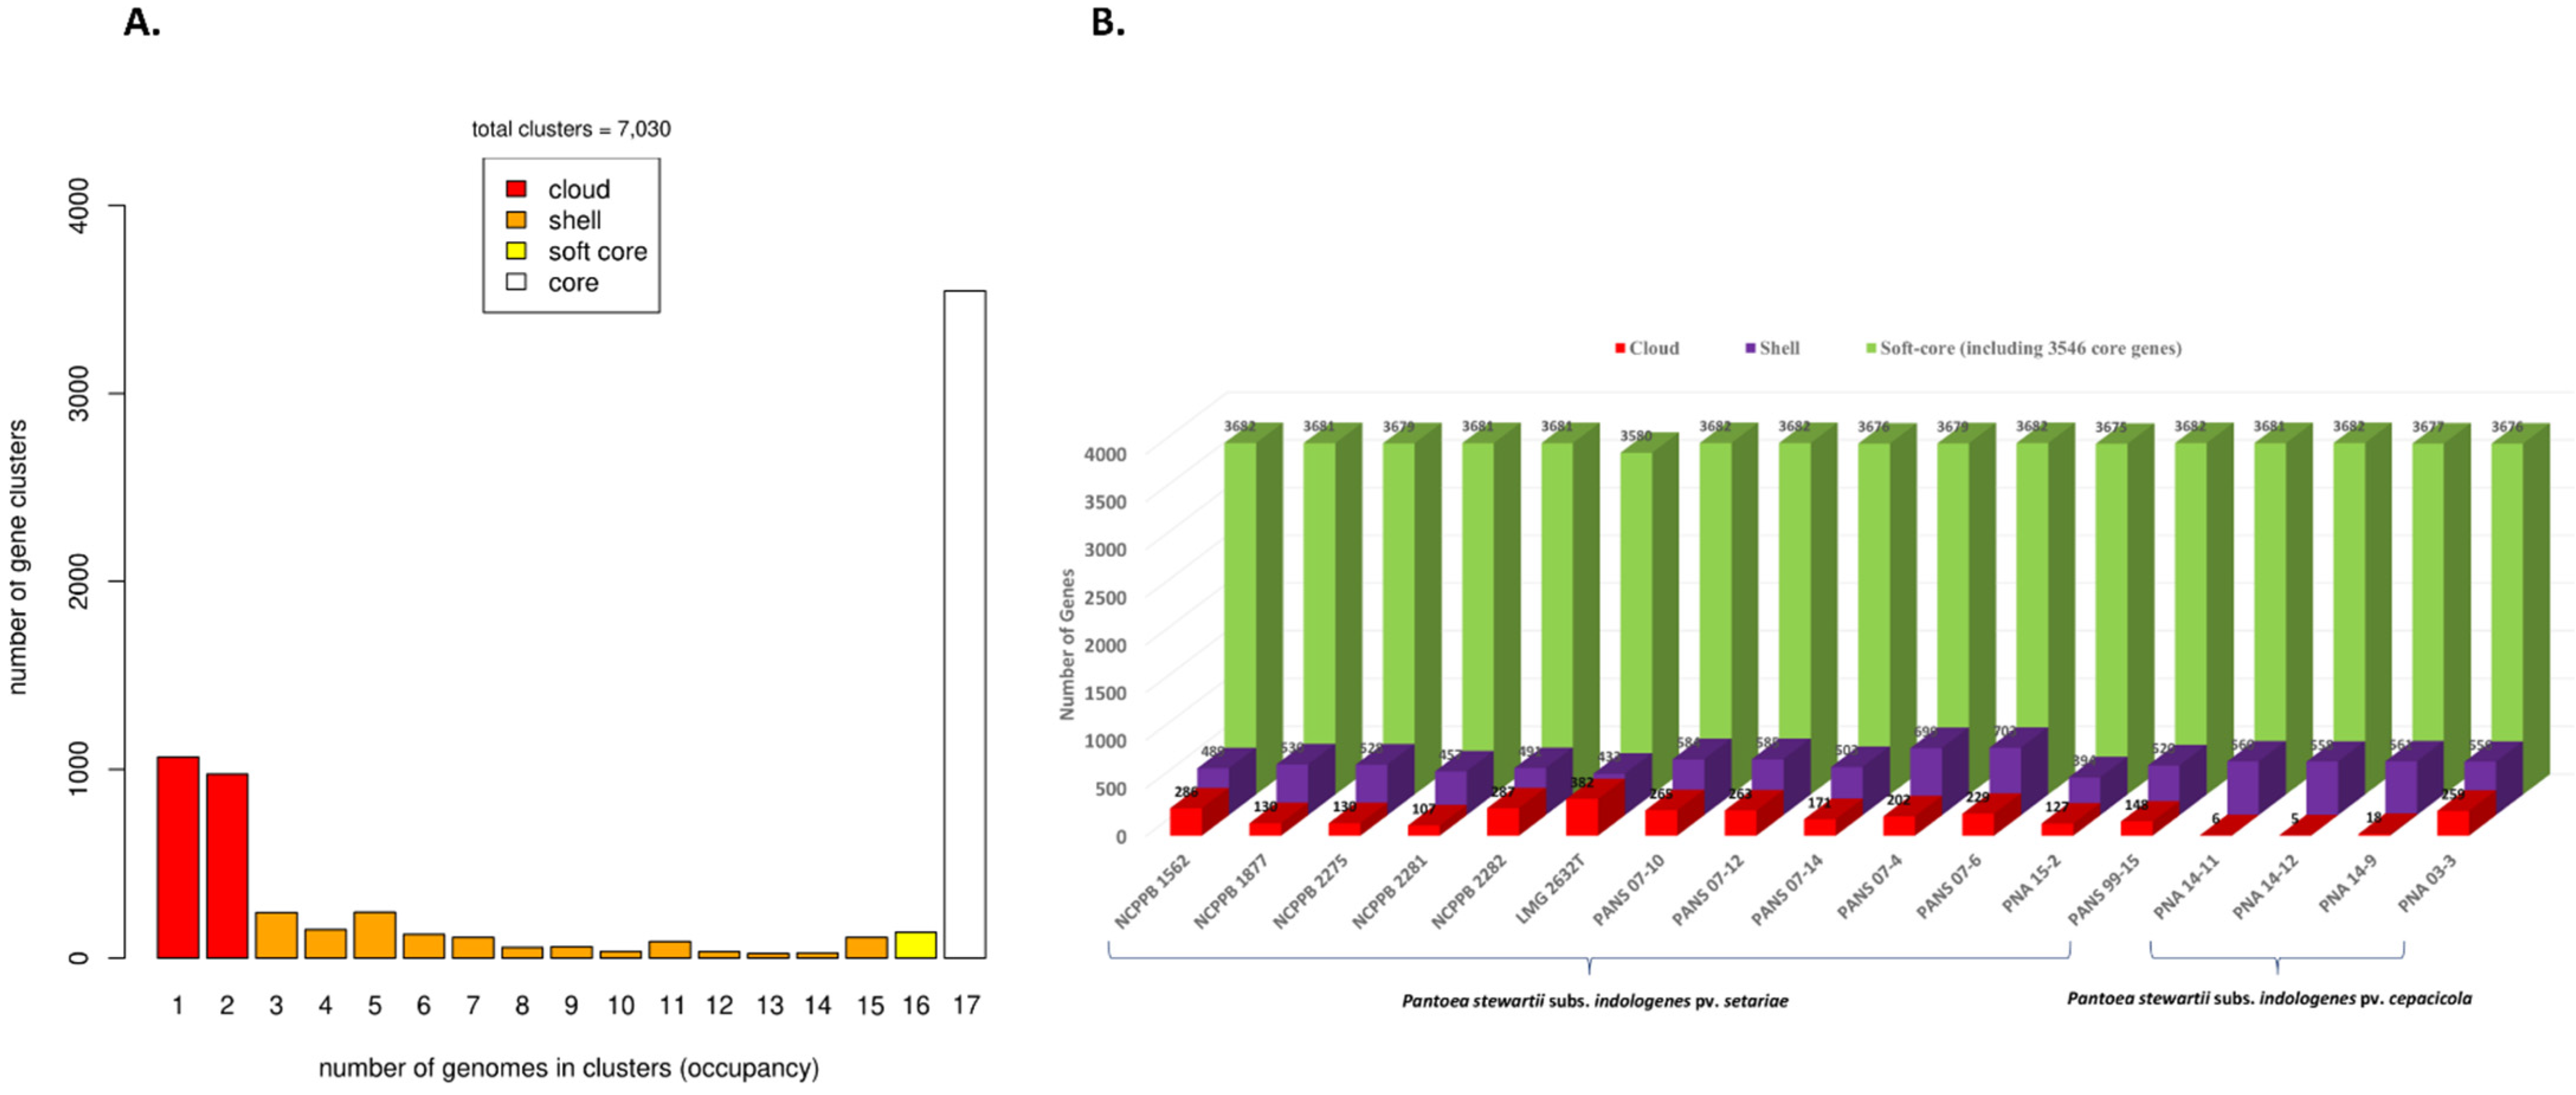
3.1. The P. stewartii subsp. indologenes Pan-Genome Architecture and Phylogeny

Genome assembly is a pre-requisite to study the pan-genome of a given species. Assembly sizes of the seventeen strains of Psi ranged from 4.6 (PNA 15-2) to 5.1 Mbp (PANS 07-6) with the number of contigs ranging from 22 (PNA 03-3) to 125 (PANS 07-4) and the number of genes ranging from 4341 (PNA 15-2) to 4816 (PANS 07-6) (Table 1). The full spectrum of the pan-genome of Psi contained 7030 genes. Among these, 3546 genes (present in all 17 strains) were part of the core genes and were a part of a subset of 3682 soft-core genes (present in ≥16 strains). The accessory genome included 1308 shell genes and 2040 cloud genes (present in ≤2 strains) (Figure 1A). The genome of each strain contributed a conserved set of 3546 core genes and a variable number of accessory genes. Overall, soft-core genes contributed by each genome ranged from 3580 to 3682 genes, including a conserved set of 3546 genes. Shell genes ranged from 394 to 703 genes and the cloud genes ranged from a minimum of five genes contributed by Psi pv. cepacicola PNA 14-12 to a maximum of 382 genes contributed by Psi pv. setariae LMG 2632T (Figure 1B). Details of the number of core and accessory genes contributed by each strain are listed in (Table S1).
The pan-genome architecture of the 17 Psi genomes, which included both pathovars, revealed an open pan-genome (Figure 2). Exponential decay models [16,36] that fitted the core gene clusters predicted a theoretical core genome of 3598 and 3524 genes (Figure 2A). Further, to confirm the openness/closeness of the pan-genome, the theoretical estimation of the pan-genome size was carried out using Tettelin’s exponential model fitted to the OMCL accessory gene clusters. The pan-genome showed a clear linear progression with >6000 genes, with ~43 new genes added on an average to the pan-genome as each new Psi genome was added (Figure 2B). This indicated an open Psi pan-genome.
Dendrograms were plotted based on the core and accessory genes identified in the Psi pan-genome. The four components of the developed pan-genome of Psi, namely, core, soft core, shell, and cloud genes, were used to assess the phylogeny of 17 Psi strains. All four components of the pan-genome used individually clustered the Psi pv. cepacicola strains separately from the Psi pv. setariae strains. However, only one Psi pv. cepacicola (PNA 03-3) was distantly clustered with Psi pv. setariae strains when soft-core, shell, and cloud genes were used. The Psi pv. cepacicola strain PNA 03-3 clustered close to other three Psi pv. cepacicola strains (PNA 14-12, PNA 14-11, PNA 14-9) only when core genes were used (Figure 3A–D).

3.2. Core Genome Genes Differentiated the Onion-Pathogenic P. stewartii subsp. indologenes pv. cepacicola Strains from the Onion-Non-Pathogenic P. stewartii subsp. indologenes pv. setariae Strains

Among the seventeen newly discovered Psi strains, four Psi pv. cepacicola strains were pathogenic on Allium spp. (onion, leek, chive, and bunching onion) and Poacea (oat, rye, foxtail millet) species [7]. The remaining strains belonged to Psi pv. setariae, and were pathogenic only on Poacea species (oat, rye, foxtail millet). Clustering based on the ANI matrix of pan-genome resulted in phylogenic trees based on core, soft-core, shell, and cloud genes (Figure 3). Core genes ANI matrix resulted in eleven clusters with three of the four Psi pv. cepacicola strains clustered together and the fourth strain (PNA 03-3) placed separately (Figure 3A). Soft-core ANI resulted in ten clusters (Figure 3B). Shell and cloud genes (accessory genome) ANI resulted in two and eleven clusters, respectively. Two shell gene clusters contained 16 out of the 17 Psi strains in one cluster and one strain (LMG 2632T) in a separate clade (Figure 3C). Three out of the four Psi pv. cepacicola strains (PNA 14-9, PNA 14-11, and PNA 14-12) consistently clustered together with core or accessory genes-based ANI.

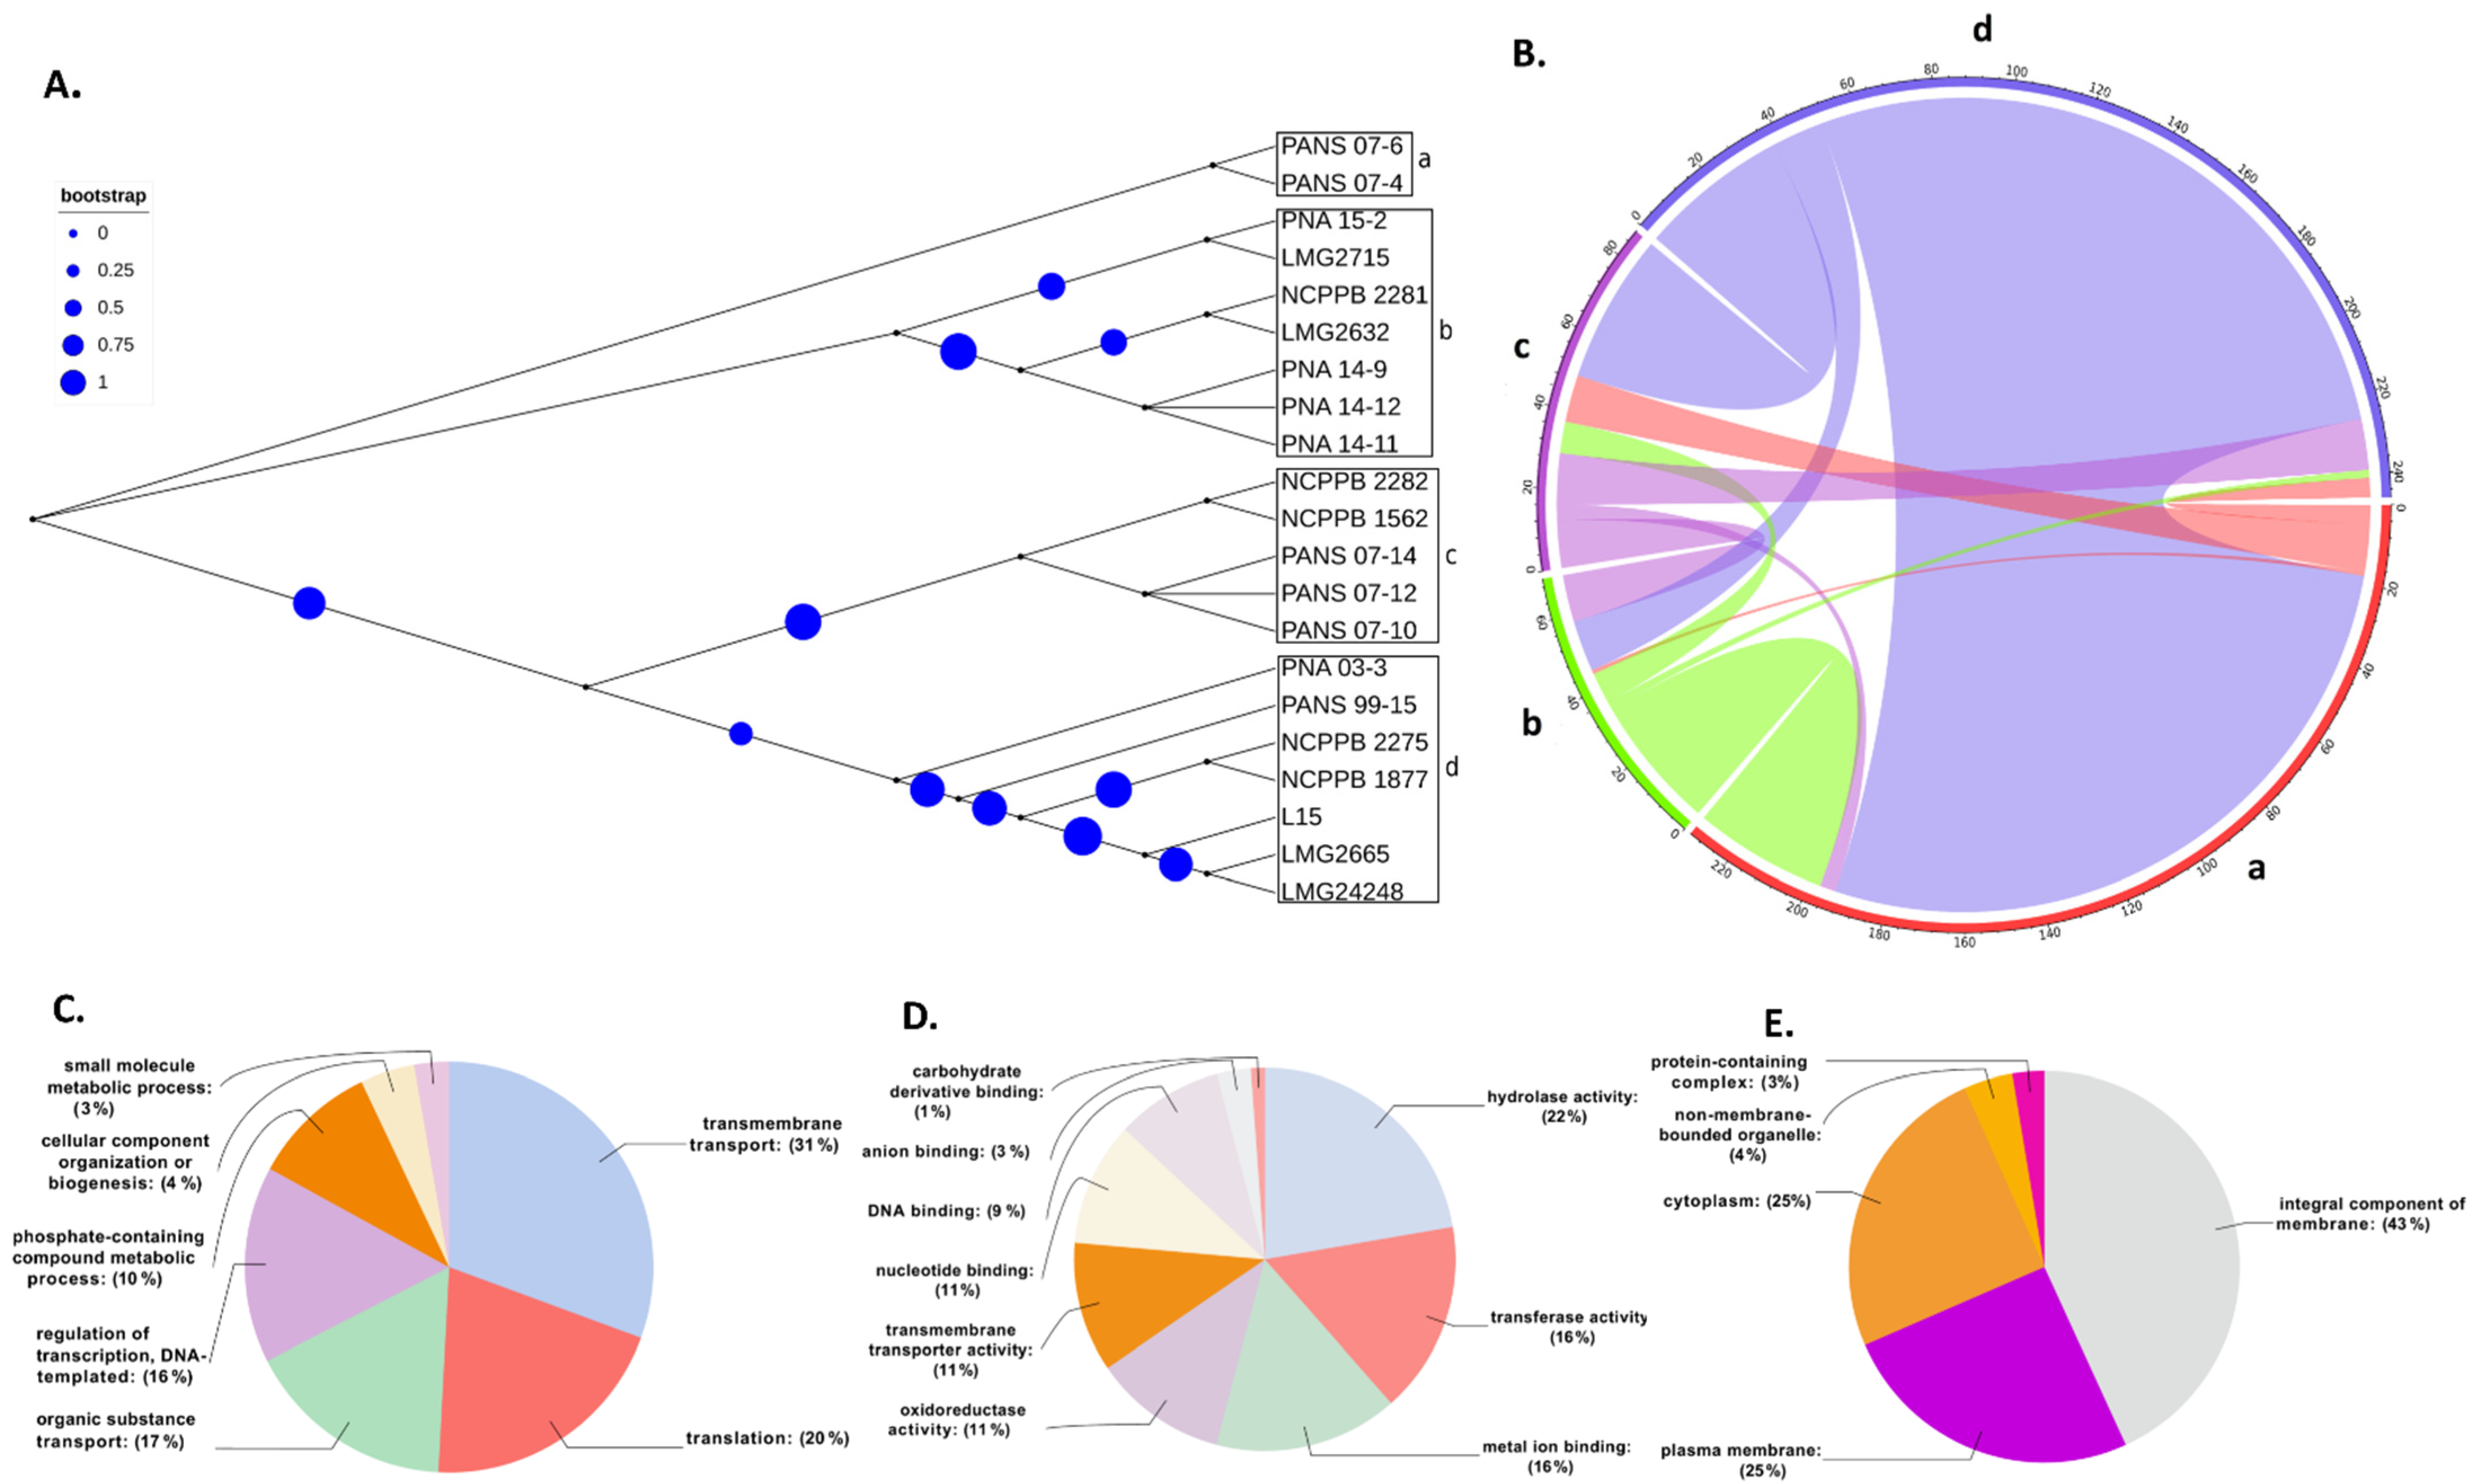
3.3. Horizontal Gene Transfer (HGT) and Annotation of Genes Involved in HGT

Five Pantoea species including 17 Psi strains (4 Psi pv. cepacicola and 13 Psi pv. setariae strains) and one strain each of P. ananatis (LMG 2665T), P. allii (LMG 24248T), P. agglomerans (L15), and P. stewartii subsp. stewartii (LMG 2715T) were used for HGT analysis. Phylogenetic classification based on the conserved SCG resulted in four groups (a–d) (Figure 4A). Strains classified within these four groups were used to study the HGT as explained in the Section 2. A total of 317 HGT events including 314 donor and 299 recipient genes among the five Pantoea species/pathovars were identified (Figure 4B, Table S2). Most of the gene transfers (n = 95) occurred from PNA 03-3 (Psi pv. cepacicola) to PANS 07-4 (Psi pv. setariae), followed by 76 HGTs from NCPPB 2275 (Psi pv. setariae) to PANS 07-4 (Psi pv. setariae), 32 from NCPPB2281 (Psi pv. setariae) to PANS 07-4 (Psi pv. setariae), and 27 from NCPPB 2275 to PNA 07-10 (Psi pv. setariae). The strain NCPPB 2275 (Psi pv. setariae) transferred (donated) a maximum number of 112 genes, followed by PNA 03-3 (Psi pv. cepacicola; n = 100) and NCPPB 2281 (Psi pv. setariae; n = 35), and others donated less than 20 genes. Similarly, among the recipient strains, PANS 07-4 (Psi pv. setariae) received a maximum of 211 genes followed by PANS 07-10 (Psi pv. setariae; n = 40) and the remaining strains received less than 20 genes (Figure 4B, Table S2). There were two compulsive donor strains (Psi pv. setariae NCPPB 2275 and Psi pv. setariae NCPPB 2281) that did not feature as recipients. Similarly, two recipient strains (Psi pv. setariae LMG 2632T and Psi pv. setariae NCPPB 1562) did not feature as donors (Figure 4B, Table S2).

3.4. Annotations of Genes Involved in Horizontal Gene Transfer (HGT)

Further, the donor and recipient proteins coded by genes involved in HGT were annotated. A non-redundant set of 607 genes coding for proteins involved in HGT showed blast hits. A total of 499 out of 607 genes that showed blast hits were mapped and annotated (Table S3). Each of the 499 genes involved in HGT were assigned GO IDs from a minimum of one to a maximum of eight. Eight genes were assigned to a maximum of eight GO IDs followed by 23 genes assigned to seven, 26 genes to six, 57 genes to five, 86 genes to four, 107 to three, 80 genes to two, and the remaining 112 genes to one GO ID (Table S4). Among all the HGTs, ABC transporter permease featured in a maximum of eight HGT events followed by GNAT family N-acetyltransferase in seven, cytochrome ubiquinol oxidase subunit I in six, and outer membrane lipoprotein chaperone in five HGT events (Table S3). Based on the assigned GO IDs, HGT genes were classified into biological process (BP), molecular function (MF), and cellular component (CC). Under BP, the maximum number of genes involved in HGT were involved in transmembrane transport (31%), followed by genes involved in translation (20%), and only 3% were involved in small molecule metabolic processes (Figure 4C). Under MF, 22% were categorized with hydrolase activity, followed by 16% that were categorized as transferase activity and metal binding. The smallest number of HGTs were categorized as carbohydrate-derivative binding (Figure 4D). In CC, most of the genes were categorized under integral component of membrane (43%) followed by 25% each under plasma membrane and cytoplasm and the minimum number as a protein-containing complex (3%) (Figure 4E). Further, we investigated various pathways that these donor and recipient genes were involved. A total of 66 biochemical pathways were identified using the KEGG database where HGT genes were involved. Purine fatty acid biosynthesis, pyrimidine, nicotinate, and nicotinamide metabolic pathways featured most of the HGT genes. Purine metabolism showed 11 genes, fatty acid biosynthesis showed six, and pyrimidine and nicotinamide metabolism showed five genes each. Remaining metabolic pathways involved three, two, or one gene(s) (Figure 5, Table S5).

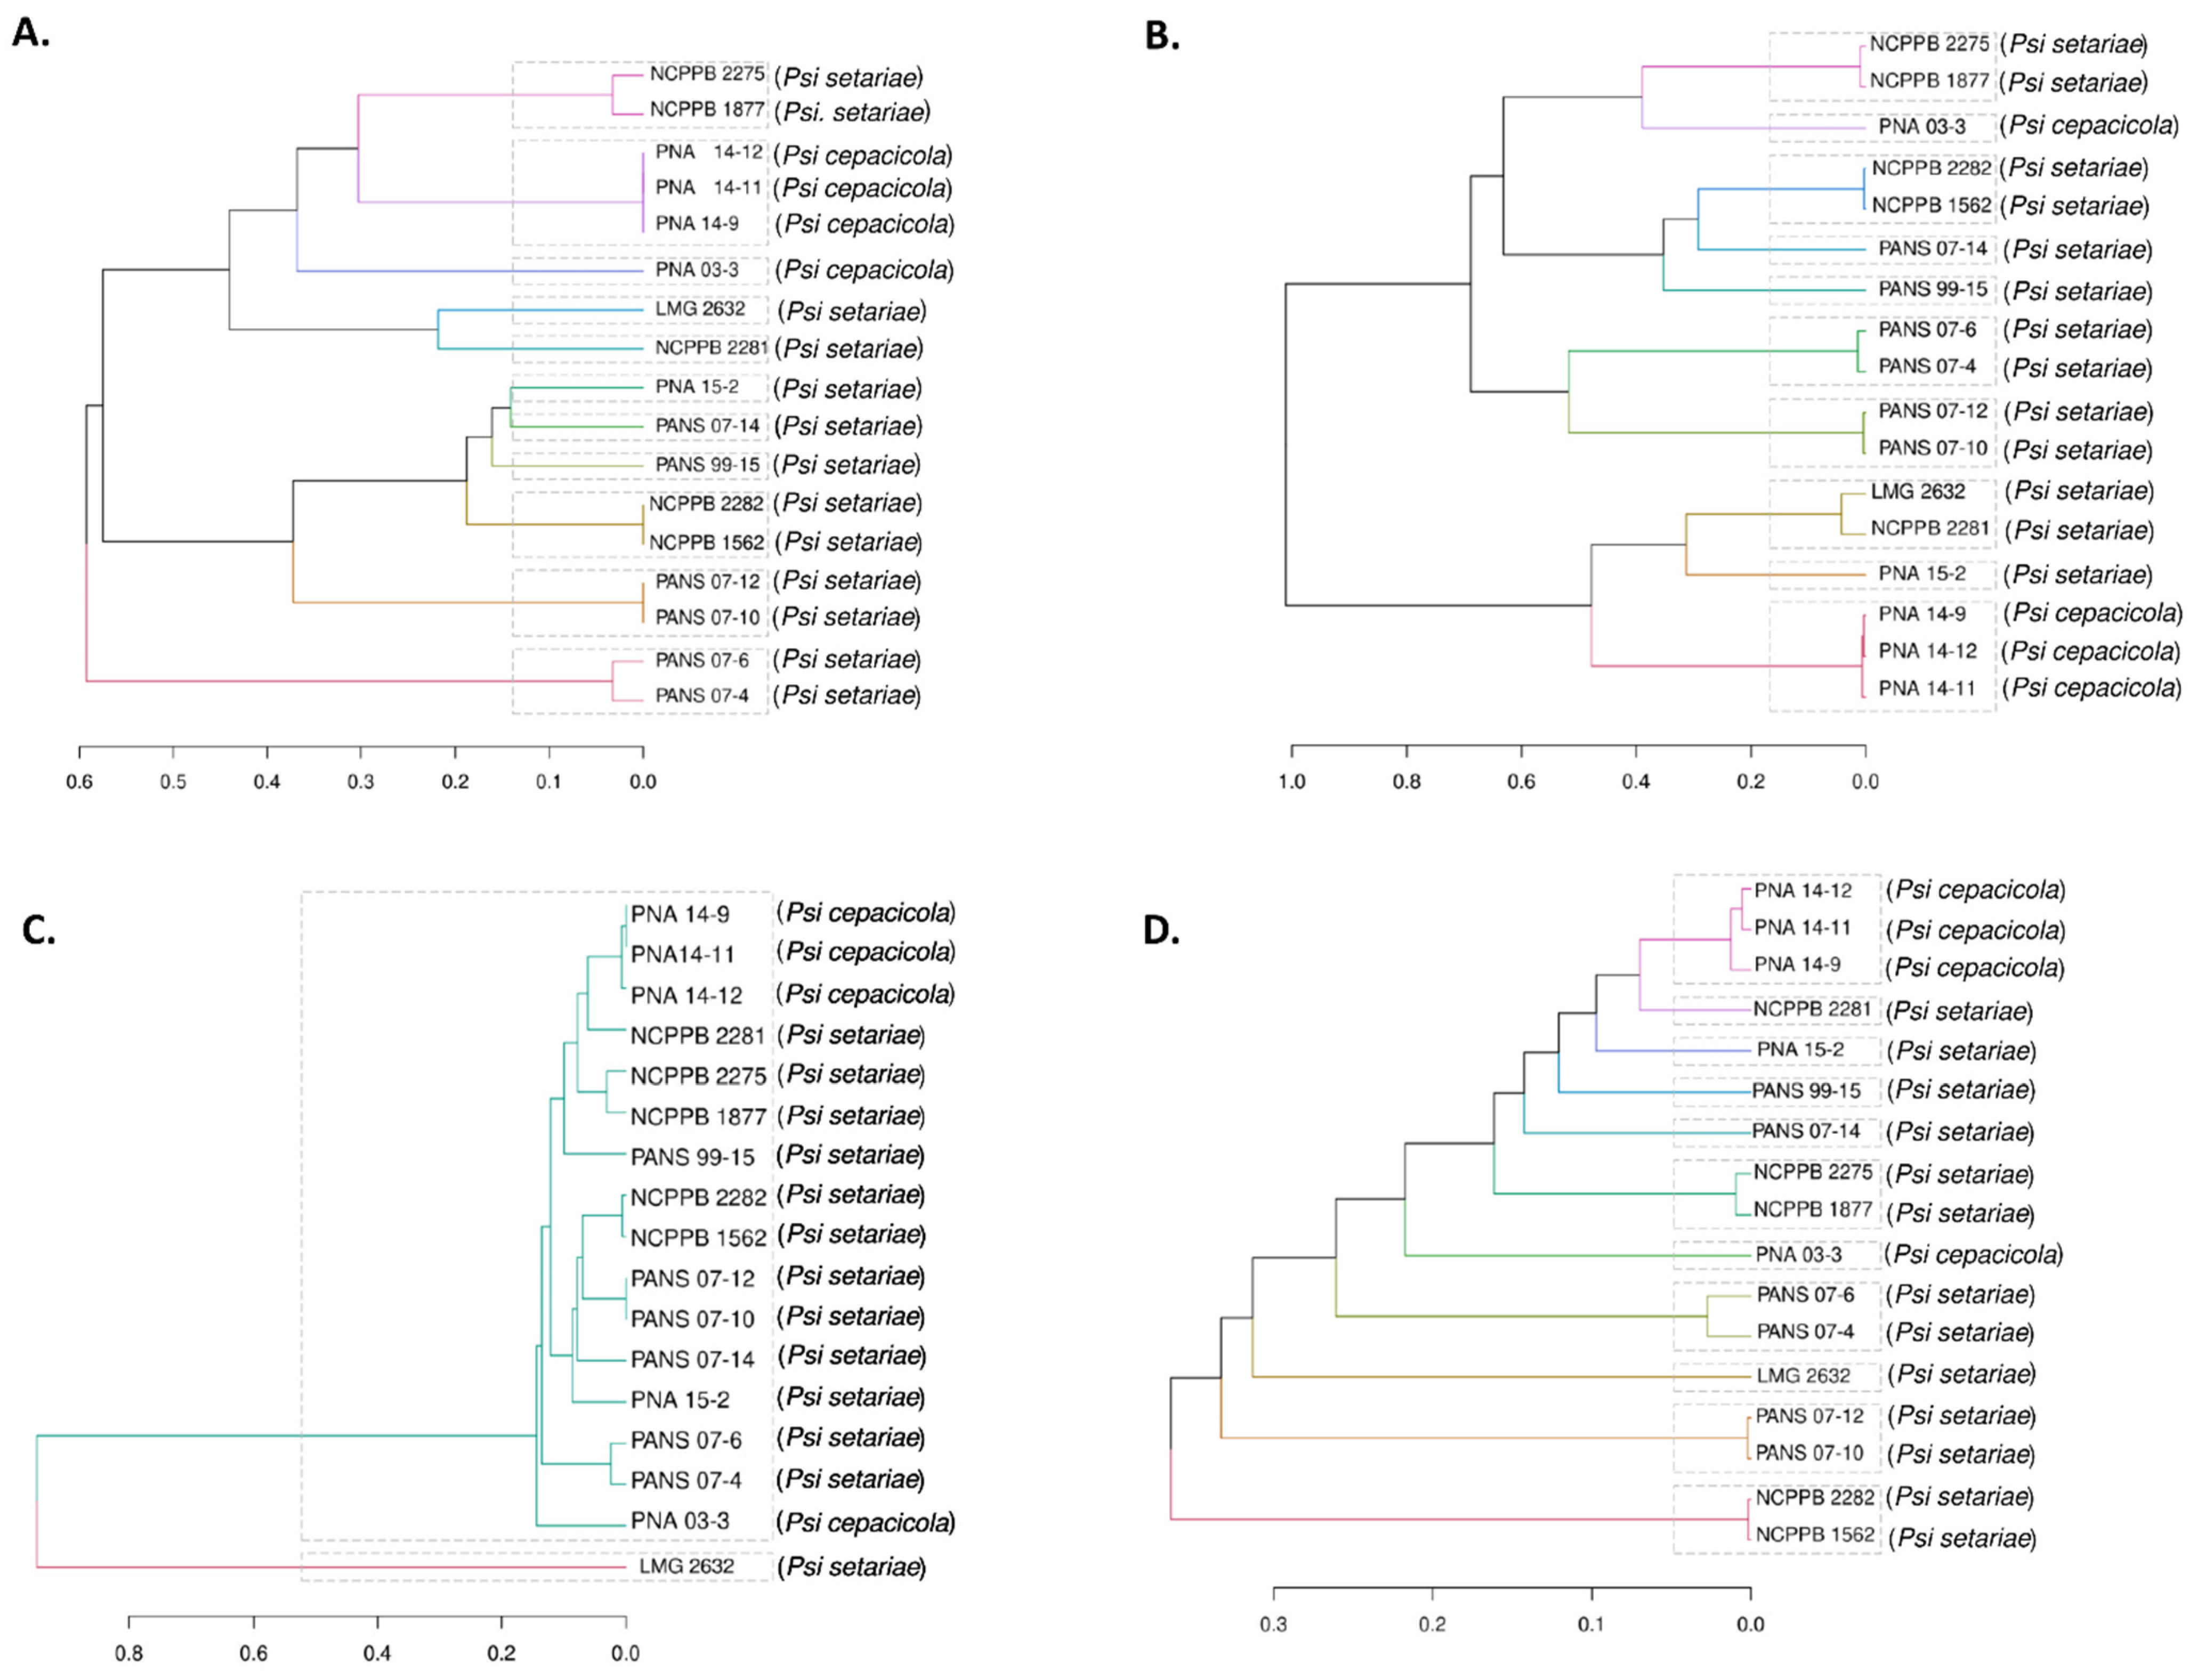
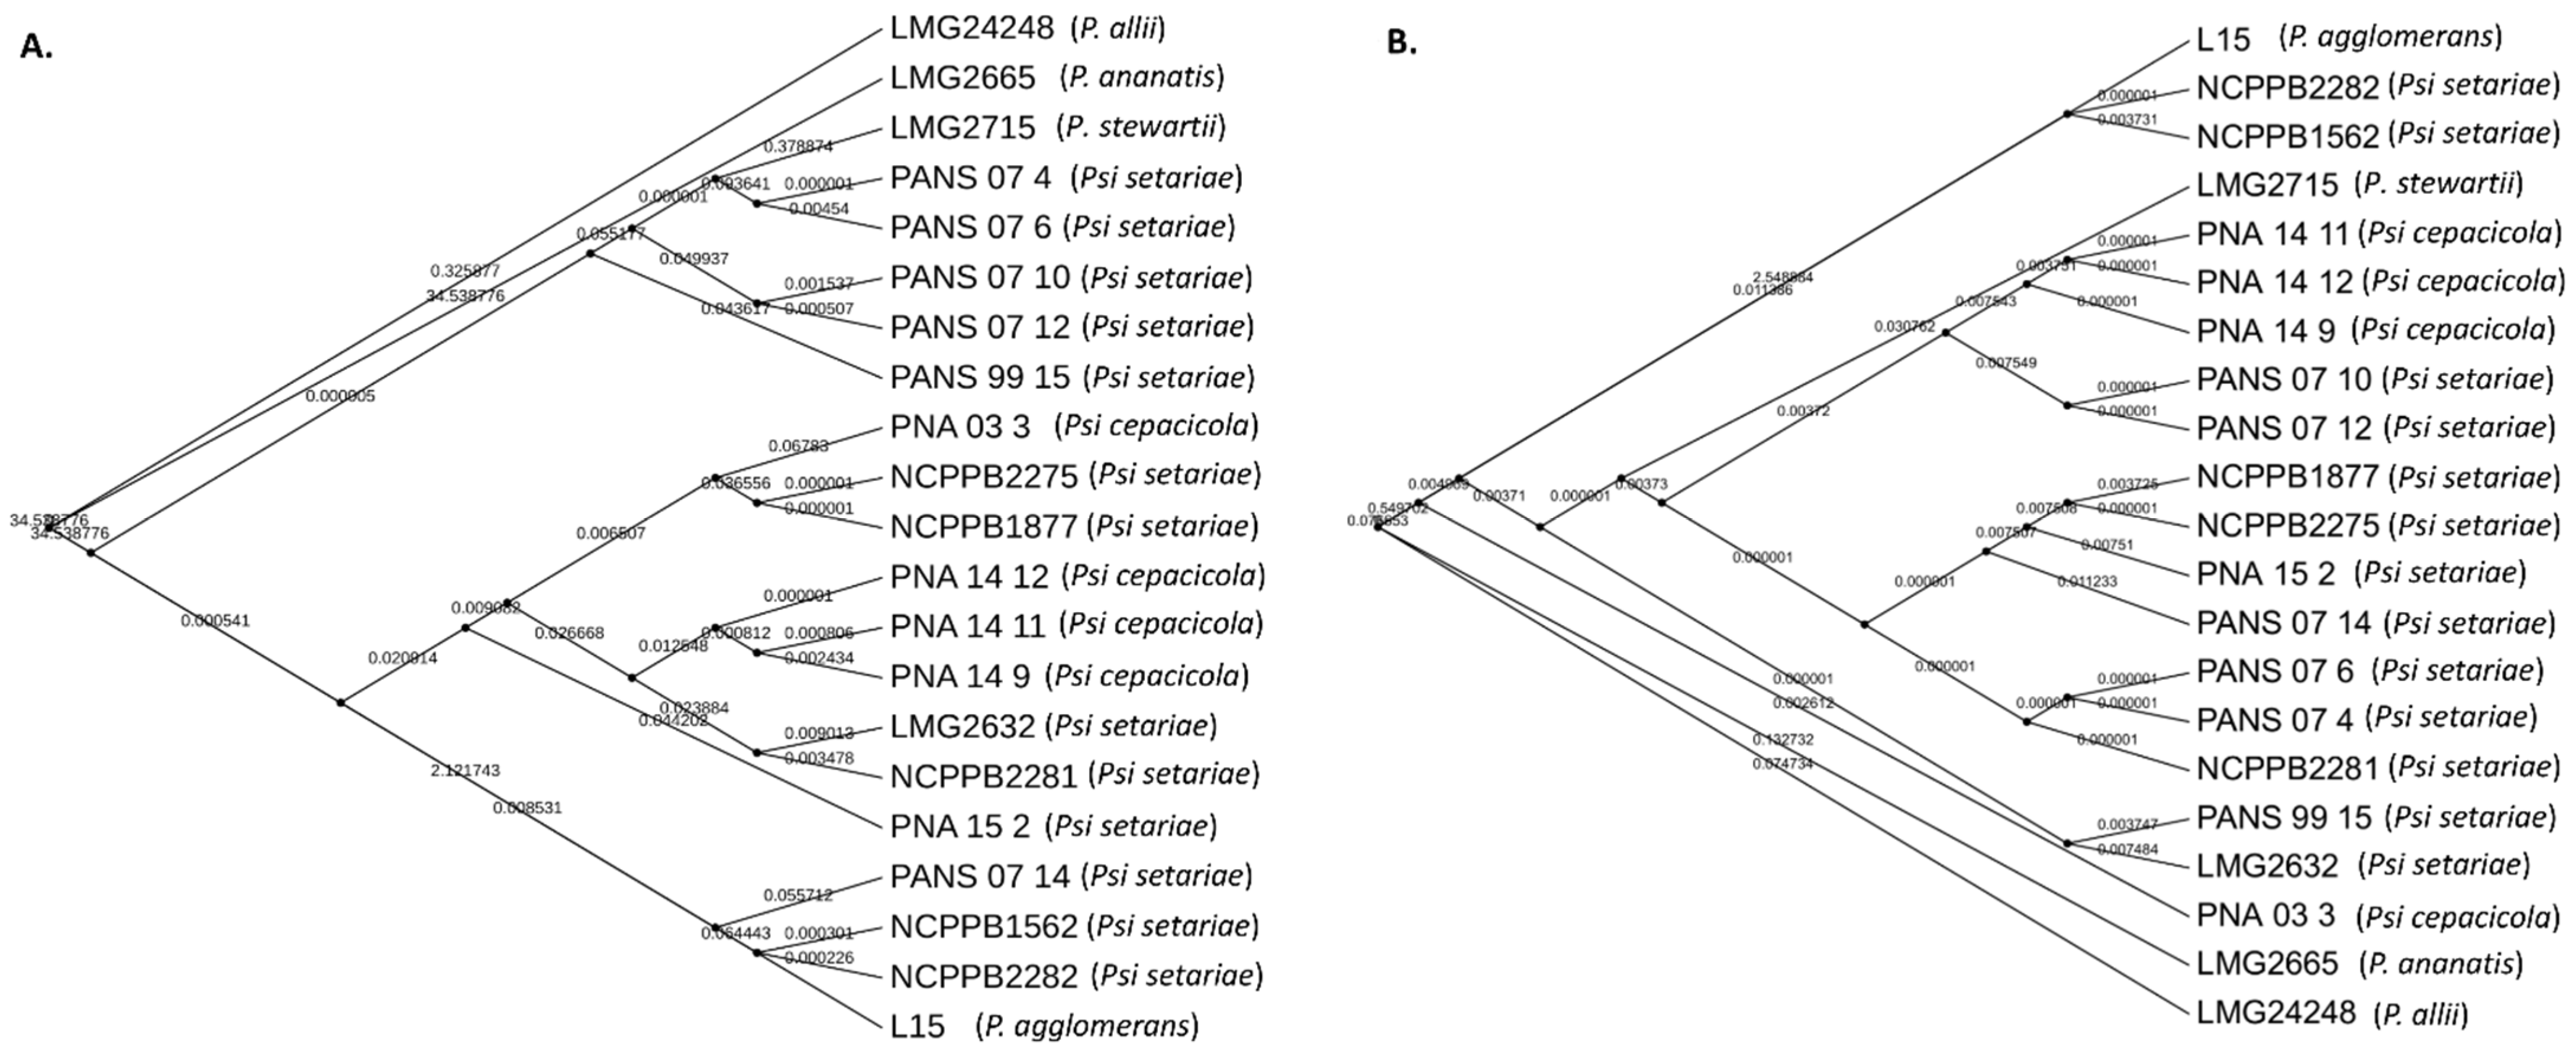
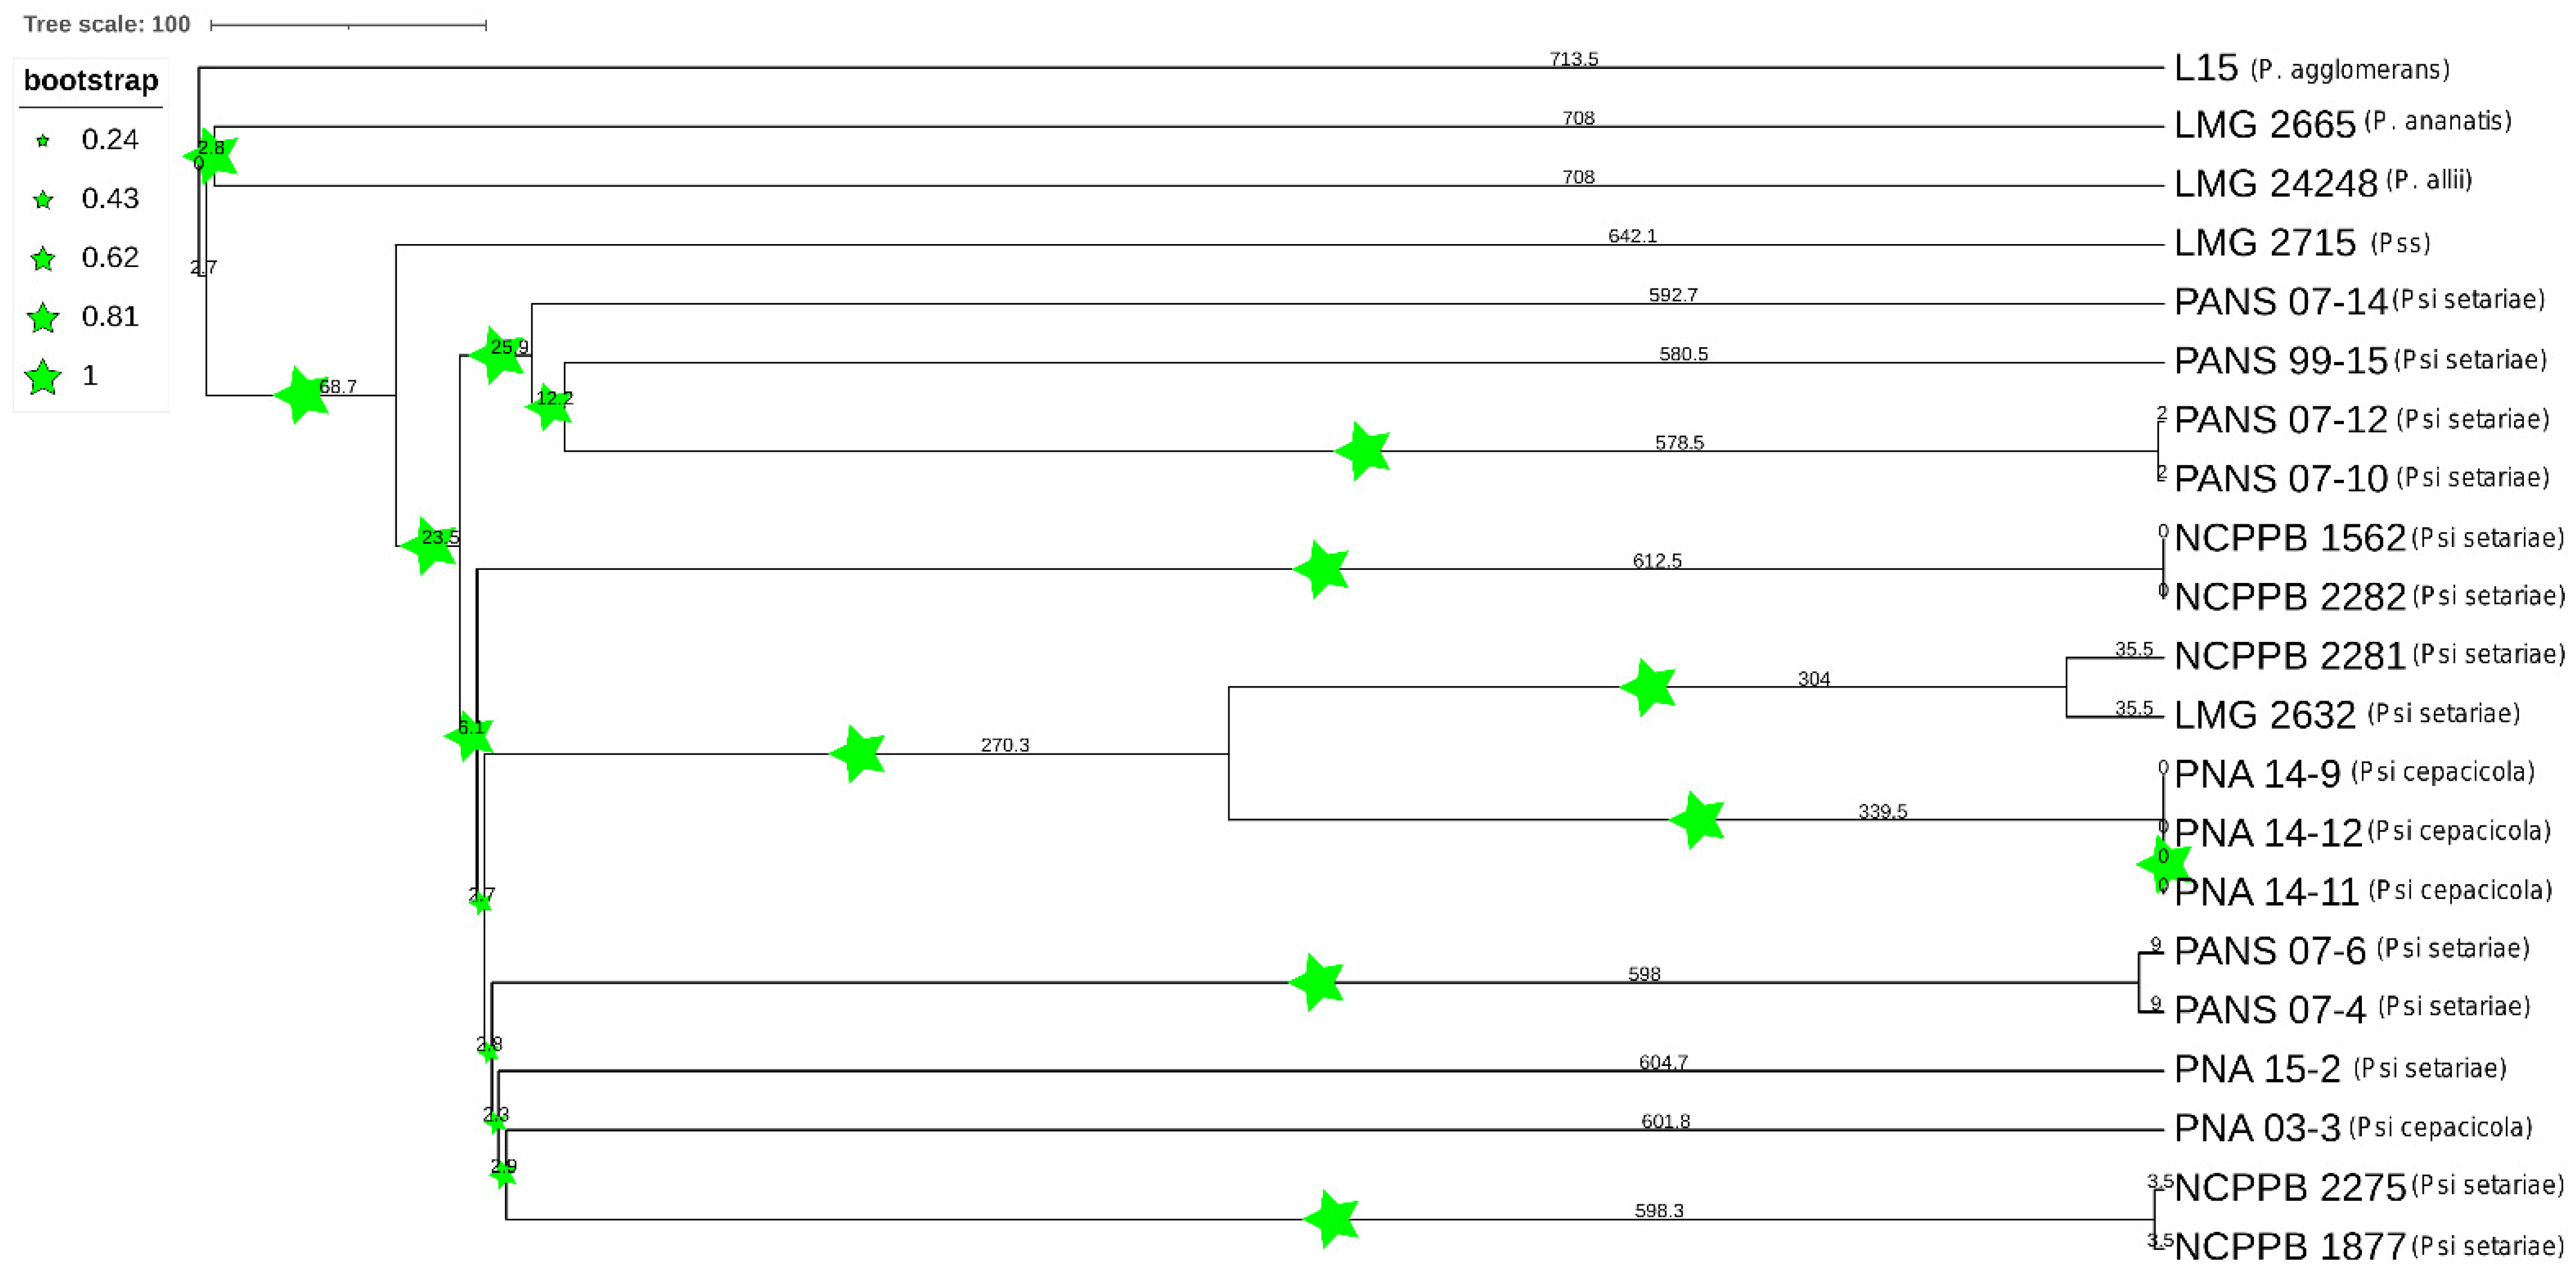
3.5. Comparative PAVs, Core SNPs and Whole Genome Multi Locus Sequence Typing (wgMLST) Based Phylogeny

A comparative phylogenetic analysis was conducted using PAVs and core genome SNPs. Phylogenomic analysis using PAVs and SNPs showed both P. ananatis (LMG 2665T) and P. allii (LMG 24248T) were outliers. However, P. agglomerans (L15) grouped together with the same Psi pv. setariae strains using both PAVs and SNPs (Figure 6). The strain P. stewartii subsp. stewartii (LMG 2715T) clustered together with PANS 07-4 (Psi pv. setariae) and PANS 07-6 (Psi pv. setariae) when plotted using PAVs. However, core SNPs were used and clustered with Psi pv. cepacicola, although they did not share the same node. Three of the four Psi pv. cepacicola strains (PNA 14-12, PNA 14-11, and PNA 14-9) clustered together when both with PAVs and core SNPs were used. The fourth Psi pv. cepacicola strain (PNA 03-3) clustered with Psi pv. setariae strains when PAVs were used. However, when core SNPs were used, PNA 03-3 formed a separate clade between LMG 2632T (Psi pv. setariae) and LMG 2665T (P. ananatis). Overall, with both PAVs and SNPs the Psi pv. cepacicola and Psi pv. setariae strains clustered in two separate groups, except for PNA 03-3 (Figure 6). PAVs along with SNPs were identified using pan-seq to conduct comparative phylogenetic analysis. As seen with SNPs and PAVs, wgMLST clustered Psi pv. cepacicola strains together except for the strain PNA 03-3, which clustered with Psi pv. setariae strains (Figure 7). Strains of four other species of Pantoea used in this study (P. agglomerans, P. ananatis, P. allii, P. stewartii subsp. stewartii) branched separately from Psi strains used. Like the PAV-based phylogenetic tree, the wgMLST tree showed P. stewartii subsp. stewartii (LMG 2715T) to be the closest to Psi pv. setariae out of the four Pantoea spp. compared (Figure 6 and Figure 7). However, wgMLST-based phylogeny branched out four Pantoea species from Psi strains, which was not observed in PAV or SNP-based phylogeny. Further, to rule out the possibility that recombination events within the 17 Psi strains could interfere with core-genome-SNP-based phylogeny, we conducted a phylogenetic study of Psi strains where recombination sites were excluded (Figure S1). The results showed that the Psi pv. cepacicola strain (PNA 03-3) clustered away from the remaining three Psi pv. cepacicola strains, as was observed with PAVs-, SNPs- and wgMLST-based phylogeny.

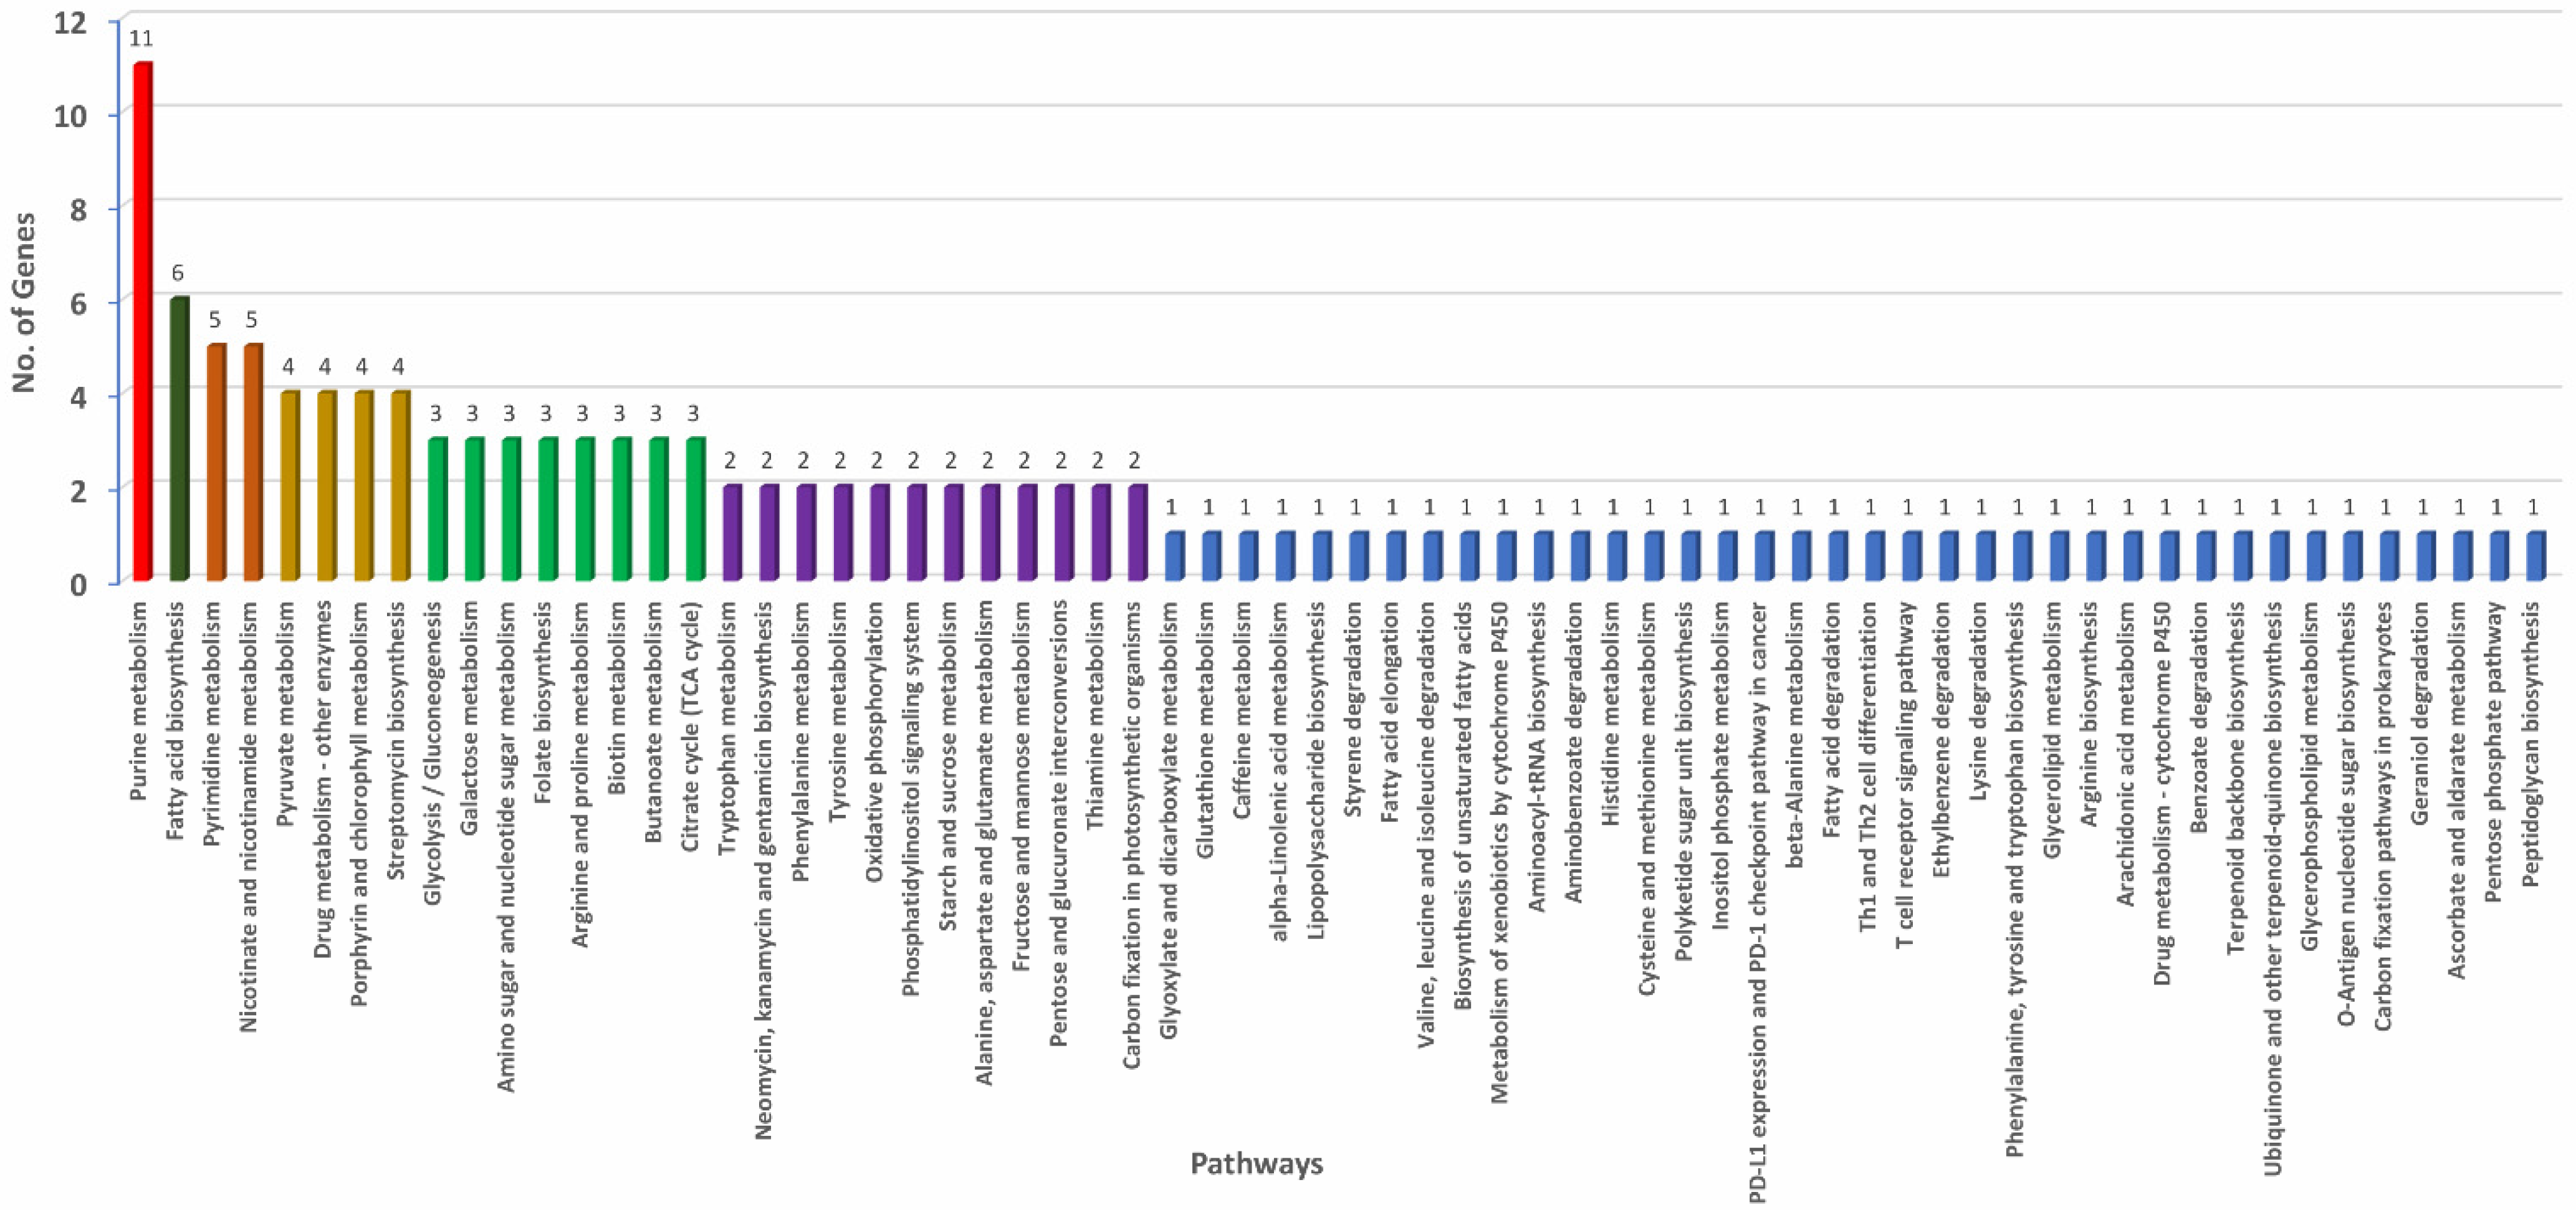
3.6. Pan-Genome-Wide Association Study

An association study was conducted using the qualitative phenotyping data (pathogenicity on onion seedling) and the core and accessory genes. The goal was to identify genes responsible for pathogenicity of Psi strains in onion. Scoary predicted a total of 154 genes associated with the phenotype (Table S6). Among the 154 genes, we found seven clusters of genes associated with the phenotype. There were three gene clusters with 5, 12, and 11 genes that were highly significant based on p-values (p-value ≤ 0.005). Two out of the three clusters contained only non-annotated hypothetical protein coding genes. However, one cluster contained 11 protein coding genes (Table 2). These 11 genes coded for Pyridoxal 5’-phosphate synthase, AMP-binding protein, MFS transporter, phosphoglycerate kinase, FAD-NAD(P)-binding protein, phosphoenolpyruvate phosphomutase, NAD(P)-binding domain-containing protein, N-acetyl-gamma-glutamyl-phosphate reductase, alcohol dehydrogenase catalytic domain-containing protein, iron containing alcohol dehydrogenase, and a LysE-family-translocator. A Blast search against the PNA 97-1R genome assembly (GCA_002952035.2) identified all genes except the last gene (LysE-family translocator) in the cluster. Interestingly, the first 10 genes in the cluster are chromosomally localized, but the last gene is localized in the large plasmid (Table S7).

3.7. Annotation of Pantoea stewartii subsp. indologenes Pan-Genome

The core and accessory genomes were annotated as genes involved in BP, MF, and CC (Figure S2). Under BP: response to stimulus, metabolic process, and cellular process were common in core, soft-core, shell and cloud genes. Regulation of biological process was specific to soft-core genes and shell genes lacked biological regulation and regulation of biological process functions. Under MF, catalytic and binding activities were common in all the core and accessory genes. However, genes coding for molecular function regulators were specific to the soft-core component of the pan-genome and shell genes lacked transporter activity. The genes in the CC category were assigned to the cellular anatomical entity and intracellular component (Figure S2). Further, we performed statistical assessment of annotation differences between core and accessory genes. When the core genome was compared with the accessory genome, catalytic activity, cellular process, metabolic (cellular) process, binding and nitrogen compound metabolic processes were the top six highly represented GO terms. When the soft-core was compared with the core, organic cyclic/heterocyclic compound binding, intrinsic/integral membrane component, small molecule binding, and localization were highly represented GO terms. When shell genes were compared with core-genes, they showed nucleic acid binding, heterocyclic/organic cyclic compound binding, DNA binding, and macromolecule (cellular) metabolic process as highly represented GO terms. Similarly, cloud genes compared with core-genes showed the same highly represented GO terms. However, cloud vs. core was different from shell vs. cloud in terms of intracellular (membrane) bounded organelle, extracellular space, and multicellular-organismal process GO terms specific to the cloud genome. Cytoskeleton organization and symbiotic process were specific to shell only (Figure S3).

4. Discussion

Pantoea stewartii subsp. indologenes causes a leafspot of foxtail millet and pearl millet, a rot of pineapple, and one strain has also been isolated from the cluster bean (Cyamopsis tetragonolobus) [6]. Recently, P. stewartii subsp. indologenes strains (Psi pv. cepacicola) were identified that caused symptoms similar to the center rot of onions [2]. These bacterial species/pathovar are not as prevalent as P. ananatis in Georgia or elsewhere but are known to cause center rot disease in onions. Genome analysis provides insights about the genes involved in pathogenicity and probable virulence mechanism(s). Moreover, it is important to know the architecture of pan-genome, phylogeny, and evolutionary association of P. stewartii subsp. indologenes strains with other Pantoea spp. and similarity or uniqueness in the onion-virulence repertoire. We therefore conducted a pan-genome study of seventeen newly identified Psi strains from both pathovars [pv. cepacicola (n = 4) and pv. setariae (n = 13)] and developed a core and a pan-genome followed by annotation of the core and accessory genes. Further, we carried out a pan-GWAS study and identified gene(s) associated with pathogenicity in onions. Phylogenetic and HGT studies were also conducted to understand the role that SNPs, PAVs, and HGTs have on the phylogeny of these strains.

4.1. Pantoea stewartii subsp. indologenes Pan-Genome and Horizontal Gene Transfer

In the current study, we identified 3546 core genes, 5 to 382 cloud genes, and 394 to 703 shell genes. A similar study using 81 P. ananatis strains identified 3153 core genes and cloud genes ranging from 1000 to 6808 [8]. We observed a stark difference in the number of cloud genes when compared with our earlier study on P. ananatis. A slightly higher number of core genes and a lesser number of cloud genes identified in the current study are expected to change in the future with an increase in the number of Psi genomes being added to the pan-genome. Fewer accessory genes were observed as compared with our previous study [8]. Fewer accessory genes in this study can be a result of HGT events because gene exchanges due to HGT can lead to extensive gene repertoire differences among closely related species or within species [37]. This may partly explain why a smaller number of cloud genes were identified in three Psi pv. cepacicola strains (PNA 14-11, PNA 14-12, and PNA 14-9) as compared with the rest of the Psi strains used in this study. Perhaps as more Psi pv. cepacicola genomes are included, the number of core genes may decrease and accessory genes may increase, as indicated in other bacterial pan-genomes (Escherichia coli) [38].
A dynamic pan-genome is also dependent on the frequent HGT events it encounters during evolution. We therefore studied HGT within Psi strains and among the four species of the Pantoea complex (P. ananatis, P. agglomerans, P. stewartii subsp. stewartii, and P. allii). The maximum number of HGT events occurred from PNA 03-3 (Psi pv. cepacicola) to PANS 07-4 (Psi pv. setariae), which may explain the phylogenetic clustering of PNA 03-3 with PANS 07-6 and PANS 07-4 using the shell and cloud genes. This in contrast to three Psi pv. cepacicola strains, namely, PNA 14-11, PNA 14-12, and 14-9 that contained 6, 5, and 18 cloud genes, respectively; Psi pv. cepacicola strain PNA 03-3 contained 259 cloud genes, which is similar to the number of cloud genes exhibited by Psi pv. setariae strains (range: 107 to 382). It seems that HGT events deeply impacted the gene loss in the abovementioned three Psi pv. cepacicola strains.

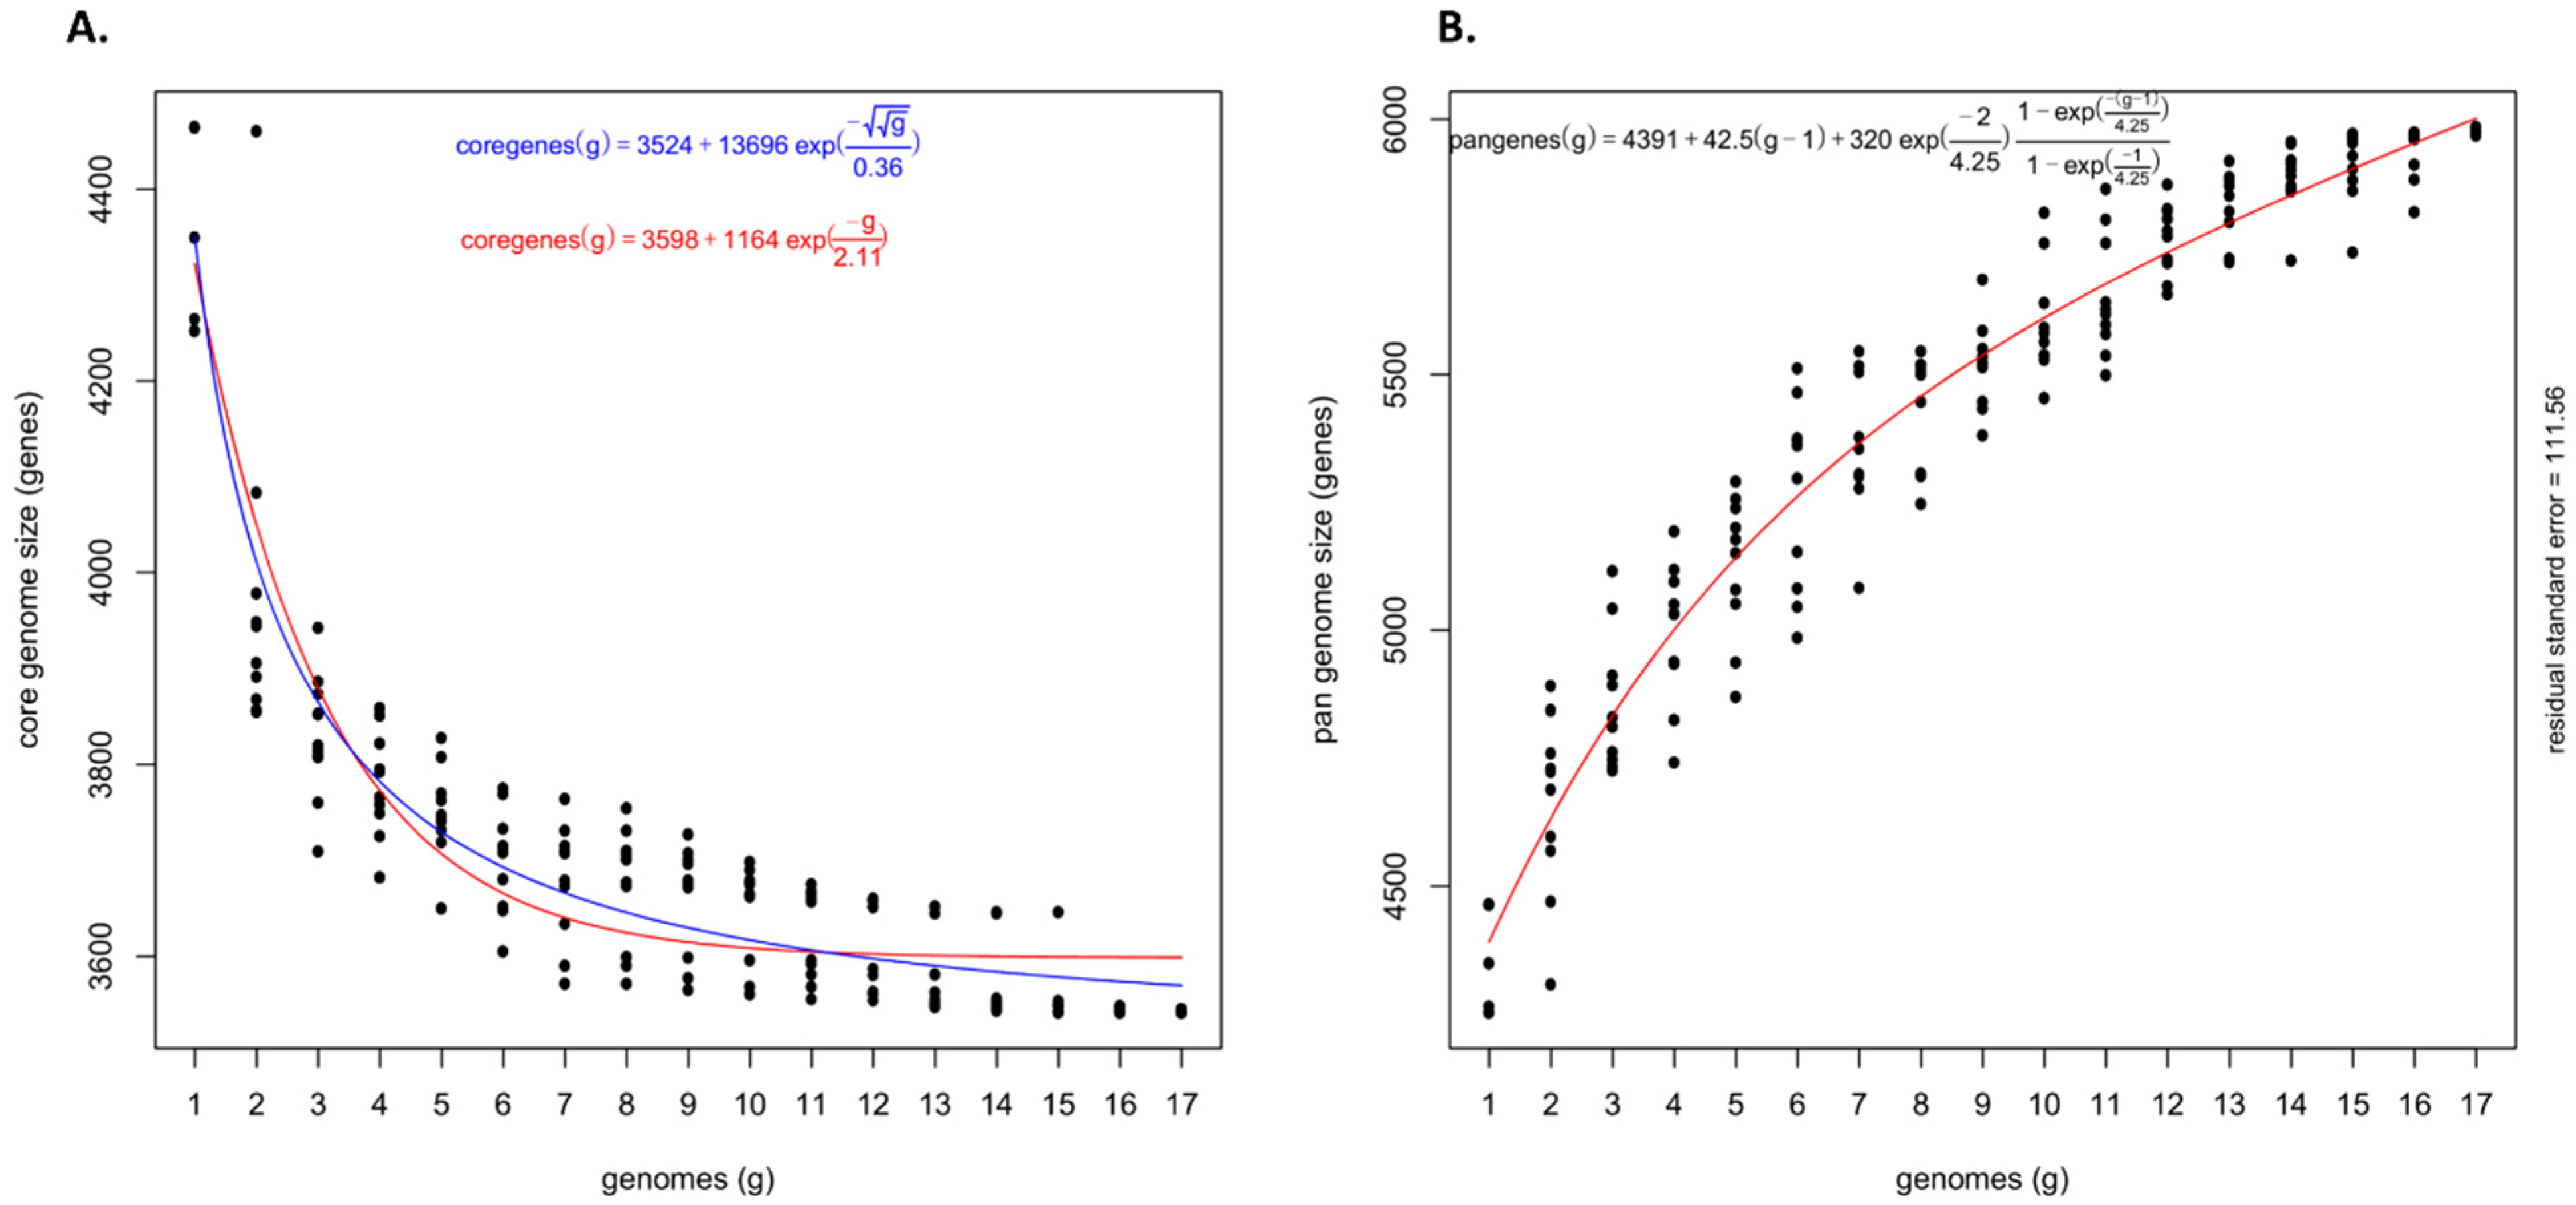
4.2. An Open Pan-Genome of Pantoea stewartii subsp. indologenes

The pan-genome approach is important for exploring the genomic repertoires of a phylogenetic lineage of microbes [39]. The pan-genome of Psi showed a linear progression with >6000 genes, with ~43 new genes adding on average to the pan-genome with each new Psi genome sequenced, suggesting that it was open and attributed to frequent evolutionary changes mediated by gene(s) gain and loss resulting due to HGT events. The open feature of Psi was consistent with P. ananatis and Geobacillus spp. datasets [8,17,40], as opposed to other species, such as Bifidobacterium breve and Staphylococcus lugdunensis, which depicted a closed trend [41,42].

4.3. Phylogenetic Study of Pantoea stewartii subsp. indologenes and Other Pantoea spp. Complex

A comparative phylogenetic approach was undertaken to evaluate the phylogeny of both Psi pathovars compared to other Pantoea spp. We used PAVs, SNPs, and wgMLST approaches to understand the differences in the phylogeny of Psi strains along with four Pantoea spp. based on the underlying genomic variants. The core genome with conserved genes instead of accessory genome with PAVs may convey a true measure of phylogeny. We therefore inferred our phylogenetic analysis based on core genome analysis. We found ANI based on core genes clustered Psi pv. cepacicola strains closely. However, soft-core genes ANI clustered one Psi pv. cepacicola strain (PNA 03-3) distantly from the other three strains. Similar, observations were made when shell and cloud genes were used to conduct the phylogenetic analysis. This suggests that onion-pathogenic Psi pv. cepacicola strains and onion-non-pathogenic Psi pv. setariae strains could be distinguished using core genes, which was not the case with accessory genes. Clustering based on the core and accessory genome ANI showed a slight difference, indicating the evolutionary and pathogenicity relationship was better depicted with core genes than the accessory genes. However, the number of input genomes may have a role to play and core genes-based phylogeny could probably change if the number of strains/genomes is further increased. It could also be possible that the core genome is impacted by HGT or homologous recombination and, as a result, the phylogenetic relationship based on core genes is obscured or distorted [43].
SNPs are vertically inherited and are one of the dominant forms of evolutionary change that have become an indispensable tool for phylogenetic analyses [44,45,46]. Hence, core genes were used to classify onion pathogenic Psi pv. cepacicola vs. onion non-pathogenic Psi pv. setariae strains. This was performed by identifying SNPs from the core genome and performing a phylogenetic analysis. Core SNPs clustered Psi pv. cepacicola strains together except for one strain, PNA 03-3.
Genomic regions that may have been involved in past recombination events should be excluded from phylogenetic analyses to produce more accurate phylogeny [47]. Therefore, we conducted another core-genome-SNPs-based phylogeny wherein the recombination events were excluded; however, despite the removal, we found similar results that we observed using SNPs- and PAVs-based phylogeny. We expected that excluding the recombination sites would result in clustering of PNA 03-3 (Psi pv. cepacicola) with the other three Psi pv. cepacicola strains (PNA 14-11, PNA 14-12 and PNA 14-9); however, that was not the case. This may in part indicate that the strain PNA 03-3 is evolutionarily distinct from the other Psi pv. cepacicola strains (PNA 14-11, PNA 14-12, and PNA 14-9).
Our earlier study showed that Psi pv. cepacicola PNA 03-3 was highly aggressive on leek, foxtail millet, and pearl millet, whereas it was moderately aggressive on onion, chive, Japanese bunching onion, and oat. Other Psi pv. cepacicola strains (PNA 14-9, PNA 14-11, PNA 14-12) were moderately-to-highly aggressive on onion, foxtail millet, and pearl millet but were moderate-to-less aggressive on leek, chive, Japanese bunching onion, and oat [7]. We believe that this difference in aggressiveness is represented by core SNPs. Additionally, Psi pv. cepacicola PNA 03-3 is more closely related to P. ananatis (LMG 2665T), which is reflected in the core SNPs-based phylogeny. The WgMLST, an extended concept of MLST, is complementary to PAVs-based phylogenetic analysis [8]. As expected, we observed a similar pattern of phylogenetic classification of strains both with PAVs- and wgMLST-based phylogeny. Particularly, Psi pv. cepacicola PNA 03-3 was clustered closely with Psi pv. setariae strains (NCPPB 2275 and NCPPB 1877) in both PAVs- and wgMLST-based phylogenetic analysis. These observations reiterated potential phylogenetic and evolutionary differences between the Psi pv. cepacicola strains, particularly with PNA 03-3 vs. PNA 14-11, PNA 14-12, and PNA 14-9.

4.4. Gene Cluster Identified from Pan-GWAS Analysis

The PAVs identified using Psi strains (n = 17) and the phenotyping data, when subjected to pan-GWAS, identified a gene cluster associated with pathogenicity in the Allium species. The phenotyping data were utilized from our earlier study [7]. Pan-GWAS identified several genes that were associated with the pathogenicity on onion seedlings. Out of all the genes identified (n = 154), a cluster of 11 well-annotated genes was identified and found to be strongly associated with pathogenicity in onion seedlings. Ten genes out of the eleven associated genes were found to be present in three out of the four pathogenic Psi pv. cepacicola strains (PNA 14-9, PNA 14-11, and PNA 14-12). However, there was one gene annotated as phosphoenolpuruvate mutase (pepM) that was present in all four pathogenic strains. Interestingly, based on further analysis it was found that the pepM gene in PNA 03-3 belongs to the previously known ‘HiVir’ cluster similar to that reported in the onion-pathogenic P. ananatis strains. In contrast, pepM gene in other Psi pv. cepacicola strains (PNA 14-9, PNA 14-11, and PNA 14-12) is a part of a novel cluster distinct from the ‘HiVir’ cluster. Hence, it is important to characterize the role of the pepM gene in Psi on onion pathogenicity in both clusters.
The novel gene cluster starts with a pyridoxal 5’-phosphate synthase (pdxH_2) gene, which catalyzes pentose and triose isomerizations, imine formation, amine addition, and ring formation, all in a single enzymatic system [48,49]. It is involved in ammonia transport [50]. The second gene of the cluster codes for the AMP binding protein. AMP binding proteins in bacteria are regarded as global activator proteins that are required to regulate the gene transcription [51]. The third gene (ydeE) in the cluster was an efflux MFS transporter known to export peptides [52]. A Pgk-tpi protein coding gene that is involved in the sub-pathway, which synthesizes D-glyceraldehyde 3-phosphate from glycerone phosphate (a part of the pathway glycolysis which is itself part of carbohydrate degradation), was next in the cluster. Pgk-tpi codes for enzymes phosphoglycerate kinase and triosephosphate isomerase that form a covalent bifunctional enzyme complex [53]. The next gene in the gene cluster codes for a FAD/NAD(P)-binding protein. The NAD(P)-binding enzymes are involved in catalyzing redox or non-redox reactions [54]. Interestingly, the next gene in the cluster (pepM) codes for phosphoenolpuruvate mutase, which was the first gene of the HiVir cluster identified in P. ananatis [55]. It was identified as the first pathogenicity factor associated with the fitness of P. ananatis as well as with symptom development in infected onion leaves and bulbs [55]. Potentially, the pepM gene (novel gene-cluster) in Psi pv. cepacicola strains (PNA 14-9, PNA 14-11, and PNA 14-12) may also play a similar role in onion-pathogenicity. As mentioned above, the role of this gene on onion-pathogenicity needs to be investigated.
The next gene in the cluster codes for NAD(P)-binding domain-containing protein, which catalyzes the NADPH-dependent reactions. For example, hydropxypyruvate reductase carries out the reduction of glyoxylate and hydroxypyruvate into glycolate and glycerate, respectively [56,57,58]. N-acetyl-gamma-glutamyl-phosphate reductase is coded by argC1 gene in the cluster. It catalyzes the NADPH-dependent reduction of N-acetyl-5-glutamyl phosphate to yield N-acetyl-L-glutamate 5-semialdehyde. This enzyme is involved in step 3 of the sub-pathway that synthesizes N(2)-acetyl-L-ornithine from L-glutamate. This sub-pathway itself is part of the L-arginine biosynthesis pathway [59]. Another gene in the cluster was annotated as alcohol dehydrogenase catalytic domain-containing protein. Alcohol dehydrogenases are the oxidoreductases that catalyze the reversible oxidation of alcohols to aldehydes or ketones, with the concomitant reduction of NAD+ or NADP+ [60]. The second-to-last gene in the cluster codes for another alcohol dehydrogenase, i.e., iron containing alcohol dehydrogenase (FeADH). The FeADH family has been characterized as exhibiting different catalytic activities. ADHs are capable of catalyzing a wide variety of substrates (e.g., normal and branched-chain aliphatic and aromatic alcohols, both primary and secondary alcohols, corresponding aldehydes and ketones, and polyols) and they are involved in an astonishingly wide range of metabolic processes; they are, for instance, involved in alcohol, alkane, sugar, and lipid metabolism, as well as in cell defense towards exogenous alcohols and aldehydes [61,62,63,64,65,66]. The last gene in the cluster codes for the Lyse-family translocator. The physiological function of the exporter is to excrete excess L-Lysine and L-arginine as a result of natural flux imbalances or peptide hydrolysis. It also plays important roles in ionic homeostasis, cell envelope assembly, and protection from excessive cytoplasmic heavy metal/metabolite concentrations. [67,68]. Overall, only two out of the eleven genes identified in this cluster that were common with the HiVir cluster were identified in P. ananatis [69]. These two common genes code for the phosphoenolpyruvate phospomutase (PepM) enzyme and the MFS transporter protein. These findings suggest a potential alternate set of onion pathogenicity-related genes in Psi, which is distinct from the known onion pathogenicity (HiVir) and virulence (allicin tolerance; alt) factors identified in P. ananatis [55,69,70]. We are currently trying to understand the role of this gene cluster in Psi pv. cepacicola on onion pathogenicity using traditional gene mutation studies.

5. Conclusions

The pan-GWAS approach predicted the genes associated with onion-pathogenicity in Psi strains, particularly in Psi pv. cepacicola. We found a cluster of genes different from the HiVir/PASVIL (identified in P. ananatis) cluster linked to onion pathogenicity in Psi pv. cepacicola. We concluded that there might be several pathogenicity factors involved in onion pathogenicity and to some extent these might be specific to some Pantoea spp. We also observed a large repertoire of accessory genes in Psi strains, which is suggestive of the potential for a broad and diverse niche-adaptation and host-range expansion capabilities. We observed HGT events as a major contributing factor for PAVs resulting in diversification of Psi and other Pantoea species. In the future, it would be interesting to assess if the aggressiveness of Psi strains on Allium and Poacea species can be predicted using GWAS utilizing SNPs rather than PAVs. We expect that the SNPs-based GWAS study will not only corroborate our current findings, but may potentially lead to the development of SNPs-based PCR markers that can distinguish the Psi pv. cepacicola and Psi pv. setariae strains.

Supplementary Materials

The following are available online at https://www.mdpi.com/article/10.3390/microorganisms9081761/s1, Figure S1: Phylogenetic tree based on core-genome alignment of 17 Pantoea stewartii subsp. indologenes strains. Phylogenetic tree was constructed excluding the recombination sites using Parsnp program of Harvest suite. PANS 07-6 was randomly chosen as reference by Parsnp while doing core-genome alignment and identifying SNPs; Figure S2: Sequences per GO terms: Annotations of core, soft-core, shell and cloud genes of Pantoea stewartii subsp. indologenes pan-genome. Panel A-C shows the core genes function to BP, MF and CC; panel D-F shows the function of soft-core genes assigned to BP, MF and CC; panel G-I represent the function of shell genes assigned to BP, MF and CC; panel J-L shows the function of cloud genes assigned to BP, MF and CC; Figure S3: Statistical assessment of annotation differences in Pantoea stewartii subsp. indologenes pan-genome. The panels represent (A) core vs. accessory; (B) soft-core vs. core; (C) shell vs. core; and (D) cloud vs core genes; Table S1: Details of the number of core and accessory genes contributed by each strain; Table S2: List of genes involved in horizontal gene transfer among the twenty-one strains used in this study. Description is the protein coded by these genes and direction shows the gene flow from one strain to another. Depending upon the direction a strain (gene) is defined as a donor or a recipient; Table S3: Mapping and annotation results of donor and recipient genes involved in horizontal gene transfer (HGT); Table S4: Details of GO ids and functional categorization of each protein coding gene sequence involved in HGT. Number of GO ids assigned to each sequence; Table S5: KEGG pathways where the genes featuring in horizontal gene transfer (HGT) are involved; Table S6: List of genes in P. stewartii subs. indologenes that Scoary predicted to be associated with red onion scale clearing phenotype; Table S7: Blast output of Psi genes identified to be associated with red onion scale clearing phenotype showing localisation in PNA-97-1R genome.

Author Contributions

G.A. and B.D. conceived the project, G.A. performed the bioinformatics analyses and complied the manuscript. B.D. designed and finalized the manuscript. B.D. planned the project, secured extramural funds, and revised and submitted the manuscript. R.D.G.: resources, supervision and writing—review & editing. All authors have read and agreed to the published version of the manuscript.

Funding

This study was supported in part by resources and technical expertise from the Georgia Advanced Computing Resource Center, a partnership between the University of Georgia Office of the Vice President for Research and Office of the Vice President for Information Technology. This work is partially supported by the Specialty Crop Block Grant AWD00009682.

Institutional Review Board Statement

Not applicable.

Informed Consent Statement

Not applicable.

Data Availability Statement

Assembly files were submitted to NCBI database under the bio-project PRJNA676043 with accession numbers SAMN16866615 to SAMN16866629.

Conflicts of Interest

The authors declare that they have no competing interests.

References

  1. Gitaitis, R.; Walcott, R.; Culpepper, S.; Sanders, H.; Zolobowska, L.; Langston, D. Recovery of Pantoea ananatis, causal agent of center rot of onion, from weeds and crops in Georgia, USA. Crop. Prot. 2002, 21, 983–989. [Google Scholar] [CrossRef]
  2. Stumpf, S.; Kvitko, B.; Gitaitis, R.; Dutta, B. Isolation and characterization of novel Pantoea stewartii subsp. indologenes strains exhibiting center rot in onion. Plant Dis. 2018, 102, 727–733. [Google Scholar] [CrossRef] [Green Version]
  3. Edens, D.; Gitaitis, R.; Sanders, F.; Nischwitz, C. First report of Pantoea agglomerans causing a leaf blight and bulb rot of onions in Georgia. Plant Dis. 2006, 90, 1551. [Google Scholar] [CrossRef]
  4. Brady, C.; Cleenwerck, I.; Venter, S.; Vancanneyt, M.; Swings, J.; Coutinho, T. Phylogeny and identification of Pantoea species associated with plants, humans and the natural environment based on multilocus sequence analysis (MLSA). Syst. Appl. Microbiol. 2008, 31, 447–460. [Google Scholar] [CrossRef] [PubMed] [Green Version]
  5. Kini, K.; Dossa, R.; Dossou, B.; Mariko, M.; Koebnik, R.; Silué, D. A semi-selective medium to isolate and identify bacteria of the genus Pantoea. J. Gen. Plant Pathol. 2019, 85, 424–427. [Google Scholar] [CrossRef] [Green Version]
  6. Mergaert, J.; Verdonck, L.; Kersters, K. Transfer of Erwinia ananas and Erwinia stewartii to the genus Pantoea and description of Pantoea stewartii ssp. indologenes. Int. J. Syst. Bacteriol. 1993, 43, 162–173. [Google Scholar] [CrossRef]
  7. Koirala, S.; Zhao, M.; Agarwal, G.; Stice, S.; Gitaitis, R.; Kvitko, B.; Dutta, B. Identification of two novel pathovars of Pantoea stewartii subsp. indologenes affecting Allium sp. and millets. In Phytopathology; APS Publications: St. Paul, MN, USA, 2021. [Google Scholar]
  8. Agarwal, G.; Choudhary, D.; Stice, S.; Myers, B.; Gitaitis, R.; Venter, S.; Kvitko, B.; Dutta, B. Pan-genome-wide analysis of Pantoea ananatis identified genes linked to pathogenicity in onion. bioRxiv 2020. [Google Scholar] [CrossRef]
  9. Agarwal, G.; Kavalappara, S.R.; Gautam, S.; Da Silva, A.; Simmons, A.; Srinivasan, R.; Dutta, B. Field screen and genotyping of Phaseolus vulgaris against two begomoviruses in Georgia, USA. Insects 2021, 12, 49. [Google Scholar] [CrossRef]
  10. Agarwal, G.; Clevenger, J.; Kale, S.M.; Wang, H.; Pandey, M.K.; Choudhary, D.; Yuan, M.; Wang, X.; Culbreath, A.K.; Holbrook, C.C. A recombination bin-map identified a major QTL for resistance to Tomato Spotted Wilt Virus in peanut (Arachis hypogaea). Sci. Rep. 2019, 9, 1–13. [Google Scholar] [CrossRef]
  11. Agarwal, G.; Clevenger, J.; Pandey, M.K.; Wang, H.; Shasidhar, Y.; Chu, Y.; Fountain, J.C.; Choudhary, D.; Culbreath, A.K.; Liu, X.; et al. High-density genetic map using whole-genome resequencing for fine mapping and candidate gene discovery for disease resistance in peanut. Plant. Biotechnol. J. 2018, 16, 1954–1967. [Google Scholar] [CrossRef] [Green Version]
  12. Divya, C.; Gaurav, A.; Hui, W.; Pandey, M.K.; Culbreath, A.K.; Varshney, R.K.; Guo, B. Molecular markers and genomic resources for disease resistance in peanut—A review. Legume Res. 2019, 42, 137–144. [Google Scholar]
  13. Clevenger, J.; Chu, Y.; Chavarro, C.; Agarwal, G.; Bertioli, D.J.; Leal-Bertioli, S.C.; Pandey, M.K.; Vaughn, J.; Abernathy, B.; Barkley, N.A.; et al. Genome-wide SNP genotyping resolves signatures of selection and tetrasomic recombination in peanut. Mol. Plant 2017, 10, 309–322. [Google Scholar] [CrossRef] [PubMed] [Green Version]
  14. Pandey, M.K.; Agarwal, G.; Kale, S.M.; Clevenger, J.; Nayak, S.N.; Sriswathi, M.; Chitikineni, A.; Chavarro, C.; Chen, X.; Upadhyaya, H.D.; et al. Development and evaluation of a high density genotyping ‘Axiom_Arachis’ array with 58 K SNPs for accelerating genetics and breeding in groundnut. Sci. Rep. 2017, 7, 1–10. [Google Scholar] [CrossRef]
  15. Khan, A.W.; Garg, V.; Roorkiwal, M.; Golicz, A.A.; Edwards, D.; Varshney, R.K. Super-pangenome by integrating the wild side of a species for accelerated crop improvement. Trends Plant Sci. 2020, 25, 148–158. [Google Scholar] [CrossRef] [PubMed] [Green Version]
  16. Tettelin, H.; Masignani, V.; Cieslewicz, M.J.; Donati, C.; Medini, D.; Ward, N.L.; Angiuoli, S.V.; Crabtree, J.; Jones, A.L.; Durkin, A.S.; et al. Genome analysis of multiple pathogenic isolates of streptococcus agalactiae: Implications for the microbial “pan-genome”. Proc. Natl. Acad. Sci. USA 2005, 102, 13950–13955. [Google Scholar] [CrossRef] [PubMed] [Green Version]
  17. Wang, M.; Zhu, H.; Kong, Z.; Li, T.; Ma, L.; Liu, D.; Shen, Q. Pan-genome analyses of geobacillus spp. reveal genetic characteristics and composting potential. Int. J. Mol. Sci. 2020, 21, 3393. [Google Scholar] [CrossRef]
  18. Bosi, E.; Monk, J.M.; Aziz, R.K.; Fondi, M.; Nizet, V.; Palsson, B.Ø. Comparative genome-scale modelling of Staphylococcus aureus strains identifies strain-specific metabolic capabilities linked to pathogenicity. Proc. Natl. Acad. Sci. USA 2016, 113, E3801–E3809. [Google Scholar] [CrossRef] [Green Version]
  19. Nowell, R.W.; Green, S.; Laue, B.E.; Sharp, P.M. The extent of genome flux and its role in the differentiation of bacterial lineages. Genome Biol. Evol. 2014, 6, 1514–1529. [Google Scholar] [CrossRef]
  20. Contreras-Moreira, B.; Vinuesa, P. GET_HOMOLOGUES, a versatile software package for scalable and robust microbial pangenome analysis. Appl. Environ. Microbiol. 2013, 79, 7696–7701. [Google Scholar] [CrossRef] [Green Version]
  21. Treangen, T.J.; Ondov, B.D.; Koren, S.; Phillippy, A.M. The harvest suite for rapid core-genome alignment and visualization of thousands of intraspecific microbial genomes. Genome Biol. 2014, 15, 1–15. [Google Scholar] [CrossRef] [Green Version]
  22. Bruen, T.C.; Philippe, H.; Bryant, D. A simple and robust statistical test for detecting the presence of recombination. Genetics 2006, 172, 2665–2681. [Google Scholar] [CrossRef] [Green Version]
  23. Price, M.N.; Dehal, P.S.; Arkin, A.P. FastTree 2—Approximately maximum-likelihood trees for large alignments. PLoS ONE 2010, 5, e9490. [Google Scholar] [CrossRef] [PubMed]
  24. Bateman, A.; Coin, L.; Durbin, R.; Finn, R.D.; Hollich, V.; Griffiths-Jones, S.; Khanna, A.; Marshall, M.; Moxon, S.; Sonnhammer, E.L. The Pfam protein families database. Nucleic Acids Res. 2004, 32 (Suppl. 1), D138–D141. [Google Scholar] [CrossRef] [PubMed]
  25. Haft, D.H.; Selengut, J.D.; Richter, R.A.; Harkins, D.; Basu, M.K.; Beck, E. TIGRFAMs and genome properties in 2013. Nucleic Acids Res. 2012, 41, D387–D395. [Google Scholar] [CrossRef] [Green Version]
  26. Finn, R.D.; Clements, J.; Eddy, S.R. HMMER web server: Interactive sequence similarity searching. Nucleic Acids Res. 2011, 39 (Suppl. 2), W29–W37. [Google Scholar] [CrossRef] [PubMed] [Green Version]
  27. Chaumeil, P.-A.; Mussig, A.J.; Hugenholtz, P.; Parks, D.H. GTDB-Tk: A Toolkit to Classify Genomes with the Genome Taxonomy Database; Oxford University Press: England, UK, 2020. [Google Scholar]
  28. Letunic, I.; Bork, P. Interactive tree of life (iTOL) v5: An online tool for phylogenetic tree display and annotation. Nucleic Acids Res. 2021, 49, W293–W296. [Google Scholar] [CrossRef]
  29. Song, W.; Wemheuer, B.; Zhang, S.; Steensen, K.; Thomas, T. MetaCHIP: Community-level horizontal gene transfer identification through the combination of best-match and phylogenetic approaches. Microbiome 2019, 7, 1–14. [Google Scholar] [CrossRef] [Green Version]
  30. Laing, C.; Buchanan, C.; Taboada, E.N.; Zhang, Y.; Kropinski, A.; Villegas, A.; Thomas, J.E.; Gannon, V.P. Pan-genome sequence analysis using Panseq: An online tool for the rapid analysis of core and accessory genomic regions. BMC Bioinform. 2010, 11, 1–14. [Google Scholar] [CrossRef] [Green Version]
  31. Stamatakis, A. RAxML version 8: A tool for phylogenetic analysis and post-analysis of large phylogenies. Bioinformatics 2014, 30, 1312–1313. [Google Scholar] [CrossRef] [PubMed]
  32. Liu, Y.-Y.; Chiou, C.-S.; Chen, C.-C. PGAdb-builder: A web service tool for creating pan-genome allele database for molecular fine typing. Sci. Rep. 2016, 6, 1–5. [Google Scholar] [CrossRef] [Green Version]
  33. Brynildsrud, O.; Bohlin, J.; Scheffer, L.; Eldholm, V. Rapid scoring of genes in microbial pan-genome-wide association studies with Scoary. Genome Biol. 2016, 17, 1–9. [Google Scholar] [CrossRef] [PubMed] [Green Version]
  34. Al-Shahrour, F.; Díaz-Uriarte, R.; Dopazo, J. FatiGO: A web tool for finding significant associations of Gene Ontology terms with groups of genes. Bioinformatics 2004, 20, 578–580. [Google Scholar] [CrossRef] [PubMed] [Green Version]
  35. Götz, S.; García-Gómez, J.M.; Terol, J.; Williams, T.D.; Nagaraj, S.H.; Nueda, M.J.; Robles, M.; Talón, M.; Dopazo, J.; Conesa, A. High-throughput functional annotation and data mining with the Blast2GO suite. Nucleic Acids Res. 2008, 36, 3420–3435. [Google Scholar] [CrossRef] [PubMed]
  36. Willenbrock, H.; Hallin, P.F.; Wassenaar, T.M.; Ussery, D.W. Characterization of probiotic Escherichia coliisolates with a novel pan-genome microarray. Genome Biol. 2007, 8, R267. [Google Scholar] [CrossRef] [PubMed] [Green Version]
  37. Shapiro, B.J.; Friedman, J.; Cordero, O.X.; Preheim, S.P.; Timberlake, S.C.; Szabó, G.; Polz, M.F.; Alm, E.J. Population genomics of early events in the ecological differentiation of bacteria. Science 2012, 336, 48–51. [Google Scholar] [CrossRef] [Green Version]
  38. Lukjancenko, O.; Wassenaar, T.M.; Ussery, D.W. Comparison of 61 sequenced Escherichia coli genomes. Microb. Ecol. 2010, 60, 708–720. [Google Scholar] [CrossRef] [Green Version]
  39. Shin, J.; Song, Y.; Jeong, Y.; Cho, B.-K. Analysis of the core genome and pan-genome of autotrophic acetogenic bacteria. Front. Microbiol. 2016, 7, 1531. [Google Scholar] [CrossRef]
  40. Bezuidt, O.K.; Pierneef, R.; Gomri, A.M.; Adesioye, F.; Makhalanyane, T.P.; Kharroub, K.; Cowan, D.A. The geobacillus pan-genome: Implications for the evolution of the genus. Front. Microbiol. 2016, 7, 723. [Google Scholar] [CrossRef]
  41. Argemi, X.; Matelska, D.; Ginalski, K.; Riegel, P.; Hansmann, Y.; Bloom, J.; Pestel-Caron, M.; Dahyot, S.; Lebeurre, J.; Prévost, G. Comparative genomic analysis of staphylococcus lugdunensis shows a closed pan-genome and multiple barriers to horizontal gene transfer. BMC Genom. 2018, 19, 1–16. [Google Scholar] [CrossRef]
  42. Bottacini, F.; Motherway, M.O.C.; Kuczynski, J.; O’Connell, K.J.; Serafini, F.; Duranti, S.; Milani, C.; Turroni, F.; Lugli, G.A.; Zomer, A.; et al. Comparative genomics of the Bifidobacterium breve taxon. BMC Genom. 2014, 15, 1–19. [Google Scholar] [CrossRef] [Green Version]
  43. Straub, C.; Colombi, E.; McCann, H.C. Population genomics of bacterial plant pathogens. Phytopathology 2021, 111, 23–31. [Google Scholar] [CrossRef] [PubMed]
  44. McNally, K.L.; Childs, K.L.; Bohnert, R.; Davidson, R.M.; Zhao, K.; Ulat, V.J.; Zeller, G.; Clark, R.M.; Hoen, D.R.; Bureau, T.E.; et al. Genomewide SNP variation reveals relationships among landraces and modern varieties of rice. Proc. Natl. Acad. Sci. USA 2009, 106, 12273–12278. [Google Scholar] [CrossRef] [PubMed] [Green Version]
  45. Faison, W.J.; Rostovtsev, A.; Castro-Nallar, E.; Crandall, K.A.; Chumakov, K.; Simonyan, V.; Mazumder, R. Whole genome single-nucleotide variation profile-based phylogenetic tree building methods for analysis of viral, bacterial and human genomes. Genomics 2014, 104, 1–7. [Google Scholar] [CrossRef]
  46. Shakya, M.; Ahmed, S.A.; Davenport, K.W.; Flynn, M.C.; Lo, C.-C.; Chain, P.S. Standardized phylogenetic and molecular evolutionary analysis applied to species across the microbial tree of life. Sci. Rep. 2020, 10, 1–15. [Google Scholar]
  47. Boto, L. Horizontal gene transfer in evolution: Facts and challenges. Proc. R. Soc. B Biol. Sci. 2010, 277, 819–827. [Google Scholar] [CrossRef] [Green Version]
  48. Burns, K.E.; Xiang, Y.; Kinsland, C.L.; McLafferty, F.W.; Begley, T.P. Reconstitution and biochemical characterization of a new pyridoxal-5′-phosphate biosynthetic pathway. J. Am. Chem. Soc. 2005, 127, 3682–3683. [Google Scholar] [CrossRef] [PubMed]
  49. Raschle, T.; Amrhein, N.; Fitzpatrick, T.B. On the two components of pyridoxal 5′-phosphate synthase from Bacillus subtilis. J. Biol. Chem. 2005, 280, 32291–32300. [Google Scholar] [CrossRef] [Green Version]
  50. Strohmeier, M.; Raschle, T.; Mazurkiewicz, J.; Rippe, K.; Sinning, I.; Fitzpatrick, T.B.; Tews, I. Structure of a bacterial pyridoxal 5′-phosphate synthase complex. Proc. Natl. Acad. Sci. USA 2006, 103, 19284–19289. [Google Scholar] [CrossRef] [Green Version]
  51. Botsford, J.L.; Harman, J.G. Cyclic AMP in prokaryotes. Microbiol. Mol. Biol. Rev. 1992, 56, 100–122. [Google Scholar] [CrossRef]
  52. Hayashi, M.; Tabata, K.; Yagasaki, M.; Yonetani, Y. Effect of multidrug-efflux transporter genes on dipeptide resistance and overproduction in Escherichia coli. FEMS Microbiol. Lett. 2010, 304, 12–19. [Google Scholar] [CrossRef] [Green Version]
  53. Schurig, H.; Beaucamp, N.; Ostendorp, R.; Jaenicke, R.; Adler, E.; Knowles, J.R. Phosphoglycerate kinase and triosephosphate isomerase from the hyperthermophilic bacterium Thermotoga maritima form a covalent bifunctional enzyme complex. EMBO J. 1995, 14, 442–451. [Google Scholar] [CrossRef] [PubMed]
  54. Hua, Y.H.; Wu, C.Y.; Sargsyan, K.; Lim, C. Sequence-motif detection of NAD (P)-binding proteins: Discovery of a unique antibacterial drug target. Sci. Rep. 2014, 4, 1–7. [Google Scholar] [CrossRef] [Green Version]
  55. Asselin, J.A.E.; Bonasera, J.M.; Beer, S.V. Center rot of onion (Allium cepa) caused by Pantoea ananatis requires pepM, a predicted phosphonate-related gene. Mol. Plant Microbe Interact. 2018, 31, 1291–1300. [Google Scholar] [CrossRef] [PubMed]
  56. Hilderbrand, R.L. Role of Phosphonates in Living Systems; CRC Press: Boca Raton, FL, USA, 1983. [Google Scholar]
  57. Nuñez, M.F.; Pellicer, M.T.; Badia, J.; Aguilar, J.; Baldoma, L. Biochemical characterization of the 2-ketoacid reductases encoded by ycdW and yiaE genes in Escherichia coli. Biochem. J. 2001, 354, 707–715. [Google Scholar] [CrossRef] [PubMed]
  58. But, S.; Egorova, S.; Khmelenina, V.; Trotsenko, Y. Biochemical properties and phylogeny of hydroxypyruvate reductases from methanotrophic bacteria with different c 1-assimilation pathways. Biochemistry 2017, 82, 1295–1303. [Google Scholar] [CrossRef]
  59. Baich, A.; Vogel, H.J. N-acetyl-γ-glutamokinase and N-acetylglutamic γ-semialdehyde dehydrogenase: Repressible enzymes of arginine synthesis in Escherichiacoli. Biochem. Biophys. Res. Commun. 1962, 7, 491–496. [Google Scholar] [CrossRef]
  60. De Smidt, O.; Du Preez, J.C.; Albertyn, J. The alcohol dehydrogenases of Saccharomyces cerevisiae: A comprehensive review. FEMS Yeast Res. 2008, 8, 967–978. [Google Scholar] [CrossRef] [Green Version]
  61. Park, D.-H.; Plapp, B. Isoenzymes of horse liver alcohol dehydrogenase active on ethanol and steroids. cDNA cloning, expression, and comparison of active sites. J. Biol. Chem. 1991, 266, 13296–13302. [Google Scholar] [CrossRef]
  62. Ma, K.; Loessner, H.; Heider, J.; Johnson, M.K.; Adams, M. Effects of elemental sulfur on the metabolism of the deep-sea hyperthermophilic archaeon Thermococcus strain ES-1: Characterization of a sulfur-regulated, non-heme iron alcohol dehydrogenase. J. Bacteriol. 1995, 177, 4748–4756. [Google Scholar] [CrossRef] [Green Version]
  63. Tani, A.; Sakai, Y.; Ishige, T.; Kato, N. Thermostable NADP+-dependent medium-chain alcohol dehydrogenase from Acinetobacter sp. strain M-1: Purification and characterization and gene expression inescherichia coli. Appl. Environ. Microbiol. 2000, 66, 5231–5235. [Google Scholar] [CrossRef] [Green Version]
  64. Burdette, D.; Jung, S.-H.; Shen, G.-J.; Hollingsworth, R.; Zeikus, J. Physiological function of alcohol dehydrogenases and long-chain (C30) fatty acids in alcohol tolerance of Thermoanaerobacter ethanolicus. Appl. Environ. Microbiol. 2002, 68, 1914–1918. [Google Scholar] [CrossRef] [Green Version]
  65. Vangnai, A.S.; Arp, D.J.; Sayavedra-Soto, L.A. Two distinct alcohol dehydrogenases participate in butane metabolism by Pseudomonas butanovora. J. Bacteriol. 2002, 184, 1916–1924. [Google Scholar] [CrossRef] [Green Version]
  66. Yoon, S.-Y.; Noh, H.-S.; Kim, E.-H.; Kong, K.-H. The highly stable alcohol dehydrogenase of Thermomicrobium roseum: Purification and molecular characterization. Comp. Biochem. Physiol. Part B Biochem. Mol. Biol. 2002, 132, 415–422. [Google Scholar] [CrossRef]
  67. Vrljic, M.; Sahm, H.; Eggeling, L. A new type of transporter with a new type of cellular function: l-lysine export from Corynebacterium glutamicum. Mol. Microbiol. 1996, 22, 815–826. [Google Scholar] [CrossRef] [PubMed]
  68. Tsu, B.V.; Saier, M.H., Jr. The LysE superfamily of transport proteins involved in cell physiology and pathogenesis. PLoS ONE 2015, 10, e0137184. [Google Scholar] [CrossRef] [PubMed] [Green Version]
  69. Polidore, A.L.; Furiassi, L.; Hergenrother, P.J.; Metcalf, W.W. A phosphonate natural product made by Pantoea ananatis is necessary and sufficient for the hallmark lesions of onion center rot. Mbio 2021, 12, e03402-20. [Google Scholar] [CrossRef]
  70. Stice, S.P.; Thao, K.K.; Khang, C.H.; Baltrus, D.A.; Dutta, B.; Kvitko, B.H. Pantoea ananatis defeats Allium chemical defenses with a plasmid-borne virulence gene cluster. bioRxiv 2020. [Google Scholar] [CrossRef]
Figure 1. Pan-genome analysis of 17 Pantoea stewartii subsp. indologenes genomes. (A) Distribution of gene (cluster) sizes as a function of the number of genomes; (B) Genes contributed by each genome that contributed to the pan-genome.
Microorganisms 09 01761 g001
Figure 2. Theoretical estimation of the core and pan-genome sizes based on the exponential decay model. (A) Estimation of core genome size based on the Willenbrock model fit to OMCL clusters and (B) Estimation of pan-genome size based on the Tettelin model fit to OMCL clusters.
Microorganisms 09 01761 g002
Figure 3. Dendrogram of 17 strains of Pantoea stewartii subsp. indologenes based on the core and accessory genes. (A) Dendrogram based on core genes, i.e., genes present in all 17 strains used in the study; (B) Dendrogram based on soft-core genes, i.e., genes present in at least 95% of the strains; (C) Dendrogram based on shell genes; and (D) Dendrogram based on cloud genes, i.e., the genes specific to each strain or shared by a maximum of two strains.
Microorganisms 09 01761 g003
Figure 4. Phylogeny-based horizontal gene transfer (HGT) among 17 strains of Pantoea stewartii subsp. indologenes strains and four other species of the Pantoea complex, namely, P. ananatis, P. stewartii subsp. stewartii, P. agglomerans, and P. allii. (A) Phylogenetic tree of Pantoea spp. (n = 21) strains based on multiple-sequence alignment. Phylogenetic tree resulted in four clusters (a–d). Size of circles represent the bootstrap values in that order; (B) Predicted gene flow within the four phylogenetic clusters of Pantoea spp. Bands connect donors and recipients, with the width of the band correlating to the number of HGTs and the color corresponding to the donors. Numbers on the circumference of circos plot represent the number of genes that underwent horizontal gene transfers. The four arcs (a–d) of circos represent the four phylogenetic clusters of Pantoea spp. strains; (CE) Graphical annotations of sequences involved in HGT as per the assigned GO terms: (C) shows the function of genes assigned to biological processes, (D) shows the function of genes assigned to molecular functions, and (E) represents the function of genes assigned to cellular components.
Microorganisms 09 01761 g004
Figure 5. Annotated genes involved in horizontal gene transfer (HGT) with functions assigned under biochemical, metabolic, and physiological pathways operational in Pantoea stewartii subsp. indologenes.
Microorganisms 09 01761 g005
Figure 6. Comparative phylogeny of onion-pathogenic and onion-non-pathogenic strains of Pantoea stewartii subsp. indologenes based on core genome SNPs and presence and absence variations (PAVs). (A) Phylogenetic tree constructed using PAVs using RAxML; (B) Phylogenetic tree constructed using core SNPs using RAxML. Numerical values in decimal represent the branch length. Longer branch length indicates higher genetic divergence.
Microorganisms 09 01761 g006
Figure 7. Phylogenetic tree based on whole genome multi-locus sequence typing (WgMLST). Dendrogram for 21 Pantoea spp. strains was constructed using assembled genome contigs. Size of stars represents the boot strap values and numbers represent the branch length. PSS is Pantoea stewartii subsp. stewartii.
Microorganisms 09 01761 g007
Table 1. Genome architecture details of Pantoea stewartii subsp. indologenes (pv. cepacicola and pv. setariae) and other Pantoea species used in this study.
Strain NamePantoea spp.Biosample AccessionGenome
Accession
Size
(Mbp)
ContigsCDSsGenestRNAs
L15 $P. agglomeransSAMN07109613GCA_003860325.14.8544456453881
LMG 24248 T$P. alliiSAMN07625522NZ_NTMH000000005.24574855492569
LMG 2632 T$Psi setariaeSAMN02905159NZ_JPKO00000000.14.68354455452165
LMG 2665 T$P. ananatisSAMN02740635NZ_JMJJ000000004.93174560463271
LMG 2715 T$P. stewartii stewartiiSAMN12697580GCA_008801695.14.5214603467773
NCPPB 1562 *Psi setariaeSAMN16866628JADWWO0000000004.87964524460277
NCPPB 1877 *Psi setariaeSAMN16866626JADWWM0000000004.77834410448776
NCPPB 2275 *Psi setariaeSAMN16866625JADWWL0000000004.77794406448174
NCPPB 2281 *Psi setariaeSAMN16866629JADWWP0000000004.701034323439975
NCPPB 2282 *Psi setariaeSAMN16866627JADWWN0000000004.871014529460878
PANS_07_10 *Psi setariaeSAMN16866621JADWWH0000000004.951024603467874
PANS_07_12 *Psi setariaeSAMN16866622JADWWI0000000004.95864602467471
PANS_07_14 *Psi setariaeSAMN16866623JADWWJ0000000004.78904429440474
PANS_07_4 *Psi setariaeSAMN16866619JADWWF0000000005.051254686476073
PANS_07_6 *Psi setariaeSAMN16866620JADWWG0000000005.101174744481671
PANS_99_15 *Psi setariaeSAMN16866624JADWWK0000000004.81974425449872
PNA_15_2 *Psi setariaeSAMN16866618JADWWE0000000004.66924266434174
PNA_03_3 *Psi cepacicolaSAMN08776223GCA_003201175.14.93224571464169
PNA_14_11 *Psi cepacicolaSAMN16866616JADWWC0000000004.68774317439072
PNA_14_12 T*Psi cepacicolaSAMN16866617JADWWD0000000004.68734307438072
PNA_14_9 *Psi cepacicolaSAMN16866615JADWWB0000000004.69924325440074
$ Sequences were downloaded from the NCBI. T Denotes type strains. * Sequences utilized from Koirala et al., 2021 study.
Table 2. List of genes with annotated function in the cluster identified in Pantoea stewartii subsp. indologenes by Pan-GWAS analysis.
Gene IDFunction *SensitivitySpecificityNaive_p
58220_pdxH_2Pyridoxal 5’-phosphate synthase751000.0059
58221_dltAAMP-binding protein751000.0059
58222_ydeEMFS transporter751000.0059
58223_pgk-tpiPhosphoglycerate kinase751000.0059
58225_spuCFAD/NAD(P)-binding protein751000.0059
58226_pepMPhosphoenolpyruvate mutase1001000.0004
58227_Hydroxypyruvate_reductaseNAD(P)-binding domain-containing protein751000.0059
58228_argC_1N-acetyl-gamma-glutamyl-phosphate reductase751000.0059
58229_lgoD_1Alcohol dehydrogenase catalytic domain-containing protein751000.0059
58230_Iron_containing_alcohol dehydrogenaseIron containing alcohol dehydrogenase751000.0059
58231_rhtC_1LysE-family-translocator751000.0059
* Gene annotation was conducted using a blast search against NR database on NCBI.
Publisher’s Note: MDPI stays neutral with regard to jurisdictional claims in published maps and institutional affiliations.

