Assessing Transcriptional Responses to Light by the Dinoflagellate Symbiodinium


Abstract

1. Introduction
2. Materials and Methods
2.1. Cell Cultures
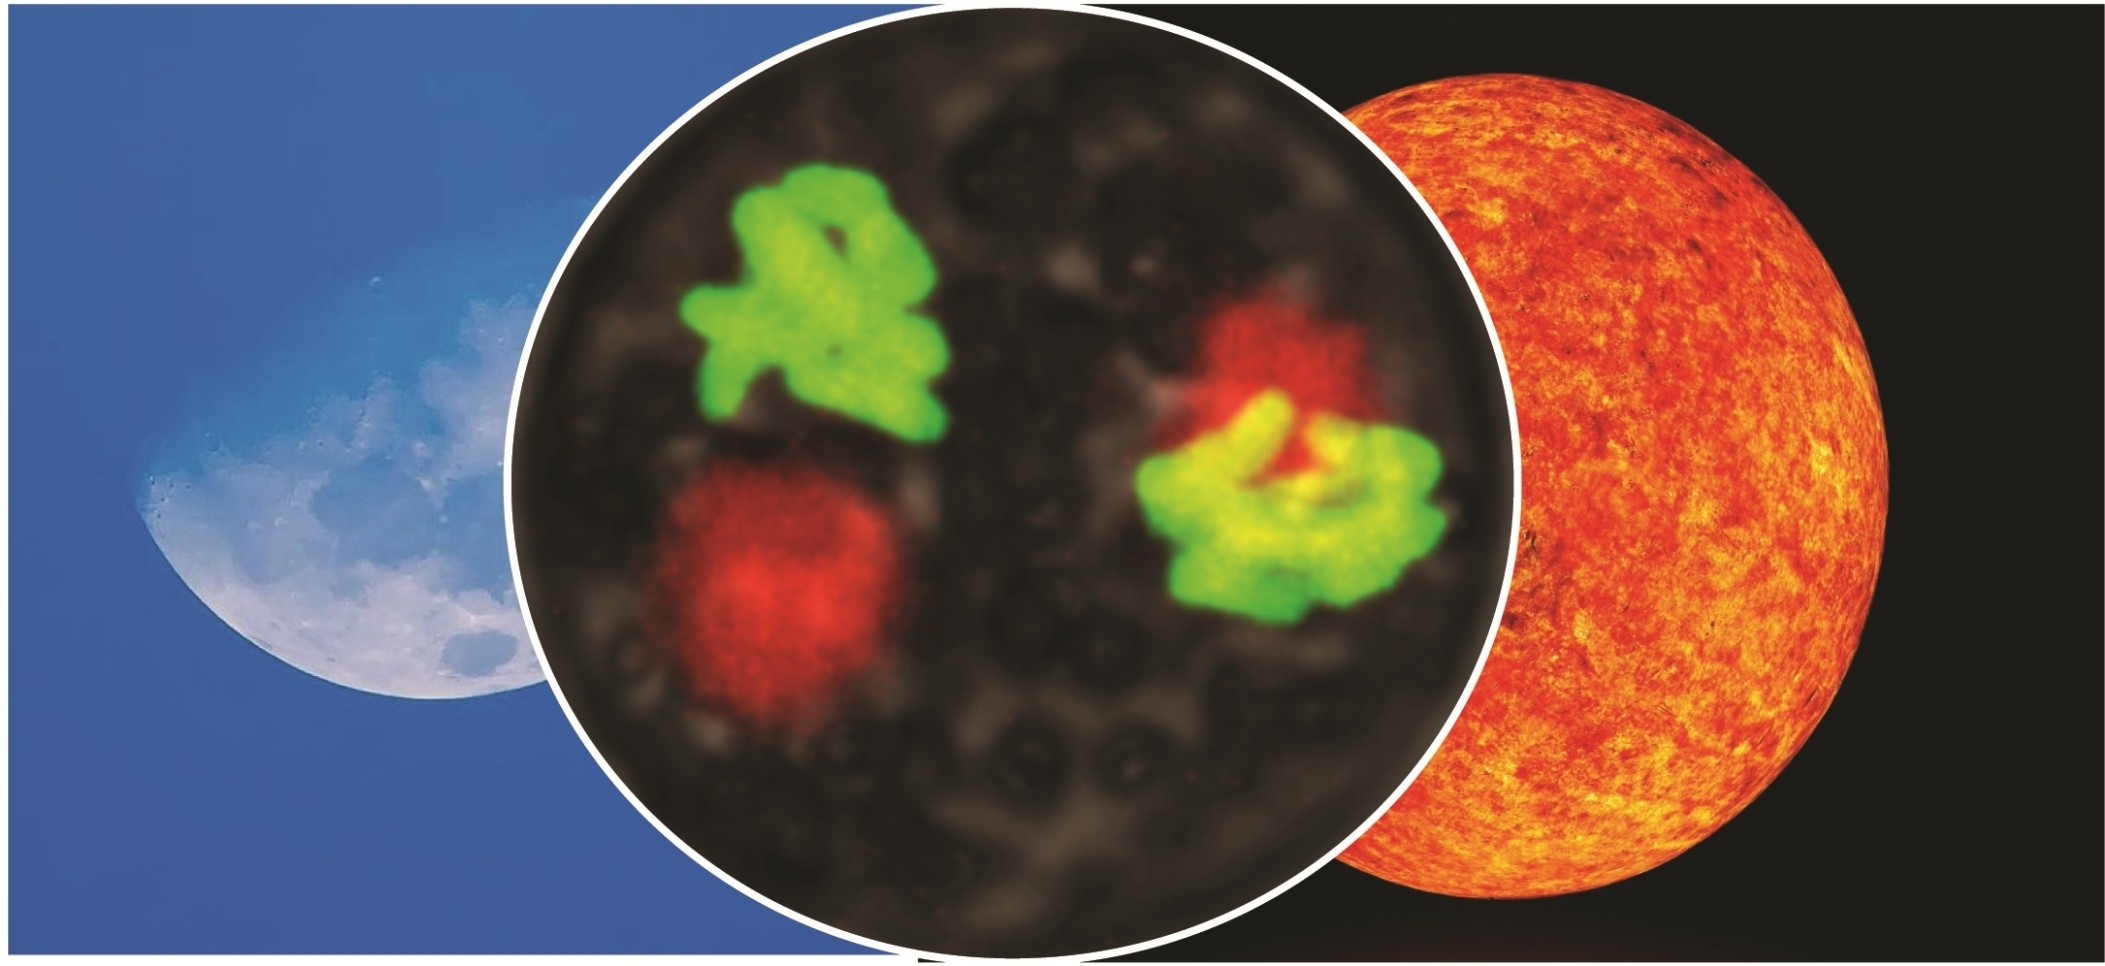
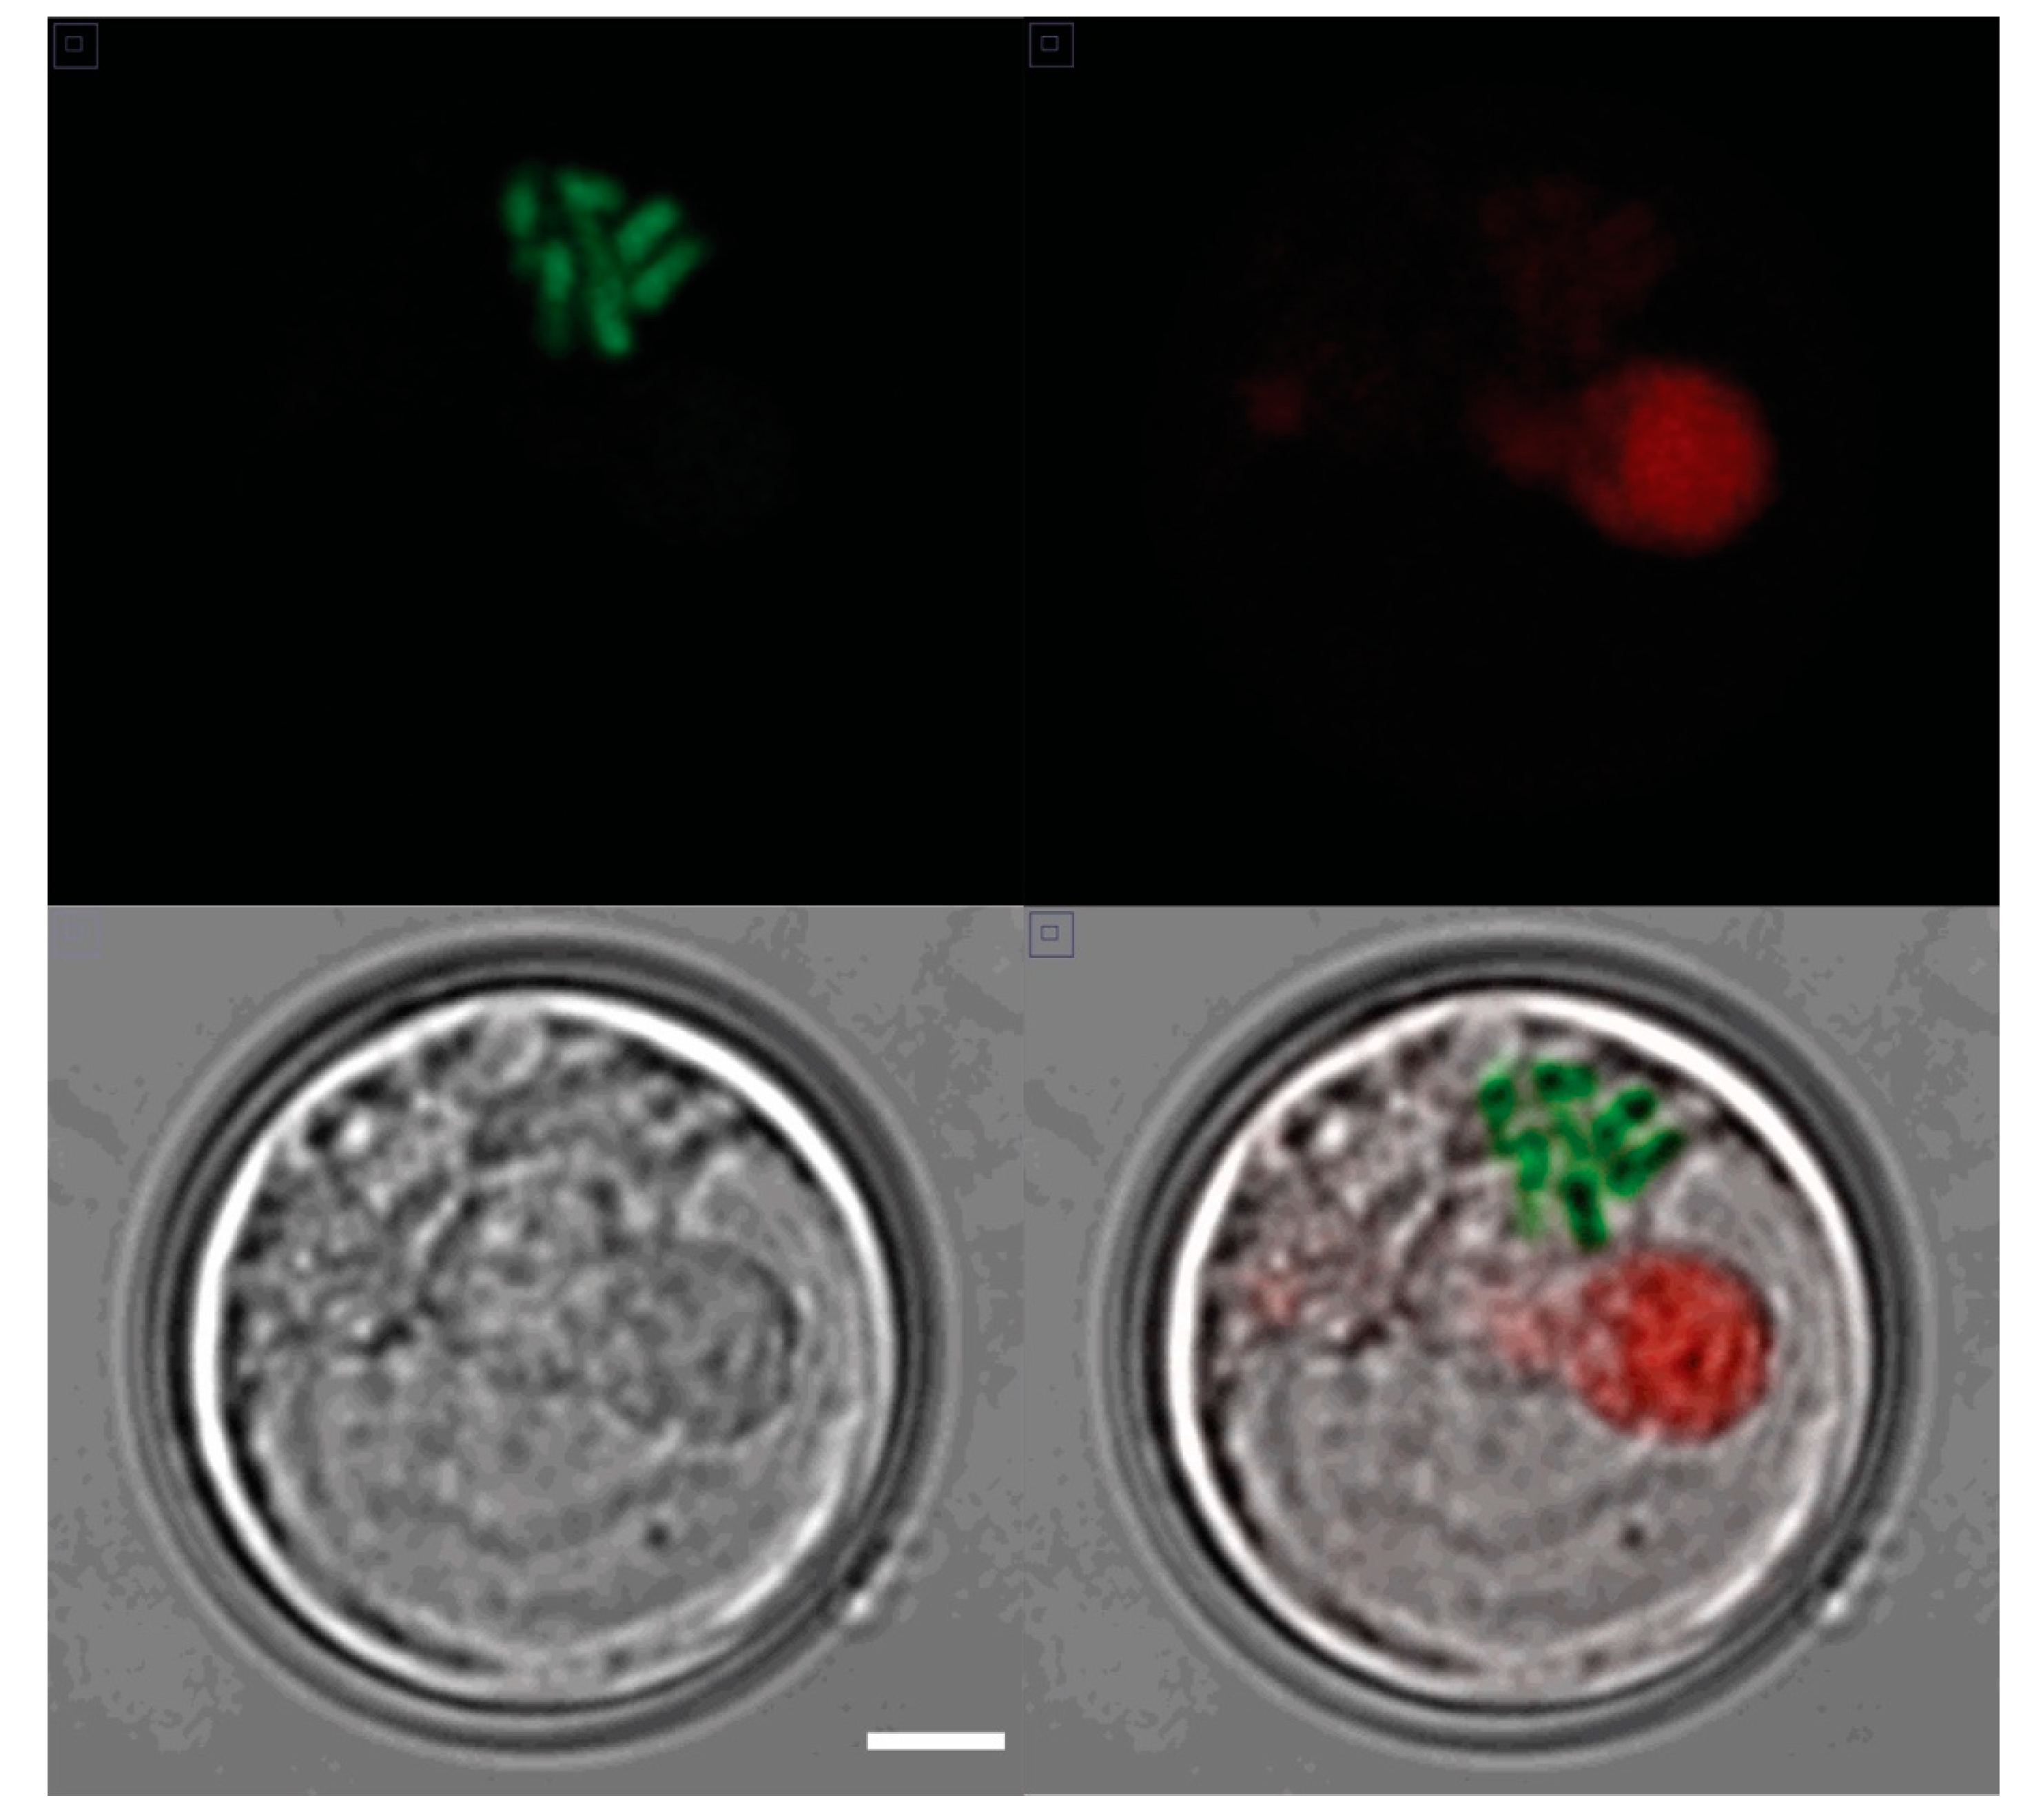
2.2. Microscopy
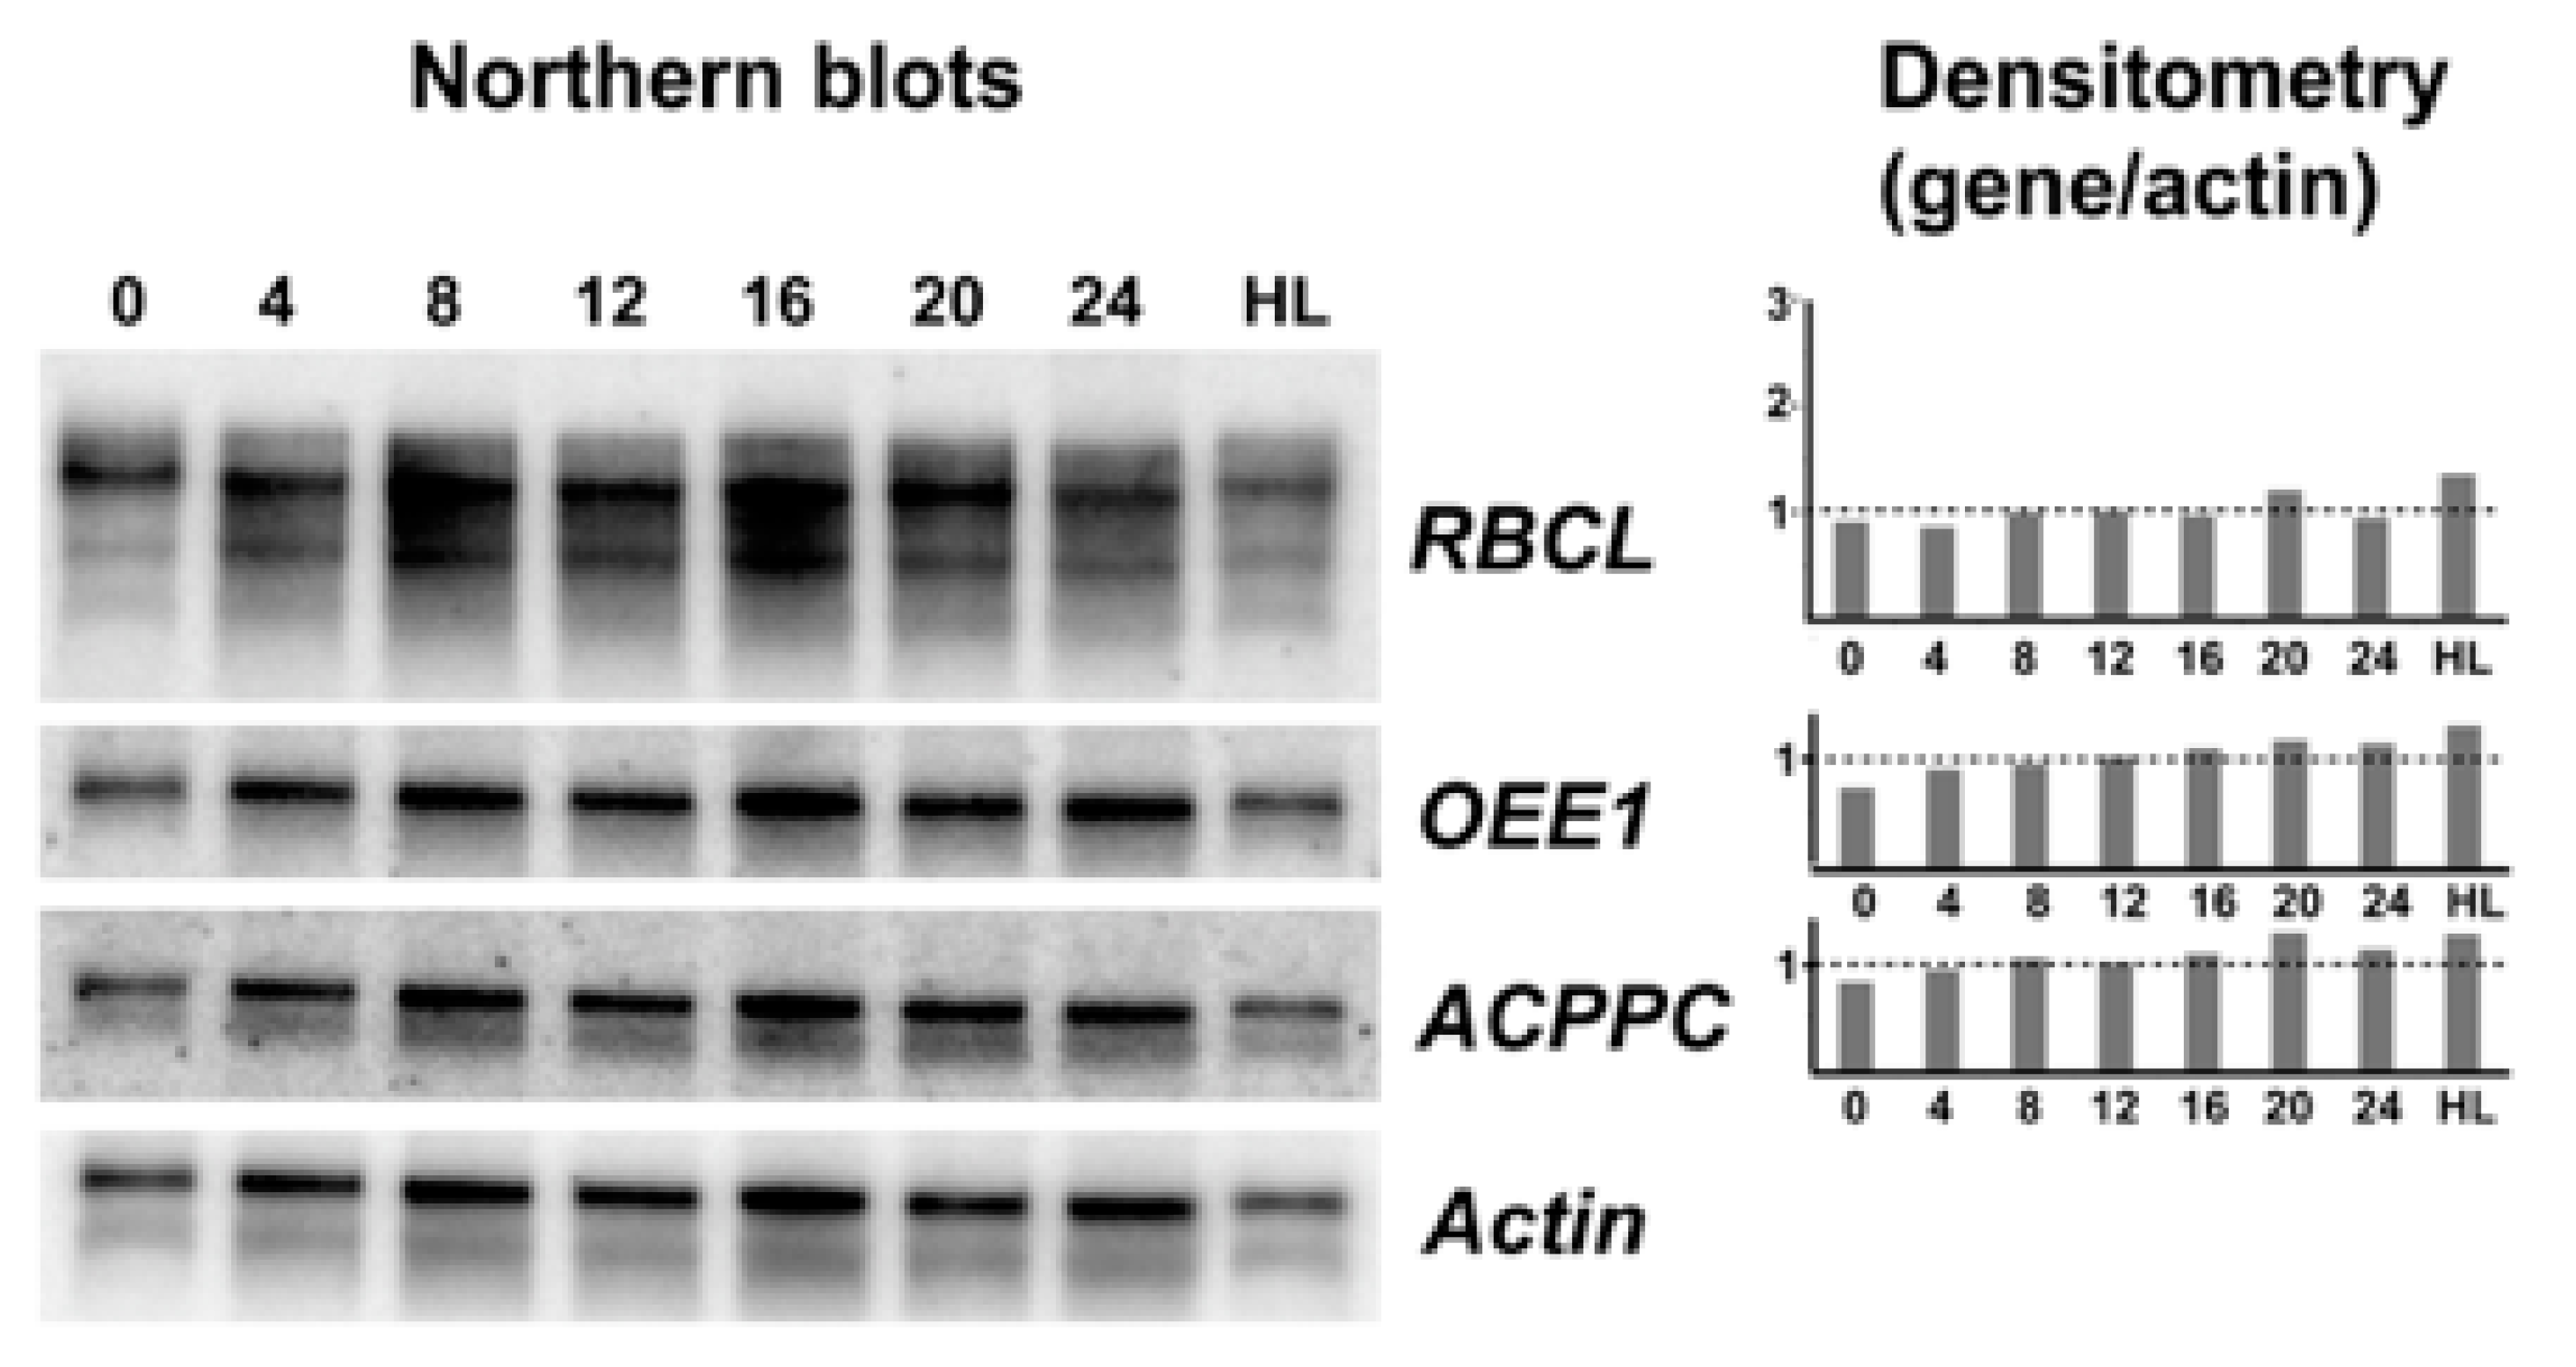
2.3. RNA Extraction and Northern Blots
2.4. RNA Sequencing
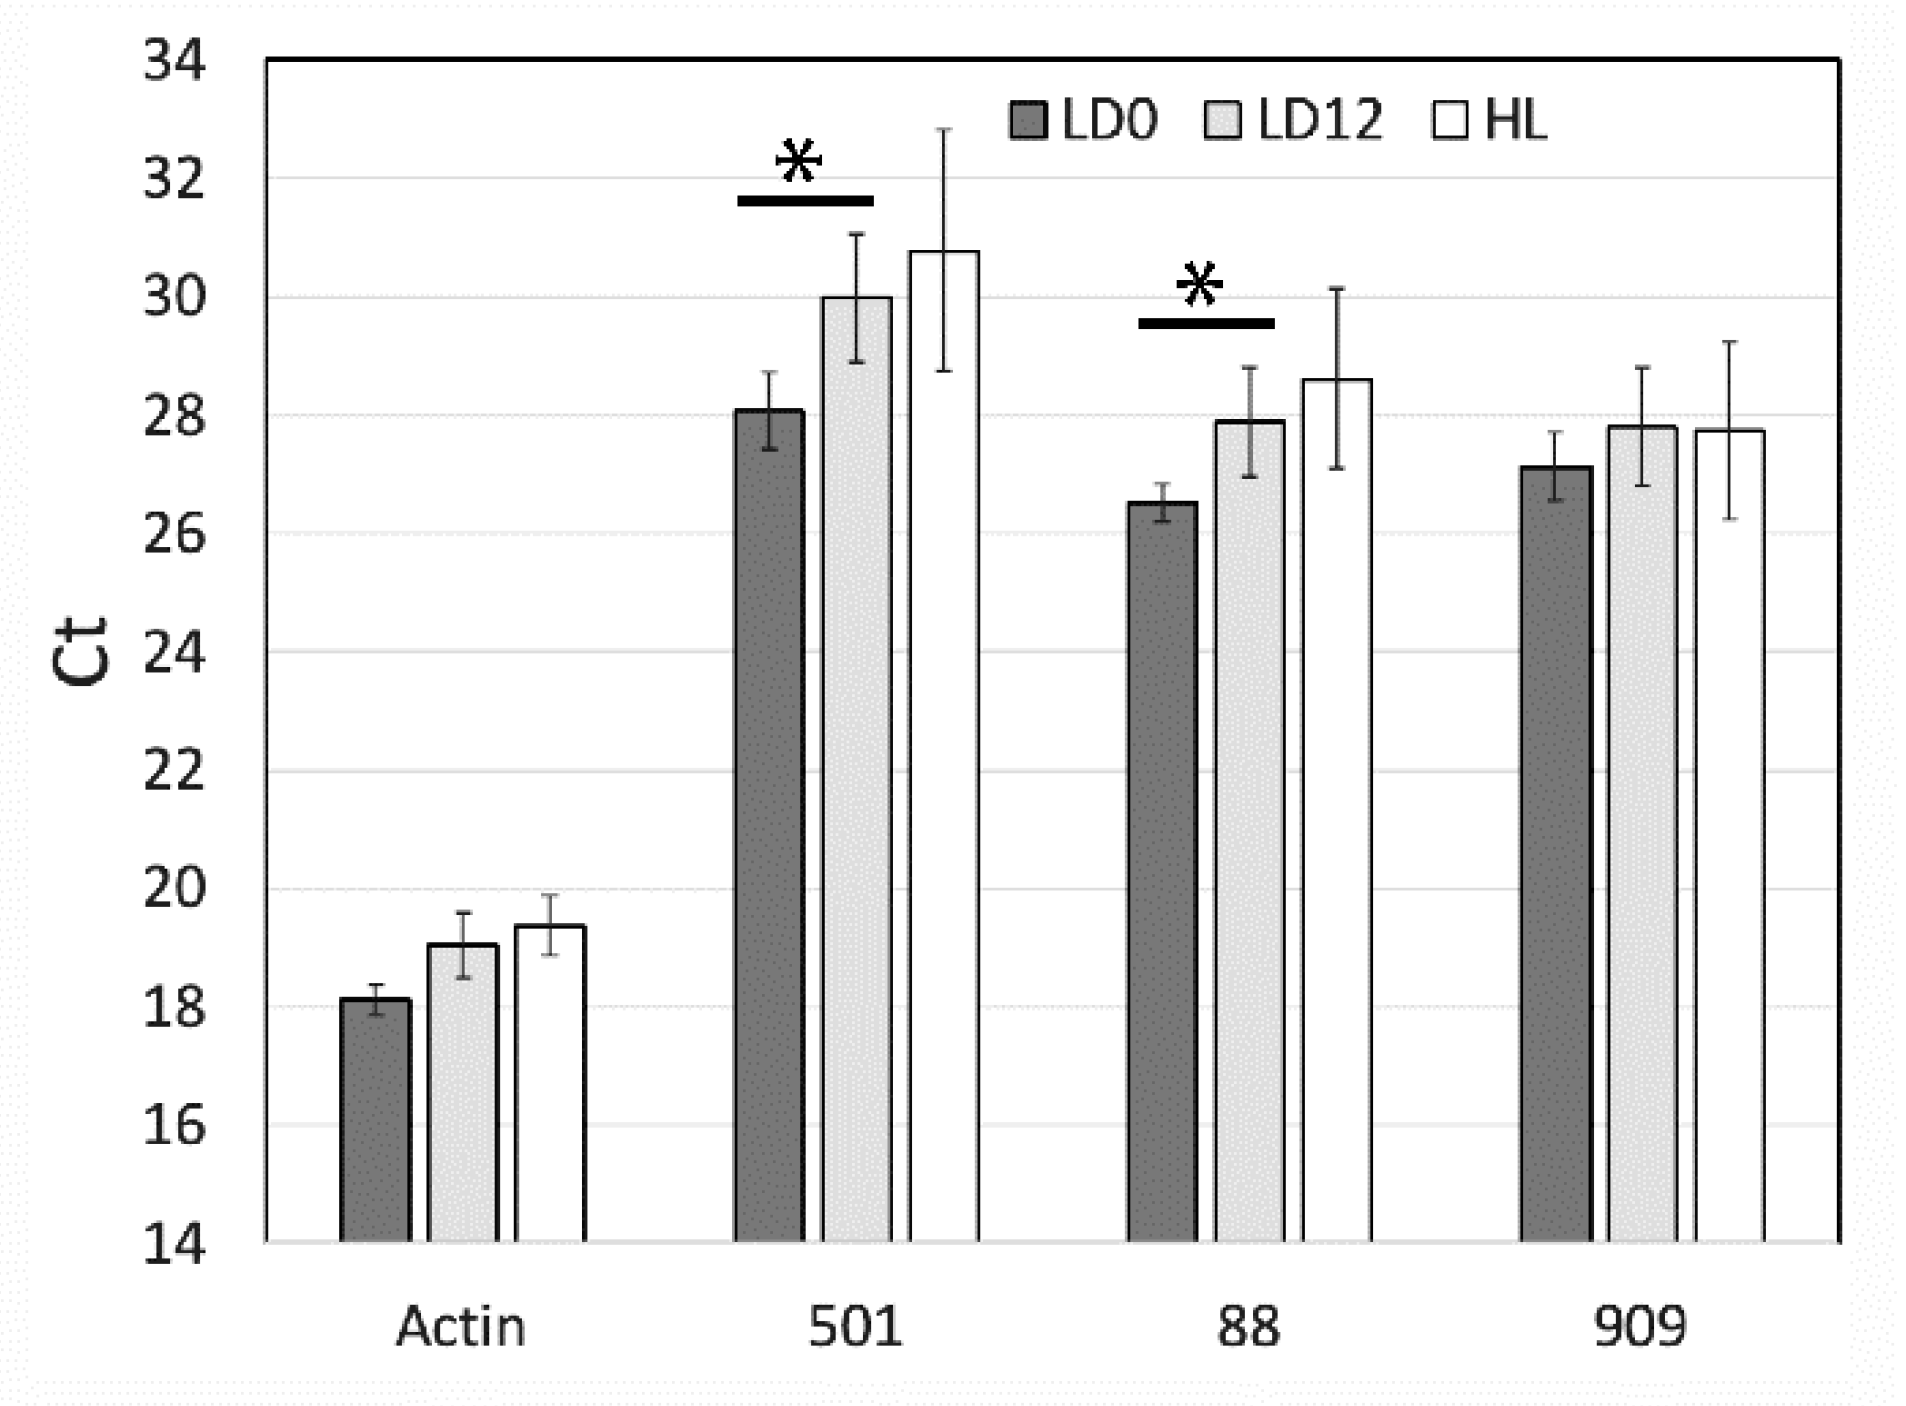
2.5. Quantitative PCR
3. Results
4. Discussion
Author Contributions
Funding
Conflicts of Interest
References
- Spector, D. Dinoflagellate nuclei; Academic Press: New York, NY, USA, 1984; pp. 107–147. [Google Scholar]
- Roy, S.; Morse, D. Transcription and maturation of mrna in dinoflagellates. Microorganisms 2013, 1, 71–99. [Google Scholar] [CrossRef] [PubMed]
- Soyer, M.O.; Haapala, O.K. Electron microscopy of rna in dinoflagellate chromosomes. Histochemistry 1974, 42, 239–246. [Google Scholar] [CrossRef] [PubMed]
- Bodansky, S.; Mintz, L.B.; Holmes, D.S. The mesokaryote gyrodinium cohnii lacks nucleosomes. Biochem. Biophys. Res. Commun. 1979, 88, 1329–1336. [Google Scholar] [CrossRef]
- Roy, S.; Morse, D. A full suite of histone and histone modifying genes are transcribed in the dinoflagellate lingulodinium. PLoS ONE 2012, 7, e34340. [Google Scholar] [CrossRef] [PubMed]
- Gornik, S.G.; Ford, K.L.; Mulhern, T.D.; Bacic, A.; McFadden, G.I.; Waller, R.F. Loss of nucleosomal DNA condensation coincides with appearance of a novel nuclear protein in dinoflagellates. Curr. Biol. 2012, 22, 2303–2312. [Google Scholar] [CrossRef] [PubMed]
- Beauchemin, M.; Morse, D. A proteomic portrait of dinoflagellate chromatin reveals abundant RNA-binding proteins. Chromosoma 2017, 127, 1–15. [Google Scholar] [CrossRef]
- Levi-Setti, R.; Gavrilov, K.L.; Rizzo, P.J. Divalent cation distribution in dinoflagellate chromosomes imaged by high-resolution ion probe mass spectrometry. Eur. J. Cell Biol. 2008, 87, 963–976. [Google Scholar] [CrossRef]
- Wong, J.T.; New, D.C.; Wong, J.C.; Hung, V.K. Histone-like proteins of the dinoflagellate crypthecodinium cohnii have homologies to bacterial DNA-binding proteins. Eukaryot Cell 2003, 2, 646–650. [Google Scholar] [CrossRef]
- Shi, X.; Li, L.; Guo, C.; Lin, X.; Li, M.; Lin, S. Rhodopsin gene expression regulated by the light dark cycle, light spectrum and light intensity in the dinoflagellate prorocentrum. Front. Microbiol. 2015, 6, 555. [Google Scholar] [CrossRef]
- Sorek, M.; Yacobi, Y.Z.; Roopin, M.; Berman-Frank, I.; Levy, O. Photosynthetic circadian rhythmicity patterns of symbiodinium, [corrected} the coral endosymbiotic algae. Proc. R Soc. B 2013, 280, 20122942. [Google Scholar] [CrossRef]
- Mayfield, A.B.; Hsiao, Y.Y.; Chen, H.K.; Chen, C.S. Rubisco expression in the dinoflagellate symbiodinium sp. Is influenced by both photoperiod and endosymbiotic lifestyle. Mar. Biotechnol. 2014, 16, 371–384. [Google Scholar] [CrossRef]
- Boldt, L.; Yellowlees, D.; Leggat, W. Measuring symbiodinium sp. Gene expression patterns with quantitative real-time pcr. In Proceedings of the 11th International Coral Reef Symposium (ICRS), Ft. Lauderdale, FL, USA, 7–11 July 2008; pp. 118–122. [Google Scholar]
- Okamoto, O.K.; Hastings, J.W. Novel dinoflagellate circadian-clock genes identified through microarray analysis of a phase shifted clock. J. Phycol. 2003, 39, 1–9. [Google Scholar] [CrossRef]
- van Dolah, F.M.; Lidie, K.B.; Morey, J.S.; Brunelle, S.A.; Ryan, J.C.; Monroe, E.A.; Haynes, B.L. Microarray analysis of diurnal and circadian regulated genes in the florida red-tide dinoflagellate karenia brevis (dinophyceae). J. Phycol. 2007, 43, 741–752. [Google Scholar] [CrossRef]
- Baumgarten, S.; Bayer, T.; Aranda, M.; Liew, Y.J.; Carr, A.; Micklem, G.; Voolstra, C.R. Integrating microrna and mrna expression profiling in symbiodinium microadriaticum, a dinoflagellate symbiont of reef-building corals. BMC Genom. 2013, 14, 704. [Google Scholar] [CrossRef]
- Xiang, T.; Nelson, W.; Rodriguez, J.; Tolleter, D.; Grossman, A.R. Symbiodinium transcriptome and global responses of cells to immediate changes in light intensity when grown under autotrophic or mixotrophic conditions. Plant. J. 2015, 82, 67–80. [Google Scholar] [CrossRef] [PubMed]
- Roy, S.; Beauchemin, M.; Dagenais-Bellefeuille, S.; Letourneau, L.; Cappadocia, M.; Morse, D. The lingulodinium circadian system lacks rhythmic changes in transcript abundance. BMC Biol. 2014, 12, 107. [Google Scholar] [CrossRef]
- Lin, S.; Cheng, S.; Song, B.; Zhong, X.; Lin, X.; Li, W.; Li, L.; Zhang, Y.; Zhang, H.; Ji, Z.; et al. The symbiodinium kawagutii genome illuminates dinoflagellate gene expression and coral symbiosis. Science 2015, 350, 691–694. [Google Scholar] [CrossRef] [PubMed]
- Guillard, R.R.L.; Ryther, J.H. Studies on marine planktonic diatoms: Cyclotella nana hufstedt and denotula confervacea (cleve) gran. Can. J. Microbiol. 1962, 8, 229–239. [Google Scholar] [CrossRef] [PubMed]
- LaJeunesse, T.C.; Parkinson, J.E.; Gabrielson, P.W.; Jeong, H.J.; Reimer, J.D.; Voolstra, C.R.; Santos, S.R. Systematic revision of symbiodiniaceae highlights the antiquity and diversity of coral endosymbionts. Curr. Biol. 2018, 28, 2570–2580. [Google Scholar] [CrossRef]
- Schindelin, J.; Arganda-Carreras, I.; Frise, E.; Kaynig, V.; Longair, M.; Pietzsch, T.; Preibisch, S.; Rueden, C.; Saalfeld, S.; Schmid, B.; et al. Fiji: An open-source platform for biological-image analysis. Nat. Methods 2012, 9, 676–682. [Google Scholar] [CrossRef]
- Beauchemin, M.; Roy, S.; Daoust, P.; Dagenais-Bellefeuille, S.; Bertomeu, T.; Letourneau, L.; Lang, B.F.; Morse, D. Dinoflagellate tandem array gene transcripts are highly conserved and not polycistronic. Proc. Natl. Acad. Sci. USA 2012, 109, 15793–15798. [Google Scholar] [CrossRef] [PubMed]
- Patro, R.; Duggal, G.; Love, M.I.; Irizarry, R.A.; Kingsford, C. Salmon provides fast and bias-aware quantification of transcript expression. Nat. Methods 2017, 14, 417–419. [Google Scholar] [CrossRef] [PubMed]
- Anders, S.; Huber, W. Differential expression analysis for sequence count data. Genome Biol. 2010, 11, R106. [Google Scholar] [CrossRef] [PubMed]
- Palozola, K.C.; Donahue, G.; Liu, H.; Grant, G.R.; Becker, J.S.; Cote, A.; Yu, H.; Raj, A.; Zaret, K.S. Mitotic transcription and waves of gene reactivation during mitotic exit. Science 2017, 358, 119–122. [Google Scholar] [CrossRef] [PubMed]
- Benjamini, Y.; Hochberg, Y. Controlling the fasle discovery rate: A practical and powerful approach to multiple testing. J. R. Statist. Soc. B 1995, 57, 289–300. [Google Scholar]
- Rocke, D.M.; Ruan, L.; Zhang, Y.; Gossett, J.J.; Durbin-Johnson, B.; Aviran, S. Excess false positive rates in methods for differential gene expression analysis using rna-seq data. Biorxiv 2015. [Google Scholar] [CrossRef]
- Barshis, D.J.; Ladner, J.T.; Oliver, T.A.; Palumbi, S.R. Lineage-specific transcriptional profiles of Symbiodinium spp. Unaltered by heat stress in a coral host. Mol. Biol. Evol. 2014, 31, 1343–1352. [Google Scholar] [CrossRef]
- Gierz, S.L.; Foret, S.; Leggat, W. Transcriptomic analysis of thermally stressed Symbiodinium reveals differential expression of stress and metabolism genes. Front. Plant sci. 2017, 8, 271. [Google Scholar] [CrossRef]
- Roy, S.; Letourneau, L.; Morse, D. Cold-induced cysts of the photosynthetic dinoflagellate Lingulodinium polyedrum have an arrested circadian bioluminescence rhythm and lower levels of protein phosphorylation. Plant Physiol. 2014, 164, 966–977. [Google Scholar] [CrossRef]
- Cooper, J.T.; Sinclair, G.A.; Wawrik, B. Transcriptome analysis of Scrippsiella trochoidea CCMP 3099 reveals physiological changes related to nitrate depletion. Front Microbiol. 2016, 7, 639. [Google Scholar] [CrossRef]
- Moustafa, A.; Evans, A.N.; Kulis, D.M.; Hackett, J.D.; Erdner, D.L.; Anderson, D.M.; Bhattacharya, D. Transcriptome profiling of a toxic dinoflagellate reveals a gene-rich protist and a potential impact on gene expression due to bacterial presence. PLoS ONE 2010, 5, e9688. [Google Scholar] [CrossRef] [PubMed]
- Lowe, C.D.; Mello, L.V.; Samatar, N.; Martin, L.E.; Montagnes, D.J.; Watts, P.C. The transcriptome of the novel dinoflagellate Oxyrrhis marina (alveolata: Dinophyceae): Response to salinity examined by 454 sequencing. BMC Genom. 2011, 12, 519. [Google Scholar] [CrossRef] [PubMed]
- Morey, J.S.; Monroe, E.A.; Kinney, A.L.; Beal, M.; Johnson, J.G.; Hitchcock, G.L.; van Dolah, F.M. Transcriptomic response of the red tide dinoflagellate, Karenia brevis, to nitrogen and phosphorus depletion and addition. BMC Genom. 2011, 12, 346. [Google Scholar] [CrossRef] [PubMed]


| Gene ID | Best BLAST Hit | E-Value | Fold Change |
|---|---|---|---|
| SymkaALLUN26766 | aminomethyl transferase family protein [Halobellus limi] | 1.6 | 0.33 |
| SymkaALLUN13501 | putative alanine aminotransferase, mitochondrial | 3 × 10⁻¹³ | 0.23 |
| SymkaALLUN70319 | Hypothetical | 9.7 | 0.24 |
| SymkaALLUN19088 | putative E3 ubiquitin-protein ligase HERC1 | 2 × 10⁻²¹ | 0.2 |
| SymkaALLUN64909 | LysM domain-containing protein | 2.9 | 0.3 |
| SymkaALLUN23766 | No Sig Hits | - | 0.3 |
| SymkaALLUN19996 | No Sig hits | - | 0.29 |
| Species | Method | Comparisons | Replicates | FDR | p-Value | DEG | Reference |
|---|---|---|---|---|---|---|---|
| S. kawagutii | Illumina/DESeq2 | LD0/LD12 | 3 | 0.05 | 1 | This study | |
| Illumina/DESeq2 | LD0/LD12 | 3 | 0.1 | 7 | This study | ||
| Illumina/DESeq2 | LD0/LD12 | 3 | <0.05 | 789 | This study | ||
| Illumina/DESeq2 | LD0/LD12 | 1 | 0.1 | 55 | This study | ||
| S. microadriaticum | Illumina/DESeq | LD0/LD12 | 1 | 0.1 | 67 | [16] | |
| Illumina/DESeq | Normal/4 h 4 °C | 1 | 0.1 | 119 | [16] | ||
| Illumina/DESeq | Normal/4 h 36 °C | 1 | 0.1 | 2465 | [16] | ||
| Illumina/DESeq | Normal/12 h 34 °C | 1 | 0.1 | 246 | [16] | ||
| Illumina/DESeq | Normal/4 h 20 g/L NaCl | 1 | 0.1 | 138 | [16] | ||
| Illumina/DESeq | Normal/4 h 60 g/L NaCl | 1 | 0.1 | 48 | [16] | ||
| Symbiodinium SSB01 | Illumina/DESeq | Light/24 h dark | 3 | <0.05 | 1334 | [17] | |
| Symbiodinium | Illumina/DESeq | 29.2 °C/3 d 31.9 °C | 2 | 0.05 | 0 | [29] | |
| Illumina/DESeq | 29.2 °C/3 d 31.9 °C | 2 | <0.05 | 541 | [29] | ||
| Symbiodinium sp | Illumina/Student’s t test | Normal/4 d 31 °C | 5 | 0.05 | 9471 | [30] | |
| Illumina/Student’s t test | Normal/19 d 31 °C | 5 | 12,701 | [30] | |||
| Illumina/Student’s t test | Normal/28 d 31 °C | 5 | 13,269 | [30] | |||
| Lingulodinium polyedra | Illumina/DESeq | Normal/1 d 4 °C | 1 | 0.05 | 132 | [31] | |
| Lingulodinium polyedra | Illumina/DESeq | LD6/LD18 | 1 | 0.05 | 5 | [18] | |
| Scrippsiella trochoidea | Illumina/DESeq | Normal/N-limited | 1 | 0.1 | 382 | [32] | |
| Illumina/DESeq | Normal/P-limited | 1 | 0.1 | 17 | [32] | ||
| Alexandrium tamarense | MPSS/Fisher’s exact test | Normal/N-limited | 1 | <1 × 10⁻¹⁰ | 20 | [33] | |
| MPSS/Fisher’s exact test | Normal/P-limited | 1 | <1 × 10⁻¹⁰ | 30 | [33] | ||
| MPSS/Fisher’s exact test | Normal/Xenic | 1 | <1 × 10⁻¹⁰ | 505 | [33] | ||
| Oxyrrhis marina | 454/Fisher’s exact test | 30/50 practical saline units | 1 | <0.05 | 29 | [34] | |
| Karenia brevis | Microarray | Normal/N-limited | 3 | <0.0001 | 456 | [35] | |
| Microarray | Normal/P-limited | 3 | <0.0001 | 425 | [35] |
© 2019 by the authors. Licensee MDPI, Basel, Switzerland. This article is an open access article distributed under the terms and conditions of the Creative Commons Attribution (CC BY) license (http://creativecommons.org/licenses/by/4.0/).
Share and Cite
Zaheri, B.; Dagenais-Bellefeuille, S.; Song, B.; Morse, D. Assessing Transcriptional Responses to Light by the Dinoflagellate Symbiodinium. Microorganisms 2019, 7, 261. https://doi.org/10.3390/microorganisms7080261
Zaheri B, Dagenais-Bellefeuille S, Song B, Morse D. Assessing Transcriptional Responses to Light by the Dinoflagellate Symbiodinium. Microorganisms. 2019; 7(8):261. https://doi.org/10.3390/microorganisms7080261
Chicago/Turabian StyleZaheri, Bahareh, Steve Dagenais-Bellefeuille, Bo Song, and David Morse. 2019. "Assessing Transcriptional Responses to Light by the Dinoflagellate Symbiodinium" Microorganisms 7, no. 8: 261. https://doi.org/10.3390/microorganisms7080261
APA StyleZaheri, B., Dagenais-Bellefeuille, S., Song, B., & Morse, D. (2019). Assessing Transcriptional Responses to Light by the Dinoflagellate Symbiodinium. Microorganisms, 7(8), 261. https://doi.org/10.3390/microorganisms7080261