1. Introduction
Piezoelectric stack actuators (PESAs) are compact with a fast response and a high position resolution and can generate large forces. PESA-equipped applications include camera autofocus and image stabilization systems [
1,
2], vibration damping actuators [
3], fast steering mirrors and prisms [
4], micro manipulators [
5], and inkjet printers [
6].
A feedback controller with a high controller gain is used to compensate for positioning errors caused by PESA hysteresis [
1,
2,
3,
7]. Increasing the gain of the controller improves the responsiveness and accuracy but reduces the stability margin and robustness of the system. A high-order linear filter is sometimes used in the feedback controller to cancel the resonances that cause control instability [
4]. However, this method is vulnerable to changes in dynamics and can be easily destabilized. Feed-forward control using an inverse model of the PESA’s voltage displacement hysteresis curve has been applied to the open-loop drive of PESAs [
8,
9,
10]. Most hysteresis models are based on limited driving conditions such as amplitude, driving speed, preload, and temperature. The model cannot simulate the responses correctly under driving conditions different from those modeled. In addition, this method has a high computational cost and is difficult to apply to highly responsive applications.
To improve the linearity of a PESA’s drive, charge control has been proposed. A Sawyer–Tower circuit, an external circuit based on the equivalent circuit of the PESA, needs to be designed in order to build a charge control system [
11,
12,
13]. However, the model parameters of the equivalent circuit depend on the driving frequency, amplitude, and temperature, and it is difficult to identify them accurately for various conditions.
Changes in the voltage displacement characteristics of a PESA due to the temperature variation when a voltage is input quasi-statically have been reported [
14,
15]. However, there are no reports on the hysteresis characteristics, and frequency characteristics during large-amplitude, high-frequency, and continuous driving, where heat generation, which cannot be dealt with by natural heat dissipation, is a problem [
16]. In addition, it has been reported that the response characteristics and positioning accuracy change with increasing temperature in positioning systems that combine a PESA and feedback control [
17].
From the above, it is clear that variations in the dynamic characteristics of PESAs need to be reduced. To realize a high-frequency, large-amplitude, and continuously driven PESA, we propose a forced liquid cooling method using silicone oil as the coolant. This method features high insulation and heat transfer properties, and we verified that its use could prevent damage to the protective film and the loss of piezoelectricity due to the fact of self-heating [
18].
In this paper, we verified whether reducing the temperature change in a PESA using this cooling method can prevent variations in the dynamic characteristics of the PESA. Specifically, we evaluated how the voltage displacement and charge displacement curves at high frequency, the frequency response of the voltage displacement transfer function, and the impedance of the PESA changed when the temperature fluctuations in the PESA were reduced by applying forced liquid cooling. In
Section 2, we explain the experimental method and describe the specific experimental system.
Section 3 presents the differences between the voltage displacement and charge displacement curves of a PESA with and without forced liquid cooling.
Section 4 presents the difference between the frequency responses of the voltage displacement transfer function with and without forced liquid cooling.
2. Experimental Method
The forced liquid cooling proposed in our previous paper exerts a cooling effect ten times greater than that of natural heat dissipation [
18]. It enables PESAs to be continuously driven with large amplitudes and at high frequencies. The operating temperature with natural heat dissipation imposes limits on this. In this study, to compare the dynamic characteristics with natural heat dissipation and with forced liquid cooling, we measured the voltage/charge displacement hysteresis curves during high-frequency driving. Moreover, we measured the frequency response of the voltage displacement transfer function with and without forced liquid cooling.
Table 1 and
Table 2 present the specifications for the PESA and the silicone oil used in this experiment, respectively.
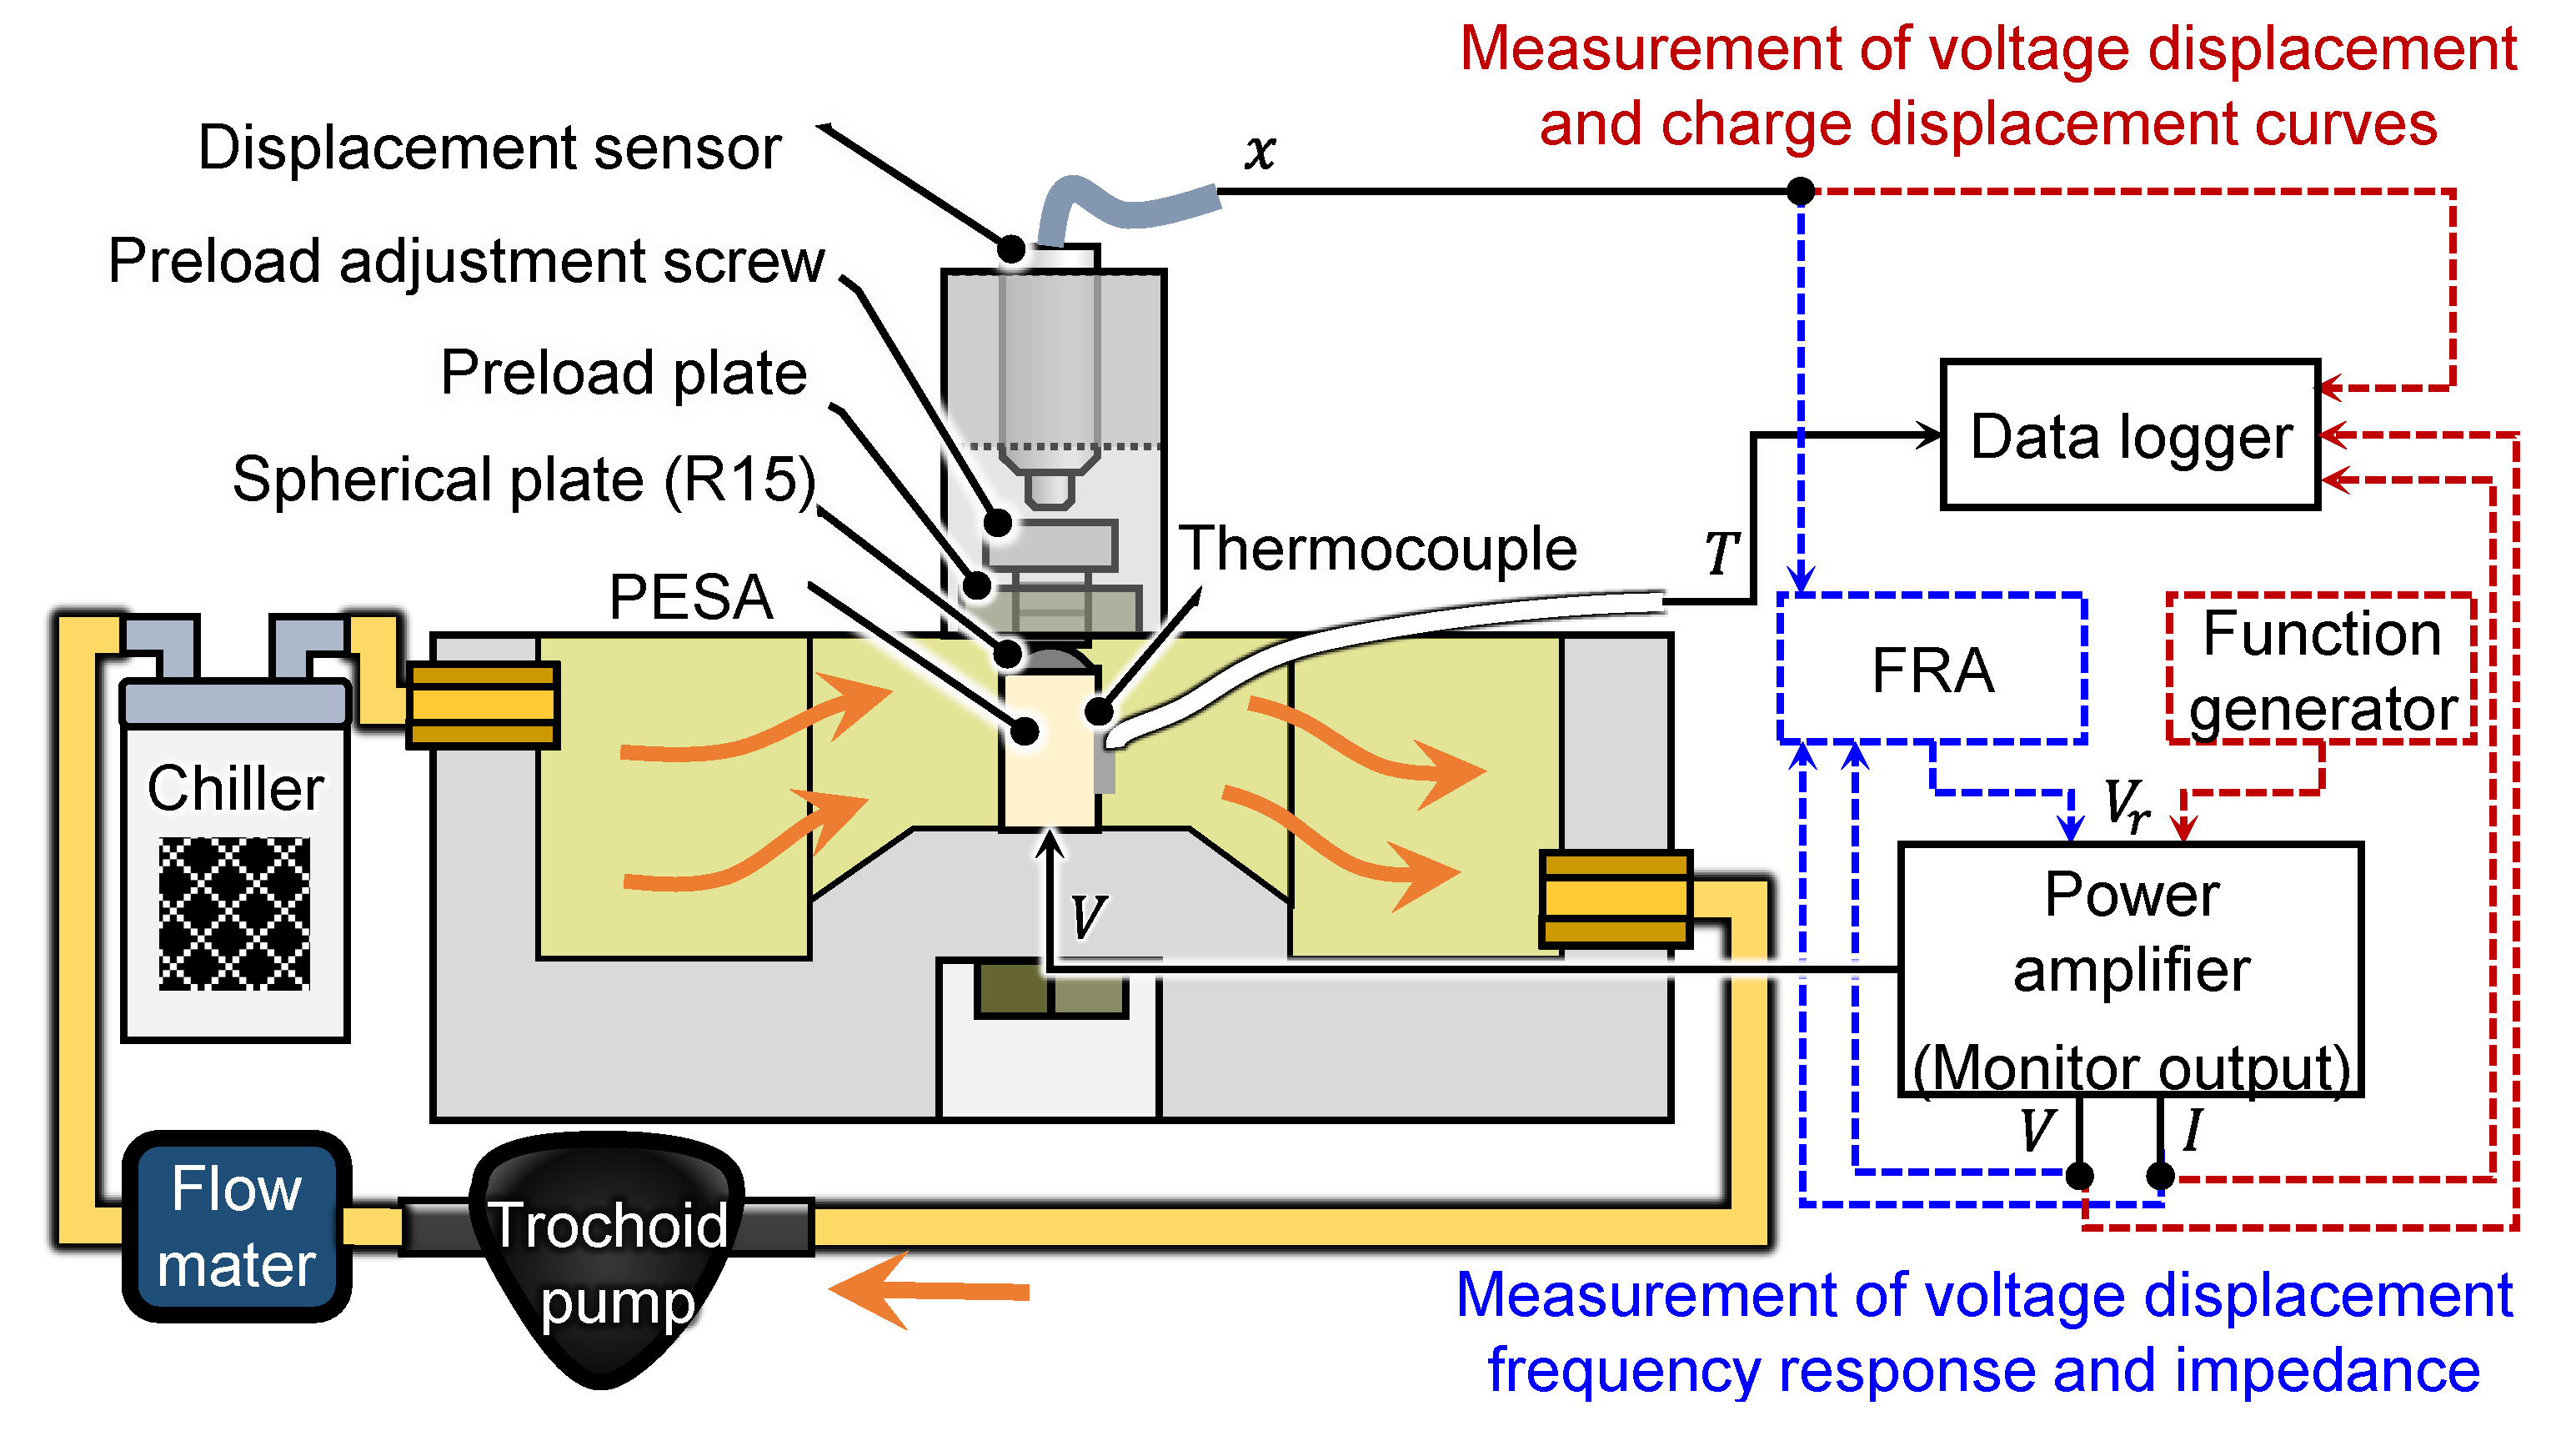
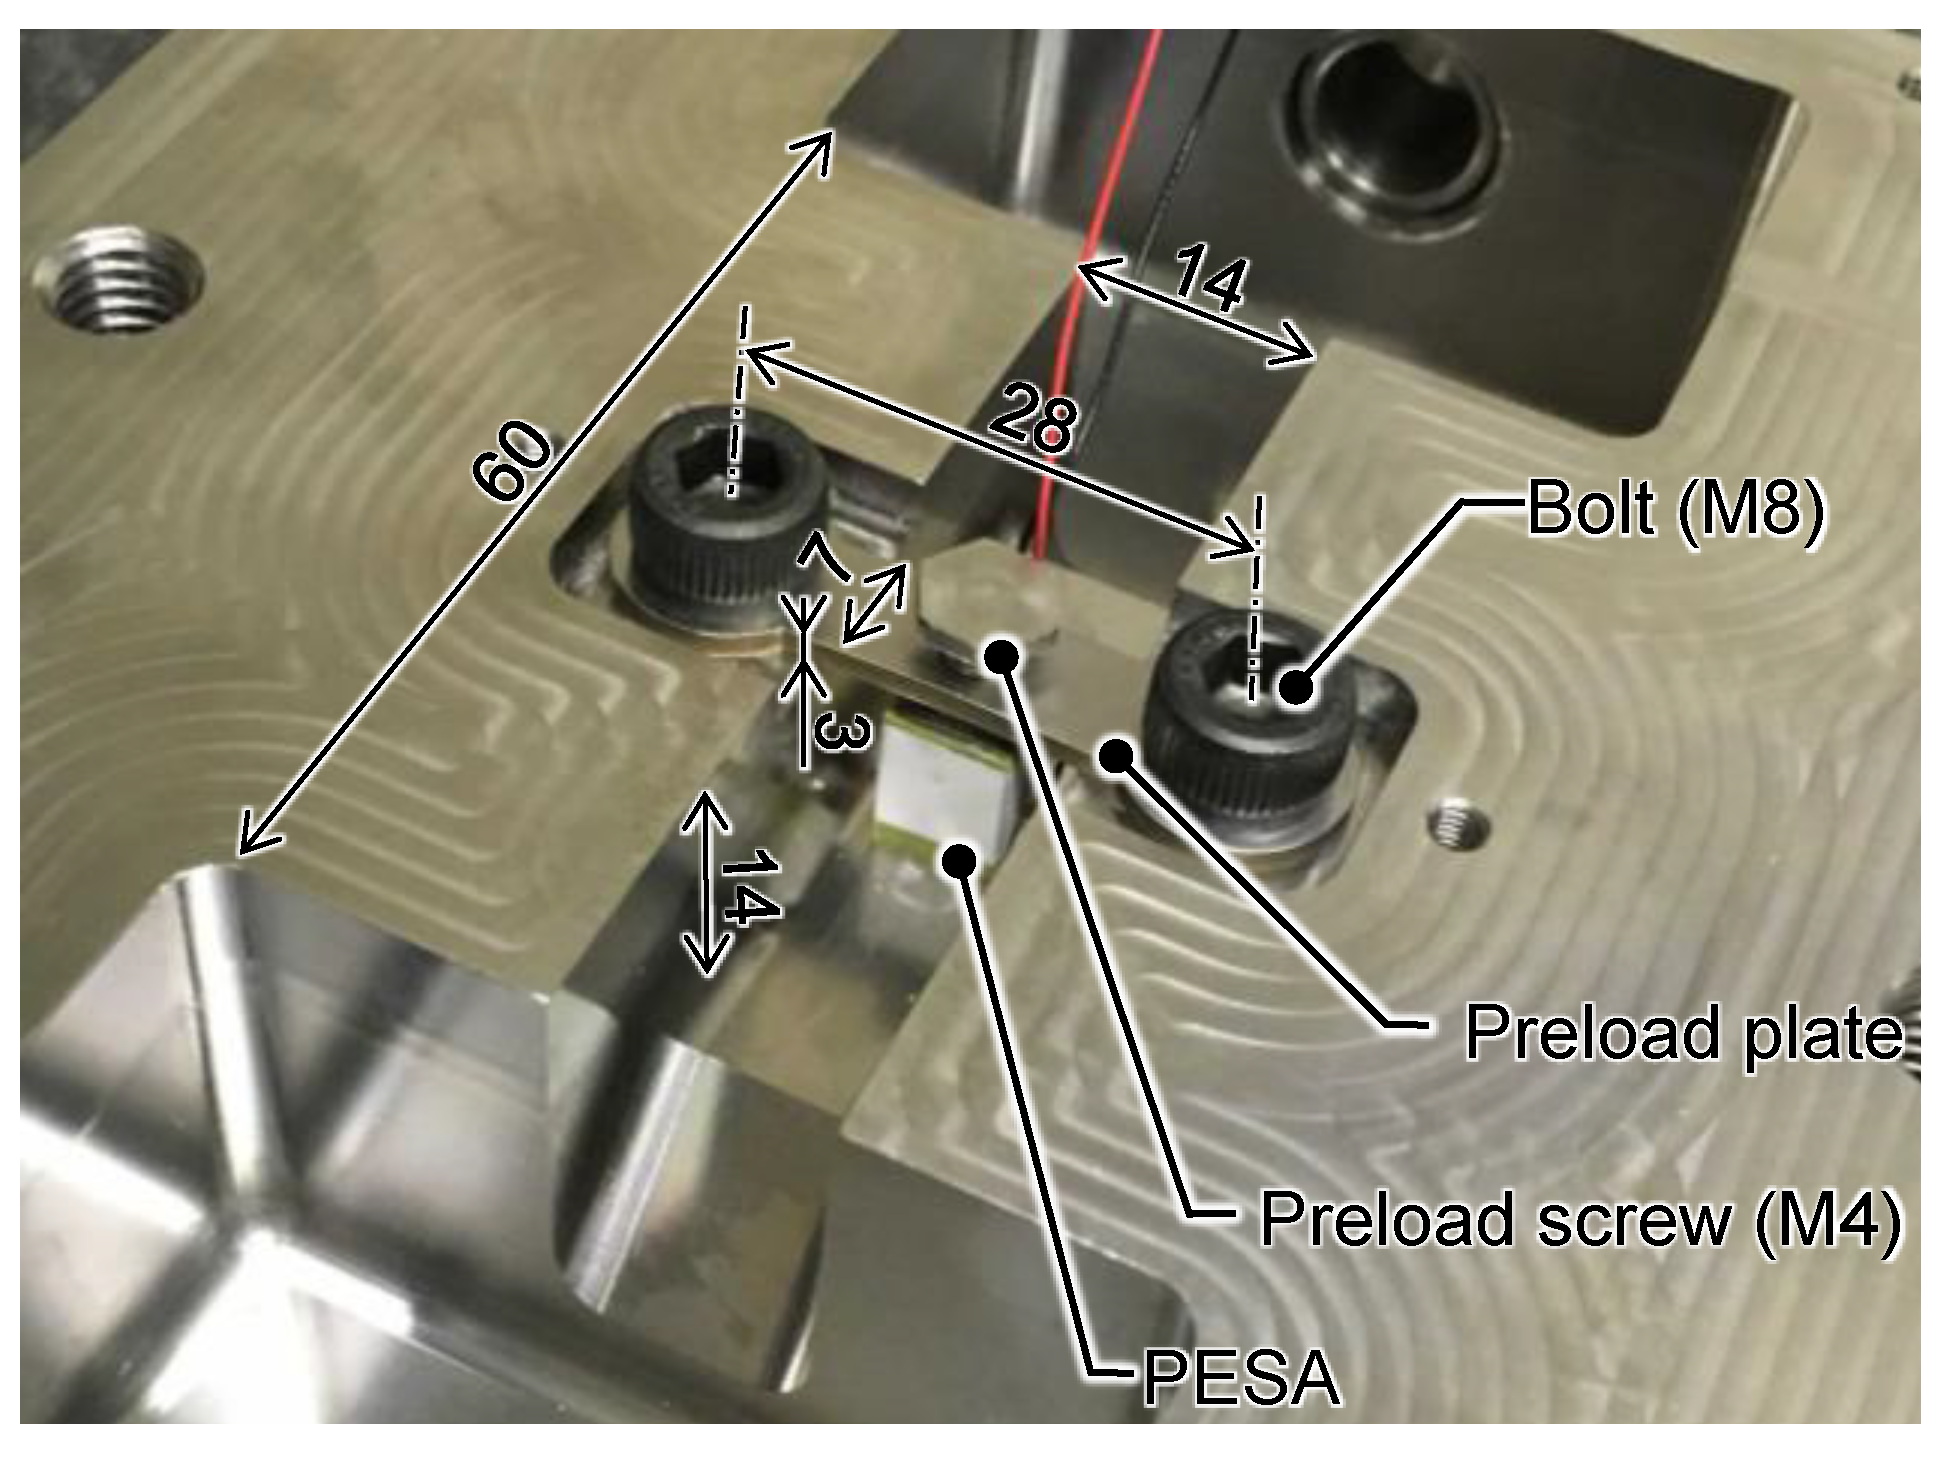
Figure 1 displays the configuration of the experimental system for the forced liquid cooling of the PESA. In this setup, the surface temperature, displacement, and electrical characteristics of the preloaded PESA were measured. To measure the temperature, a K-type thermocouple was attached to the center of the PESA surface, facing away from the flow. A capacitive displacement sensor (5504, MicroSense, range: ±25 µm/±10 V, bandwidth: 100 kHz) measured the displacement of the PESA. The silicone oil was circulated through the channel in the preload structure with a trochoid pump rotating at 1800 rpm (TOP-20HT, Nippon Oil Pump, maximum discharge rate: 2.7 L at 1800 rpm). The silicone oil was warmed by frictional heat generated in the pump, and the heat of the PESA was cooled to the range of 16~20 °C by a thermostatically controlled chiller (LTC-450α, As One, cooling capacity: 450 W).
When measuring the hysteresis, a sinusoidal reference voltage () with a constant frequency and amplitude from a function generator (WF1948, NF) was transmitted through a power amplifier (BP4620, NF) and applied to the PESA. The displacement , the input voltage , and the current of the PESA were recorded by a data logger (midi LOGGERGL900, GRAPHTEC). When measuring the frequency response characteristics, a frequency response analyzer (FRA5014, NF) output a reference voltage and measured the displacement and current to analyze the frequency response of the transfer function (=) and the impedance (=).
In general, PESAs are easily damaged by shear and tensile forces; thus, a preload of 85 N was applied to the PESA using a screw when not charged at room temperature. A spherical plate was placed between the screw and the PESA, according to the manufacturer’s recommendation, because the non-uniform distribution of the preload to the upper surface of the PESA can cause shear forces. According to finite element analysis, the first natural frequency of the designed preload structure with the flow channel was 20.3 kHz, with a second mode at 25.9 kHz.
Figure 2 presents the prototype of the PESA and the preload structure.
3. Voltage Displacement and Charge Displacement Curves of the PESA with/without Forced Liquid Cooling
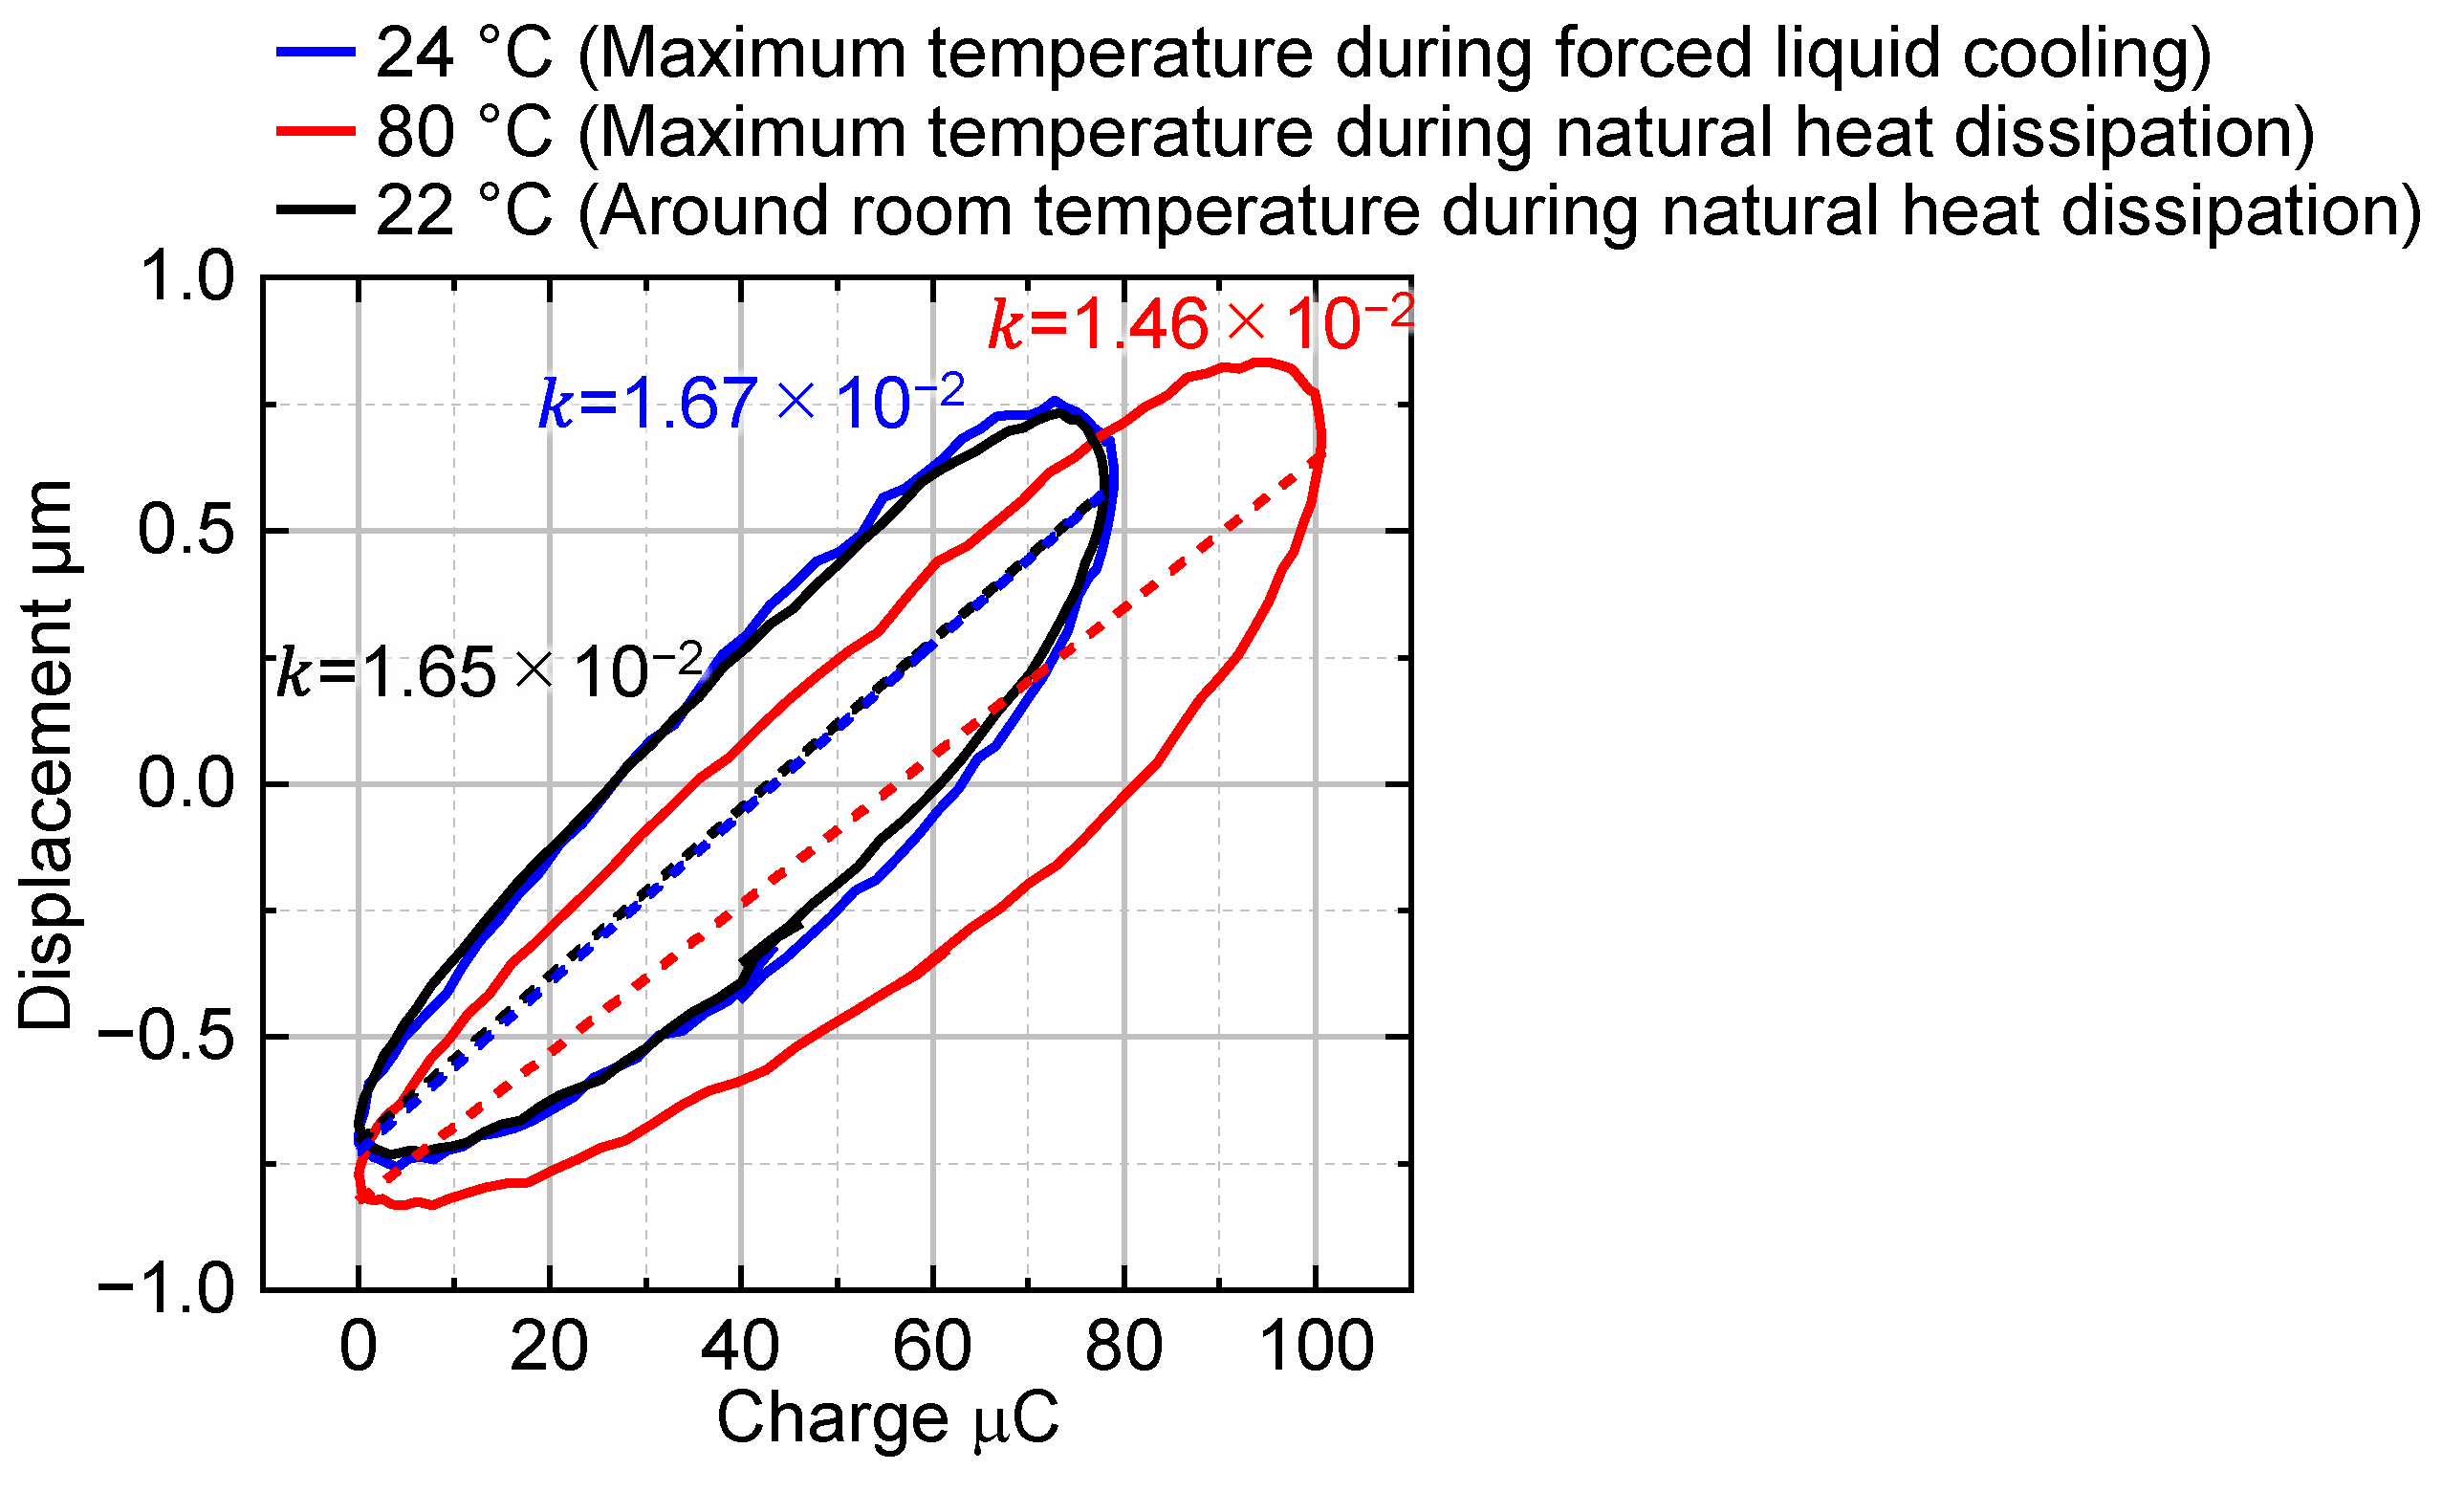
The voltage displacement and charge displacement curves of the PESA driven at high frequency were measured. Comparisons between the curves measured with natural heat dissipation and with forced liquid cooling were performed to observe how self-heating affected them. The voltage displacement and charge displacement characteristics were evaluated; the smaller the variations in these displacement characteristics, the more suitable the PESA for stabilization and voltage and charge control.
Figure 3a displays the measured voltage displacement hysteresis curves of the PESA in the preload structure presented in
Figure 2. A bias voltage of 50 V, together with a sinusoidal voltage with a frequency and amplitude of 10 kHz and 24 V, respectively, were applied to the PESA. These conditions were below the limit set by the resonance frequency for continuous operation during natural heat dissipation. The red and blue lines are the hysteresis curves measured when the temperature reached a steady state after the application of the voltage with natural heat dissipation and forced liquid cooling, respectively. The black line represents the curve measured immediately after the voltage was applied with natural heat dissipation. In this case, the surface temperature of the PESA had not yet risen, and it was at approximately room temperature. To exclude the drift due to the thermal expansion, the average displacement was subtracted from each measured value. To compare the shapes of the hysteresis curves,
Figure 3b displays them with the displacements normalized by each amplitude.
Figure 4 presents the relationship between the displacement and the charge on the PESA measured under the same conditions as in
Figure 3. The charge was obtained by integrating the current output from the amplifier.
Table 3 summarizes the surface temperature, displacement, and charge of the PESA for each measurement.
During natural heat dissipation, the surface temperature of the PESA rose from a room temperature of 22 to 80 °C, with a time constant of 38 seconds. At the maximum temperature, the displacement increased by 15% and the charge by 29% from the displacement just after the voltage was applied. During the forced liquid cooling, the surface temperature of the PESA rose by only 6 °C, from 18 °C, with a time constant of 9 s. The charge was approximately 1% greater and the displacement 3% higher compared to the charge and displacement at room temperature with forced liquid cooling.
Comparing the results with natural heat dissipation to those with forced liquid cooling, it is clear that with forced liquid cooling, the variations in the voltage displacement characteristics of the PESA were reduced, which contributed to the stabilization of the voltage control of the PESA. With natural heat dissipation, the displacement-to-charge ratio decreased by 12% from the ratio at room temperature, while with forced liquid cooling, it increased by 1%. The reduced variation in the charge displacement characteristics contributed to the stabilization of the PESA and an improvement in the accuracy of the charge control.
Previous research has demonstrated that temperature variations change the amplitude but not the shape of the hysteresis loop when driven at low frequencies [
14]. Thus, the hysteresis curve normalized by amplitude was consistent at each temperature.
Figure 3b shows that this phenomenon, observed for low-frequency drive, was also applicable when driven at 10 kHz.
4. Frequency Response of the Displacement to Voltage Characteristics with/without Forced Liquid Cooling
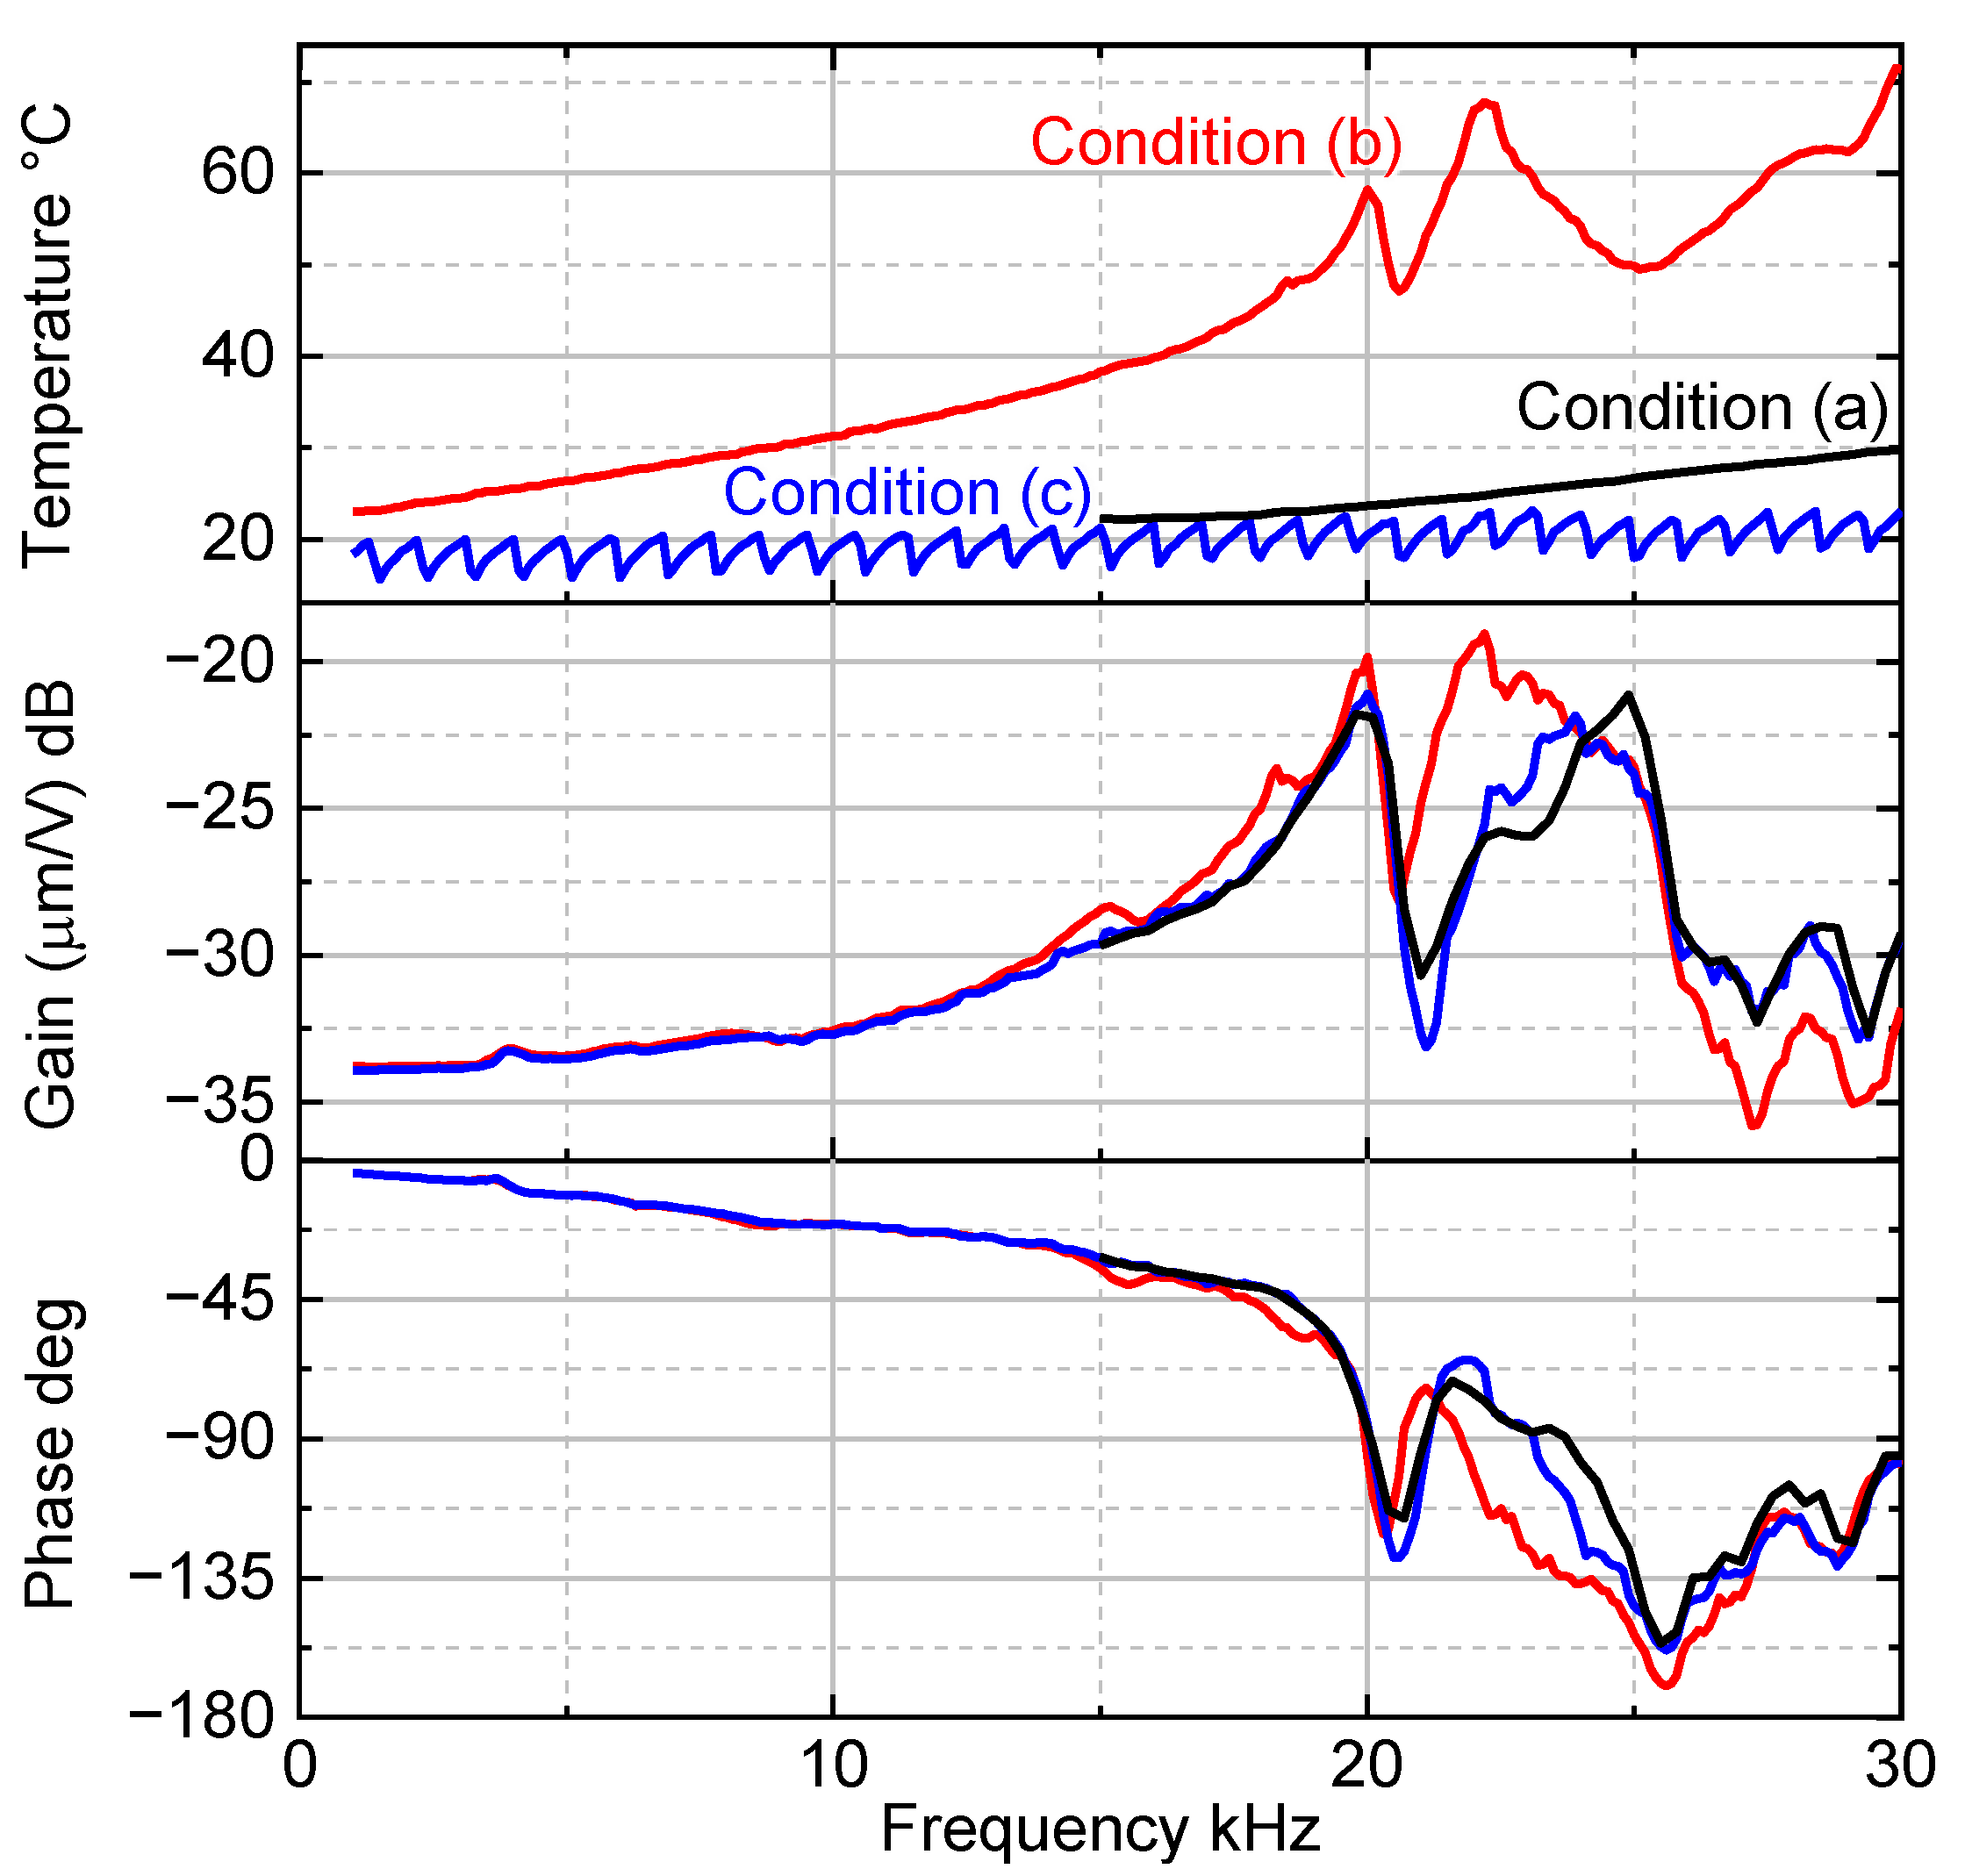
4.1. Measurement Conditions and Temperature Increase
The frequency responses of the displacement to voltage characteristics were measured. For comparison, the measurements were taken under three conditions. Under condition (a), the frequency response was measured after a slight temperature rise due to the fact of natural heat dissipation. In order to shorten the overall measurement time and not allow sufficient time for the temperature to increase due to the vibration of the PESA, the measurement was performed immediately after the frequency change, in a limited frequency band including resonances, which greatly affected the stability of the control. Under conditions (b) and (c), the frequency responses were measured when the temperature became stable at each measurement frequency during natural heat dissipation and forced liquid cooling, respectively. Sufficient intervals were provided between each frequency change and the measurement. A comparison between conditions (a) and (b), where the cooling conditions were the same but the temperatures were different, demonstrates the effect of the temperature increase during natural heat dissipation on the frequency responses. A comparison between conditions (a) and (c), where the temperature difference was small and the fluid surrounding the PESA was different, demonstrates the effect of the hydrodynamic force of the flowing coolant on the frequency responses.
The amplitude of the input voltage was fixed at 13 V for all the frequency ranges and cooling methods, so that the surface temperature would be lower than 85 °C, even during natural heat dissipation when driving at a frequency of less than 30 kHz. The measurement conditions are summarized in
Table 4.
The top of
Figure 5 displays the surface temperature of the PESA under these conditions. Under condition (a), the surface temperature at 15 kHz was 22 °C, and at 30 kHz, it was 30 °C. Under condition (b), the surface temperature increased with frequency up to 20 kHz and reached a peak of 58 °C at 20.0 kHz. It then decreased to 20.6 kHz and increased again up to 22.2 kHz, reaching a second local maximum of 68 °C at 22.2 kHz. Under condition (c), the surface temperature was maintained at an average of 19 °C, but there was a variation of ±3 °C due to the thermostatic control of the chiller.
4.2. Measurement of the Frequency Response Characteristics of the Voltage Displacement Transfer Function
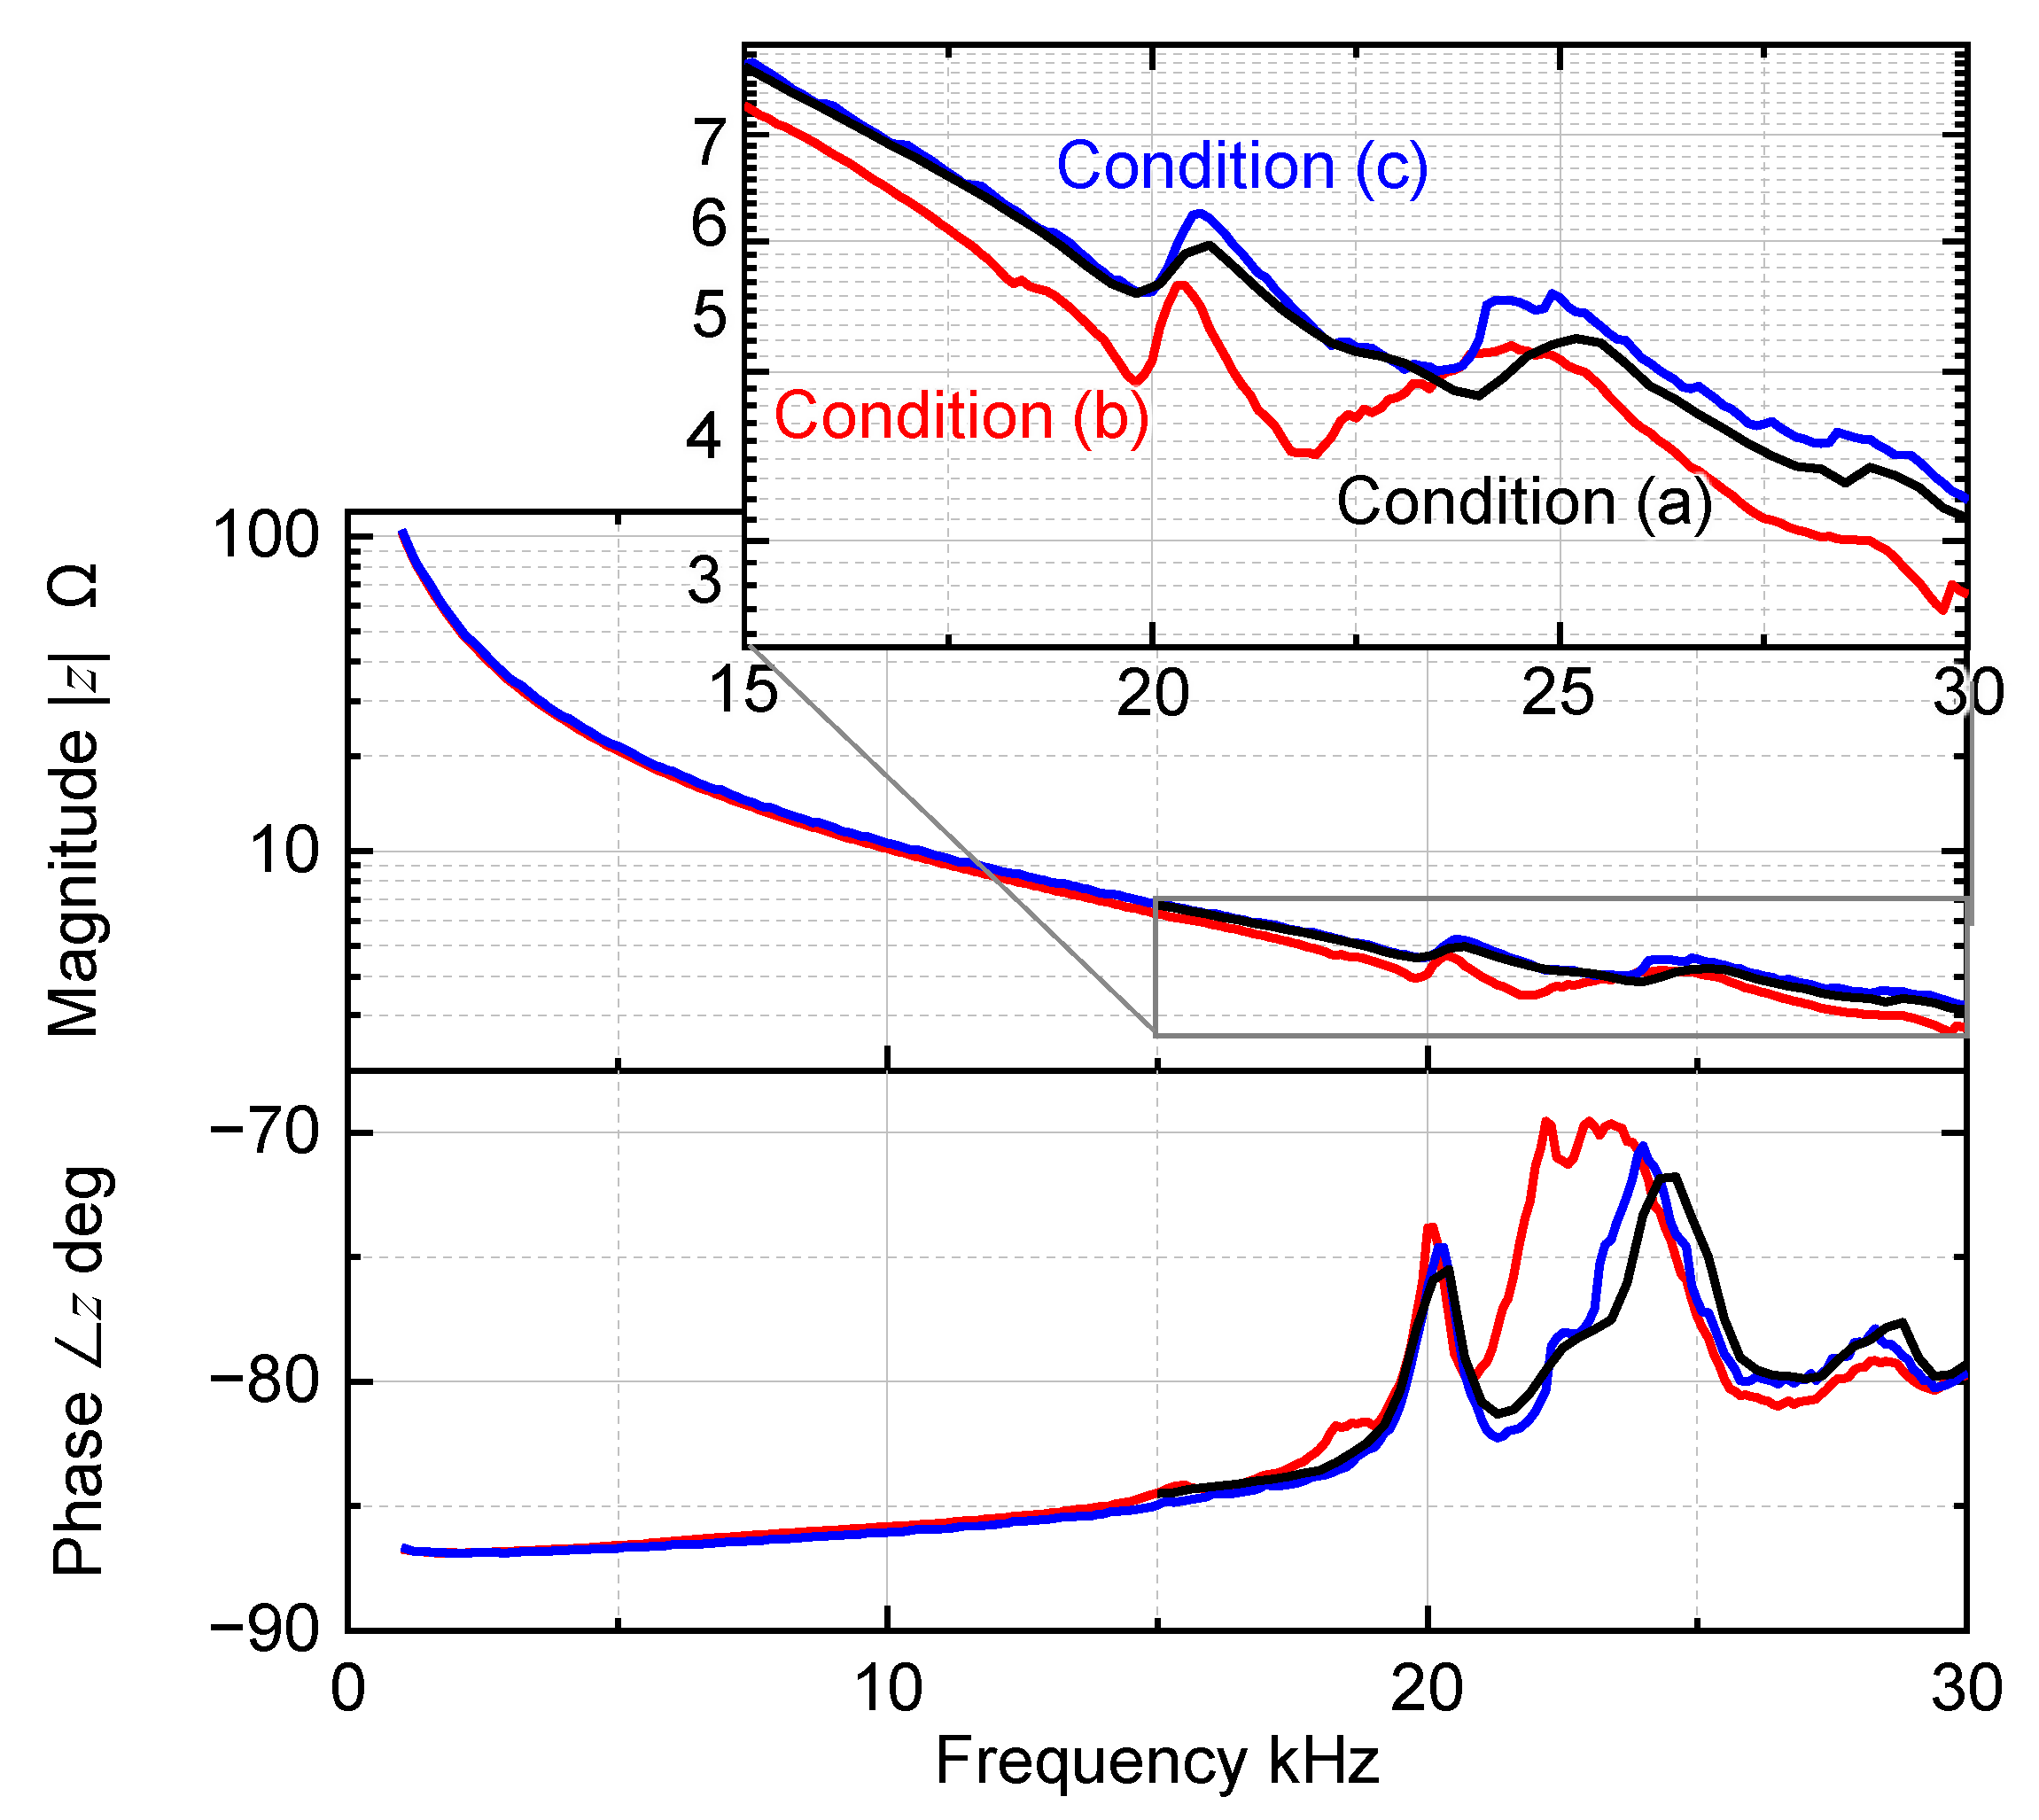
The middle and bottom of
Figure 5 display the voltage displacement Bode diagram of the PESA for each condition. Under all conditions, the first resonance was approximately 20 kHz. Under conditions (a) and (c), where the temperature difference was small, the responses were similar over the entire frequency range. If the fluid force due to the flowing coolant exerted an effect on the mass, stiffness, and damping of the mechanism, it would have significantly changed the resonance frequency, peak gain, and phase at resonance, but the effect was slight. On the other hand, compared with the responses under conditions (a) and (c), a different response was observed under condition (b), with a significant temperature increase, especially from 20.7 to 23.7 kHz. In the hysteresis curve measurement, the displacement was less than a few tens of percent when the temperature increased from room temperature to below 85 °C, and the shape of the hysteresis curve did not change, which means that the displacement characteristics of a single PESA had little effect on the damping. At 20.7~23.7 kHz, the amplitude increased by up to 9.0 dB, and the resonant frequency was reduced, which might be due not only to the change in the displacement characteristics of the PESA but also to the change in the dynamics of the mechanism. One of the reasons for the change in the dynamics of the mechanism is that a decrease in the preload due to the negative thermal expansion coefficient of the PESA reduced the stiffness of the contact area between the spherical plate and the screw.
In general, the thermal expansion coefficient of PZT is negative around room temperature, and the PESA used in this experiment also shrank as the temperature rose [
19]. The contact stiffness between a sphere and a plane is nonlinear, according to the Hertzian contact theory, and decreases as the preload force is reduced [
20]. The secondary mode is the mode in which the preload plate deflects in the driving direction of the PESA, and this natural frequency is highly dependent on the stiffness of the contact surface. However, the primary mode is a torsional mode of the preload plate centered on the contact area with the spherical plate, and the effect of the change in the stiffness of the contact area is slight, so it is possible that the change was not observed. This experiment confirms that temperature control by forced liquid cooling reduces the variations in the frequency response characteristics by reducing the changes in the amplitude of the PESA and the dynamic characteristics of the mechanism.
4.3. Impedance Measurements
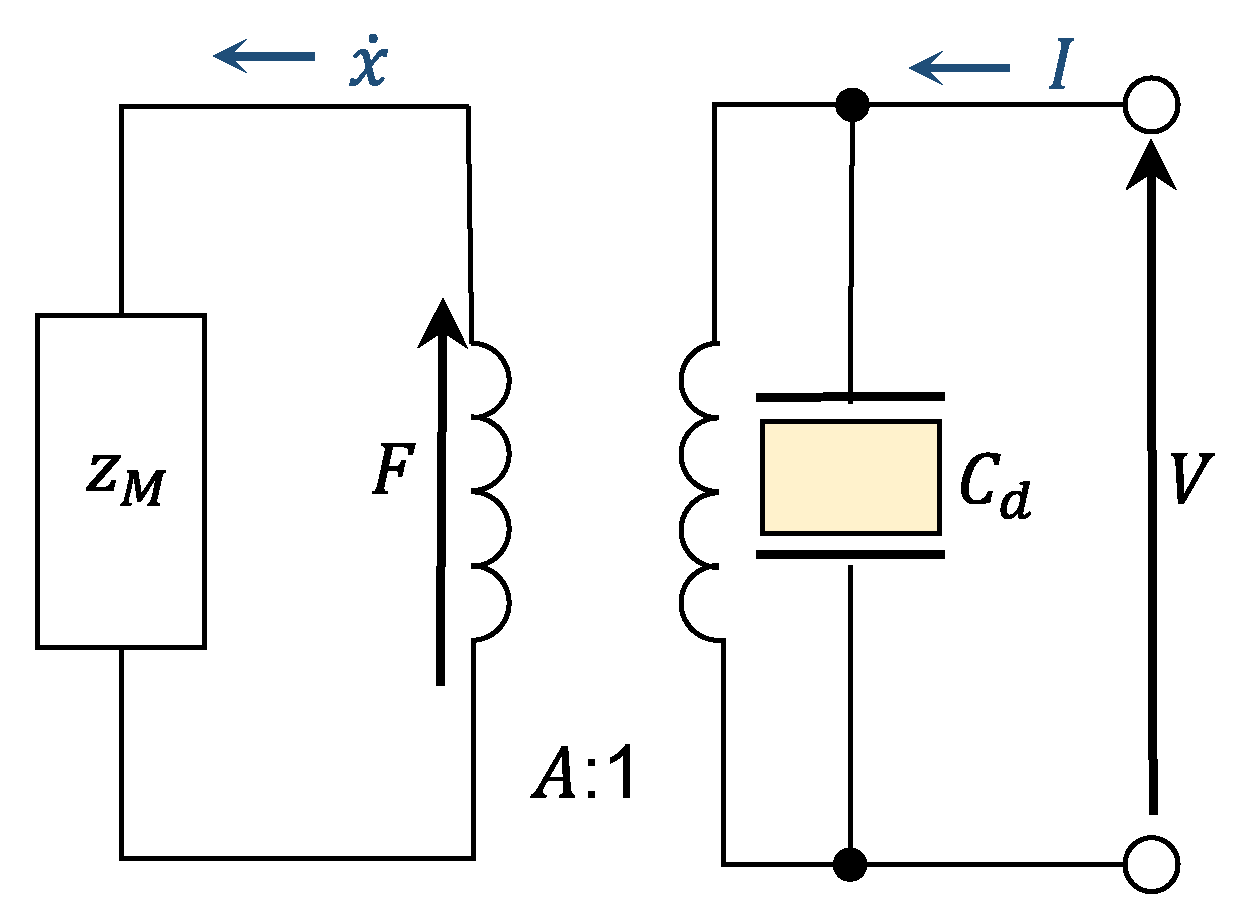
With charge control, an external circuit based on the equivalent circuit of a PESA is often used. Therefore, any change in the impedance of the PESA may reduce the reliability of the charge control. As demonstrated in
Figure 6, the equivalent circuit of a PESA fixed in a preloaded structure when driven near its resonant frequency includes electrical and mechanical parameters [
21]. The left part of this figure models the electrical characteristics of the PESA. Here,
is the input voltage to the PESA,
is the electrostatic capacity, and
is the current flowing in the circuit. The right part displays the mechanical characteristics of the PESA fixed in the preload structure.
is a constant proportional to the piezoelectric constant,
is the blocking force, and
is the displacement of the PESA. The value
features an impedance equivalent to the dynamic characteristics of the preload mechanism, and the voltage applied to
indicates the reaction force from the preload structure to the PESA. The transfer function
and the impedance
are given by the following equations:
From Equation (2), the impedance can be expressed by the mechanical transfer function , which was measured.
Figure 7 displays the impedance of the PESA measured simultaneously with the measurement of the frequency response of the displacement. The magnitude of the impedance under condition (b) was smaller over almost the entire range than under condition (a), but the magnitude of the impedance under condition (c) was close to that under condition (a). Several previous studies have demonstrated that the dielectric constant of PZT increases with increasing temperatures [
22,
23,
24]. This means that the increase in the capacitance
proportional to the dielectric constant reduced the magnitude of the impedance. Since the impedance is also affected by the dynamic characteristics of the PESA, the difference in impedance under condition (b) to those under conditions (a) and (c) was large at frequencies where there was a large change in the measured dynamic characteristics. This experiment confirms that forced liquid cooling also reduced fluctuations in the impedance by reducing the variations in the capacitance and mechanical dynamics due to the temperature increases.
5. Conclusions
We confirmed that by using our proposed forced liquid cooling method to reduce the temperature change in a PESA, variations in the dynamic characteristics of the PESA could be prevented. The voltage displacement and charge displacement curve measurements at 10 kHz on a PESA with natural heat dissipation showed that the amplitude of the displacement and the charge increased by 15% and 29%, respectively, due to the fact of self-heating. Forced liquid cooling reduced the changes, and the displacement and charge when using this method increased by 3% and 1%, respectively. The displacement-to-charge ratio reduced by 12% with natural heat dissipation, while the change was only approximately 1% with forced liquid cooling. A comparison of the normalized voltage displacement hysteresis curves under each cooling condition showed that the temperature change and the hydraulic force of the coolant did not change the shape of the curve at this driving frequency.
Measurements of the frequency responses of the voltage displacement transfer function showed the gains and phases in the first and secondary vibration modes at 20 kHz or higher to be different between natural heat dissipation and forced liquid cooling. In addition, the temperature increases also changed the impedance of the PESA, which depends on the capacitance and dynamics of the PESA. It was confirmed that forced liquid cooling also reduced the impedance change. The stabilization of the displacement characteristics and the impedance of PESAs by forced liquid cooling is expected to contribute to improvements in the stability and accuracy of voltage-controlled and charge-controlled PESA positioning systems.
Author Contributions
Conceptualization, R.N., J.Z. and T.S.; methodology, R.N., J.Z. and T.S.; software, R.N.; validation, R.N.; formal analysis, R.N.; investigation, R.N.; resources, J.Z. and T.S.; data curation, R.N.; writing—original draft preparation, R.N.; writing—review and editing, J.Z. and T.S.; visualization, R.N.; supervision, T.S.; project administration, T.S.; funding acquisition, R.N. and T.S. All authors have read and agreed to the published version of the manuscript.
Funding
This work was supported by a JSPS KAKENHI Grant-in-Aid for JSPS Fellows Number 20J22197.
Institutional Review Board Statement
Not applicable.
Informed Consent Statement
Not applicable.
Data Availability Statement
Not applicable.
Conflicts of Interest
The authors declare no conflict of interest.
References
- Ko, H.-P.; Jeong, H.; Koc, B. Piezoelectric actuator for mobile auto focus camera applications. J. Electroceramics 2008, 23, 530–535. [Google Scholar] [CrossRef]
- Lee, S.; Nakamura, Y.; Yamane, K.; Toujo, T.; Takahashi, S.; Tanikawa, Y.; Takahashi, H. Image Stabilization for in Vivo Mi-croscopy by High-speed Visual Feedback Control. IEEE Trans. Robot. 2008, 24, 45–54. [Google Scholar] [CrossRef]
- Palazzolo, A.B.; Lin, R.R.; Kascak, A.F.; Montague, J.; Alexander, R.M. Test and Theory for Piezoelectric actuator-active Vi-bration Control of Rotating Machinery. J. Vib. Acoust. 1991, 113, 167–175. [Google Scholar] [CrossRef]
- Zhu, W.; Bian, L.; An, Y.; Chen, G.; Rui, X. Modeling and control of a two-axis fast steering mirror with piezoelectric stack actuators for laser beam tracking. Smart Mater. Struct. 2015, 24, 075014. [Google Scholar] [CrossRef]
- Na, T.-W.; Choi, J.-H.; Jung, J.-Y.; Kim, H.-G.; Han, J.-H.; Park, K.-C.; Oh, I.-K. Compact piezoelectric tripod manipulator based on a reverse bridge-type amplification mechanism. Smart Mater. Struct. 2016, 25, 095028. [Google Scholar] [CrossRef]
- Oktavianty, O.; Kyotani, T.; Haruyama, S.; Kaminishi, K. New actuation waveform design of DoD inkjet printer for single and multi-drop ejection method. Addit. Manuf. 2018, 25, 522–531. [Google Scholar] [CrossRef]
- Shieh, H.J.; Chiu, Y.J.; Chen, Y.T. Optimal PID Control System of a Piezoelectric Micropositioner. In Proceedings of the 2008 IEEE/SICE International Symposium on System Integration, Nagoya, Japan, 4 December 2008. [Google Scholar]
- Changhai, R.; Lining, S. Hysteresis and creep compensation for piezoelectric actuator in open-loop operation. Sens. Actuators A Phys. 2005, 122, 124–130. [Google Scholar] [CrossRef]
- Tzen, J.-J.; Jeng, S.-L.; Chieng, W.-H. Modeling of piezoelectric actuator for compensation and controller design. Precis. Eng. 2003, 27, 70–86. [Google Scholar] [CrossRef]
- Qin, Y.; Tian, Y.; Zhang, D.; Shirinzadeh, B.; Fatikow, S. A Novel Direct Inverse Modeling Approach for Hysteresis Compensation of Piezoelectric Actuator in Feedforward Applications. IEEE/ASME Trans. Mechatron. 2013, 18, 981–989. [Google Scholar] [CrossRef]
- Yi, K.A.; Member, S.; Veillette, R.J. A Charge Controller for Linear Operation of a Piezoelectric Stack Actuator. IEEE Trans. Cont. Syst. Tech. 2005, 13, 517–526. [Google Scholar] [CrossRef]
- Ronkanen, P. Current Measurement in Control and Monitoring of Piezoelectric Actuators. Ph.D. Thesis, Tampere University of Technology, Tampere, Finland, 2008. [Google Scholar]
- Wallenhauer, C.; Gottlieb, B.; Kappel, A.; Schwebel, T.; Rucha, J.; Lüth, T. Accurate Load Detection Based on a New Piezoe-lectric Drive Principle Employing Phase-shift Measurement. J. Microelectromechanical Syst. 2007, 16, 344–350. [Google Scholar] [CrossRef]
- Al Janaideh, M.; Al Saaideh, M.; Rakotondrabe, M. On Hysteresis Modeling of a Piezoelectric Precise Positioning System under Variable Temperature. Mech. Syst. Signal Process 2020, 145, 106880. [Google Scholar] [CrossRef]
- Li, F.X.; Rajapakse, R.K.N.D.; Mumford, D.; Gadala, M. Quasi-static Thermo-electro-mechanical Behavior of Piezoelectric Stack Actuators. Smart Mater. Struct. 2008, 17, 015049. [Google Scholar] [CrossRef]
- Pritchard, J.; Ramesh, R.; Bowen, C. Time–temperature profiles of multi-layer actuators. Sens. Actuators A Phys. 2004, 115, 140–145. [Google Scholar] [CrossRef]
- Sharma, A.; Kumar, R.; Vaish, R.; Chauhan, V.S. Active vibration control of space antenna reflector over wide temperature range. Compos. Struct. 2015, 128, 291–304. [Google Scholar] [CrossRef]
- Nishida, R.; Zhong, J.; Shinshi, T. Dynamic characteristics of piezoelectric stack actuators during temperature control by liquid cooling. In Proceedings of the 10th International Conference on Leading Edge Manufacturing in 21st Century, Online, 14–18 November 2021. accepted. [Google Scholar]
- Tokin Corporation Catalog “Multilayer Piezoelectric Actuators Vol. 1”. Available online: https://www.tokin.com/english/product/pdf_dl/multilayerpiezoelectricactu.pdf (accessed on 10 September 2021).
- Hertz, H. Miscellaneous Papers; Jones, D.E., Scott, G.A., Eds.; Macmillan& Co.: London, UK, 1896. [Google Scholar]
- Morita, T. Atsuden Gensho (Piezoelectric Phenomena, Japanese), 1st ed.; Morikita Publishing Co.: Tokyo, Japan, 2017. [Google Scholar]
- Goel, P.; Yadav, K.L.; James, A.R. Double doping effect on the structural and dielectric properties of PZT ceramics. J. Phys. D Appl. Phys. 2004, 37, 3174–3179. [Google Scholar] [CrossRef]
- Zhuang, Z.Q.; Haun, M.; Jang, S.-J.; Cross, L. Composition and temperature dependence of the dielectric, piezoelectric and elastic properties of pure PZT ceramics. IEEE Trans. Ultrason. Ferroelectr. Freq. Control. 1989, 36, 413–416. [Google Scholar] [CrossRef] [PubMed]
- Miclea, C.; Tanasoiu, C.; Amarande, L.; Miclea, C.F.; Plavitu, C.; Cioangher, M.; Trupina, L.; Miclea, C.; David, C. Effect of Temperature on The Main Piezoelectric Parameters of a Soft PZT Ceramic. Rom. J. Inf. Sci. Tech. 2007, 10, 243–250. [Google Scholar]
| Publisher’s Note: MDPI stays neutral with regard to jurisdictional claims in published maps and institutional affiliations. |
© 2021 by the authors. Licensee MDPI, Basel, Switzerland. This article is an open access article distributed under the terms and conditions of the Creative Commons Attribution (CC BY) license (https://creativecommons.org/licenses/by/4.0/).


