Abstract
Background: Non-typhoidal (NT) Salmonella spp. constitutes a major cause of foodborne illness. Culture is the gold standard, but it is time consuming, whereas multiplex nucleic acid amplification tests (NAATs)/Polymerase Chain Reaction (PCR) offer faster detection with variable reported performance. Objectives: To compare the diagnostic accuracy of multiplex NAAT/PCR and culture for Salmonella spp. using various statistical models with or without a gold standard assumption. Methods: A systematic search (PubMed, Web of Science, Scopus; up to April 2024) identified 44 studies (55 comparisons). Diagnostic performance was evaluated using the frequentists bivariate model (BM) and Split Component Synthesis (SCS) and the Bayesian bivariate models (BBMs) and hierarchical summary ROC (BHSROC). Results: Across models, multiplex NAAT/PCR demonstrated high specificity (>98%) but model-dependent variability in sensitivity (85.5–94.8%), consistently substantial between study heterogeneity and threshold variation. The BM and BBM yielded a higher sensitivity estimate with narrower non-overlapping confidence intervals while SCS and BHSROC models, which are more robust to threshold differences, produced more conservative estimates with wider uncertainty. In Bayesian latent class analyses, culture remained highly accurate (Se: 97.17%, 95% CrI: 70.3–99.99; Sp: 96.06%, 95% CrI: 78.9–99.99), but with wide credible intervals indicating variation between studies, perhaps due to the different protocols used. Conclusion: Model choice affects inferred diagnostic accuracy, particularly when high heterogeneity is present. Both multiplex NAAT/PCR and culture showed high accuracy; hence, a combination of the two tests could optimise rapid diagnosis and treatment. Future research should include cost effectiveness and decision analysis to update the diagnostic algorithms.
1. Introduction
Non-typhoidal (NT) Salmonella spp. is the second most common causative agent isolated from foodborne outbreaks, following Campylobacter spp. [1]. In 2023, there were 18 confirmed cases per 100,000 population, with a total of 1115 outbreaks [1]. The most prevalent NT Salmonella serovar in the European Union is Salmonella enteritidis, which accounted for approximately 71% of the reported human cases in 2023 [1,2,3]. Other significant serovars include S. typhimurium, monophasic S. typhimurium (1,4,[5],12:i:-), S. infantis, and S. coeln. Each of these serovars has unique characteristics and implications for disease management.
Currently, culture with an enrichment step remains the gold standard for diagnosing Salmonella spp. infections due to its high accuracy and ability to recover live isolates [4,5,6,7,8]. However, results typically take at least 48 h to obtain [4,6]. To address this delay, many laboratories now employ culture-independent diagnostic tests (CIDTs), particularly molecular methods such as multiplex nucleic acid amplification tests (NAATs)/Polymerase Chain Reaction (PCR), as rapid first-line diagnostic tools [9]. While molecular diagnostics offer faster turnaround times, they are limited in key respects, such as the inability to isolate bacteria and distinguish between active and past infections. Moreover, different NAAT/PCR platforms use various primer sets that target distinct gene areas, and not all assays are equally sensitive to all Salmonella strains. Compounding these limitations, culture performance itself can substantively vary depending on enrichment protocols and the agar type used, as these differ in inhibitory components and recovery efficiency; studies comparing agar types (often in conjunction with enrichment) have reported sensitivities ranging from 84% to 98% and specificities from 78% to 100% [4,5,6,7,8].
These limitations become particularly critical, when discrepancies arise between culture and NAAT/PCR results. In these cases, determining whether the difference is due to missed detection by culture or a false positive from NAAT/PCR and vice versa presents a significant diagnostic challenge.
To address this issue, this meta-analysis employs a range of statistical models to estimate the diagnostic accuracy of multiplex NAAT/PCR and culture. These include both frequentist models Split Component Synthesis (SCS) and bivariate (BM), as well as Bayesian approaches, such as the Bayesian bivariate model (BBM) and the Bayesian hierarchical summary receiver operating characteristic (BHSROC) model. In frequentist frameworks, the reference test is assumed to be perfect. In contrast, Bayesian latent class models acknowledge the absence of a true gold standard by treating the actual disease status as a latent (unobserved) variable. These models integrate prior information with observed data to estimate the performance of both the index test and the reference test.
Each statistical method is based on specific assumptions and has its strengths and limitations (Table 1), which depend on several factors including data structure, study sample size, and the presence of threshold differences. Therefore, applying multiple approaches enables a more comprehensive and robust evaluation of diagnostic accuracy, reducing the dependence on any single model’s assumptions. Given the anticipated heterogeneity across studies—resulting from various NAAT/PCR brands and culture conditions—methods like SCS and BHSROC are considered well suited to handle threshold effects and are expected to yield more robust summary estimates.

Table 1.
Advantages, limitations, and recommended use of meta-analytical models applied for the estimation of the accuracy of multiplex NAAT/PCR and culture (when assumed as imperfect gold standard), against NT Salmonella spp.
The overall aim of this systematic review and meta-analysis is to estimate and compare the diagnostic accuracy of multiplex NAAT/PCR for NT Salmonella spp., across various statistical methodologies.
2. Materials and Methods
2.1. Search Strategy and Selection Criteria
A comprehensive literature search was performed across PubMed, Web of Science, and Scopus, for peer-reviewed articles up to and including April 2024 using combinations of the following terms: “multiplex PCR”, “culture”, “Salmonella enterica”, “gastroenteritis”, “diagnostic accuracy”, “sensitivity”, and “specificity”.
After removing duplicates, two reviewers (X.R. and E.M.) independently screened articles for inclusion, first by title and abstract, and then by full article assessment. Disagreements were resolved by a third reviewer (P.K.). We included studies that (1) involved symptomatic participants providing a stool or rectal swab specimen for testing, (2) used commercially available or laboratory-developed multiplex NAAT/PCR tests, (3) both culture and multiplex NAAT/PCR were performed on the same specimen, (4) evaluated multiplex NAAT/PCR against culture for the detection of NT Salmonella spp., (5) provided sufficient data to construct 2 × 2 contingency tables, and (6) were published in peer-reviewed journals. Studies were excluded if they lacked a reference standard, used more than one sample per patient, were not in English, or involved non-human samples.
2.2. Data Extraction and Quality Assessment
Two independent reviewers (X.R. and E.M.) extracted data on study characteristics, sample size, test method characteristics, diagnostic performance metrics (true positives, false positives, false negatives, true negatives), and study design. Importantly, all meta-analyses were based on the raw cross-tabulation of multiplex NAAT/PCR against culture performed on the same specimen, as reported by each study. If studies reported the use of a third test (e.g., additional PCR, sequencing) or retesting to adjudicate discordant results, this information was extracted but adjudicated results were not used to reclassify outcomes or to modify extracted 2 × 2 tables. Discrepancies between reviewers were resolved by consensus. The methodological quality of each study was assessed using the QUADAS-2 tool [19].
2.3. Statistical Analysis
Various methods have been developed for the joint estimation of Se and Sp [10,12,14,17,20], and the characteristics as well as the advantages and disadvantages of the models used in this study are summarised in Table 1.
The most widely used statistical method [21] is the bivariate model that was introduced by Reitsma et al. [12] and modified by Chu et al. to account for zero cells, by using an exact binomial model instead of a continuity correction [13]. The bivariate model (BM) can also be computed via Bayesian inference (BBM) [14], thereby incorporating prior knowledge or relaxing the assumption of an imperfect standard. The BM and BBM also take into account the dependence between Se and Sp via a variance–covariance matrix [14].
The split component synthesis (SCS) method, as described in [10,11], utilises quasi-likelihood to address the issues of overdispersion commonly associated with this type of data, making it a more flexible model than the BM. In addition, high heterogeneity is frequently anticipated in these studies due to the different cut-off values that each study might use (threshold effect), for which the SCS method might be more resilient than the BM [10,22,23]. This method estimates the DOR, which is then split into the logit-transformed Se and Sp, and the summary receiver operating characteristic (SROC) curve is produced.
The threshold effect can also be dealt with by using the Bayesian hierarchical summary receiver operating characteristic (BHSROC) model, developed by Rutter and Gastonis [17] and updated by Dendukuri et al. [18]. This model addresses heterogeneity both between- and within-study levels, by incorporating in the model a threshold parameter [17,18,24].
To estimate the diagnostic accuracy of culture without assuming it as the perfect gold standard, we applied the Bayesian HSROC and BBM models under a latent class framework. In these models, neither test was assumed to be perfect, and latent disease status was inferred from the data.
Analyses were conducted in three stages. First, in the primary meta-analysis, culture was treated as the gold standard and multiplex NAAT/PCR accuracy was evaluated using BM, SCS, and the gold-standard parameterisations of BBM and BHSROC. Second, to relax the perfect-reference assumption, we fitted Bayesian latent class BBM and BHSROC models, in which true Salmonella infection status is unobserved, and the accuracy of multiplex NAAT/PCR and culture were jointly estimated. Third, we carried out a subgroup analysis using the latent class BHSROC to evaluate several factors that might influence accuracy of multiplex NAAT/PCR and culture as well as to assess heterogeneity. For the Bayesian models, sensitivity analysis was also performed to investigate the influence of priors on the accuracy estimates and also whether the two tests were conditionally dependent.
2.3.1. Software
For the BM, we utilised the shiny apps Meta-Disc 2.0 [25] and MetaDTA [15,26,27]. We performed the SCS method using the SCSMeta function [10], and the statistical software R, version 4.2.3 [28]. Note that the SCS method can also be run with the diagma module in Stata [Furuya-Kanamori L & Doi SA. DIAGMA: Stata module for the split component synthesis method of diagnostic meta-analysis (RePEc:boc:bocode:s458815). <https://ideas.repec.org/c/boc/bocode/s458815.html>, accessed on 26 December 2025].
The Bayesian analyses with BBM and BHSROC were performed using the runjag package [29] of the statistical software R (model syntax code provided in the Supplementary Materials), with 100,000 iterations in the post-burn-in phase of 15,000, different initial values for each chain, and visual inspection of trace plots to assess convergence. Summary measures include median/mean estimates as well as 95% credible intervals (CrI). Model comparison was based on the Deviance Information Criterion (DIC). The BBM was also performed via the Shiny app MetaBayesDTA, version 1.5.3 [15].
2.3.2. Sensitivity Analysis
Bayesian Methods
We used non-informative priors, weakly informative priors (restriction of the sensitivity and specificity of culture to be above 0.3 and 0.7, respectively), and informative priors for the sensitivity and specificity of culture. The informative prior normal distributions were calculated based on three studies evaluating the performance of various agar media, which reported sensitivities ranging from 84% to 98% and specificities of 78% to 100% [4,5,6]. We also investigated conditional dependence by considering the covariance between sensitivities to be fixed at 5%, 25%, 50%, or 80% of its maximum value, as illustrated previously [14].
Subgroup Analysis
The Bayesian HSROC latent class model was utilised for the simultaneous meta-analysis of various subgroups in investigating potential sources of heterogeneity and differences in accuracy of the multiplex NAAT/PCR. We also evaluated if there were different estimates of culture accuracy depending on the type of agar or on the transport medium used.
The factors “multiplex NAAT/PCR brand” and “manufacturer funding” were used in the subgroup analysis to explore potential sources of heterogeneity for the estimation of accuracy of multiplex NAAT/PCR. The different NAAT/PCR brands were grouped into six categories (FilmArray, Luminex, Allplex/Seeplex, BDMax, Laboratory Developed-LD- and other commercial NAAT/PCR brands). NAAT/PCR brands that could not be solely evaluated due to a small number of studies (<4 studies) were collapsed into the other commercial NAAT/PCR brands category.
The accuracy of culture was assessed regarding the agar type (HE, XLD, SS, and the use of more than one type), and the use of transport medium (no, yes, unclear). The bivariate version of I2 developed by [30] and also calculated by the shiny app Meta-Disc was used to calculate the overall heterogeneity since it takes into account both sensitivity and specificity as well as the correlation between them.
3. Results
3.1. Literature Search
The literature search identified, after excluding duplicates, 4720 articles for title and abstract screening, from which 186 were selected for full-text review, yielding 44 eligible studies (Supplemental Figure S1). For the primary meta-analysis, we included 45 studies with 55 comparisons between the index test and culture.
3.2. Study Characteristics
The characteristics of the studies published from 2009 to 2024 are presented in Table 2 and Table 3. Luminex was the most commonly evaluated index test (n = 14, 29.8%), followed by FilmArray (n = 7, 14.9%), Allplex/Seeplex (n = 6, 12.8%), and BDMax (n = 5, 11.1%). Most studies (n = 36, 80%) reported the age of the participants with the majority (n = 28, 59.57%) to include patients of all ages. Six studies (12.8%) employed only paediatric patients, and two (4.2%) only adults. Most studies were prospective, with only seven being retrospective and five using both designs. Almost all studies included patients with symptoms of gastroenteritis, and only two studies did not mention any information. Fourteen (31.11%) and twenty (44%) studies reported whether they respectively received or did not receive industry funding. Thirty-eight studies provided information on the procedure followed for culture, of which thirty-four included an enrichment step and fifteen used more than one type of agar. In total, 31% (n = 14) of the studies reported using Cary–Blair or other transport medium in all (n = 9, 20%) or in some (n = 6, 13%) of the samples. Discrepancy analysis using a third test, usually another NAAT/PCR with different primers targeting different genes and/or sequencing, was reported in 32/55 comparisons (58%); only in 12/55 (21.8%) comparisons were the results of the third test documented (Table 3).
Table 2.
Characteristics of the included studies *.
Table 3.
Results and characteristics regarding index test and culture methods.
3.3. Risk of Bias Analysis (QUADAS 2 Tool)
The risk of bias analysis, using the QUADAS-2 tool, is presented in Tables S3 and S4 as well as in Figure S1. All studies ranked high, indicating correct answers to most questions, and thus low risk of bias. However, several studies received funding from the manufacturer of the index test, which may introduce a serious bias. In addition, the absence of an enrichment step in four studies could pose an important risk factor influencing the overall accuracy. For several studies, the risk of bias was unclear due to limited or no information regarding the exclusion or inclusion criteria for the selection of patients for, e.g., exclusion of travellers and if prior antibiotic use, as well as culture protocol. The applicability concerns regarding the methodological framework applied for the reference standard were unclear for six studies, since no information was reported.
3.4. Overall Analysis
The overall accuracies of multiplex NAAT/PCR and culture as estimated by the various statistical methods, are shown in Figure 1. The overall accuracies of multiplex NAAT/PCR and culture as estimated by the various statistical methods are shown in Figure 1. Two overarching findings are apparent. First, pooled Sp of multiplex NAAT/PCR was consistently high across modelling frameworks, whereas pooled Se was more model dependent. Second, the BM/BBM produced higher Se point estimates with narrower, non-overlapping intervals compared with SCS and BHSROC. Finally, Figure 1 includes both frequentist 95% confidence intervals (CI) and Bayesian 95% credible intervals (CrI).
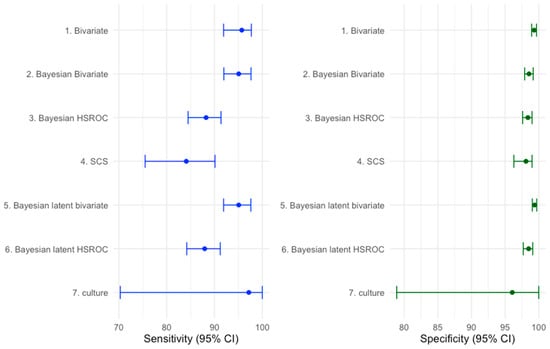
Figure 1.
Sensitivity and specificity with 95% confidence/credible intervals (CI) (error bars) for multiplex NAAT/PCR and culture across several meta-analytic methods. Frequentist models are summarised with 95% confidence intervals (CI), whereas Bayesian models are summarised with 95% credible intervals (CrI).
The pooled mean estimates of the Se and the Sp of the multiplex NAATs/PCRs, with the BHSROC model, were 87.71 (95% CrI: 84.4–90.85) and 98.54 (95% CrI: 97.9–99.17), respectively. Under the Bayesian latent HSROC model, the estimated accuracy of multiplex NAAT/PCR was similar but slightly lower (Se: 87.95%, 95% CrI: 84.23–91.19%, Sp: 98.49%, 95%, CrI: 97.72–99.19), while culture showed high sensitivity and slightly lower specificity (Se: 97.17%, 95% CrI: 70.30–99.99; Sp: 96.06%, 95% CrI: 78.90–99.99). The wide credible intervals for culture, especially in sensitivity, indicate substantial uncertainty and likely protocol dependence.
3.5. Subgroup Analysis
Table 4 and Table 5 present latent class BHSROC subgroup estimates aimed at exploring potential sources of heterogeneity. Across multiplex NAAT/PCR platform categories, pooled Sp remained uniformly high, whereas Se varied numerically across categories. However, credible intervals were wide and overlapped substantially, indicating that the available evidence is insufficient to support definitive platform differences. Subgroup analyses by manufacturer funding status and transport medium did not show clear shifts in pooled accuracy, but these findings should be interpreted cautiously because such study-level covariates are prone to incomplete reporting.
Table 4.
Sensitivity and specificity estimate with 95% credible intervals (CrI) calculated by the latent BHSROC model, for the different categories of multiplex NAAT/PCR (brands FilmArray, Luminex, BDMax, Allplex/Seeplex, other brands, laboratory developed-LD-multiplex NAAT/PCR), and for funding or not of all or part of the research by the manufacturer.
Table 5.
Sensitivity and specificity estimate with 95% credible intervals (CrI) calculated by latent BHSROC model, for the different agar types used for culture and for the use or not of a transport medium.
For culture, sufficient data were available to explore agar type. The Se and Sp estimates of culture were broadly comparable across individual agar types (HE, XLD, SS), with overlapping 95% credible intervals. The “more than one agar type” subgroup showed a slightly higher Se point estimate; however, credible intervals remained wide across agar-defined subgroups, reflecting between-study variability and limited precision within subgroups.
3.6. Conditional Dependence Model and Informative Priors
The use of informative priors did not influence the accuracy of the index test but lowered the Se and Sp of culture (Table S4). The inclusion of a covariate to account for the conditional dependence between the sensitivities did not exceedingly alter the accuracy estimates, with a slight reduction as the percentage of dependence increased (Table S5).
4. Discussion
This meta-analysis comprehensively evaluates the diagnostic accuracy of multiplex NAAT/PCR versus routine culture for detecting NT Salmonella spp., applying a range of advanced statistical models that differ in their handling of between-study heterogeneity, and the assumption of a perfect reference standard. Across all statistical approaches, multiplex NAAT/PCR demonstrated consistently high Sp, whereas pooled Se was more model dependent and ranged from higher estimates under BM/BBM to lower, more robust estimates under SCS and BHSROC models. A previous meta-analysis [75], implementing the BM, reported similar estimates depending on the assay platform, supporting the consistency of these frequentist results under a perfect reference assumption.
The observed divergence between models could be expected because of model differences in parameterisation. BM/BBM jointly model logit Se and logit Sp without an explicit study-specific threshold parameter; when heterogeneity is high, possibly due to study variations in positivity thresholds and laboratory workflows, BM/BBM can produce overconfident pooled Se and comparatively narrower intervals, as shown in simulation studies [10,22,23]. In contrast, SCS is comparatively robust to overdispersion, because it uses a quasi-likelihood approach and BHSROC decomposes test performance into accuracy and threshold components; therefore, these approaches tend to produce more conservative Se estimates when threshold heterogeneity is high. Overall, BM/BBM estimates can be interpreted as best case accuracy under a gold standard assumption and a relatively homogeneous group. When the threshold effect is expected to be high as is often the case, then the estimates from SCS/BHSROC—particularly under a latent class framework—are more consistent with the underlying diagnostic process, and the wider intervals should be viewed as a realistic representation of uncertainty rather than a limitation of the method.
Substantial heterogeneity, in our study, likely reflects both methodological and clinical variation across studies, including differences in patient spectrum (age, disease severity, and pre-test probability), specimen handling (e.g., transport medium), and laboratory workflows (e.g., enrichment broths, agar type, number of agar types used, incubation conditions). In our dataset, at least six commercial multiplex platforms were represented, each potentially differing in gene targets, and positivity thresholds. In addition, three different agar types, with differing performance characteristics [4,5,6,7,8], could be identified. These factors alone can generate considerable heterogeneity and help explain the discrepancies between statistical methods. However, even when analyses were stratified by test brand or culture agar type, substantial heterogeneity persisted, as indicated by the wide credible intervals, suggesting that additional study-level factors—such as patient selection, disease severity, specimen transport and storage, or laboratory workflow—also influence observed accuracy. Additional simulation studies that vary in threshold effect, prevalence, sample size and degree of reference-standard imperfection, could be valuable to clarify under which conditions different meta-analytic models provide robust estimates of test performance.
The Bayesian HSROC model estimated higher Se and lower Sp of culture compared to multiplex NAAT/PCR. This pattern is supported by individual studies, particularly when culture is preceded by overnight enrichment [9,42,62]. In the study by Yoo et al. [72], three different brands of multiplex NAAT/PCR were evaluated against enriched culture; all demonstrated lower Se than culture, and one assay (Luminex) exhibited markedly poor Sp. Similarly, in a large prospective study of 6372 sequential stool samples from 5619 patients [9], the Se of multiplex NAAT/PCR was 89%, similar to what was found in our study. These patterns were broadly consistent when studies were stratified by index test brand, manufacturer funding, transport medium, and by culture agar type (HE, XLD, SS, or use of multiple agars), indicating that, within this heterogeneous evidence base, enrichment culture tends to be more sensitive but slightly less specific than multiplex NAAT/PCR.
From a clinical perspective, the high Sp and overall high Se of multiplex NAAT/PCR support its use as a rapid front-line test to accelerate diagnosis and inform early clinical management. However, NAAT/PCR as a stand-alone test with total replacement of culture has important implications for epidemiological data recording, because as already stated, NAAT/PCR does not provide an isolate for antimicrobial susceptibility testing and epidemiological surveillance. To mitigate this, laboratories may perform culture in parallel with NAAT/PCR or adopt reflex culture of NAAT/PCR-positive specimens; decision-analytic modelling (e.g., a decision tree) could be used to compare these strategies.
This meta-analysis has several strengths, including a systematic literature search of three large databases and the use of both frequentist and Bayesian methods, allowing for direct comparison of models that assume a perfect reference standard with those that do not. Nonetheless, it also has limitations. The literature search did not explicitly include grey literature or additional databases, which might have identified further studies but at the potential cost of lower methodological quality. Exploration of heterogeneity was restricted to parameters consistently reported across studies, such as index test brand and agar type; it was not feasible to examine the influence of other clinically relevant variables (e.g., age group) because of limited subgroup sizes. Subgroup analyses were constrained by small numbers of studies per category and sparse data, leading to wide credible intervals and limited ability to attribute heterogeneity to individual factors. Finally, applicability concerns about the reference standard were rated as unclear in six studies, because no detail on culture workflows (e.g., enrichment use, agar combinations) was given, and not even a report that standardised procedures were followed as done by other studies. This limits confidence in the transportability of pooled estimates to specific laboratory settings, particularly if it differs from the dominant workflows in the included studies.
Multiplex NAAT/PCR assays exhibit excellent Sp and high Se for detecting NT Salmonella spp., though inter-assay variability persists. Conventional culture remains highly accurate, particularly when enrichment is applied. Future work should prioritise standardisation and explicit reporting of culture protocols, as well as decision-analytic/cost-effectiveness analysis to optimise diagnostic testing algorithms.
Supplementary Materials
The following supporting information can be downloaded at https://www.mdpi.com/article/10.3390/pathogens15010045/s1, Figure S1: PRISMA flow diagram of the systematic process for the selection of the relevant studies [76]; Figure S2: The percentage of studies with low high or unclear (a) risk of bias and (b) concerns of applicability; Figure S3: Hierarchical summary ROC curve; Table S1. Signaling questions used in the risk of bias analysis (QUADAS 2 tool); Table S2. Rank of studies based on the QUADAS tool analysis; Tables S3. Prior distributions for the Bayesian models with or without gold standard; Table S4. Results from the Bayesian hierarchical latent class (LC-BHSROC) model; Table S5. Results from the conditional dependence Bayesian hierarchical latent (LC-BHSROC) model with weakly informative priors for the reference test.
Author Contributions
Conceptualisation and design of the study were performed by X.R., P.K., S.A.R.D. and L.F.-K. Screening and reviewing of the articles were conducted by X.R. and E.M., supervised by P.K. and supported by N.S. X.R. conducted the statistical analysis supervised by P.K. Data handling, analysis, and interpretation were performed by X.R., supervised by P.K., and supported by S.A.R.D. and L.F.-K. X.R. drafted the manuscript and P.K., S.A.R.D., N.S., E.M., O.L. and L.F.-K. critically revised, edited, and finalised the manuscript. All authors have read and agreed to the published version of the manuscript.
Funding
This research received no external funding.
Institutional Review Board Statement
Not applicable.
Informed Consent Statement
Not applicable.
Data Availability Statement
All data generated or analysed during this study are included in this published article (and its Supplementary Information Files).
Conflicts of Interest
The authors S.A.R.D., L.F.-K. and P.K. are co-authors of the article concerning the SCS method for DTA studies.
References
- European Food Safety Authority. The European Union One Health 2022 Zoonoses Report. EFSA J. 2023, 21, e8442. [Google Scholar] [CrossRef]
- European Food Safety Authority; European Centre for Disease Prevention and Control. The European Union One Health 2019 Zoonoses Report. EFSA J. 2021, 19, e06406. [Google Scholar] [CrossRef]
- European Food Safety Authority; European Centre for Disease Prevention and Control. The European Union summary report on antimicrobial resistance in zoonotic and indicator bacteria from humans, animals and food in 2021–2022. EFSA J. 2024, 22, e8583. [Google Scholar]
- Ruiz, J.; Núñez, M.-L.; Díaz, J.; Lorente, I.; Pérez, J.; Gómez, J. Comparison of five plating media for isolation of Salmonella species from human stools. J. Clin. Microbiol. 1996, 34, 686–688. [Google Scholar] [CrossRef]
- O’Neill, W.; Cooke, R.P.D.; Plumb, H.; Kennedy, P. ABC chromogenic agar: A cost-effective alternative to standard enteric media for Salmonella spp. isolation from routine stool samples. Br. J. Biomed. Sci. 2003, 60, 187–190. [Google Scholar] [CrossRef]
- Maddocks, S.; Olma, T.; Chen, S. Comparison of CHROMagar salmonella medium and xylose-lysine-desoxycholate and Salmonella-Shigella agars for isolation of Salmonella strains from stool samples. J. Clin. Microbiol. 2002, 40, 2999–3003. [Google Scholar] [CrossRef] [PubMed]
- Church, D.L.; Emshey, D.; Lloyd, T.; Pitout, J. Clinical and economic evaluation of BBLTM CHROMagarTM Salmonella (CHROMSal) versus subculture after selenite broth enrichment to CHROMSal and Hektoen enteric agars to detect enteric Salmonella in a large regional microbiology laboratory. Diagn. Microbiol. Infect. Dis. 2010, 68, 13–19. [Google Scholar] [CrossRef] [PubMed]
- Dusch, H.; Altwegg, M. Evaluation of five new plating media for isolation of Salmonella species. J. Clin. Microbiol. 1995, 33, 802–804. [Google Scholar] [CrossRef]
- Hapuarachchi, C.T.; Jeffery, K.J.M.; Bowler, I.C.J.W. Stool PCR may not be a substitute for enrichment culture for the detection of salmonella. J. Med. Microbiol. 2019, 68, 395–397. [Google Scholar] [CrossRef]
- Furuya-Kanamori, L.; Kostoulas, P.; Doi, S.A.R. A new method for synthesizing test accuracy data outperformed the bivariate method. J. Clin. Epidemiol. 2021, 132, 51–58. [Google Scholar] [CrossRef] [PubMed]
- Doi, S.A.R.; Barendregt, J.J.; Khan, S.; Thalib, L.; Williams, G.M. Advances in the meta-analysis of heterogeneous clinical trials I: The inverse variance heterogeneity model. Contemp. Clin. Trials 2015, 45, 130–138. [Google Scholar] [CrossRef]
- Reitsma, J.B.; Glas, A.S.; Rutjes, A.W.S.; Scholten, R.J.P.M.; Bossuyt, P.M.; Zwinderman, A.H. Bivariate analysis of sensitivity and specificity produces informative summary measures in diagnostic reviews. J. Clin. Epidemiol. 2005, 58, 982–990. [Google Scholar] [CrossRef]
- Chu, H.; Cole, S.R. Bivariate meta-analysis of sensitivity and specificity with sparse data: A generalized linear mixed model approach. J. Clin. Epidemiol. 2006, 59, 1331–1332. [Google Scholar] [CrossRef] [PubMed]
- Xie, X.; Sinclair, A.; Dendukuri, N. Evaluating the accuracy and economic value of a new test in the absence of a perfect reference test. Res. Synth. Methods 2017, 8, 321–332. [Google Scholar] [CrossRef] [PubMed]
- Cerullo, E.; Sutton, A.J.; Jones, H.E.; Wu, O.; Quinn, T.J.; Cooper, N.J. MetaBayesDTA: Codeless Bayesian meta-analysis of test accuracy, with or without a gold standard. BMC Med. Res. Methodol. 2023, 23, 127. [Google Scholar] [CrossRef]
- Yao, M.; Schiller, I.; Dendukuri, N. Shiny App for Bayesian Diagnostic Test Accuracy Meta-Analysis; Centre for Outcomes Research, McGill University Health Centre-Research Institute: Montréal, QC, Canada, 2023. [Google Scholar]
- Rutter, C.M.; Gatsonis, C.A. A hierarchical regression approach to meta-analysis of diagnostic test accuracy evaluations. Stat. Med. 2001, 20, 2865–2884. [Google Scholar] [CrossRef]
- Dendukuri, N.; Schiller, I.; Joseph, L.; Pai, M. Bayesian Meta-Analysis of the Accuracy of a Test for Tuberculous Pleuritis in the Absence of a Gold Standard Reference. Biometrics 2012, 68, 1285–1293. [Google Scholar] [CrossRef] [PubMed]
- Whiting, P.F.; Rutjes, A.W.; Westwood, M.E.; Mallett, S.; Deeks, J.J.; Reitsma, J.B.; Leeflang, M.M.; Sterne, J.A. BPQ-2 G. QUADAS-2: A Revised Tool for the Quality Assessment of Diagnostic Accuracy Studies. Ann. Intern. Med. 2011, 155, 529. [Google Scholar] [CrossRef]
- Moses, L.E.; Shapiro, D.; Littenberg, B. Combining independent studies of a diagnostic test into a summary roc curve: Data-analytic approaches and some additional considerations. Stat. Med. 1993, 12, 1293–1316. [Google Scholar] [CrossRef]
- Ochodo, E.A.; Reitsma, J.B.; Bossuyt, P.M.; Leeflang, M.M.G. Survey revealed a lack of clarity about recommended methods for meta-analysis of diagnostic accuracy data. J. Clin. Epidemiol. 2013, 66, 1281–1288. [Google Scholar] [CrossRef]
- Diaz, M. Performance measures of the bivariate random effects model for meta-analyses of diagnostic accuracy. Comput. Stat. Data Anal. 2015, 83, 82–90. [Google Scholar] [CrossRef]
- Furuya-Kanamori, L.; Meletis, E.; Xu, C.; Kostoulas, P.; Doi, S.A.R. Overconfident results with the bivariate random effects model for meta-analysis of diagnostic accuracy studies. J. Evid. Based Med. 2022, 15, 6–9. [Google Scholar] [CrossRef] [PubMed]
- Takwoingi, Y.; Dendukuri, N.; Schiller, I.; Rücker, G.; Jones, H.E.; Partlett, C.; Macaskill, P. Supplementary material 1 to Chapter 10: Code for undertaking meta-analysis. In Cochrane Handbook for Systematic Reviews of Diagnostic Test Accuracy; Deeks, J.J., Bossuyt, P.M., Leeflang, M.M., Takwoingi, Y., Eds.; Version 2.0 (Updated July 2023); Cochrane: London, UK, 2023; Available online: https://training.cochrane.org/handbook-diagnostic-test-accuracy/current (accessed on 26 December 2025).
- Zamora, J.; Abraira, V.; Muriel, A.; Khan, K.; Coomarasamy, A. Meta-DiSc: A software for meta-analysis of test accuracy data. BMC Med. Res. Methodol. 2006, 6, 31. [Google Scholar] [CrossRef] [PubMed]
- Patel, A.; Cooper, N.; Freeman, S.; Sutton, A. Graphical enhancements to summary receiver operating characteristic plots to facilitate the analysis and reporting of meta-analysis of diagnostic test accuracy data. Res. Synth. Methods 2021, 12, 34–44. [Google Scholar] [CrossRef]
- Freeman, S.C.; Kerby, C.R.; Patel, A.; Cooper, N.J.; Quinn, T.; Sutton, A.J. Development of an interactive web-based tool to conduct and interrogate meta-analysis of diagnostic test accuracy studies: MetaDTA. BMC Med. Res. Methodol. 2019, 19, 81. [Google Scholar] [CrossRef]
- R Core Team. R: A Language and Environment for Statistical Computing; R Foundation for Statistical Computing: Vienna, Austria, 2019; Available online: https://www.r-project.org/ (accessed on 1 March 2023).
- Denwood, M.J. runjags: An R package providing interface utilities, model templates, parallel computing methods and additional distributions for MCMC models in JAGS. J. Stat. Softw. 2016, 71, 1–25. [Google Scholar] [CrossRef]
- Zhou, Y.; Dendukuri, N. Statistics for quantifying heterogeneity in univariate and bivariate meta-analyses of binary data: The case of meta-analyses of diagnostic accuracy. Stat. Med. 2014, 33, 2701–2717. [Google Scholar] [CrossRef]
- Ahmed, A.O.; Abdelaziz, A.M.; Rashed, H.-A.G.; Tolba, M.; Mahmoud, A.A. Evaluation of a multiplex polymerase chain reaction for the diagnosis of infectious diarrhea in intensive care unit patients in Upper Egypt. Egypt. J. Immunol. 2024, 31, 1–9. [Google Scholar]
- Bessède, E.; Delcamp, A.; Sifré, E.; Buissonnière, A.; Mégraud, F. New Methods for Detection of Campylobacters in Stool Samples in Comparison to Culture. J. Clin. Microbiol. 2011, 49, 941–944. [Google Scholar] [CrossRef]
- Buchan, B.W.; Olson, W.J.; Pezewski, M.; Marcon, M.J.; Novicki, T.; Uphoff, T.S.; Chandramohan, L.; Revell, P.; Ledeboer, N.A. Clinical evaluation of a real-time PCR assay for identification of salmonella, shigella, campylobacter (Campylobacter jejuni and C. coli), and shiga toxin-producing escherichia coli isolates in stool specimens. J. Clin. Microbiol. 2013, 51, 4001–4007. [Google Scholar] [CrossRef]
- Buss, S.N.; Leber, A.; Chapin, K.; Fey, P.D.; Bankowski, M.J.; Jones, M.K.; Rogatcheva, M.; Kanack, K.J.; Bourzac, K.M. Multicenter Evaluation of the BioFire FilmArray Gastrointestinal Panel for Etiologic Diagnosis of Infectious Gastroenteritis. J. Clin. Microbiol. 2015, 53, 915–925. [Google Scholar] [CrossRef]
- Claas, E.C.; Burnham, C.-A.D.; Mazzulli, T.; Templeton, K.; Topin, F. Performance of the xTAG® gastrointestinal pathogen panel, a multiplex molecular assay for simultaneous detection of bacterial, viral, and parasitic causes of infectious gastroenteritis. J. Microbiol. Biotechnol. 2013, 23, 1041–1045. [Google Scholar] [CrossRef]
- Coupland, L.J.; Mcelarney, I.; Meader, E.; Cowley, K.; Alcock, L.; Naunton, J.; Gray, J. Simultaneous detection of viral and bacterial enteric pathogens using the Seeplex® Diarrhea ACE detection system. Epidemiol. Infect. 2013, 141, 2111–2121. [Google Scholar] [CrossRef]
- Cybulski, R.J.; Bateman, A.C.; Bourassa, L.; Bryan, A.; Beail, B.; Matsumoto, J.; Cookson, B.T.; Fang, F.C. Clinical Impact of a Multiplex Gastrointestinal Polymerase Chain Reaction Panel in Patients with Acute Gastroenteritis. Clin. Infect. Dis. 2018, 67, 1697–1704. [Google Scholar] [CrossRef]
- Deng, J.; Luo, X.; Wang, R.; Jiang, L.; Ding, X.; Hao, W.; Peng, Y.; Jiang, C.; Yu, N.; Che, X. A comparison of Luminex xTAG® Gastrointestinal Pathogen Panel (xTAG GPP) and routine tests for the detection of enteropathogens circulating in Southern China. Diagn. Microbiol. Infect. Dis. 2015, 83, 325–330. [Google Scholar] [CrossRef] [PubMed]
- Dror, S.K.; Pavlotzky, E.; Barak, M. Evaluation of the NanoCHIP® Gastrointestinal Panel (GIP) Test for Simultaneous Detection of Parasitic and Bacterial Enteric Pathogens in Fecal Specimens. PLoS ONE 2016, 11, e0159440. [Google Scholar] [CrossRef]
- Duong, V.T.; Phat, V.V.; Tuyen, H.T.; Dung, T.T.N.; Trung, P.D.; Minh, P.V.; Tu, L.T.P.; Campbell JILe Phuc, H.; Ha, T.T.T.; Ngoc, N.M.; et al. Evaluation of Luminex xTAG Gastrointestinal Pathogen Panel Assay for Detection of Multiple Diarrheal Pathogens in Fecal Samples in Vietnam. J. Clin. Microbiol. 2016, 54, 1094–1100. [Google Scholar] [CrossRef] [PubMed]
- Halligan, E.; Edgeworth, J.; Bisnauthsing, K.; Bible, J.; Cliff, P.; Aarons, E.; Klein, J.; Patel, A.; Goldenberg, S. Multiplex molecular testing for management of infectious gastroenteritis in a hospital setting: A comparative diagnostic and clinical utility study. Clin. Microbiol. Infect. 2014, 20, O460–O467. [Google Scholar] [CrossRef]
- Harrington, S.M.; Buchan, B.W.; Doern, C.; Fader, R.; Ferraro, M.J.; Pillai, D.R.; Rychert, J.; Doyle, L.; Lainesse, A.; Karchmer, T.; et al. Multicenter Evaluation of the BD Max Enteric Bacterial Panel PCR Assay for Rapid Detection of Salmonella spp., Shigella spp., Campylobacter spp. (C. jejuni and C. coli), and Shiga Toxin 1 and 2 Genes. J. Clin. Microbiol. 2015, 53, 1639–1647. [Google Scholar] [CrossRef]
- Hu, Q.; Lyu, D.; Shi, X.; Jiang, Y.; Lin, Y.; Li, Y.; Qiu, Y.; He, L.; Zhang, R.; Li, Q. A Modified Molecular Beacons–Based Multiplex Real-Time PCR Assay for Simultaneous Detection of Eight Foodborne Pathogens in a Single Reaction and Its Application. Foodborne Pathog. Dis. 2014, 11, 207–214. [Google Scholar] [CrossRef]
- Huang, R.S.P.; Johnson, L.C.; Pritchard, L.; Hepler, R.; Ton, T.T.; Dunn, J.J. Performance of the Verigene® enteric pathogens test, Biofire FilmArrayTM gastrointestinal panel and Luminex xTAG® gastrointestinal pathogen panel for detection of common enteric pathogens. Diagn. Microbiol. Infect. Dis. 2016, 86, 336–339. [Google Scholar] [CrossRef]
- Huang, S.-H.; Lin, Y.-F.; Tsai, M.-H.; Yang, S.; Liao, M.-L.; Chao, S.-W.; Hwang, C.-C. Detection of common diarrhea-causing pathogens in Northern Taiwan by multiplex polymerase chain reaction. Medicine 2018, 97, e11006. [Google Scholar] [CrossRef]
- Jo, S.J.; Kang, H.M.; Kim, J.O.; Cho, H.; Heo, W.; Yoo, I.Y.; Park, Y.-J. Evaluation of the biofire gastrointestinal panel to detect diarrheal pathogens in pediatric patients. Diagnostics 2022, 12, 34. [Google Scholar] [CrossRef]
- Kellner, T.; Parsons, B.; Chui, L.; Berenger, B.M.; Xie, J.; Burnham, C.-A.D.; Tarr, P.I.; Lee, B.E.; Nettel-Aguirre, A.; Szelewicki, J.; et al. Comparative Evaluation of Enteric Bacterial Culture and a Molecular Multiplex Syndromic Panel in Children with Acute Gastroenteritis. J. Clin. Microbiol. 2019, 57, e00205-19. [Google Scholar] [CrossRef]
- Khare, R.; Espy, M.J.; Cebelinski, E.; Boxrud, D.; Sloan, L.M.; Cunningham, S.A.; Pritt, B.S.; Patel, R.; Binnicker, M.J. Comparative evaluation of two commercial multiplex panels for detection of gastrointestinal pathogens by use of clinical stool specimens. J. Clin. Microbiol. 2014, 52, 3667–3673. [Google Scholar] [CrossRef]
- Knabl, L.; Grutsch, I.; Orth-Höller, D. Comparison of the BD MAX® Enteric Bacterial Panel assay with conventional diagnostic procedures in diarrheal stool samples. Eur. J. Clin. Microbiol. Infect. Dis. 2016, 35, 131–136. [Google Scholar] [CrossRef]
- Knoth, C.; Humphries, R.; Johnson, J.K.; Patel, A.; Lima, A.; Silbert, S.; Vinjé, J. Multicenter evaluation of BioCode GPP for syndromic molecular detection of gastrointestinal pathogens from stool specimens. J. Clin. Microbiol. 2024, 62, e0154523. [Google Scholar] [CrossRef] [PubMed]
- Koeffer, J.; Kolb, M.; Sorel, O.; Ulekleiv, C.; Feenstra, J.D.M.; Eigner, U. Clinical performance evaluation of TAQPATH Enteric Bacterial Select Panel for the detection of common enteric bacterial pathogens in comparison to routine stool culture and other qPCR-based diagnostic tests. Microbiol. Spectr. 2024, 12, e0317223. [Google Scholar] [CrossRef] [PubMed]
- Köffer, J.; Frontzek, A.; Eigner, U. Development and validation of a bacterial gastrointestinal multiplex RT-PCR assay for use on a fully automated molecular system. J. Microbiol. Methods 2023, 210, 106754. [Google Scholar] [CrossRef]
- Koo, S.H.; Heng, Y.X.; Jiang, B.; Ng, L.S.Y.; Sim, D.M.F.; Tan, T.Y. Evaluation of the clinical sensitivity and specificity of the BD MaxTM Enteric Bacterial Panel for molecular detection of pathogens for acute gastroenteritis in the Singaporean population. J. Microbiol. Methods 2022, 197, 106478. [Google Scholar] [CrossRef] [PubMed]
- Kosai, K.; Suzuki, H.; Tamai, K.; Okada, Y.; Akamatsu, N.; Ueda, A.; Notake, S.; Yaguchi, Y.; Yanagihara, K. Multicenter evaluation of Verigene Enteric Pathogens Nucleic Acid Test for detection of gastrointestinal pathogens. Sci. Rep. 2021, 11, 3033. [Google Scholar] [CrossRef]
- Liu, J.; Gratz, J.; Maro, A.; Kumburu, H.; Kibiki, G.; Taniuchi, M.; Howlader, A.M.; Sobuz, S.U.; Haque, R.; Talukder, K.A.; et al. Simultaneous Detection of Six Diarrhea-Causing Bacterial Pathogens with an In-House PCR-Luminex Assay. J. Clin. Microbiol. 2012, 50, 98–103. [Google Scholar] [CrossRef]
- Liu, J.; Gratz, J.; Amour, C.; Kibiki, G.; Becker, S.; Janaki, L.; Verweij, J.J.; Taniuchi, M.; Sobuz, S.U.; Haque, R.; et al. A Laboratory-Developed TaqMan Array Card for Simultaneous Detection of 19 Enteropathogens. J. Clin. Microbiol. 2013, 51, 472–480. [Google Scholar] [CrossRef]
- Martín, A.; Pérez-Ayala, A.; Chaves, F.; Lora, D.; Orellana, M.Á.Á. Evaluation of the multiplex PCR Allplex-GI assay in the detection of bacterial pathogens in diarrheic stool samples. J. Microbiol. Methods 2018, 144, 33–36. [Google Scholar] [CrossRef]
- McAuliffe, G.; Bissessor, L.; Williamson, D.; Moore, S.; Wilson, J.; Dufour, M.; Taylor, S.; Upton, A. Use of the EntericBio Gastro Panel II in a diagnostic microbiology laboratory: Challenges and opportunities. Pathology 2017, 49, 419–422. [Google Scholar] [CrossRef]
- Navidad, J.F.; Griswold, D.J.; Gradus, M.S.; Bhattacharyya, S. Evaluation of Luminex xTAG Gastrointestinal Pathogen Analyte-Specific Reagents for High-Throughput, Simultaneous Detection of Bacteria, Viruses, and Parasites of Clinical and Public Health Importance. J. Clin. Microbiol. 2013, 51, 3018–3024. [Google Scholar] [CrossRef] [PubMed]
- O’Leary, J.; Corcoran, D.; Lucey, B. Comparison of the EntericBio Multiplex PCR System with Routine Culture for Detection of Bacterial Enteric Pathogens. J. Clin. Microbiol. 2009, 47, 3449–3453. [Google Scholar] [CrossRef] [PubMed]
- Onori, M.; Coltella, L.; Mancinelli, L.; Argentieri, M.; Menichella, D.; Villani, A.; Grandin, A.; Valentini, D.; Raponi, M.; Russo, C. Evaluation of a multiplex PCR assay for simultaneous detection of bacterial and viral enteropathogens in stool samples of paediatric patients. Diagn. Microbiol. Infect. Dis. 2014, 79, 149–154. [Google Scholar] [CrossRef] [PubMed]
- Pankhurst, L.; Macfarlane-Smith, L.; Buchanan, J.; Anson, L.; Davies, K.; O’cOnnor, L.; Ashwin, H.; Pike, G.; Dingle, K.E.; Peto, T.E.; et al. Can rapid integrated polymerase chain reaction-based diagnostics for gastrointestinal pathogens improve routine hospital infection control practice? A diagnostic study. Health Technol. Assess. 2014, 18, 1–167. [Google Scholar] [CrossRef]
- Park, K.; Shin, B.-M. Comparative evaluation of two molecular multiplex syndromic panels with acute gastroenteritis: Multiplex Syndromic Tests for Gastroenteritis. Diagn. Microbiol. Infect. Dis. 2024, 109, 116211. [Google Scholar] [CrossRef]
- Patel, A.; Navidad, J.; Bhattacharyya, S. Site-specific clinical evaluation of the Luminex xTAG gastrointestinal pathogen panel for detection of infectious gastroenteritis in fecal specimens. J. Clin. Microbiol. 2014, 52, 3068–3071. [Google Scholar] [CrossRef]
- Perry, M.D.; Corden, S.A.; Howe, R.A. Evaluation of the luminex xTAG Gastrointestinal Pathogen Panel and the Savyon Diagnostics Gastrointestinal Infection Panel for the detection of enteric pathogens in clinical samples. J. Med. Microbiol. 2014, 63, 1419–1426. [Google Scholar] [CrossRef] [PubMed]
- Rintala, A.; Munukka, E.; Weintraub, A.; Ullberg, M.; Eerola, E. Evaluation of a multiplex real-time PCR kit Amplidiag® Bacterial GE in the detection of bacterial pathogens from stool samples. J. Microbiol. Methods 2016, 128, 61–65. [Google Scholar] [CrossRef] [PubMed]
- Roy, C.; Robert, D.; Bénéjat, L.; Buissonnière, A.; Ducournau, A.; Mégraud, F.; Bessède, E.; Boraud, D.; Lehours, P. Performance Evaluation of the Novodiag Bacterial GE+ Multiplex PCR Assay. J. Clin. Microbiol. 2020, 58, e01033-20. [Google Scholar] [CrossRef]
- Tilmanne, A.; Martiny, D.; Quach, C.; Wautier, M.; Vandenberg, O.; Lepage, P.; Hallin, M. Enteropathogens in paediatric gastroenteritis: Comparison of routine diagnostic and molecular methods. Clin. Microbiol. Infect. 2019, 25, 1519–1524. [Google Scholar] [CrossRef] [PubMed]
- Van Lint, P.; De Witte, E.; De Henau, H.; De Muynck, A.; Verstraeten, L.; Van Herendael, B.; Weekx, S. Evaluation of a real-time multiplex PCR for the simultaneous detection of Campylobacter jejuni, Salmonella spp., Shigella spp./EIEC, and Yersinia enterocolitica in fecal samples. Eur. J. Clin. Microbiol. Infect. Dis. 2015, 34, 535–542. [Google Scholar] [CrossRef]
- Wiemer, D.; Loderstaedt, U.; von Wulffen, H.; Priesnitz, S.; Fischer, M.; Tannich, E.; Hagen, R.M. Real-time multiplex PCR for simultaneous detection of Campylobacter jejuni, Salmonella, Shigella and Yersinia species in fecal samples. Int. J. Med. Microbiol. 2011, 301, 577–584. [Google Scholar] [CrossRef]
- Wohlwend, N.; Tiermann, S.; Risch, L.; Risch, M.; Bodmer, T. Evaluation of a Multiplex Real-Time PCR Assay for Detecting Major Bacterial Enteric Pathogens in Fecal Specimens: Intestinal Inflammation and Bacterial Load Are Correlated in Campylobacter Infections. J. Clin. Microbiol. 2016, 54, 2262–2266. [Google Scholar] [CrossRef]
- Yoo, J.; Park, J.; Lee, H.K.; Yu, J.K.; Lee, G.D.; Park, K.G.; Oak, H.C.; Park, Y.-J. Comparative evaluation of Seegene allplex gastrointestinal, luminex XTAG gastrointestinal pathogen panel, and BD Max enteric assays for detection of gastrointestinal pathogens in clinical stool specimens. Arch. Pathol. Lab. Med. 2019, 143, 999–1005. [Google Scholar] [CrossRef]
- Zhang, C.; Niu, P.; Hong, Y.; Wang, J.; Zhang, J.; Ma, X. A probe-free four-tube real-time PCR assay for simultaneous detection of twelve enteric viruses and bacteria. J. Microbiol. Methods 2015, 118, 93–98. [Google Scholar] [CrossRef]
- Zhang, J.; Guan, H.; Zhao, W.; Zhang, H.; Wang, W.; Ling, X.; Xiao, Y.; Guo, J.; Huang, Z.; Xu, Y.; et al. Evaluation of the BioFire FilmArray Gastrointestinal Panel and Real-Time Polymerase Chain Reaction Assays for the Detection of Major Diarrheagenic Pathogens by a Multicenter Diarrheal Disease Surveillance Program in China. Foodborne Pathog. Dis. 2019, 16, 788–798. [Google Scholar] [CrossRef] [PubMed]
- Chang, L.-J.; Hsiao, C.-J.; Chen, B.; Liu, T.-Y.; Ding, J.; Hsu, W.-T.; Su-Ortiz, V.; Chen, S.-T.; Su, K.-Y.; Wu, H.-P.; et al. Accuracy and comparison of two rapid multiplex PCR tests for gastroenteritis pathogens: A systematic review and meta-analysis. BMJ Open Gastroenterol. 2021, 8, e000553. [Google Scholar] [CrossRef] [PubMed]
- Haddaway, N.R.; Page, M.J.; Pritchard, C.C.; McGuinness, L.A. PRISMA2020: An R package and Shiny app for producing PRISMA 2020-compliant flow diagrams, with interactivity for optimised digital transparency and Open Synthesis. Campbell Syst. Rev. 2022, 18, e1230. [Google Scholar] [CrossRef] [PubMed]
Disclaimer/Publisher’s Note: The statements, opinions and data contained in all publications are solely those of the individual author(s) and contributor(s) and not of MDPI and/or the editor(s). MDPI and/or the editor(s) disclaim responsibility for any injury to people or property resulting from any ideas, methods, instructions or products referred to in the content. |
© 2025 by the authors. Licensee MDPI, Basel, Switzerland. This article is an open access article distributed under the terms and conditions of the Creative Commons Attribution (CC BY) license.