Abstract
The credibility of findings ensuing from cross-sectional survey research depends largely on the validity and reliability of the research instruments. Critical attention to the quality of such instruments will ensure logical and valid results. The purpose of this article is to provide evidence for two methodological issues observed that are potential threats to construct validity of widely used Teaching and Learning International Survey (TALIS) 2018 data on teacher job satisfaction scale (TJSS). The first issue concerns reverse recoding of some items necessary to obtain a coherence covariance between these items and other items on the same subscale. The second issue concerns the addition of item cross-loading necessary to improve the fit of the TJSS. Both conceptual and empirical arguments are provided in the current article to substantiate these observations. A series of structural equation modeling tests are evaluated to assess the measurement model of the TJSS across 27 randomly selected countries/economies that participated in the survey. The results reveal gross misspecifications in the measurement model if these issues are not addressed. An alternative two-factor structure with an item cross-loading is proposed and evaluated for TJSS and found acceptable across the countries/economies. Some implications of findings for methodologists and practitioners are presented.
1. Introduction
Effective teachers are considered cardinal to the development and improvement of the teaching-learning process across the globe. This importance of effective teachers is evident with the surge in research on teacher education and the rapid growth of the field over the last decades. Teachers with a high sense of self-efficacy, a good mastery of subject matter, and full of satisfaction with their teaching job are being sought after by school administrators, policymakers, and employers. Perhaps, for an apparent reason that such teachers are less prone to quitting the job, have low burnout, are innovative, motivate students to learn, and bring about improved learning outcomes (Skaalvik et al. 2011). Identifications of such teachers, coupled with recruiting and maintaining them on the teaching profession, have become a challenge for educators, policymakers, and other stakeholders.
One of the recent international attempts to identify these effective teachers is the conduction of the Teaching and Learning International Survey (TALIS). TALIS is a five-year cyclical survey that started in 2008 with 24 countries/economies and expanded to 48 countries/economies in 2018. It is part of the programs of the Organization for Economic Co-operation and Development (OECD) with a sole aim of providing “robust international indicators and policy-relevant analysis on teachers and teaching in order to help countries review and develop policies that promote conditions for effective teaching and learning” (Ainley and Carsten 2018). TALIS is a large-scale survey that provides international empirical evidence for current practices of both teachers and school leaders, e.g., principals. This survey covers primary school (ISCED 1), lower secondary school (ISCED 2), and upper secondary school (ISCED 3) teachers and principals since its 2013 cycle. Two separate questionnaires (teacher and principal versions) are usually prepared and administered in which respondents will rate their agreements on statements related to job satisfaction, instructional practices, school climate, teacher self-efficacy, and teacher-related factors. The results from these surveys have informed changes in many countries with substantial contributions to identifying, recruiting, and retaining effective teachers (OECD 2019a).
TALIS has consequently attracted global attention of educational researchers ever since the release of the 2013 survey data sets. A quick search for TALIS on the Web of Science core collection engine returned 167 articles published in top educational journals as of October 17, 2019. Eighteen out of these 167 articles were published in 2019 alone by the International Journal of Educational Research, Educational Researcher, Teaching and Teacher Education, Educational Measurement Issues and Practices, and Teachers and Teaching: Theory and Practice. The 2018 TALIS data sets were also released in June 2019 for the public benefit and encouraging more national/cross-national studies on teacher/principal practices. The released data sets were very comprehensive, including responses for national and international participants of teachers and principals around the three pre-university education levels. The national data sets contained responses of teachers, as well as principals, to the surveys for each participating country. In contrast, the international data sets contained combined responses of teachers as well as combined responses of principals across all the 48 participating countries and economies. However, two methodological issues are observed in these newly released TALIS data sets that are potential threats to construct validity of the teacher job satisfaction multidimensional scale for lower secondary school (ISCED 2) teachers. The first issue concerns coding of some items that should be reverse-coded, and the second issue concerns the addition of an item cross-loading that appears unavoidable based on some compelling empirical evidence.
Proper awareness of these issues is essential to researchers that rely on the use of these data sets. Primarily, researchers who use these data sets to investigate within a country or cross-country mean score comparisons of teacher job satisfaction as well as those who study relations between job satisfaction and other constructs using item-level structural equation modeling. The reason being that findings based on the analyses of these data sets can be misleading if the issues are not addressed. Thus, the main aim of this article is to provide conceptual and empirical evidence for these methodological issues and offer recommendations for dealing with it. The present article is hoped to serve a cautionary note to all researchers that are using these data and practitioners that rely on findings from TALIS worldwide. The author is not in any way claiming the arguments presented in this article are entirely flawless. Instead, justifications for issues raised, as well as recommendations, are informed by compelling evidence.
2. Literature
2.1. Background of the Problem
Teacher job satisfaction and other related personal constructs, such as self-efficacy, can be provided a theoretical foundation from the social-ecological theory perspective (Bronfenbrenner 1986; Darling 2007). The basic tenet of this theory, as applicable to teachers, is that internal feelings or self-evaluations of teachers, such as job satisfaction, are considered a construct that is consistently being shaped by interacting with the work environment. The work environment, in this case, includes school leaders, student relations, parent relations, and school community. Thus, teacher job satisfaction is a multidimensional construct. According to Ainley and Carsten (2018), teacher job satisfaction is conceptualized as “the sense of fulfillment and gratification that teachers experience through their work as a teacher” (p. 43). It includes teacher self-evaluations of the teaching job, which could be positive or negative (Skaalvik et al. 2015). As teacher job satisfaction is a multifaceted construct, earlier studies have reported five facets for this construct (e.g., Veldman et al. 2013). However, TALIS 2018 team conceptualized and operationalized three facets of teacher job satisfaction. These facets are: (a) “Teacher job satisfaction with work environment” (JSENV), (b) their “job satisfaction with profession” (JSPRO), and (c) their “job satisfaction with target class autonomy” (JSTCA), see (OECD 2019b).
However, data from only two facets of the teacher job satisfaction and the corresponding composite scale scores were released for ISCED 2 2018 survey. These subscales are: “Job satisfaction with work environment” (JSENV) and “Job satisfaction with profession” (JSPRO) with four-item each (OECD 2019b). The stem question adopted for these two subscales is, “We would like to know how you generally feel about your job. How strongly do you agree or disagree with the following statements?” in which teachers rate their level of agreement to the statements choosing one of the options between (1) strongly disagree to (4) strongly agree (OECD 2019b). The item labels and wordings of each subscale are presented in Table 1.

Table 1.
Item labels and wordings of the TALIS 2018 teacher job satisfaction scale.
The methodological issues addressed in this article were first observed while preparing TALIS 2018 for a national structural cross-validation study reported elsewhere (Zakariya 2020). The measurement model resulted in a poor fit with some unexpected negative item covariances between some indicators. The negative item covariances are not expected because the items are theorized to expose a common latent factor in their respective subscales. The poor fit of the measurement model was significantly improved by allowing item G53J—‘All in all, I am satisfied with my job’ to cross load on ‘Job satisfaction with profession’ subscale. Moreover, the negative covariances between items G53C, G53D, G53F, and other items in their respective subscales disappeared after recoding these items. The issue of this reverse-coding was mentioned in the TALIS technical report during their scale constructions and validations. However, empirical evidence suggests that this reverse-coding was not implemented in the published data. Awareness of this lack of reverse coding is essential for social science researchers while working with these data.
2.2. Related Studies
Several empirical studies have been reported using TALIS data on teacher job satisfaction, or some facets of it, and its relations with other constructs, such as teacher self-efficacy, school characteristics, and other related factors. For instance, Gil-Flores (2017) investigated the contribution of teachers’ traits and school factors on job satisfaction among Spanish teachers. Results from his hierarchical linear modeling revealed that age, sex, work experience, teacher self-efficacy, either fixed or tenure status of employment, classroom management are good predictors of teacher job satisfaction. It was found that teacher-student relations exert the most considerable influence on predicting teacher job satisfaction (Gil-Flores 2017). This finding could be interpreted to mean that the better the teacher-student relations, the better the teachers’ job satisfaction. Another study examines the interrelationship between teacher perception of distributed leadership, self-efficacy, and their job satisfaction across the 34 participating countries and economies in TALIS 2013 (Sun and Xia 2018). Teachers’ responses from 200 randomly selected schools in each country to make a total of 117,876 across the three pre-university education levels were used for this study. The results of the analyzed data using multilevel structural equation modeling at both teacher and school levels revealed two major findings. The first finding established a direct positive effect of teacher perception of distributed leadership on both self-efficacy and job satisfaction at the two levels (Sun and Xia 2018). This direct effect was more pronounced at the teacher level than at the school level. The second finding of the study provides empirical evidence for a mediating role played by teacher self-efficacy between the perception of distributed leadership in schools and job satisfaction (Sun and Xia 2018).
Another critical study is a pairwise comparison between lower secondary school teachers’ job satisfaction in the United Kingdom with 17 other participating countries in TALIS 2013 (Zieger et al. 2019). In this study, the latent variable approach was used to compare the mean scores of British lower secondary school teachers’ job satisfaction with that of 17 other countries. The latent variable approach is an example of item-level structural equation modeling in which rather than comparing means of composite scores of the scale as in the classical multivariate analysis of variance (MANOVA), the latent means of the factor are compared with approximate measurement invariance. The finding of their study is that lower secondary school teachers in England, on average, have the least job satisfaction as compared to the 17 countries (Zieger et al. 2019). This type of findings is critical to policymakers and other education stakeholders in order to improve teacher job satisfaction. However, reliance on such findings could be very problematic if the measuring instrument of teacher job satisfaction lacks construct validity. Thus, proper attention to any methodological issues that can threaten the validity of such an instrument is necessary.
3. Materials and Methods
3.1. Sample
The data used for the current study were extracted from the TALIS 2018 publicly available data. The TALIS 2018 team set a benchmark of at least 200 schools and 20 teachers in each selected school using stratified random sampling techniques. This sampling procedure, coupled with the associated sample sizes for teachers, was implemented in each participating country and economy. The response rates for both schools and teachers were pegged at 75% each, which gave an overall response rate of 56.25% in order to consider each country’s sample size representative of the population (OECD 2019b). Thousands of schools were covered around the world, which accrued to a large sample of 153682 lower secondary school teachers in 47 countries and economies (Iceland data were not released). In the current study, 27 out of these 47 countries/economies were selected at random (using random number technique in SPSS) to demonstrate supportive evidence for the observed methodological issues in the released data. It is the opinion of the author that these 27 countries (57.45%) are representative enough of the total population of the participating countries and economies. Coincidentally, it is slightly above the benchmark of 56.25% sufficient sample set by the TALIS 2018 team. Necessary information on sample sizes for sampled countries and economies is presented in Table 2.
Table 2.
Sample distribution of the study.
Table 2 reveals the valid sample of the current study to be 85,023 lower secondary school teachers after excluding 3211 teachers that have missing responses on all the items of the teacher job satisfaction scale.
3.2. Measures and Data Preparation
Teacher job satisfaction is proposed to be a two-dimensional construct in the current study and captured by two correlated latent constructs: JSENV (job satisfaction with work environment) and JSPRO (job satisfaction with profession). Consistent with the TALIS 2018 team, each of these latent constructs is operationalized and measured by respective items, as presented in Table 1. Each of these items forms the observed variables through which their own theorized latent constructs manifest. Two data sets were prepared from the extracted data. The first data set contained the extracted raw data as published by TALIS 2018 team while the second data set contained modified data with items G53C, G53D, and G53F recoded as follows 1 → 4, 2 → 3, 3→2 and 4 → 1 from old to new, respectively. The recoding was implemented to investigate one of the observed methodological issues. Each data set was screened for the pattern and the significance of the missing values using Little’s missing completely at random (MCAR) tests. The missing pattern was found to be at random, with less than 10% missing on each variable. Thus, for convenience, the default expectation maximum algorithm in Mplus software was used to handle the missing values.
3.3. Data Analysis
The analyses proceeded by evaluating two measurement models of the two-factor job satisfaction scale for each country presented in Table 2 using the prepared data sets. The first measurement model concerns a two-factor model (JSPRO and JSENV) with error covariance between items G53D and G53F as recommended by TALIS 2018 team (Figure 1). The first data set was used for these analyses, and the model was evaluated for each of the 27 randomly selected countries and economies.
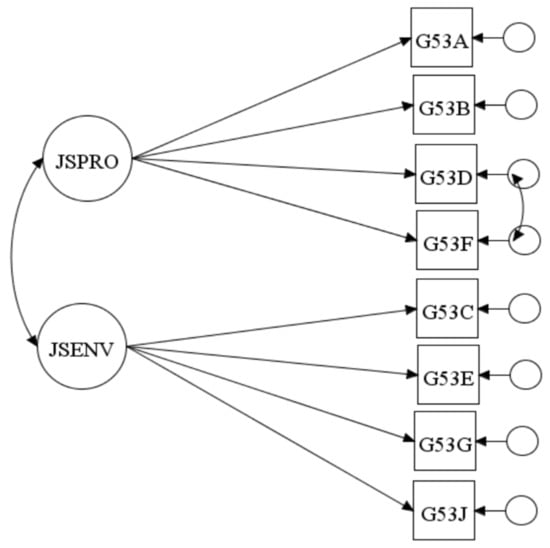
Figure 1.
The first measurement model of the two-factor teacher job satisfaction scale.
Figure 1 shows a two-factor measurement model of the teacher job satisfaction scale in which the two big oval shapes with labels JSPRO and JSENV represent the latent constructs of teacher job satisfaction with profession and teacher job satisfaction with work environment respectively. The double-headed arrow between these two oval shapes indicates the correlation between these constructs. It appears most preponderant that the TALIS 2018 team constrained this correlation to zero. The further argument will be provided with empirical evidence on the significance of including this correlation in the measurement model instead of fixing it to zero. The eight square boxes at the end of pointed arrows from JSPRO and JSENV represent the individual items (observed variables) that expose the latent constructs. The small oval shapes associated with short arrows pointing towards the items represent the corresponding residuals or measurement errors associated with these items. The double arrow between the residuals of items G53D and G53F indicates the error covariance between these items. The error covariance was recommended by the TALIS team to account for the errors associated with the negative wordings of these items.
The second measurement model is the proposed model and improvement of the first model that allows item G53J to cross load on the JSPRO factor using the second data set (Figure 2). This model has all its characteristics, like the first model except for the inclusion of one item cross-loading. This measurement model was evaluated for each of the 27 randomly selected countries and economies.
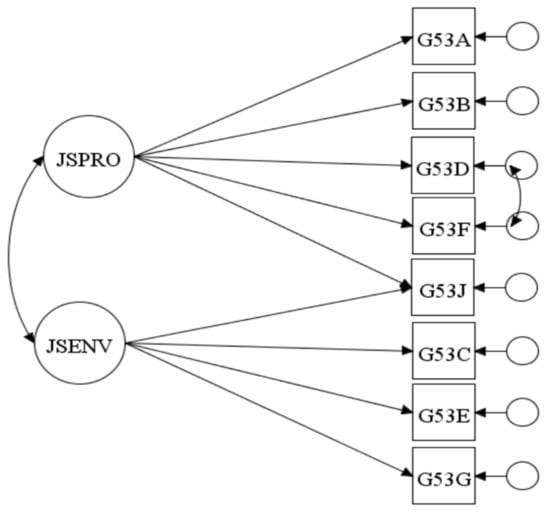
Figure 2.
The second (proposed) measurement model of the two-factor teacher job satisfaction scale.
A series of confirmatory factor analyses (CFAs) were conducted to evaluate these two measurement models across the 27 countries and economies using a robust maximum likelihood (MLR) estimator. CFA was used for these analyses because it appears to be the most appropriate tool since the construct under investigation has previously been theoretically and conceptually hypothesized. The focus of the current study is to validate and not to develop a new instrument. Moreover, MLR was used in estimating the model parameters such as factor loadings, item residuals, and intercepts, because it was presumably used by the TALIS team in their validation studies of the scales. An alternative estimator that could have been used is weighted least square mean and variance adjusted (WLSMV) given the ordinal nature of the data. However, both WLSMV and MLR have been reported to perform equally well in the analysis of ordinal data, especially when a large sample size (greater 1000) is involved (Suh 2015).
The model fits were assessed using selected goodness of fits (GOF) indices such as Tucker–Lewis index (TLI), comparative fit index (CFI), root mean square error of approximation (RMSEA), and standardized root mean square residual (SRMR). These GOF indices were used because of the several empirical studies that have demonstrated their satisfactory fitting performance, e.g., (Zakariya 2019). Given the large sample size involved in the current study, the chi-square statistic was not used to assess the model fits directly because of its tendency to reject an acceptable model in the presence of a large sample size (Chen 2007). However, when comparing the differences between two competing models, the chi-square difference test with Satorra–Bentler correction (Satorra and Bentler 2010) was used coupled with other GOF indices. There is no golden rule, to the best of author’s knowledge, on GOF indices cut-off criteria for acceptable model fits. For this reason, an acceptable model fit was assessed with the following criteria: TLI, CFI close to or ≥ 0.95, RMSEA, and SRMR ≤ 0.08 (Hu and Bentler 1999; Browne and Cudeck 1992).
4. Results
Results from the analyses of the first measurement model are presented in Table 3 for each selected country or economy. The chi-square degree of freedom is 18 for each country or economy, and the selected GOF indices are approximated to three decimal places for convenience, including standardized correlations between the two latent factors JSENV and JSPRO.
Table 3.
Selected GOF indices for the first measurement models of the TALIS 2018 teacher job satisfaction scale.
The results in Table 3 revealed poor fits of the measurement models across all the 27 countries and economies except for Mexico ( (18) = 174.584, p < 0.05, RMSEA = 0.055, CFI = 0.943, TLI = 0.912, and SRMR = 0.039) and Portugal ( (18) = 374.876, p < 0.05, RMSEA = 0.074, CFI = 0.953, TLI = 0.927, and SRMR = 0.067) which can be considered to demonstrate acceptable fits. The poor fits of all other countries can be deduced from high chi-square values, low TLI and CFI values, and high RMSEA and SRMR values. There are also negative inter-item covariances between items G53C, G53D, G53F, and other items in their respective subscales in both the input and the output variance-covariance matrices of all the 27 countries and economies used in analyses. One of the effects of these negative covariances can be read directly from Table 3 with the negative significant standardized correlation between the two latent factors JSENV and JSPRO, for each country. This could be interpreted to mean that higher teacher job satisfaction with work environment leads to lower job satisfaction with the profession. This is unexpected and appears to be conceptually not plausible because these two facets are theorized to expose the same latent construct of job satisfaction in the same direction.
In order to proceed with the analyses, the data set was changed, and the second measurement model was evaluated for each country and economy. Results from these analyses are presented in Table 4 for all the 27 selected countries or economies. The chi-square degree of freedom dropped to 17 as a result of the inclusion of one item cross-loading. The chi-square values from Table 3 are included in Table 4 for natural juxtaposition with the new chi-square values (in bold faces), and the respective changes in chi-square values between individual country or economy after using Satorra–Bentler corrections are presented.
Table 4.
Selected GOF indices for the second measurement models of the TALIS 2018 teacher job satisfaction scale.
It is very clear from the results presented in Table 4 that there were significant improvements in the measurement models when item G53J was cross-loaded on JSPRO across all the 27 countries and economies. This improvement is evident from the significant reduction in chi-square values, high TLI and CFI values, and low RMSEA and SRMR values. For instance, the chi-square value for Belgium substantially reduced from 1194.984 to 330.529 when item G53J was cross-loaded on the JSPRO subscale. The MLR chi-square difference test with Satorra–Bentler correction was found to be significant . All the GOF indices TLI, CFI, RMSEA and SRMR significantly improved from 0.838, 0.896, 0.114, 0.080 to 0.954, 0.972, 0.061, 0.027 respectively. According to Hu and Bentler’s (1999) criteria, these are indicative of excellent model fits. Similar patterns of model improvement can also be seen in the presented results for all the countries in Table 4. Every other country or economy demonstrates acceptable fits of the model except for Shanghai ( (17) = 440.079, p < 0.05, RMSEA = 0.080, CFI = 0.926, TLI = 0.879, and SRMR = 0.050), South Africa ( (17) = 307.746, p < 0.05, RMSEA = 0.092, CFI = 0.918, TLI = 0.865, and SRMR = 0.053) and Viet Nam ( (17) = 395.937, p < 0.05, RMSEA = 0.076, CFI = 0.912, TLI = 0.856, and SRMR = 0.049) whose results failed one or two criteria. However, these countries show significant improvement in their measurement models, as compared to the first models.
The results in Table 4 also reveal some significant standardized correlation coefficients between the two latent factors JSENV and JSPRO. The correlations now turned positive, though, with general reductions in absolute values, as compared to the first model in each country or economy. The positive and general reduction in absolute is a manifestation of the items G53C, G53D, G53F that are reverse-coded. The positive correlation between JSENV and JSPRO now appears to be conceptually more plausible when interpreted for each country or economy.
5. Discussion and Limitations
5.1. Discussion and Implications of Findings
It is popularly said that the validity of any behavioral, educational, and social science research depends mainly on the quality of measures of the data used. Quantitative cross-sectional survey researchers do pay keen attention to the validity and reliability of research instruments in order to ensure trustworthiness and plausible interpretations of research findings. With the growing popularity and global campaigns for open science data in education and other fields, one must be a bit critical of using secondary data sources. Based on these premises, this study was motivated to create awareness of two methodological issues inherent in some data released by the TALIS 2018 team for the recently completed international teacher survey. These issues could threaten the validity of studies based on these data, especially those studies on item-level structural equation modeling of some factors related to teacher job satisfaction. In order to substantiate the observed methodological issues, 27 countries and economies were randomly selected out of the total population of 47 participating countries/economies, and extensive analyses were conducted.
The first issue concerns reverse-coding of items G53C: I would like to change to another school if that were possible, G53D: I regret that I decided to become a teacher, and G53F: I wonder whether it would have been better to choose another profession. These three items are mentioned to be reverse-coded during the scale construction and validation process in the TALIS 2018 technical report. However, evidence suggests that the final 2018 survey data released to the public appear to lack this reverse-coding. Perhaps, it is a deliberate attempt by the TALIS team for those who will study ’method–effect’ using the data. Item covariance, as well as correlation matrices of all the 27 countries and economies, investigated revealed negative covariances of these three items with their respective subscale items. The negative covariances are unexpected. Reverse-coding was done considering the stem of the question, “We would like to know how you generally feel about your job. How strongly do you agree or disagree with the following statements?” as well as the response options (1) strongly disagree to (4) strongly agree (OECD 2019b). Furthermore, when these items were reverse-coded in the current study, the negative covariances, as well as correlations (Pearson and polychoric), turned positive in all the 27 countries and economies that were investigated. This seems consistent with the conceptualization of these constructs.
One implication of this finding for both the methodologists and practitioners is the unexpected negative correlations between the two latent constructs. This could lead to a false negative effect in structural equation modeling when any of these constructs is related to another construct, e.g., self-efficacy. For instance, teachers with a high sense of self-efficacy in classroom instruction could be identified with low job satisfaction. Perhaps, this is possible at an individual level, but it calls for concerns when it applies to a large group of teachers. It is important to remark that the reverse coding of these items might not affect the overall model fits, especially in large sample surveys like TALIS.
On the other hand, it might underestimate the weighted averages of the respective subscales to which the items belong. Another peculiar remark on the data from Lithuania is that even after the items were reverse-coded, item G53F still had negative covariances with the other three items in the ‘job satisfaction with profession subscale’. Perhaps, this could be linked to other factors that could emanate from the scale translation process. Thus, further investigations are recommended on this issue with Lithuania data.
The second methodological issue concerns allowing item G53J: ‘All in all, I am satisfied with my job’ to cross load on the ‘job satisfaction with profession’ subscale in addition to the ‘job satisfaction with work environment’ subscale that it was initially theorized. The findings of this study provide empirical evidence to support this item cross-loading. More so, from a conceptual perspective, the statement ‘All in all, I am satisfied with my job’ seems to capture a substantial aspect of teacher job satisfaction with their profession. This is coupled with the fact that the item was the last item in the questionnaire stem question where teachers are to rate their job satisfaction. That means the position of the item could also prompt teachers to think that the item reflects their job satisfaction with the profession rather than job satisfaction with a specific work environment. Thus, it can be deduced from both the statistical and the conceptual perspectives that the cross-loading of item G53J to the ‘job satisfaction with profession’ subscale is justified. It is the opinion of the author and a suggestion to the TALIS team that item G53I: “I am satisfied with my performance in this school” could be a potential item for exposing ‘teacher job satisfaction with work environment’.
One might argue that the poor model results are due to MLR presumably used by the TALIS team rather than the weighted least square mean and variance adjusted (WLSMV) estimator and some other related arguments of when to treat categorical items as continuous (Suh 2015). This argument seems to be legitimate, especially with four response options involved in the questionnaire. The argument was investigated by changing the estimator to WLSMV in the analyses across the 27 countries/economies, and there was no substantial improvement in the model fits. It was generally observed that the estimated values of TLI and CFI were slightly improved as compared to when MLR was used. However, this improvement was marred by higher chi-square values and higher RMSEA values across all the countries and economies. For instance, the following statistics were found when WLSMV was used to evaluate the measurement model of Malta data: (18) = 1115.782, p < 0.001, RMSEA = 0.197 (90% C.I. = 0.188–0.027, CFit < 0.001), CFI = 0.930, TLI = 0.891, and SRMR = 0.079. These statistics appear not so much different from the results presented in Table 3 and still suggestive of poor fits of the measurement model (Hu and Bentler 1999). Thus, the choice of estimators between MLR and WLSMV does not make a substantial difference in the results.
It is also acknowledged that this issue of the item G53J cross-loading on ‘job satisfaction with profession’ subscale might not be relevant to those researchers that have fate in weighted composite scores derived through item parceling. Undoubtedly, the weighted composite score using item parceling approach is the method adopted by the TALIS 20018 team such that the one-factor model was fitted for each of the teacher job satisfaction subscales and then responses from items in each subscale were weighted. This is evident with the reported excellent fits of these subscales and their provision of the weighted average scores for each subscale. The elusive strength of this approach lies in the achievement of excellent model fits and, most importantly, convenient use of weighted scores in subsequent analyses (Bandalos 2008). However, some severe defects in the data, e.g., unexpected negative covariance, could be hidden, and unidimensionality is inherently assumed. Further, significant correlations between latent constructs, such as the ones revealed in this study, might be ignored. Teacher job satisfaction being a multidimensional scale, it will be more plausible to treat it as such by allowing interactions between its subscale factors. Thus, it is crucial to consider a two-factor model of the teacher job satisfaction as proposed in the current article such that opportunity is given for items to cross load, and non-trivial factor correlations can easily be determined.
5.2. Limitations
Despite the strength of this study in exposing the methodological issues presented therein, some potential limitations can be acknowledged. First, the author assumed that the sample size for each country is large enough for the measurement model evaluations. However, this assumption was not tested. Second, the author did not evaluate multigroup comparisons of the proposed measurement model or test its measurement invariance within or across the countries. Future study with this intention is needed. Lastly, the author did not include any covariate, e.g., gender, year of teaching experience, and other fixed factors in the proposed measurement model. It will be interesting to see how these covariates will affect the model parameter estimates in the future.
6. Conclusions
In this article, attempts are made to create awareness of two methodological issues that could pose potential threats to the construct validity of the TALIS 2018 teacher job satisfaction scale. Although job satisfaction is an essential factor in teaching and teacher training, the validity of its measures is equally important. The empirical evidence provided in this article, as well as the recommendations therein, are not in any way aimed to undermine the excellent work done by the TALIS 2018 team. Instead, findings reported in this article are seen to complement their job well-done as well as to serve as cautions to most researchers dealing with item-level structural modeling of teacher job satisfaction based on these data. The findings on one side also corroborate the importance of thorough screening of research data before analyses. On the other side, they also expose some rarely reported defects, such as lack of opportunity for items to cross-load and overlooking non-trivial factor correlations that are inherent in fitting the one-factor model for each facet of a multifaceted construct.
Funding
No funding information to declare.
Acknowledgments
The author acknowledges the financial support of the University of Agder library for paying article processing charge (APC) of this article.
Conflicts of Interest
The author declares no conflict of interest.
References
- Ainley, John, and Ralph Carstens. 2018. Teaching and Learning International Survey (TALIS) 2018. In Conceptual Framework, OECD Working Papers. Paris: OECD Publishing. [Google Scholar]
- Bandalos, D.L. 2008. Is parceling really necessary? A comparison of results from item parceling and categorical variable methodology. Structural Equation Modeling 15: 211–40. [Google Scholar] [CrossRef]
- Bronfenbrenner, Urie. 1986. Ecology of the family as a context for human development: Research perspectives. Developmental Psychology 22: 723–42. [Google Scholar] [CrossRef]
- Browne, Michael W., and Robert Cudeck. 1992. Alternative ways of assessing model fit. Sociological Methods Research: SAGE Journals 21: 230–58. [Google Scholar] [CrossRef]
- Chen, Fang Fang. 2007. Sensitivity of goodness of fit indexes to lack of measurement invariance. Structural Equation Modeling 14: 464–504. [Google Scholar] [CrossRef]
- Darling, Nancy. 2007. Ecological systems theory: The person in the center of the circles. Research in Human Development 4: 203–17. [Google Scholar] [CrossRef]
- Gil-Flores, Javier. 2017. The role of personal characteristics and school characteristics in explaining teacher job satisfaction. Revista de Psicodidáctica (English ed.) 22: 16–22. [Google Scholar] [CrossRef]
- Hu, Li-tze, and Peter M. Bentler. 1999. Cutoff criteria for fit indexes in covariance structure analysis: Conventional criteria versus new alternatives. Structural Equation Modeling 6: 1–55. [Google Scholar] [CrossRef]
- OECD. 2019a. TALIS 2018 Results (Volume I): Teachers and School Leaders as Lifelong Learners. Paris: TALIS, OECD Publishing. [Google Scholar]
- OECD. 2019b. TALIS 2018 Technical Report. Paris: TALIS, OECD Publishing. [Google Scholar]
- Satorra, Albert, and Peter M. Bentler. 2010. Ensuring positiveness of the scaled difference chi-square test statistic. Psychometrika 75: 243–48. [Google Scholar] [CrossRef] [PubMed]
- Skaalvik, Einar M., and Sidsel Skaalvik. 2011. Teacher job satisfaction and motivation to leave the teaching profession: Relations with school context, feeling of belonging, and emotional exhaustion. Teaching and Teacher Education 27: 1029–38. [Google Scholar] [CrossRef]
- Skaalvik, Einar M., Roger A. Federici, and Robert M. Klassen. 2015. Mathematics achievement and self-efficacy: Relations with motivation for mathematics. International Journal of Educational Research 72: 129–36. [Google Scholar] [CrossRef]
- Suh, Youngsuk. 2015. The performance of maximum likelihood and weighted least square mean and variance adjusted estimators in testing differential item functioning with nonnormal trait distributions. Structural Equation Modeling 22: 568–80. [Google Scholar] [CrossRef]
- Sun, Anna, and Jiangang Xia. 2018. Teacher-perceived distributed leadership, teacher self-efficacy and job satisfaction: A multilevel SEM approach using the 2013 TALIS data. International Journal of Educational Research 92: 86–97. [Google Scholar] [CrossRef]
- Veldman, Ietje, Janvan Tartwijk, Mieke Brekelmans, and Theo Wubbels. 2013. Job satisfaction and teacher–student relationships across the teaching career: Four case studies. Teaching and Teacher Education 32: 55–65. [Google Scholar] [CrossRef]
- Zakariya, Yusuf F. 2019. Study approaches in higher education mathematics: Investigating the statistical behaviour of an instrument translated into Norwegian. Education Science 9: 191. [Google Scholar]
- Zakariya, Yusuf F. 2020. Validation and cross-validation of a model that explains the effects of school climate, teacher self-efficacy on job satisfaction: A structural multigroup invariance approach. International Journal of STEM Education 7: 10. [Google Scholar] [CrossRef]
- Zieger, Laura, Sam Sims, and John Jerrim. 2019. Comparing teachers’ job satisfaction across countries: A multiple-pairwise measurement invariance approach. Educational Measurement 38: 75–85. [Google Scholar] [CrossRef]
© 2020 by the author. Licensee MDPI, Basel, Switzerland. This article is an open access article distributed under the terms and conditions of the Creative Commons Attribution (CC BY) license (http://creativecommons.org/licenses/by/4.0/).