
Assessing the Play Provisions for Children in Urban Neighborhoods of India: Case Study Nagpur, Maharashtra

Abstract
:1. Introduction
1.1. Children and Their Local Play in Urban Residential Environments
1.2. Children’s Needs
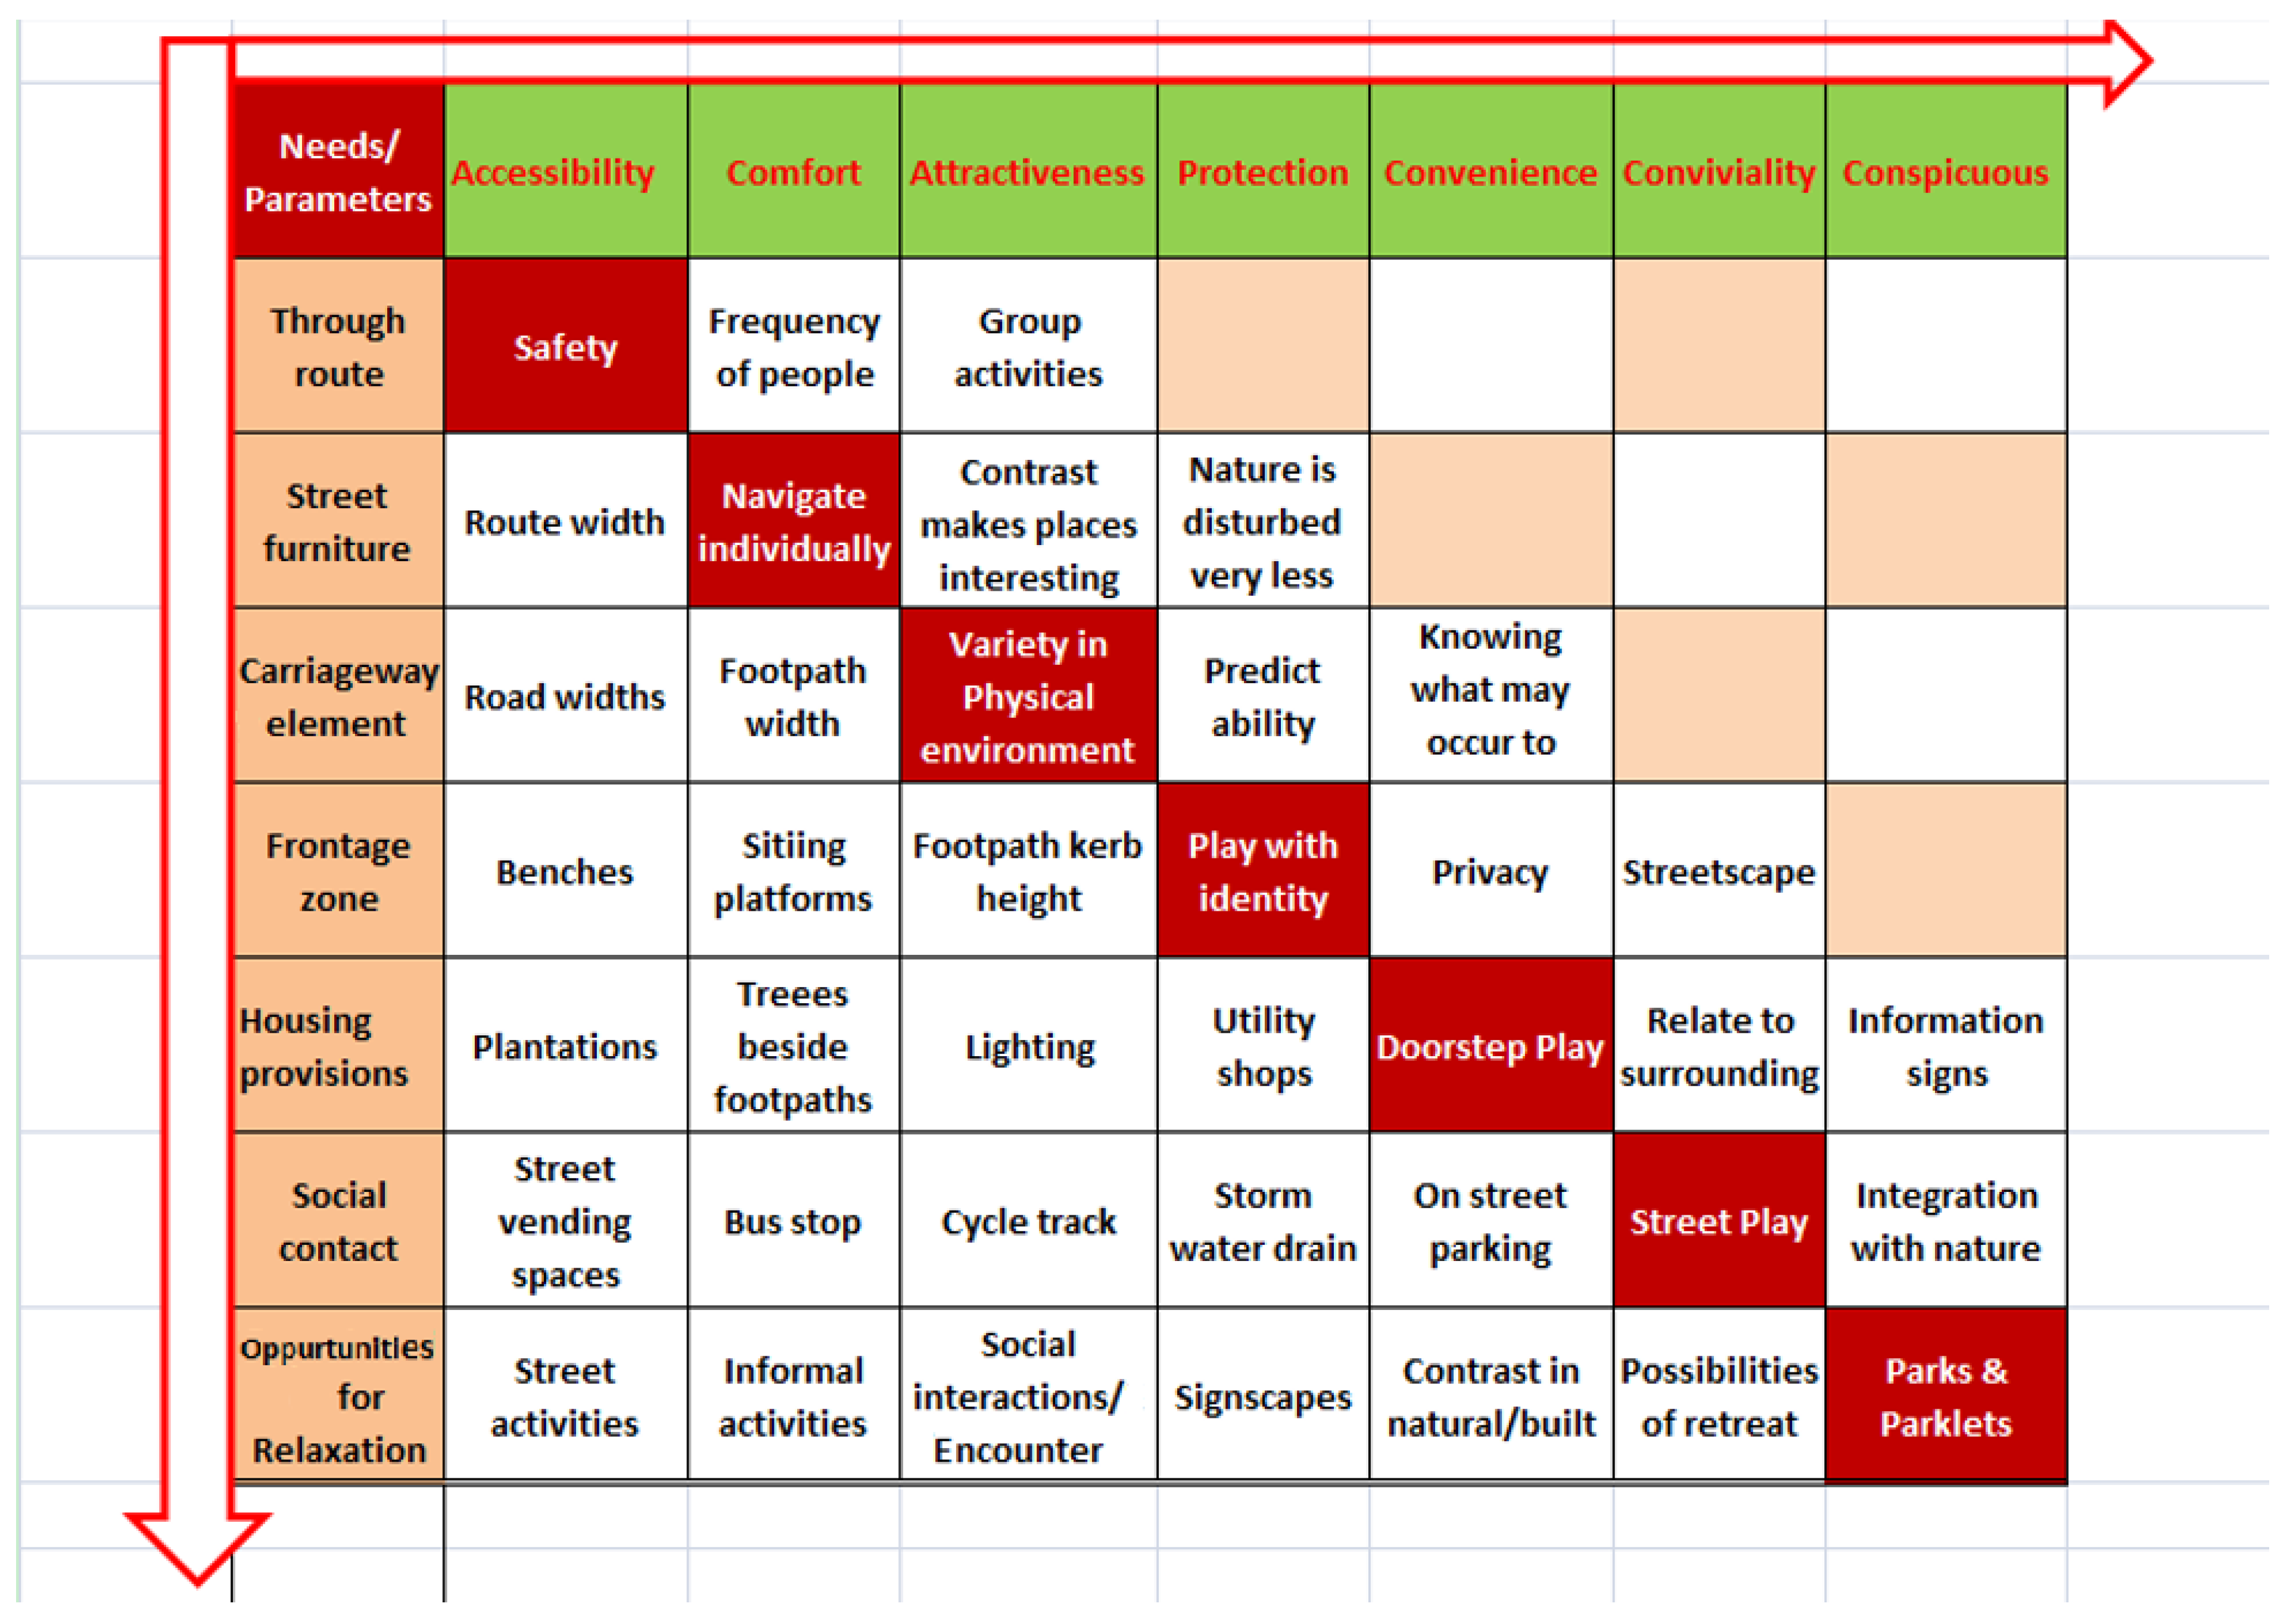
- (a)
- Physiological need—The comfort experienced during physical movements and actions such as walking, sitting, standing, seeing and hearing playing or unfolding activities. Spaces obstruction free and increases competences.
- Accessibility—It is the relative nearness of one place to another indicating easiness of reaching destination from origin. As a spatial analytic measure it plays a vital role for decision makers in deciding where to locate public facilities or amenities to maximize utility.
- Comfort—Increasing ones competences/abilities. When children feel comfortable in their physical surroundings they will venture to explore materials or events around them. Most likely these settings involve varied and moderate levels of stimulation for all senses. Patterns of movement that are moderately diverse help maintain optimum levels of responsiveness and make children feel comfortable.
- Connectivity—The extent to which the pedestrian network provides continuous movement without any physical obstructions links to key trip origins and destinations as well as the extent of linkages between different routes on network.
- (b)
- Physical needs—The comfort experienced from external influences like climatic protection, traffic accidents, walking path modal conflicts.
- Safety—It means safety from stumbling, tripping, slipping and traffic accidents. Children have great concerns about their personal safety but their strategies for dealing with danger are limited. Living in a state of continual concern about personal safety can wear the body’s immune system, capacity to relax and overall health. Measures like physical barriers, segregation of traffic, nooks and corners and level changes can be incorporated.
- Protection from sun winds and rains.
- Convenience of walking over other modes of transport.
- (c)
- Physiological needs—The mental and emotional comfort achieved from the sensory and memorable experiences such as legibility, sense of place and belongingness, personal security, relaxation, active and passive engagement, enjoyment, equity and discovery.
- Conviviality—Traversing with active and passive engagement like interaction with people, natural and built environment and other road users.
- Conspicuous—Clear and legible signing, information, orientation and direction.
- Attractiveness—Quality of aesthetics, appealing to senses and interesting.
1.3. Objective and Hypotheses
- (1)
- The perceived quality of urban residential environment is a hierarchial multi attribute concept.
- (2)
- Enhancing the psycho-social attributes and child friendly parameters can improve the residential satisfaction among the residents.
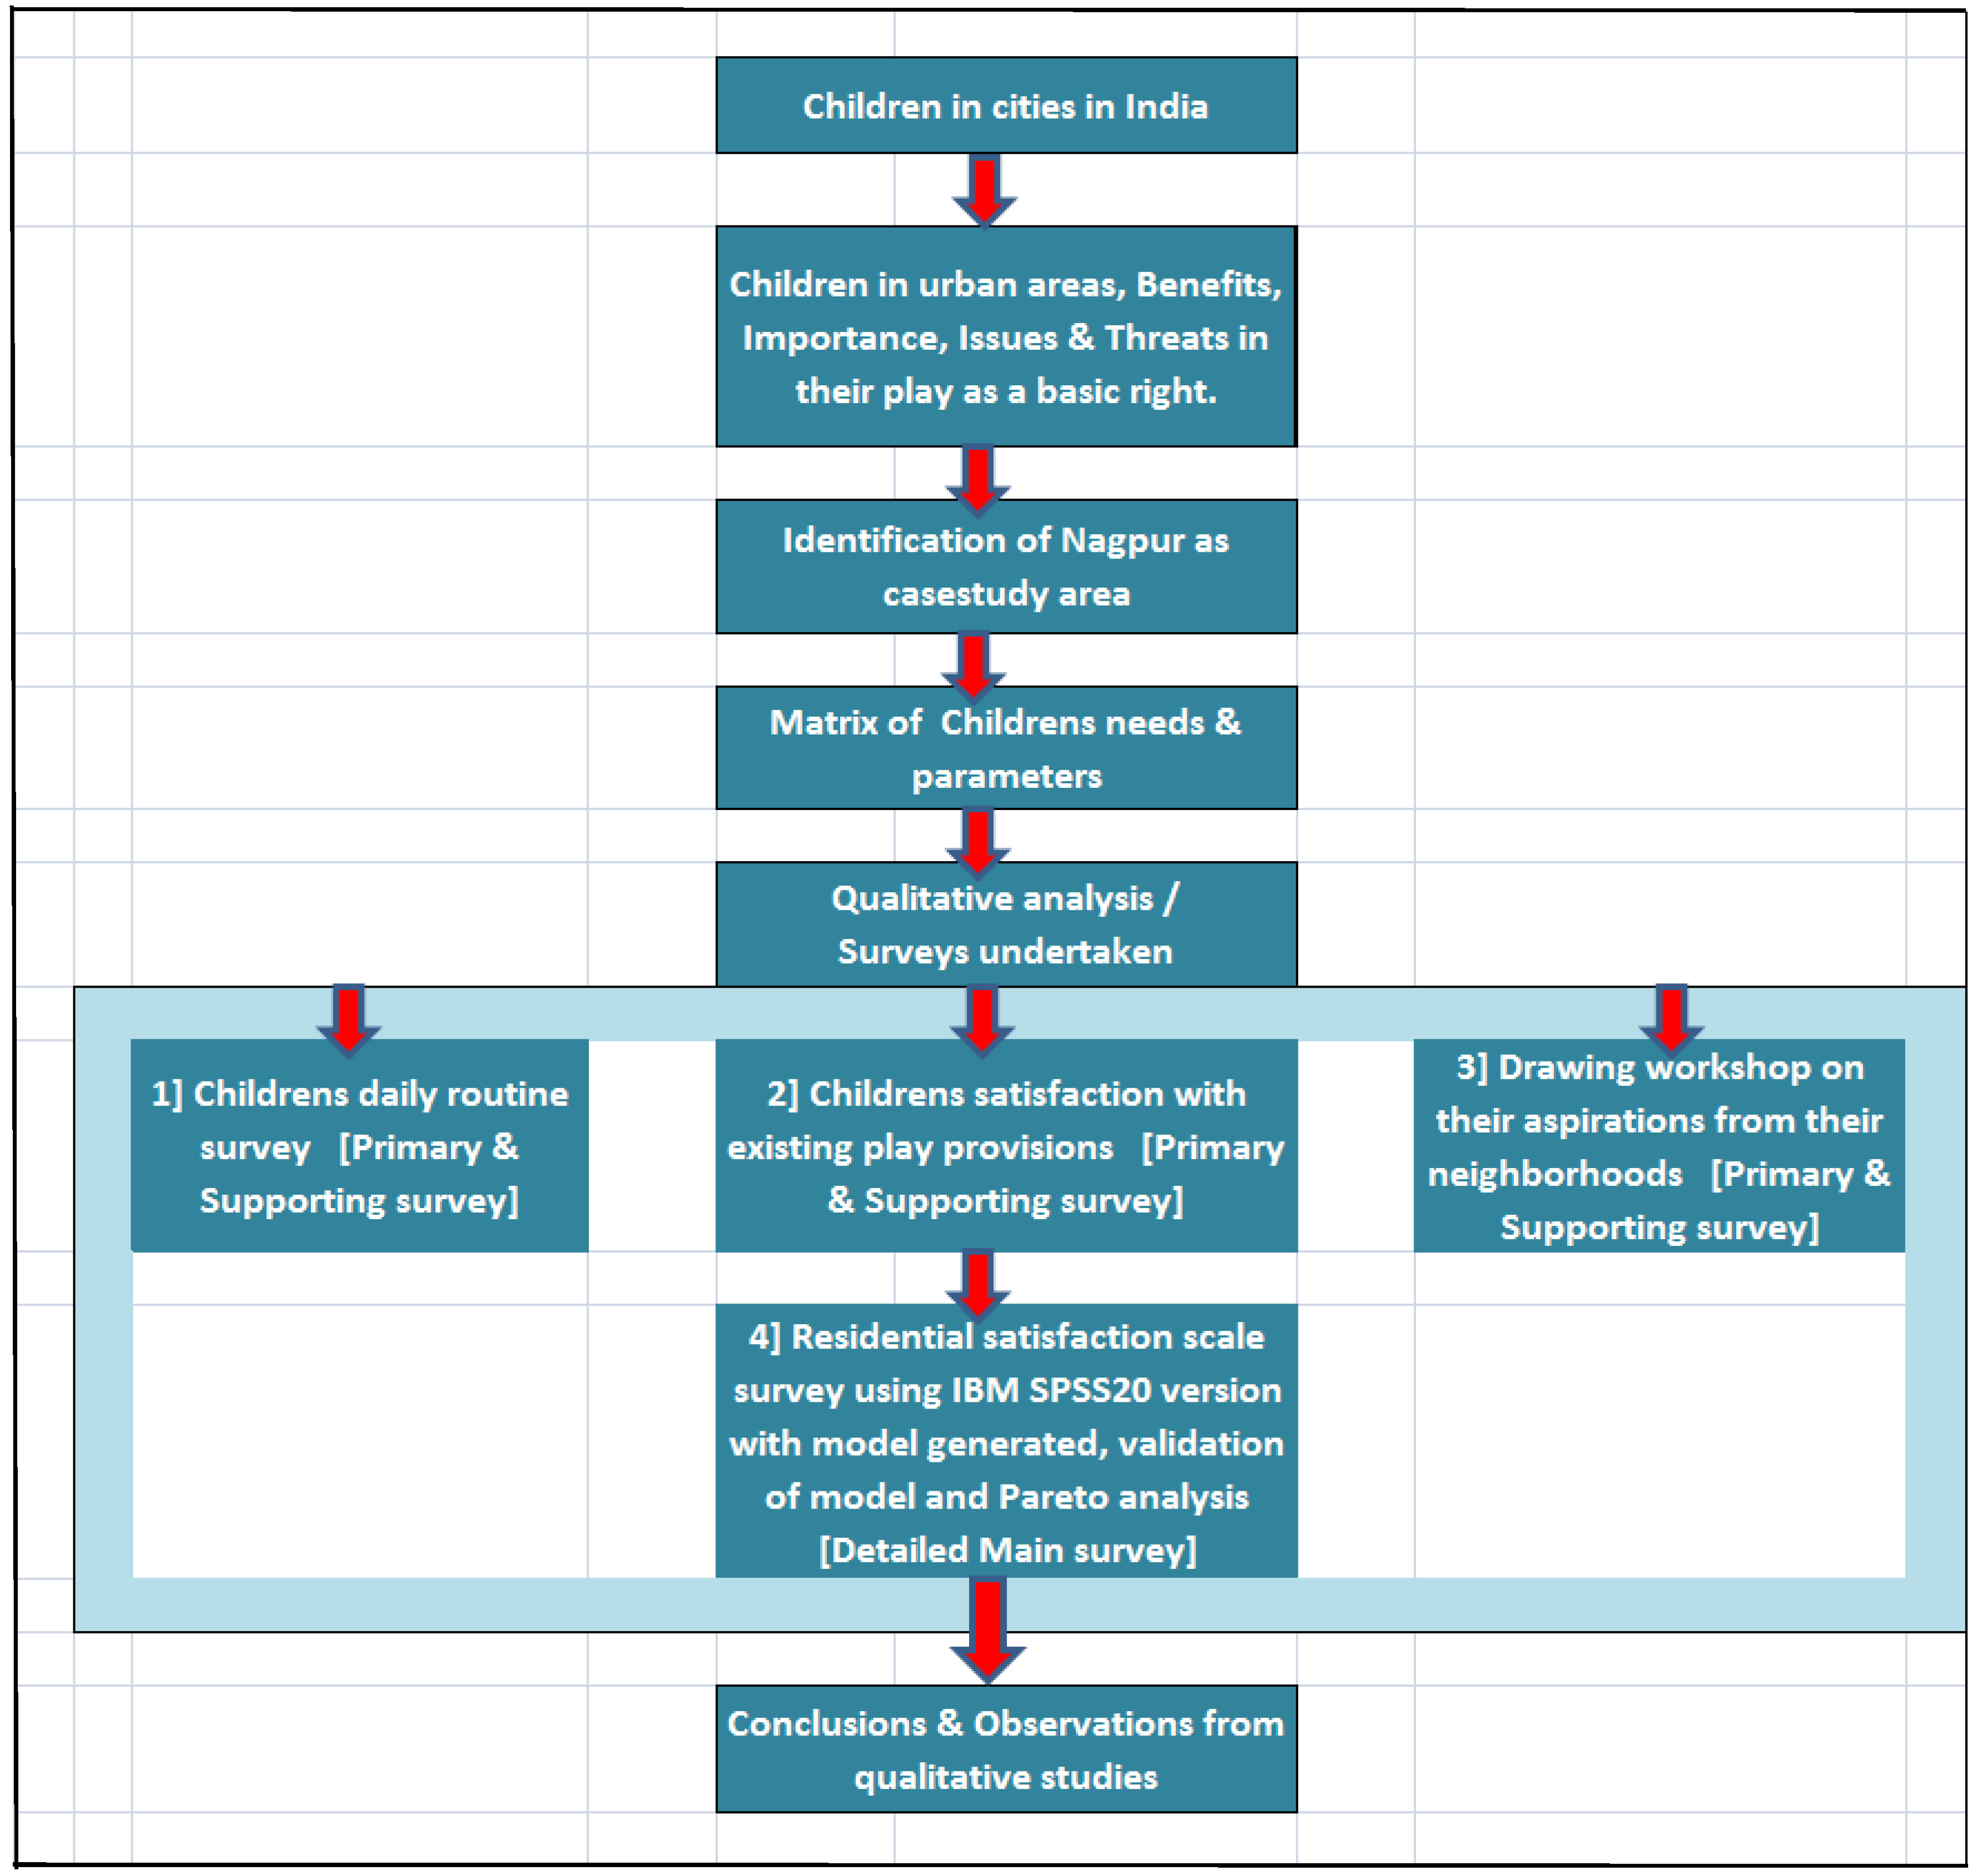
1.4. Methodology of Study
1.4.1. Contextualizing the Location for Groundwork in India
1.4.2. Delimitation and Characterization of the Study Neighborhoods in Nagpur
1.4.3. Defining the Participants
1.4.4. Qualitative Surveys
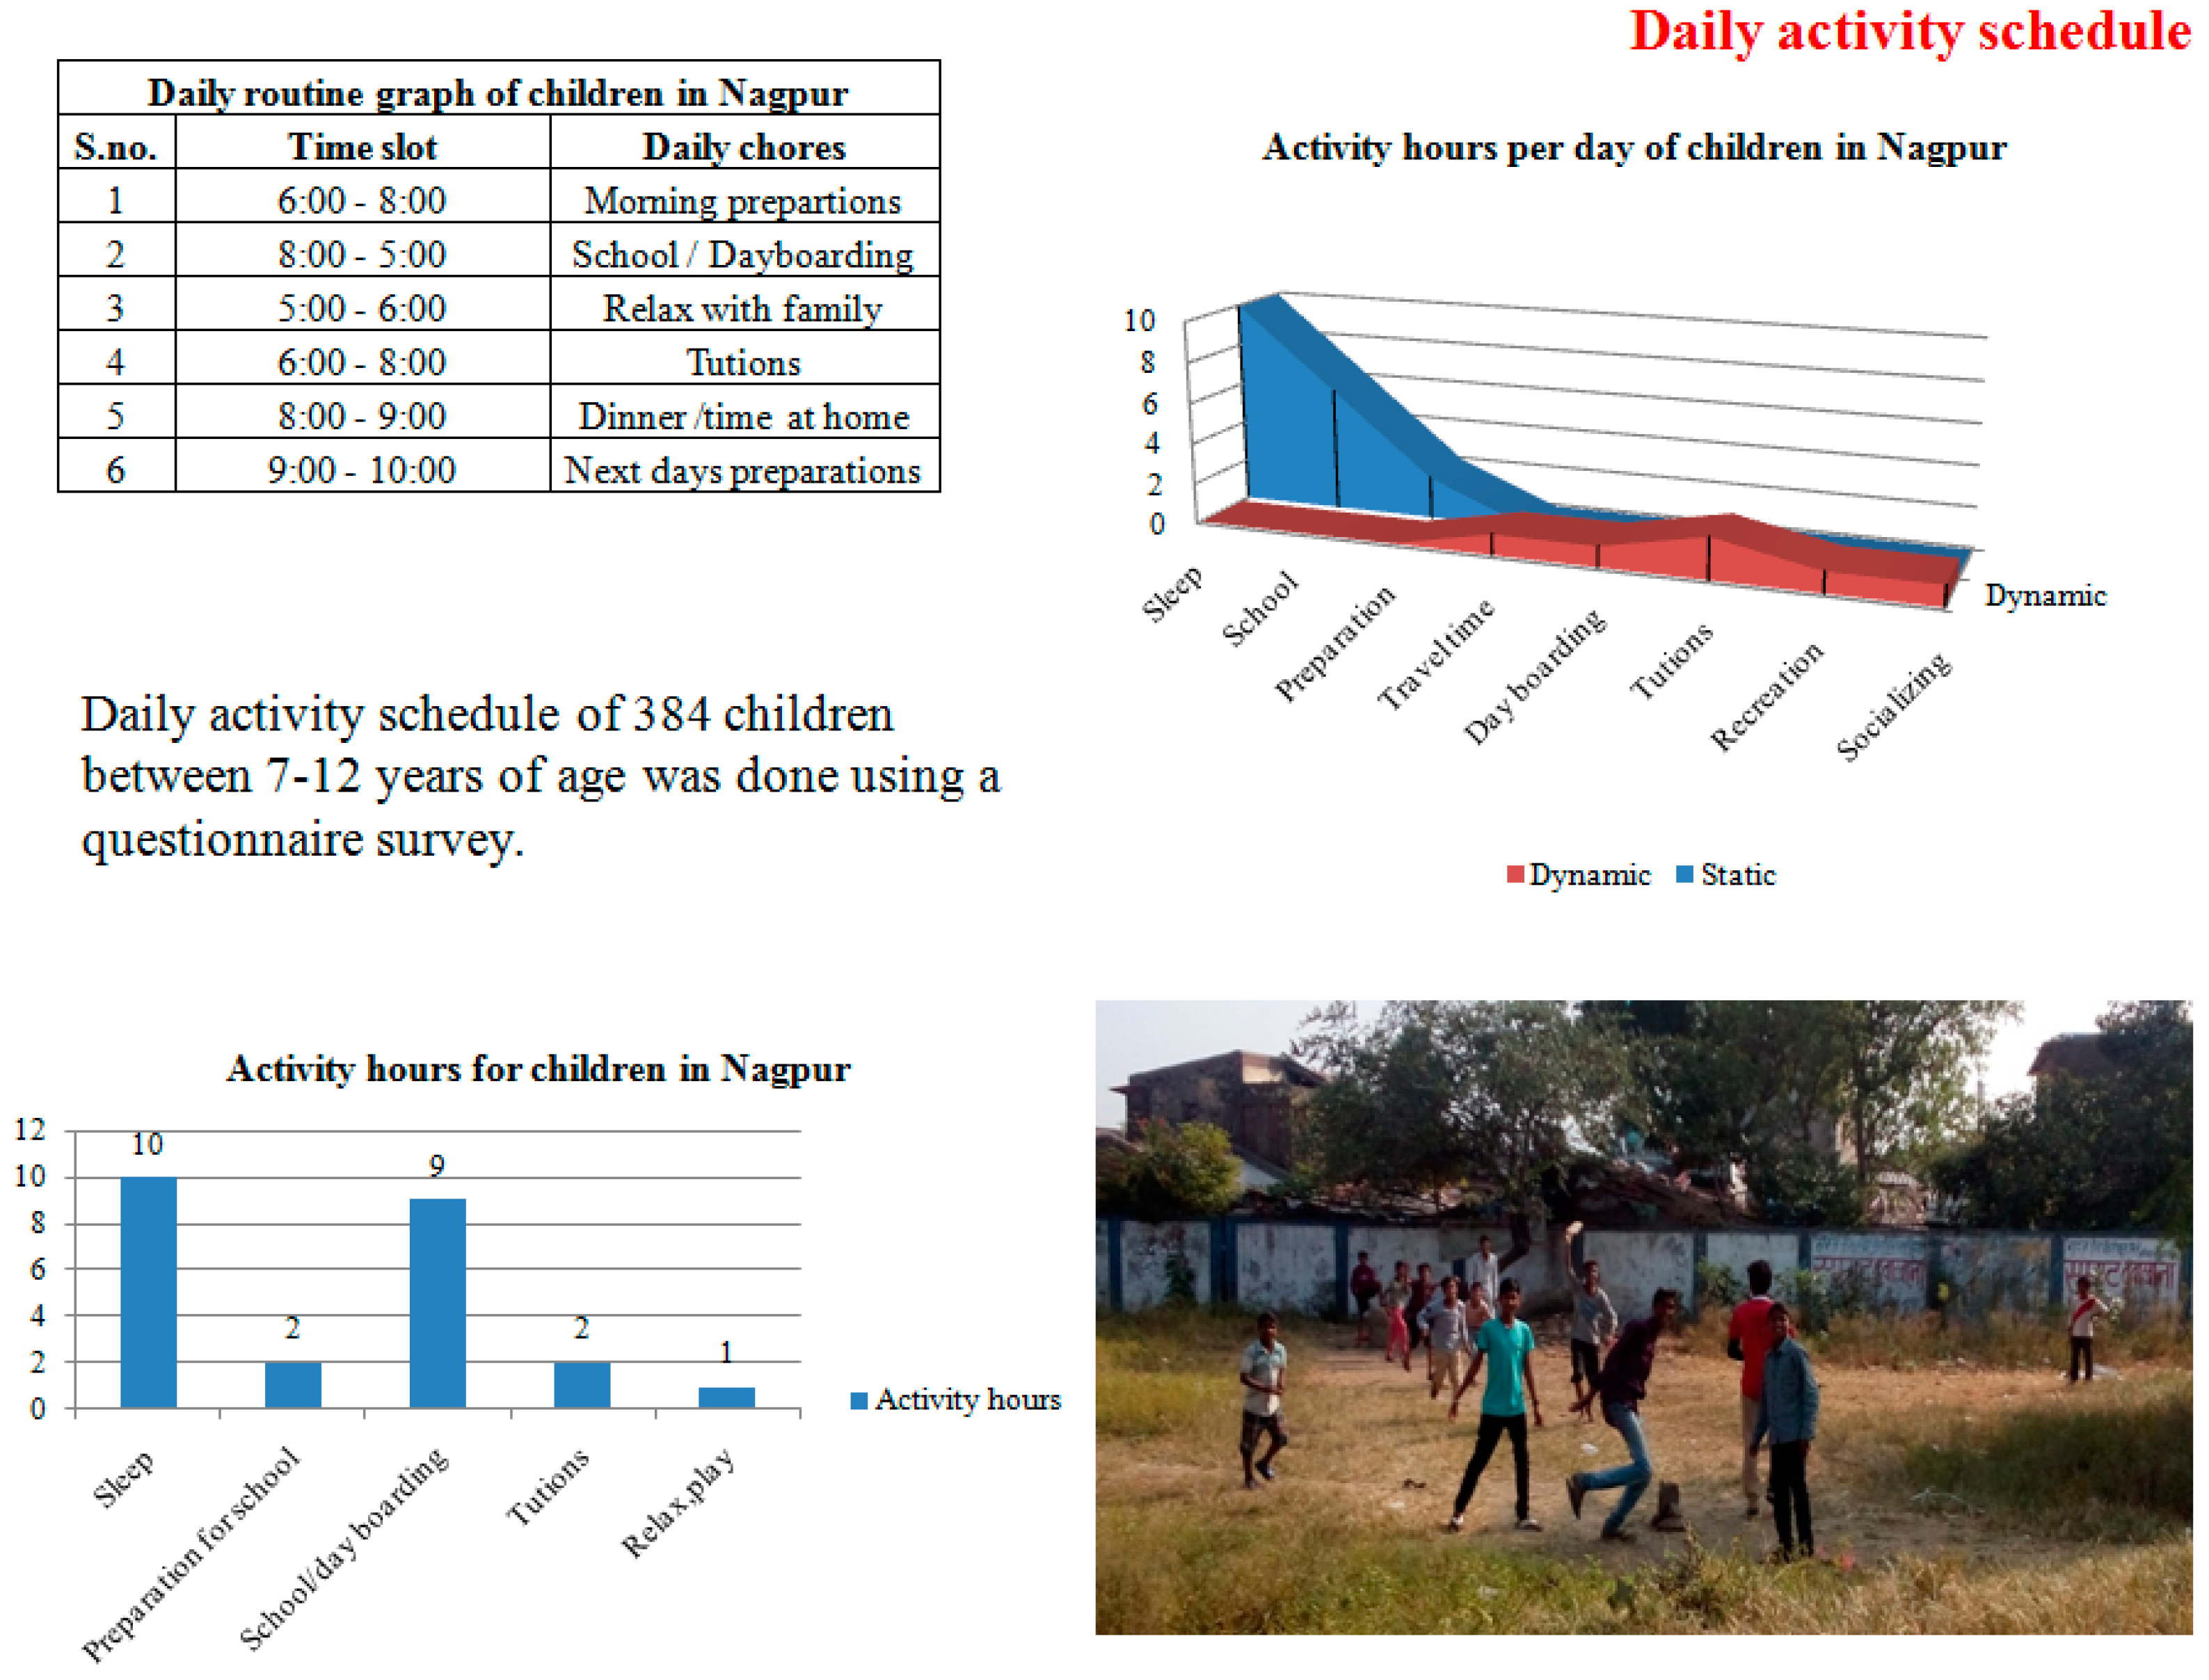
- Interviews with children had a sequence of queries from orders and specific to thought provoking encouraging wishful thinking and dreaming about ideal play spaces in neighborhoods (Children’s satisfaction with existing play provisions).
- Interviews with parents and children (Children’s daily routine survey).
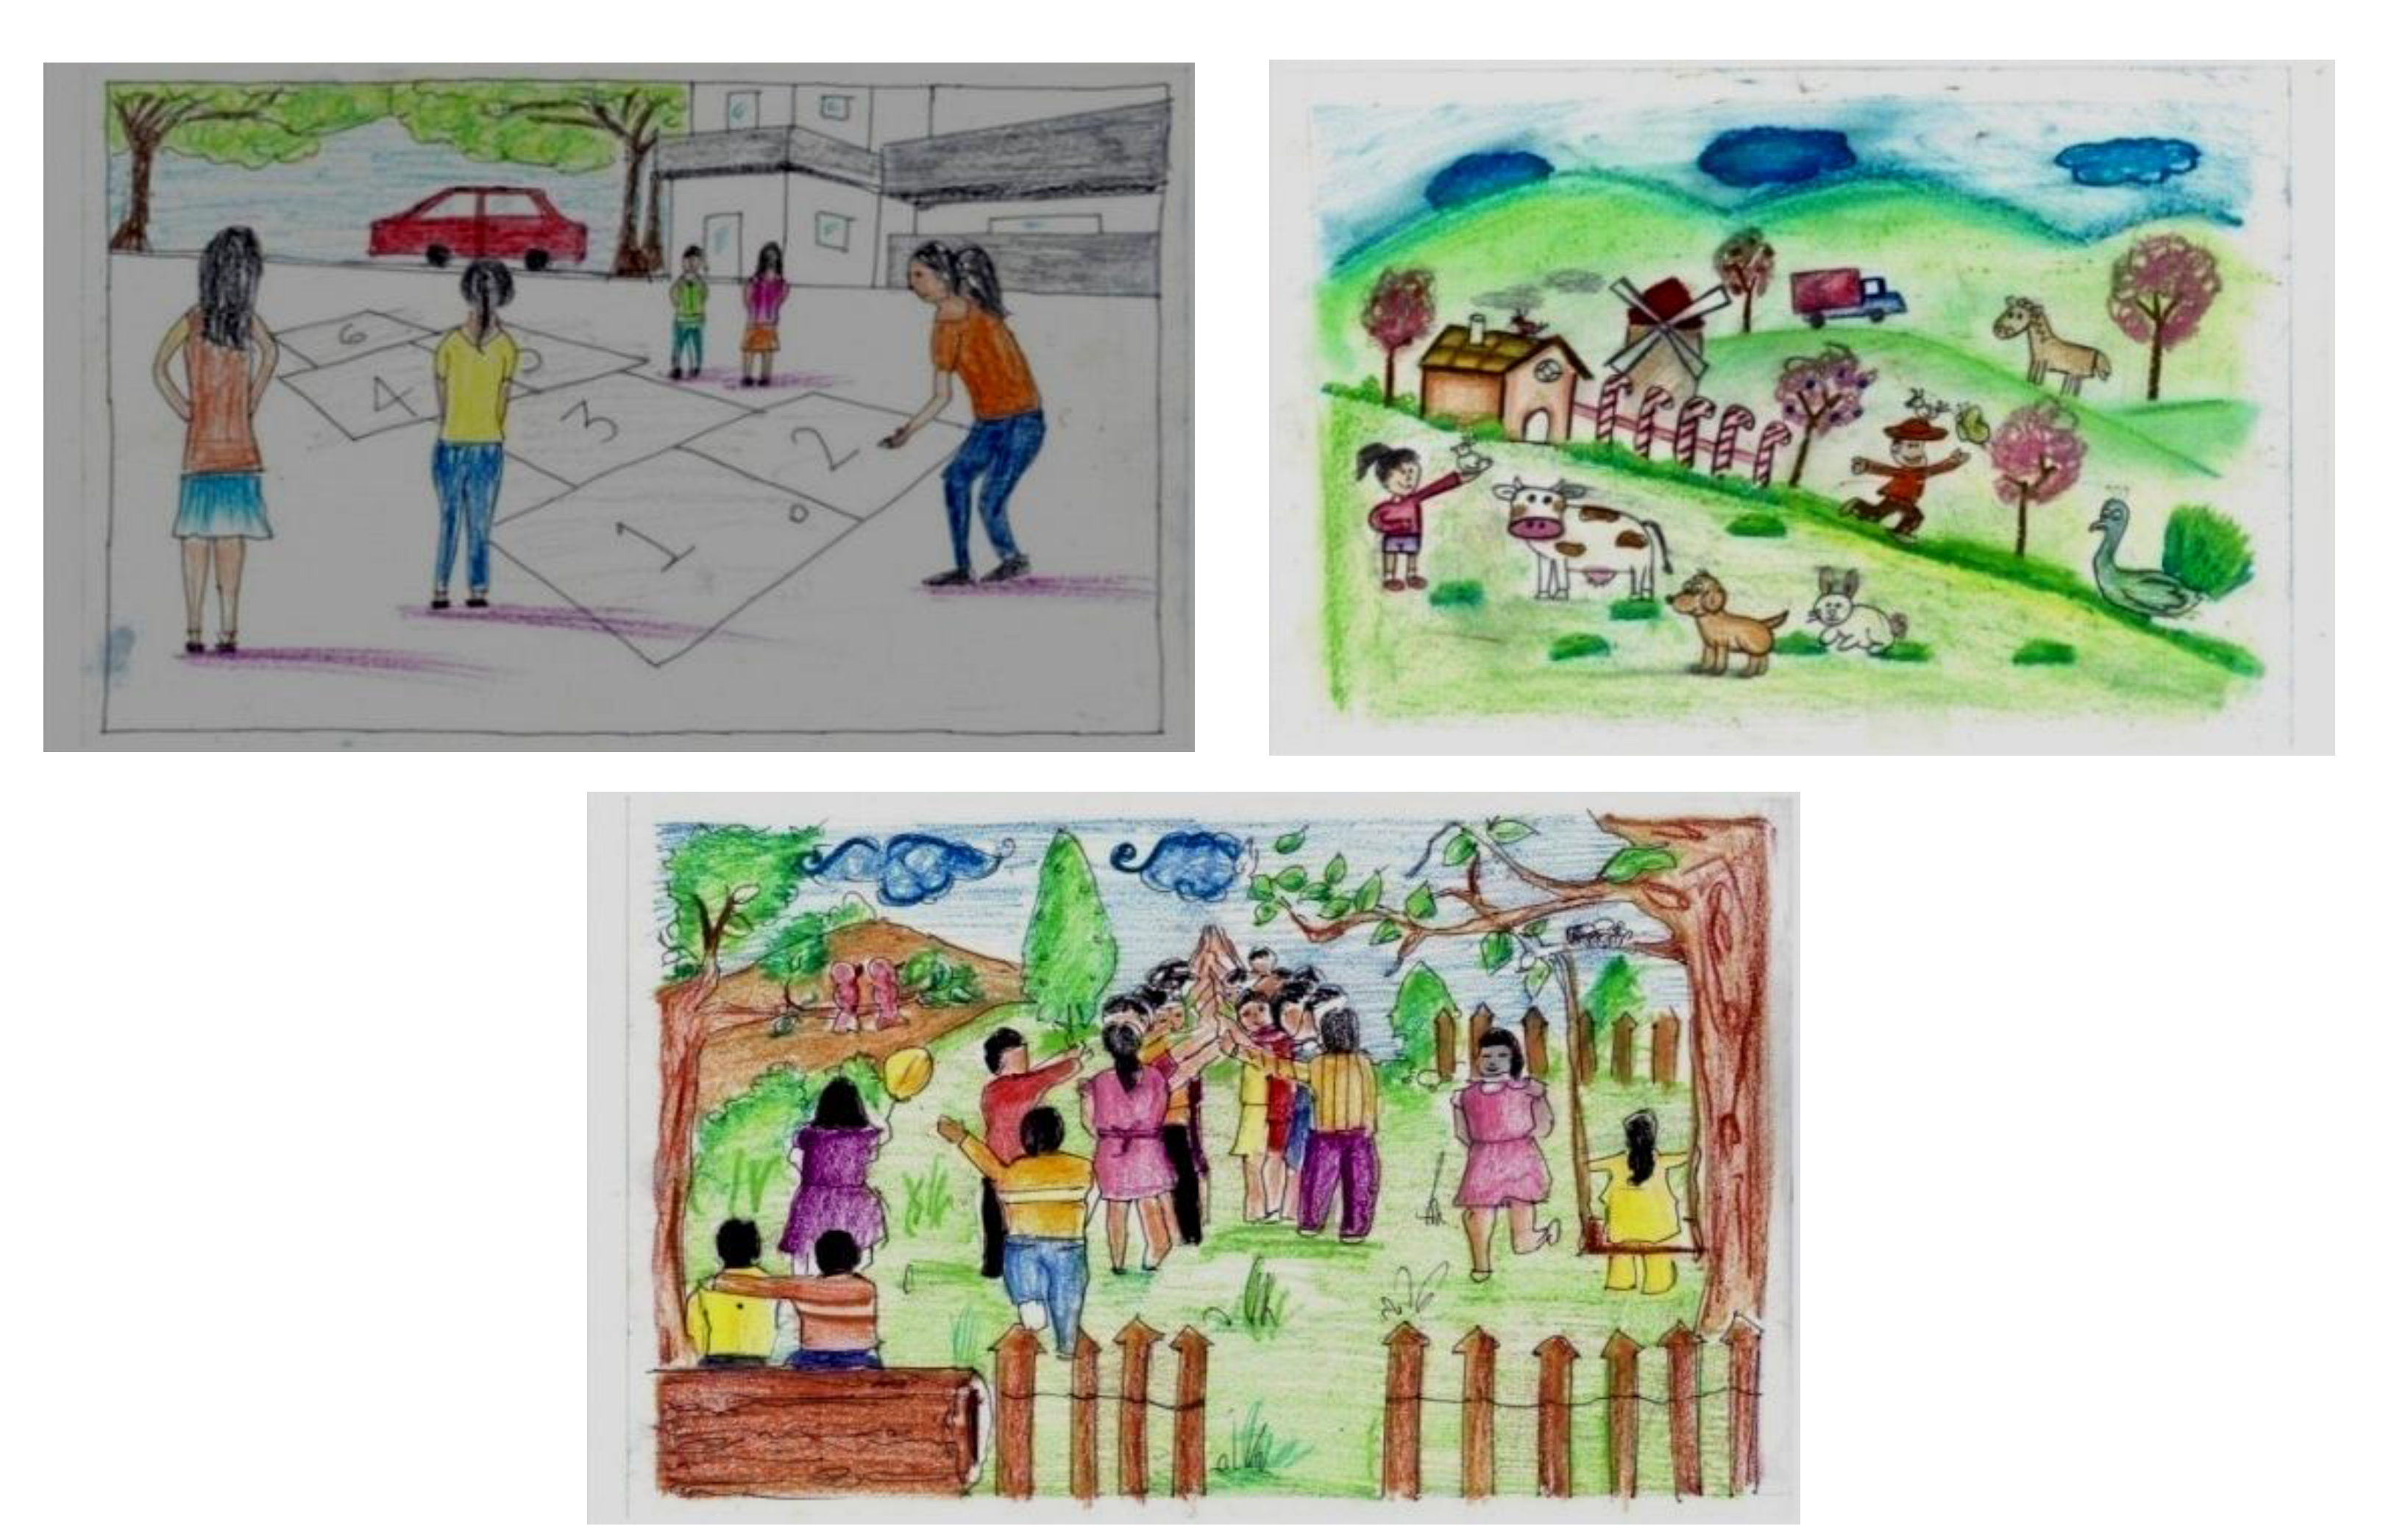
- As it is part of an architectural and planning research, the design and layout of the questionnaire is visually appealing, the creative drawing workshops urged children to respond in a free manner through sketches, notes etc. Although of no statistical worth, it adds value to the ordered and restricted sequence of questionnaire and gives a deeper insight of the assessment.
- RESS Statistical analysis—The data input is done in SPSS to know the normality, reliability, validity of data and the appropriateness of the variables used in the design of the questionnaire which in turn led to the creation of a model of children’s satisfaction scale in the Indian context and in turn the importance of each variable on the output of residents satisfaction.
2. Survey Tools
2.1. Childrens Daily Activity Schedule Survey
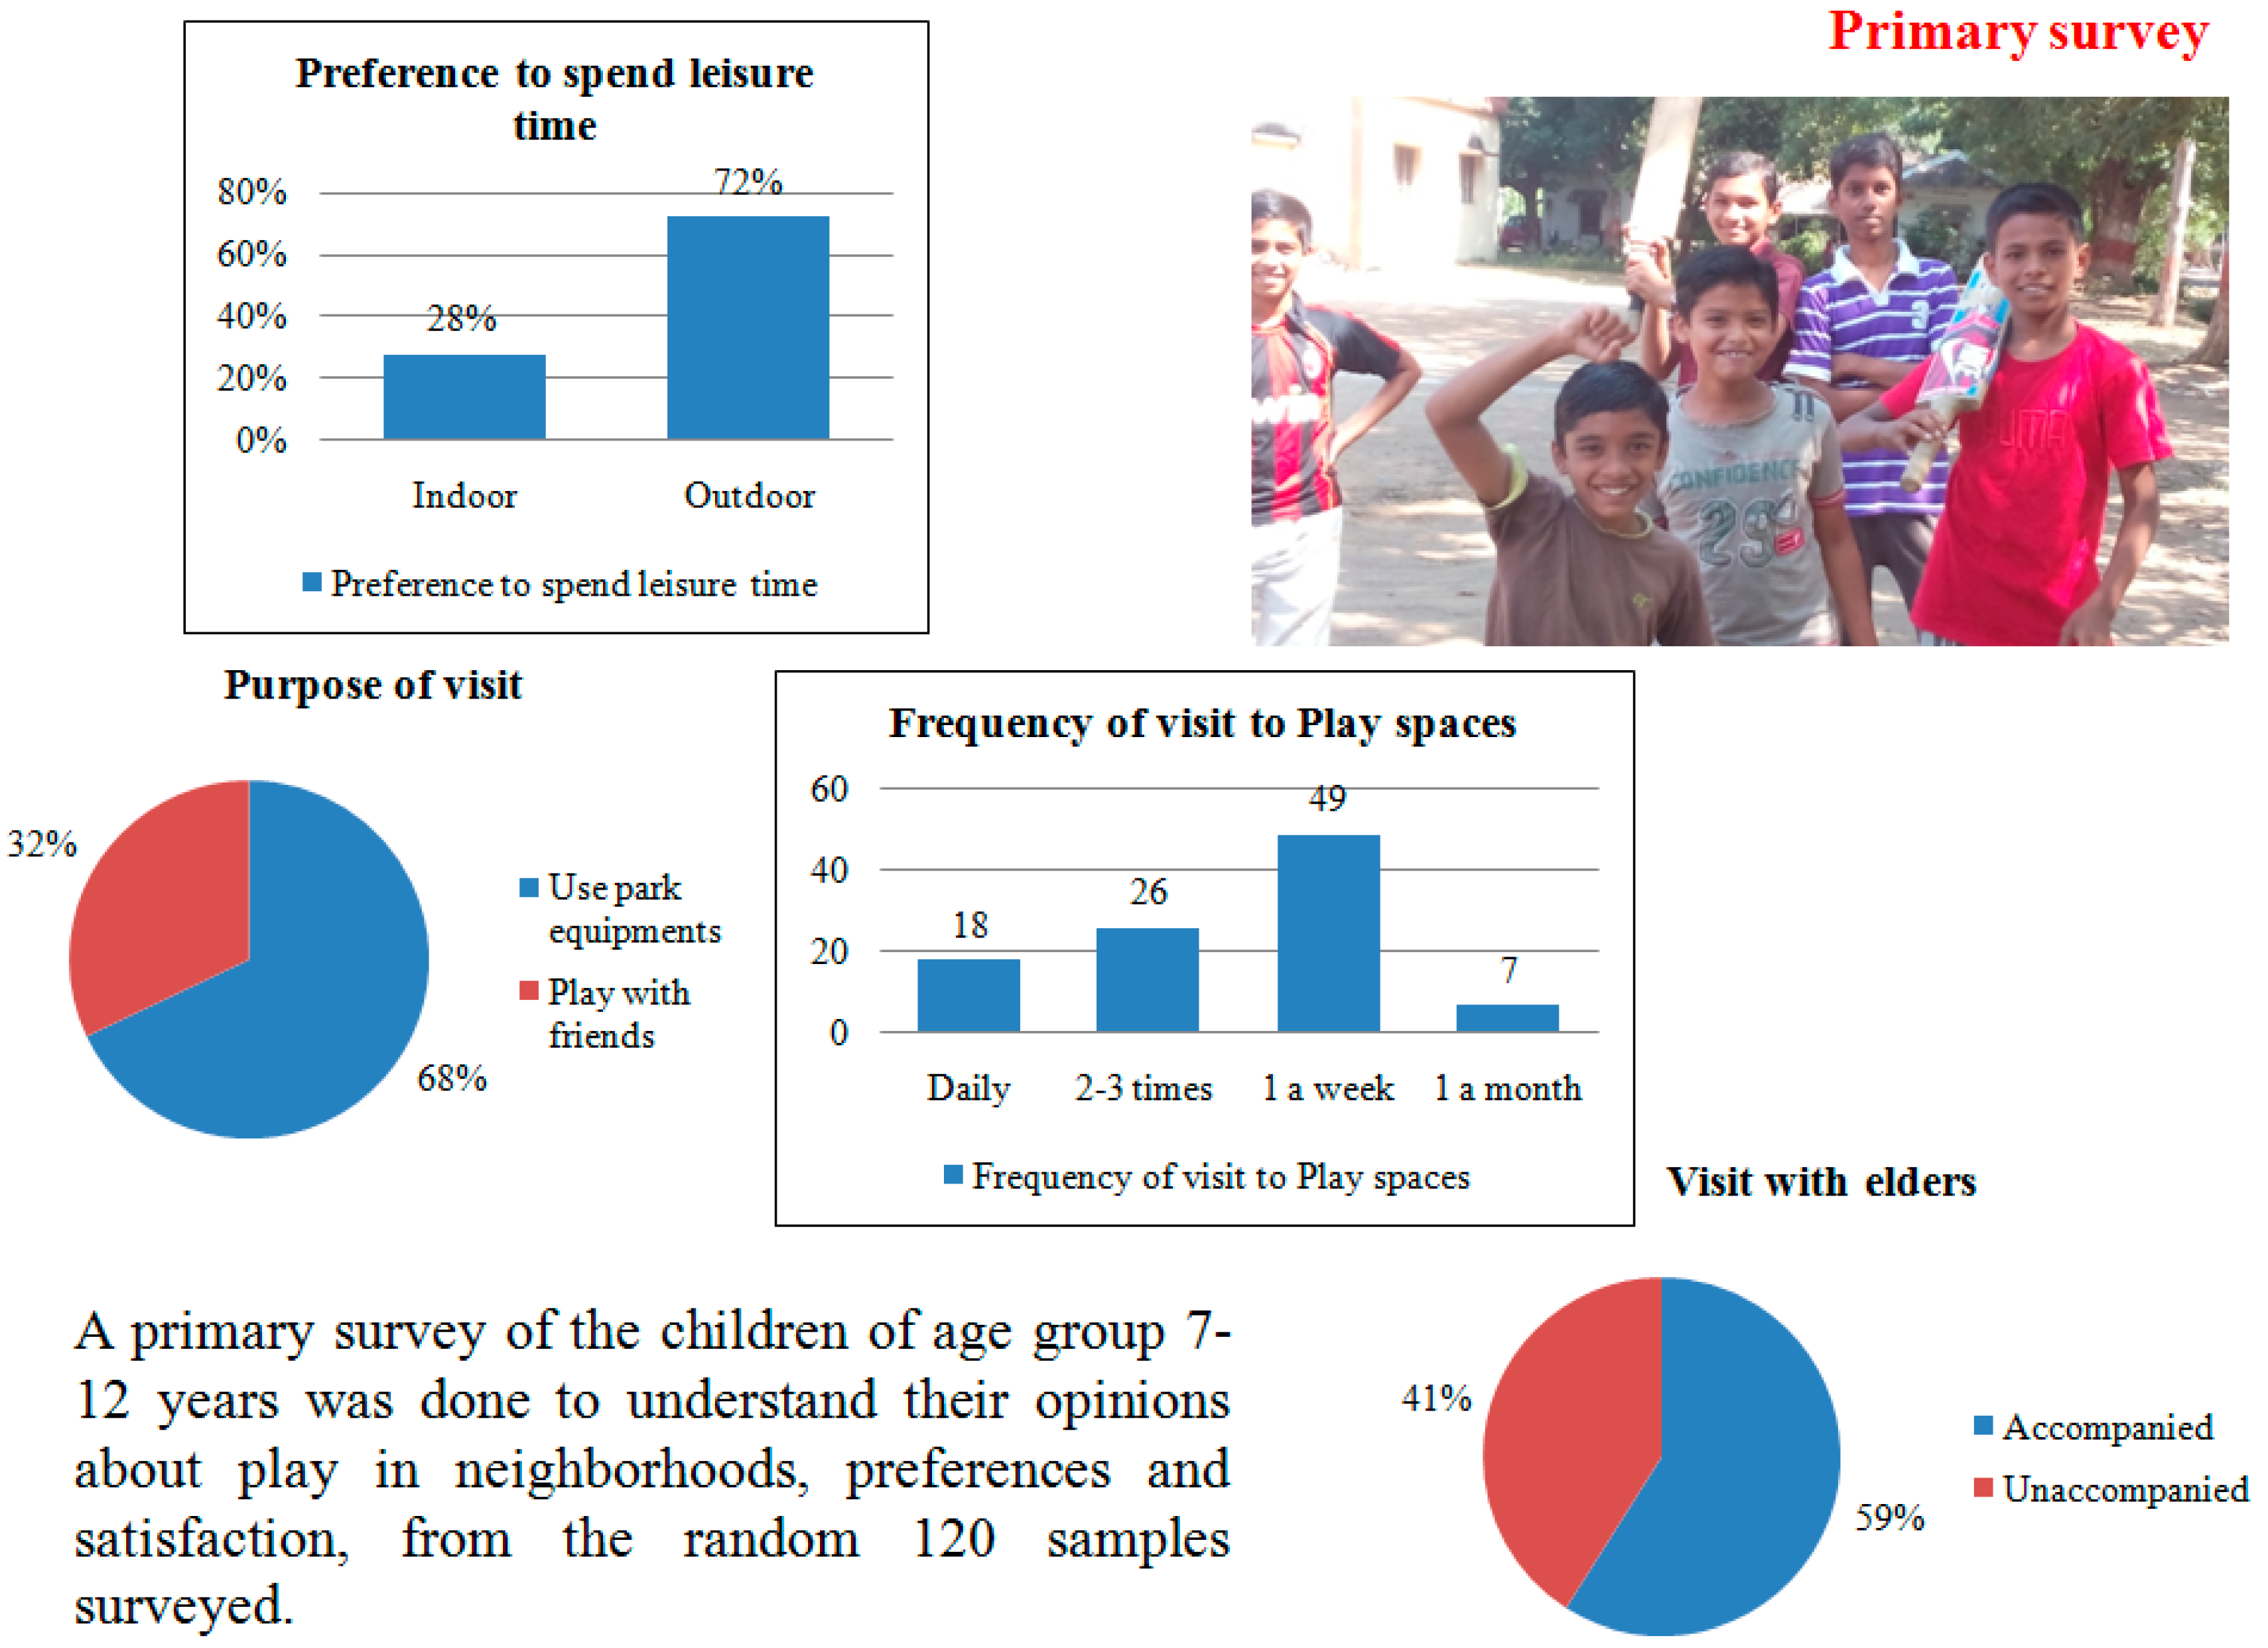
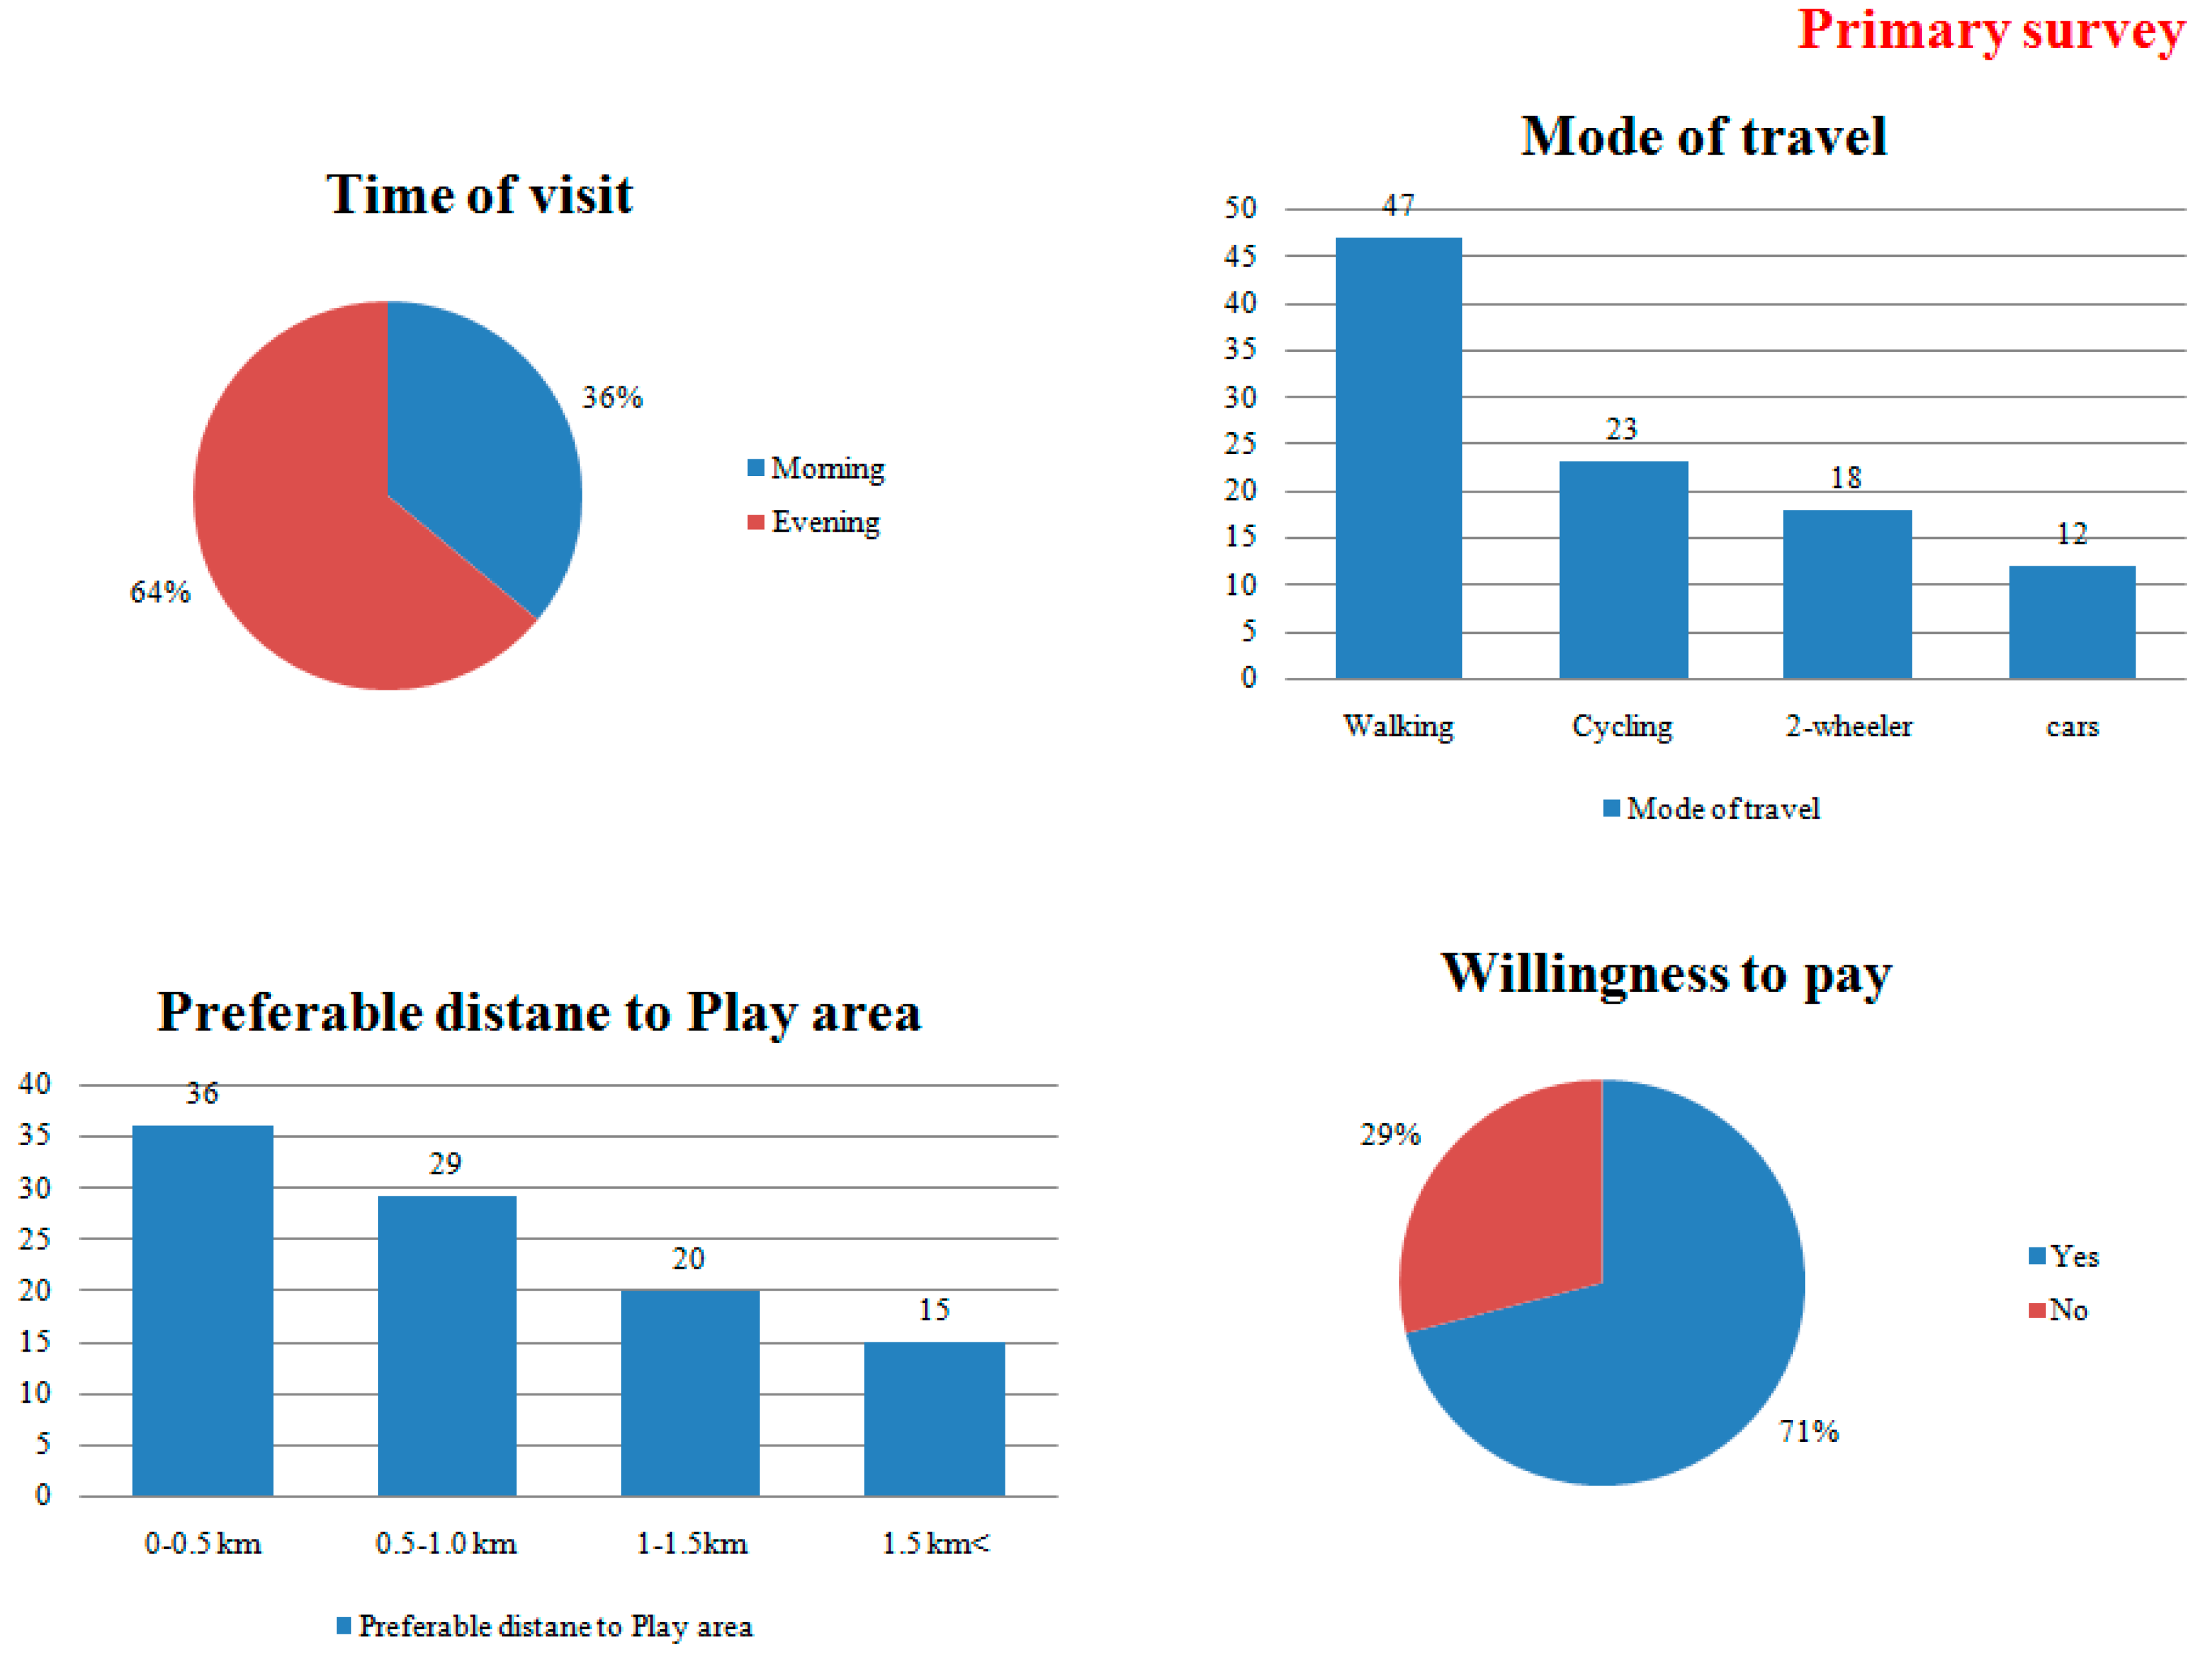
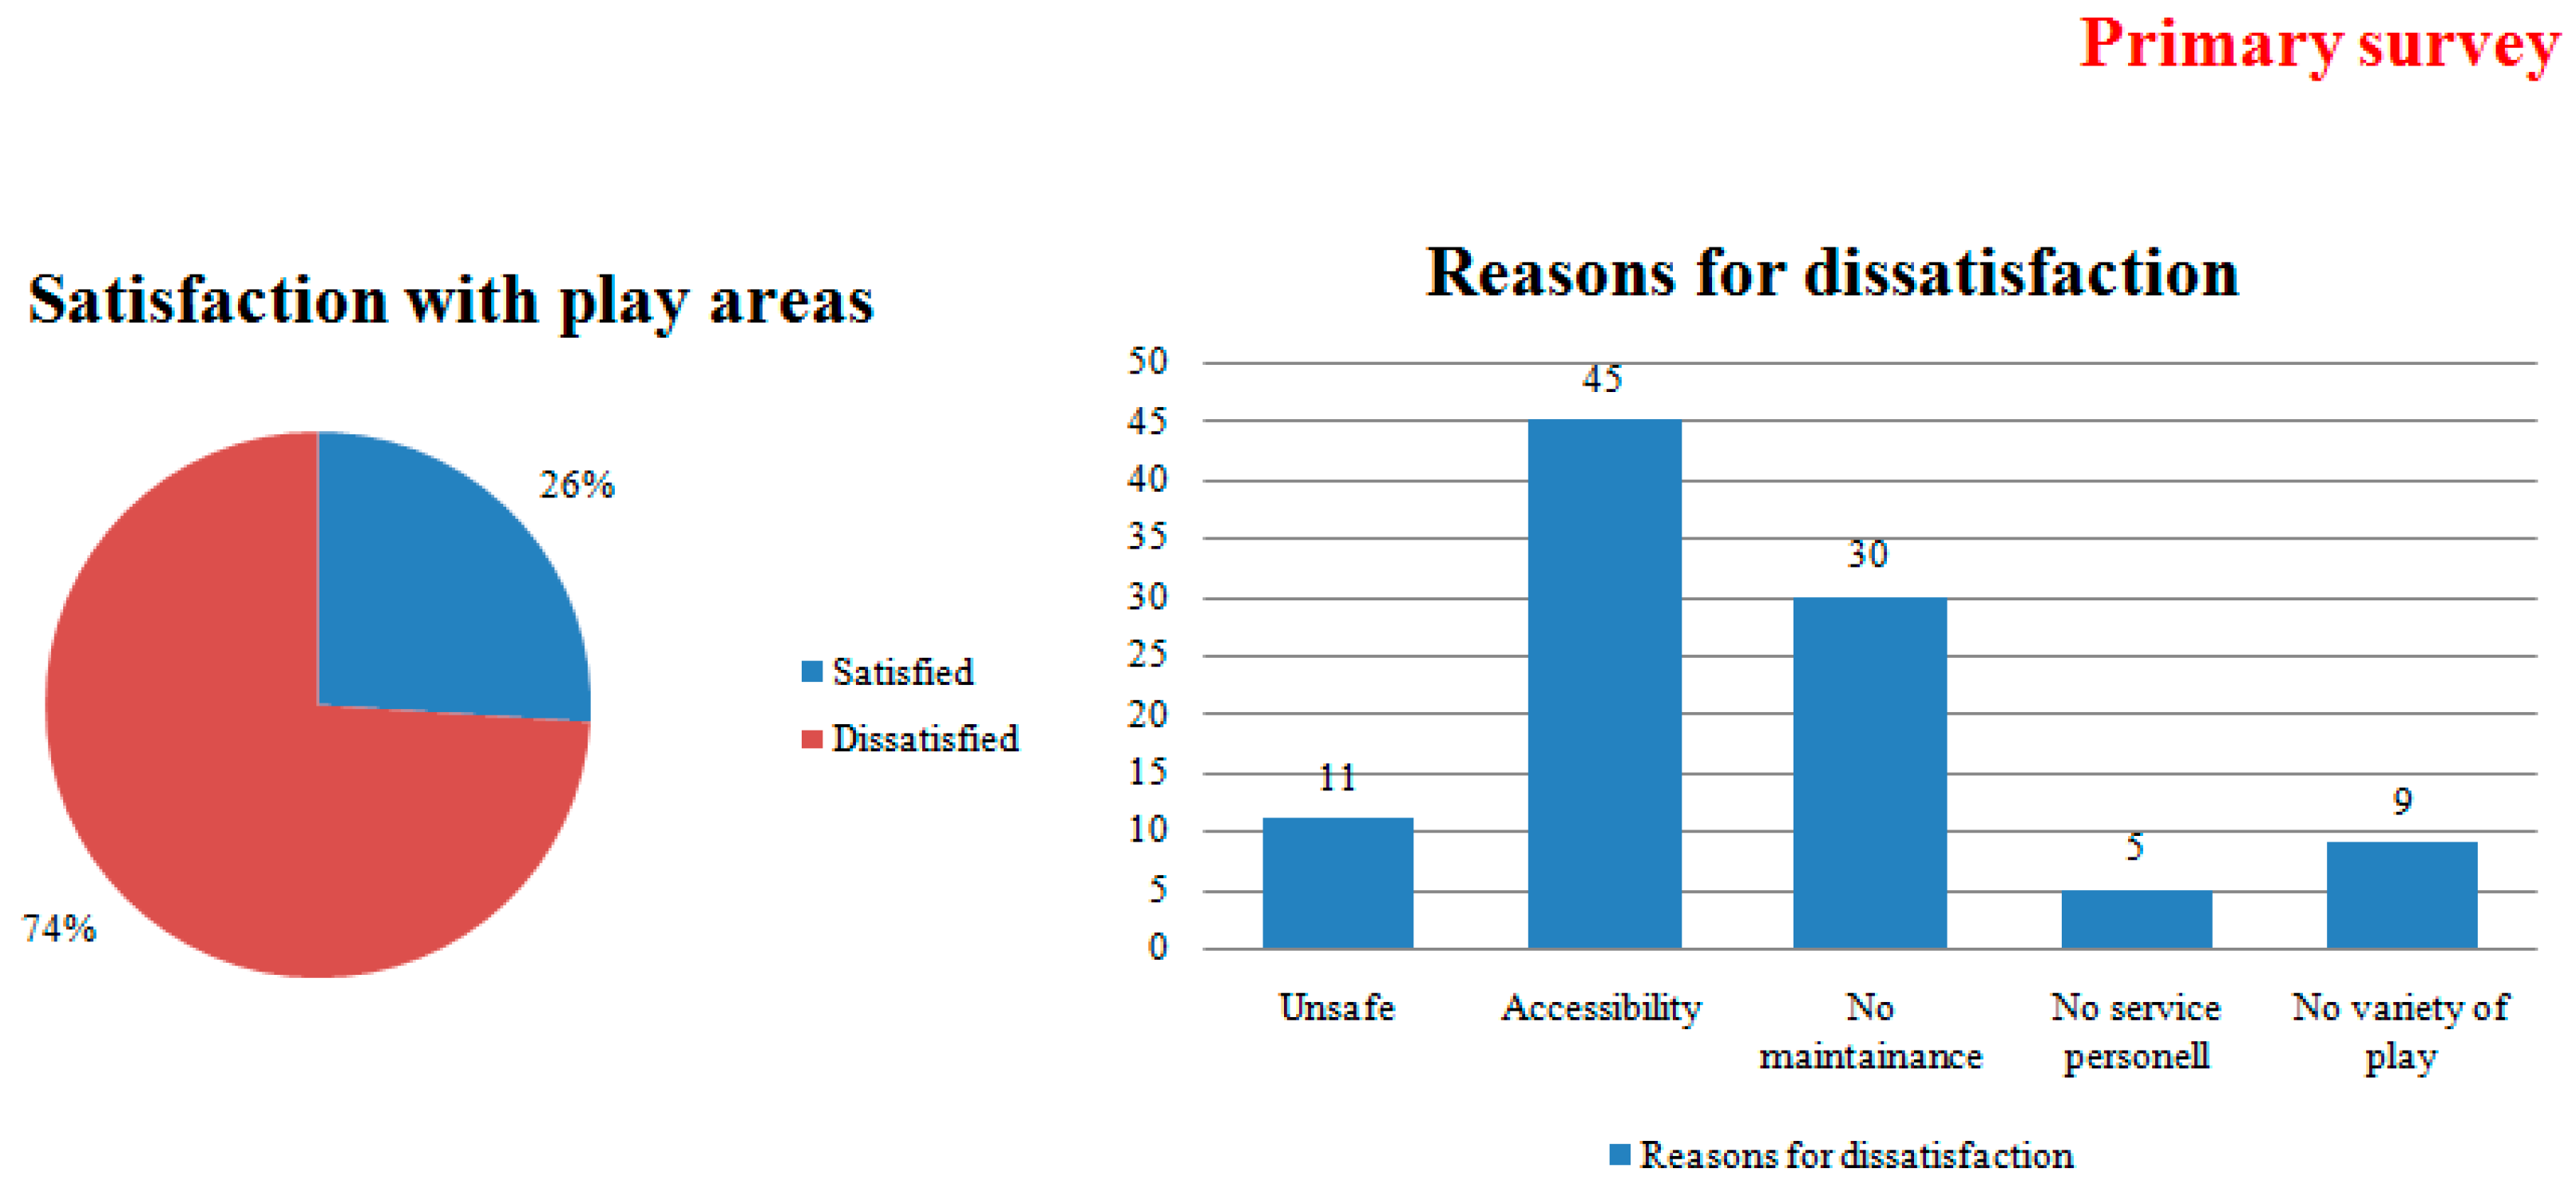
2.2. Childrens Survey about the Existing Play Provisions in Their Neighborhoods
2.3. Children’s Aspirations from Their Neighborhoods
2.4. Residents Perception Survey
2.4.1. Customizing the RESS
- ○
- Questions are addressing to the specific issues and bounded as it is best suited for a statistical analysis. The questions are numerically evaluated on a five point scale—Strongly agree/very satisfied/yes very much: Agree/satisfied/yes: Neither agree nor disagree/neither satisfied nor dissatisfied/not so much: Disagree/dissatisfied/no: Strongly disagree/very dissatisfied/not at all.
- ○
- The questionnaire initiates with the architectural and town planning aspects, organization and accessibility of roads, green areas to more of social and welfare activities, relations. Level of complexity is further stepped up with queries on recreation and transport facilities, commercial facilities and pace of life with all age groups of people.
- ○
- The journey then makes respondents enter a more abstract form of queries dealing with the sense of belonging and neighborhood attachment.
- ○
- A wish list helps bring out in full force all the aspirations they nurture within themselves for their neighborhood environs.
2.4.2. Method of RESS
- (1)
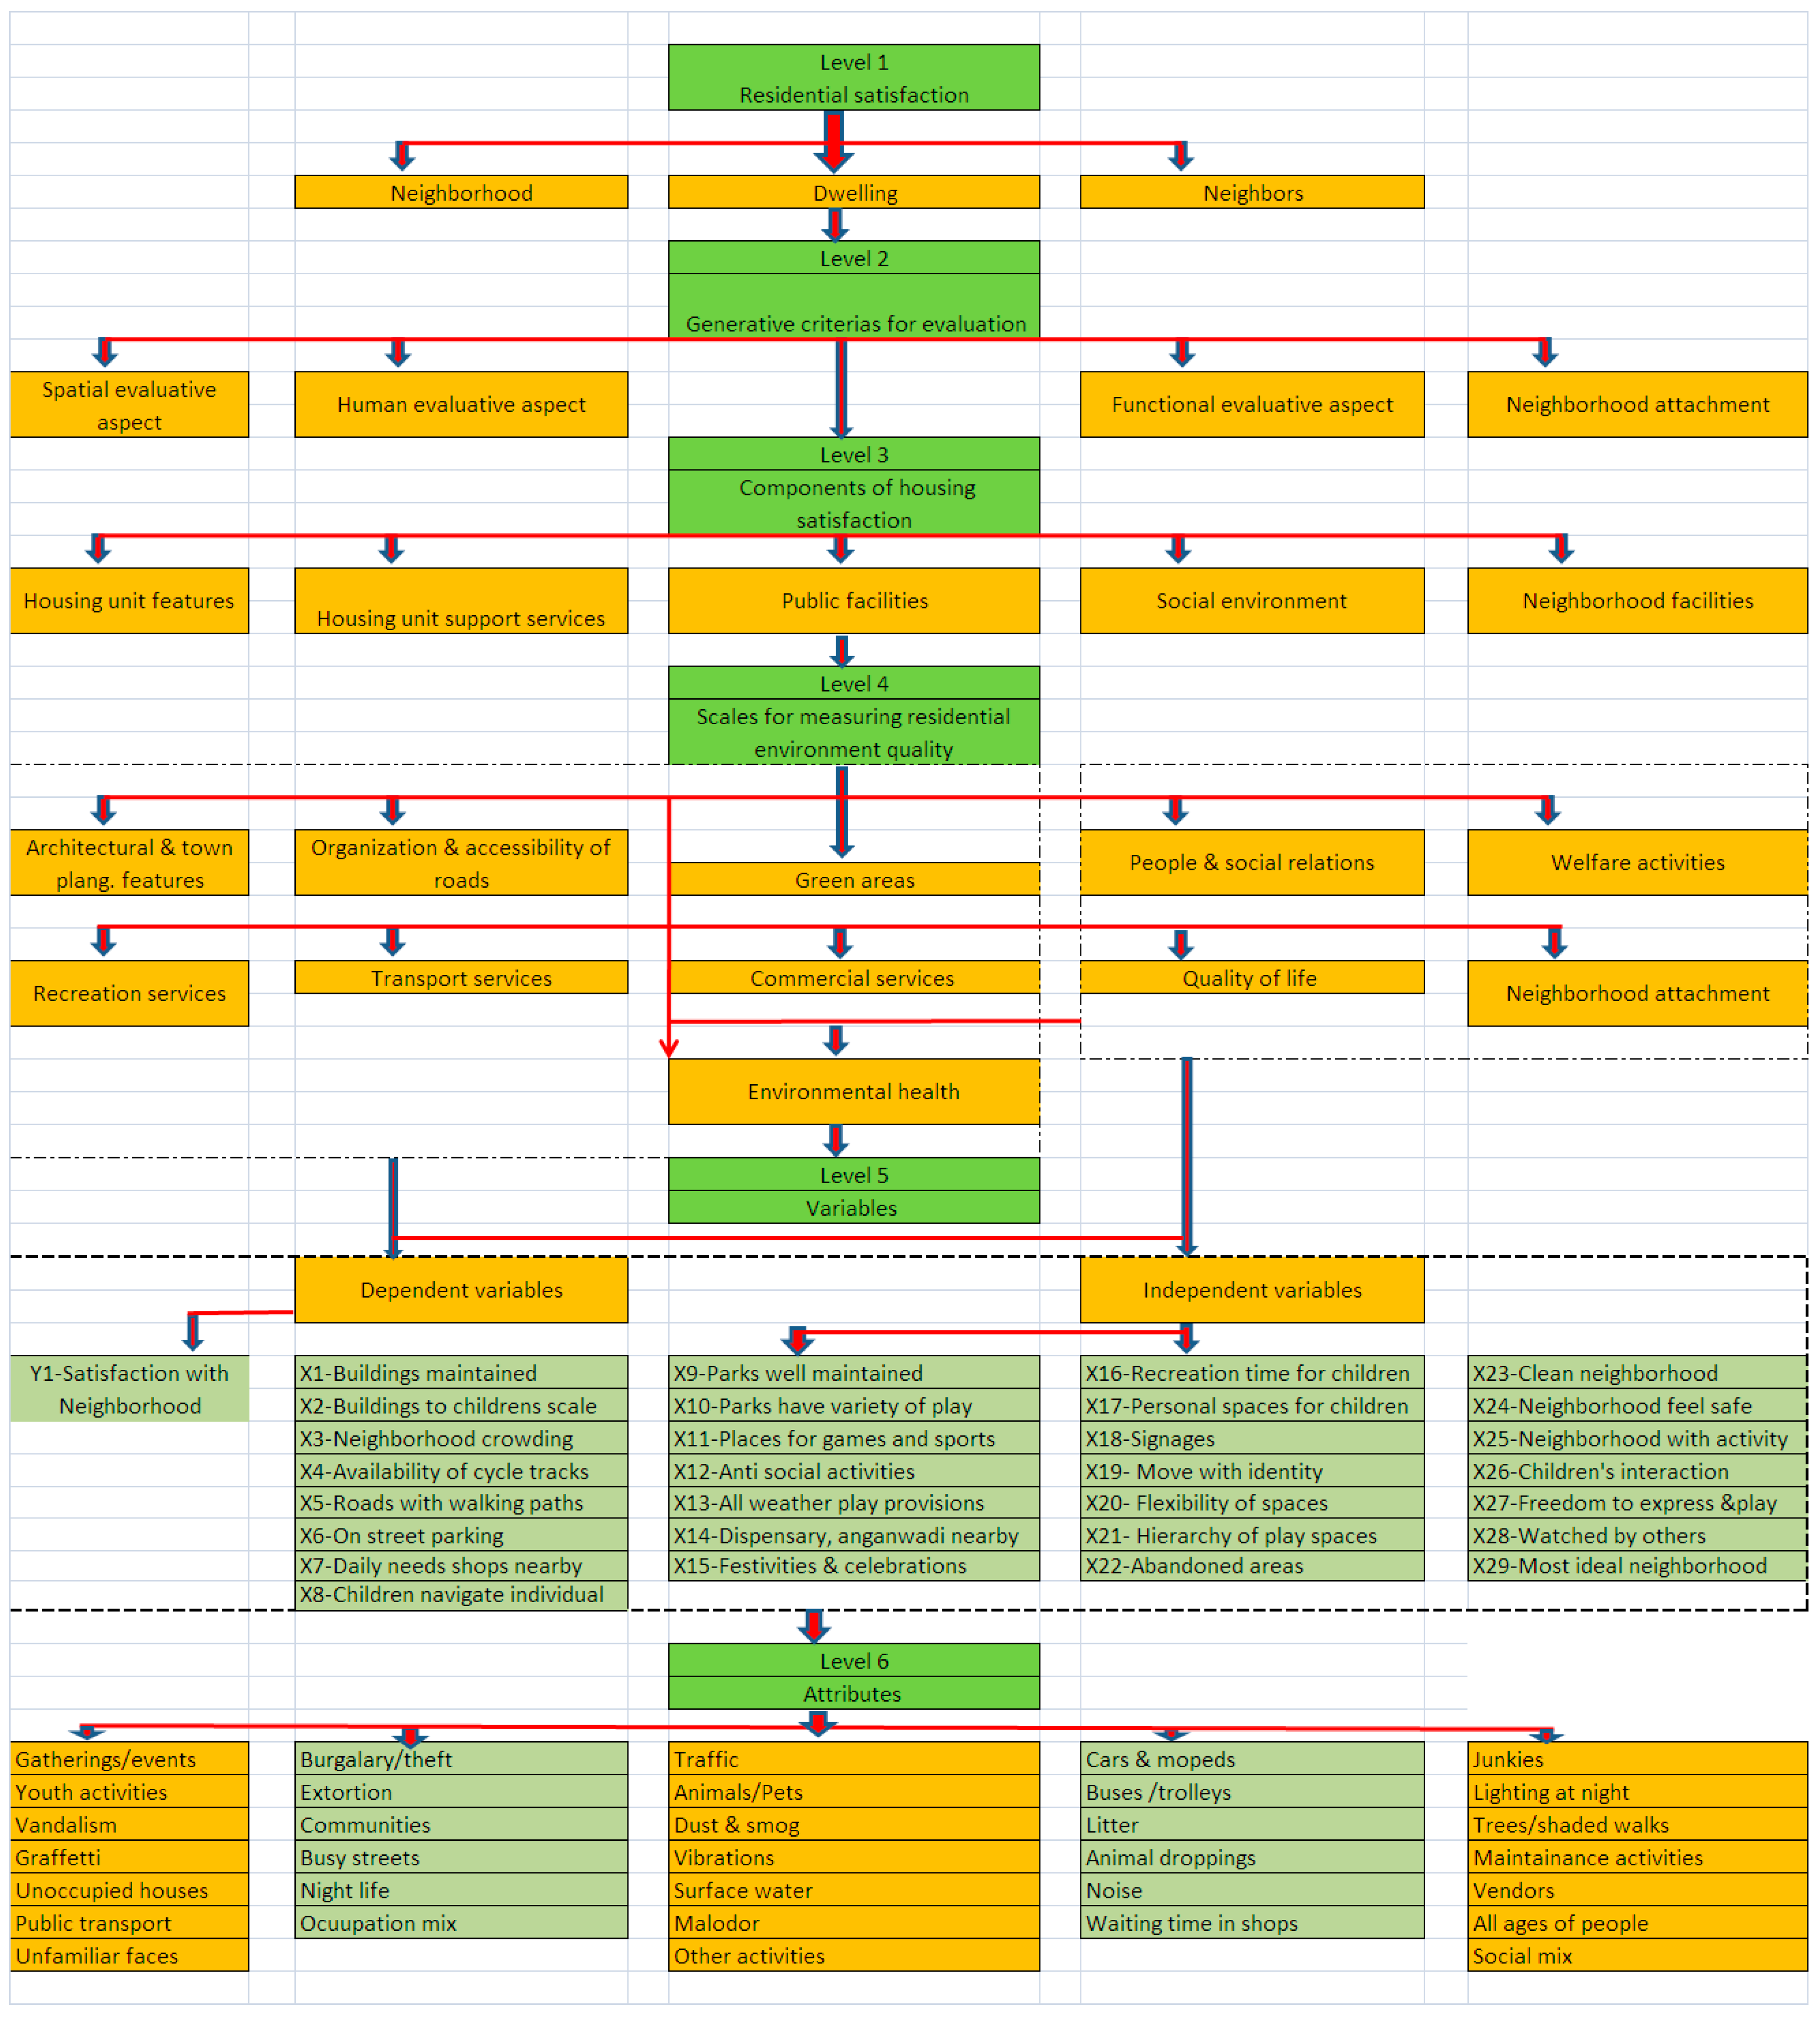
- Identification and structuring of attributes—the model starts with the top level attribute environmental quality represented by residential satisfaction. The top level attribute branches out into more specific lower level attributes like satisfaction with dwelling, neighborhood and neighbors respectively on which the object may be validly measured.
- (2)
- Actual residential environments are evaluated on the attributes in the theoritical model given in the Figure 9. The theoritical model of environmental quality was used to design a questionnaire in which respondents were asked to evaluate their present residential situation with each attribute in the model. The variables selected for the questionnaire study are listed as under in Table 3 as a set of dependent and independent variables. The variable of satisfaction with the neighborhood is dependent on a number of features of the built environment like:
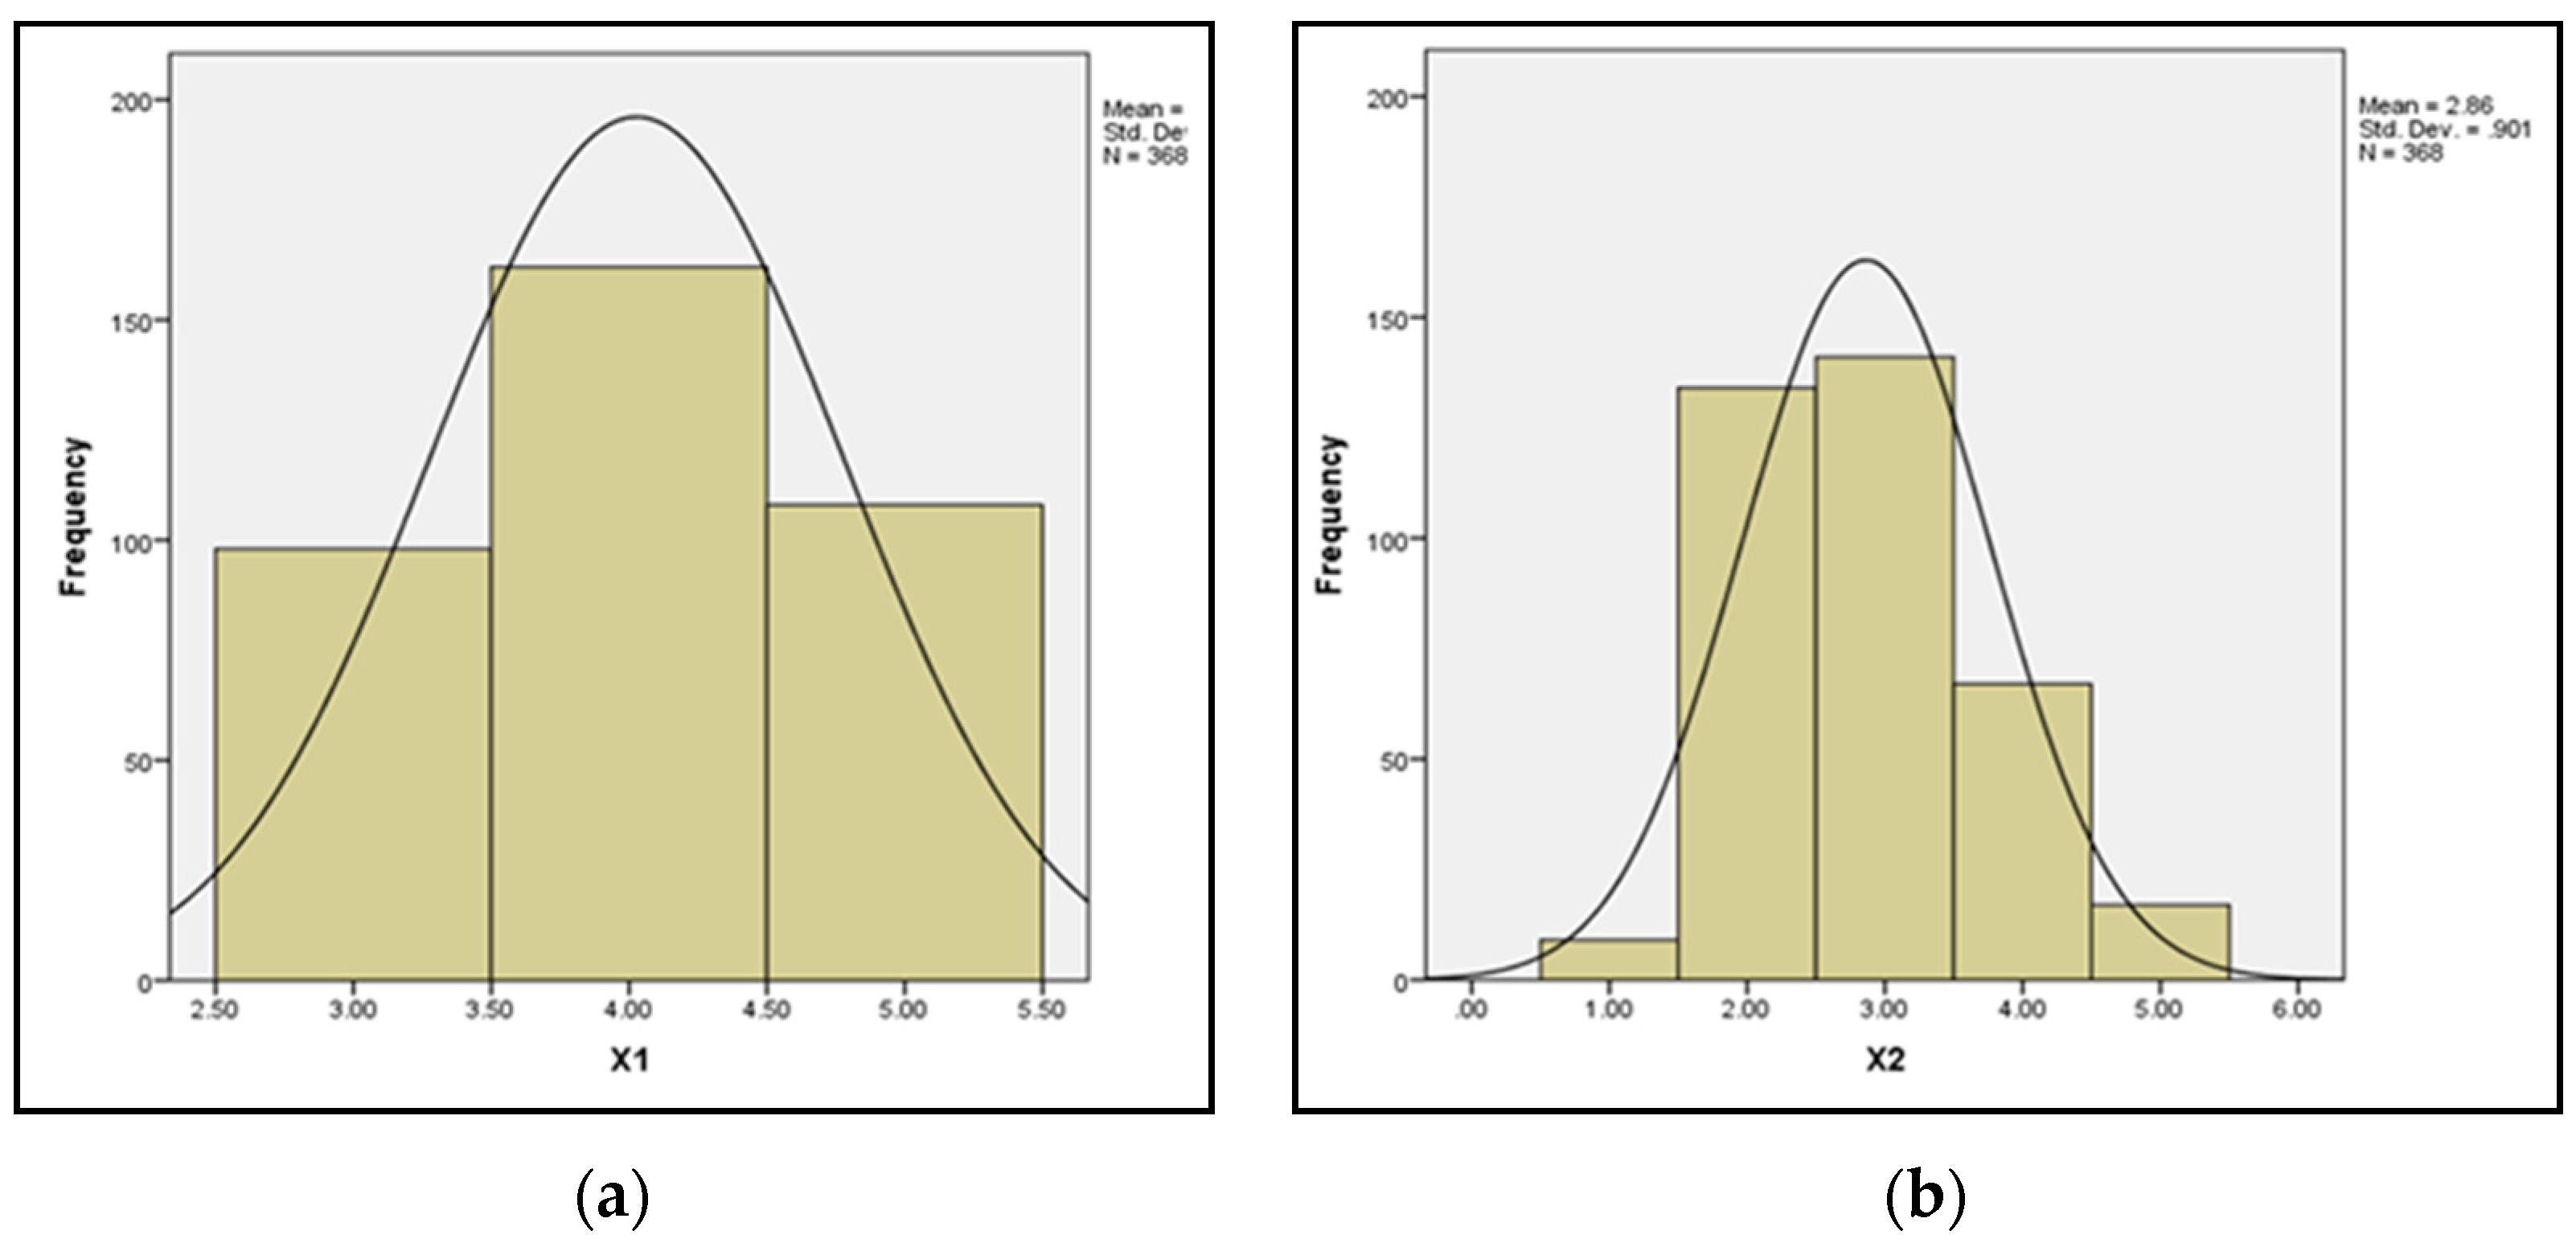
- I.V.1. The architectural characteristics of the buildings to be pleasing, good, well maintained and occupied by residents. This is considered as an independent variable (X1) to become part of the questionnaire survey.
- I.V.2. The scale of the buildings in the neighborhood to be preferably to the childrens scale so that it increV.ases ledgibility, recognition and brings in confidence in children about the neighborhood as something to be traversed and explored on their own, which is taken as variable (X2).
- I.V.3. The extent of crowding in the neighborhoods is also an important concern as regards childrens free movement in neighborhood as, if it is lonely or too crowded it tends to become unsafe for children to be left on their own in the neighborhood. This is an independent variable (X3).
- I.V.4. The provision of cycle tracks (X4) well designed as per childrens anthropometery and well protected and supervised by the walking paths (X5) along the neighborhood roads are two other variables to be important part of the questionnaire. So also, the on street parking (X6) along roads hindering the traffic movement, walking and childrens play is also an important part of the questionnaire survey in RESS.
- I.V.5. The provisions of the daily needs shops, dispensary, police booths and anganwadis nearby in the neighborhood (X7), (X14) meaning thereby within walkable distance for children and devoid of trafficulated route are variables that would encourage the individual and independent navigation of children in the neighborhoods (X8) giving them a sense of worth and self esteem and be able to negotiate and interact with people and environments.
- I.V.6. The parks and open spaces in the neighborhood are well maintained and equipped (X9) with facilities offering a variety of play oppurtunities (X10). In addition, the places for games and sports are safe (X11) with the hierarchy of spaces for different age groups of children (X21) giving them the freedom to express and play in their neighborhoods and play provisions (X27) that can be enjoyed and used by them throughout the year in all weather conditions (X13).
- I.V.7. The social and cultural vibrancy of the neighborhood being measured by the variable of frequency of festivities and celebrations (X15), making the neighborhood full of activity (X25) and the chances of the neighborhood spaces being used for multiple purposes (X20) which in turn encourages the interaction of all age group of people including children (X26) while they move around with identity (X19).
- I.V.8. The children in the neighborhood get time to recreate (X16) giving them various options for meeting or personal spaces in the neighborhoods (X17) without the unease of being too much overlooked by others (X28).
- I.V.9. The variable of the neighborhood feeling safe (X24) with proper signages and paths highlighted (X18) and with minimum number of abandoned or dead areas in the neighborhood (X22) which do not tend to become dumping grounds of garbage, while maintaining the cleanliness and upkeep, fowl smell, stray animals, out of sight in neighborhoods (X23).
- I.V.10. Of all the variables being taken up , last but not the least is a subjective variable of the residents rating if their neighborhood is close to being the ideal which can be measured in variable (X29).
- (3)
- The data collected from the questionnaire survey was fed in the IBM SPSS 20 data sheet.
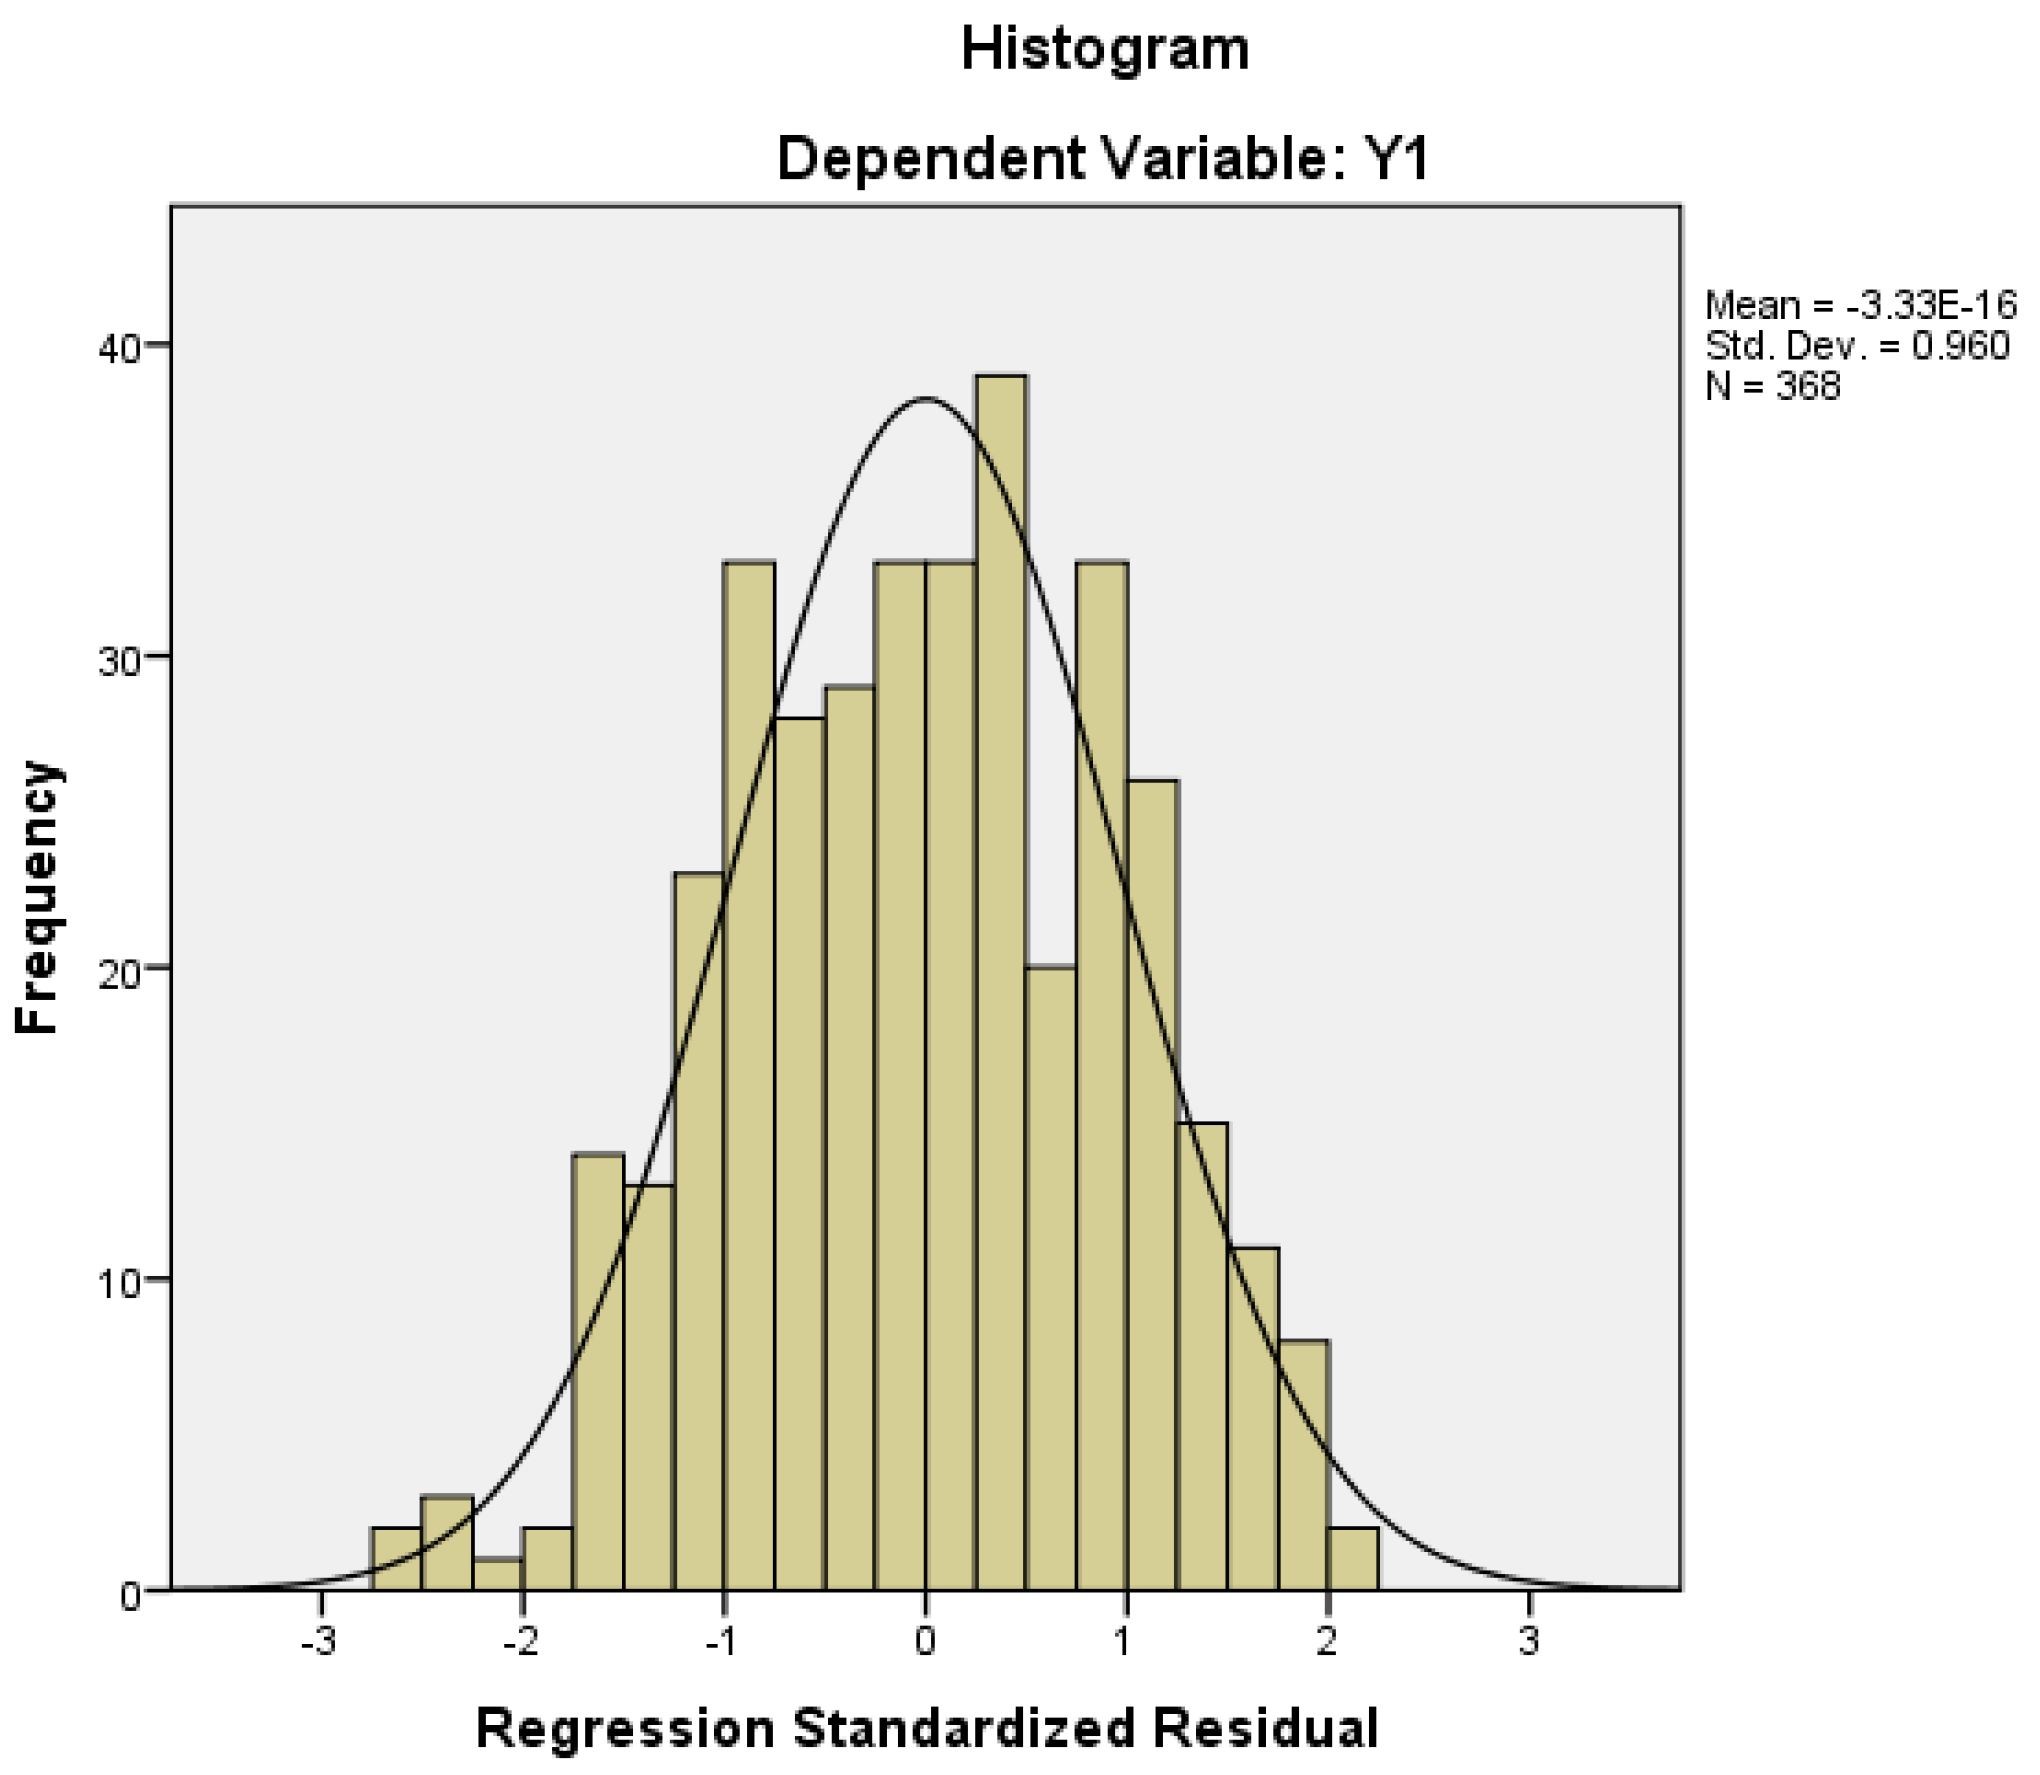
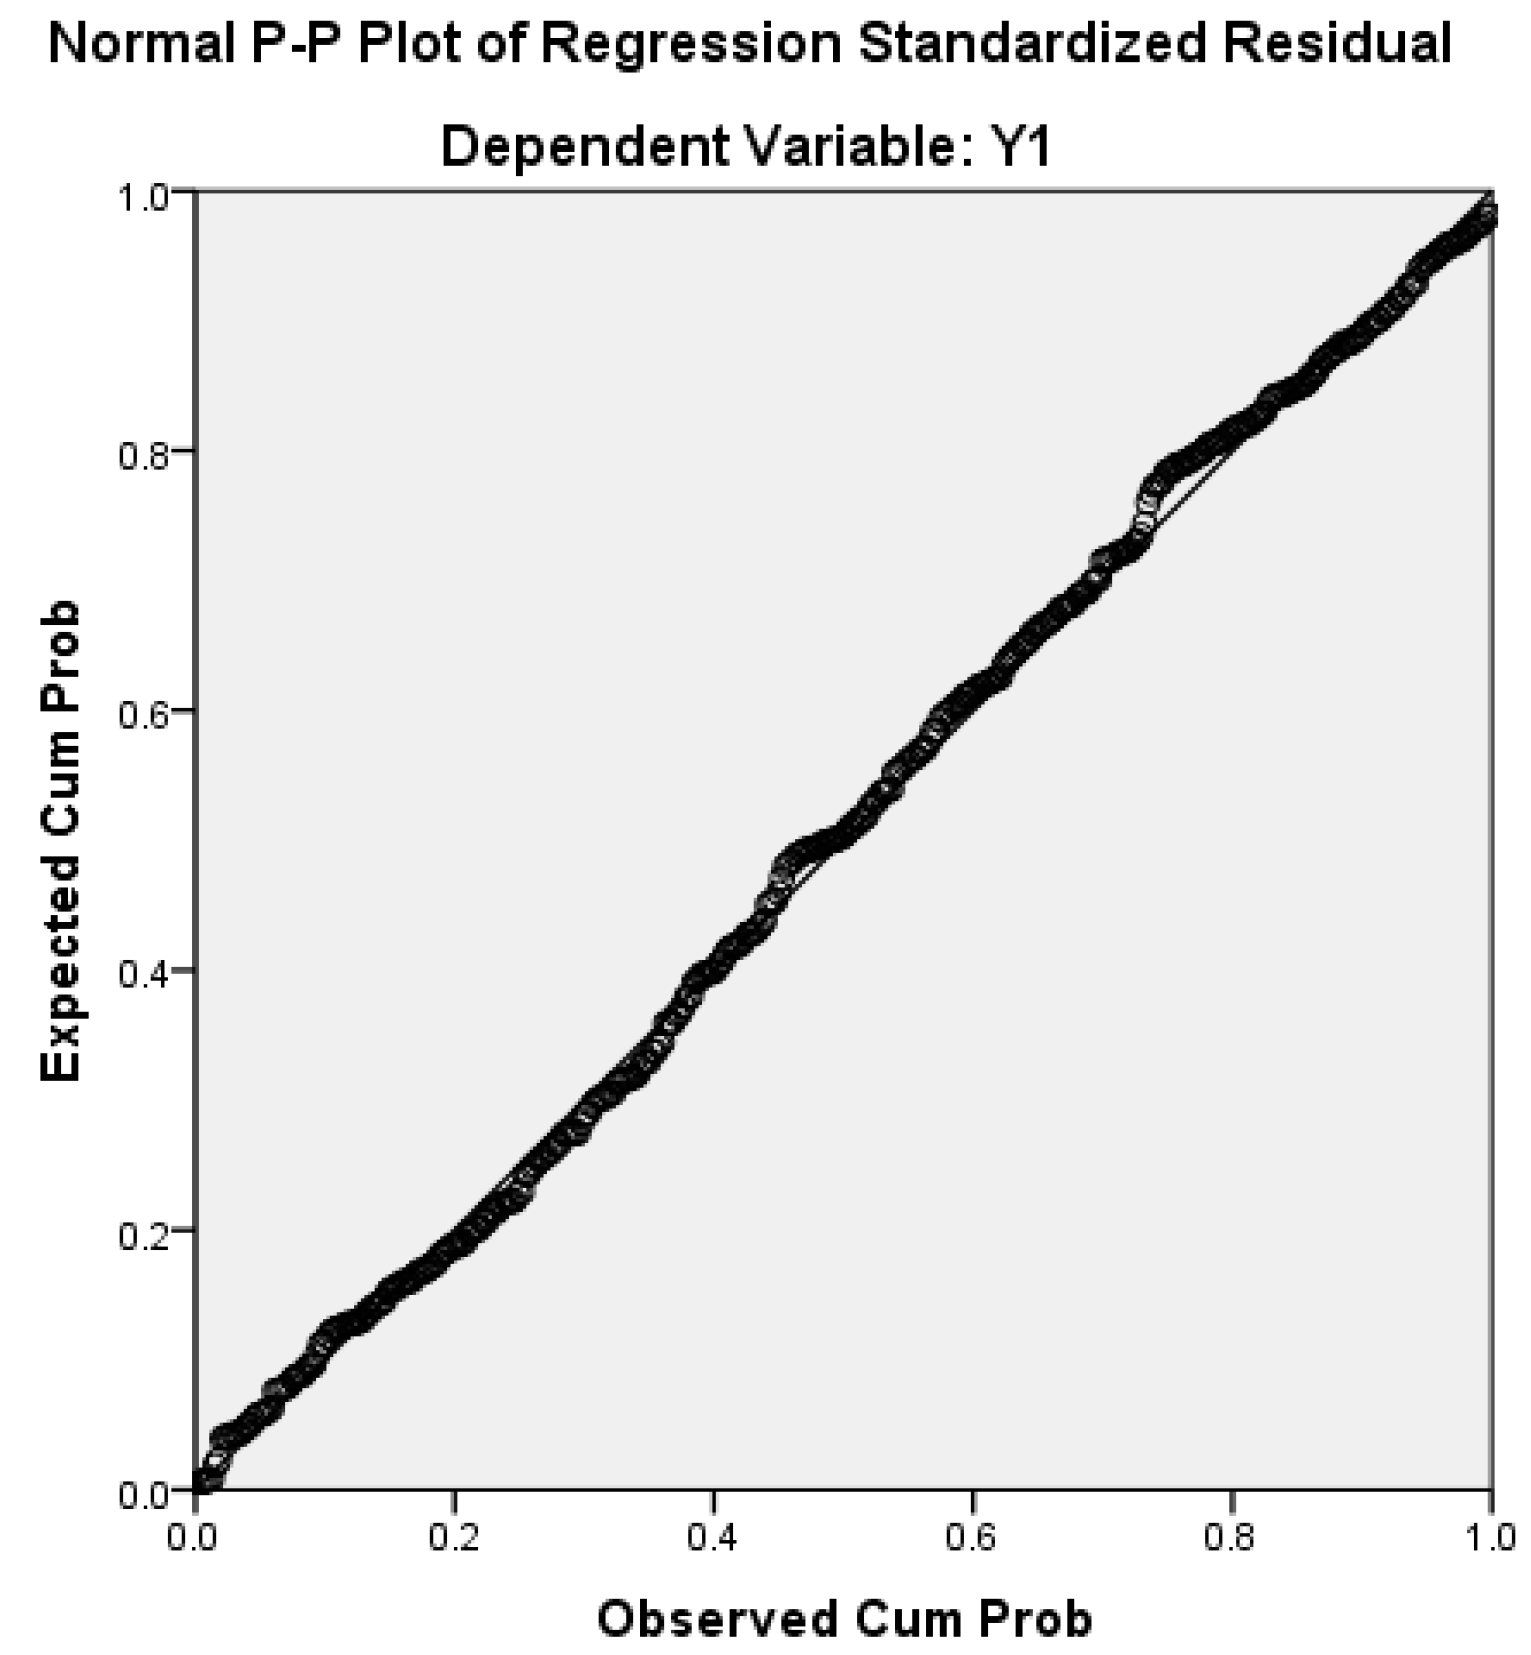
2.4.3. Normality Tests
2.4.4. Reliability Tests
2.4.5. Exploratory Factor Analysis
- Reduce the number of variables, from large to small
- Establish underlying dimensions between measured variables and constructs and
- Provide construct validity evidence
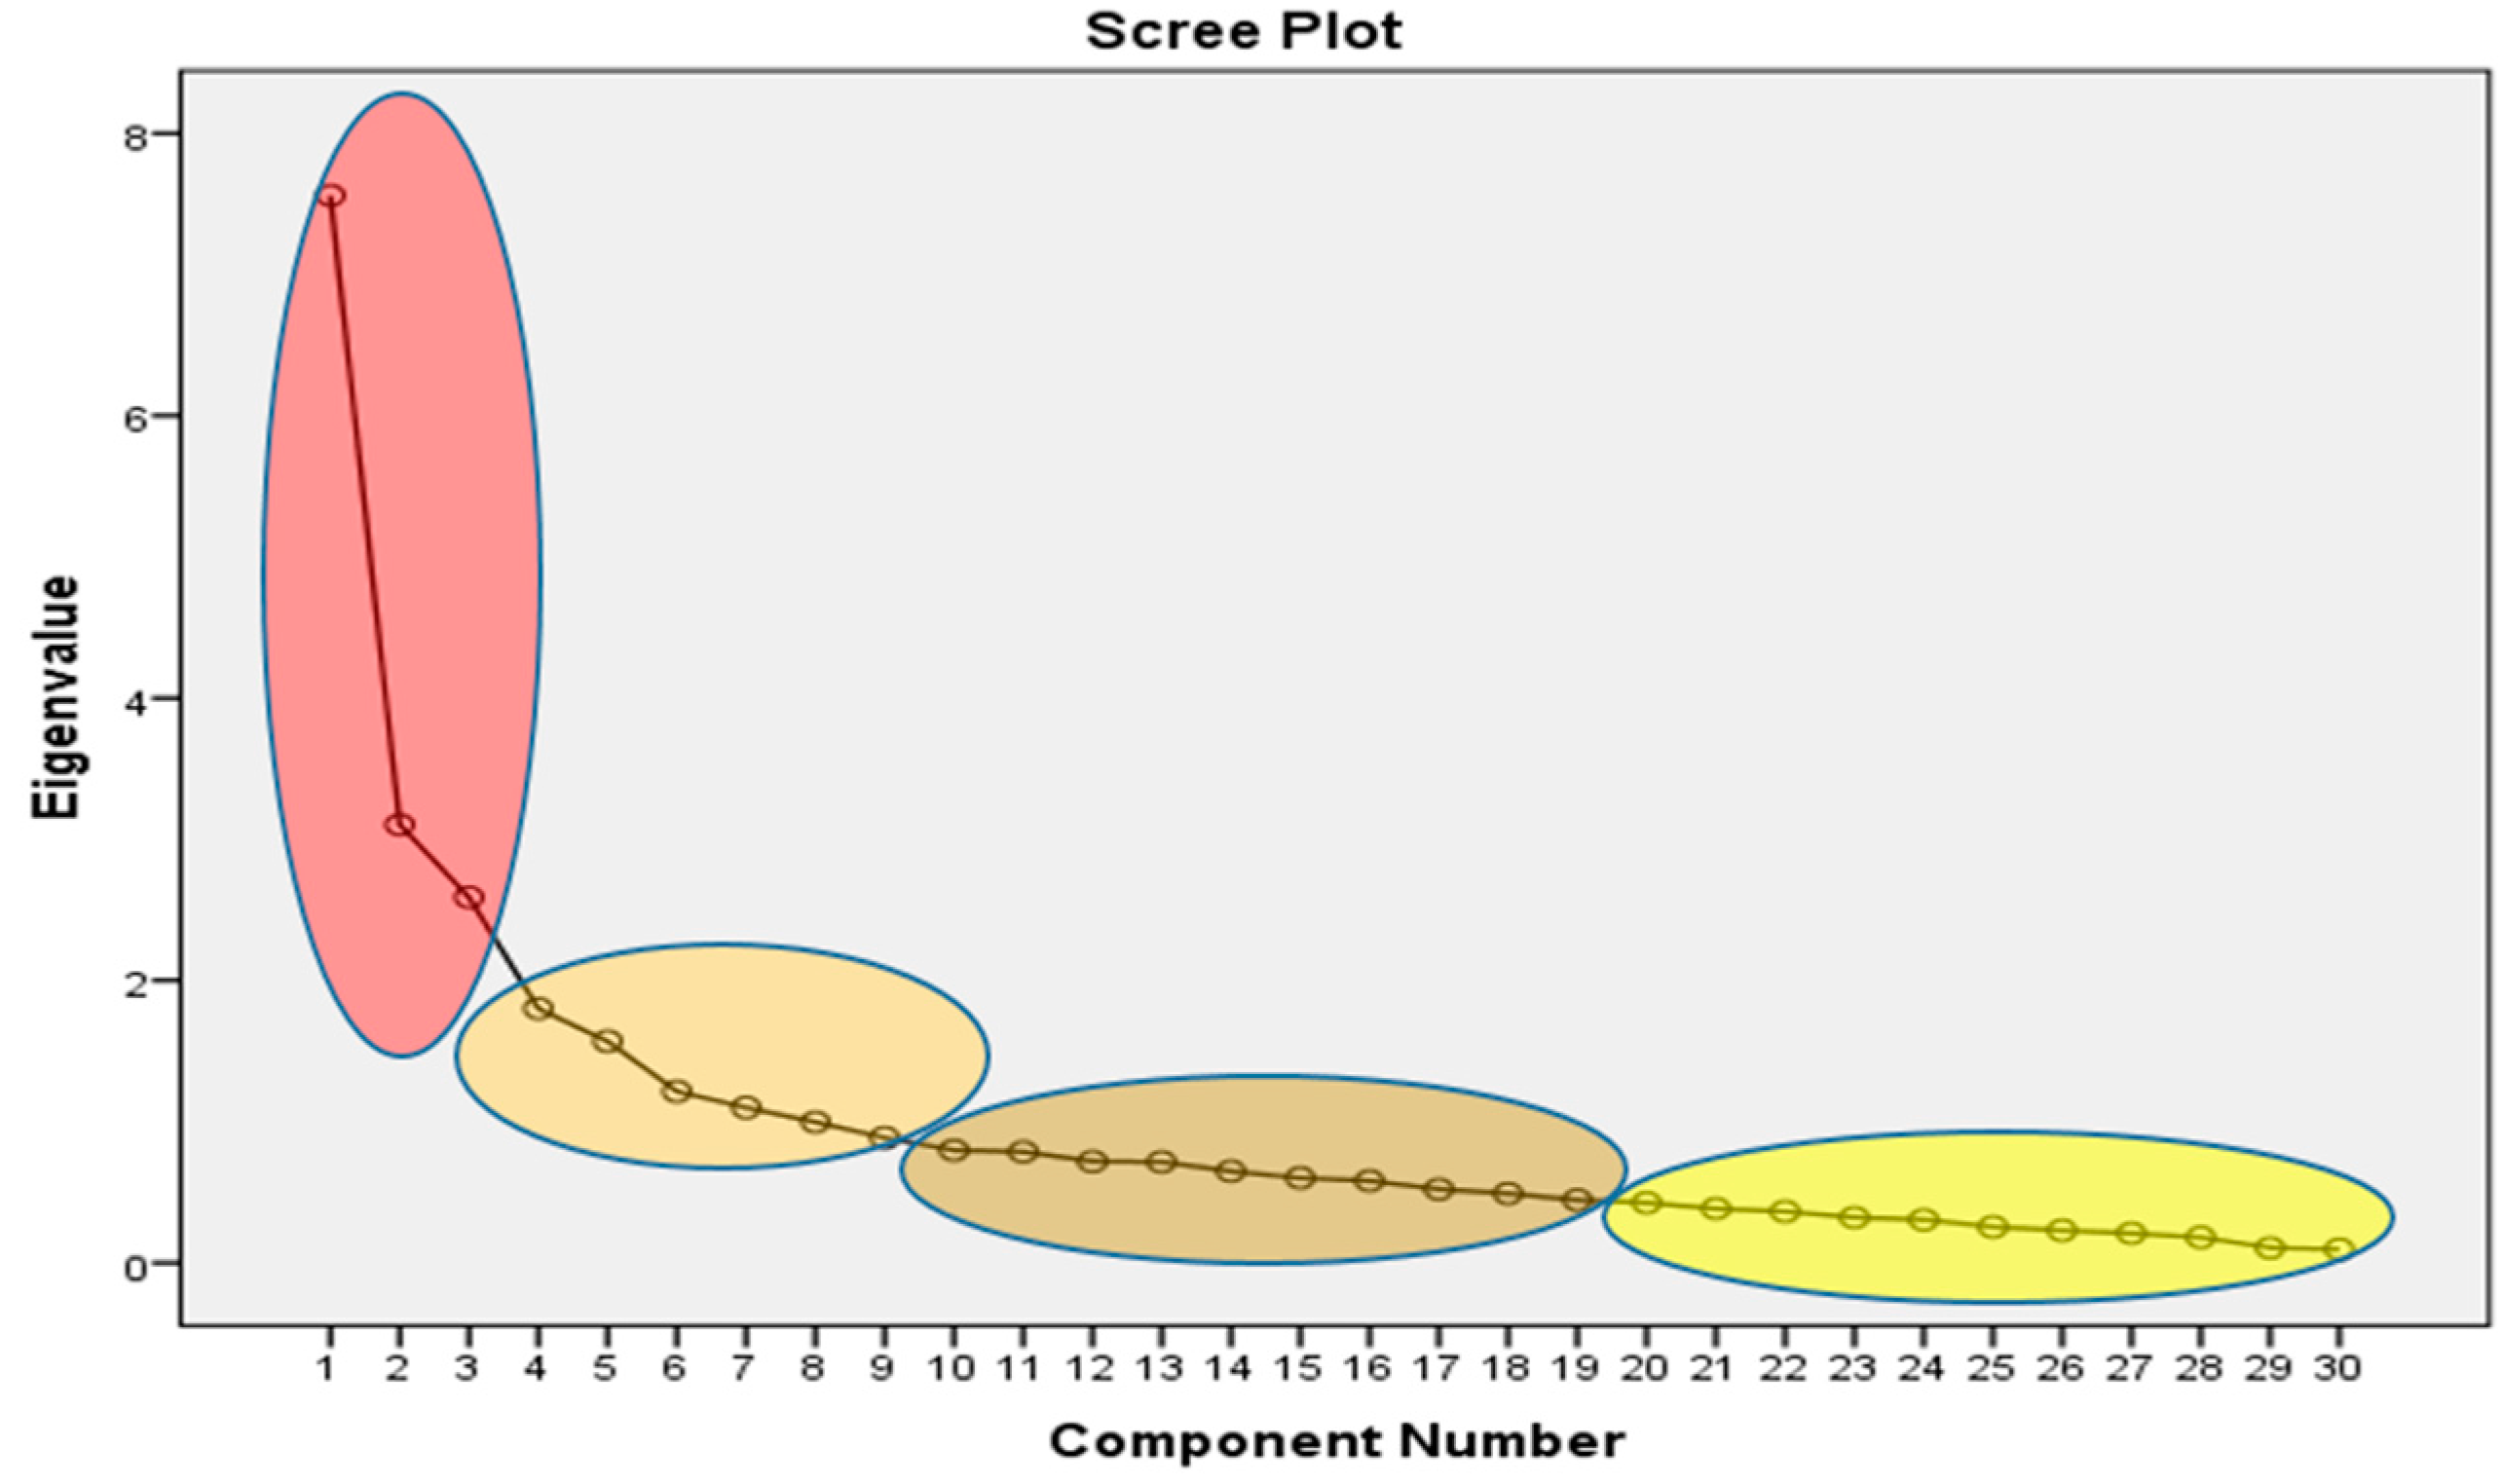
- Factor—The initial number of factors is the same as the number of variables used in the factor analysis. However, not all 30 factors will be retained. Here seven factors will be retained.
- Initial Eigen values—Eigen values are the variances of the factors. Because we conducted our factor analysis on the correlation matrix, the variables are standardized, which means that the each variable has a variance of 1, and the total variance is equal to the number of variables used in the analysis, in this case, 30.
- Total—This column contains the eigenvalues. The first factor will always account for the most variance (and hence have the highest eigenvalues), and the next factor will account for as much of the left over variance as it can, and so on. Hence, each successive factor will account for less and less variance.
- % of Variance—This column contains the percent of total variance accounted for by each factor.
- Cumulative %—This column contains the cumulative percentage of variance accounted for by the current and all preceding factors. For example, the eighth row shows a value of 66.443. This means that the first eight factors together account for 66.443% of the total variance.
- Extraction Sums of Squared Loadings—The number of rows in this panel of the table correspond to the number of factors retained. Here the values are based on the common variance. The values in this panel of the table will always be lower than the values in the left panel of the table, because they are based on the common variance, which is always smaller than the total variance.
- Rotation Sums of Squared Loadings—The values in this panel of the table represent the distribution of the variance after the varimax rotation. Varimax rotation tries to maximize the variance of each of the factors, so the total amount of variance accounted for is redistributed over the three extracted factors. The graph below shows the scree plots of eigenvalues against the factor numbers.
- The scree plot graphs the eigenvalues against the factor number. You can see these values in the first two columns of the table immediately above. From the seventh factor on, you can see that the line is almost flat, meaning thereby that each successive factor is accounting for smaller and smaller amounts of the total variance as is shown in the Figure 11.
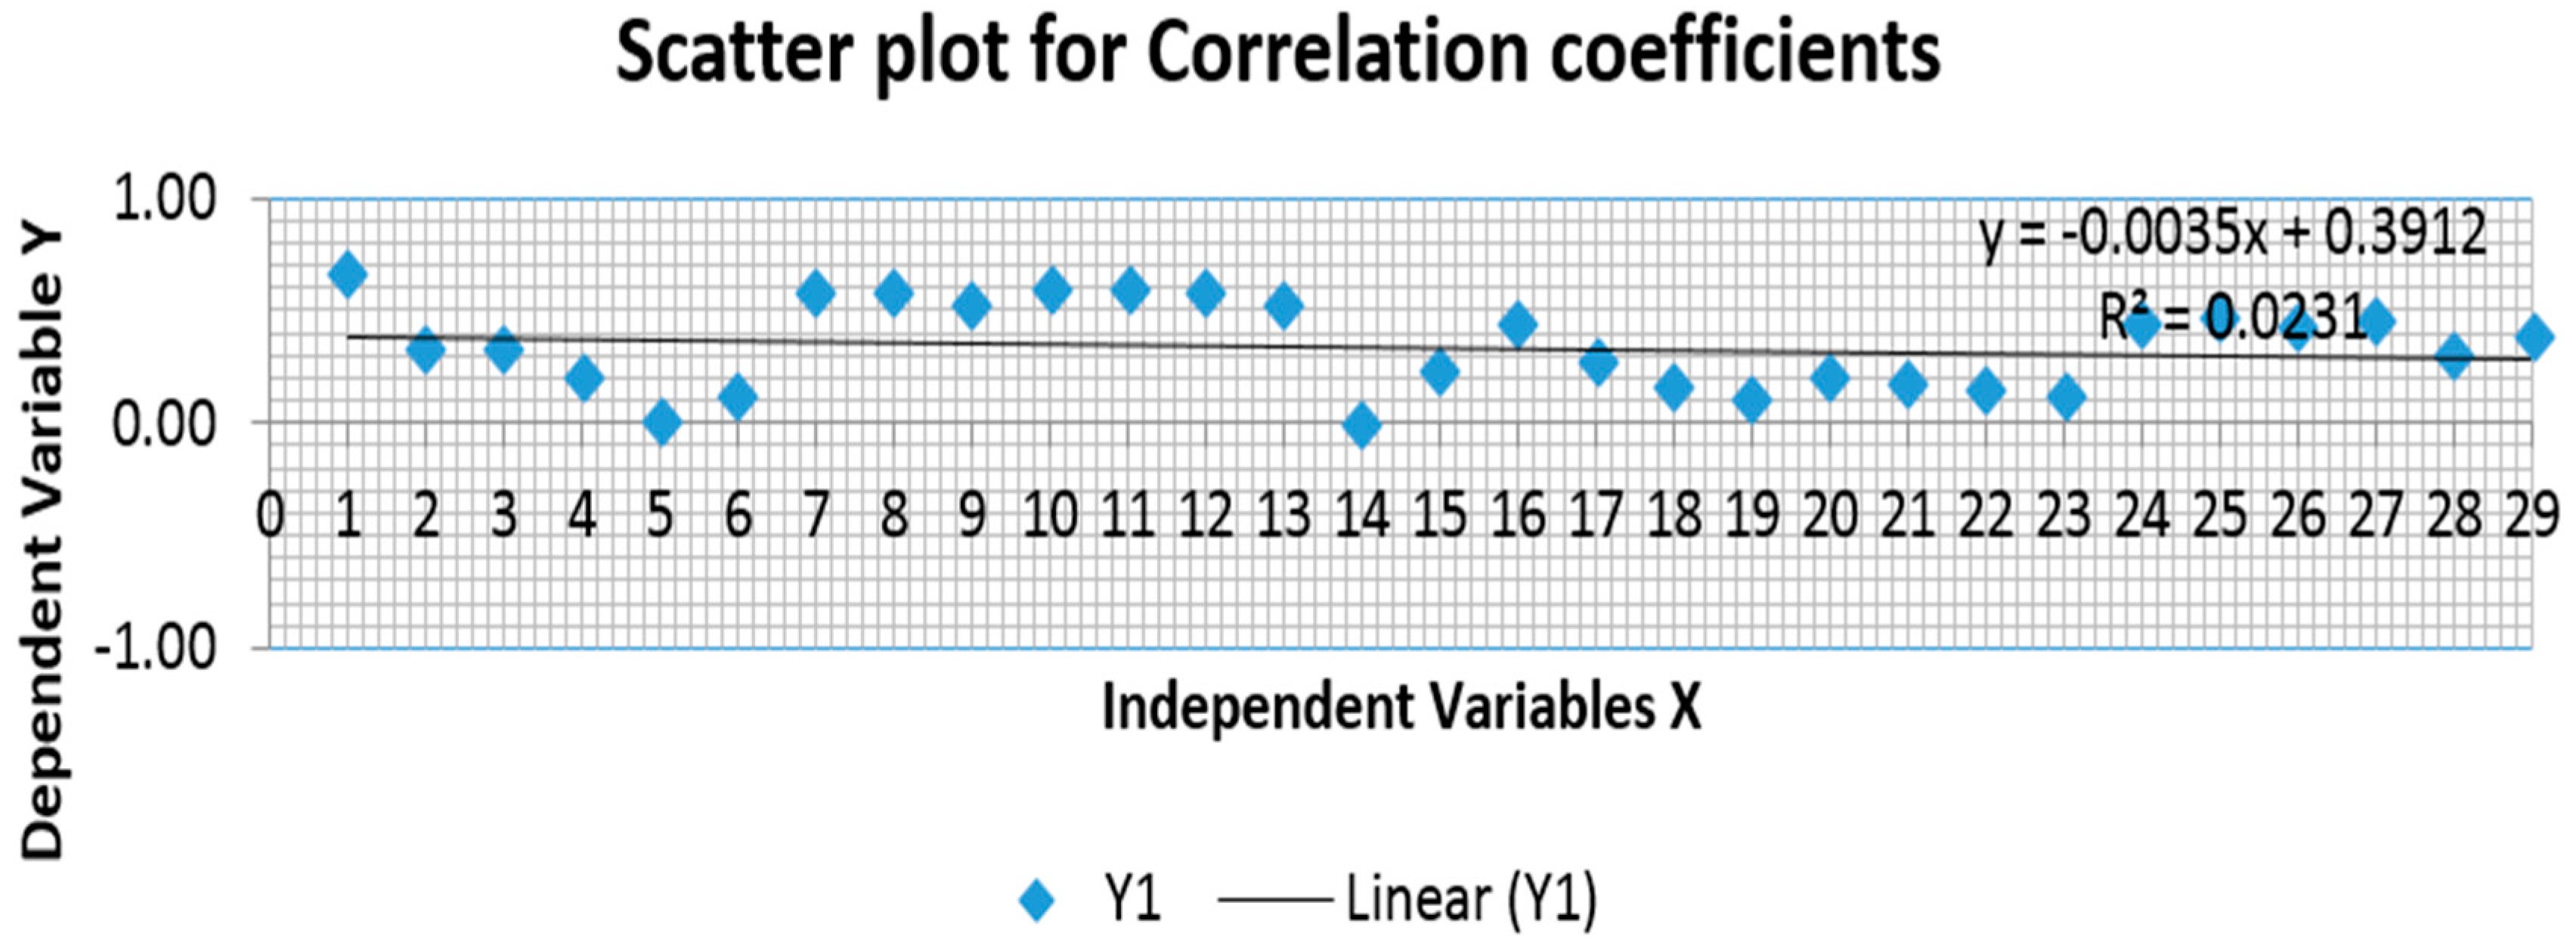
- Component Matrix—This table contains the unrotated factor loadings, which are the correlations between the variable and the factor. Because these are correlations, possible values range from −1 to +1. The correlations that are 3 or less can be removed. This makes the output easier to read by removing the clutter of low correlations that are probably not meaningful anyway.
- Factor Score Coefficient Matrix—This is the factor weight matrix and is used to compute the factor scores. The data was then subjected to the validity tests.
2.4.6. Validity Tests
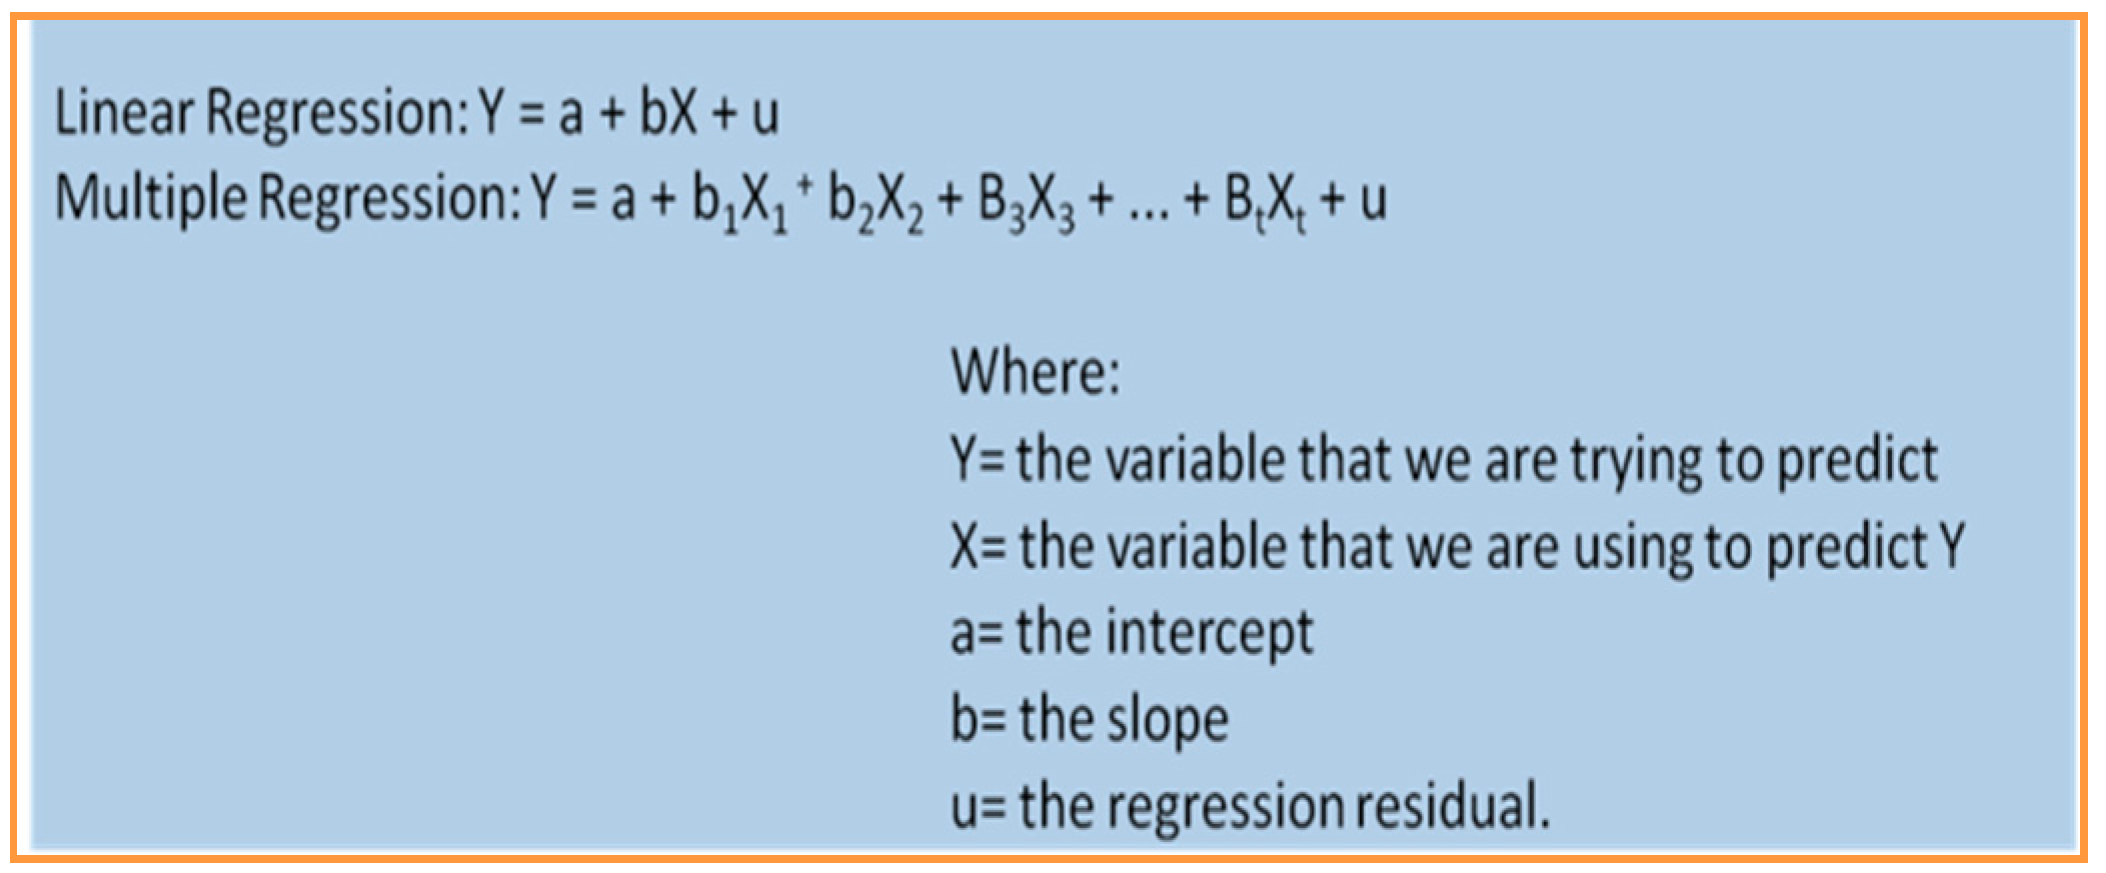
2.4.7. Regression Analysis
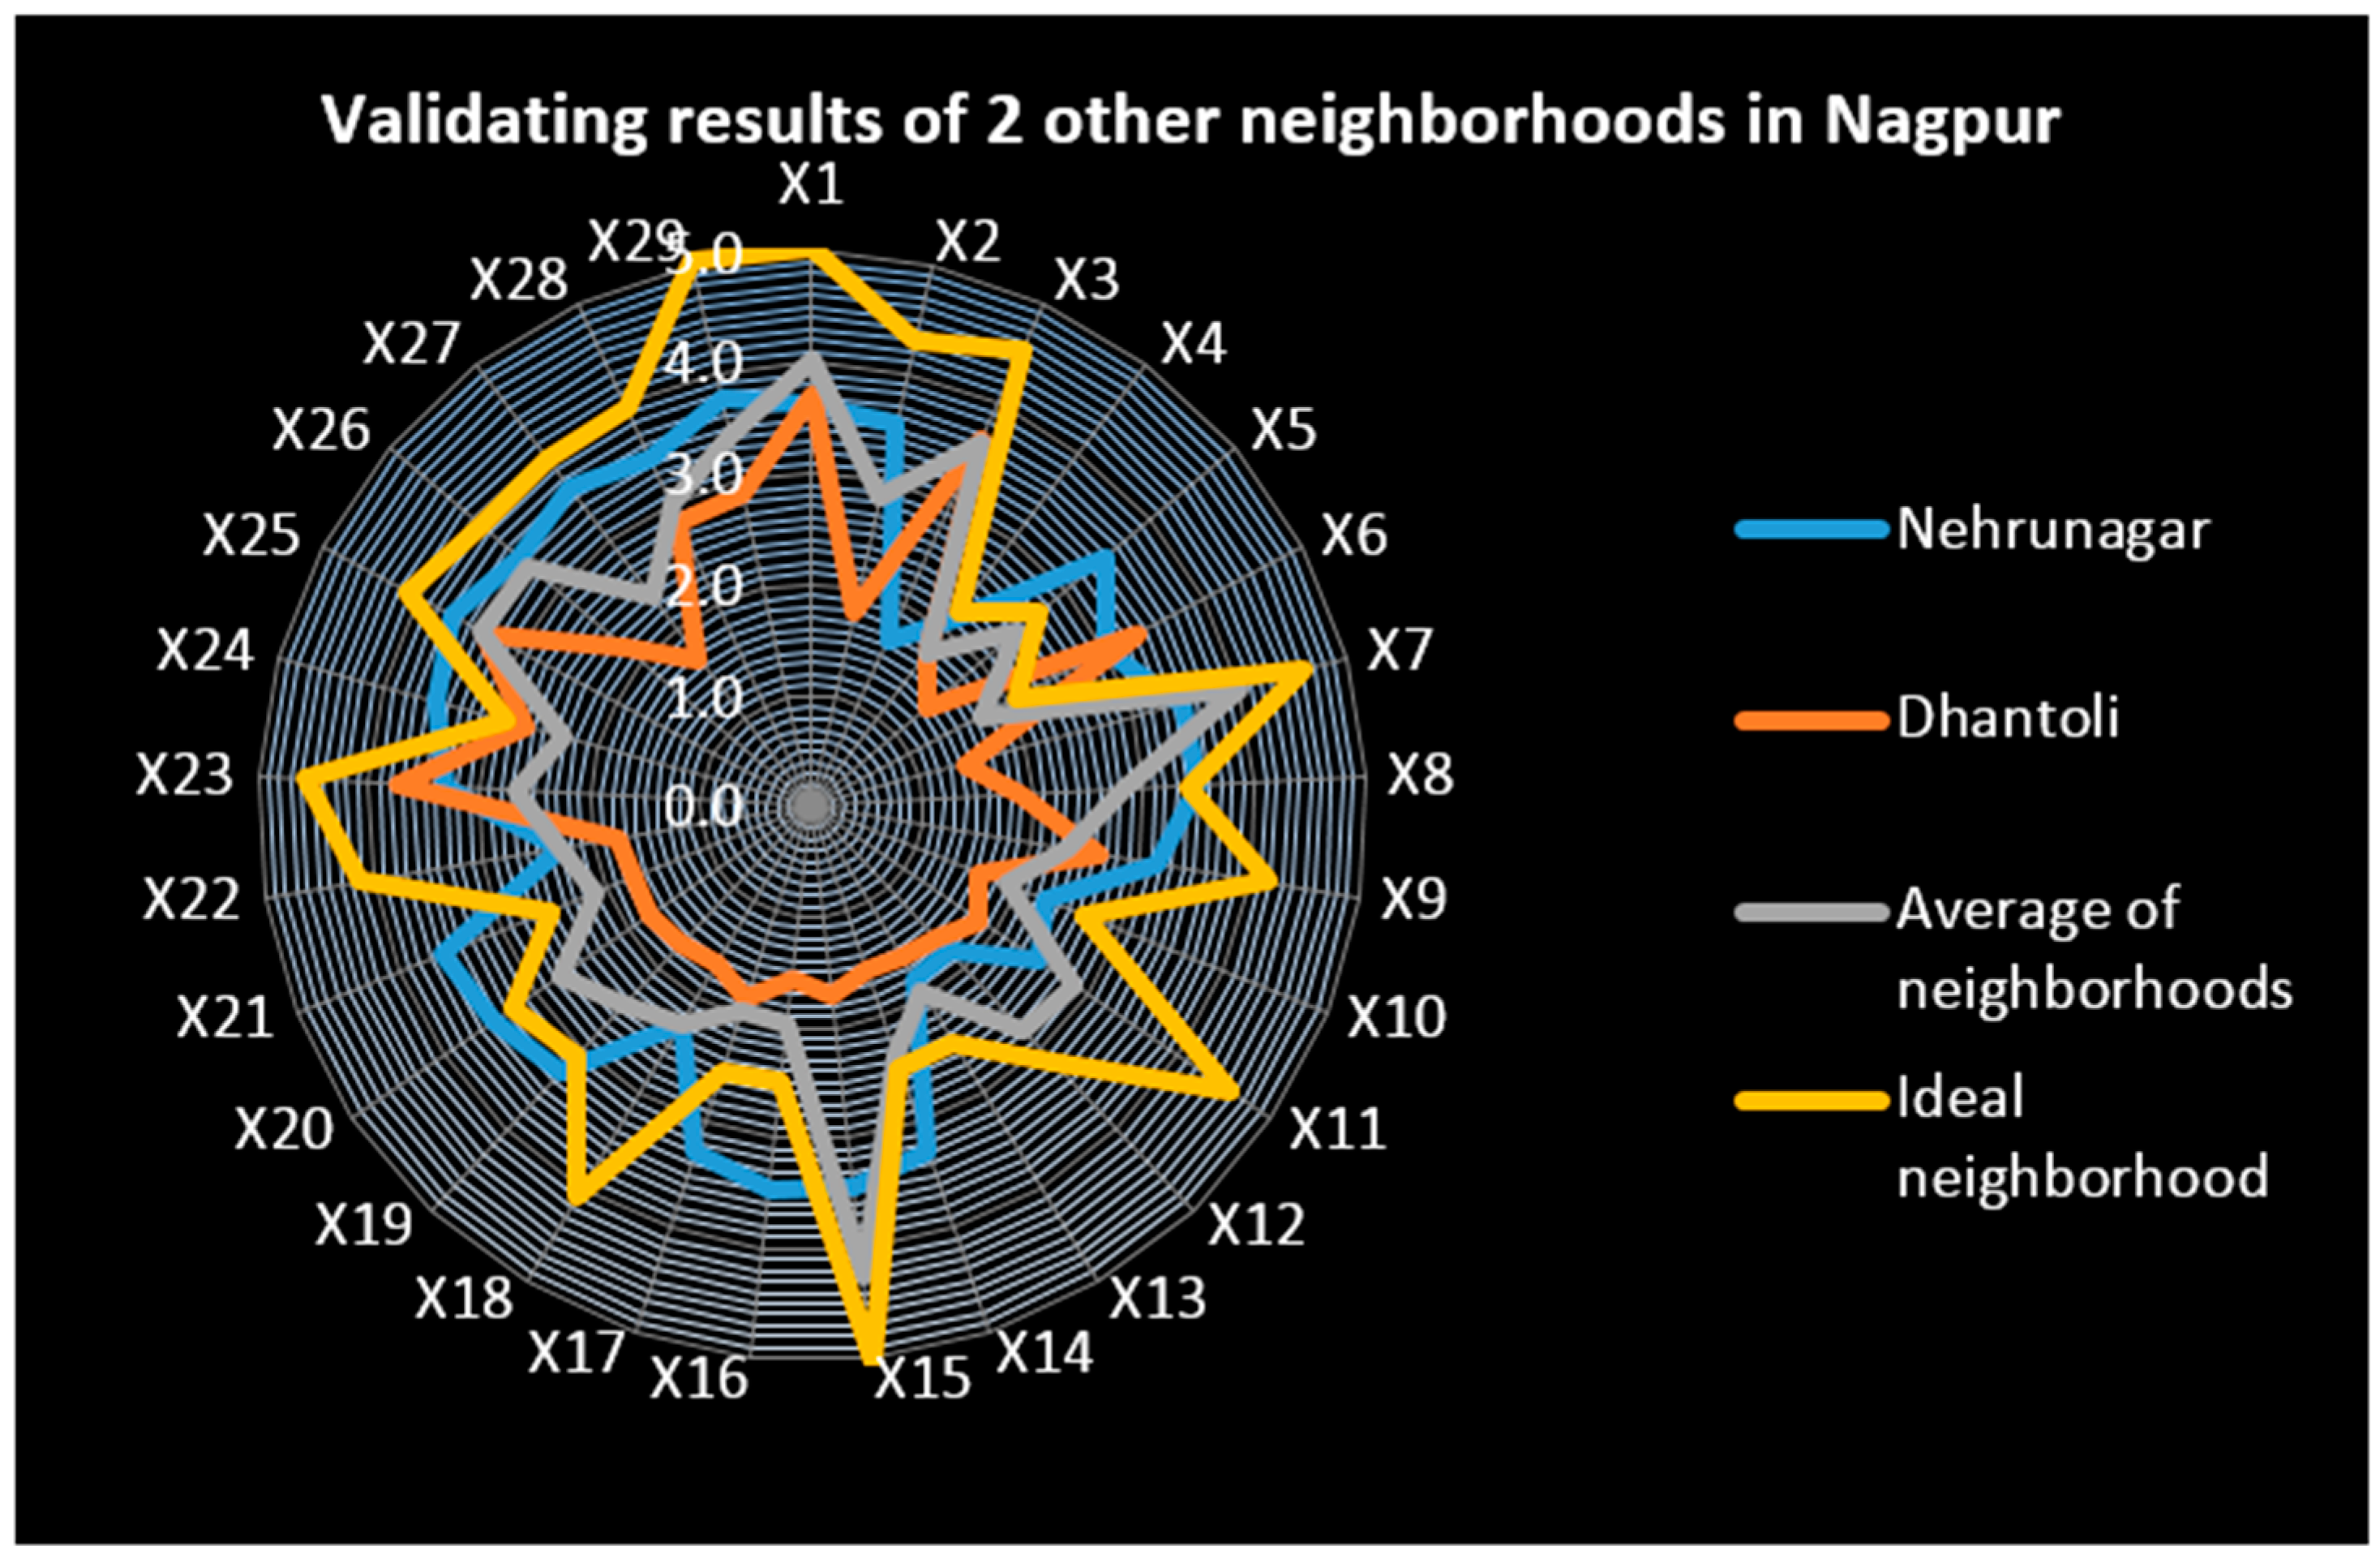
3. Validating the Model
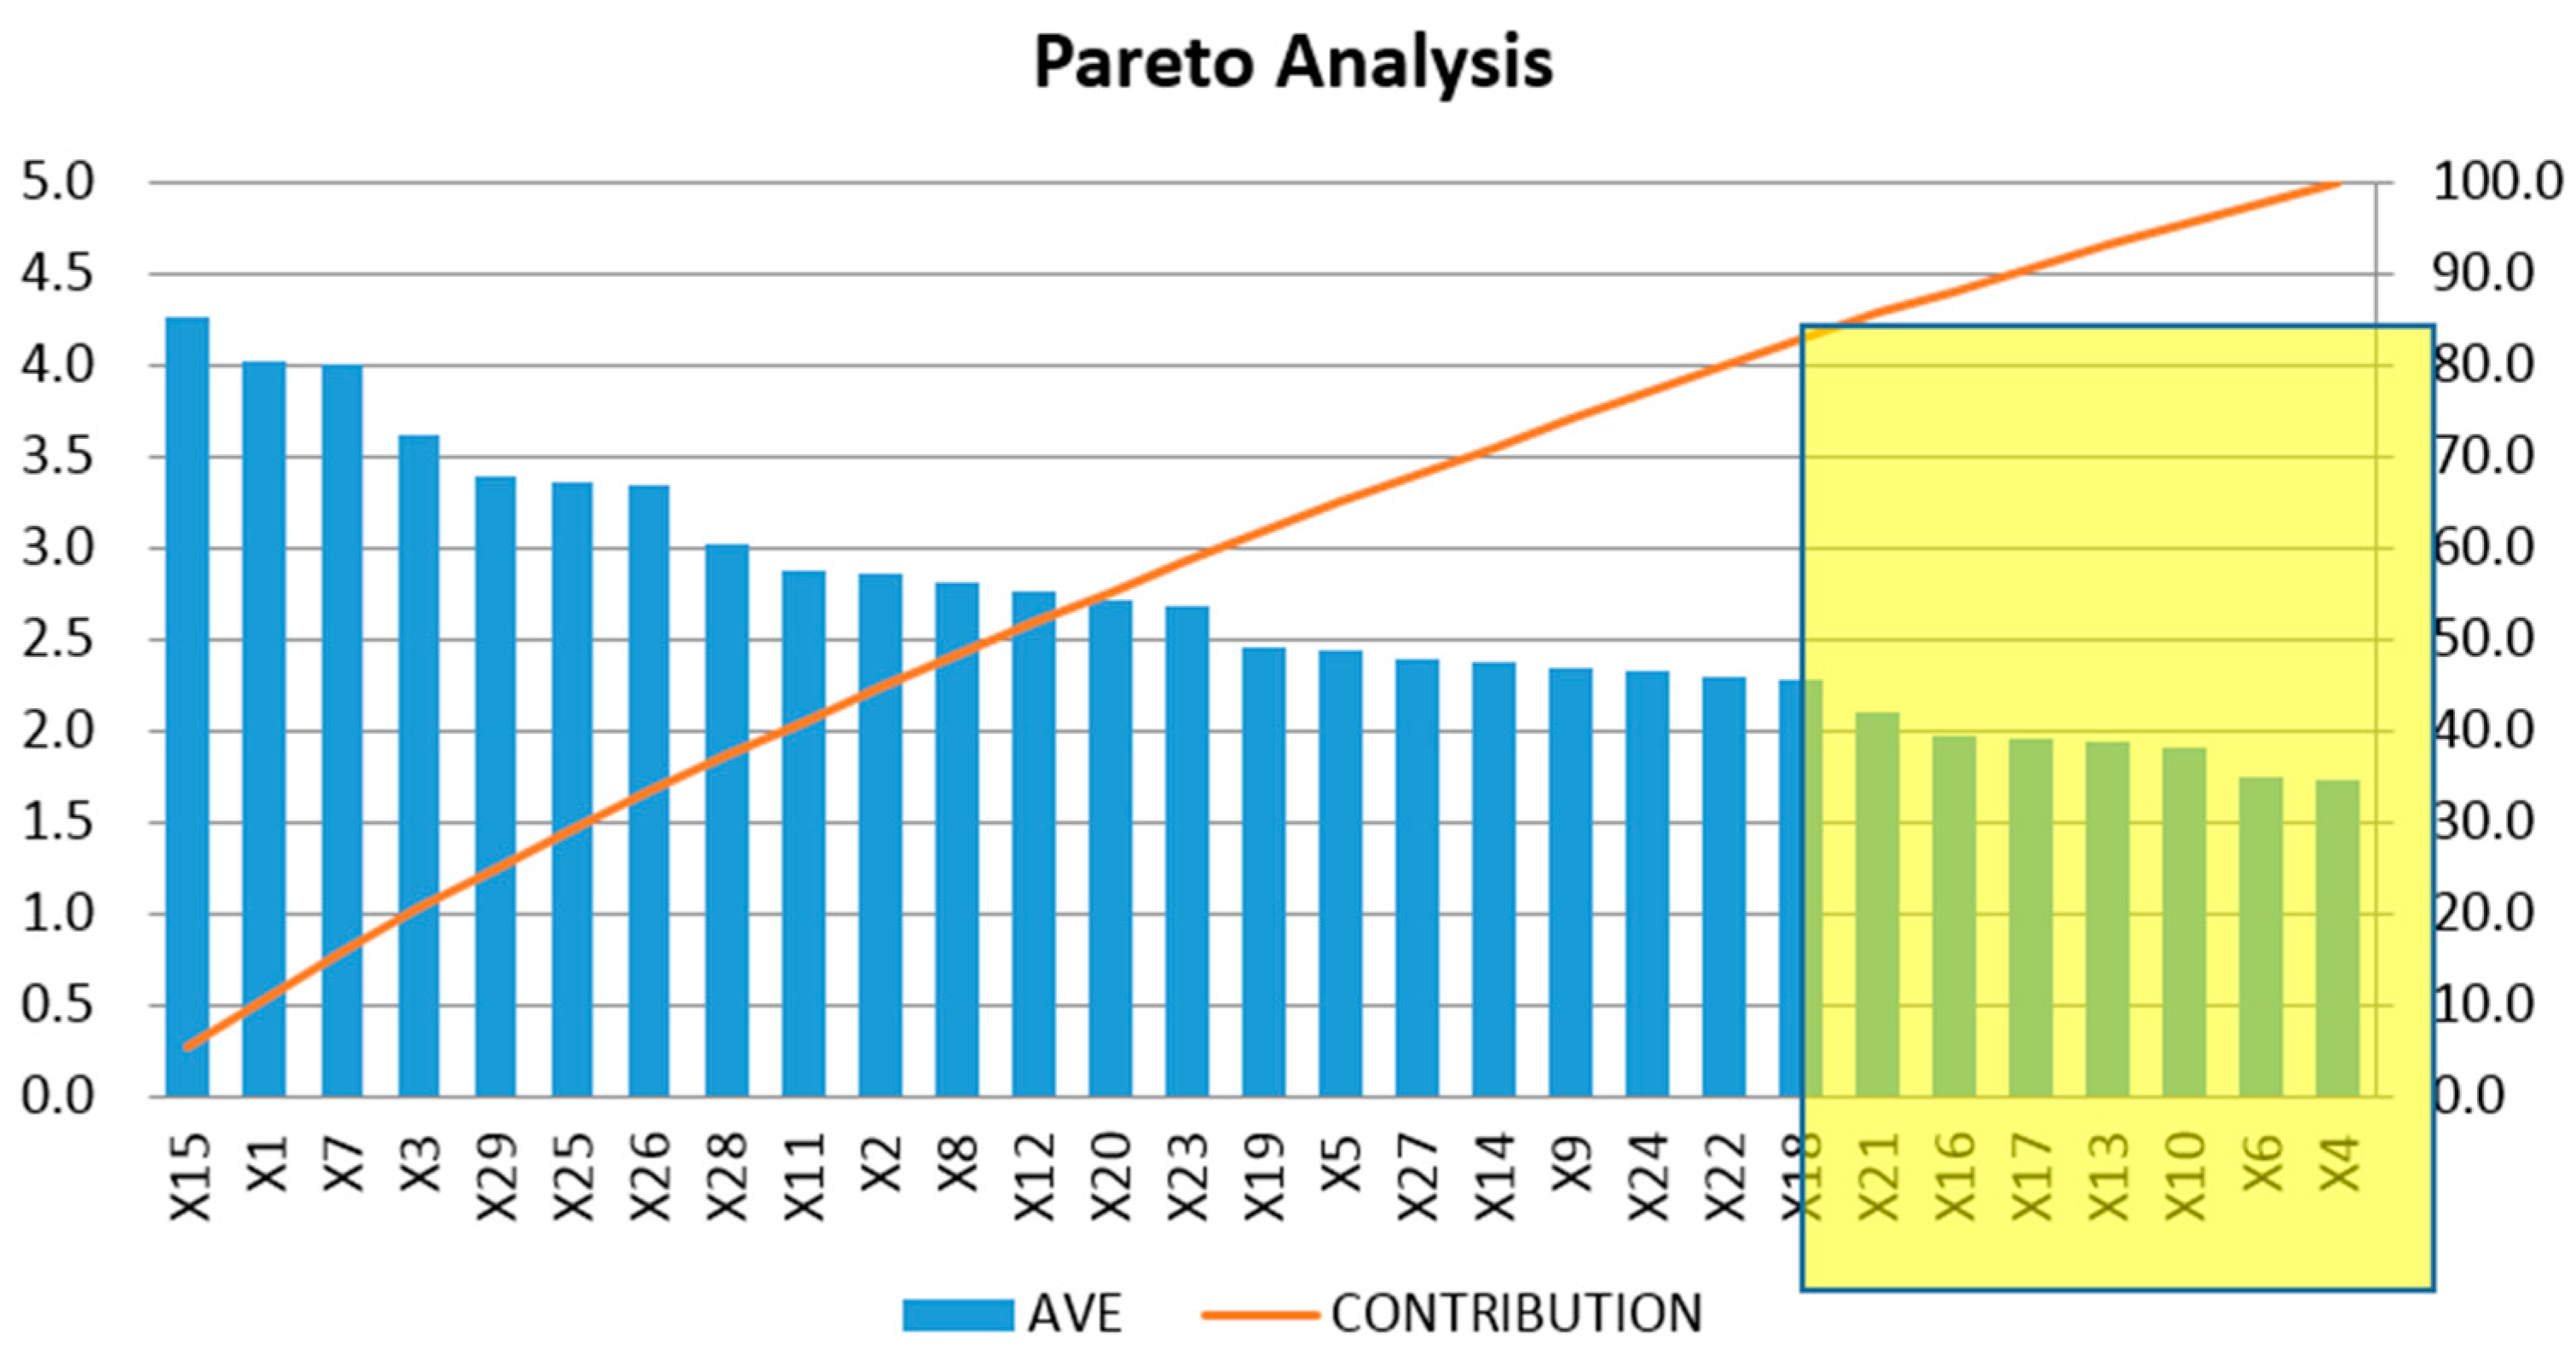
3.1. Identification of Significant Variable Mainly Contributing to the Satisfaction Level (Y1)
- (1)
- Significant independent variables were identified using Pareto statistical tool.
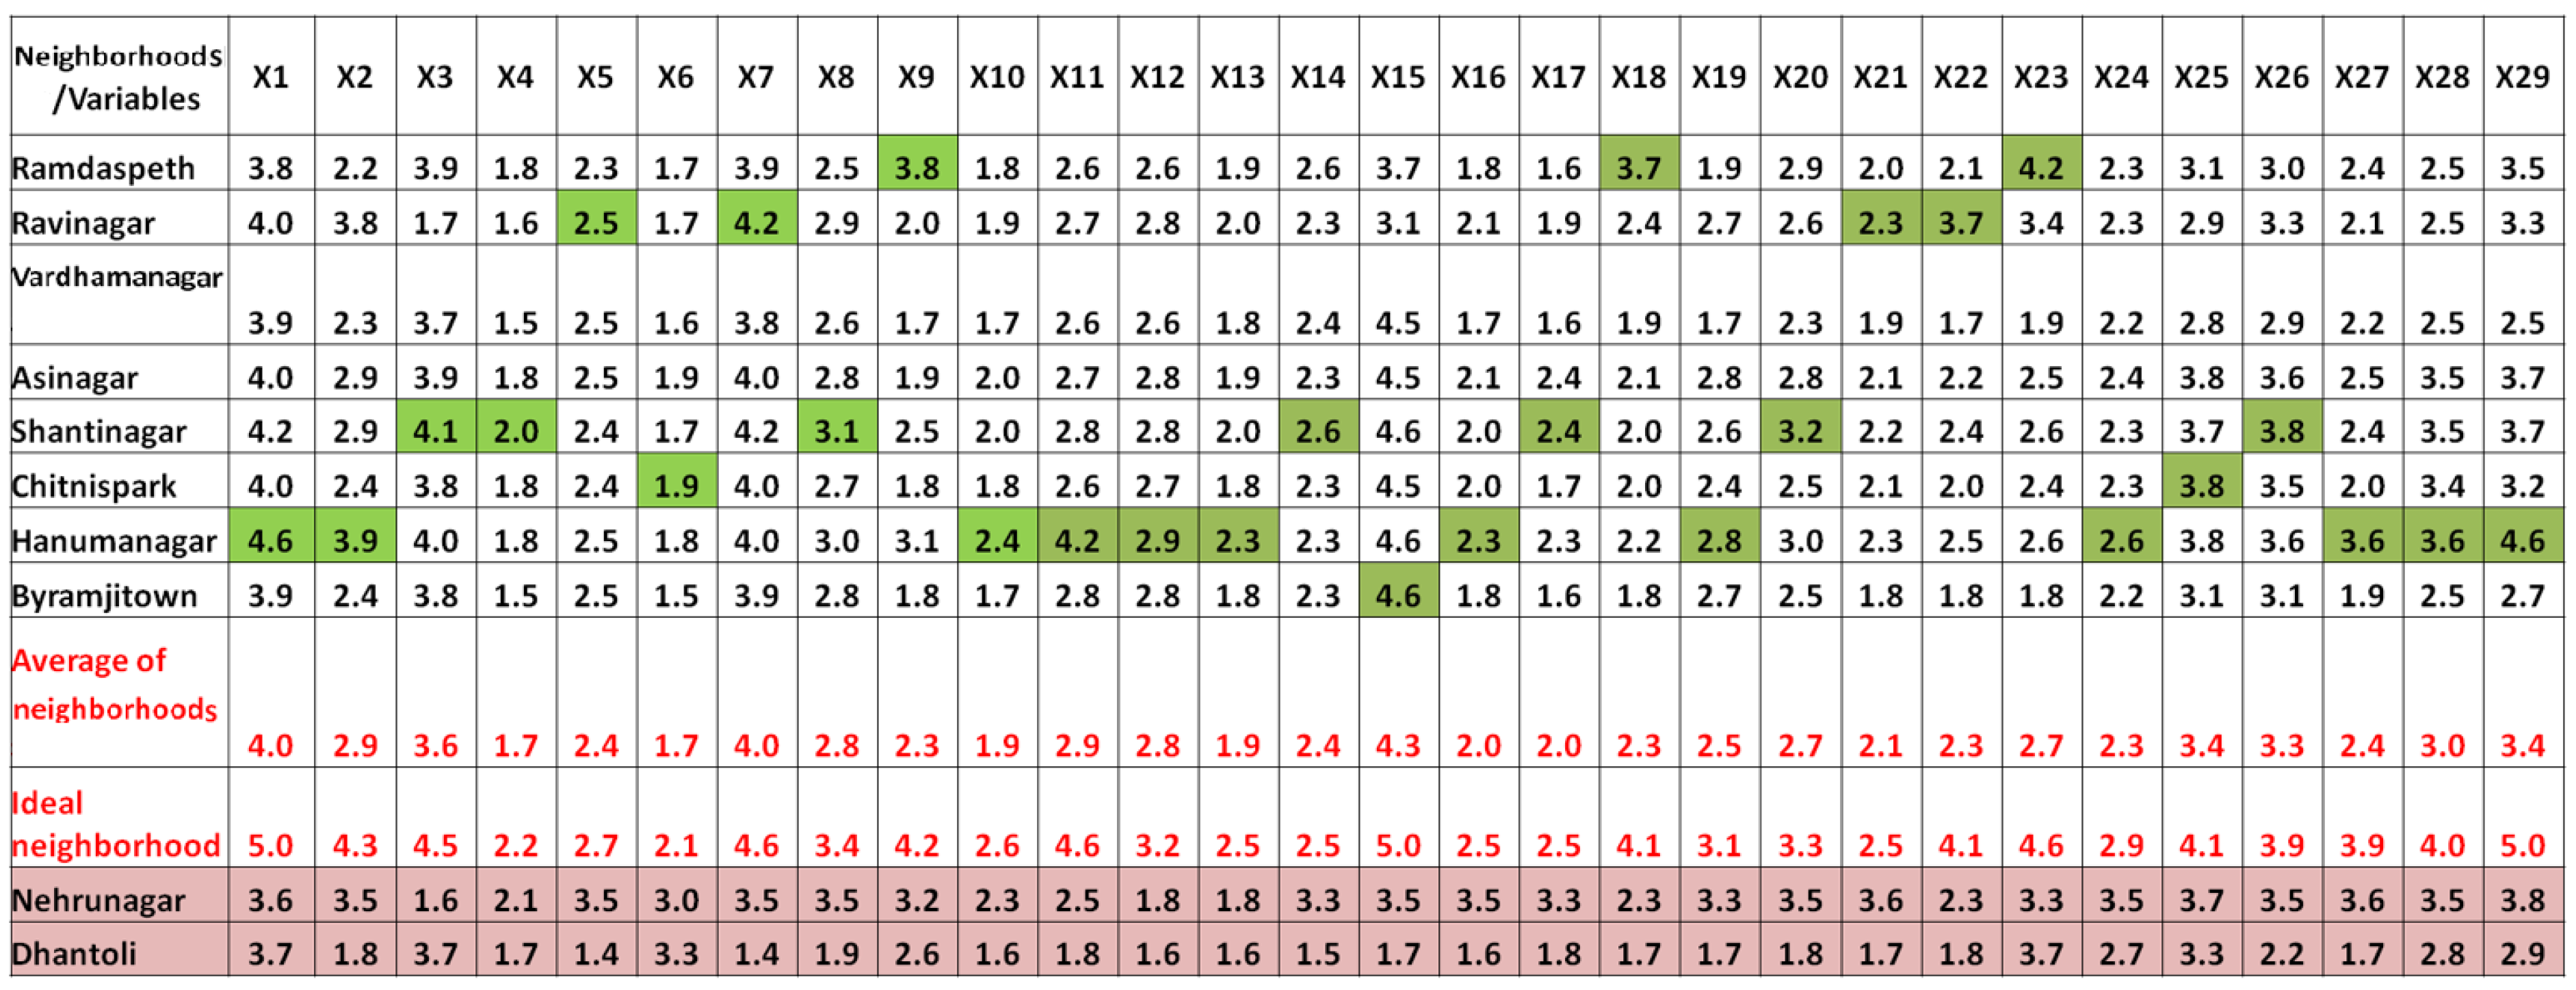
- (2)
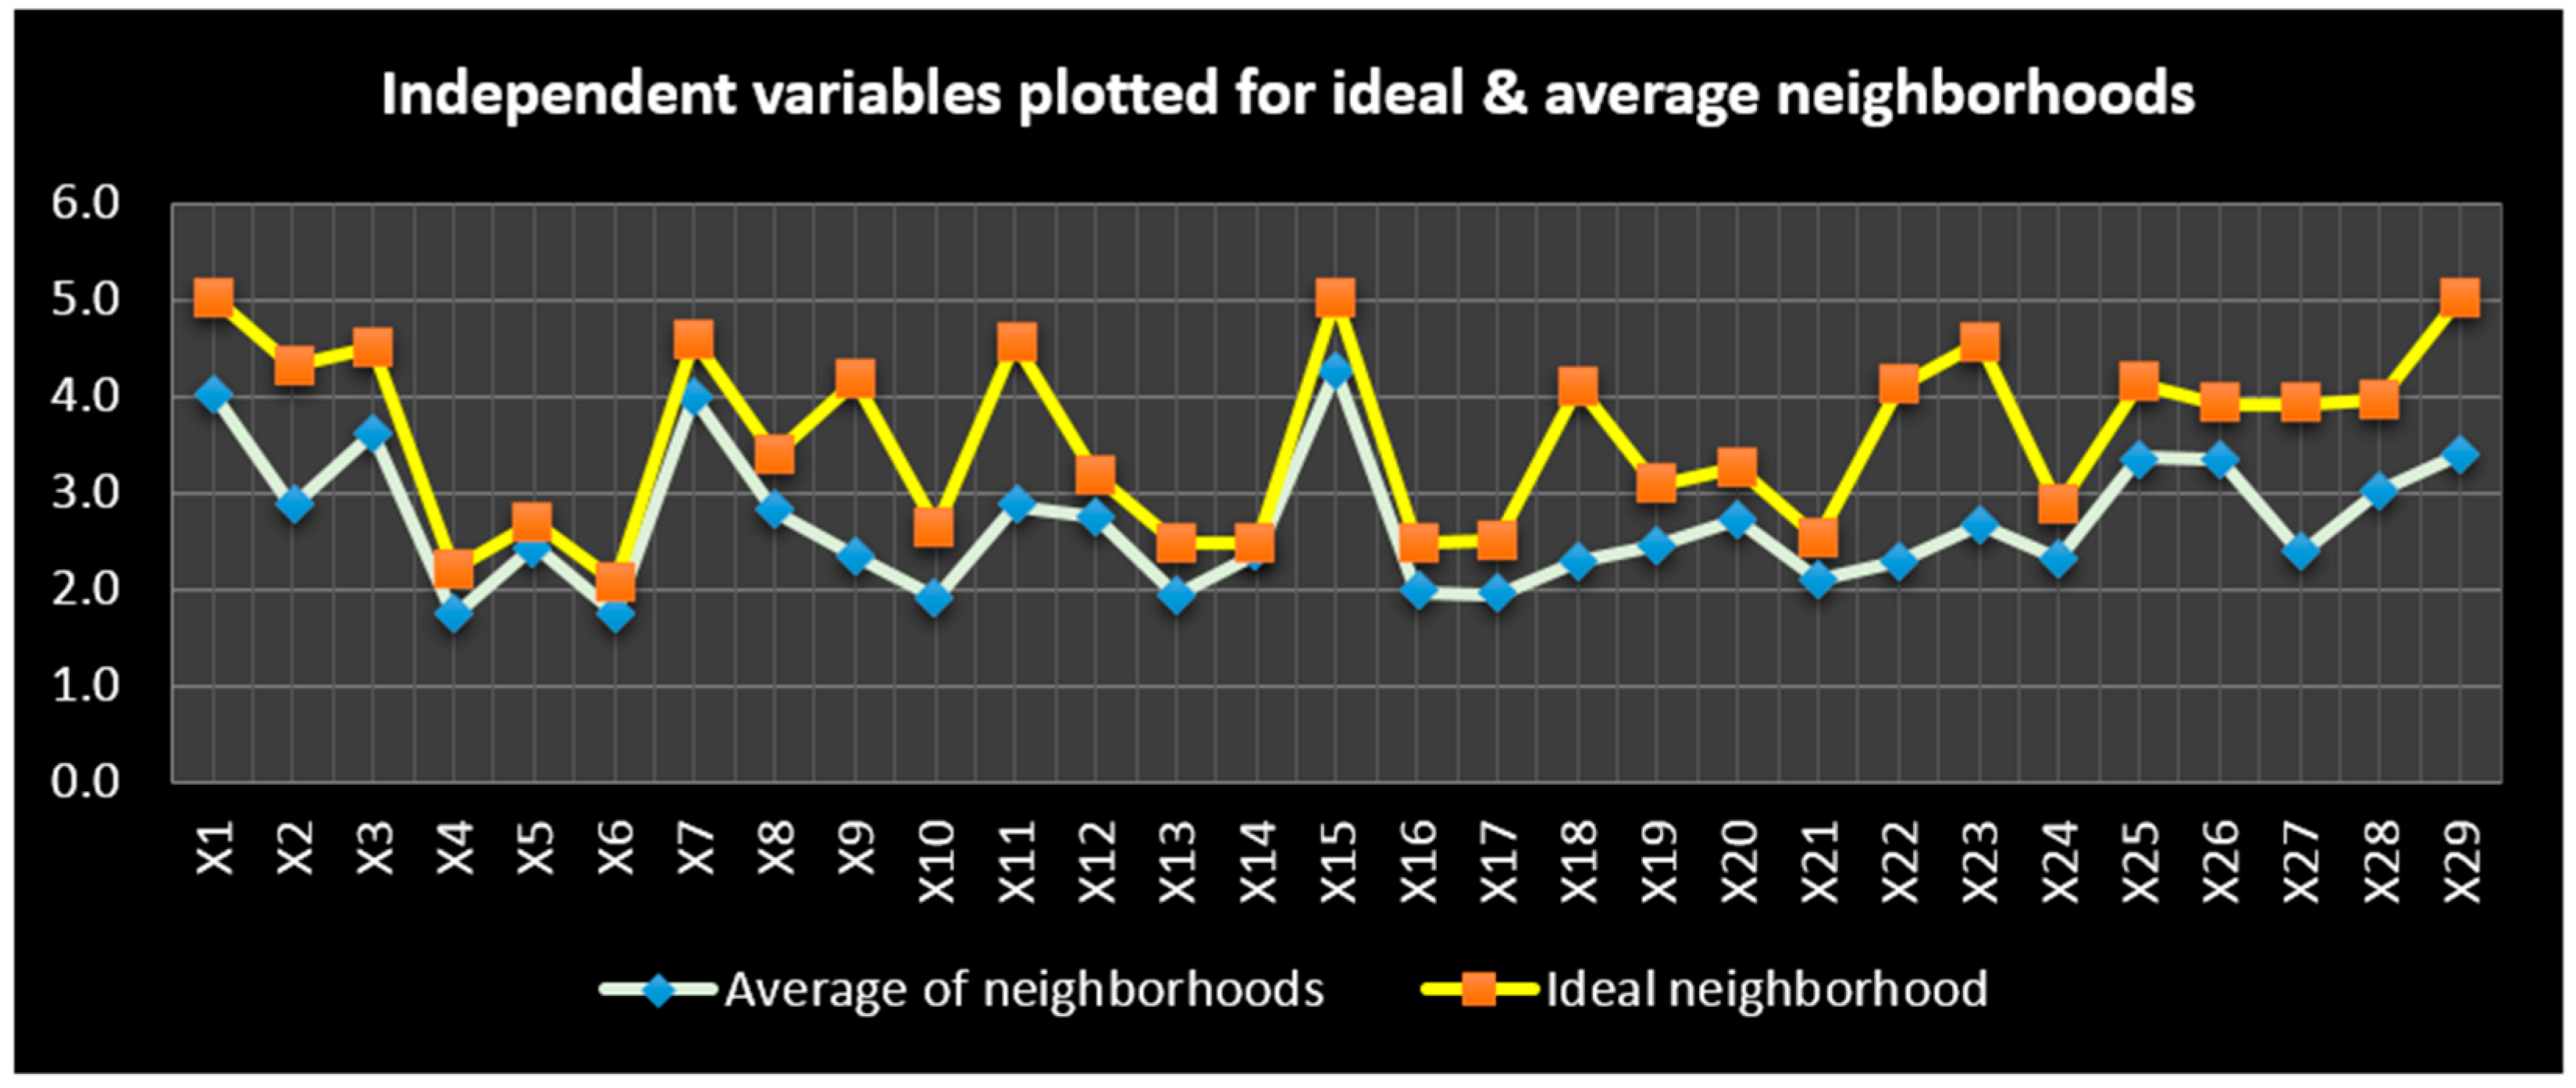
- Average and Ideal values were set for the independent variables marked as (X) with numbers.
3.1.1. Pareto Analysis for Identification of Significant Independent Variable
3.1.2. Average and Ideal Values for the Independent Variables (X)
4. Conclusions
Limitations and Further Applications of Methodology
- In evolving methodology to study child friendly environs.
- In identifying variables in Indian context.
- In developing requisite tools for Residential environment evaluation.
Author Contributions
Conflicts of Interest
References
- Lawrence, R.J. Healthy residential environments. In Handbook of Environmental Psychology, 2nd ed.; Bechtel, R.B., Churchman, A., Eds.; Wiley: New York, NY, USA, 2002; pp. 394–412. [Google Scholar]
- Carp, F.M. Impact of improved housing on morale and life satisfaction. Gerontologist 1975, 15, 511–515. [Google Scholar] [CrossRef] [PubMed]
- Sewell, W.R.D. Behavioural responses to changing environmental quality. Environ. Behav. 1971, 3, 119–122. [Google Scholar] [CrossRef]
- Kaili, D. Fuzzy Evaluation of Urban Environmental Quality: Casestudy Wuchang Wuhan. Master’s Thesis, International Institute for Geo-Information and Earth-Observation, Enschede, The Netherlands, 2003. [Google Scholar]
- Odemerho, F.O.; Chokor, B.A. An aggregate index of environmental quality: The example of a traditional city in Nigeria. Appl. Geogr. 1991, 11, 35–38. [Google Scholar] [CrossRef]
- Bonaiuto, M.; Fornara, F.; Bonnes, M. Indexes of perceived residential environmental quality and neighbourhood attachment in urban environments: A confirmation study on the city of Rome. Landsc. Urban Plan. 2003, 65, 41–52. [Google Scholar] [CrossRef]
- Aziz, N.; Said, I. The trends and influential factors of children’s use of outdoor environments: A review. Asian J. Environ. Behav. Stud. 2011, 2, 67–79. [Google Scholar] [CrossRef]
- Lester, S.; Russell, W. Children’s Right to Play, an Examination of the Importance of Play in the Lives of Children Worldwide; Bernard van Leer Foundation: The Hague, The Netherlands, 2010. [Google Scholar]
- Fried, M. Residential satisfaction: Sources of residentialand community satisfaction. J. Soc. Issues 1982, 38, 107–119. [Google Scholar] [CrossRef]
- Bonaiuto, M.; Aiello, A.; Perugini, M.; Bonnes, M.; Ercolani, A.P. Multidimensional perception of residential environment.quality and neighbourhood attachment in the urban environment. J. Environ. Psychol. 1999, 19, 331–352. [Google Scholar] [CrossRef]
- National Playing Fields Association. PLAYLINK and the Children’s Play Council Best Play: What Play Provision Should do for Children; National Playing Fields Association: London, UK, 2000. [Google Scholar]
- Shapiro, S.S.; Wilk, M.B. An Analysis of Variance Test for Normality (Complete Samples), Biometrika; Oxford University Press: Oxford, UK, 1965; Volume 52, pp. 591–611. [Google Scholar]
- Razali, N.M.; Wah, Y.B. Power comparisons of Shapiro-Wilk, Kolmogorov-Smirnov, Lillefors and Anderson Darling tests. J. Stat. Model. Anal. 2011, 2, 21–33. [Google Scholar]
- Cramer, D. Fundamental Statistics for Social Research Step-by-Step Calculations and Computer Techniques Using SPSS for Windows; Psychology Press: Hove, UK, 1998. [Google Scholar]
- Cramer, D.; Howitt, D.L. The Sage Dictionary of Statistics: A Practical Resource for Students in the Social Sciences; SAGE: London, UK, 2004. [Google Scholar]
- Doane, D.P.; Seward, L.E. Applied Statistics in Business and Economics, 3rd ed.; McGraw-HillIrwin: New York City, NY, USA, 2011; pp. 154–156. [Google Scholar]
- Cronbach, L.J. Coefficient alpha and the internal structure of tests. Psychometrika 1951, 16, 297–334. [Google Scholar] [CrossRef]
- George, D.; Mallery, P. SPSS for Windows Step by Step: A Simple Guide and Reference, 11.0 Update, 4th ed.; Allyn & Bacon: Boston, MA, USA, 2003. [Google Scholar]


| Rating | Social Qualities | Physical Qualities |
|---|---|---|
| Positive | Social integration Freedom from threats Cohesive community Secure tenure Community self help | Green areas Basic facilities Activity settings Freedom from physical dangers Freedom to move Peer gathering places |
| Negative | Political powerlessness Insecure tenure Social stigma and exclusion Boredom Racial tensions | Lack of gathering spaces Heavy traffic Trash/litter Lack of activities and services |
| Characteristics of Urban Neighborhood | Qualities They Nurture |
|---|---|
|
|
|
|
|
|
|
|
| Independent Variables | Question Form |
|---|---|
| X1 | Do the buildings have pleasing appearance? |
| X2 | Are the buildings to child scale? |
| X3 | Is the neighborhood too overcrowded? |
| X4 | Are there cycle tracks along roads? |
| X5 | Do roads have walking paths? |
| X6 | On street parking does not obstructs walking? |
| X7 | Are daily needs shops within walkable distance? |
| X8 | Can children walk down to school/bus stops navigating individually? |
| X9 | Are parks well maintained and equipped? |
| X10 | Do parks have variety of play opportunities? |
| X11 | Are there places for games and sports? |
| X12 | Do parks have anti social activities? |
| X13 | Do parks have all weather play provisions? |
| X14 | Is there dispensary, police booth, anganwadi nearby? |
| X15 | What is the frequency of festivities & celebrations? |
| X16 | How much recreation time do children get? |
| X17 | Are there good meeting/personal spaces for children in neighborhood? |
| X18 | Is there proper signage in the neighborhood? |
| X19 | Can the children move with identity in the neighborhood? |
| X20 | Is there flexibility in the use of spaces in the neighborhood? |
| X21 | Is there a hierarchy of play spaces for children of all age groups? |
| X22 | Are there too many abandoned or dead areas in the neighborhood? |
| X23 | Is the neighborhood clean and maintained? |
| X24 | Does the neighborhood feel safe? |
| X25 | Is the neighborhood full of activity? |
| X26 | Do children interact with all age groups of people? |
| X27 | Are children free to express and play in neighborhood? |
| X28 | Do you feel watched and controlled by others? |
| X29 | Is this the most ideal neighborhood for you? |
| Dependent Variables | Question Form |
| Y1 | What is your overall satisfaction with your neighborhood? |
| Descriptive Statistics | Statistic | Std. Error | ||
|---|---|---|---|---|
| X1 | Mean | 3.9484 | 0.0388 | |
| 95% Confidence Interval for Mean | Lower Bound | 3.8719 | ||
| Upper Bound | 4.0248 | |||
| 5% Trimmed Mean | 3.9426 | |||
| Median | 4.0000 | |||
| Variance | 0.5560 | |||
| Std. Deviation | 0.7456 | |||
| Minimum | 3.0000 | |||
| Maximum | 5.0000 | |||
| Range | 2.0000 | |||
| Interquartile Range | 2.0000 | |||
| Skewness | 0.0840 | 0.1270 | ||
| Kurtosis | −1.1930 | 0.2540 | ||
| X2 | Mean | 2.3478 | 0.0307 | |
| 95% Confidence Interval for Mean | Lower Bound | 2.2874 | ||
| Upper Bound | 2.4082 | |||
| 5% Trimmed Mean | 2.3865 | |||
| Median | 2.0000 | |||
| Variance | 0.3470 | |||
| Std. Deviation | 0.5893 | |||
| Minimum | 1.0000 | |||
| Maximum | 3.0000 | |||
| Range | 2.0000 | |||
| Interquartile Range | 1.0000 | |||
| Skewness | −0.2740 | 0.1270 | ||
| Kurtosis | −0.6690 | 0.2540 | ||
| Total | Mean | 3.8614 | 0.0346 | |
| 95% Confidence Interval for Mean | Lower Bound | 3.7933 | ||
| Upper Bound | 3.9295 | |||
| Cronbach’s Alpha | Cronbach’s Alpha Based on Standardized Items | N of Items |
|---|---|---|
| 0.832 | 0.837 | 30 |
| Cronbach’s Alpha | Part 1 | Value | 0.790 |
| N of Items | 15 a | ||
| Part 2 | Value | 0.697 | |
| N of Items | 15 b | ||
| Total N of Items | 30 | ||
| Correlation Between Forms | 0.541 | ||
| Spearman-Brown Coefficient | Equal Length | 0.702 | |
| Unequal Length | 0.702 | ||
| Guttman Split-Half Coefficient | 0.698 | ||
| KMO and Bartlett’s Test | ||
|---|---|---|
| Kaiser-Meyer-Olkin Measure of Sampling Adequacy | 0.851 | |
| Bartlett’s Test of Sphericity | Approx. Chi-Square | 5458.758 |
| df | 435 | |
| Sig. | 0.000 | |
| Component | Initial Eigenvalues | Extraction Sums of Squared Loadings | ||||
|---|---|---|---|---|---|---|
| Total | % of Variance | Cumulative % | Total | % of Variance | Cumulative % | |
| 1 | 7.561 | 25.202 | 25.202 | 7.561 | 25.202 | 25.202 |
| 2 | 3.103 | 10.344 | 35.546 | 3.103 | 10.344 | 35.546 |
| 3 | 2.589 | 8.628 | 44.175 | 2.589 | 8.628 | 44.175 |
| 4 | 1.801 | 6.003 | 50.177 | 1.801 | 6.003 | 50.177 |
| 5 | 1.569 | 5.231 | 55.409 | 1.569 | 5.231 | 55.409 |
| 6 | 1.214 | 4.047 | 59.456 | 1.214 | 4.047 | 59.456 |
| 7 | 1.099 | 3.665 | 63.120 | 1.099 | 3.665 | 63.120 |
| 8 | 0.997 | 3.323 | 66.443 | |||
| 9 | 0.886 | 2.953 | 69.396 | |||
| 10 | 0.798 | 2.660 | 72.056 | |||
| 11 | 0.786 | 2.619 | 74.675 | |||
| 12 | 0.718 | 2.392 | 77.067 | |||
| 13 | 0.714 | 2.381 | 79.448 | |||
| 14 | 0.649 | 2.165 | 81.613 | |||
| 15 | 0.602 | 2.006 | 83.619 | |||
| 16 | 0.580 | 1.935 | 85.554 | |||
| 17 | 0.521 | 1.737 | 87.291 | |||
| 18 | 0.491 | 1.636 | 88.927 | |||
| 19 | 0.445 | 1.483 | 90.410 | |||
| 20 | 0.426 | 1.420 | 91.830 | |||
| 21 | 0.384 | 1.279 | 93.109 | |||
| 22 | 0.364 | 1.212 | 94.321 | |||
| 23 | 0.321 | 1.071 | 95.392 | |||
| 24 | 0.306 | 1.019 | 96.411 | |||
| 25 | 0.255 | 0.849 | 97.259 | |||
| 26 | 0.230 | 0.766 | 98.026 | |||
| 27 | 0.210 | 0.700 | 98.726 | |||
| 28 | 0.181 | 0.602 | 99.327 | |||
| 29 | 0.106 | 0.353 | 99.681 | |||
| 30 | 0.096 | 0.319 | 100.000 | |||
| Y1 | Y1 | Y1 | |||
|---|---|---|---|---|---|
| X1 | 0.66 | X11 | 0.59 | X21 | 0.17 |
| X2 | 0.33 | X12 | 0.58 | X22 | 0.14 |
| X3 | 0.33 | X13 | 0.52 | X23 | 0.12 |
| X4 | 0.20 | X14 | −0.02 | X24 | 0.43 |
| X5 | 0.00 | X15 | 0.23 | X25 | 0.46 |
| X6 | 0.11 | X16 | 0.43 | X26 | 0.42 |
| X7 | 0.58 | X17 | 0.27 | X27 | 0.44 |
| X8 | 0.58 | X18 | 0.15 | X28 | 0.31 |
| X9 | 0.52 | X19 | 0.10 | X29 | 0.38 |
| X10 | 0.59 | X20 | 0.19 |
| Model | R | R Square | Adjusted R Square | Std. Error of the Estimate | Change Statistics | ||||
|---|---|---|---|---|---|---|---|---|---|
| R Square Change | F Change | df1 | df2 | Sig. F Change | |||||
| 1 | 0.862 a | 0.742 | 0.720 | 0.31558 | 0.742 | 33.581 | 29 | 338 | 0.000 |
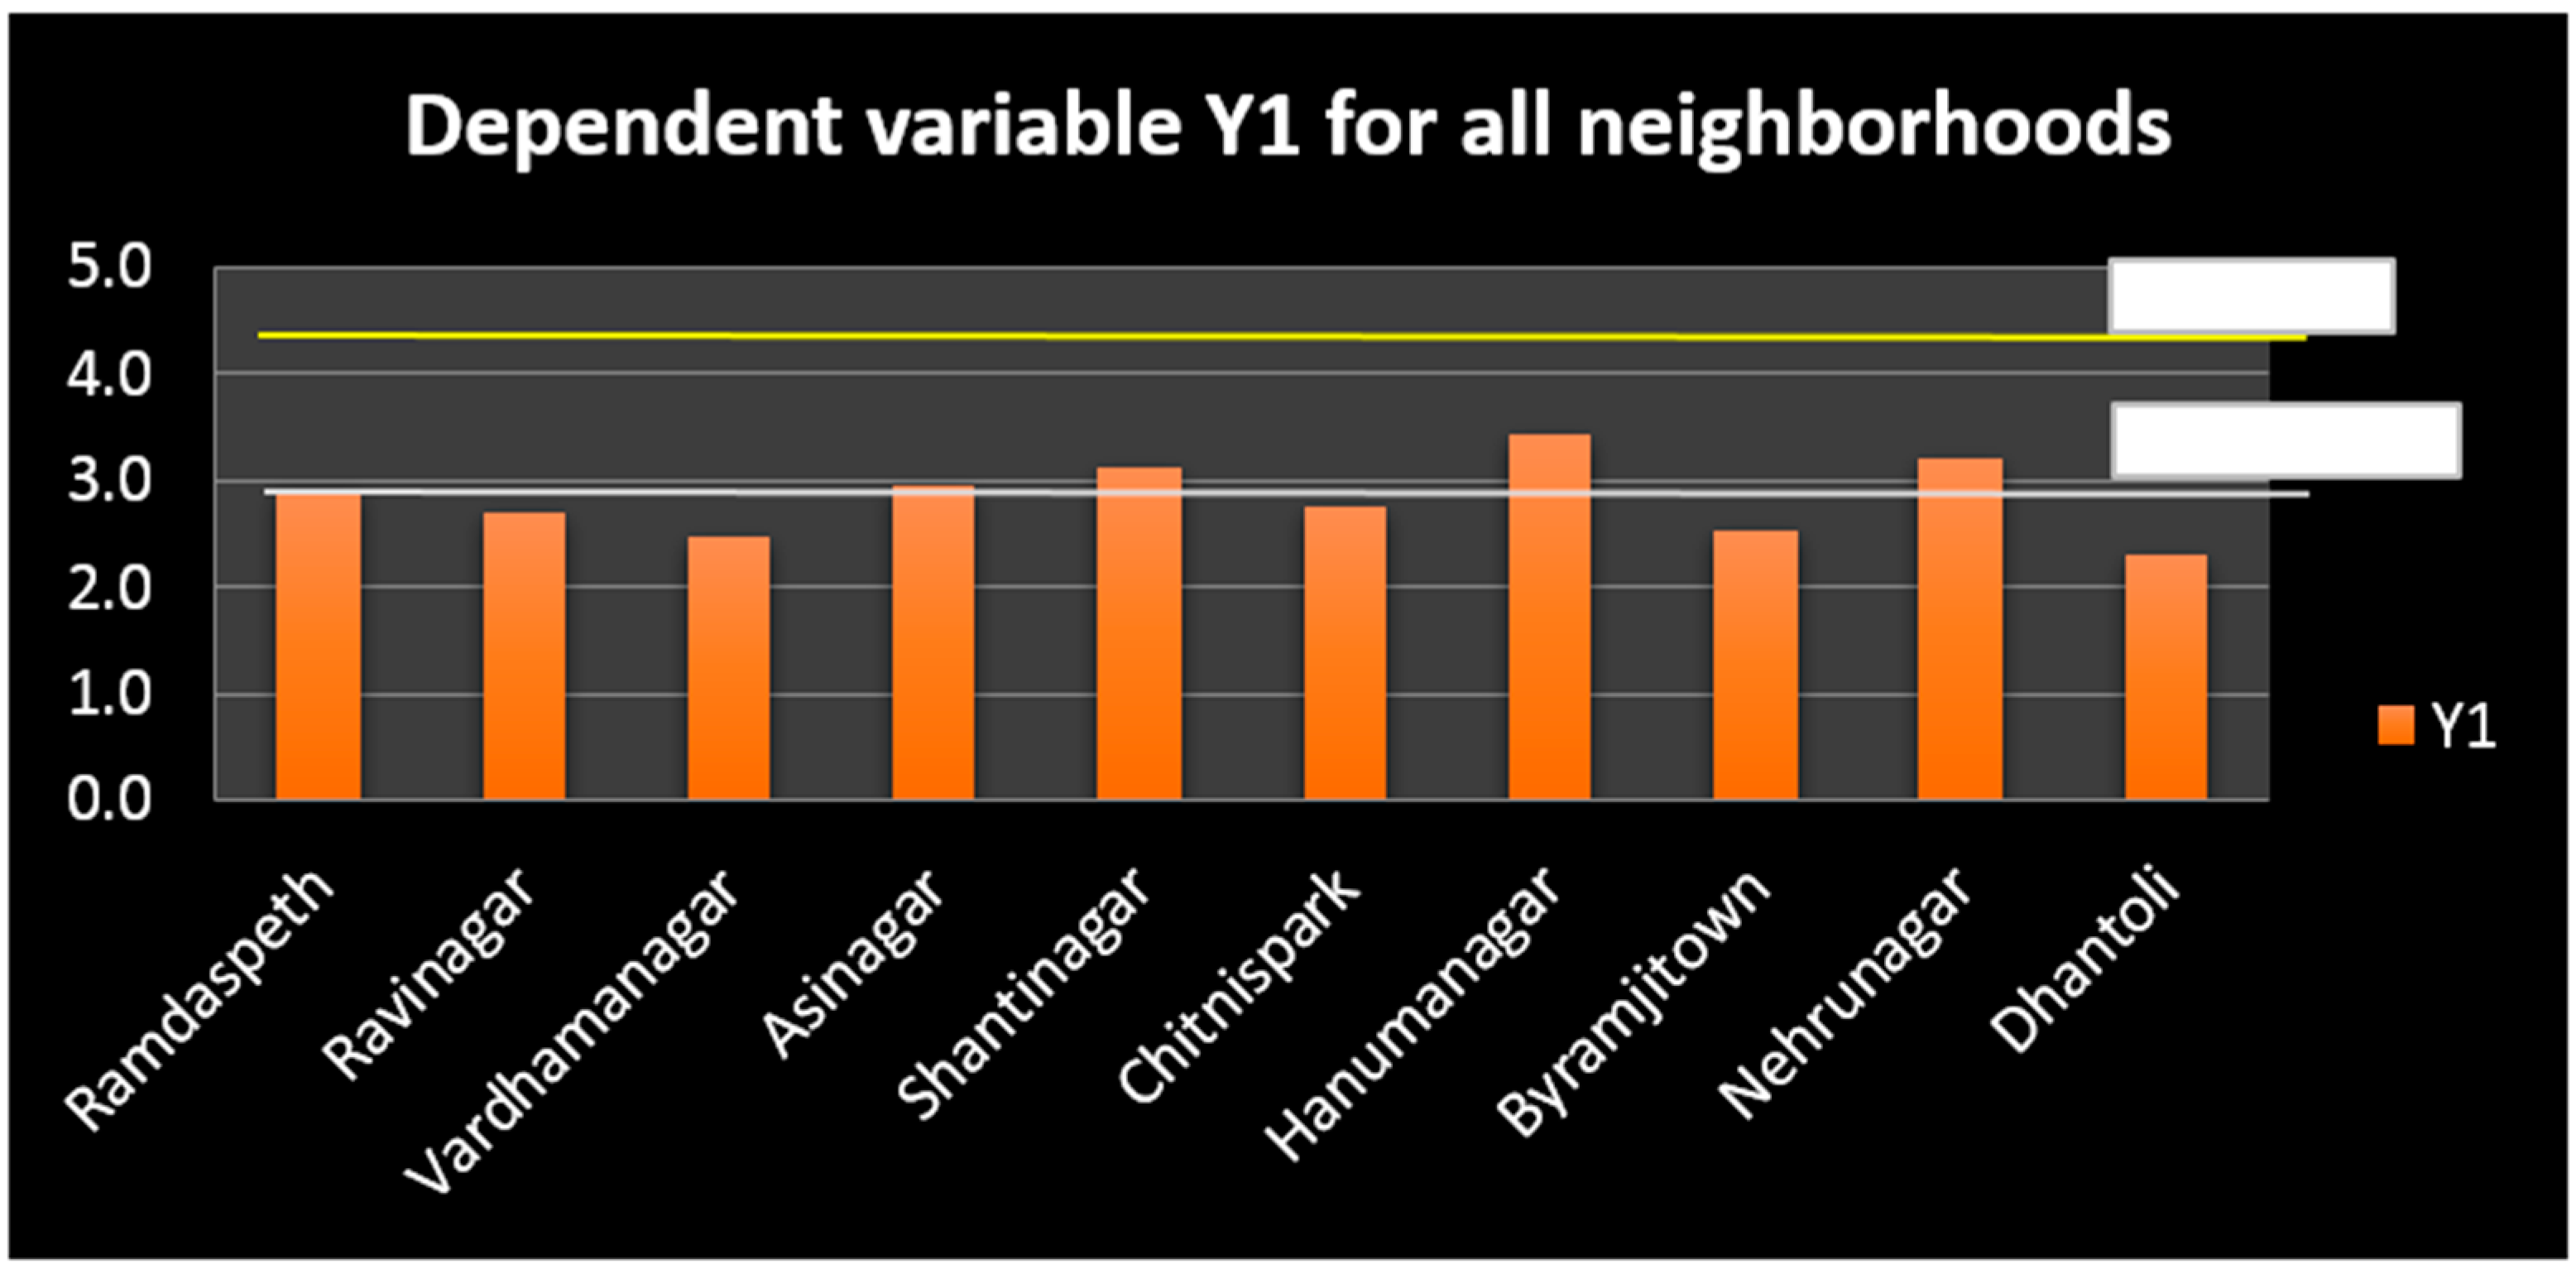
| Neighborhood | Y1 from Model | Y1 from Respondent |
|---|---|---|
| Nehrunagar | 3.416 | 3.2 |
| Dhantoli | 2.217 | 2.3 |
© 2016 by the authors; licensee MDPI, Basel, Switzerland. This article is an open access article distributed under the terms and conditions of the Creative Commons Attribution (CC-BY) license (http://creativecommons.org/licenses/by/4.0/).
Share and Cite
Bhonsle, K.D.; Adane, V.S. Assessing the Play Provisions for Children in Urban Neighborhoods of India: Case Study Nagpur, Maharashtra. Buildings 2016, 6, 31. https://doi.org/10.3390/buildings6030031
Bhonsle KD, Adane VS. Assessing the Play Provisions for Children in Urban Neighborhoods of India: Case Study Nagpur, Maharashtra. Buildings. 2016; 6(3):31. https://doi.org/10.3390/buildings6030031
Chicago/Turabian StyleBhonsle, Kirti D., and Vinayak S. Adane. 2016. "Assessing the Play Provisions for Children in Urban Neighborhoods of India: Case Study Nagpur, Maharashtra" Buildings 6, no. 3: 31. https://doi.org/10.3390/buildings6030031
APA StyleBhonsle, K. D., & Adane, V. S. (2016). Assessing the Play Provisions for Children in Urban Neighborhoods of India: Case Study Nagpur, Maharashtra. Buildings, 6(3), 31. https://doi.org/10.3390/buildings6030031