Skip to Content
BuildingsBuildings
  • Article
  • Open Access

22 April 2026

Pedestrian Physiological Response Map Prediction Model for Street Audiovisual Environments Using LSTM Networks


,
,
,
,
and
1
School of Architecture & Urban Planning, Huazhong University of Science and Technology, Wuhan 430074, China
2
Hubei Engineering and Technology Research Center of Urbanization, Wuhan 430074, China
3
School of Computer Science & Technology, Huazhong University of Science and Technology, Wuhan 430074, China
4
College of Life Science and Technology, Huazhong University of Science and Technology, Wuhan 430074, China

Abstract

Existing studies of street-related emotional perception mainly rely on static scene evaluations, which cannot capture the cumulative effects of environmental exposure during continuous walking. To address this limitation, this study proposes a method for predicting pedestrian physiological responses in sequential audiovisual street environments. Four real-world walking routes were selected, with outbound and return directions treated as independent paths, yielding eight paths and 32 valid samples. EEG, ECG, sound pressure level, first-person video, and GPS data were synchronously collected to construct a 1 s multimodal time-series dataset. Pearson correlation, Kendall correlation, and mutual information analyses were used to examine linear, monotonic, and nonlinear relationships between environmental variables and physiological indicators, and the resulting weights were incorporated into a Long Short-Term Memory (LSTM) model for multi-step prediction. Visual elements and noise exposure were the main factors influencing physiological responses. Among the models, the mutual-information-weighted LSTM performed best, achieving an R2 of 0.77 for heart rate variability (RMSSD), whereas prediction of the EEG ratio (β/α and θ/β) remained limited. An additional independent street sample outside the training set was then used to generate a dual-dimensional EEG-ECG physiological response map, demonstrating the model’s potential for identifying emotional risk segments and supporting street-level micro-renewal.

1. Introduction

1.1. Research Background and Significance of the Study

Urban streets, among the most frequented public spaces in daily travel, directly influence pedestrians’ emotional experiences, travel choices, and dwelling behaviors through their audiovisual environmental quality. These factors further impact urban vitality, public health, and street renewal strategies. Unlike static scene evaluations, walking experiences have strong path continuity and contextual transitions. Individual emotions are not instant responses to a single spatial scene but are integrated reactions to ongoing environmental stimuli, showing both lagged and cumulative effects.
In light of this, the present study extends existing research toward a “sequential exposure–cumulative effect” framework, aiming to construct a “street physiological response prediction map” to uncover patterns of physiological response perception among pedestrians within authentic street audiovisual sequences. Ultimately, this study develops a predictive model oriented toward dynamic street experiences. By forecasting physiological responses under different design scenarios, the model provides an operational quantitative basis for the coordinated optimization of audiovisual elements and the prioritization of street renewal interventions.

1.2. Review of Existing Research

1.2.1. Street-Level Perception and Urban Emotion Studies

A growing body of research has examined how urban and street environments influence human physiological and emotional responses [1,2]. Related evidence has also been reported in architectural and street-environment contexts [3,4]. The use of physiological signals has improved the objectivity and temporal sensitivity of emotion-related assessment [5,6], and EEG-based approaches have been widely applied in emotion recognition and affective-state analysis [7,8]. Additional studies have further demonstrated the value of EEG for tracking dynamic emotional processes [9,10], while more recent work has emphasized the role of neural measures in emotion regulation and naturalistic affective research [11,12]. In parallel, HRV-based indicators have been used to characterize autonomic aspects of emotional regulation and stress response [13,14], and have also been linked to perceived emotion, stress, and cognitive functioning [15,16]. Building on these methodological developments, several studies have investigated how environmental scenes and street attributes affect emotional and physiological responses [2,3]. Other work has explored these relationships in broader urban contexts using wearable or field-based measurements [1,17]. Recent studies have also examined healing-oriented or anxiety-related responses to streetscapes through physiological evidence [4,18]. At the same time, review studies have summarized the broader application of physiological and neuroarchitectural approaches in environmental and architectural research [19,20], including the growing role of VR- and EEG-based methods in architectural perception studies [21,22].
A representative example is the study by Zhang et al., which examined emotional responses to street visual patterns using physiological measures and subjective evaluations [3]. Like many studies in street-level perception and urban emotion research, however, its design was based on photographs or image-like representations of individual street scenes. In this line of work, emotional responses are typically linked to specific images, locations, or place semantics, so urban environments are treated as discrete perceptual units. While such studies have generated important insights into how visual attributes shape perception and affect, they are less capable of capturing the continuous, sequential, and path-dependent nature of real pedestrian experience. This limitation highlights the need for approaches that examine emotional responses as they unfold along movement through changing street environments, rather than only at isolated points.

1.2.2. Multisensory and Audiovisual Environmental Cognition

In addition to visual perception, an increasing number of studies have emphasized that emotional responses to urban environments are shaped by multiple sensory inputs, particularly the combined influence of visual and auditory stimuli [2,17,19,20]. Barros et al. examined psychophysiological stress responses under different urban traffic conditions by relating environmental indicators, such as noise exposure and greenery, to physiological measurements [17]. Their findings suggest that both auditory and visual factors are relevant to stress responses. However, like many studies in multisensory environmental research, this approach mainly treats visual and auditory variables as separate predictors within the same model, focusing on their individual associations with psychophysiological outcomes. Such a framework is useful for identifying whether each modality matters, but it is less capable of revealing how visual and auditory information interact, couple, or jointly shape emotional responses as an integrated perceptual process. As a result, existing research still provides limited insight into audiovisual environmental cognition as a coordinated mechanism rather than a set of parallel effects.

1.2.3. Temporal Modeling Approach

With the advancement of machine learning, temporal modeling techniques have increasingly been used to capture the dynamic nature of physiological and emotional responses in environmental and affective-computing research [23,24]. Deep-learning studies have further advanced EEG-based emotion recognition and physiological pattern analysis [24,25]. Within this broader field, LSTM-based models have been widely applied to EEG-based emotion recognition and temporal sequence learning [26,27]. For example, Huang et al. proposed a CNN-BiLSTM framework to extract spatial features from EEG signals and model their temporal dependencies for emotion recognition [26], while Du et al. similarly demonstrated that LSTM-based models are effective at identifying temporal dependencies and dynamic characteristics in emotional data [27]. Related studies have also demonstrated the value of attention-enhanced or alternative LSTM frameworks for EEG classification [26,28]. Beyond EEG-only settings, multimodal affective modeling has also benefited from sequential deep-learning architectures [29]. Additional evidence from wearable biosignal studies and multi-channel EEG frameworks further supports the potential of sequential models for emotion prediction [30]. However, while these studies effectively model temporal dependencies in physiological or emotional signals, the temporal dimension primarily reflects controlled experimental inputs or stimulus-evoked dynamics, rather than continuous affective responses shaped by real-world environmental exposure.

1.3. The Present Work

Taken together, existing studies remain limited in that street-level perception is typically represented as static and scene-based, multisensory inputs are insufficiently integrated, and temporal modeling approaches are rarely embedded in real-world environmental contexts.
To address these limitations, this study aims to:
  • Construct an LSTM-based predictive model linking dynamic audiovisual environmental features with EEG/HRV physiological responses and emotional states, based on a dataset incorporating audiovisual factors and exposure duration, thereby enabling the generation of physiological response maps.
  • Further analyze the contributions and cumulative effects of the duration, timing of changes, and magnitude of variation of audiovisual factors on emotional responses, providing actionable quantitative guidance for street micro-renewal and the coordinated optimization of environmental elements.

2. Materials and Methods

2.1. Data Collection

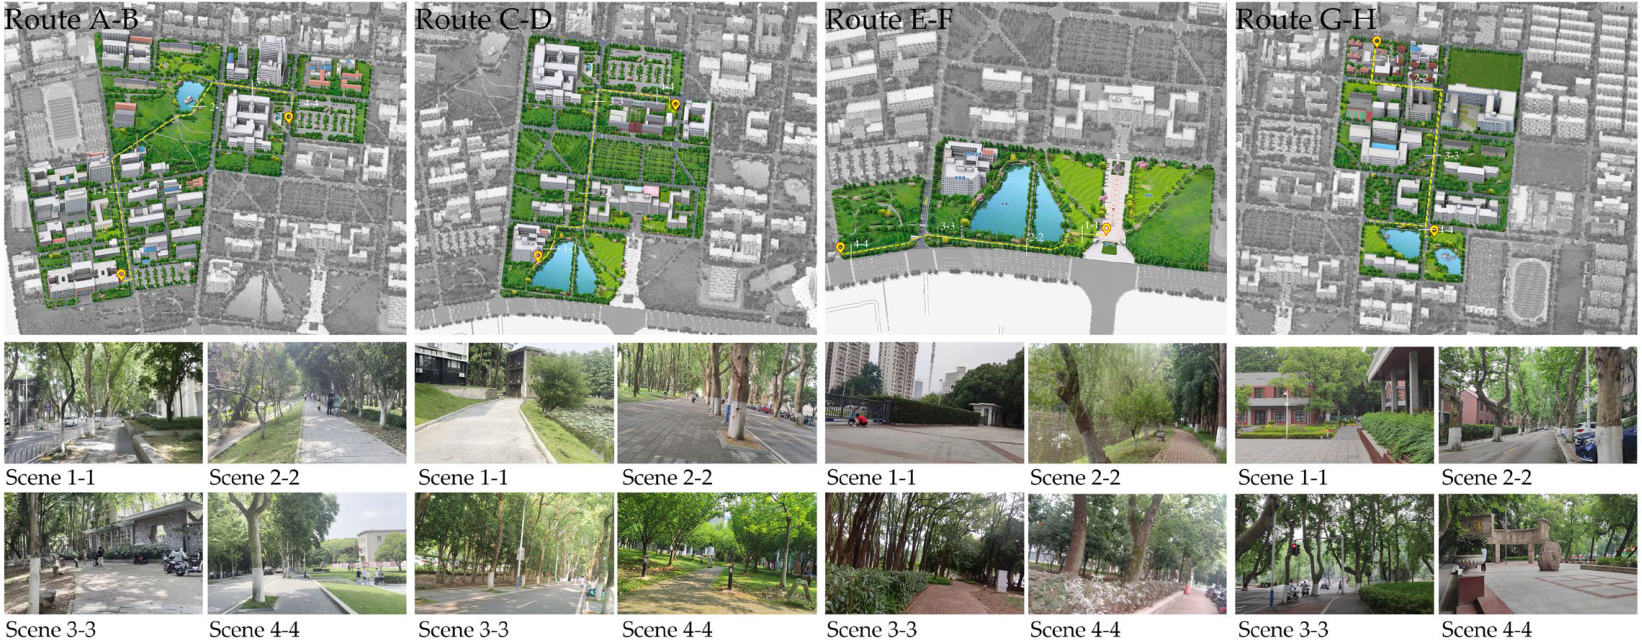
For route design, this study referred to previously published empirical research in the field. Sun et al. employed five predefined walking routes in an urban park soundwalk study, whereas Jeon and Hong organized their investigation around three representative spatial settings to compare perceptual responses across different urban park environments [31,32]. Based on these methodological precedents, the present study selected four representative walking routes, each approximately 10 min long, in order to achieve a balance between environmental diversity and experimental feasibility within a comparable urban context.
As shown in Figure 1, the four routes exhibit distinct spatial sequences within a comparable urban setting. Each route includes both relatively natural and more urbanized street spaces, with approximately four typical scene types, such as tree-lined pedestrian segments, open green-edge sections, building-enclosed street spaces, and corner or intersection transition nodes. This design provides sufficient variation in environmental exposure while preserving contextual comparability.
Figure 1. The four experimental routes, as well as real-scene images of the key nodes along the routes.
In addition, outbound and return directions along the same route were treated as independent perceptual paths, because the order, timing, and accumulation of audiovisual exposure differed between the two directions. As a result, the four physical routes were expanded into eight experimental path conditions.
Regarding participant allocation, the study followed established soundwalk practice and relevant methodological guidance. According to ISO 12913-2:2018, soundwalk-based evaluations are recommended to be conducted in small groups of up to five participants per session in order to maintain perceptual independence and reduce interpersonal influence [33]. In addition, prior psychophysiological studies have shown that a total sample size of around 40 participants can be sufficient to detect meaningful physiological and affective differences under varying environmental conditions [34]. Based on this rationale, each directional path (AB or BA) was assigned five different participants. Therefore, the study ultimately comprised eight path conditions and 40 participants in total, of which 32 valid multimodal datasets were retained after data screening and quality control to exclude recordings with incomplete or poor-quality physiological or environmental data. All participants were students aged 18–26, including 18 males and 22 females, and were relatively familiar with the experimental routes.
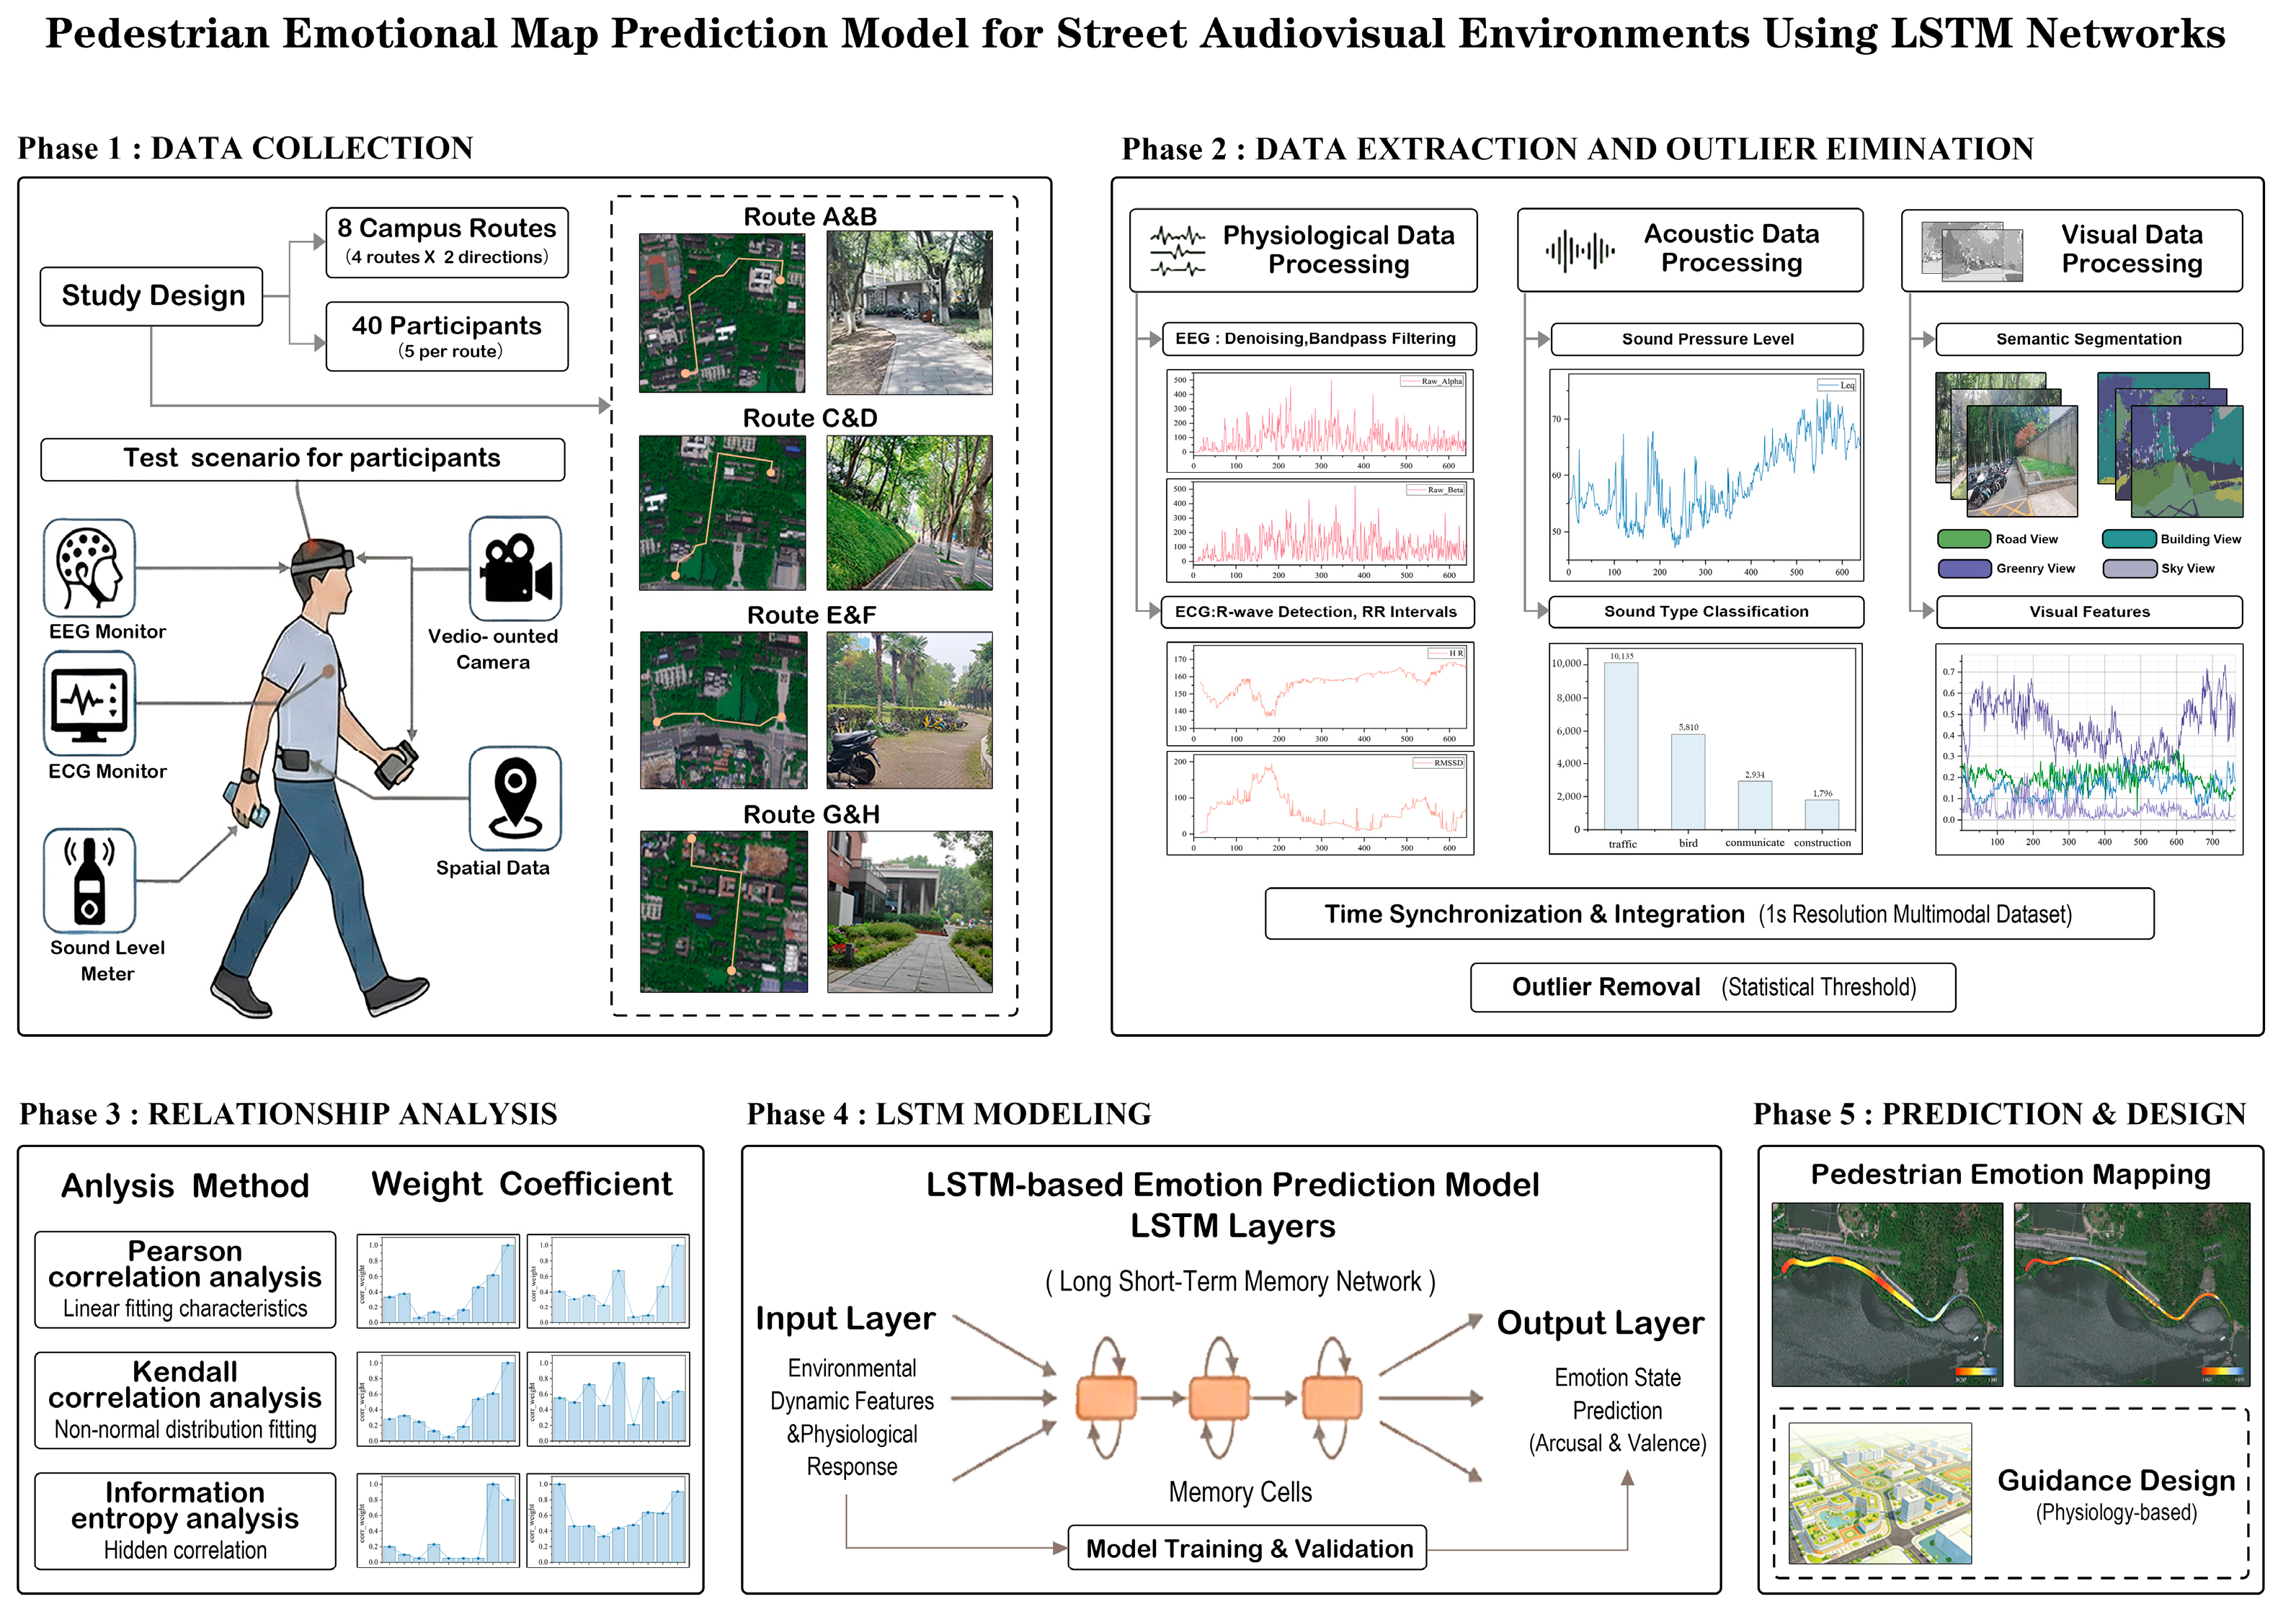
Field experiments were conducted in a real street environment, where both environmental data and participants’ physiological responses were recorded under natural walking conditions. A BIOPAC multi-channel physiological acquisition system was employed to collect real-time physiological signals. Participants carried sound level meters to record perceived environmental sound pressure levels, thereby quantifying the acoustic characteristics of the street environment. Wearable video devices captured visual information from a first-person perspective during walking. In addition, GPS (Garmin International Inc., Olathe, KS, USA) devices were employed to record spatial location data, enabling spatiotemporal alignment of multimodal data in subsequent analyses (Figure 2).
Figure 2. Overall framework of multimodal data acquisition and LSTM-based physiological prediction.

2.2. Data Processing and Outlier Removal

2.2.1. EEG Preprocessing and Feature Extraction

For physiological data processing, EEG signals were first imported into AcqKnowledge software (version 5.0; BIOPAC Systems Inc., Goleta, CA, USA), from which relevant EEG indicators were extracted. For single-channel EEG signals sampled at 2000 Hz, a standardized preprocessing framework incorporating physiological constraint-based reconstruction was developed. To eliminate environmental noise and baseline drift, a multi-stage filtering procedure was applied. The filtering process was implemented using Python (version 3.10, Python Software Foundation, Wilmington, DE, USA) with custom signal processing scripts. A 50 Hz notch filter (IIR Notch Filter, Q = 30) was used to remove power line interference [35,36]. Subsequently, a fourth-order Butterworth band-pass filter with a passband of 0.5–45.0 Hz was applied. This configuration preserves slow-wave components while effectively suppressing ultra-low-frequency baseline drift caused by electrodermal activity or perspiration, as well as high-frequency electromyographic noise and power harmonics, thereby ensuring that the signal is focused on the primary frequency bands of neural oscillations [37,38].
To address temporal discontinuities caused by artifact removal, a physiological-threshold-based Piecewise Cubic Hermite Interpolating Polynomial (PCHIP) reconstruction strategy was proposed [39]. A dual-threshold detection scheme was implemented: an amplitude threshold of ±150 µV to identify large-amplitude electrooculographic or motion artifacts, and a gradient threshold of 20 µV/sample to detect non-physiological abrupt changes due to poor electrode contact. Detected artifact segments were expanded by 100 ms using morphological dilation to cover edge effects, after which the removed segments were reconstructed using PCHIP interpolation. This approach preserves signal monotonicity and continuity while avoiding overshoot and oscillatory artifacts introduced by conventional interpolation. Subsequently, frequency-domain features were extracted from the reconstructed clean signals using Welch’s power spectral density (PSD) estimation method [40]. The analysis window was set to 2.0 s with a sliding step of 1.0 s (i.e., 50 per cent overlap), allowing for the capture of second-level temporal dynamics while maintaining adequate frequency resolution. The area under the PSD curve was computed using Simpson’s integration method to obtain the power of the α (8–13 Hz) and β (13–30 Hz) frequency bands. Finally, a digital fingerprint-matching algorithm was employed to automatically align EEG recordings with behavioral logs, precisely anchoring the time axis to actual time. The first 2.0 s of aligned features were zero-padded to eliminate transient oscillations introduced by the IIR filter’s initial stage.

2.2.2. ECG Processing with Artifact-Resistant Filtering and Robust Analysis

The ECG signals collected in this study were also sampled at 2000 Hz. To address motion artifacts and electromyographic interference commonly encountered in outdoor mobile scenarios, a standardized processing pipeline was developed comprising artifact-resistant filtering, robust R-peak detection, and real-time sliding-window feature extraction. First, to remove environmental noise while preserving the morphological characteristics of the QRS complex, a dual-stage filtering approach was applied. A 50 Hz notch filter was used to eliminate power line interference, followed by a fourth-order Butterworth band-pass filter with a passband of 0.5–35.0 Hz. The lower cutoff (0.5 Hz) suppresses baseline drift caused by respiratory motion, while the upper cutoff (35.0 Hz) removes high-frequency EMG noise, ensuring accurate R-peak detection.
To overcome the issue of inflated detection thresholds caused by large artifacts in the conventional Pan–Tompkins algorithm, an improved detection strategy was adopted. The filtered signal was first differentiated and squared to enhance QRS energy. A robust dynamic thresholding approach was then implemented, using the 99.5th percentile of the integrated signal as a reference and setting the detection threshold to 40 per cent of this value. This effectively suppresses extreme voltage spikes caused by electrode collisions [41,42,43]. Additionally, a minimum R–R interval of 300 ms was enforced, and a local maximum back-search procedure was applied to correct for phase delays introduced during integration.
To capture second-level emotional fluctuations, a cumulative sliding-window strategy was designed for time-domain feature extraction. A standard window length of 60 s (in accordance with short-term HRV analysis standards) and a step size of 1 s were used [44,45,46]. For the initial stage (t < 60 s), a cumulative window was used to ensure indicators could be generated from the start of the experiment. Prior to calculation, R–R intervals outside the range from 300 ms to 1500 ms were removed. A quotient filter was further applied to exclude intervals with successive changes exceeding 30 per cent, thereby eliminating errors caused by ectopic beats or missed detections. Finally, based on absolute experimental timestamps, the resulting HRV sequences were temporally aligned with EEG and behavioral data, forming a multimodal physiological feature matrix.

2.2.3. Audiovisual Feature Extraction and Multisource Data Integration

For acoustic data processing, the SvanPC++ software (Svantek Sp. z o.o., Warsaw, Poland) was used to read and export continuous sound-pressure-level records. Dominant sound types corresponding to each second were identified through frame-by-frame analysis of first-person video recordings. The sound types were extracted by trained researchers following a standardized annotation protocol. This procedure ensured consistency in the identification of acoustic categories and reduced potential variability arising from individual differences in sound sensitivity. For visual feature extraction, first-person videos were segmented at 1 s intervals, and semantic segmentation techniques were applied to quantify the visibility of greenery, sky, roads, and buildings (Figure 2). We exported one image per second from the first-person walking video (i.e., video screenshots aligned to each 1 s interval). These images were processed offline with the GPU-CUDA-enabled semantic segmentation application (v1.0) released by the UrbanComp project (Human–Machine Intelligent Computing Laboratory, China University of Geosciences), which implements a fully convolutional network (FCN) trained on the ADE20K scene-parsing dataset. According to the provider’s report for the distributed weights, pixel-wise classification accuracy on ADE20K is 0.814 on the training split and 0.668 on the test split; we cite these figures to document the performance of the pre-trained model applied to our street-view frames. For each screenshot, the tool yields segmentation masks (16-bit PNG outputs) and/or a CSV summary of class proportions; we then computed four visibility metrics—greenery, sky, road, and building—by aggregating pixels mapped to the corresponding semantic classes in the ADE20K taxonomy (class IDs in ADE20K_Class.txt bundled with the software). The resulting four time series were aligned with audio, physiology, and GPS at 1 s [47].
To ensure temporal consistency within the multimodal dataset, all devices used in the experiment recorded absolute timestamps during data acquisition. During preprocessing, these timestamps were aligned across devices to establish a unified temporal reference. On this basis, GPS, first-person video, acoustic data, and physiological signals were synchronized at a 1 s resolution, resulting in an integrated multimodal dataset.

2.3. Model Development

2.3.1. Correlation Analysis Between Environmental Factors and Physiological Indicators

To comprehensively capture potential linear, monotonic, and nonlinear relationships among variables, this study constructed an integrated analytical framework combining Pearson correlation, Kendall’s Tau-b, and mutual information (MI) based on information entropy analysis [48,49,50]. This framework enables the examination of the coupling relationships between independent and dependent variables from multiple perspectives and facilitates the identification of their intrinsic associations and contributions to emotional fluctuations (Figure 2). The dependent variables included the EEG β/α ratio and θ/β ratio, reflecting central nervous system activation, and the HRV metric RMSSD, representing autonomic nervous system regulation. Independent variables describing the walking environment included greenery visibility, road visibility, building visibility, sky visibility, and sound pressure level.
These three analytical methods complement each other, providing a comprehensive characterization of pedestrian perception data. This multidimensional validation approach not only enables the accurate identification of key environmental factors influencing physiological responses but also provides a scientific basis for weight allocation in the subsequent LSTM model.

2.3.2. LSTM-Based Emotion Prediction Model Architecture

Building upon the results of the multidimensional correlation analysis, a correlation-guided input reweighting mechanism was introduced. The correlation strengths derived from each analytical method were transformed into feature weights, giving audiovisual factors more strongly associated with physiological responses greater importance during temporal modeling, thereby improving the model’s predictive performance (Figure 2).
Temporal Sequence Construction and Recurrent Modeling
Temporal samples were constructed using a fixed-length sliding window on the 1 Hz-synchronized multimodal data. Each row corresponds to one second of jointly aligned audiovisual and physiological variables; inputs are not assembled by CNN-style aggregation of raw video frames. For each walking route, sliding windows of length T (default T = 128, i.e., 128 s at 1 Hz) were paired with a subsequent target segment of length H (prediction horizon H = pre_len; default H = 1 for one-step-ahead regression). Along a single path, windows start at indices i = 0, H, 2H, … (stride equals H); when H = 1, windows are shifted every second (dense overlap), whereas larger H yields sparser strides. The training, validation, and test sets were partitioned by entire routes rather than by random shuffling within trajectories.
Sequence modeling is performed with stacked LSTM layers (recurrent neural network), not by temporal pooling of video frames. At each time step t = 1, …, T, the (optionally correlation-weighted) feature vector is linearly projected and fed through the LSTM cell; the hidden state evolves over the window to encode temporal dependencies. The model predicts the next H steps of the target physiological variable (multivariate prediction setting: predict the target channel).
To align training with inference, when a window starts at path index i < T, the target column in the input window is masked to zero for the first max(0, T − i) time steps within that window, preventing early segments from leaking future target information into the input.
Computational Learning Formulation
We now specify the supervised learning formulation (notation, loss, and evaluation metrics), aligned with the temporal sample construction described in Section Temporal Sequence Construction and Recurrent Modeling. Let xt ∈ ℝF denote the F-dimensional feature vector at time t after alignment to 1 Hz, and let yt denote the scalar target physiology (e.g., EEG β/α ratio or θ/β ratio or RMSSD) when a single target channel is predicted. The objective is to map a length-T input window to an H-step horizon.
We propose an LSTM-based framework that integrates data normalization, correlation-guided feature scaling, temporal sequence modeling, and supervised training, with standardized evaluation metrics.
  • Normalization. For each feature j, training-set statistics (mean μj, standard deviation σj > 0) are computed; inputs are standardized as x ~ t , j = (xt,j − μj)/σj, and the target is scaled consistently before metrics are computed in the original scale where applicable.
  • Correlation-guided input scaling. Let w = (w1, …, wF)T be nonnegative weights derived from Pearson, Kendall, or mutual-information analysis with the target, normalized to a stable scale. The gated input is x ^ t = w ⊙ x ~ t (Hadamard product), applied before the linear projection.
  • Recurrent mapping and readout. A linear layer maps x ^ t to zt = ReLU(Win  x ^ t + bin). Stacked LSTM layers update hidden states ht and cell states ct via (ht, ct) = LSTM(zt, ht−1, ct−1). A ReLU-activated linear readout maps the trajectory of hidden states to the next H time steps (batch-first LSTM, dropout on inputs, and linear output layer).
  • Training objective. With predictions y ^ and targets y, the empirical Huber risk is Lδ = (1/N) Σi ρδ( y ^ i − yi), where ρδ(a) = ½a2 if |a| ≤ δ, and ρδ(a) = δ(|a| − ½δ) otherwise. MAE is used as an alternative. Optimization uses Adam with L2 weight decay and gradient clipping; learning rate scheduling and early stopping are based on the validation loss.
  • Evaluation metrics. We report MAE, RMSE = √[(1/N) Σi ( y ^ i − yi)2], and R2 = 1 − Σi(yi y ^ i )2i(yi y ¯ )2 on held-out routes after inverse scaling where applicable.
Training Protocol and Hyperparameter Specification
Models were implemented in PyTorch (version 2.4.1, Meta Platforms, Inc., Menlo Park, CA, USA) based on the Corr-LSTM pipeline (training–prediction alignment; CorrLSTM_train_aligned). Table 1 summarizes the default configurations adopted in the reported experiments; sensitivity analyses were conducted by varying a single hyperparameter while keeping the others fixed.
Table 1. Default LSTM training and model hyperparameters (CorrLSTM_train_aligned/CorrLSTM_v1).
Model training employed the Adam optimizer with an initial learning rate of 0.001 and a weight decay of 5 × 10⁻⁴. The primary regression objective was the Huber loss (δ = 1.0), while mean absolute error (MAE; L1 loss) was used in ablation experiments. Gradients were clipped to a global norm of 1.0. Learning-rate scheduling was performed using ReduceLROnPlateau based on validation MAE (reduction factor = 0.5, patience = 5 epochs, minimum learning rate = 10−6). Early stopping was applied by monitoring validation MAE with a patience of 10 epochs, and the model parameters corresponding to the lowest validation MAE were retained.
The mini-batch size was set to 64. Training batches were shuffled with drop_last = True, whereas validation and test loaders used drop_last = False. Route-level data splitting allocated 75 per cent, 20 per cent, and 5 per cent of walking paths to the training, validation, and test sets, respectively (train_ratio = 0.75, valid_ratio = 0.20, test_ratio = 0.05 in CorrLSTM_train_aligned). A fixed random seed (42) was used to control path shuffling.
Input features and targets were standardized using statistics computed from the training set (StandardScaler). To mitigate the influence of extreme outliers, targets were optionally winsorized to the 0.5–99.5th percentile prior to scaling. Correlation-based input gating (optional) was implemented using mutual information by default (corr_type = mi), with absolute values, a power of 1.0, and a minimum per-feature threshold of 0.05 after normalization.
The default architectural settings included an input window length of T = 128 and a prediction horizon of H = pre_len (default = 1). The LSTM hidden size was set to 128 with a single LSTM layer (layer_num = 1). A linear input projection mapped features to the hidden dimension, followed by ReLU activation. In MS mode, only the target channel was predicted.
Notably, although dropout is exposed as a configurable parameter (default = 0.2), no inter-layer dropout is applied in a single-layer LSTM; it is only effective between layers in multi-layer configurations, as implemented in LSTM.

3. Results

3.1. Correlation and Differential Analysis of Environmental Factors

3.1.1. Pearson Correlation Analysis

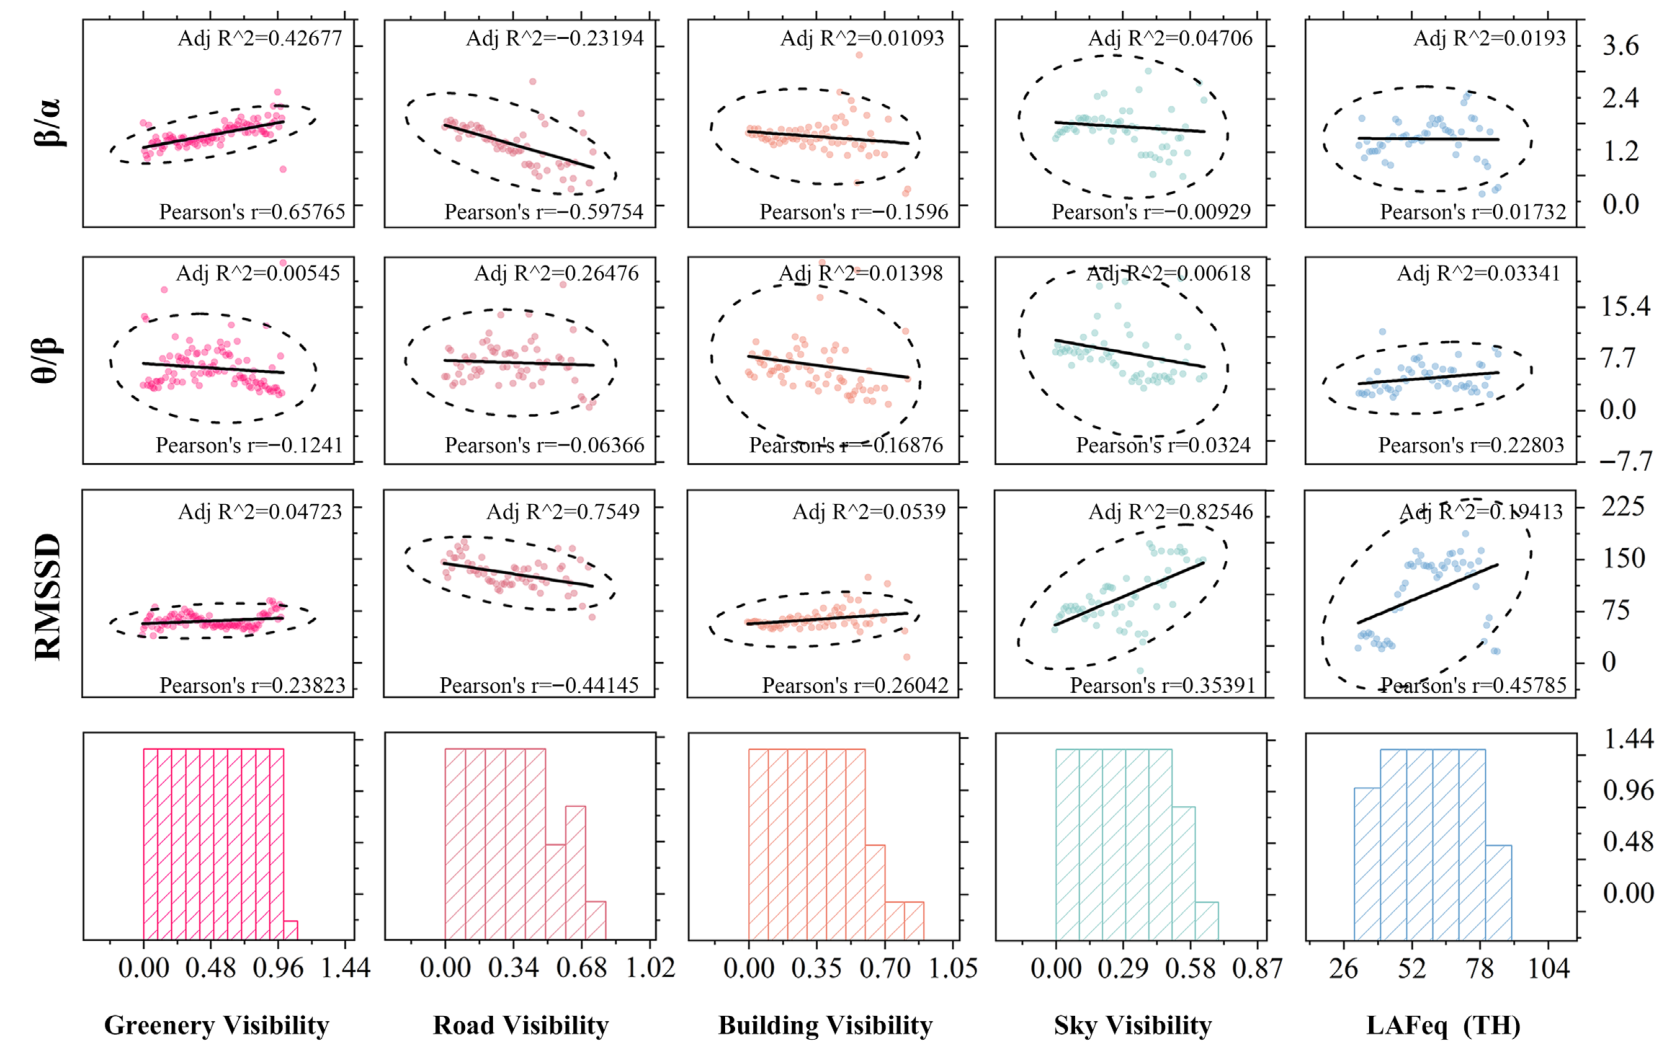
Pearson correlation analysis was conducted to examine the linear associations between street audiovisual features and participants’ physiological responses. The results indicate that walkers’ physiological signals showed clear responses to the dynamic changes of certain environmental factors (Figure 3).
Figure 3. Summary figure of Pearson correlation analysis between audiovisual factors and physiological indicators (β/α ratio, θ/β ratio, and RMSSD).
Specifically, greenery visibility exhibited a strong positive correlation with the EEG β/α ratio (Pearson’s r = 0.65765), suggesting that higher exposure to vegetation effectively enhances pedestrians’ emotional arousal. Sky visibility demonstrated substantial linear explanatory power for RMSSD, with an adjusted R2 reaching 0.75. In contrast, building visibility contributed relatively weakly to physiological indicators, with correlation coefficients generally in the low-to-moderate range (Pearson’s r < 0.20). Sound pressure level (SPL) showed a notable positive correlation with RMSSD (Pearson’s r = 0.45785), reflecting that changes in the acoustic environment can also elicit emotional fluctuations. For the θ/β ratio, its overall correlations with audiovisual factors remain relatively low under Pearson correlation analysis.

3.1.2. Kendall’s Tau-b Correlation Analysis

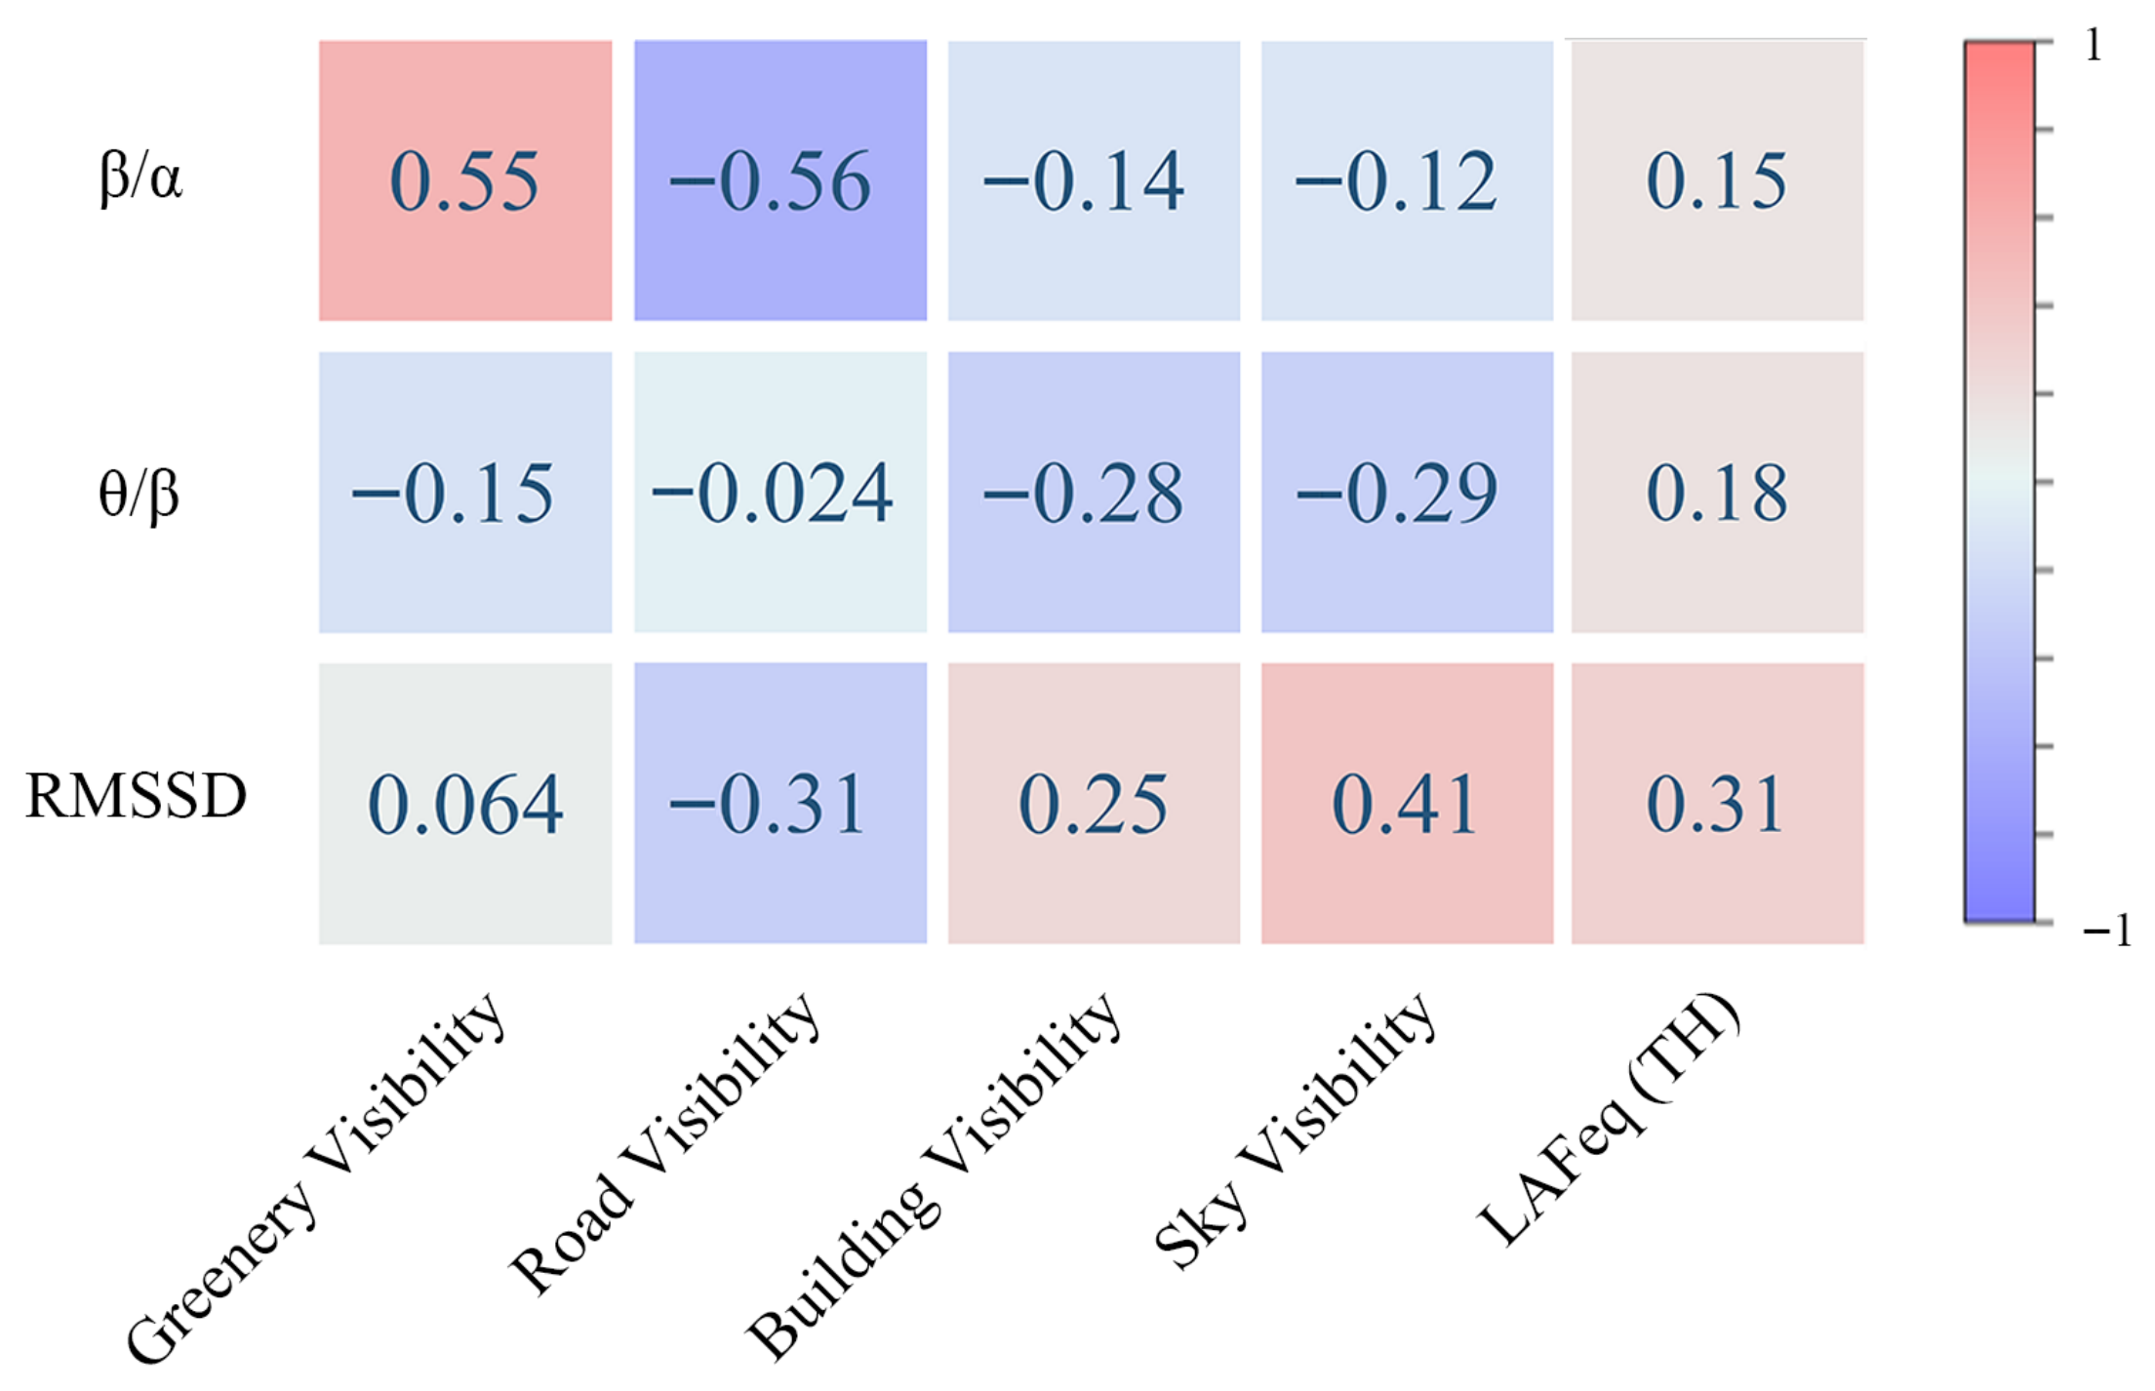
To further explore monotonic associations under non-normal distributions, Kendall’s Tau-b correlation analysis was performed. The heatmap results indicate that audiovisual features exerted discernible monotonic effects on EEG and ECG responses (Figure 4).
Figure 4. Summary figure of Kendall correlation analysis between audiovisual factors and physiological indicators (β/α ratio, θ/β ratio, and RMSSD).
Kendall analysis showed that greenery visibility was significantly positively associated with the β/α ratio (τ = 0.55), further supporting the role of natural vegetation in promoting emotional arousal. Both sky visibility and SPL demonstrated moderate positive correlations with RMSSD (τ approximately 0.3–0.4), reflecting that open visual spaces and auditory stimuli jointly influence parasympathetic nervous activity. For the θ/β ratio, its overall correlation with audiovisual factors remains relatively low under Kendall’s tau-b.

3.1.3. Mutual Information Analysis

To capture potential complex nonlinear mappings between street audiovisual stimuli and physiological responses, mutual information (MI) analysis based on information entropy was introduced. As a nonparametric measure derived from probability distributions, MI effectively quantifies the extent to which changes in audiovisual features reduce uncertainty in predicting physiological responses, thereby revealing deep associations that may be overlooked by linear or monotonic metrics.
The analysis revealed that, in the nonlinear dimension, SPL and greenery visibility continued to make significant contributions to the MI matrix, with substantial explanatory power for the β/α ratio, the θ/β ratio, and RMSSD (Table 2).
Table 2. Summary table of mutual information analysis between audiovisual factors and physiological indicators (β/α ratio, θ/β ratio, and RMSSD).

3.1.4. Differential Analysis

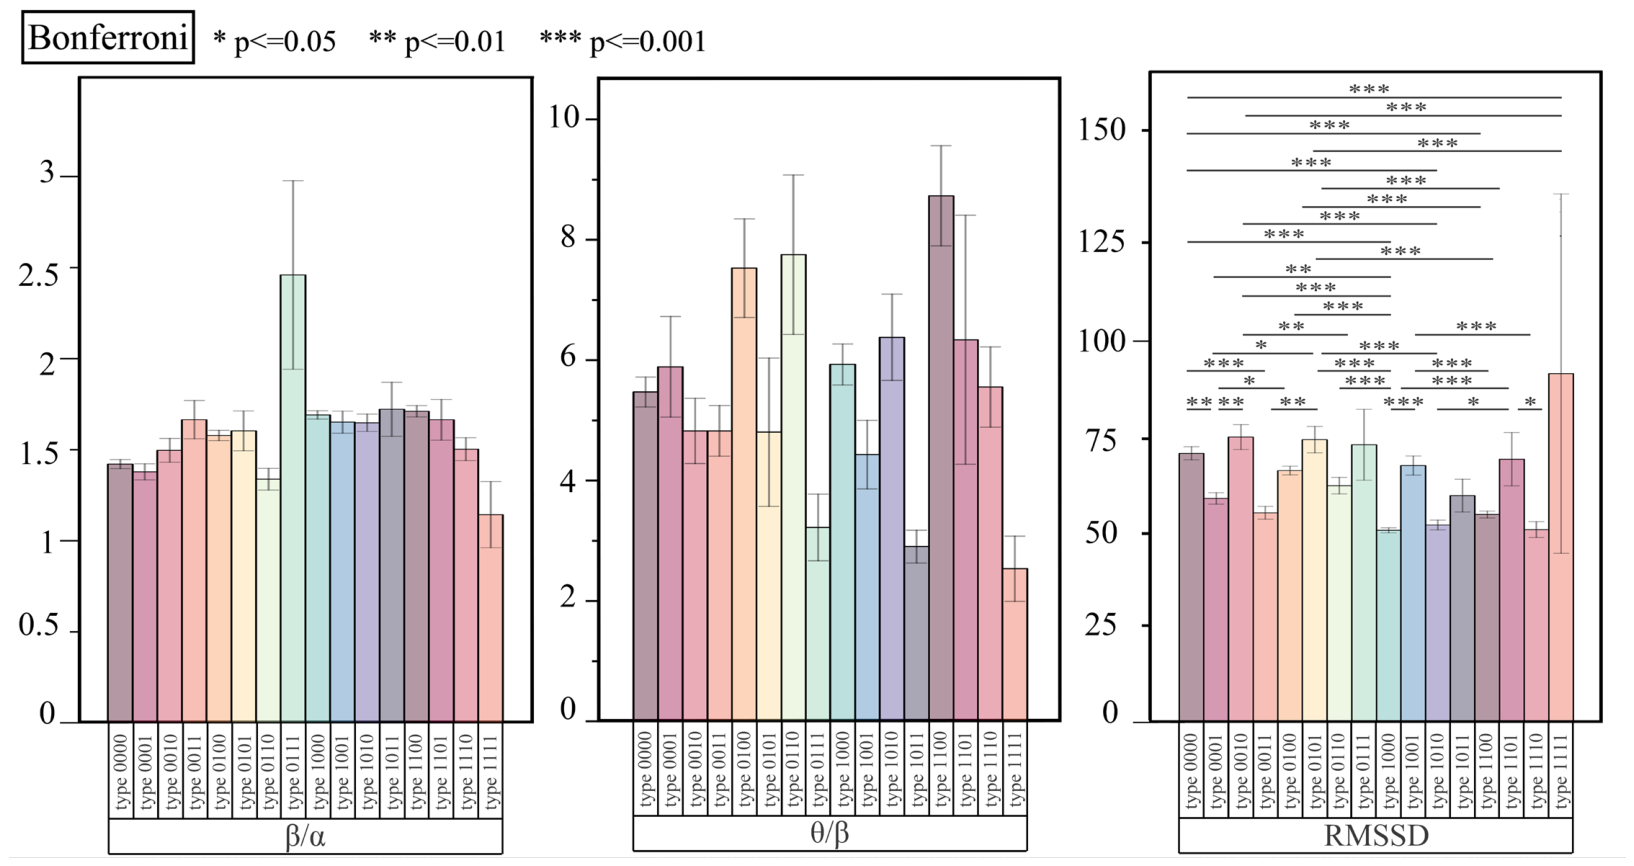
For auditory features such as sound type, which are difficult to quantify directly, intergroup differential analysis was employed to examine their influence on physiological responses. Four sound categories—traffic noise, bird song, human conversation, and construction noise—were collected. Each scenario was coded according to the presence or absence of these sounds (e.g., traffic noise present, bird song, conversation, and construction noise absent), yielding 16 distinct sound type groups. Bonferroni statistical tests were conducted to assess whether physiological responses differed significantly between groups (Figure 5).
Figure 5. Inter-group differences in different sound types for physiological indicators (β/α ratio, θ/β ratio, and RMSSD). Sound types were encoded using a four-digit binary labeling scheme. In this scheme, each digit represents the presence (1) or absence (0) of a specific sound category. The four positions, from left to right, correspond to traffic noise, birdsong, human conversation, and construction noise, respectively. For example, the code “0110” indicates the absence of traffic and construction noise, while birdsong and human conversation are present.
Results indicated that EEG responses did not differ markedly across sound type groups, whereas RMSSD showed substantial, statistically significant differences. This suggests that changes in sound type have a pronounced effect on parasympathetic activity as reflected by RMSSD.

3.2. LSTM Model

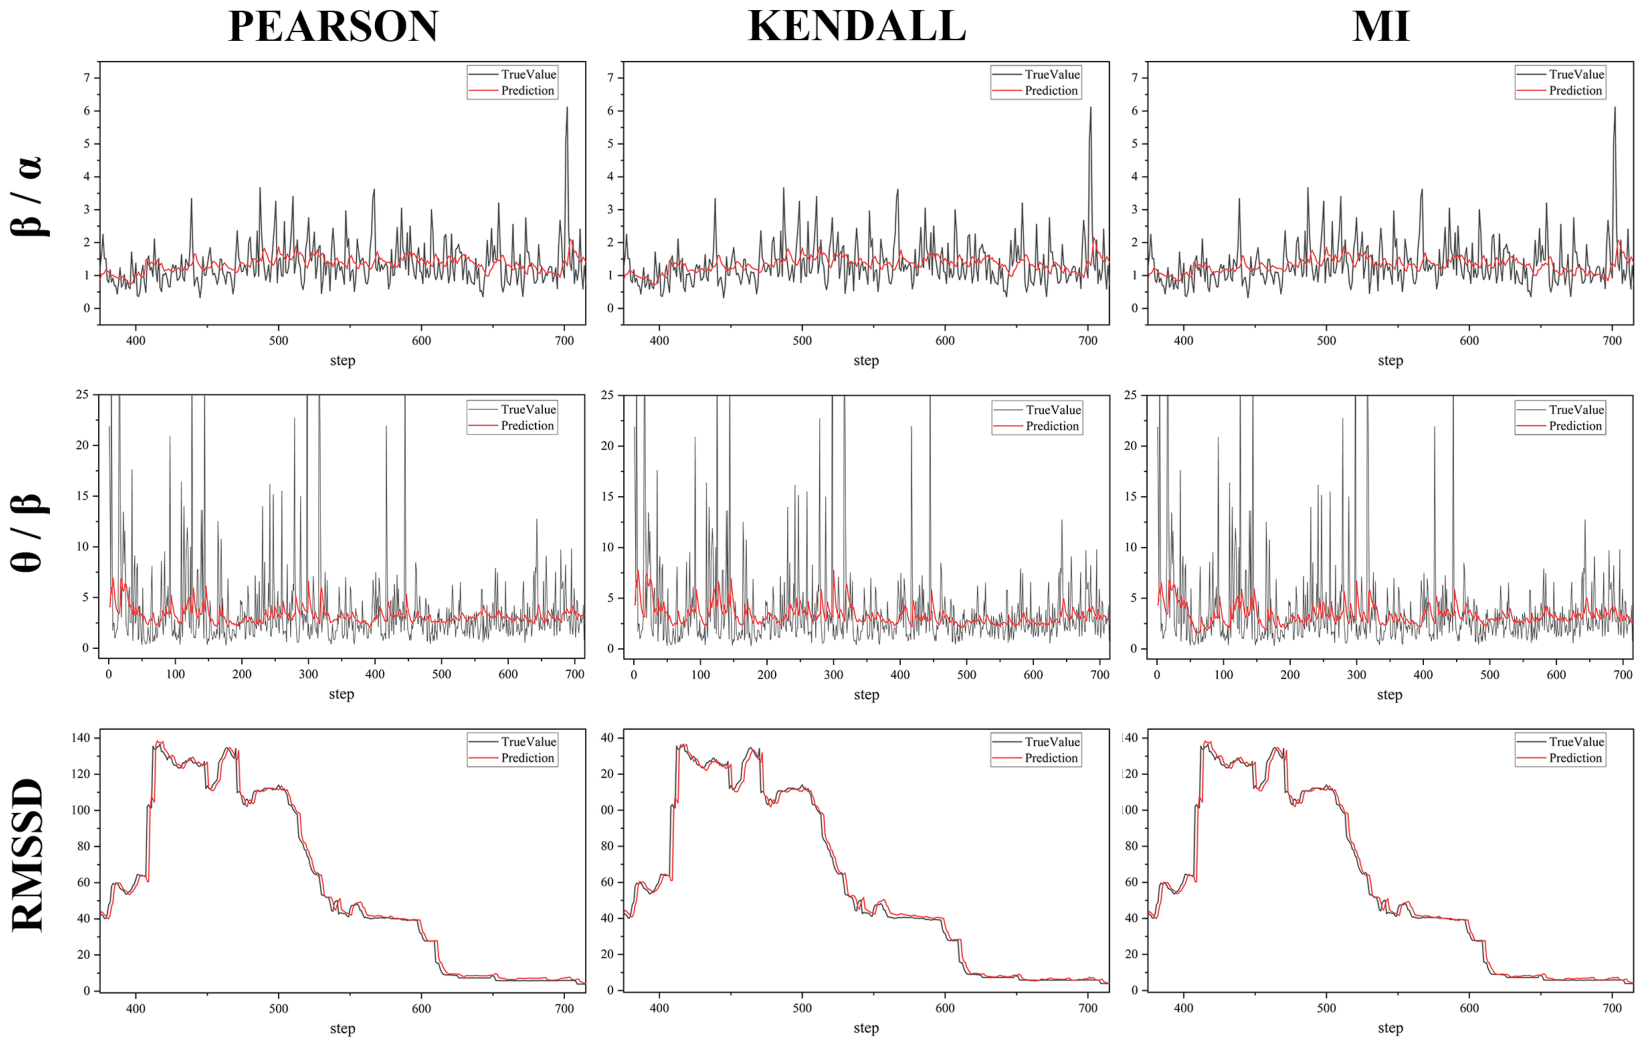
The feature weights derived from the three preceding correlation analyses were incorporated into the LSTM network’s input layer. By comparing prediction performance under different weighting schemes (MAE, RMSE, and R2), the effect of multidimensional feature coupling on sequential emotion prediction was evaluated. Results indicate that the MI-weighted model outperformed the other models in capturing the nonlinear relationships between street audiovisual features and physiological responses (Figure 6, Table 3).
Figure 6. Summary figure of LSTM prediction results based on correlation-weighted fusion of Pearson, Kendall, and MI methods.
Table 3. Summary table of LSTM prediction accuracy based on correlation-weighted integration of Pearson, Kendall, and MI methods.
For ECG response prediction, the MI weighting scheme demonstrated the highest consistency and robustness. Specifically, for the RMSSD index reflecting parasympathetic regulation, the MI-LSTM model achieved an R2 of 0.77, surpassing the Pearson-weighted model (R2 = 0.69) and the Kendall-weighted model (R2 = 0.74). This improvement confirms that MI-based weights more effectively guide the model to learn the nonstationary evolution of physiological signals in complex street environments, enabling highly accurate predictions of pedestrian physiological responses. Analysis of the predicted time series shows that the MI-LSTM model most effectively captured dynamic physiological fluctuations: the predicted RMSSD closely matched the actual values in both amplitude and phase, outperforming the Pearson and Kendall schemes. In contrast, predictions of the EEG β/α and θ/β ratios yielded low R2 values (around 0.02 across all three schemes), reflecting the highly instantaneous and individually variable nature of EEG responses.
Overall, based on predictive accuracy across weighting schemes, the MI-LSTM model was selected for the subsequent generation of pedestrian physiological response maps.

3.3. Physiological Response Map Prediction

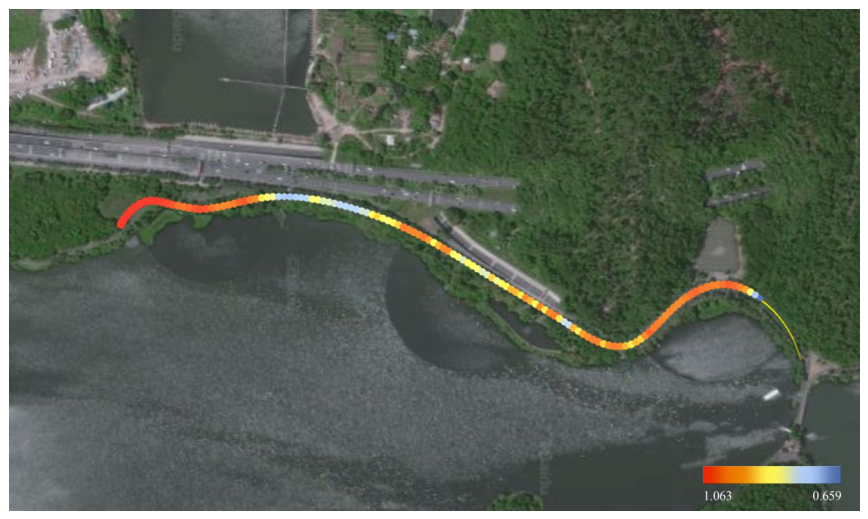
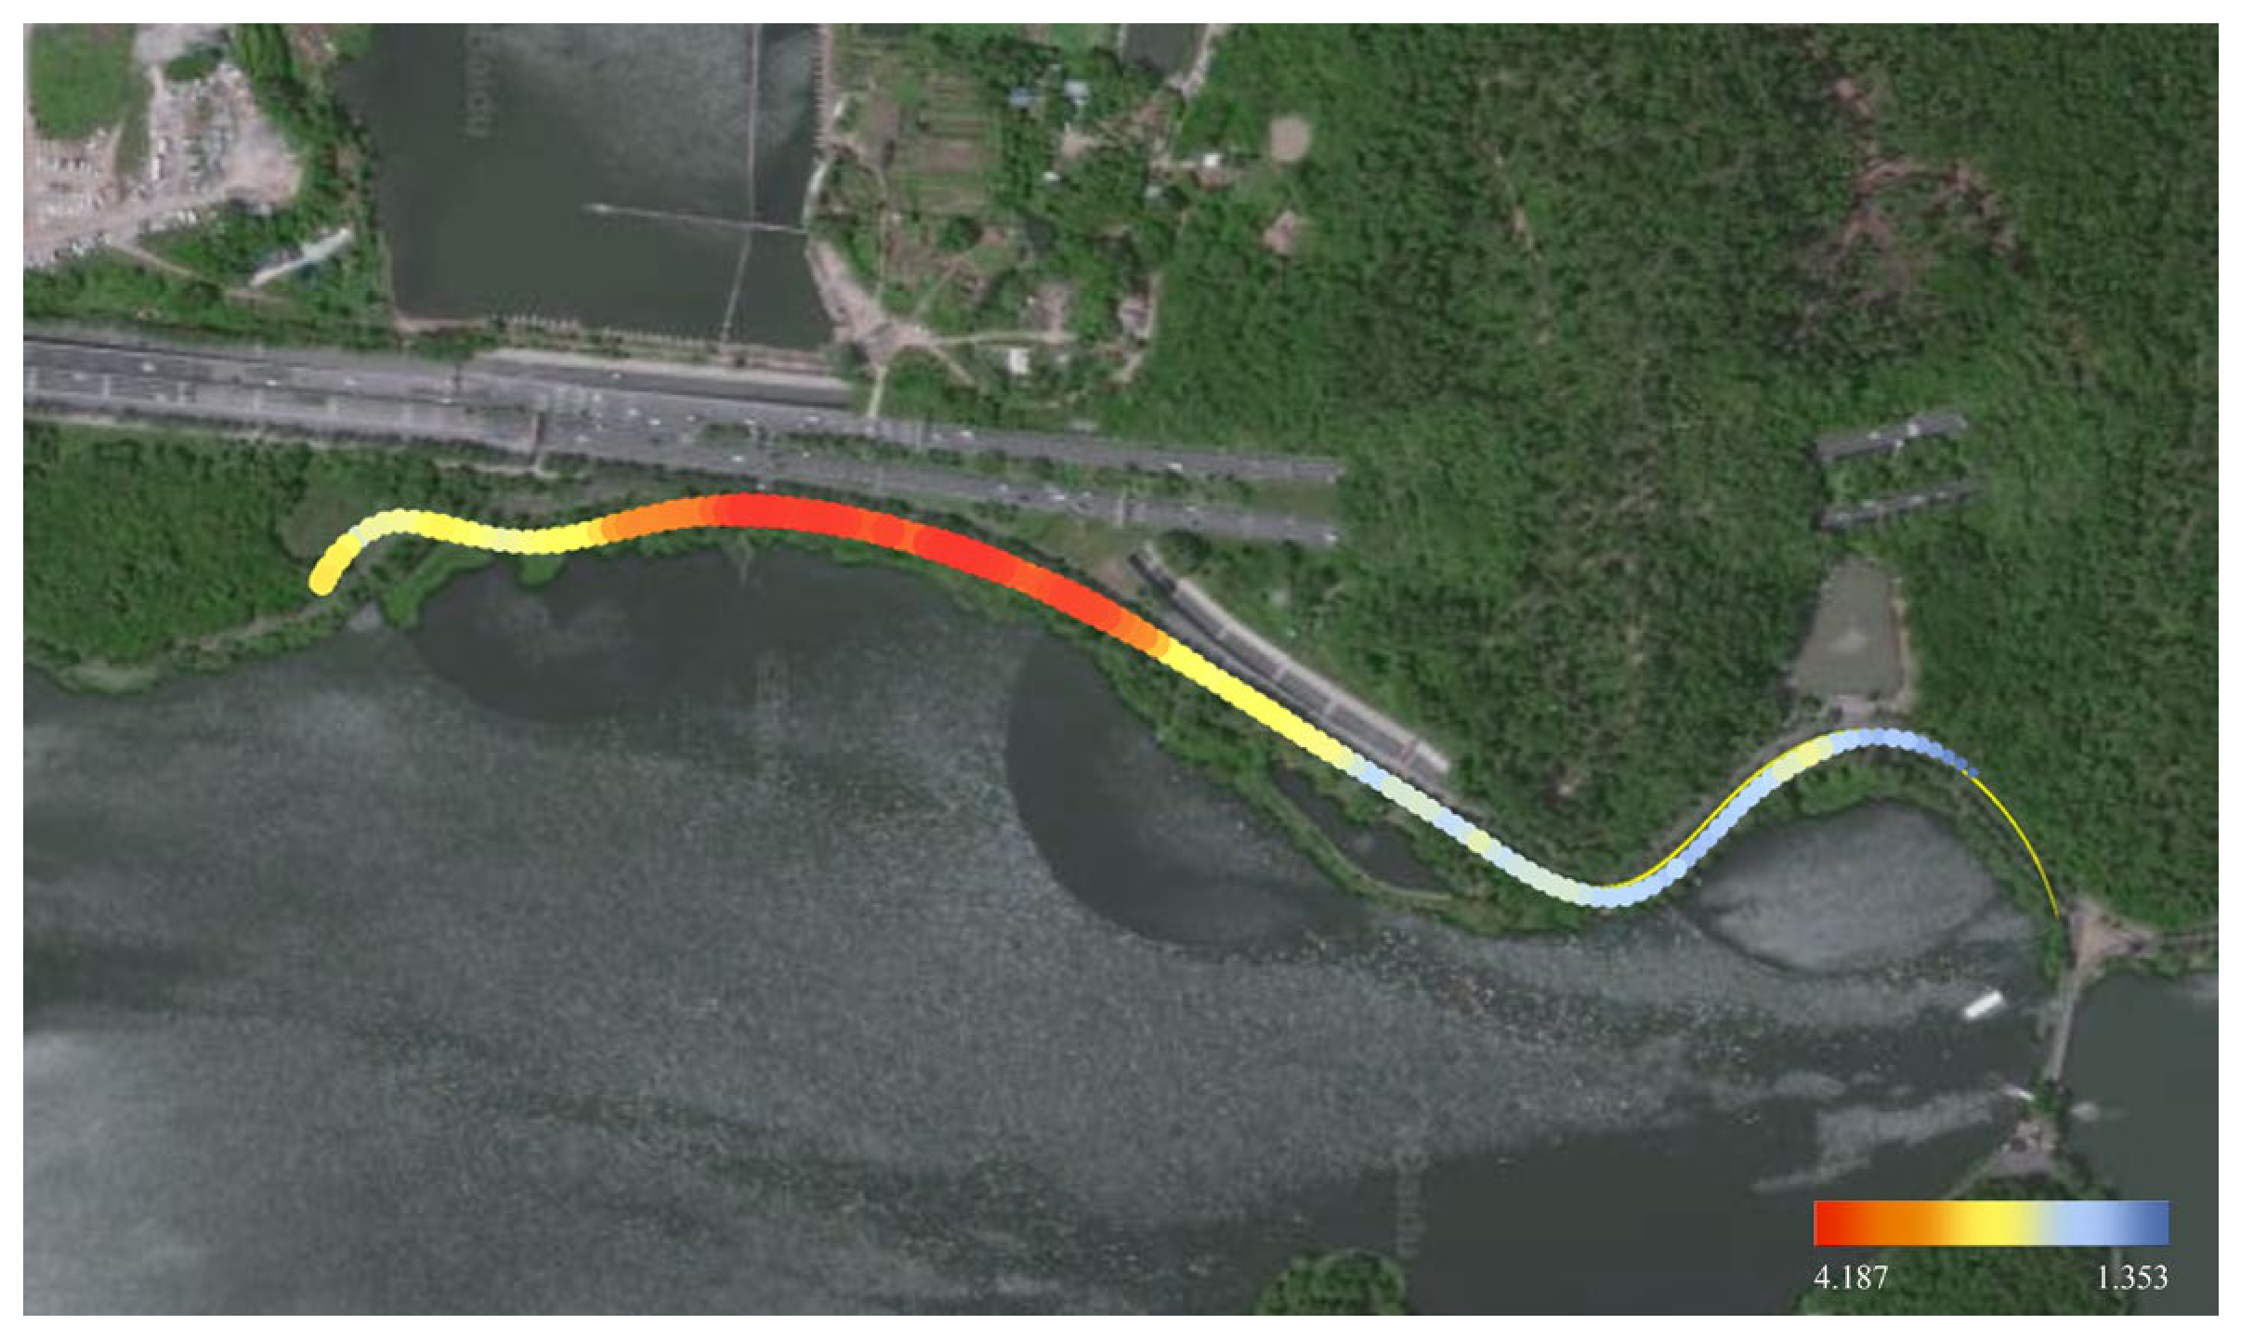
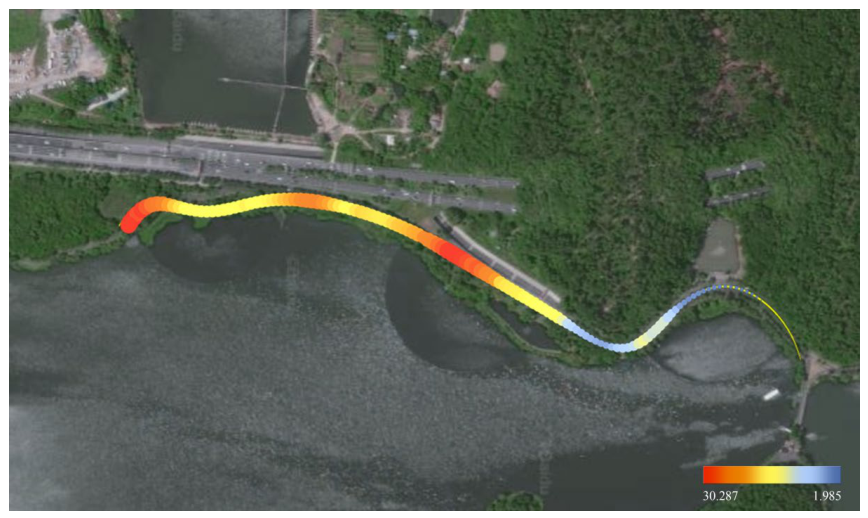
To validate the MI-LSTM model’s generalizability to unseen environments and its applicability in spatial design, an independent street segment outside the training set was used for model extrapolation. By inputting audiovisual parameters collected along this segment, the model successfully generated a spatiotemporal mapping of pedestrians’ multidimensional physiological responses, which was used to produce spatial physiological response maps (Figure 7, Figure 8 and Figure 9).
Figure 7. Predicted map of β/α ratio.
Figure 8. Predicted map of θ/β ratio.
Figure 9. Predicted map of RMSSD.
Analysis of Figure 7 shows that, along the route’s initial segment (128–326 s, moving from the right starting point), the β/α ratio was moderately high due to elevated greenery visibility and corresponding brain activation. As pedestrians approached the exit of the elevated roadway, although ambient noise had a mild arousal effect, the continued decrease in greenery visibility exerted a stronger inhibitory effect. Consequently, the β/α ratio fluctuated markedly in the mid-segment (326–616 s), showing an overall downward trend. In the final segment (616–765 s), the β/α ratio rose again as greenery visibility increased and terrain mitigated some traffic noise. Overall, EEG β/α exhibited strong immediate responsiveness to environmental changes along the route.
Analysis of Figure 8 shows that, in the initial segment of the route (128–326 s, moving from the right starting point), the θ/β ratio remained at its lowest level, reflecting enhanced attentional engagement and increased cognitive involvement under conditions of higher greenery visibility and a more favorable natural environment. As pedestrians entered the mid-segment (326–616 s), the θ/β ratio began to increase steadily following the weakening of the natural environment along the side road. Upon approaching the exit area beneath the elevated roadway, the θ/β ratio reached its peak, indicating that increased noise levels and reduced visibility of greenery contributed to diminished attention and lower cognitive engagement. In the final segment (616–756 s), the θ/β ratio decreased again as greenery visibility improved and terrain features helped mitigate traffic noise. Overall, the θ/β ratio demonstrated strong immediate responsiveness to environmental changes along the route.
Figure 9 shows that RMSSD was relatively low in the initial segment (128–326 s), likely reflecting the delayed stabilization of autonomic regulation. In the mid-segment (326–616 s), RMSSD initially increased, then decreased near the exit of the elevated roadway, indicating that HRV is influenced not only by prior favorable environmental exposure but also by subsequent increases in noise, changes in sound type, and reduced greenery. In the final segment (616–765 s), RMSSD rose again as greenery recovered and traffic disturbances lessened.
The predicted β/α ratio ranged dynamically from 0.659 to 1.063, the θ/β ratio ranged from 1.353 to 4.187, and RMSSD values ranged from 1.985 to 30.287, consistent with normal physiological fluctuations and without extreme outliers, validating the model’s predictive reliability. The analysis demonstrates that, compared with the EEG β/α and θ/β ratios, RMSSD shows a lagged increase, reflecting the cumulative effect of HRV relative to instantaneous EEG changes.

3.4. Reveal the Mechanisms of Physiological Feedback

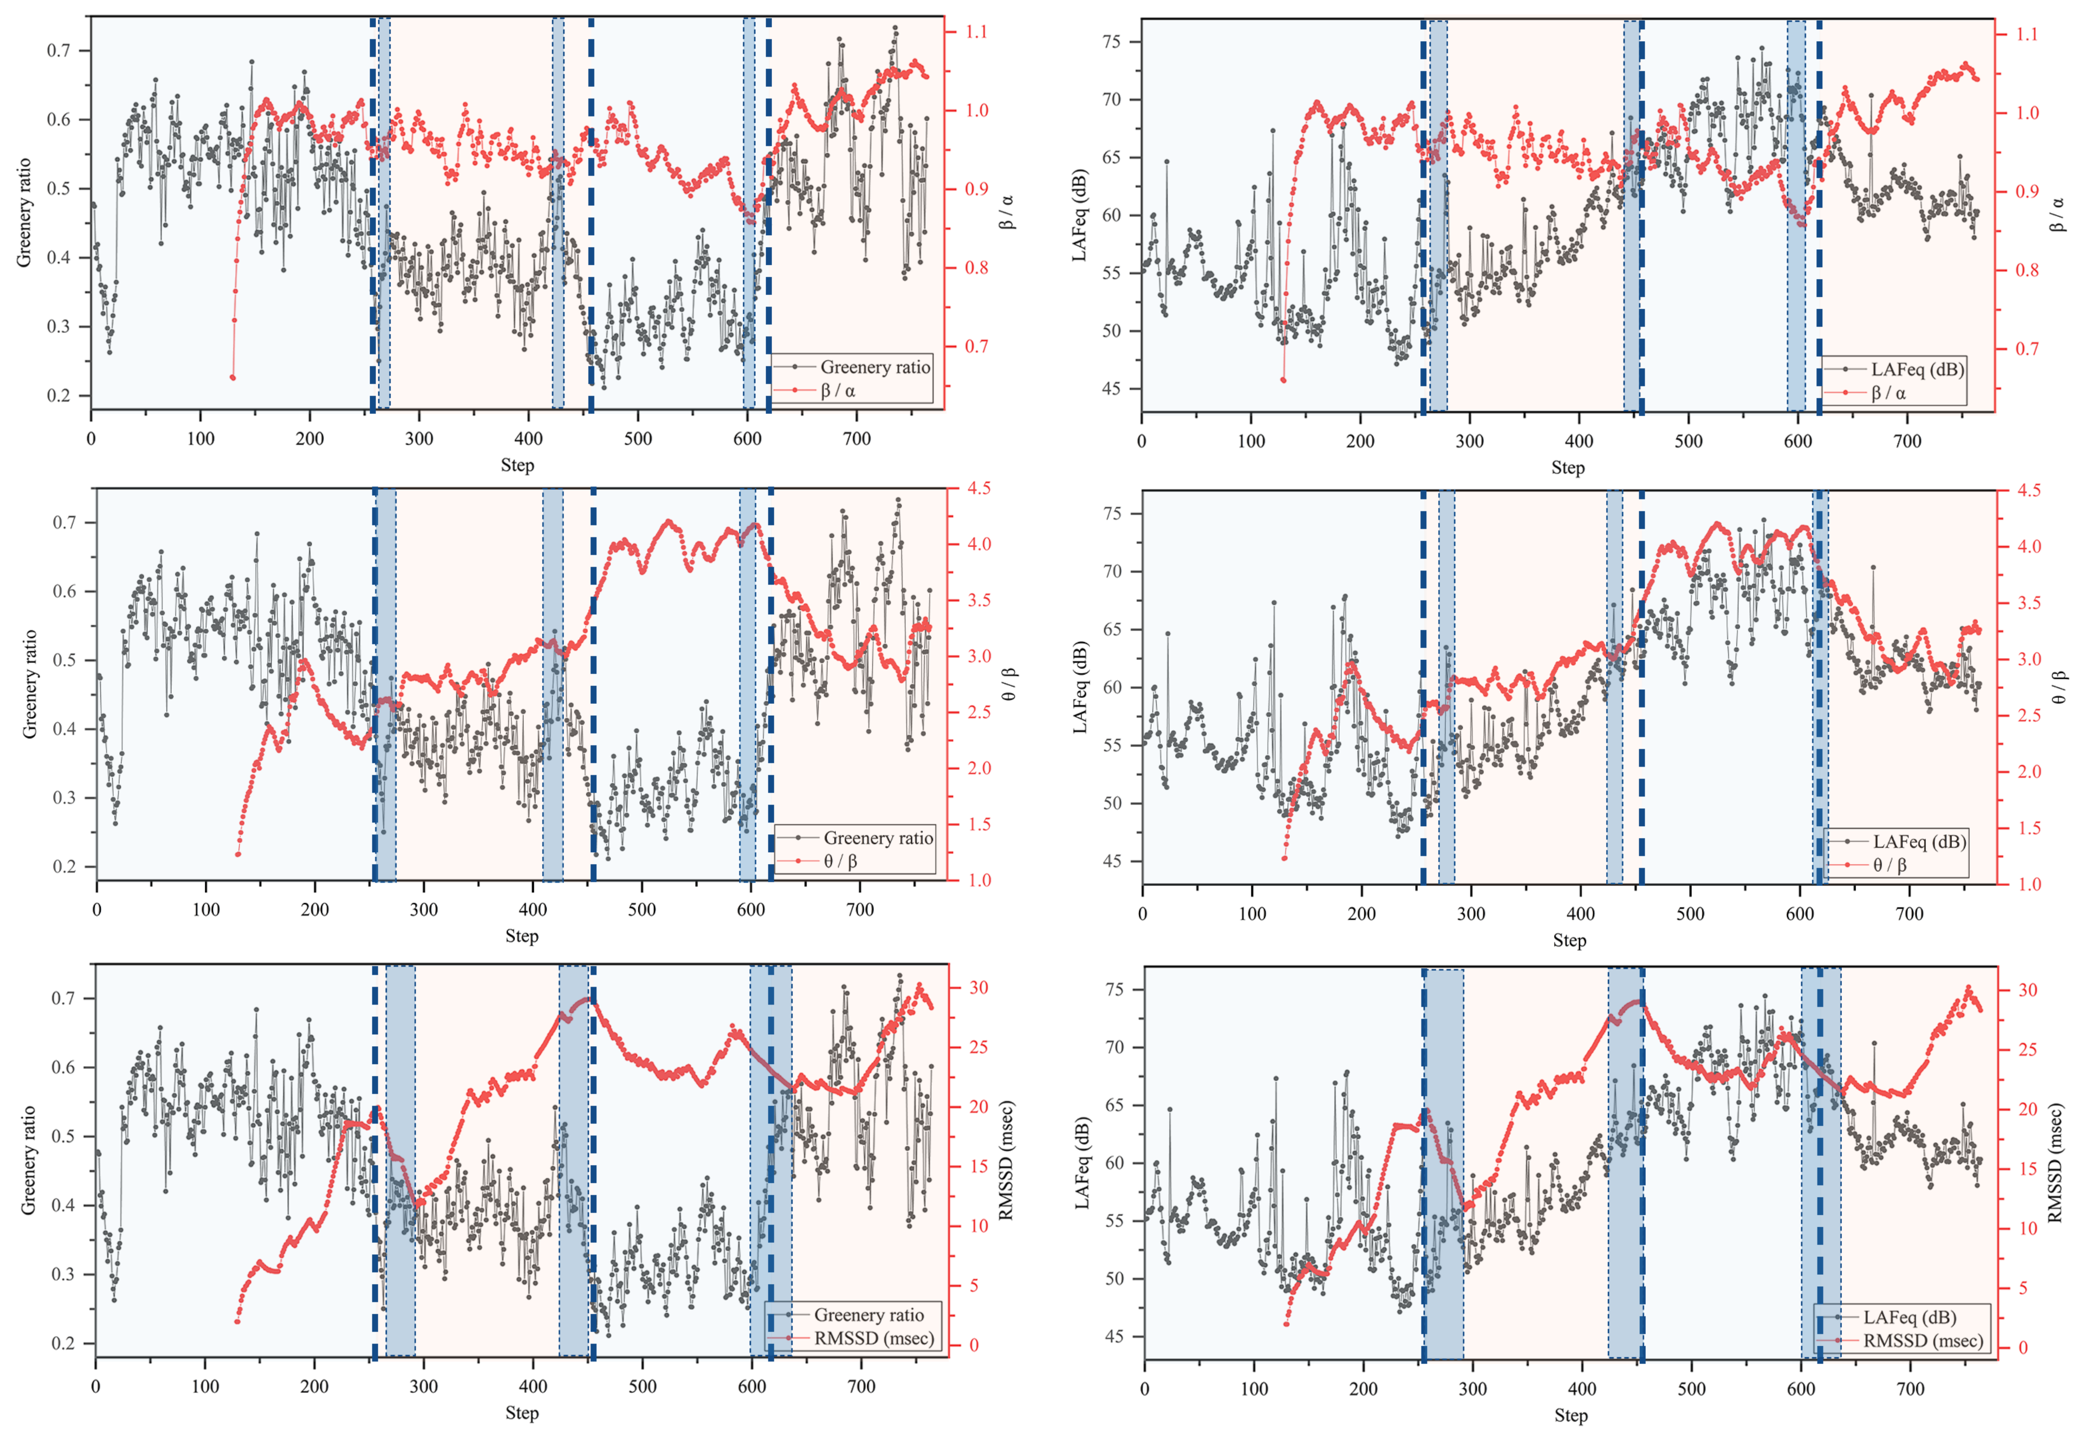
Given that visual greenery visibility and sound pressure level exhibit strong correlations with physiological responses and demonstrate high explanatory power for physiological feedback, this study takes these variables as the entry point. By analyzing the relationships among greenery visibility, sound pressure level, and physiological responses (Figure 10), the study further explores the response and feedback mechanisms of physiological indicators to environmental audiovisual factors.
Figure 10. Dual-axis statistical plots of greenery visibility, sound pressure level, and physiological responses. The dark blue rectangles represent the lag effect of physiological responses to changes in audiovisual factors; the light blue and light orange shaded regions indicate distinct environmental sequence units; the dark blue dashed lines mark the points where abrupt environmental transitions occur.

3.4.1. Lag Effect of Physiological Responses

As shown in the dark blue regions in Figure 10, around training steps 250, 450, and 600, both electroencephalogram (EEG) and electrocardiogram (ECG) indicators exhibit evident lagged responses to changes in the independent variables, namely visual greenery visibility and sound pressure level.
Specifically, the response delay of EEG indicators—represented by the β/α ratio and θ/β ratio—is approximately 5 to 10 time steps. In contrast, the lag interval of heart rate variability (HRV), represented by RMSSD, is approximately 30 to 40 time steps. These findings suggest that EEG activity responds more rapidly to environmental stimuli, demonstrating higher instantaneous sensitivity. By comparison, ECG-related indicators exhibit a longer temporal adjustment process, reflecting the gradual nature of autonomic nervous system regulation in emotional recovery and physiological homeostasis.

3.4.2. Transition Effect of Physiological Responses

The light blue and light orange shaded regions in Figure 10 indicate distinct environmental sequence units, such as moments when pedestrians enter street corner nodes or when significant changes occur in the surrounding audiovisual environment. Along the predicted trajectory, steps 255, 457, and 613 (corresponding to the dark blue dashed lines in the figure) represent points of abrupt environmental transitions, each accompanied by pronounced fluctuations in physiological indicators.
These results indicate that spatial scene transitions can induce significant emotional stimuli, highlighting the transitional characteristics of physiological responses during environmental changes.

3.5. Design Decision Support

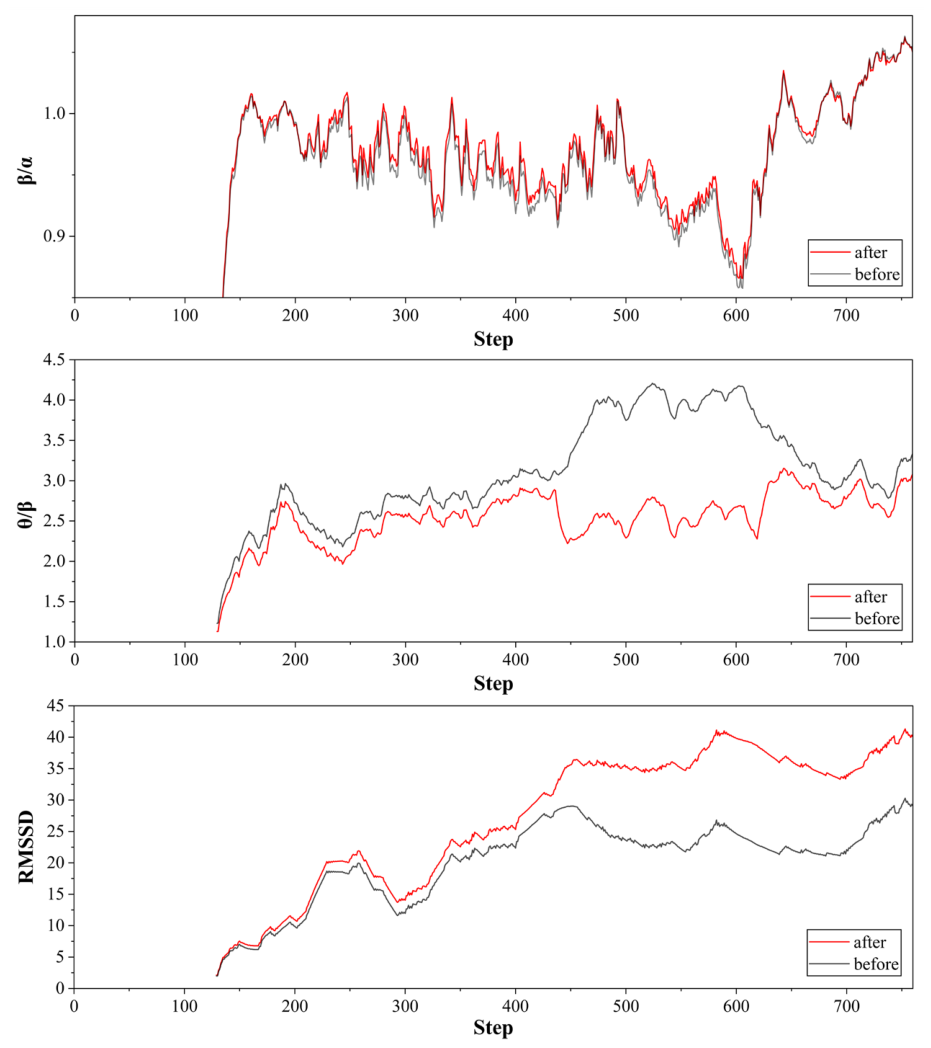
To further demonstrate the applicability of the proposed physiological response map prediction framework in supporting design decision-making, this study introduces targeted environmental modifications and compares the predicted physiological responses before and after the interventions. To address identified “emotion risk zones” (periods of low EEG β/α ratio, θ/β ratio, and RMSSD indicating low brain arousal, suppressed parasympathetic activity, and reduced relaxation), core audiovisual inputs were adjusted. The model outputs demonstrated dynamic restoration of physiological responses (Figure 11), confirming its utility for informing street micro-renewal decisions.
Figure 11. Comparison of predicted physiological indicator (β/α ratio, θ/β ratio, and RMSSD) changes before and after implementation of the modification strategy.
  • Given the significant positive effect of greenery visibility on physiological responses, and considering its relatively low implementation cost, the study increased greenery visibility by 10 per cent in the initial segment of the route (128–434 s). The revised predictions indicate that the EEG β/α ratio increased by an average of 0.68 per cent, the EEG θ/β ratio decreased by an average of 8.4 per cent, while RMSSD increased by 11.4 per cent.
  • In the mid-segment (434–616 s), which is located near the exit of the elevated roadway, greenery visibility is notably lower, and the sound pressure level rises sharply compared to other sections. Field investigation revealed that the elevated roadway segment on the right side of the study area is relatively short and carries a low traffic volume. Therefore, a strategy to remove the elevated roadway was adopted, aiming to reduce the sound pressure level by 10 dB, increase greenery visibility by 20 per cent, and incorporate additional birdsong to further improve the auditory environment. The simulated post-intervention results show that the EEG β/α ratio increased by 0.72 per cent on average, the EEG θ/β ratio decreased by 35.1 per cent on average, and RMSSD increased by 48.3 per cent.
  • Similarly, due to the positive influence of greenery visibility and its cost-effectiveness, the study increased greenery visibility by 10 per cent in the final segment (616–760 s). The updated predictions show that the EEG β/α ratio increased by 0.69 per cent on average, the EEG θ/β ratio decreased by 11 per cent on average, and RMSSD increased by 54.2 per cent.
Overall, the above findings further demonstrate the practical value of the proposed LSTM-based temporal prediction model and the physiological response map prediction in supporting urban planning and improving pedestrian experiential environments. First, the temporal model and prediction maps enable the identification of “high-risk segments” of physiological discomfort along existing street environments, thereby allowing planners to precisely locate specific route sections that require visual and auditory environmental improvements to enhance walking experience quality. Second, the framework enables designers to modify environmental parameters and directly simulate their potential impacts on pedestrian physiological responses, providing objective, data-driven evidence for the formulation of design strategies. This capability significantly improves the efficiency and accuracy of the design decision-making process, bridging the gap between environmental diagnosis and design intervention in a quantitative, predictive manner. In addition, the framework has potential practical value in supporting cost-effectiveness evaluation. By combining the observed physiological improvement associated with a given intervention with its estimated implementation workload and cost, the physiological benefit per unit cost could be assessed. This perspective would help identify the most efficient design option for maximizing physiological improvement under comparable resource constraints, thereby strengthening the decision-support value of the proposed method.

4. Conclusions & Discussion

4.1. Discussion of Correlations

This study comprehensively evaluated the results of Pearson correlation, Kendall’s Tau-b, and MI analyses, aiming to investigate the mechanisms by which street audiovisual environments affect pedestrians’ physiological responses from linear, monotonic, and nonlinear perspectives. The combined use and mutual validation of these three analytical methods enabled an in-depth reconstruction of the dynamic, nonlinear perceptual process underlying walking experiences.
One advantage of the multidimensional correlation analysis is that it confirmed the robustness of core explanatory variables across different analytical dimensions. For instance, greenery visibility showed a high correlation with the EEG β/α ratio in the Pearson analysis and strong explanatory power in both the Kendall and MI analyses. Similarly, SPL consistently demonstrated a strong effect on RMSSD across all three correlation analyses. These findings indicate that dynamic adjustments in greenery visibility and SPL produce more pronounced physiological feedback, providing a scientifically grounded focus for subsequent street renewal design strategies.
Another advantage of multidimensional correlation analysis is its contribution to optimizing the LSTM prediction model. Based on the correlation analysis results, weights for each audiovisual feature were extracted and incorporated as prior weights during model training, yielding weighted predictive models grounded in distinct statistical logics. Comparative experiments revealed that these weighted parameters significantly influenced model prediction accuracy. By comparing predictive performance across weighting schemes, the MI-based correlation weights were selected as the final input standard, resulting in the MI-LSTM model.
In summary, the parallel application of multidimensional correlation analysis offers dual benefits: it helps identify core explanatory variables for physiological indices, providing a foundation for intervention strategies, and it facilitates comparison of weighting schemes to determine the optimal model training configuration, ensuring scientific rigor in training and accuracy in prediction.

4.2. Model Performance Enhancement

To evaluate the effect of correlation-based weighting on LSTM sequential emotion prediction, three weighting schemes—Pearson, Kendall, and MI—were implemented under identical data splits and network architecture, with per-feature gating applied at the input layer to reweight. Results show that for the parasympathetic regulation indicator RMSSD, the MI-weighted model achieved an R2 of 0.77, higher than the Pearson-weighted model (R2 = 0.69) and the Kendall-based model (R2 = 0.74). This demonstrates that MI-based weights capture nonlinear coupling between street environmental factors and physiological responses more effectively, thereby enhancing the stability and accuracy of fitting nonstationary physiological sequences. In contrast, for predicting EEG β/α ratios and θ/β ratios, all schemes yielded low R2 values (R2 = 0.02) due to the high instantaneous variability and individual differences in EEG signals. This indicates that further refinement in EEG feature representation and model architecture is necessary to improve generalization.

4.3. Model Prediction

The MI-LSTM model was used to generate physiological response maps, enabling quantitative simulation of pedestrians’ street perception. EEG maps revealed instantaneous fluctuations in central arousal, while HRV maps reflected the continuous evolution of physiological stress. These predictive results not only confirmed the robustness of the proposed model in real-world applications but also provided urban management authorities with a scientific tool for identifying “emotion risk zones” and devising targeted spatial optimization strategies during urban street renewal.
Comparisons of predictions before and after intervention demonstrated the effectiveness of the MI-LSTM physiological response maps in dynamic design simulations. By using physiological feedback as a benchmark, the approach transforms traditional “empirical design” into “evidence-based intervention design,” offering a quantifiable predictive tool and a framework for optimizing urban street spaces.

5. Limitations and Future Work

Although this study has made exploratory progress in integrating multimodal physiological data with machine learning methods to achieve emotion prediction in street environments, it remains, overall, a proof-of-concept study within this emerging research field and therefore inevitably has several limitations:
  • Limited environmental variables: This study primarily focuses on audiovisual perceptual factors (e.g., greenery visibility, sky visibility, and sound pressure level), while spatial morphological parameters (e.g., street width, segment length, and enclosure) are not included. Future research should incorporate these spatial metrics to achieve a more comprehensive representation of the built environment.
  • Limited sample size: The dataset (32 sets of data samples) remains relatively small, which may constrain the robustness of the analysis and limit the ability to capture inter-individual variability in physiological responses. Future studies should expand the sample size to improve the reliability and generalizability of the findings.
  • Limited EEG predictive performance: Although the MI-LSTM model performs well for HRV prediction, its accuracy for EEG indicators remains low, likely due to high temporal variability and individual differences. Future work should explore more advanced feature extraction and modeling approaches to improve EEG prediction.
  • Potential temporal synchronization uncertainty: Although a multi-device temporal alignment strategy was implemented to synchronize audiovisual, physiological, and GPS data, residual temporal discrepancies may still exist due to inherent measurement latency and hardware-level timing inaccuracies across different devices. Such minor misalignments could affect the predictive performance.
Future research will aim to enhance the robustness and generalizability of the proposed framework by addressing current limitations. Specifically, expanding the sample size and including more diverse participants and environmental contexts (e.g., water and urban typologies) will help better capture inter-individual variability in physiological responses and improve the statistical reliability and external validity of the findings. In addition, incorporating spatial morphological parameters—such as street width, segment length, and enclosure—will enable a more comprehensive characterization of the built environment and strengthen the explanatory power of the environmental feature set.
Furthermore, to improve the predictive performance of EEG indicators, future studies should explore more advanced feature extraction techniques and modeling approaches, such as attention mechanisms, transformer-based architectures, and multimodal fusion strategies, to better capture the complex, nonlinear, and highly dynamic nature of neural signals. Finally, future work should also aim to improve multimodal temporal synchronization accuracy by adopting higher-precision synchronization protocols (e.g., hardware-triggered synchronization or unified data acquisition systems) to reduce cross-device temporal misalignment and enhance overall data fidelity.

Author Contributions

Conceptualization, J.X. and X.L.; methodology, J.X. and X.L.; software, J.X., X.H., X.L. and T.W.; validation, J.X., X.H. and X.L.; formal analysis, J.X. and X.H.; investigation, J.X., X.L., S.M. and L.L.; resources, X.L.; data curation, J.X., S.M. and L.L.; writing—original draft preparation, J.X., X.H. and T.W.; writing—review and editing, J.X. and X.L.; visualization, J.X.; supervision, X.L.; project administration, J.X. and X.L.; funding acquisition, J.X. and X.L. All authors have read and agreed to the published version of the manuscript.

Funding

This research was funded by the National Natural Science Foundation of China (Grant No. 52308022) and the Undergraduate Natural Science Innovation Fund of Huazhong University of Science and Technology (Grant No. 82500029).

Institutional Review Board Statement

This study was approved by the Medical Ethics Committee of Tongji Medical College, Huazhong University of Science and Technology (Approval No. [2023]伦审字(S157)号; approval date: 26 November 2023).

Data Availability Statement

The data presented in this study are available on request from the corresponding author.

Acknowledgments

During the preparation of this study, the authors used ChatGPT (GPT-5, OpenAI, San Francisco, CA, USA) for the purposes of assisting in language refinement and suggesting phrasing. The authors have reviewed and edited the output and take full responsibility for the content of this publication.

Conflicts of Interest

The authors declare no conflicts of interest.

Abbreviations

The following abbreviations are used in this manuscript:
ECGElectrocardiogram
EEGElectroencephalogram
EMGElectromyography
GPSGlobal Positioning System
HRVHeart Rate Variability
IIRInfinite Impulse Response
LSTMLong Short-Term Memory
MAEMean Absolute Error
MIMutual Information
PCHIPPiecewise Cubic Hermite Interpolating Polynomial
PSDPower Spectral Density
ReLURectified Linear Unit
RMSERoot Mean Square Error
RMSSDRoot Mean Square of Successive Differences
SPLSound Pressure Level

References

  1. Zhang, Z.; Amegbor, P.M.; Sigsgaard, T.; Sabel, C.E. Assessing the Association between Urban Features and Human Physiological Stress Response Using Wearable Sensors in Different Urban Contexts. Health Place 2022, 78, 102924. [Google Scholar] [CrossRef] [Scilit]
  2. Feng, J.; Li, Q. Investigate Physiological and Psychological Responses to Environment Scenes, Elements and Components in Different Urban Settings. Sci. Rep. 2025, 15, 3694. [Google Scholar] [CrossRef] [Scilit]
  3. Zhang, Z.; Zhuo, K.; Wei, W.; Li, F.; Yin, J.; Xu, L. Emotional Responses to the Visual Patterns of Urban Streets: Evidence from Physiological and Subjective Indicators. Int. J. Environ. Res. Public Health 2021, 18, 9677. [Google Scholar] [CrossRef] [Scilit]
  4. Anand, S.; Pujara, T. Impact of Streetscapes on Anxiety: A Physiological Evidence. In Urban Resilience, Livability, and Climate Adaptation; Pigliautile, I., Piselli, C., Karunathilake, H.P., Fabiani, C., Eds.; Advances in Science, Technology & Innovation; Springer Nature: Cham, Switzerland, 2024; pp. 99–116. [Google Scholar]
  5. Zhao, G.; Zhang, Y.; Ge, Y.; Zheng, Y.; Sun, X.; Zhang, K. Asymmetric Hemisphere Activation in Tenderness: Evidence from EEG Signals. Sci. Rep. 2018, 8, 8029. [Google Scholar] [CrossRef] [Scilit] [PubMed]
  6. Koelstra, S.; Muhl, C.; Soleymani, M.; Lee, J.-S.; Yazdani, A.; Ebrahimi, T.; Pun, T.; Nijholt, A.; Patras, I. DEAP: A Database for Emotion Analysis; Using Physiological Signals. IEEE Trans. Affect. Comput. 2012, 3, 18–31. [Google Scholar] [CrossRef] [Scilit]
  7. Zheng, W.-L.; Zhu, J.-Y.; Lu, B.-L. Identifying Stable Patterns over Time for Emotion Recognition from EEG. IEEE Trans. Affect. Comput. 2019, 10, 417–429. [Google Scholar] [CrossRef] [Scilit]
  8. Yu, X.; Li, Z.; Zang, Z.; Liu, Y. Real-Time EEG-Based Emotion Recognition. Sensors 2023, 23, 7853. [Google Scholar] [CrossRef] [Scilit]
  9. Jatupaiboon, N.; Pan-Ngum, S.; Israsena, P. Real-Time EEG-Based Happiness Detection System. Sci. World J. 2013, 2013, 618649. [Google Scholar] [CrossRef] [Scilit] [PubMed]
  10. Yu, C.; Wang, M. Survey of Emotion Recognition Methods Using EEG Information. Cogn. Robot. 2022, 2, 132–146. [Google Scholar] [CrossRef] [Scilit]
  11. Suzuki, Y.; Tanaka, S.C. Functions of the Ventromedial Prefrontal Cortex in Emotion Regulation under Stress. Sci. Rep. 2021, 11, 18225. [Google Scholar] [CrossRef] [Scilit]
  12. Medvedeva, A.; Rudenkiy, N.; Shelepenkov, D.; Kosonogov, V. The Role of Prefrontal Cortex in Emotion Regulation: A More Naturalistic Magnetoencephalographic Study. Behav. Brain Res. 2026, 507, 116169. [Google Scholar] [CrossRef] [Scilit]
  13. Watanabe, D.K.; Pourmand, V.; Lai, J.; Park, G.; Koenig, J.; Wiley, C.R.; Thayer, J.F.; Williams, D.P. Resting Heart Rate Variability and Emotion Regulation Difficulties: Comparing Asian Americans and European Americans. Int. J. Psychophysiol. 2023, 194, 112258. [Google Scholar] [CrossRef] [Scilit]
  14. Thayer, J.F.; Lane, R.D. A Model of Neurovisceral Integration in Emotion Regulation and Dysregulation. J. Affect. Disord. 2000, 61, 201–216. [Google Scholar] [CrossRef] [Scilit]
  15. You, M.; Laborde, S.; Borges, U.; Vaughan, R.S.; Dosseville, F. Cognitive Failures: Relationship with Perceived Emotions, Stress, and Resting Vagally-Mediated Heart Rate Variability. Sustainability 2021, 13, 13616. [Google Scholar] [CrossRef] [Scilit]
  16. De Brito, J.N.; Pope, Z.C.; Mitchell, N.R.; Schneider, I.E.; Larson, J.M.; Horton, T.H.; Pereira, M.A. The Effect of Green Walking on Heart Rate Variability: A Pilot Crossover Study. Environ. Res. 2020, 185, 109408. [Google Scholar] [CrossRef] [Scilit]
  17. Barros, A.; Pereira, F.; Rudnicki, K.; Van Renterghem, T.; Machado, D.; Kampen, J.K.; Decorte, P.; Poels, K.; Sousa, E.; Freitas, E.; et al. Psychophysiological Stress Response to Urban Traffic: The Effect of Speed Limits, Road Surface Type, and Greenery. Build. Environ. 2025, 277, 112921. [Google Scholar] [CrossRef] [Scilit]
  18. Shao, H.; Liu, Y.; Ren, H.; Li, Z. Research on Healing-Oriented Street Design Based on Quantitative Emotional Electroencephalography and Eye-Tracking Technology. Front. Hum. Neurosci. 2025, 19, 1546933. [Google Scholar] [CrossRef] [Scilit] [PubMed]
  19. Ghamari, H.; Golshany, N.; Naghibi Rad, P.; Behzadi, F. Neuroarchitecture Assessment: An Overview and Bibliometric Analysis. Eur. J. Investig. Health Psychol. Educ. 2021, 11, 1362–1387. [Google Scholar] [CrossRef] [Scilit] [PubMed]
  20. Zhao, M.; Crossley, T.; Shinohara, H. The Implications of EEG Neurophysiological Data in Human-Centered Architectural Design: A Systematic Review and Bibliometric Analysis. J. Environ. Psychol. 2025, 103, 102550. [Google Scholar] [CrossRef] [Scilit]
  21. Taherysayah, F.; Malathouni, C.; Liang, H.-N.; Westermann, C. Virtual Reality and Electroencephalography in Architectural Design: A Systematic Review of Empirical Studies. J. Build. Eng. 2024, 85, 108611. [Google Scholar] [CrossRef] [Scilit]
  22. Llinares, C.; Nolé, M.L.; Pérez-Martínez, M.; Barranco-Merino, R.; Higuera-Trujillo, J.L. An Exploratory Neuroarchitecture Study: Emotional Responses to Residential Spaces Using Psychological and Physiological Indicators. VITRUVIO 2025, 10, e24201. [Google Scholar] [CrossRef] [Scilit]
  23. Ojha, V.K.; Griego, D.; Kuliga, S.; Bielik, M.; Bus, P.; Schaeben, C.; Treyer, L.; Standfest, M.; Schneider, S.; Konig, R.; et al. Machine Learning Approaches to Understand the Influence of Urban Environments on Human’s Physiological Response. Inf. Sci. 2019, 474, 154–169. [Google Scholar] [CrossRef] [Scilit]
  24. Fernandes, J.V.M.R.; Alexandria, A.R.D.; Marques, J.A.L.; Assis, D.F.D.; Motta, P.C.; Silva, B.R.D.S. Emotion Detection from EEG Signals Using Machine Deep Learning Models. Bioengineering 2024, 11, 782. [Google Scholar] [CrossRef] [Scilit] [PubMed]
  25. Topic, A.; Russo, M. Emotion Recognition Based on EEG Feature Maps through Deep Learning Network. Eng. Sci. Technol. Int. J. 2021, 24, 1442–1454. [Google Scholar] [CrossRef] [Scilit]
  26. Huang, Z.; Ma, Y.; Wang, R.; Li, W.; Dai, Y. A Model for EEG-Based Emotion Recognition: CNN-Bi-LSTM with Attention Mechanism. Electronics 2023, 12, 3188. [Google Scholar] [CrossRef] [Scilit]
  27. Du, X.; Ma, C.; Zhang, G.; Li, J.; Lai, Y.-K.; Zhao, G.; Deng, X.; Liu, Y.-J.; Wang, H. An Efficient LSTM Network for Emotion Recognition From Multichannel EEG Signals. IEEE Trans. Affect. Comput. 2022, 13, 1528–1540. [Google Scholar] [CrossRef] [Scilit]
  28. Kim, Y.; Choi, A. EEG-Based Emotion Classification Using Long Short-Term Memory Network with Attention Mechanism. Sensors 2020, 20, 6727. [Google Scholar] [CrossRef] [Scilit]
  29. Firdou, T.B.; Ashra, M.; Kalpan, A.V. Deep Learning-Based Emotion Recognition Using CNN, LSTM for Multimodal Text, Speech, and Facial Analysis. In Proceedings of the 2024 5th International Conference on Data Intelligence and Cognitive Informatics (ICDICI), Tirunelveli, India, 18–20 November 2024; IEEE: New York, NY, USA, 2024; pp. 1291–1295. [Google Scholar]
  30. Siirtola, P.; Tamminen, S.; Chandra, G.; Ihalapathirana, A.; Röning, J. Predicting Emotion with Biosignals: A Comparison of Classification and Regression Models for Estimating Valence and Arousal Level Using Wearable Sensors. Sensors 2023, 23, 1598. [Google Scholar] [CrossRef] [Scilit]
  31. Jeon, J.Y.; Hong, J.Y. Classification of Urban Park Soundscapes through Perceptions of the Acoustical Environments. Landsc. Urban. Plan. 2015, 141, 100–111. [Google Scholar] [CrossRef] [Scilit]
  32. Sun, C.; Meng, Q.; Yang, D.; Wu, Y. Soundwalk Path Affecting Soundscape Assessment in Urban Parks. Front. Psychol. 2023, 13, 1096952. [Google Scholar] [CrossRef] [Scilit]
  33. ISO 12913-2; Acoustics Soundscape Part 2: Data Collection and Reporting Requirements. The International Organization for Standardization: Geneva, Switzerland, 2018.
  34. Alvarsson, J.J.; Wiens, S.; Nilsson, M.E. Stress Recovery during Exposure to Nature Sound and Environmental Noise. Int. J. Environ. Res. Public Health 2010, 7, 1036–1046. [Google Scholar] [CrossRef] [Scilit]
  35. Pise, A.W.; Rege, P.P. Comparative Analysis of Various Filtering Techniques for Denoising EEG Signals. In Proceedings of the 2021 6th International Conference for Convergence in Technology (I2CT), Maharashtra, India, 2–4 April 2021; IEEE: New York, NY, USA, 2021; pp. 1–4. [Google Scholar]
  36. Delorme, A.; Makeig, S. EEGLAB: An Open Source Toolbox for Analysis of Single-Trial EEG Dynamics Including Independent Component Analysis. J. Neurosci. Methods 2004, 134, 9–21. [Google Scholar] [CrossRef] [Scilit]
  37. Sanei, S.; Chambers, J. EEG Signal Processing; John Wiley & Sons: Chichester, UK; Hoboken, NJ, USA, 2007. [Google Scholar]
  38. Webster, J.G.; Nimunkar, A.J. (Eds.) Medical Instrumentation: Application and Design, 5th ed.; Wiley: Hoboken, NJ, USA, 2020. [Google Scholar]
  39. Fritsch, F.N.; Carlson, R.E. Monotone Piecewise Cubic Interpolation. SIAM J. Numer. Anal. 1980, 17, 238–246. [Google Scholar] [CrossRef] [Scilit]
  40. Welch, P. The Use of Fast Fourier Transform for the Estimation of Power Spectra: A Method Based on Time Averaging over Short, Modified Periodograms. IEEE Trans. Audio Electroacoust. 1967, 15, 70–73. [Google Scholar] [CrossRef] [Scilit]
  41. Pan, J.; Tompkins, W.J. A Real-Time QRS Detection Algorithm. IEEE Trans. Biomed. Eng. 1985, BME-32, 230–236. [Google Scholar] [CrossRef] [Scilit] [PubMed]
  42. Elgendi, M. Fast QRS Detection with an Optimized Knowledge-Based Method: Evaluation on 11 Standard ECG Databases. PLoS ONE 2013, 8, e73557. [Google Scholar] [CrossRef] [Scilit] [PubMed]
  43. Zidelmal, Z.; Amirou, A.; Ould-Abdeslam, D.; Moukadem, A.; Dieterlen, A. QRS Detection Using S-Transform and Shannon Energy. Comput. Methods Programs Biomed. 2014, 116, 1–9. [Google Scholar] [CrossRef] [Scilit]
  44. Castaldo, R.; Melillo, P.; Pecchia, L. Acute Mental Stress Assessment via Short Term HRV Analysis in Healthy Adults: A Systematic Review. In 6th European Conference of the International Federation for Medical and Biological Engineering; Lacković, I., Vasic, D., Eds.; IFMBE Proceedings; Springer International Publishing: Cham, Switzerland, 2015; Volume 45, pp. 1–4. [Google Scholar]
  45. Shaffer, F.; Ginsberg, J.P. An Overview of Heart Rate Variability Metrics and Norms. Front. Public Health 2017, 5, 258. [Google Scholar] [CrossRef] [Scilit]
  46. Munoz, M.L.; Van Roon, A.; Riese, H.; Thio, C.; Oostenbroek, E.; Westrik, I.; De Geus, E.J.C.; Gansevoort, R.; Lefrandt, J.; Nolte, I.M.; et al. Validity of (Ultra-)Short Recordings for Heart Rate Variability Measurements. PLoS ONE 2015, 10, e0138921. [Google Scholar] [CrossRef] [Scilit]
  47. Yao, Y.; Liang, Z.; Yuan, Z.; Liu, P.; Bie, Y.; Zhang, J.; Wang, R.; Wang, J.; Guan, Q. A Human-Machine Adversarial Scoring Framework for Urban Perception Assessment Using Street-View Images. Int. J. Geogr. Inf. Sci. 2019, 33, 2363–2384. [Google Scholar] [CrossRef] [Scilit]
  48. Kraskov, A.; Stoegbauer, H.; Grassberger, P. Estimating Mutual Information. Phys. Rev. E 2004, 69, 066138. [Google Scholar] [CrossRef] [Scilit]
  49. Croux, C.; Dehon, C. Influence Functions of the Spearman and Kendall Correlation Measures. Stat. Methods Appl. 2010, 19, 497–515. [Google Scholar] [CrossRef] [Scilit]
  50. Cohen, I.; Huang, Y.; Chen, J.; Benesty, J. Noise Reduction in Speech Processing; Springer Topics in Signal Processing; Springer: Berlin/Heidelberg, Germany, 2009; Volume 2. [Google Scholar]
Disclaimer/Publisher’s Note: The statements, opinions and data contained in all publications are solely those of the individual author(s) and contributor(s) and not of MDPI and/or the editor(s). MDPI and/or the editor(s) disclaim responsibility for any injury to people or property resulting from any ideas, methods, instructions or products referred to in the content.

Article Metrics

Citations

Article Access Statistics

Multiple requests from the same IP address are counted as one view.