1. Introduction
With the continuous advancement of urbanization, building volume has steadily increased, leading to a significant increase in energy consumption within buildings. Excessive energy use causes more environmental problems, which hinder the development of sustainable, environmentally friendly societies. Therefore, it is essential to enhance buildings’ energy efficiency, reduce their fossil fuel consumption, and lower their carbon emission intensity. In the building sector, air conditioning systems are gradually becoming the primary energy consumers due to the growing demand for environmental comfort. Survey findings indicate that building energy consumption accounts for 36% of global energy use and contributes to 39% of global carbon emissions [
1]. Heating, ventilation, and air conditioning (HVAC) systems consume approximately 25~65% of total building energy, generating one-third of total building carbon emissions [
2]; within HVAC systems, refrigeration accounts for a significant portion of the energy used [
3].
In China, building operational energy consumption has exceeded 1.06 billion tons of standard coal equivalents. Electricity demand for cooling during hot seasons is especially significant, accounting for 50% of the population’s peak power demand [
4,
5]. Therefore, there is an urgent need to develop energy-efficient technologies that reduce building loads, improve the energy efficiency of buildings, and promote sustainable development. Utilizing natural cooling sources (geothermal sources, water sources, air sources, space cooling sources, etc.) is an effective method of increasing the energy efficiency of cooling systems in buildings. These sources can provide natural cooling and serve as heat sinks to replace or supplement conventional air conditioning systems. Han et al. [
6] proposed a novel dedicated outdoor air system (DOAS) equipped with a heat-source tower and a wellbore heat exchanger that achieves space cooling and dehumidification solely by utilizing geothermal energy. During the cooling season, the system’s average coefficient of performance (COP) improves from 6.1 to 8.7, achieving energy savings of 123% and 26% compared to air-source heat pumps and ground-source heat pumps, respectively. Ning et al. [
7] proposed a hybrid system that integrates solar photovoltaic-thermal (PV-T) modules with an air-source heat pump (ASHP). Compared to a conventional photovoltaic system, this hybrid system achieved an average cooling efficiency of 45.02% and increased the overall energy utilization efficiency from 5.68% to 17.76%. Radiative sky cooling (RSC) technology is an effective cooling method that harnesses the cold energy of deep space. By leveraging the high transmittance of the atmosphere in the 8~13 µm wavelength band (commonly known as the “atmospheric window”), it dissipates heat in the form of infrared radiation into the vast natural heat sink of outer space, thereby lowering its own temperature. RSC systems utilize selective radiant coating materials to cool the surfaces of objects and employ radiative coolers to generate chilled water/air. Under a clear sky, radiative sky coolers have a cooling capacity of 50~100 W/m
2 [
8], making them an ideal cold source for building systems.
RSC materials include photonic crystal structures, multilayer film structures, and random medium structures. Their radiative properties require high emissivity within the “atmospheric window”. Early research primarily focused on nighttime radiation [
9,
10,
11], while recent advancements in daytime radiative cooling materials have significantly advanced the practical applications of this technology [
12,
13]. Li et al. [
14] developed a high-performance radiative cooler centered on a porous PVDF/TEOS composite film incorporating SiO
2. This device achieved approximately 97% solar reflectance and an average cooling power of 61 W/m
2 in humid regions with a peak solar intensity of 1000 W/m
2. Using phase inversion technology, Mandal et al. [
15] successfully fabricated a P(VdF-HFP)HP coating with a hierarchical porous structure. This material exhibited a solar reflectance of 96% and achieved a cooling power of approximately 96.61 W/m
2 across varying solar intensities. Raman et al. [
16] developed a multilayer membrane consisting of seven alternating layers capable of achieving a daytime radiative cooling temperature 5 °C below ambient temperature under direct sunlight, with a net cooling power of approximately 40.1 W/m
2.
Due to the significant contribution of the building envelope to indoor cooling loads during hot summers, constructing high-performance building envelopes is an important strategy for reducing building energy consumption. In recent years, the application of radiative sky cooling (RSC) technology to building envelopes has attracted considerable attention from scholars and engineers. Xuan et al. [
17] applied RSC materials to rooftops to enhance thermal performance during the cooling season and improve building energy efficiency. Compared to conventional roofs, those coated with radiation-cooling paint achieved maximum external temperature reductions of 21.1 °C, resulting in an average energy savings rate of 49.42% (equivalent to 1108.74 kWh). Meng et al. [
18] coated windows with a transparent bilayer coating comprising a near-infrared reflective underlayer and a mid-to-far-infrared emissive top layer, achieving a reduction of 49 MJ/m
2 in annual building cooling load and significantly lowering the building energy demand.
Compared to passive energy-saving building envelopes, the integration of active building envelopes with RSC technology offers greater flexibility and broader applicability. As an energy-efficient active building envelope technology, the pipe-embedded wall system circulates cold or hot water through pre-embedded pipes within the wall to heat or cool the wall structure, thereby effectively reducing heat exchange between indoor and outdoor environments [
19]. Unlike traditional insulation materials that rely on high thermal resistance to slow the rate and intensity of heat transfer indoors, the pipe-embedded wall system actively captures and removes heat to the outdoors, eliminating the wall’s intrinsic heat gain and effectively preventing heat ingress. During the cooling season, cold water for the wall system can be supplied by heat pumps, cooling towers, or other natural means, such as RSC. Kisilewicz et al. [
20] confirmed that embedding pipes in walls and directly connecting them to ground heat exchangers can significantly reduce heat lost through the building envelope. During cold periods, this approach achieved a minimum heat loss reduction of 50% and an instantaneous peak reduction of 81%, with average energy savings exceeding those of standard insulation measures by 63%. Based on the features of the pipe-embedded wall system, RSC technology can be effectively integrated with this structure to facilitate energy conservation and carbon reduction in buildings. By producing cold water, the cooling capacity of the RSC system prevents the intrusion of outdoor heat through the wall. Shen et al. [
21] proposed a novel PCM wall system integrated with microchannel heat pipes (MHPs) and radiative sky cooling (RSC) panels, referred to as the “MHP-RSC-PCM wall”. Their study demonstrated that the cooling load of the MHP-RSC-PCM wall was approximately 25% lower than that of a brick wall of equivalent thickness and about 42% lower under ideal conditions.
In analyzing its applicability, the energy-saving potential of RSC technology is a crucial evaluation metric. Accurate and effective predictions of energy performance are essential. Actual energy performance is significantly influenced by various environmental parameters, including outdoor air temperature, humidity, wind speed, and cloud cover [
22,
23]. Zhu et al. [
24] calculated the nationwide radiative cooling potential using data from 271 meteorological stations across China. Their results indicate that for ideal radiative surfaces, the annual average radiative cooling potential in most regions ranges from approximately 70 to 100 W/m
2 under clear-sky conditions and from about 40 to 55 W/m
2 under all-weather conditions. Geographically, the annual average cooling power exceeds 100 W/m
2 in western regions and is approximately 50 W/m
2 in southeastern regions. Vila et al. [
25] assessed the space cooling potential of RSC technology in European regions, finding that the summer cooling power could reach approximately 69.6 W/m
2 in all-weather applications, representing the highest cooling potential.
Although these studies analyzed the cooling capacity of RSC technology in different regions, its actual potential for energy conservation remains unclear. Cooling demand varies significantly across climate zones worldwide due to their distinct meteorological characteristics. Additionally, how RSC technology is integrated with building systems influences its energy-saving effectiveness. For building envelopes, some of the cooling energy generated by the RSC cooler or system may escape without being fully utilized indoors; in contrast, air conditioning units typically apply their energy directly to the indoor air. Therefore, to accurately assess the potential of RSC technology in building systems, it is necessary to take into consideration specific application methods and climate characteristics.
Current traditional physical models for wall systems, such as numerical models [
26] and simplified RC models [
27], can achieve accurate predictions. However, they are limited by their low computational efficiency and difficulties in multi-physics coupling, which hinder their application for large-scale and long-term predictions. Consequently, in this study, the steady-state RDH method proposed in Reference [
28] was adopted. Because this method has only been applied to structures like windows, its applicability to wall systems, which have significant thermal inertia, requires further validation.
This study was conducted to assess the global energy-saving potential of a composite wall system. To achieve this, an innovative assessment framework is proposed, focusing on the predictive analysis of radiative sky cooling technology integrated with a pipe-embedded wall system. Building cooling demand is analyzed based on global climate characteristics and meteorological data from various regions. A radiative sky cooling (RSC) model and revised degree-hour energy efficiency evaluation model are developed. Utilizing meteorological data, this evaluation model enables the rapid and accurate prediction of the energy-saving and carbon reduction potential of the composite wall system in different regions. Further, considering the influence of other factors (solar radiation, ambient radiation, and sky-view factor) on the prediction results, the influence of the temperature uncertainty of the cold water provided by the radiative cooler on the system’s energy-saving potential is analyzed. This work provides prediction tools and reference data for the design and application of an integrated cooling system.
2. Global Climate Regions and Cooling Demand
Due to diverse geographical locations and climatic conditions, meteorological characteristics and cooling demand vary significantly by climate zone, and the energy-saving potential of RSC technology in building systems differs accordingly. For example, in China, cities are classified into five major climate zones based on climatic characteristics. The meteorological parameters and required cooling periods/months vary across these climate zones [
29]. The required cooling months, monthly average temperatures, and outdoor peak temperatures of representative cities in the five zones are shown in
Table 1.
For some cities, i.e., Guangzhou and Wuhan, the outdoor temperatures are relatively high, and the cooling season lasts for an extended period. These cities generally experience significant building cooling loads. Moreover, despite having lower average monthly temperatures, Kunming and Harbin still require some cooling from June to August. This study also analyzes the energy-saving potential of RSC technology in these cities.
Globally, additional climatic zones have been delineated based on diverse climatic characteristics and geographical locations, as shown in
Table 2. The duration of cooling demand and the monthly average temperatures for cities within these zones exhibit corresponding variations. Since frost and tundra climate zones experience severe cold year-round, eliminating the need for cooling, this study analyzed the application potential of a pipe-embedded wall system combined with RSC technology in buildings across ten typical climate zones (the cities are marked in bold in
Table 2). The selection ensures the coverage of different latitudes, climate zones, and cooling demand levels. The goal is to assess the energy-saving potential of the pipe-embedded wall system integrated with radiative sky cooling under various climatic conditions.
The study used weather files (TMY) from the Meteonorm database to estimate the radiative cooling power of RSC technology. Meteonorm provides typical meteorological year data including temperature, humidity, cloud cover, and wind speed.
3. System Description and Methodology
3.1. Pipe-Embedded Wall System Coupled with RSC Technology
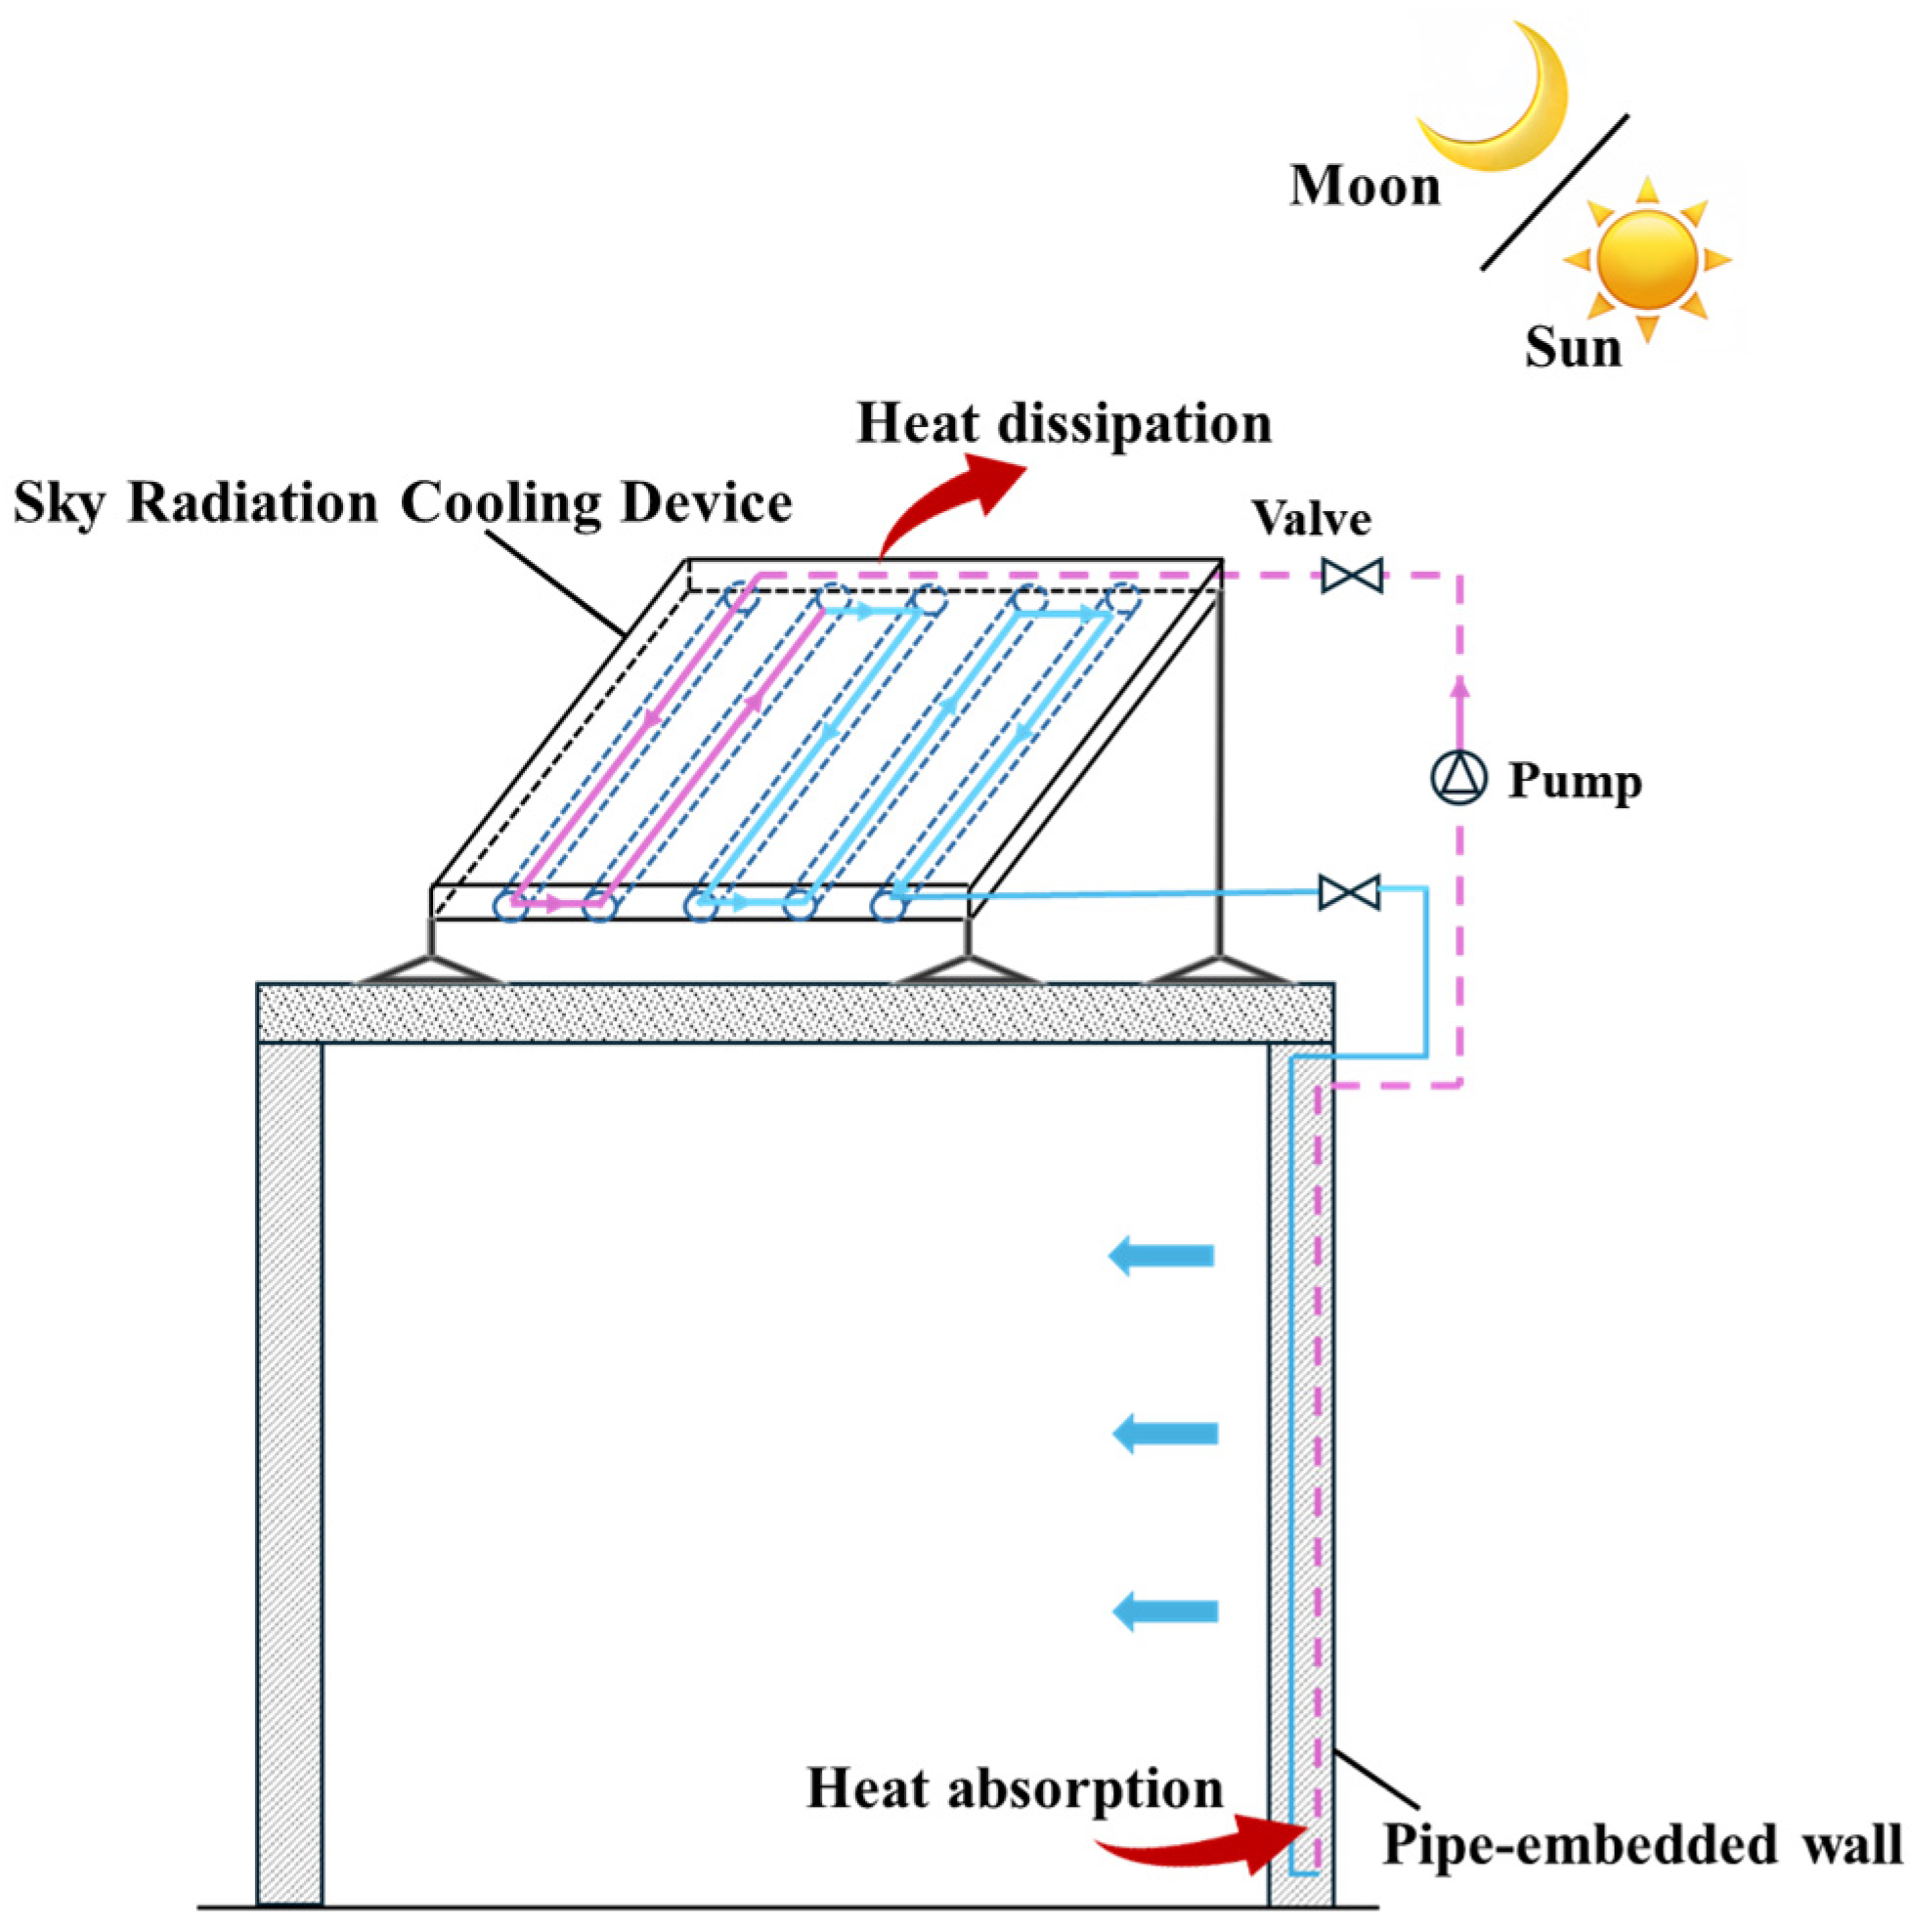
Figure 1 presents a schematic diagram of the integrated system, in which RSC technology is coupled with a pipe-embedded wall. The pipe is embedded within the wall structure, and cold water flows through it to absorb heat from the exterior. The RSC system cooler, which can be installed on the roof, produces cold water by utilizing longwave radiation in the “atmospheric window”. The circulation of cold water is maintained by a water pump. During the cooling season, the wall absorbs and stores heat from the surrounding environment due to high outdoor air temperatures and intense solar radiation. The cold water from the RSC cooler is then transported to the wall, where it absorbs the stored heat, preventing it from entering the indoor air. The RSC cooler is coated with selective radiant paint, which reflects solar radiation and facilitates longwave radiative cooling. By integrating the RSC cooler with the pipe-embedded wall, natural energy is harnessed to reduce the indoor cooling load. Additionally, when the temperature of the water supplied by the RSC cooler is sufficiently low, effective space cooling can also be achieved.
3.2. Heat Transfer Model of RSC System
In an RSC system, the outer surface exchanges the heat with the environment through convection and radiation, including convective heat exchange with the ambient air, solar radiation heat gain, and longwave radiation emitted through the atmospheric window. The corresponding heat flux is expressed by the following equation:
Here, Qcooler is the cooling power, Qsky is the radiative heat exchange between the cooler and the sky, Qcv is the convective heat exchange, Qsol is the solar radiative heat, and Qamb is the radiative heat exchange between the cooler and the ambient surroundings, W.
In this study, a high-reflectance assumption is adopted based on the advanced technological foundation of existing radiative cooling materials. For example, Li et al. [
14] developed a metamaterial achieving a solar reflectance of 96%, and Raman et al. [
16] reported a multilayer photonic structure with a solar reflectance of 97%; both materials demonstrated stable daytime cooling. Therefore, to predict the system’s maximum energy-saving potential, this study’s proposed method neglects solar heat gain. Additionally, Zhao et al. [
30] proposed that for horizontal or slightly tilted surfaces, radiative heat exchange occurs only among the cooling surface, the atmosphere, and the Sun, so the effect of ambient heat exchange (
Qamb) can be neglected. For radiative sky cooling applications, it is generally acceptable to assume the surface is horizontally oriented toward the sky to obtain the maximum cooling capacity. Under these conditions, the cooling capacity of the unit is primarily determined by radiative heat dissipation through sky radiation and convective heat exchange with the surrounding environment. The solar heat gain is neglected. The energy-saving effect of the pipe-embedded wall depends primarily on the temperature of the cold water produced by the RSC cooler. A lower water temperature results in diminished sky radiation cooling capacity while the negative impact of heat gain from environmental convection becomes more pronounced, reducing the cooling power. Conversely, excessively high water temperatures limit the system’s energy-saving effectiveness within the wall structure. Therefore, an ideal equilibrium water temperature exists, which can be determined using Equations (2) and (3). Provided that the radiative cooler possesses sufficient surface area and an extremely high heat exchange efficiency, the minimum achievable cold water temperature can be calculated using the aforementioned equations.
Here,
εrad is the emissivity of the cooling device, taken as 0.9 in this study.
Qra,Tw_lowest and
Qcv,Tw_lowest are the radiative heat transfer and convective heat transfer of the radiative cooling device at its lowest temperature, respectively. σ is the Stefan–Boltzmann constant.
Tamb is the ambient temperature, and
Tsky is the effective sky radiation temperature, which varies and can be calculated according to the ambient temperature and effective sky emissivity using Formulas (4)–(6).
hair is the convective air convective heat transfer coefficient, calculated using Equation (7) [
31].
Here, Cₐ is the cloud amount coefficient, and nc is the cloud factor. εsky is the effective sky emissivity, which is calculated from the dew point temperature Tdew and varies with different climate conditions. Vwind is the wind speed.
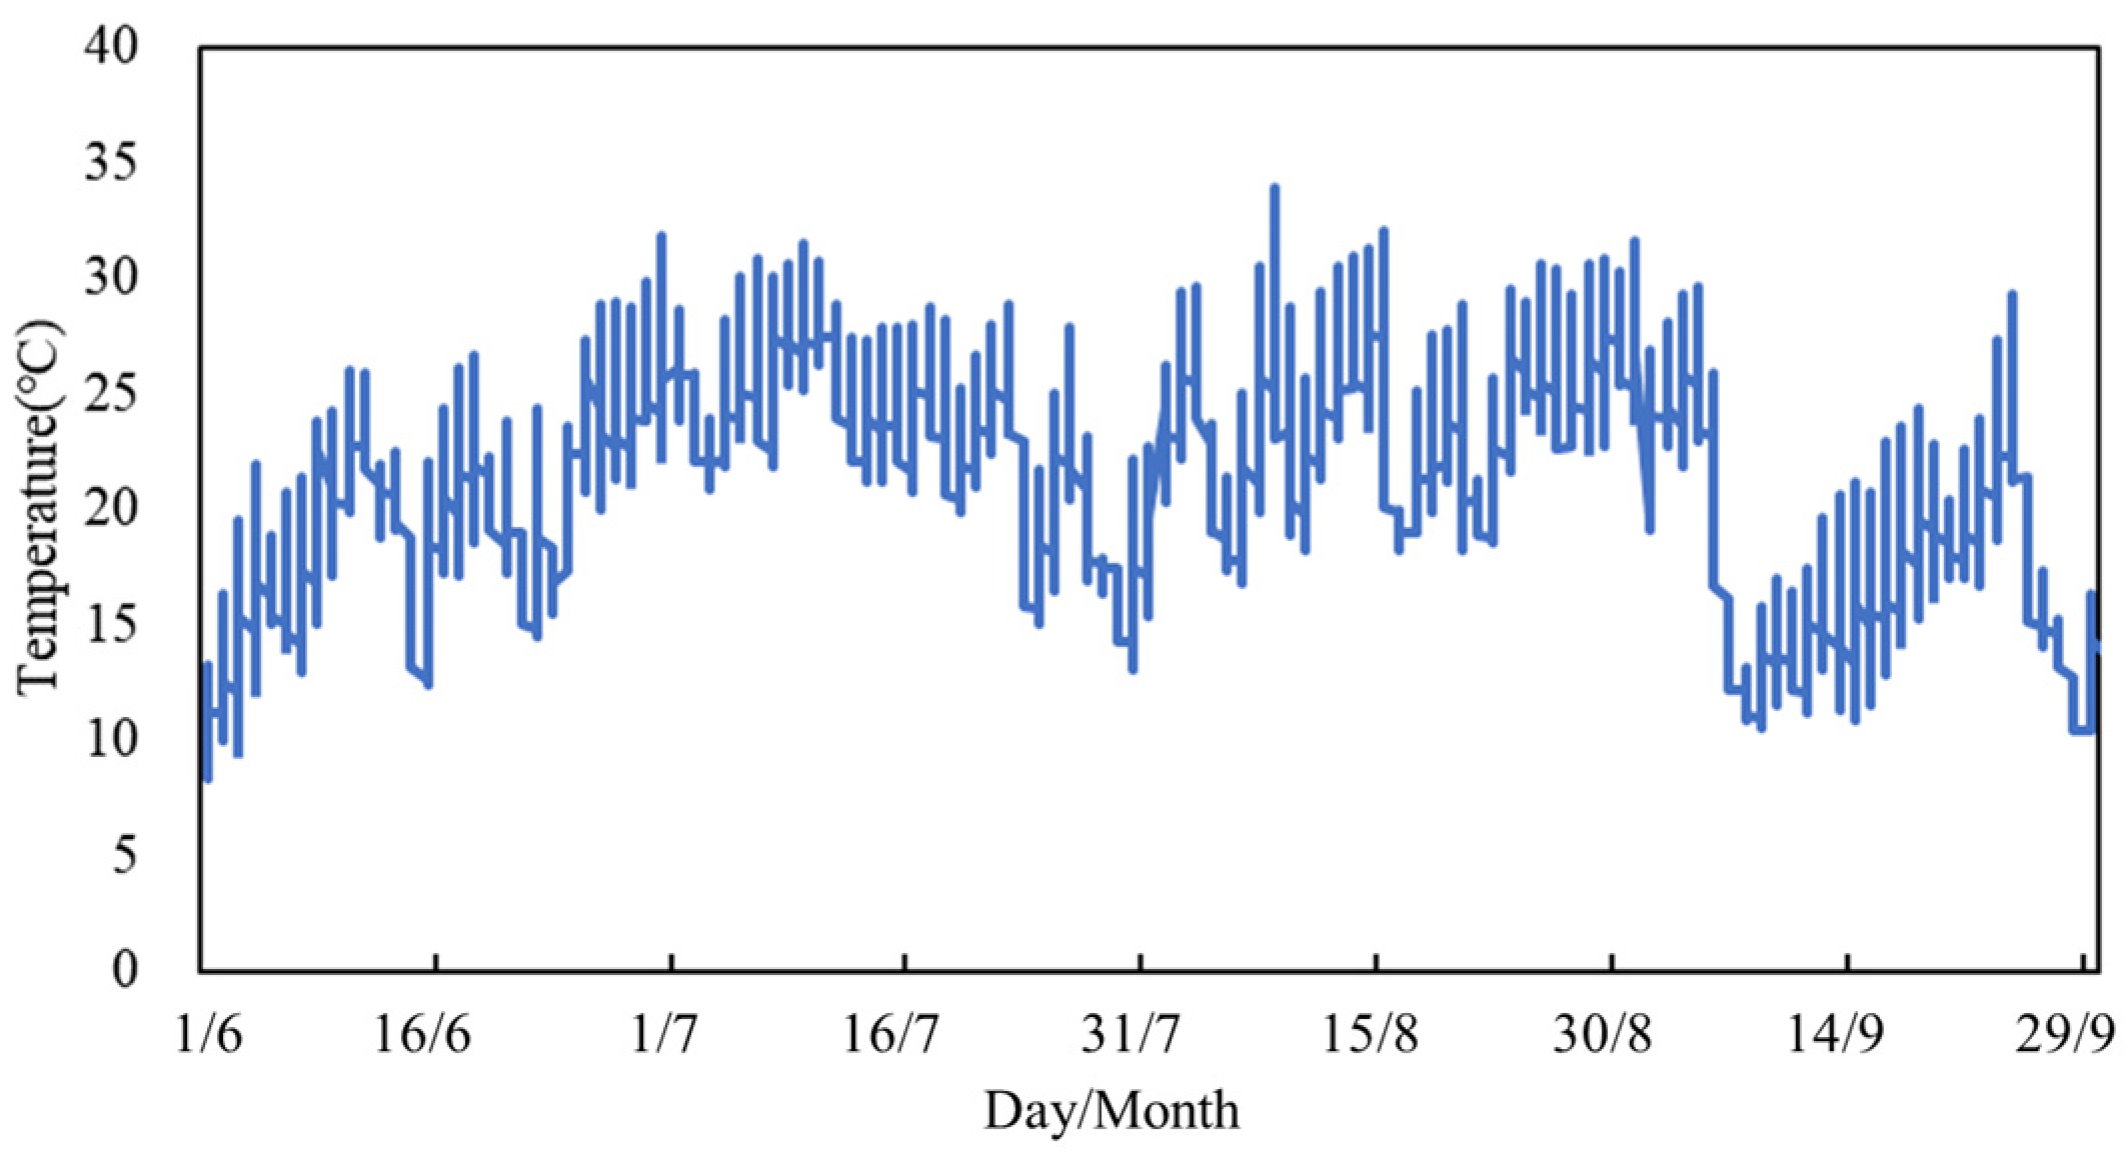
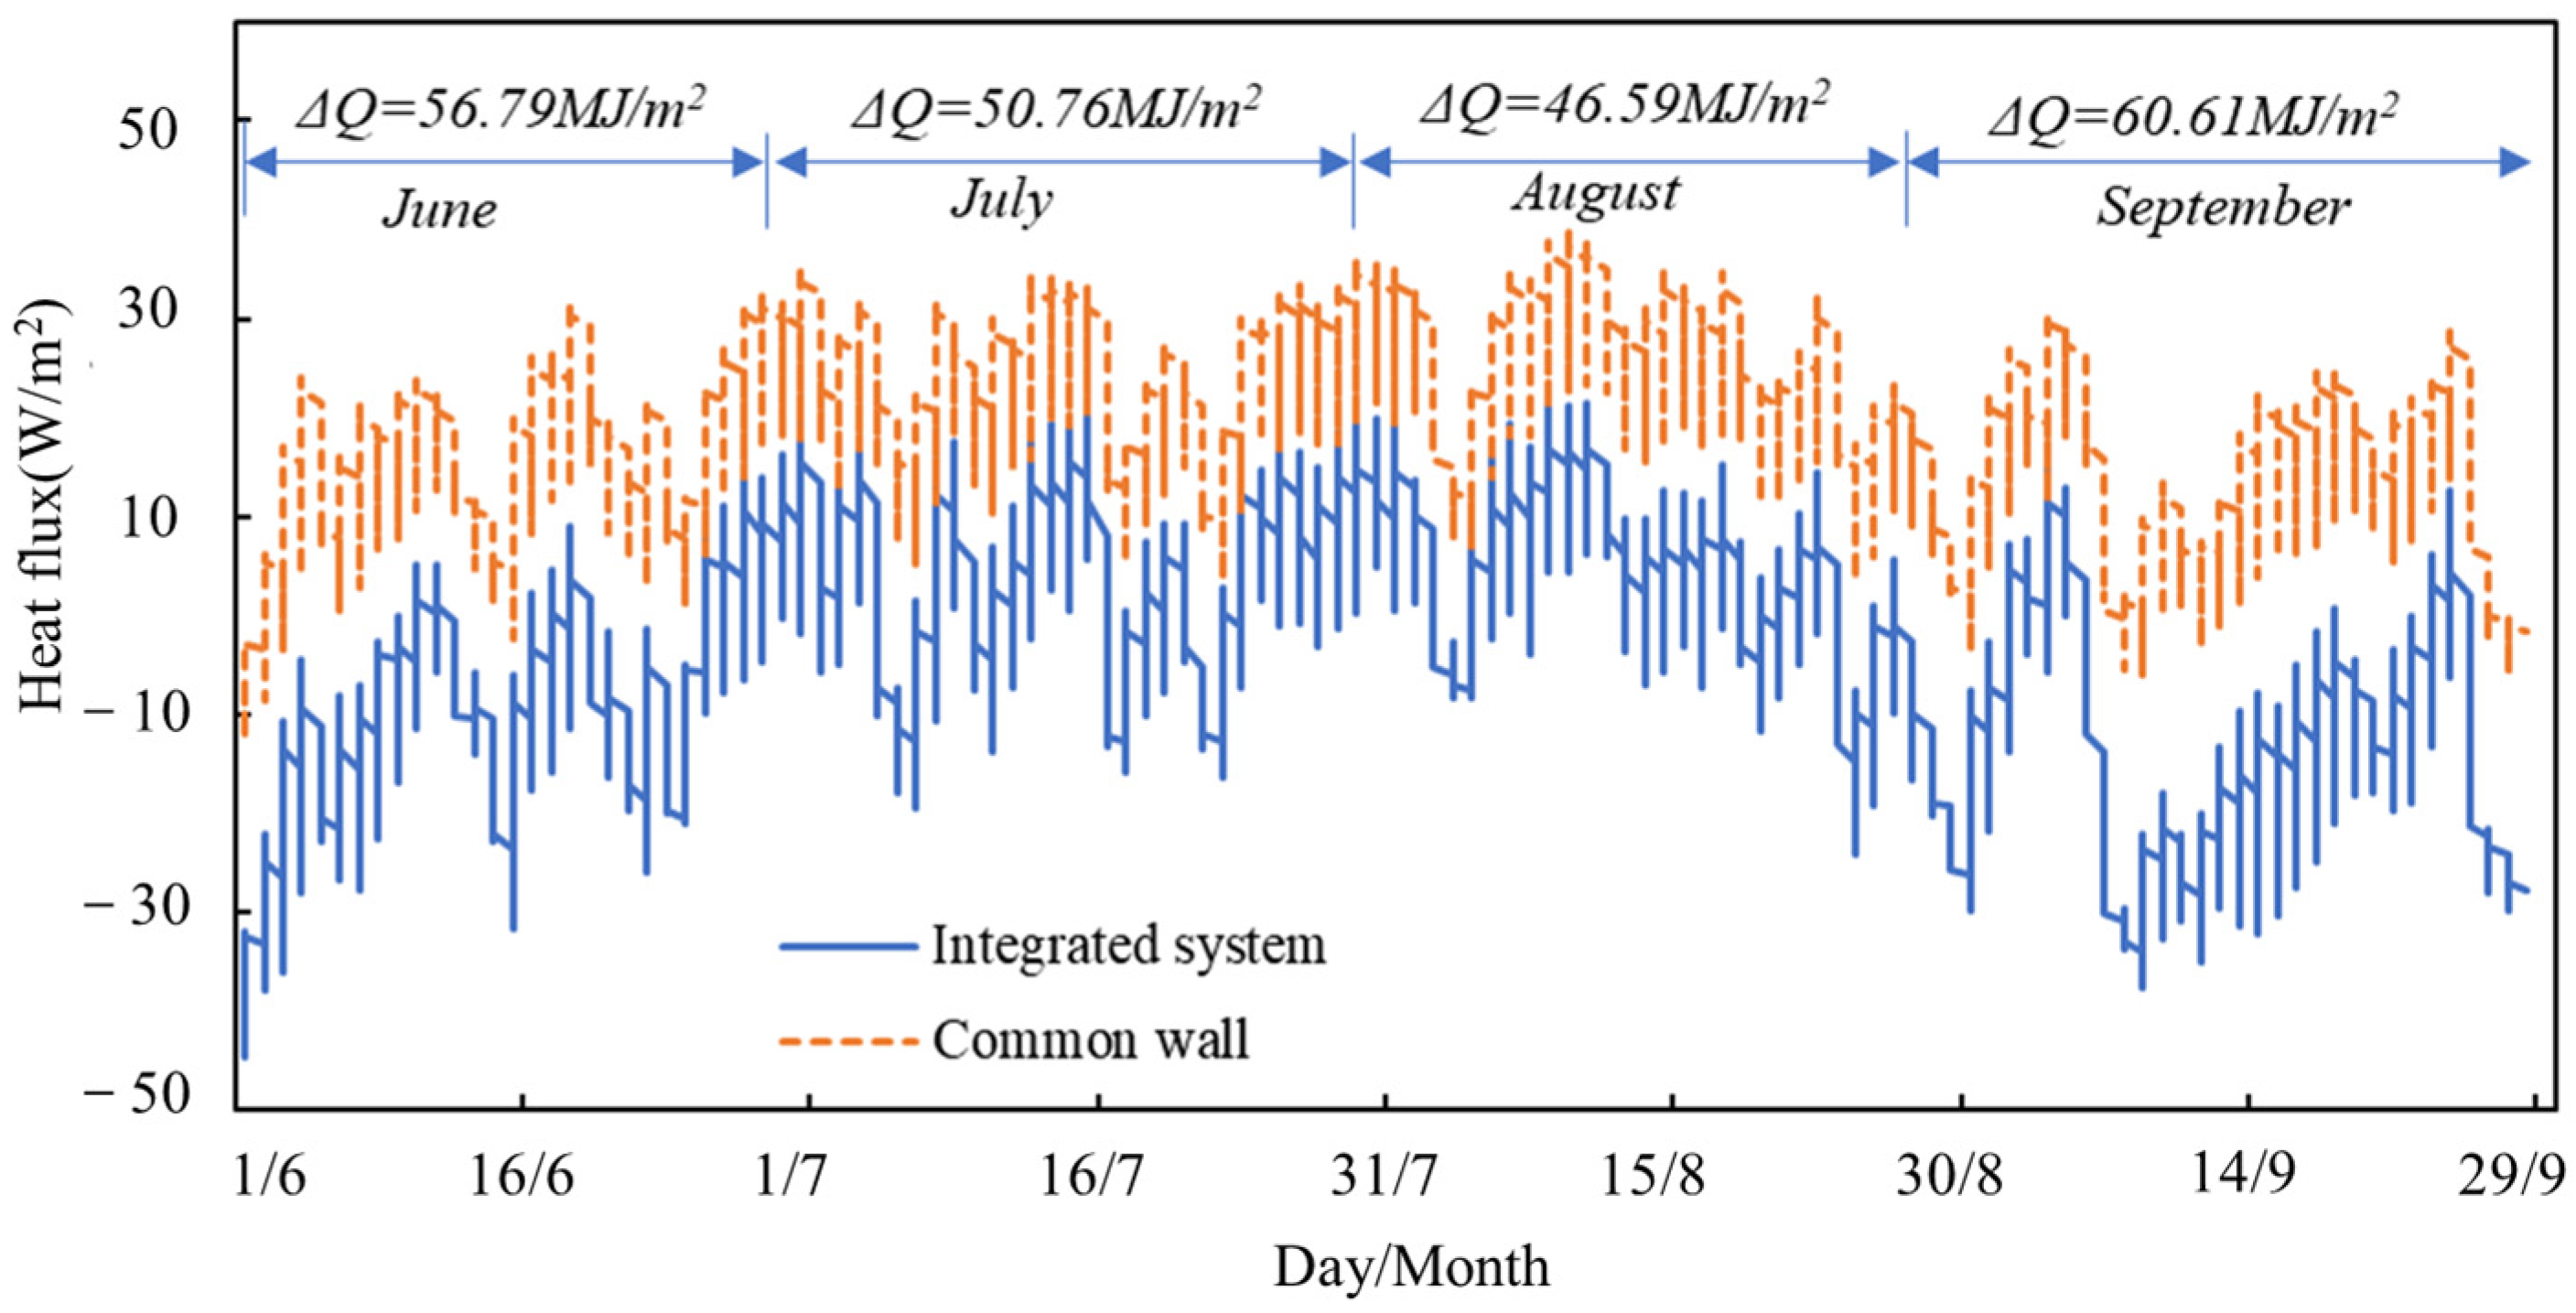
Taking Wuhan City as an example, summer temperatures (June to September) range from 25 °C to 40 °C, with relatively high humidity levels that are typically between 70% and 85%. Average cloud cover is relatively low during this period, resulting in frequent clear nights that promote longwave radiation cooling. Wind speeds are generally low, typically ranging from 1 to 3 m/s. Collectively, these boundary conditions influence the real-world performance of the integrated system. By combining Equations (2)–(7) and integrating urban meteorological data, the minimum temperature of the cold water produced by the RSC cooler can be calculated. The calculated cold-water temperature is shown in
Figure 2. From June to September, the water temperature fluctuates between 8 °C and 33 °C. Based on this water temperature data, the method proposed in the following section can be used to estimate the energy-saving potential of the coupled wall system.
3.3. Potential Estimation Method
The degree-hour method is commonly used to assess the energy-saving potential of natural ventilation, but it is difficult to apply directly to complex coupled wall systems. Wang et al. [
28] proposed a revised degree-hour (RDH) method that fully accounts for the potential of natural energy sources and how they are applied in buildings, making it well-suited for evaluating the energy-saving potential of the coupled wall system in this study. This method comprehensively evaluates the energy consumption impacts of both the building’s HVAC system and the system’s water pumps to estimate the overall energy-saving potential.
In this study, the RDH method is applied to estimate the potential of a pipe-embedded wall coupled with an RSC cooler. In buildings equipped with this coupled wall system, cooling energy consumption primarily comprises the electricity used by air conditioning units and water pumps, as well as the available natural cooling energy. Here, the RDH value represents the natural cooling energy potential, which can be calculated from the wall system temperature and the temperature of the cold water supplied by the RSC cooler, as shown in Equations (8) and (9). These formulas capture the combined effects of cooling capacity cost and cold-water temperature on the indoor environment. When the cold-water temperature is high, the natural cold source cannot cool the wall, resulting in an RDH value of zero. When the cost of cooling obtained from natural systems exceeds that of mechanical systems, the RDH is also zero, indicating that the integrated system has no energy-saving potential. The RDH value represents the utilization potential of natural cooling energy, considering how it is integrated. Its value depends on the difference between the basic temperature of the wall body and the temperature of the cold water produced by the RSC cooler, which are both determined by local environmental parameters. This method is applicable under different climatic conditions.
Here, RDH is the revised degree-hours for the cooling season, °C·h, and ηRSC is the effectiveness factor, which characterizes the cooling contribution of the cold water in the pipes to the indoor environment. The value is the ratio of cooling energy transferred into the indoor space through the wall structure to the cooling energy supplied by the cold water. It is related to the structural and material properties of the wall. Cs and Ce denote the start and end times of the cooling season, respectively; µi is a correction factor; ηRSC,i is the hourly effectiveness factor; QRSC,i is the indoor load handled by the sky radiation cooling device, in W; COPm is the coefficient of performance of the conventional air conditioning system; COPm,i and COPRSC,i are the hourly coefficients of performance for the conventional air conditioning system and the natural energy system, respectively; and λi is the ratio of the hourly heat exchange temperature difference to the reference temperature difference.
In this study, COPm is assumed to be 4; COPRSC is the coefficient of performance for the pipe-embedded wall utilizing natural energy under a reference heat exchange temperature difference ΔTref (e.g., 10 °C), which can be calculated using Equation (10).
Here, QRSC is the total indoor cooling capacity of the RSC system, W·h; Ppump is the pump power, W; t is the operating time; and Kequ is the equivalent heat transfer coefficient based on the heat transfer from the pipes to the wall, W/(m2·°C).
Determining the revised degree-hours for the integrated system requires the definition of two temperature parameters: tbase,i and tRSC,I. Here, tbase,i is the wall temperature, which equals the equivalent wall temperature considering heat transfer through the pipe, as shown in Equation (11). tRSC,i is the hourly water temperature, obtained through calculations using the RSC model described in the previous session. Specifically, when tRSC,i is higher than tbase,i, the revised degree-hour for this natural energy source is zero, meaning that it cannot provide cooling to the building.
Here, tin and tsol-air represent the indoor temperature and the outdoor sol-air temperature, respectively, in °C; Requ is the equivalent thermal resistance of the wall; and Rin,water and Rout,water are the thermal resistances from indoor air to the water in the pipe and from outdoor air to the water in the pipe, respectively.
Once the revised degree hours are determined, the energy-saving effect of the integrated system can be rapidly calculated using Equation (12).
Here, ΔE is the cooling energy saved per unit area of the system, in kWh/m2. The carbon emission reduction potential ΔCO2 of the wall system can be estimated using Equation (13).
Here,
fCO2 is the carbon emission factor. The
fCO2 of different regions can be obtained from the IEA [
32] and the Global Real-Time Carbon Data Monitoring website [
33], as detailed in
Table 3.
6. Discussion of Cold-Water Temperature Uncertainty
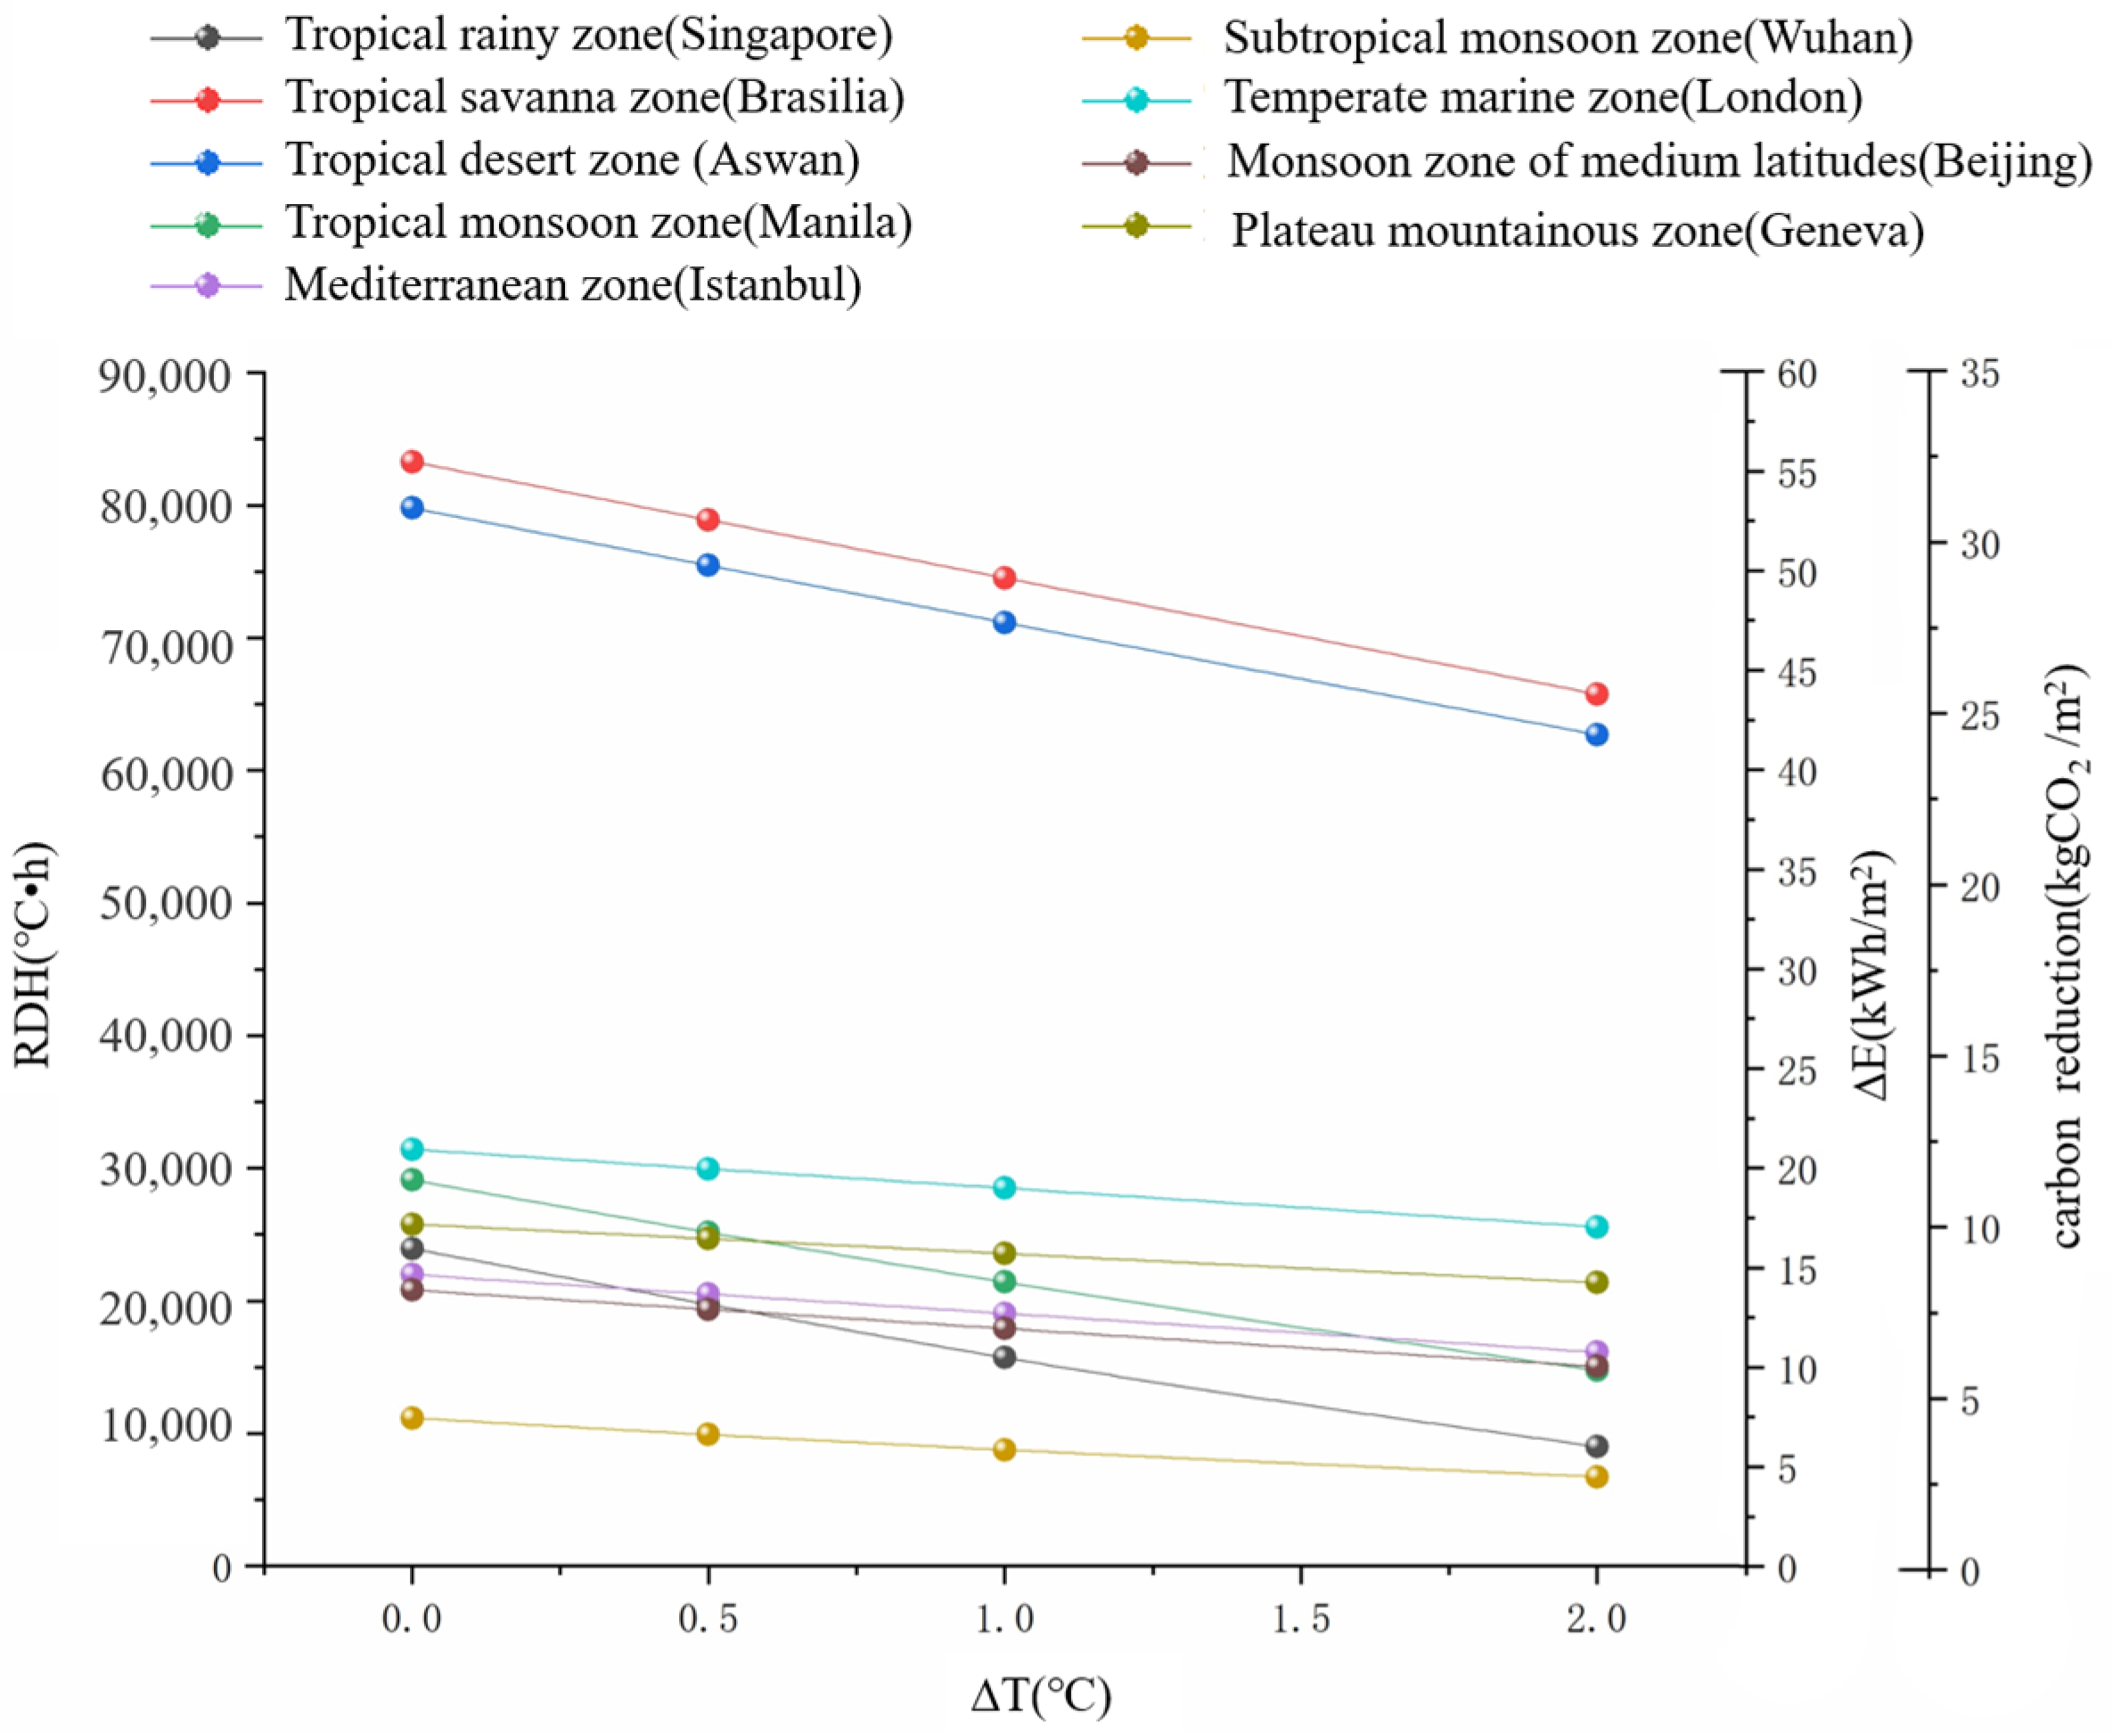
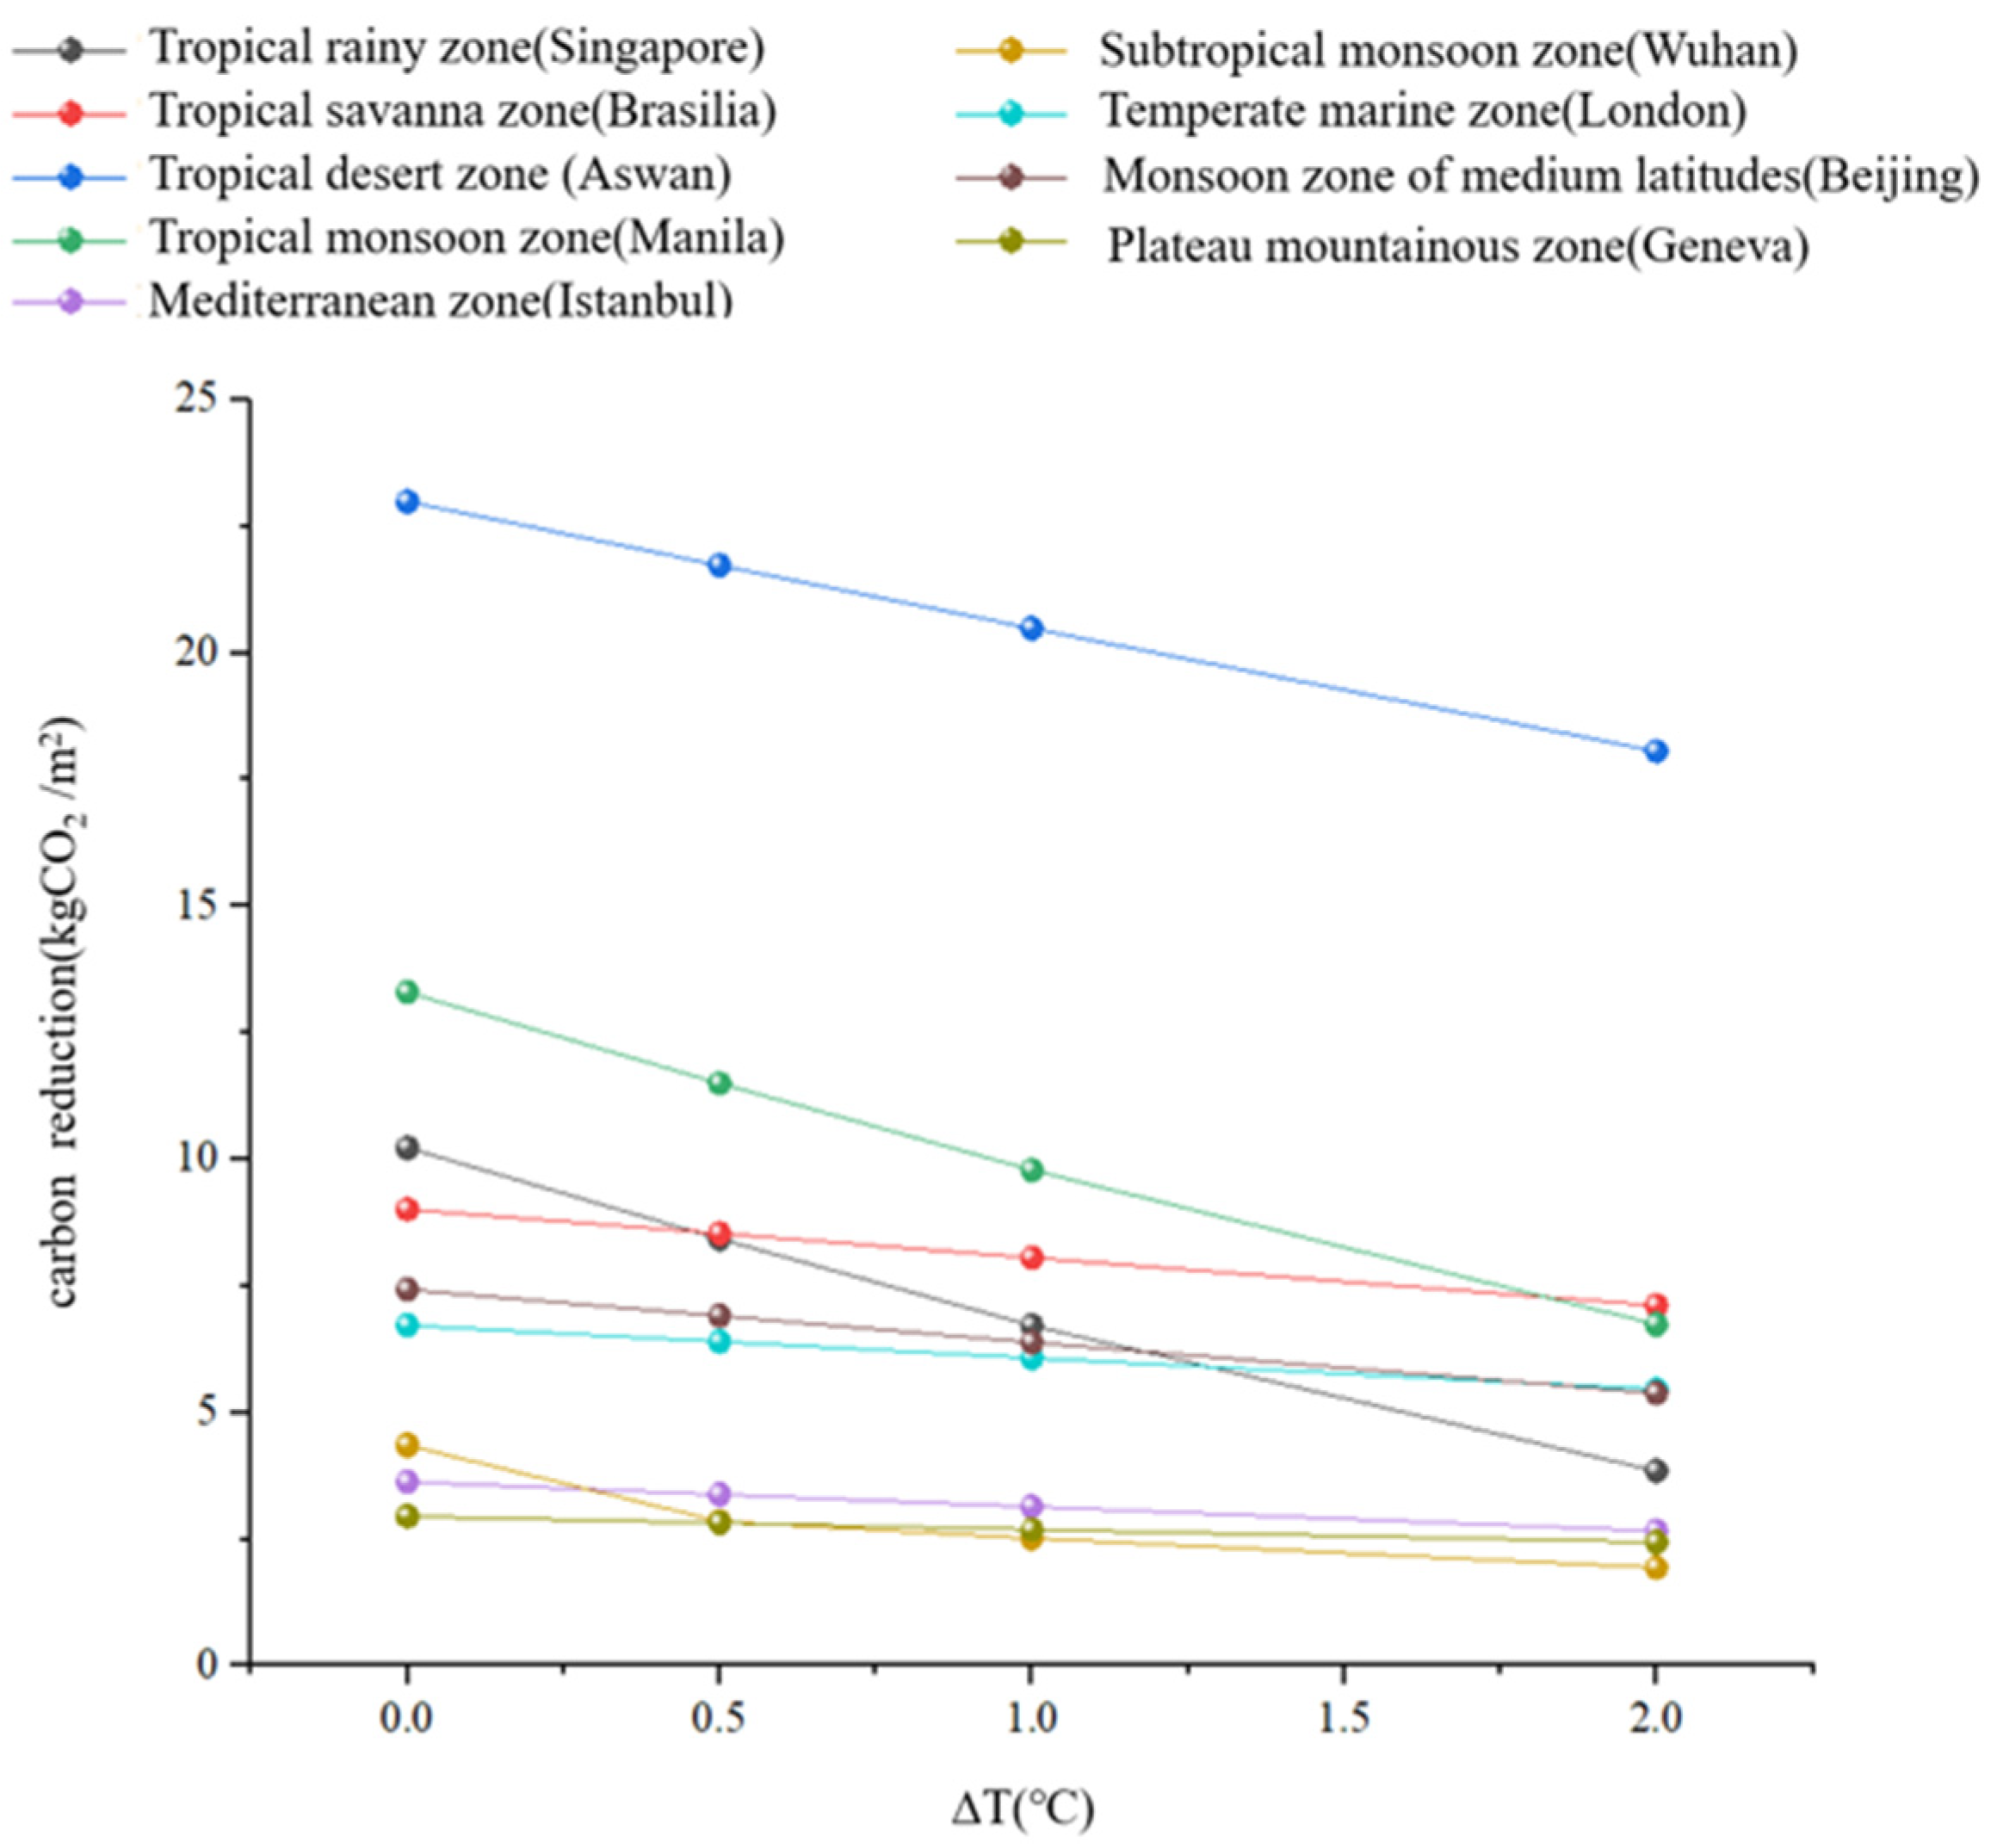
The energy-saving potential of RSC coupled with the pipe-embedded wall system is strongly affected by the temperature of the cold water produced by the RSC cooler. In addition to the radiant power of the cooler surface, the heat transfer capacity of the cooler is crucial for predicting the system energy savings. In practice, factors such as solar radiation, ambient longwave radiation exchange, building orientation, sky view factor, and urban shading can weaken the radiative cooling effect, resulting in a lower achievable cold-water temperature and causing theoretical predictions to generally exceed the predicted values. Therefore, when evaluating the energy-saving potential in this study, the potential increase in outlet water temperature caused by the above factors is accounted for, and the influence of the cold-water temperature is analyzed. For example, under typical summer conditions in Wuhan, when solar radiation is considered, the system’s outlet water temperature increases by approximately 1 to 2 °C compared to the scenario without radiation. In addition, the ambient longwave radiation exchange may weaken the cooling capacity of the RCS cooler, causing the cold-water temperature to increase. Thus, the impact of the RSC cooler’s heat exchange temperature increase (ΔT) on the evaluated energy-saving potential is also investigated. By establishing a system thermodynamic model and utilizing typical annual meteorological data from various regions, variation patterns of the system’s revised degree-hour (RDH), electrical energy savings (ΔE), and carbon emission reductions under different ΔT of 0 °C, 0.5 °C, 1 °C, and 2 °C are quantitatively analyzed.
Estimations with different Δ
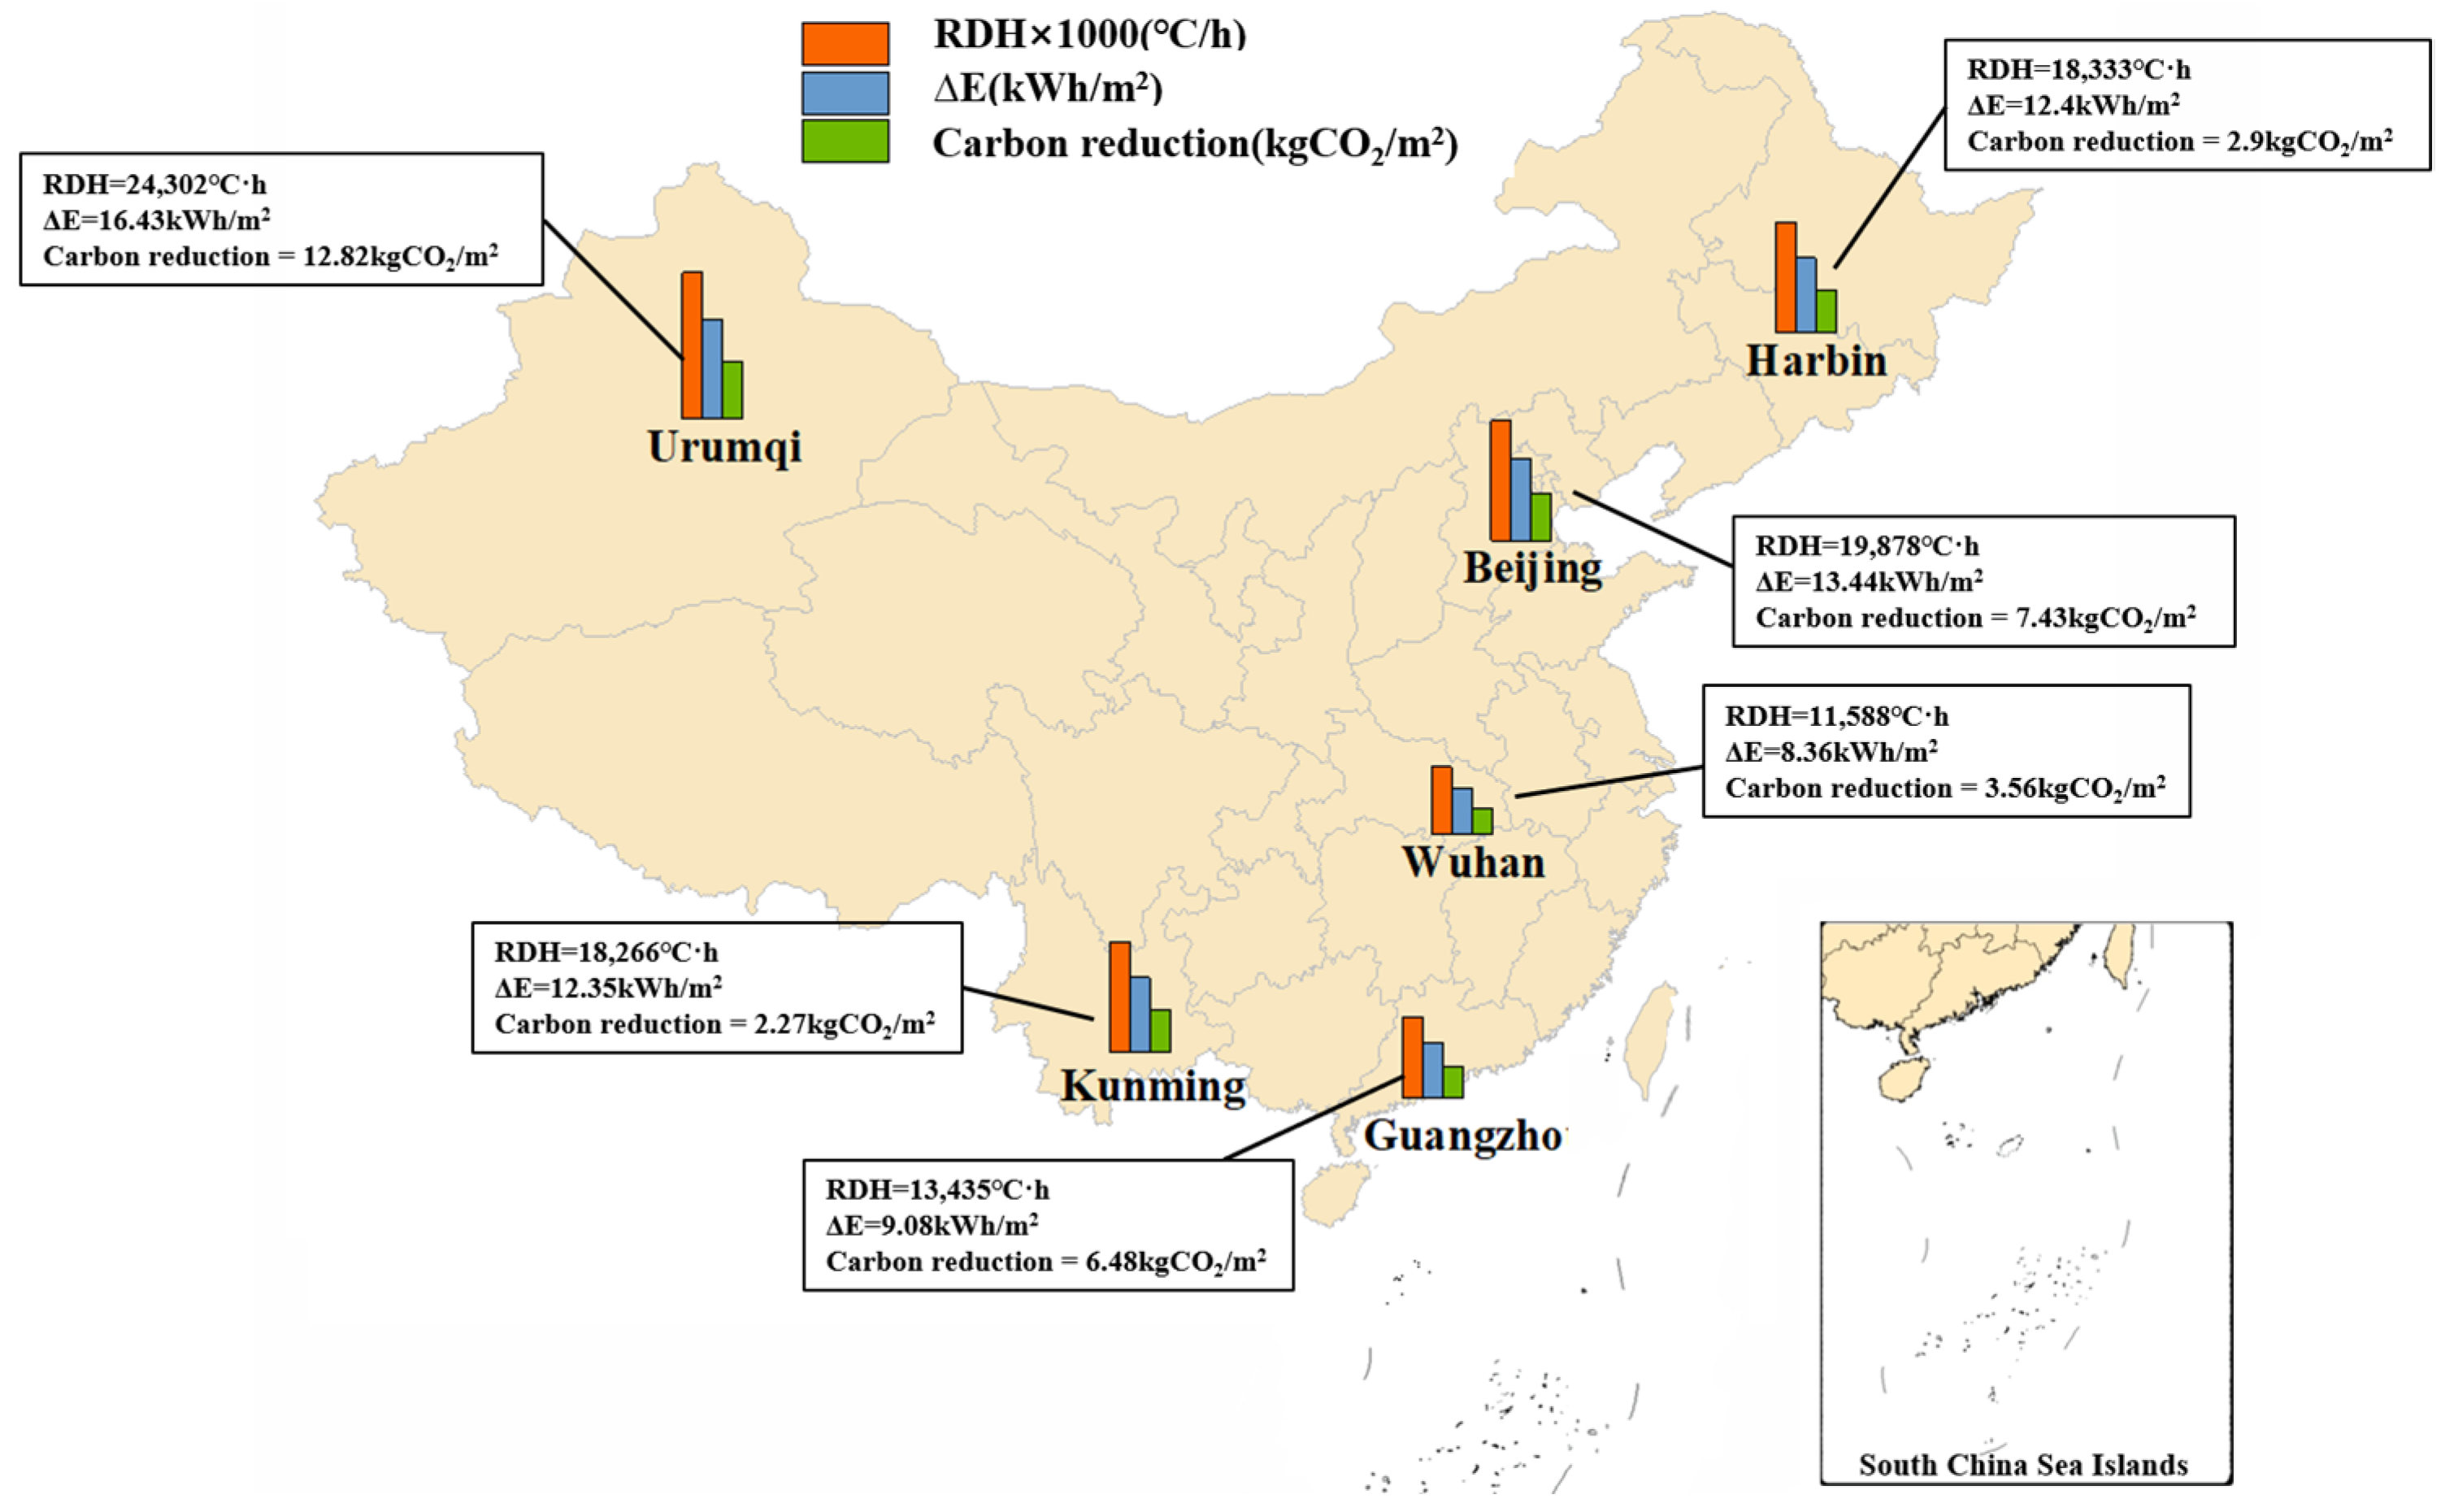
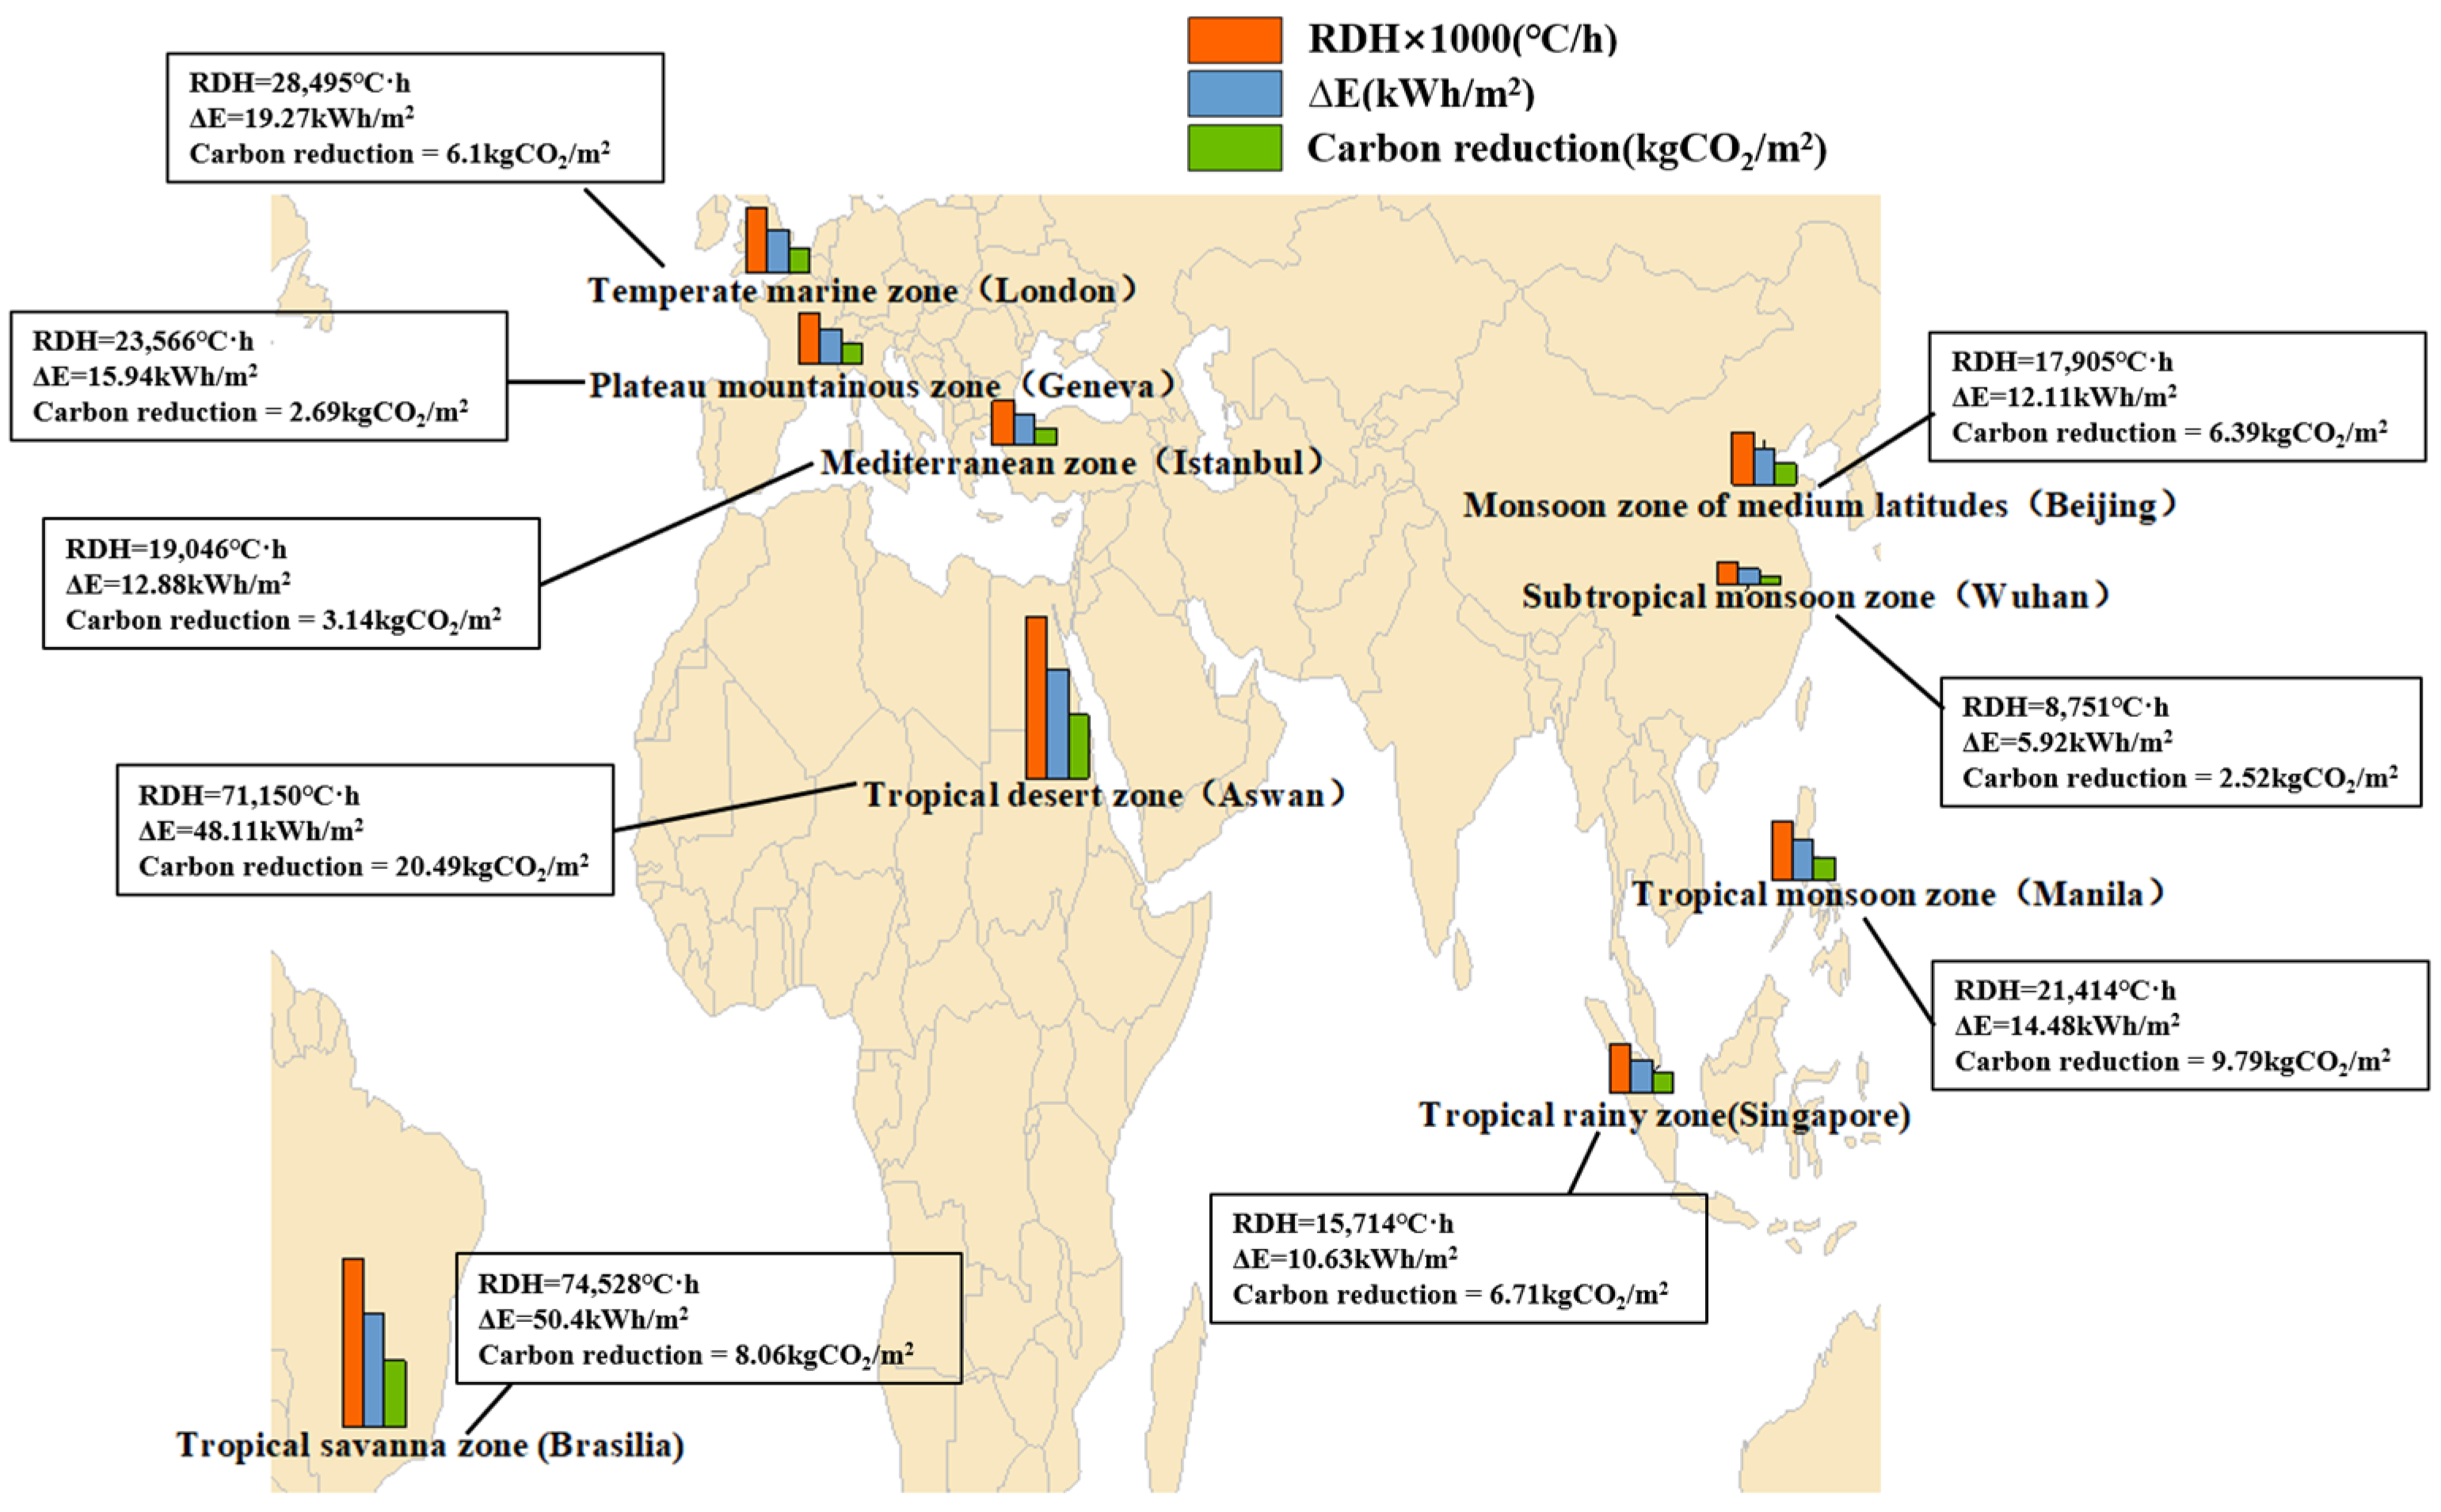
T values are presented in
Figure 6 and
Figure 7. Under ideal conditions (Δ
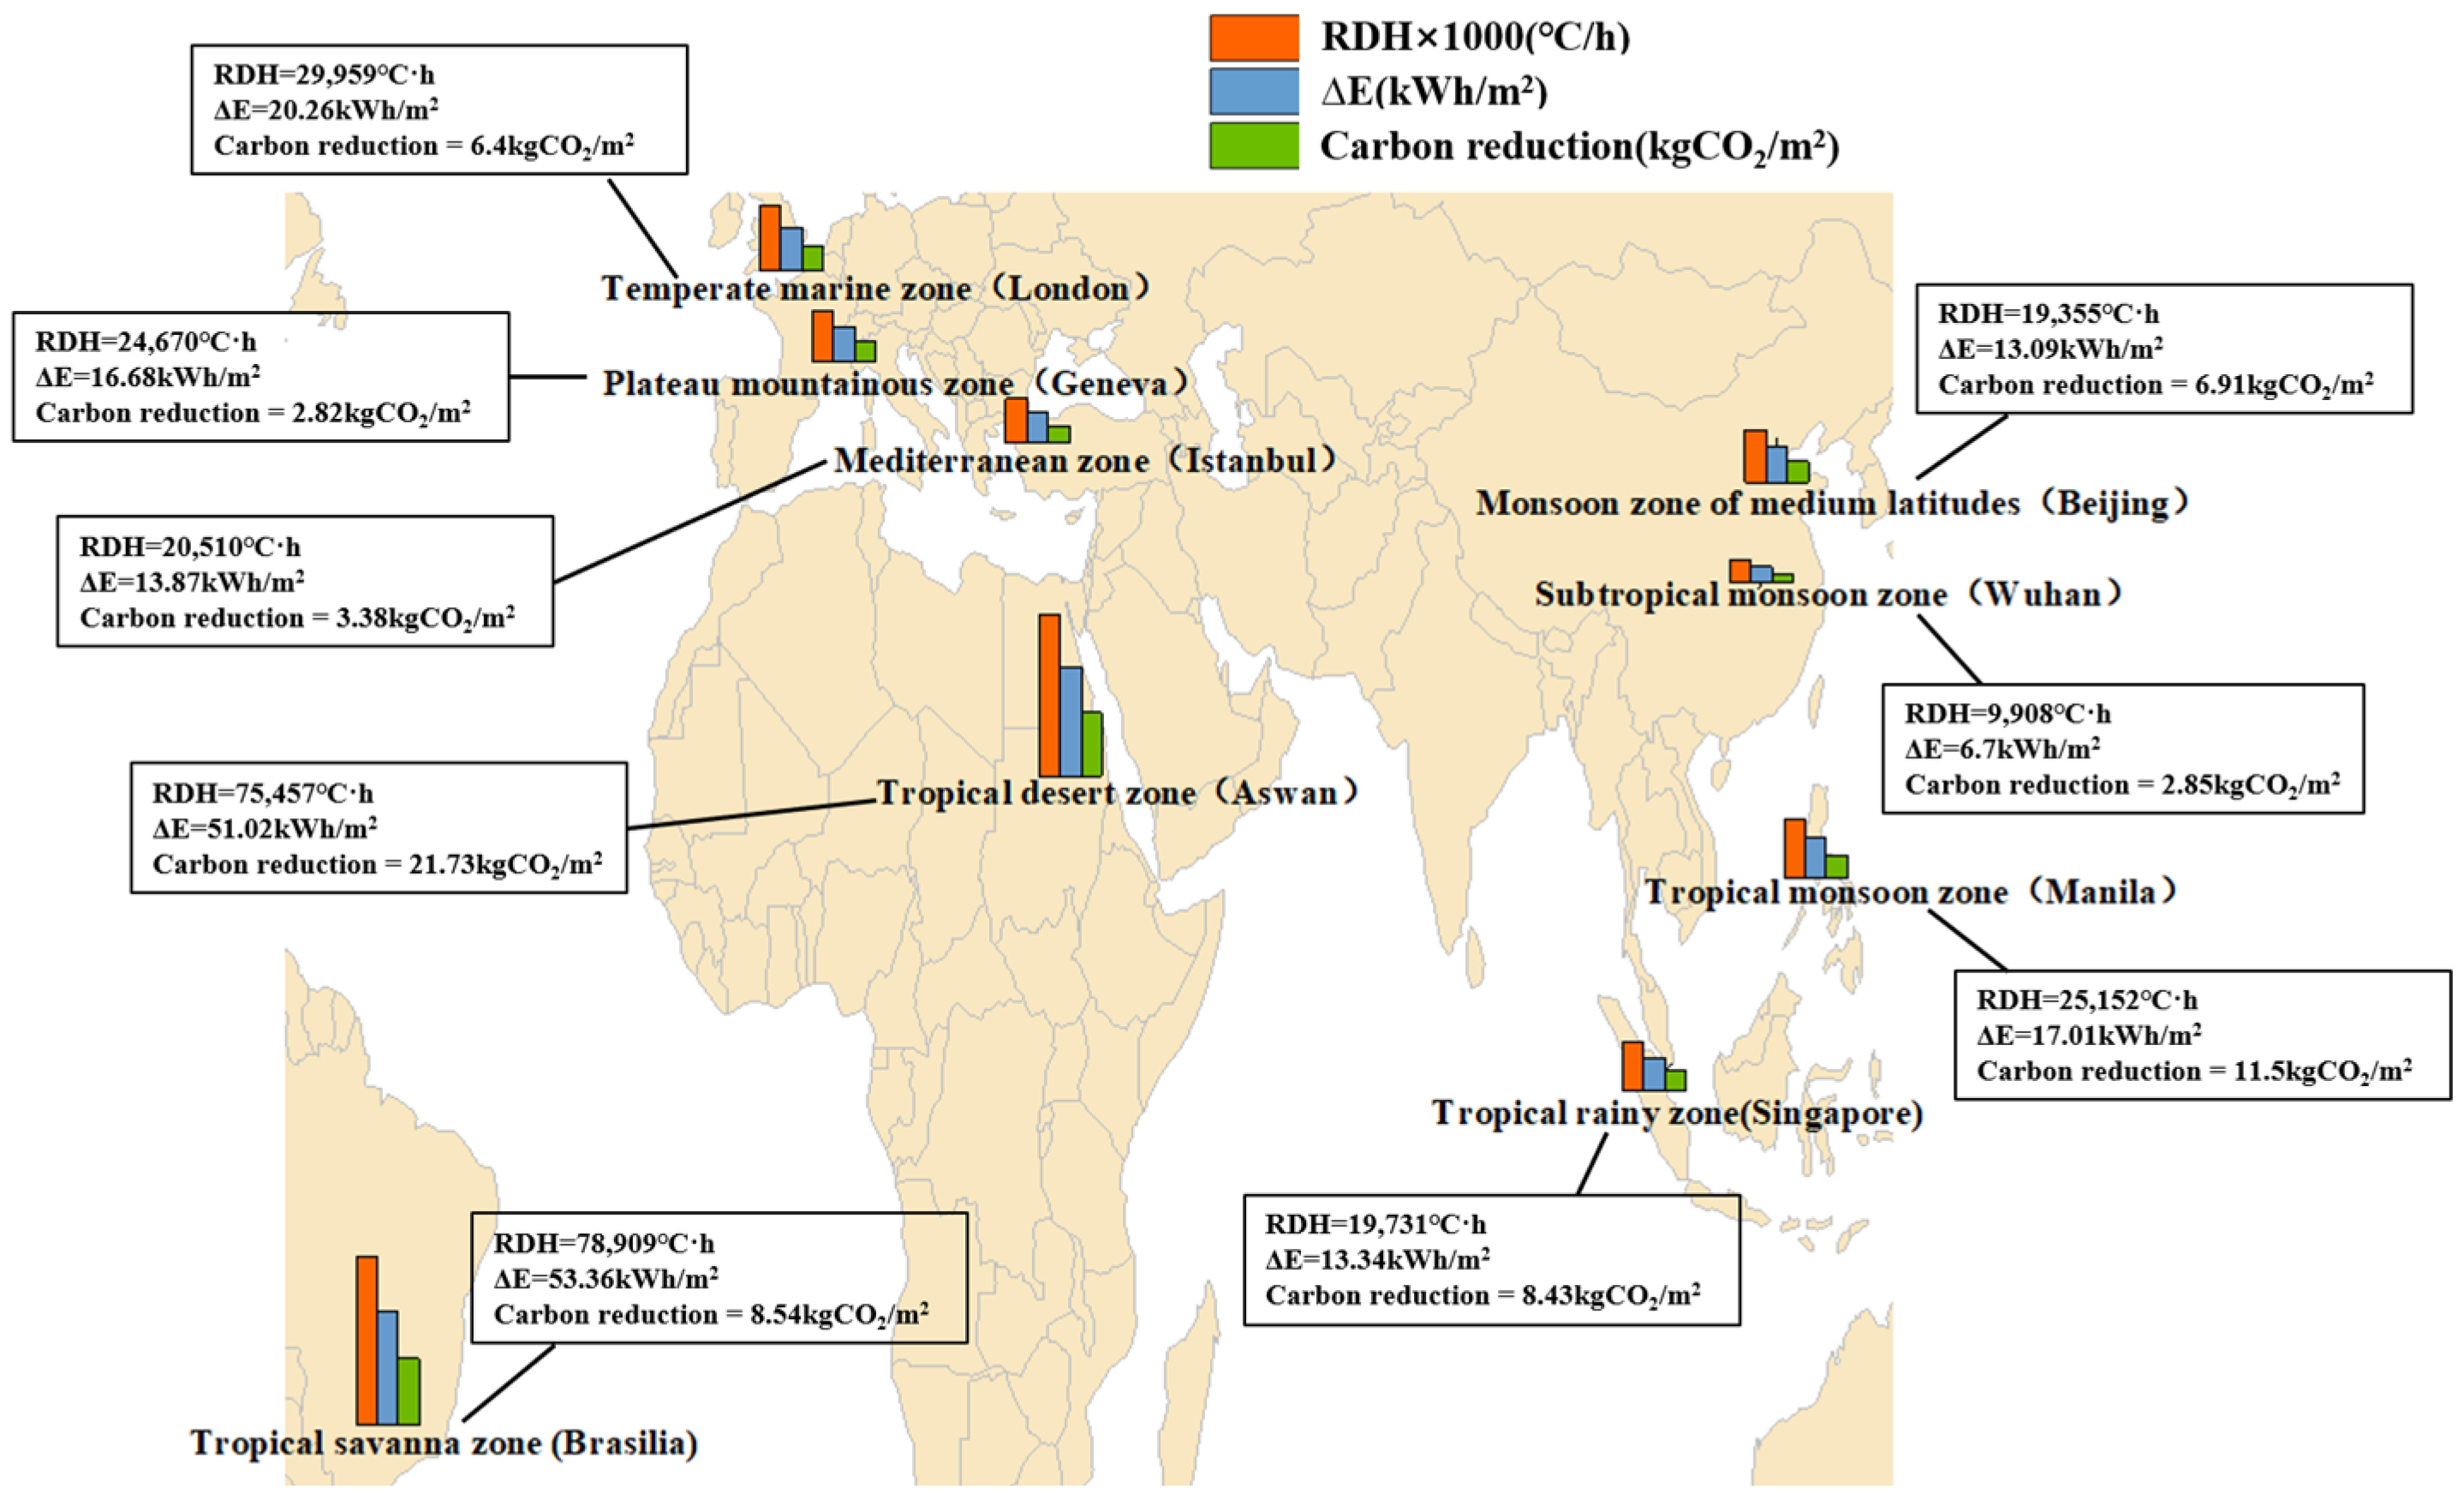
T = 0 °C), the energy-saving potential of the integrated system is maximized. Due to extremely low atmospheric humidity and consistently clear night skies, the energy-saving potential is high in tropical arid regions (Aswan, Egypt) and tropical savanna regions (Brasília, Brazil). In subtropical monsoon regions (Wuhan, China), the theoretical potential (Δ
E = 8.36 kWh/m
2) is significantly lower due to high humidity, frequent cloud cover, and elevated nighttime temperatures during summer. As the heat exchange temperature difference increases, the potential for energy saving gradually decreases.
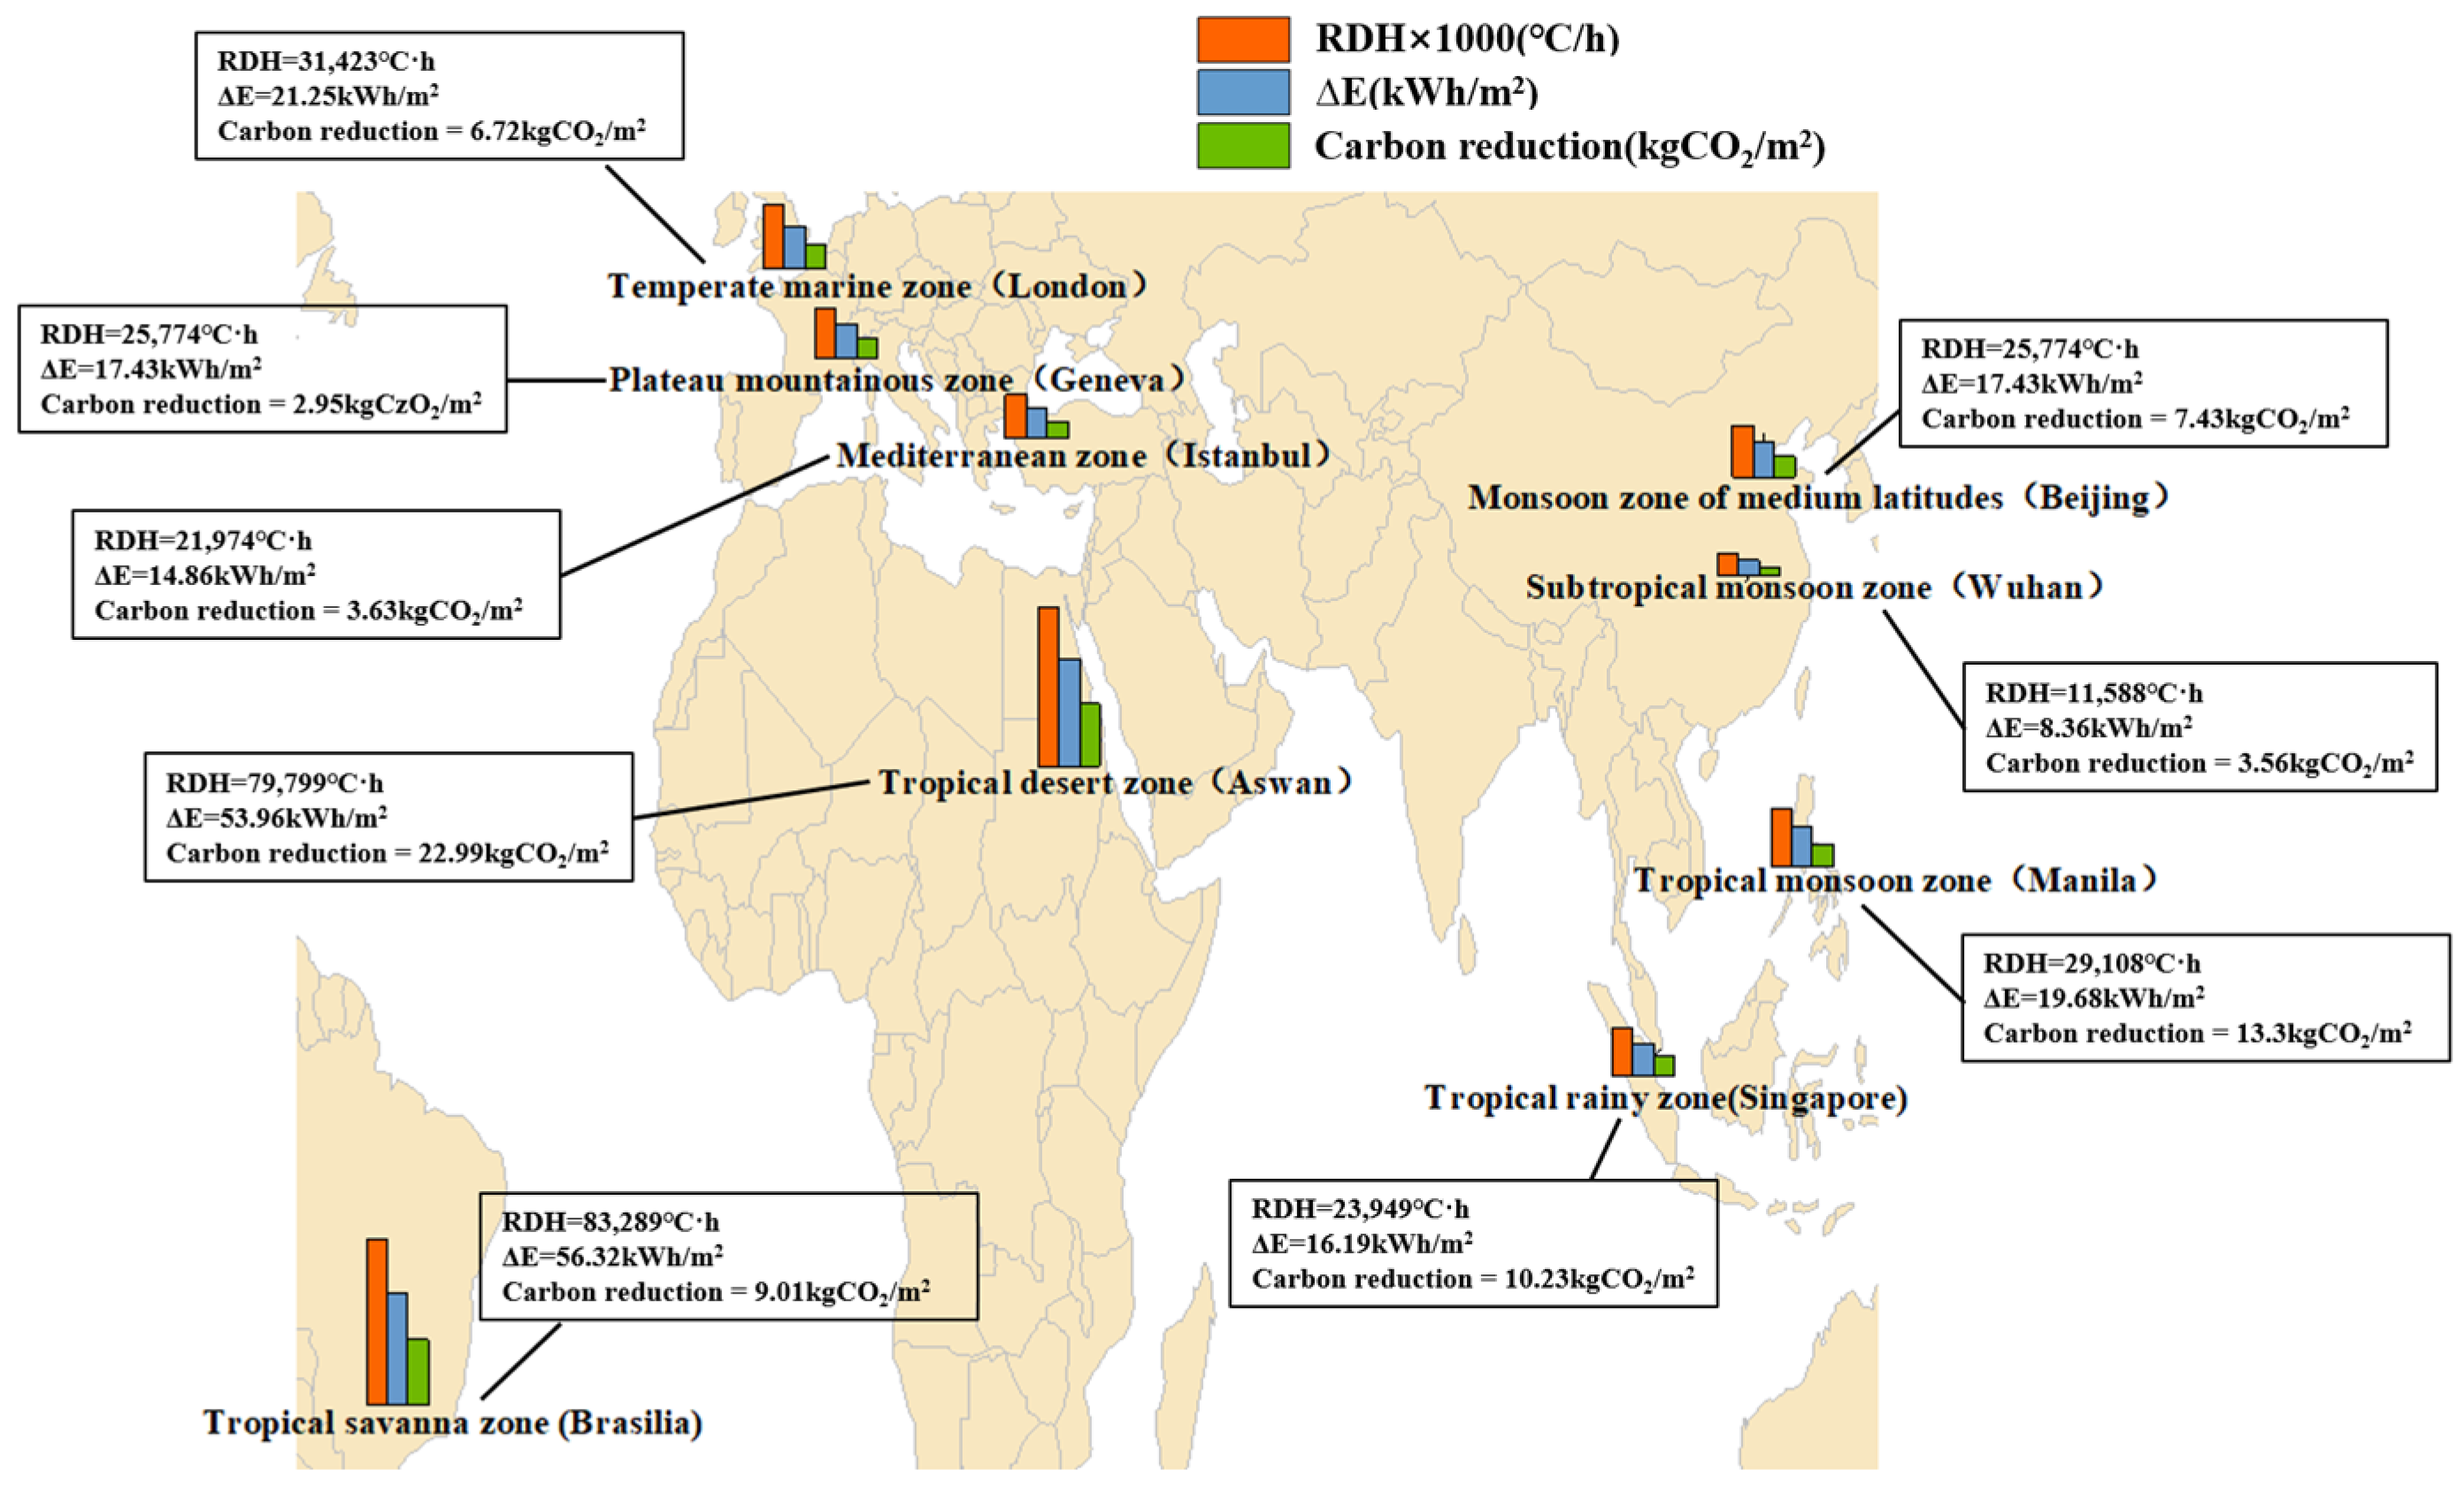
As shown in
Figure 8,
Figure 9 and
Figure 10, when Δ
T is 0.5 °C, performance begins to decline in all regions, but the rate of decline exhibits significant regional variation. The tropical rainforest climate (Singapore) and subtropical monsoon climate (Wuhan) showed the highest decreases in Δ
E at 17.6% and 11.1%, respectively. In contrast, the decrease in tropical arid (Aswan) and tropical savanna (Brasília) regions is relatively modest. For instance, Aswan’s Δ
E decreased only from 53.96 to 51.02 kWh/m
2 (a mere 5.4% reduction). This demonstrates that compared to arid regions, the system’s performance in high-humidity areas (Singapore and Wuhan) is more sensitive to changes in Δ
T.
When Δ
T is 1 °C, Singapore’s Δ
E decreases by 34.3% and Wuhan’s decreases by 21.5% compared to the performance of the system with a 0 °C temperature difference. Meanwhile, the decline was only 10.8% for Aswan, 9.1% for London, and 8.6% for Geneva. Adaptability is high in mid-to-high-latitude regions (London, Beijing, and Geneva). In these areas, summer nighttime ambient temperatures are relatively low, allowing the system to readily obtain cold water as the temperature is below indoor temperatures, even with increased Δ
T. Performance degradation is severe in low-latitude humid and hot regions, where adaptability is relatively poor.
Figure 8 is the global potential map of the integrated system with a Δ
T of 1 °C.
When Δ
T was 2 °C, Singapore’s Δ
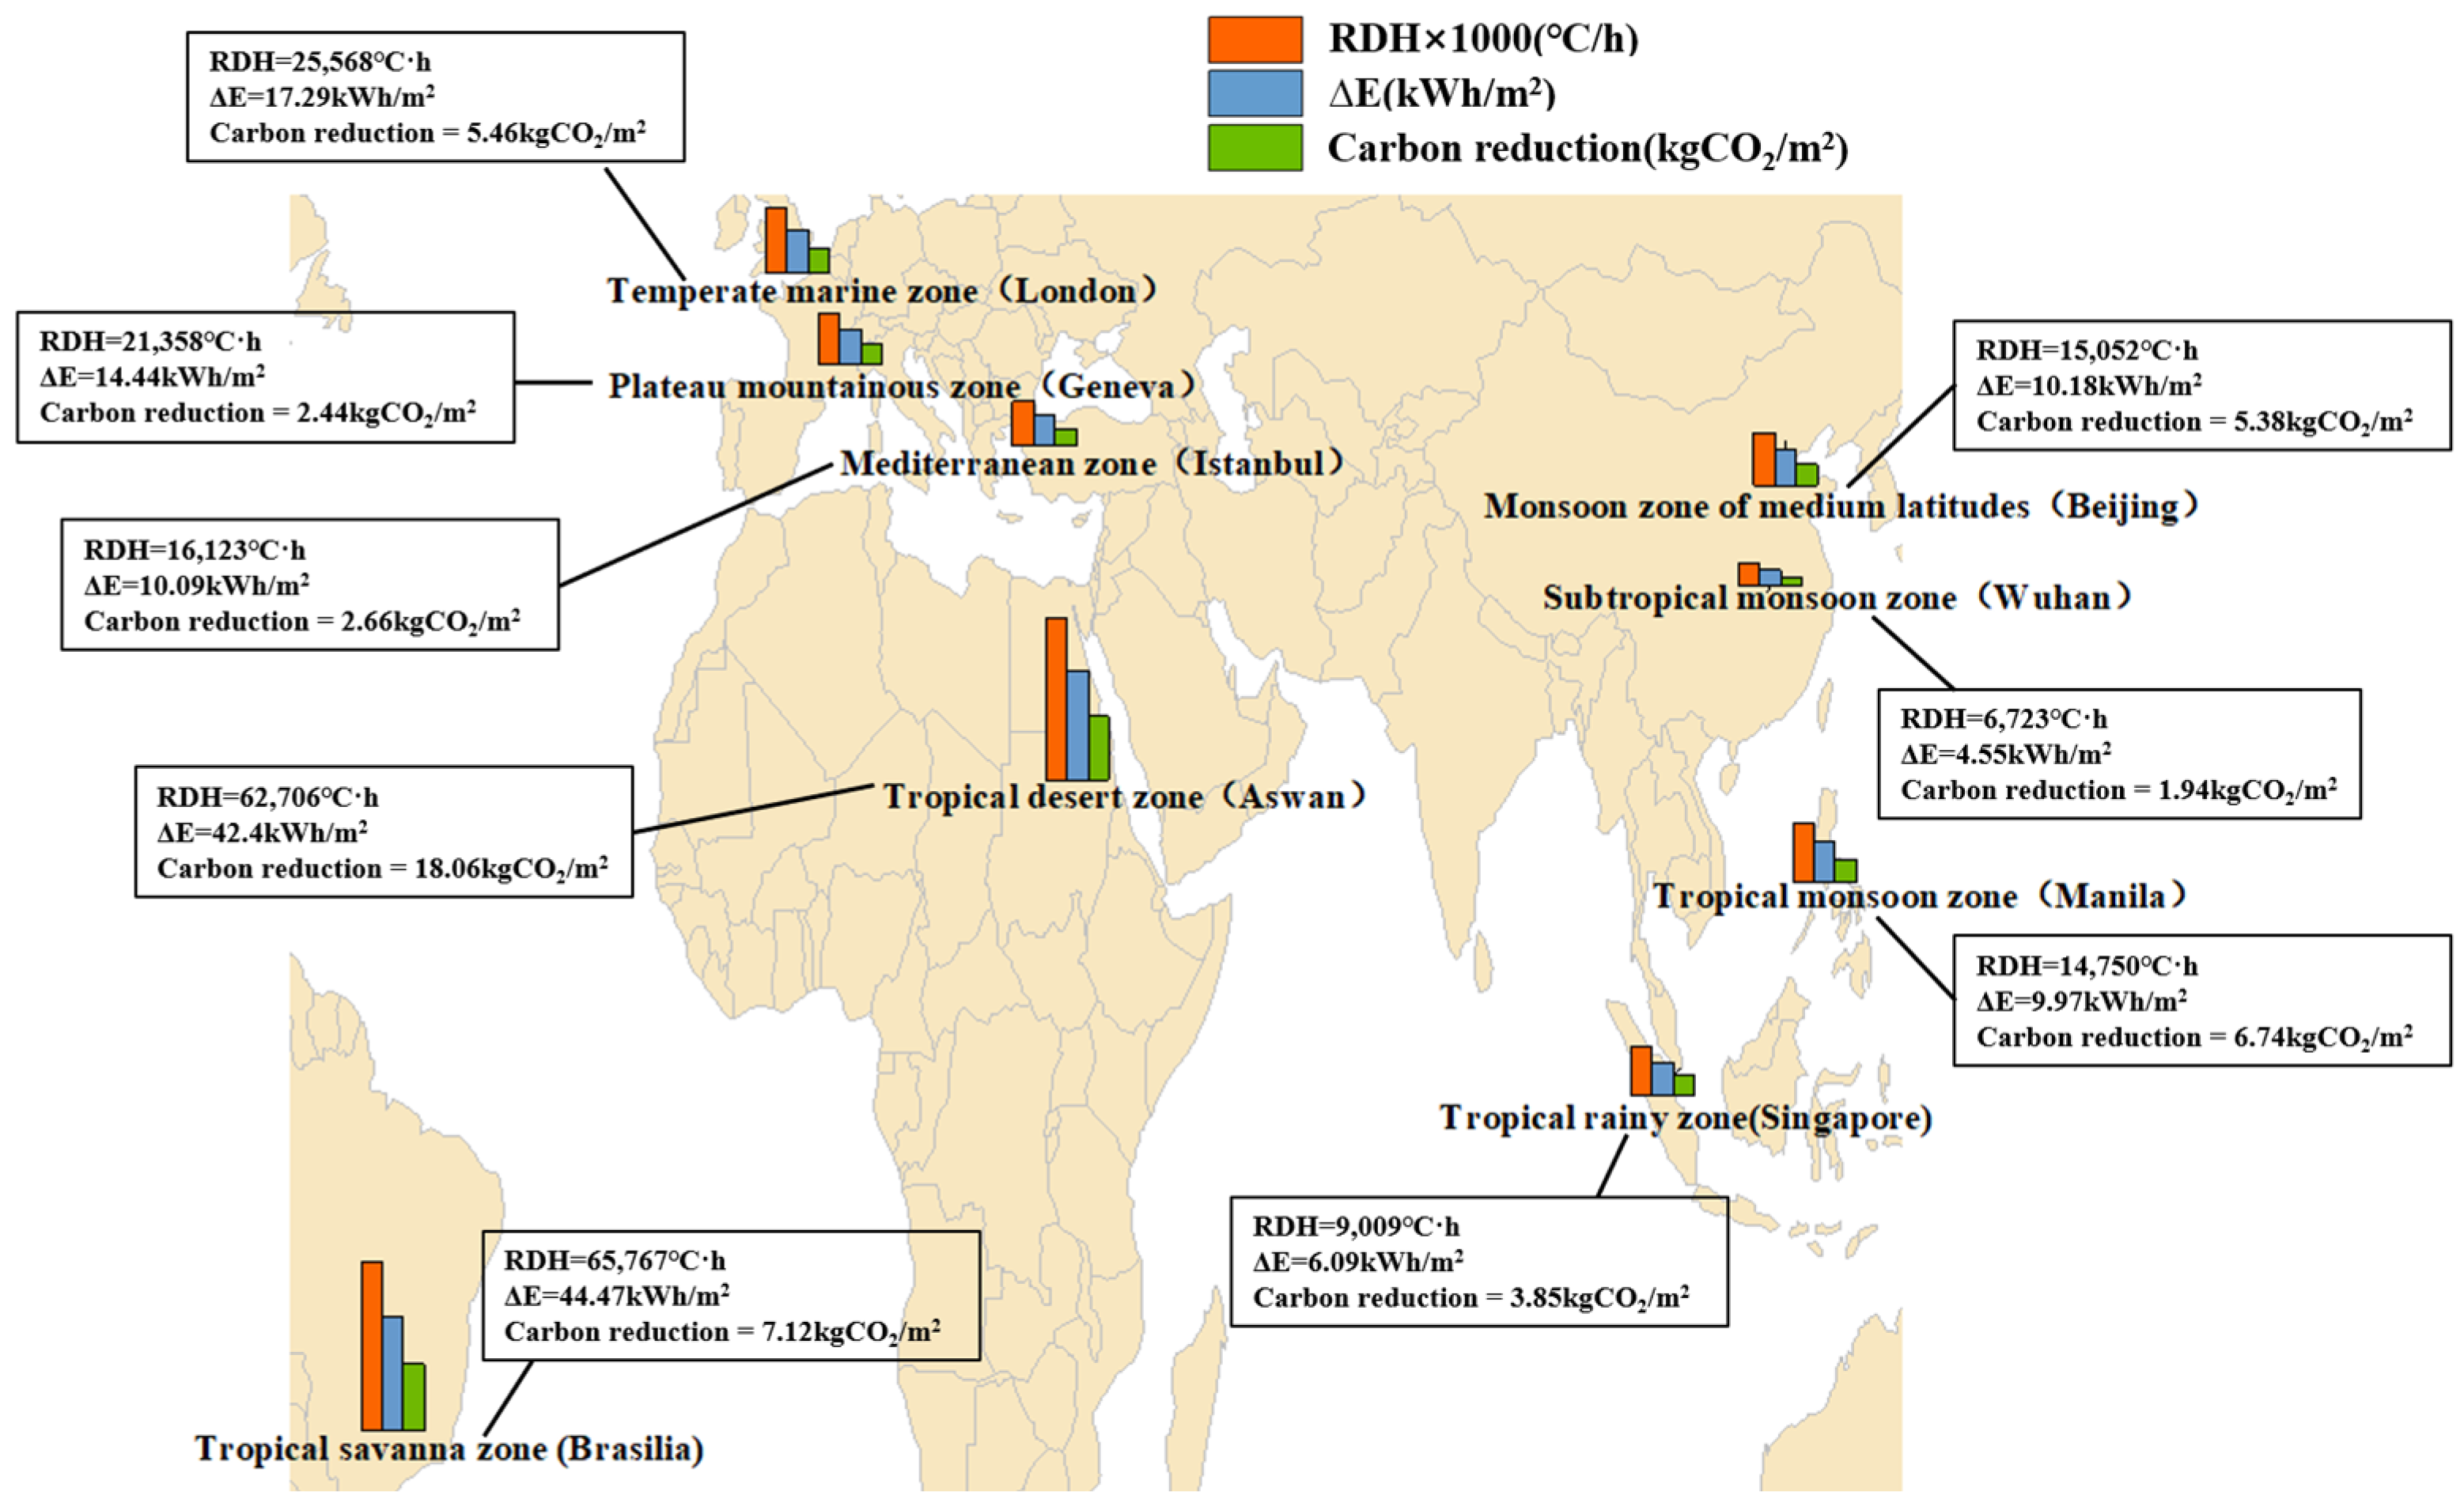
E decreased by 62.4%, while Wuhan’s decreased by 39.7%. Arid regions such as Aswan and Brasília saw cumulative decreases of approximately 21~24%, while temperate regions like London and Geneva experienced cumulative decreases of about 23~29%. Although their absolute potential also declined significantly, the remaining potential remains substantial. This demonstrates that low-latitude humid and hot climate zones are highly susceptible to Δ
T variations, indicating poor technological applicability. Conversely, low-latitude arid regions and mid-to-high-latitude areas exhibit greater tolerance to Δ
T fluctuations.
Figure 9 shows a global potential map of the integrated system for a Δ
T of 2 °C. The tendency for the system’s performance to decline intensifies, and regional disparities become more pronounced.
Overall, both the RDH and energy-saving potential decrease as the temperature rise (ΔT) increases, but the rate of decline varies significantly by region. In low-latitude humid and hot climates, system performance is highly sensitive to ΔT changes, where even a slight increase in the temperature differential can cause a substantial reduction in energy-saving potential. Conversely, in low-latitude arid regions and mid-to-high-latitude areas with cool summers, the system demonstrates strong adaptability, maintaining a relatively high residual energy-saving potential.
The generation and magnitude of the system operating temperature difference (ΔT) primarily result from the combined effects of external climatic conditions and the cooler’s internal heat transfer processes. Climatic factors constitute the primary source of ΔT. Intense solar radiation, high ambient temperatures, high humidity, and overcast conditions significantly diminish the cooling effect of RSC, thereby increasing the chilled water temperature and forcing the system’s ΔT to rise. The convective effect of air velocity can also impact the cooler’s effectiveness. Simultaneously, the cooler’s inherent heat transfer efficiency influences the actual magnitude of ΔT. Along the complete heat transfer path from the radiant panel to the building interior, factors such as pipe layout, fluid dynamic characteristics, thermal insulation of pipelines, and interfacial contact thermal resistance all contribute to increasing ΔT during operation. Improving the heat exchange efficiency of the cooler and reducing the heat exchange temperature difference in the integrated system are important measures to enhance the energy-saving potential.
As the temperature of the cold water increases, the cooling capacity and energy-saving potential of the system both tend to decline. In practical applications, the actual ΔT will be higher, causing the energy-saving effects to diminish, potentially to values lower than those predicted in this study. To improve the system performance and potential, the following specifications are recommended: First, the solar reflectance of the radiative cooling surface should be enhanced to directly minimize solar heat gain. Second, where installation conditions permit, efforts should be made to ensure that the radiative surface has an unobstructed view of the sky, reducing thermal radiation blockage from surrounding buildings and urban environments.