Article

Mechanical Performance Analysis of Grouted Mortise–Tenon Joints in Prefabricated Subway Stations


1
School of Civil Engineering, Chongqing University, Chongqing 400045, China
2
Chongqing Transportation Construction Management Co., Ltd., Chongqing 400045, China
*
Author to whom correspondence should be addressed.
Buildings 2026, 16(9), 1646; https://doi.org/10.3390/buildings16091646
Submission received: 9 March 2026 / Revised: 2 April 2026 / Accepted: 18 April 2026 / Published: 22 April 2026
(This article belongs to the Section Building Structures)

Abstract

The mechanical performance of joints in prefabricated subway stations is a key factor governing the overall structural stability. This study investigates the grouted mortise–tenon joint (GMTJ), which is widely used in prefabricated subway station structures. A refined finite element model was established by incorporating material nonlinearity and a cohesive–friction hybrid constitutive model for the grout–concrete interface, and the accuracy of the model was validated against experimental results. Using the prototype GMTJ from an engineering project as the baseline, parametric analyses were conducted considering three concrete strength grades (CSGs) and three longitudinal reinforcement ratios (LRRs). The results show that increasing the CSG improves the joint’s flexural capacity and delays crack propagation. Although a higher LRR enhances the overall deformation resistance, an excessively high LRR intensifies stress concentration in the tenon region due to the absence of reinforcement in this area. Therefore, merely increasing the LRR cannot effectively improve joint durability, and local reinforcement of critical components such as the tenon is recommended in practical engineering. These findings provide meaningful references and insights for the structural design of prefabricated subway station joints.

1. Introduction

Prefabricated construction technology is a key approach to achieving construction industrialization, offering advantages such as high construction efficiency, low environmental impact, and superior quality control. However, research and application of prefabrication technology in subway stations are still at the nascent stage.
The main structure of composite prefabricated subway stations is formed by assembling semi-prefabricated components on-site and then pouring the composite layer of concrete. The connections between prefabricated components are mostly of the “wet joint” type, a method that has been applied at Nanmen Station on Wuxi S1 Line [1,2]. Currently, the open-cut method is predominantly adopted for the construction of prefabricated subway stations. The main structure of fully prefabricated subway stations is assembled from fully prefabricated components, with “dry joints” serving as the primary connection form between these components. Currently, the common connection types for fully prefabricated components in underground stations primarily include four forms: grouted mortise–tenon joints (GMTJs), welded joints, grouted sleeve connections, and steel–concrete composite joints. The GMTJ was implemented in Shuangfeng Station on Line 2 of Changchun [3,4], while welded steel plate connections and embedded steel coupler connections were applied in Shangyong Park Station of Guangzhou Subway [5,6]. Furthermore, longitudinal rebar grouted sleeve connections and rebar lap joints were utilized in Jin’anqiao Station on Line 6 of Beijing [7,8], and CHC steel–concrete composite joints were employed in Pingxi Station on Line 3 of Shenzhen [9,10].
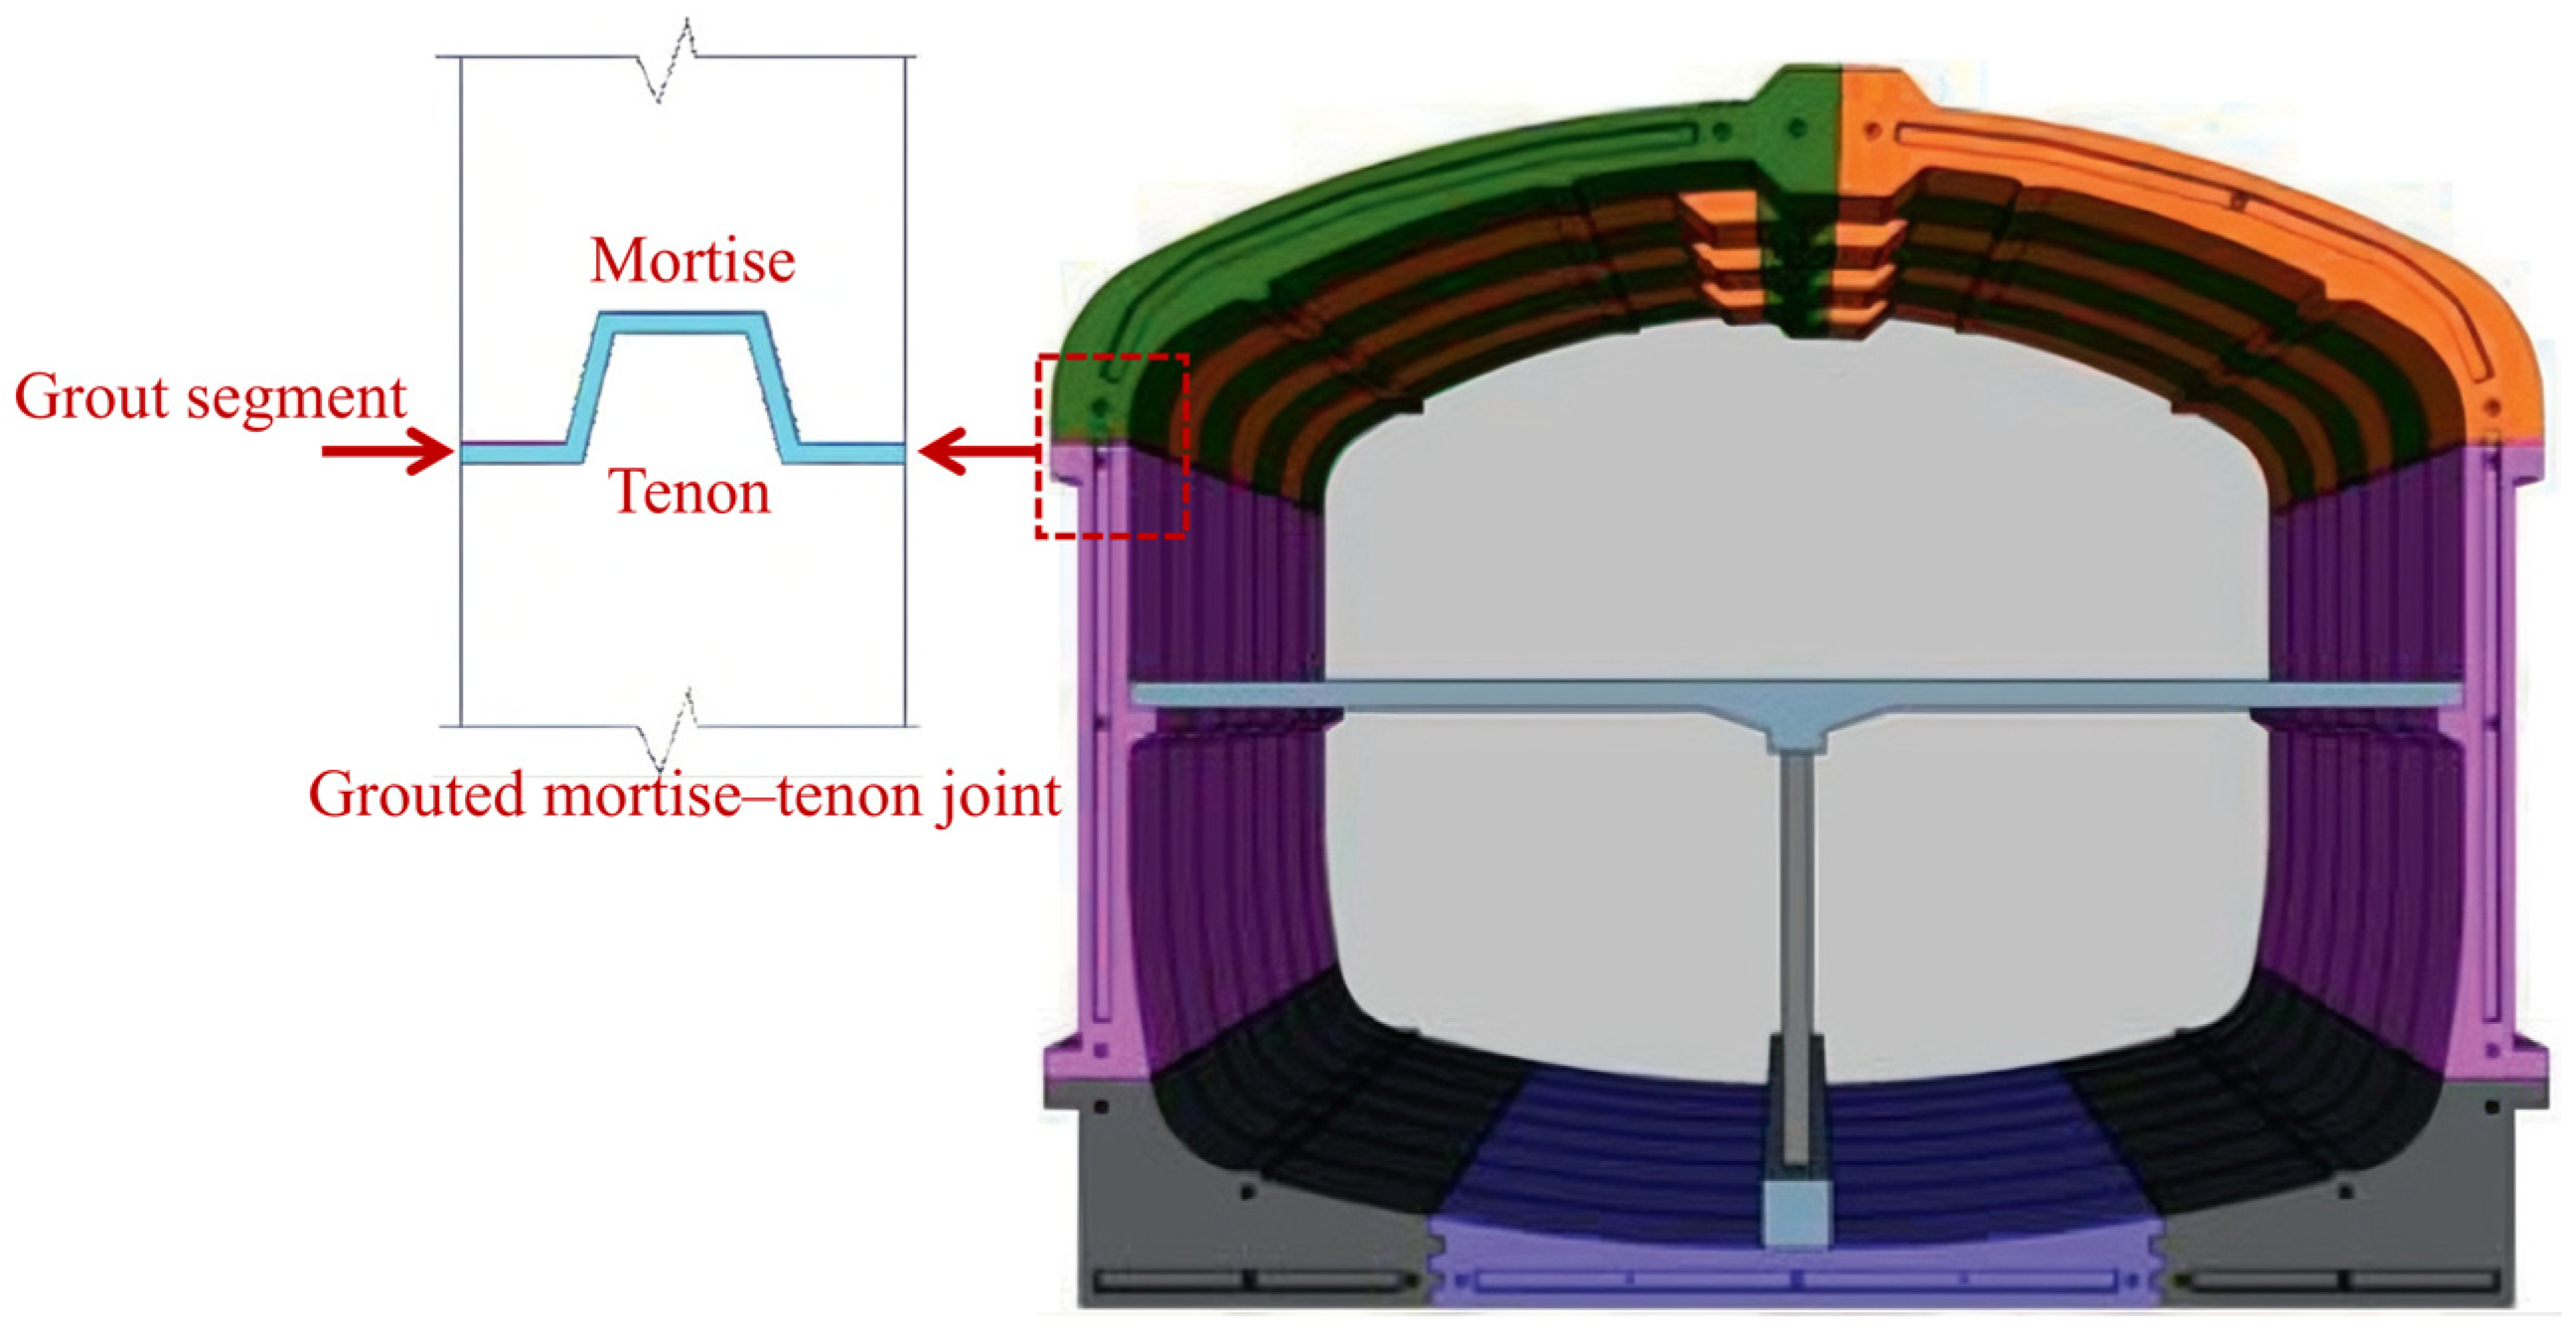
As the first fully prefabricated subway station in China, Shuangfeng Station on Line 2 of the Changchun adopts the GMTJ to connect its prefabricated components [11]. As shown in Figure 1, this joint consists of a mortise, a tenon, and the joint grout filled between the prefabricated components during assembly. The assembly of prefabricated components is achieved through the interlocking of the tenon and mortise. Subsequently, grout is injected into the gaps between the mortise and tenon through pre-drilled grouting holes, ensuring full contact at the interfaces. This process facilitates the effective transfer of internal sectional forces and prevents displacement at the contact surfaces [12]. The flexural performance of prefabricated underground station structures depends on the mechanical performance of the connection joints. Yang et al. [12,13,14,15] conducted full-scale flexural tests on GMTJs under 38 different working conditions, including various tenon types, tenon lengths, grouting ranges, and loading conditions. Their study revealed the bearing capacity, bending stiffness, and deformation patterns of different types of mortise–tenon joints. Furthermore, they established the concepts of “resistance action” and “resistance moment,” and proposed calculation methods for the joint resistance moment, bearing capacity, and bending stiffness. Xiang et al. [16] adopted an orthogonal experimental design to investigate the effects of the joint’s bottom length, top length, and height on its bending stiffness, and proposed a modified cruciform tenon based on the optimal combination of geometric parameters. Su et al. [17] considered different bonding conditions between the grouting material and the concrete. The results indicated that for GMTJs, the flexural capacity is hardly affected by the bonding performance between the grouting material and the concrete. He et al. [18] conducted seismic performance tests on the GMTJs of side walls. The results indicated that, compared to cast-in-place side walls, those with prefabricated GMTJs exhibit higher ductility and similar energy dissipation capacity, although their bearing capacity is lower.
Regarding numerical analysis of GMTJs, Yang et al. [19] established finite element models to analyze the effects of the tenon’s geometric parameters on the mechanical performance and bending stiffness of the joint. Cao et al. [20] developed numerical models for the thin-walled structure of the mortise–tenon closed cavity. The results demonstrated that this structure can reduce the internal forces in most sections, but simultaneously increases the principal strain, displacement, and stress. Based on a refined numerical model of the GMTJ, Wu et al. [21] established three-dimensional finite element models for both partially prefabricated and monolithic structures. Their findings indicated that the partially prefabricated structure outperformed the cast-in-place monolithic structure in terms of plastic strain at column ends, component damage levels, force transfer paths, and inter-story deformation coordination. Ding et al. [22] established a finite element numerical model of a prefabricated station structure connected by mortise–tenon joints. Their results showed that under horizontal seismic action, the mortise–tenon joints exhibit strong deformation resistance, which is conducive to reducing the peak bending moments and shear forces of the prefabricated components.
The aforementioned studies have deepened the understanding of the reliability of GMTJs in prefabricated underground structures, thereby promoting the development and application of prefabricated construction technologies in underground engineering. However, existing studies have mainly focused on optimizing joint geometries and verifying structural configurations [19,23,24], and the validation of finite element models has largely relied on comparisons of global mechanical response curves [15,19]. Systematic investigations into the influence of material parameters and reinforcement design on the joint’s mechanical behavior remain insufficient, and the failure patterns and crack propagation observed in experimental specimens have often been overlooked. The bearing performance and failure characteristics of GMTJs are highly dependent on the strength of the core concrete and the confinement effect of the longitudinal reinforcement. Under complex underground stress environments, the concrete strength grade and the longitudinal reinforcement ratio not only determine the ultimate bearing capacity of the joint but are also key factors in controlling the crack evolution patterns and the final failure mode. Therefore, conducting an in-depth investigation into the effects of various concrete strength grades and longitudinal reinforcement ratios on the mechanical performance of GMTJs, and clarifying their damage and failure mechanisms, is of great theoretical significance and engineering value for refining the design theory of such joints.
Compared with existing finite element studies on GMTJs, this study develops a refined finite element model that incorporates material nonlinearity together with a cohesive–friction mixed constitutive law for the interface between the grout layer and the concrete. After validating the model against experimental results in terms of failure modes and mechanical performance, parametric analyses were conducted to investigate the effects of concrete strength grades and longitudinal reinforcement ratios. The GMTJs were analyzed from four dimensions: mechanical performance, stress distribution, principal tensile plastic strain, and tensile damage. The failure mechanisms of GMTJs under the influence of different concrete strength grades and longitudinal reinforcement ratios were investigated. This study provides insights into clarifying the failure modes and facilitating the refined design of GMTJs. Furthermore, from the perspective of interaction mechanisms among structural components, this study investigates the damage evolution and plastic development in the tenon region of GMTJs under different concrete strength grades and longitudinal reinforcement ratios. This approach expands the evaluation of GMTJ mechanical performance from a focus on global load-carrying capacity to an assessment of local damage mechanisms, thereby providing a more practical and implementable theoretical basis for the structural design of GMTJs.

2. Validation of Numerical Model Effectiveness

2.1. Mechanical Performance Test of the GMTJ

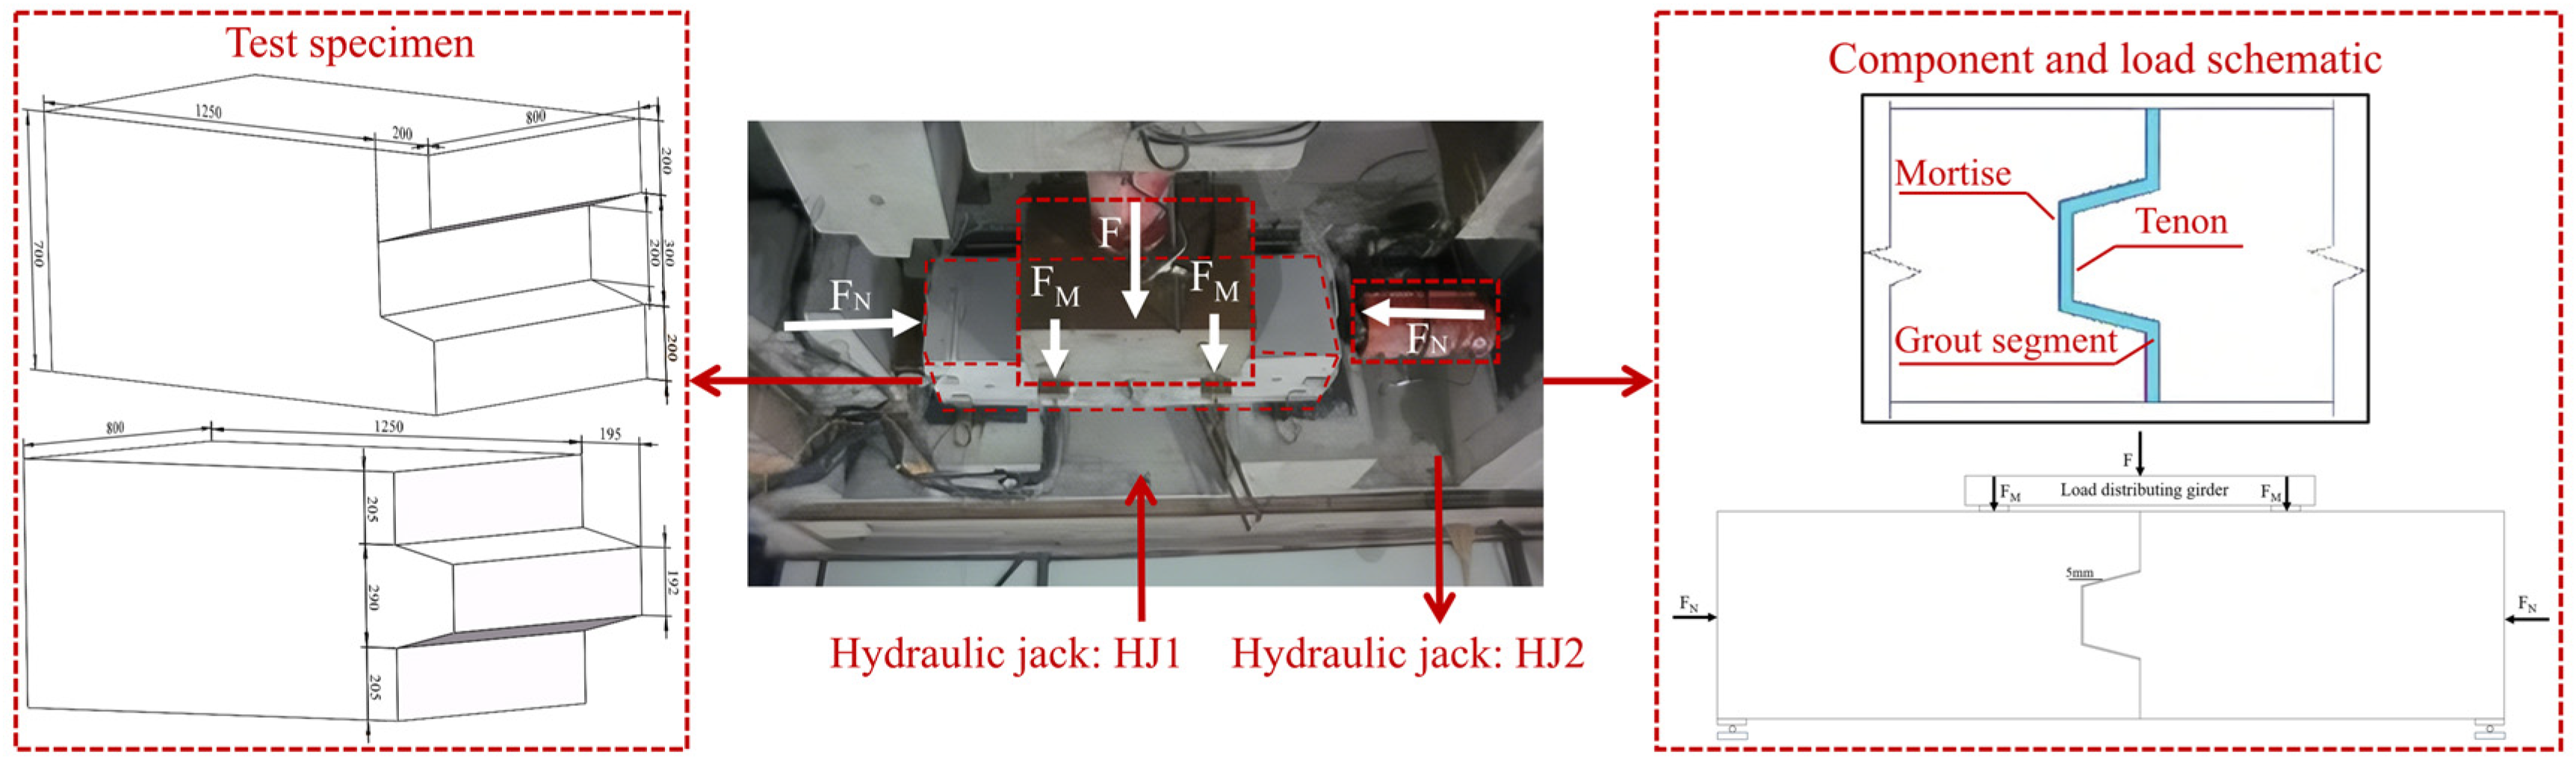
In the mechanical performance test of the GMTJ for prefabricated underground stations, the structural configuration, geometric dimensions, and material performance of the GMTJ components are entirely consistent with those used in the Yuanjiadian Station project of Changchun Metro Line 2 [19]. The concrete strength grade is C50, the reinforcement grade is HRB400, and the grouting material is modified epoxy resin. A single specimen was used in the experiment. The specimens were designed at a 1:1 prototype scale, with 800 mm long segments intercepted along the longitudinal direction of the station. A four-point bending loading scheme was adopted, utilizing a loading system composed of two orthogonally and horizontally positioned hydraulic jacks, HJ1 and HJ2. During the test, the bending moment M was applied by the hydraulic jack HJ1, which was oriented perpendicular to the axial force FN. HJ1 applied the vertical force F using displacement control, generating a vertical load FM on the specimen via a distribution beam. During the test, the axial force FN was applied by the horizontal hydraulic jack HJ2, while the transverse reaction force FN on the opposite side was provided by the side wall of the reaction pit. The load applied to the specimen was obtained from the load cells installed on the two hydraulic jacks. Displacement transducers were used to measure the vertical displacement at the joint interface of the connection model. The specimen dimensions and the on-site loading conditions are shown in Figure 2.

2.2. Establishment of the Finite Element Model

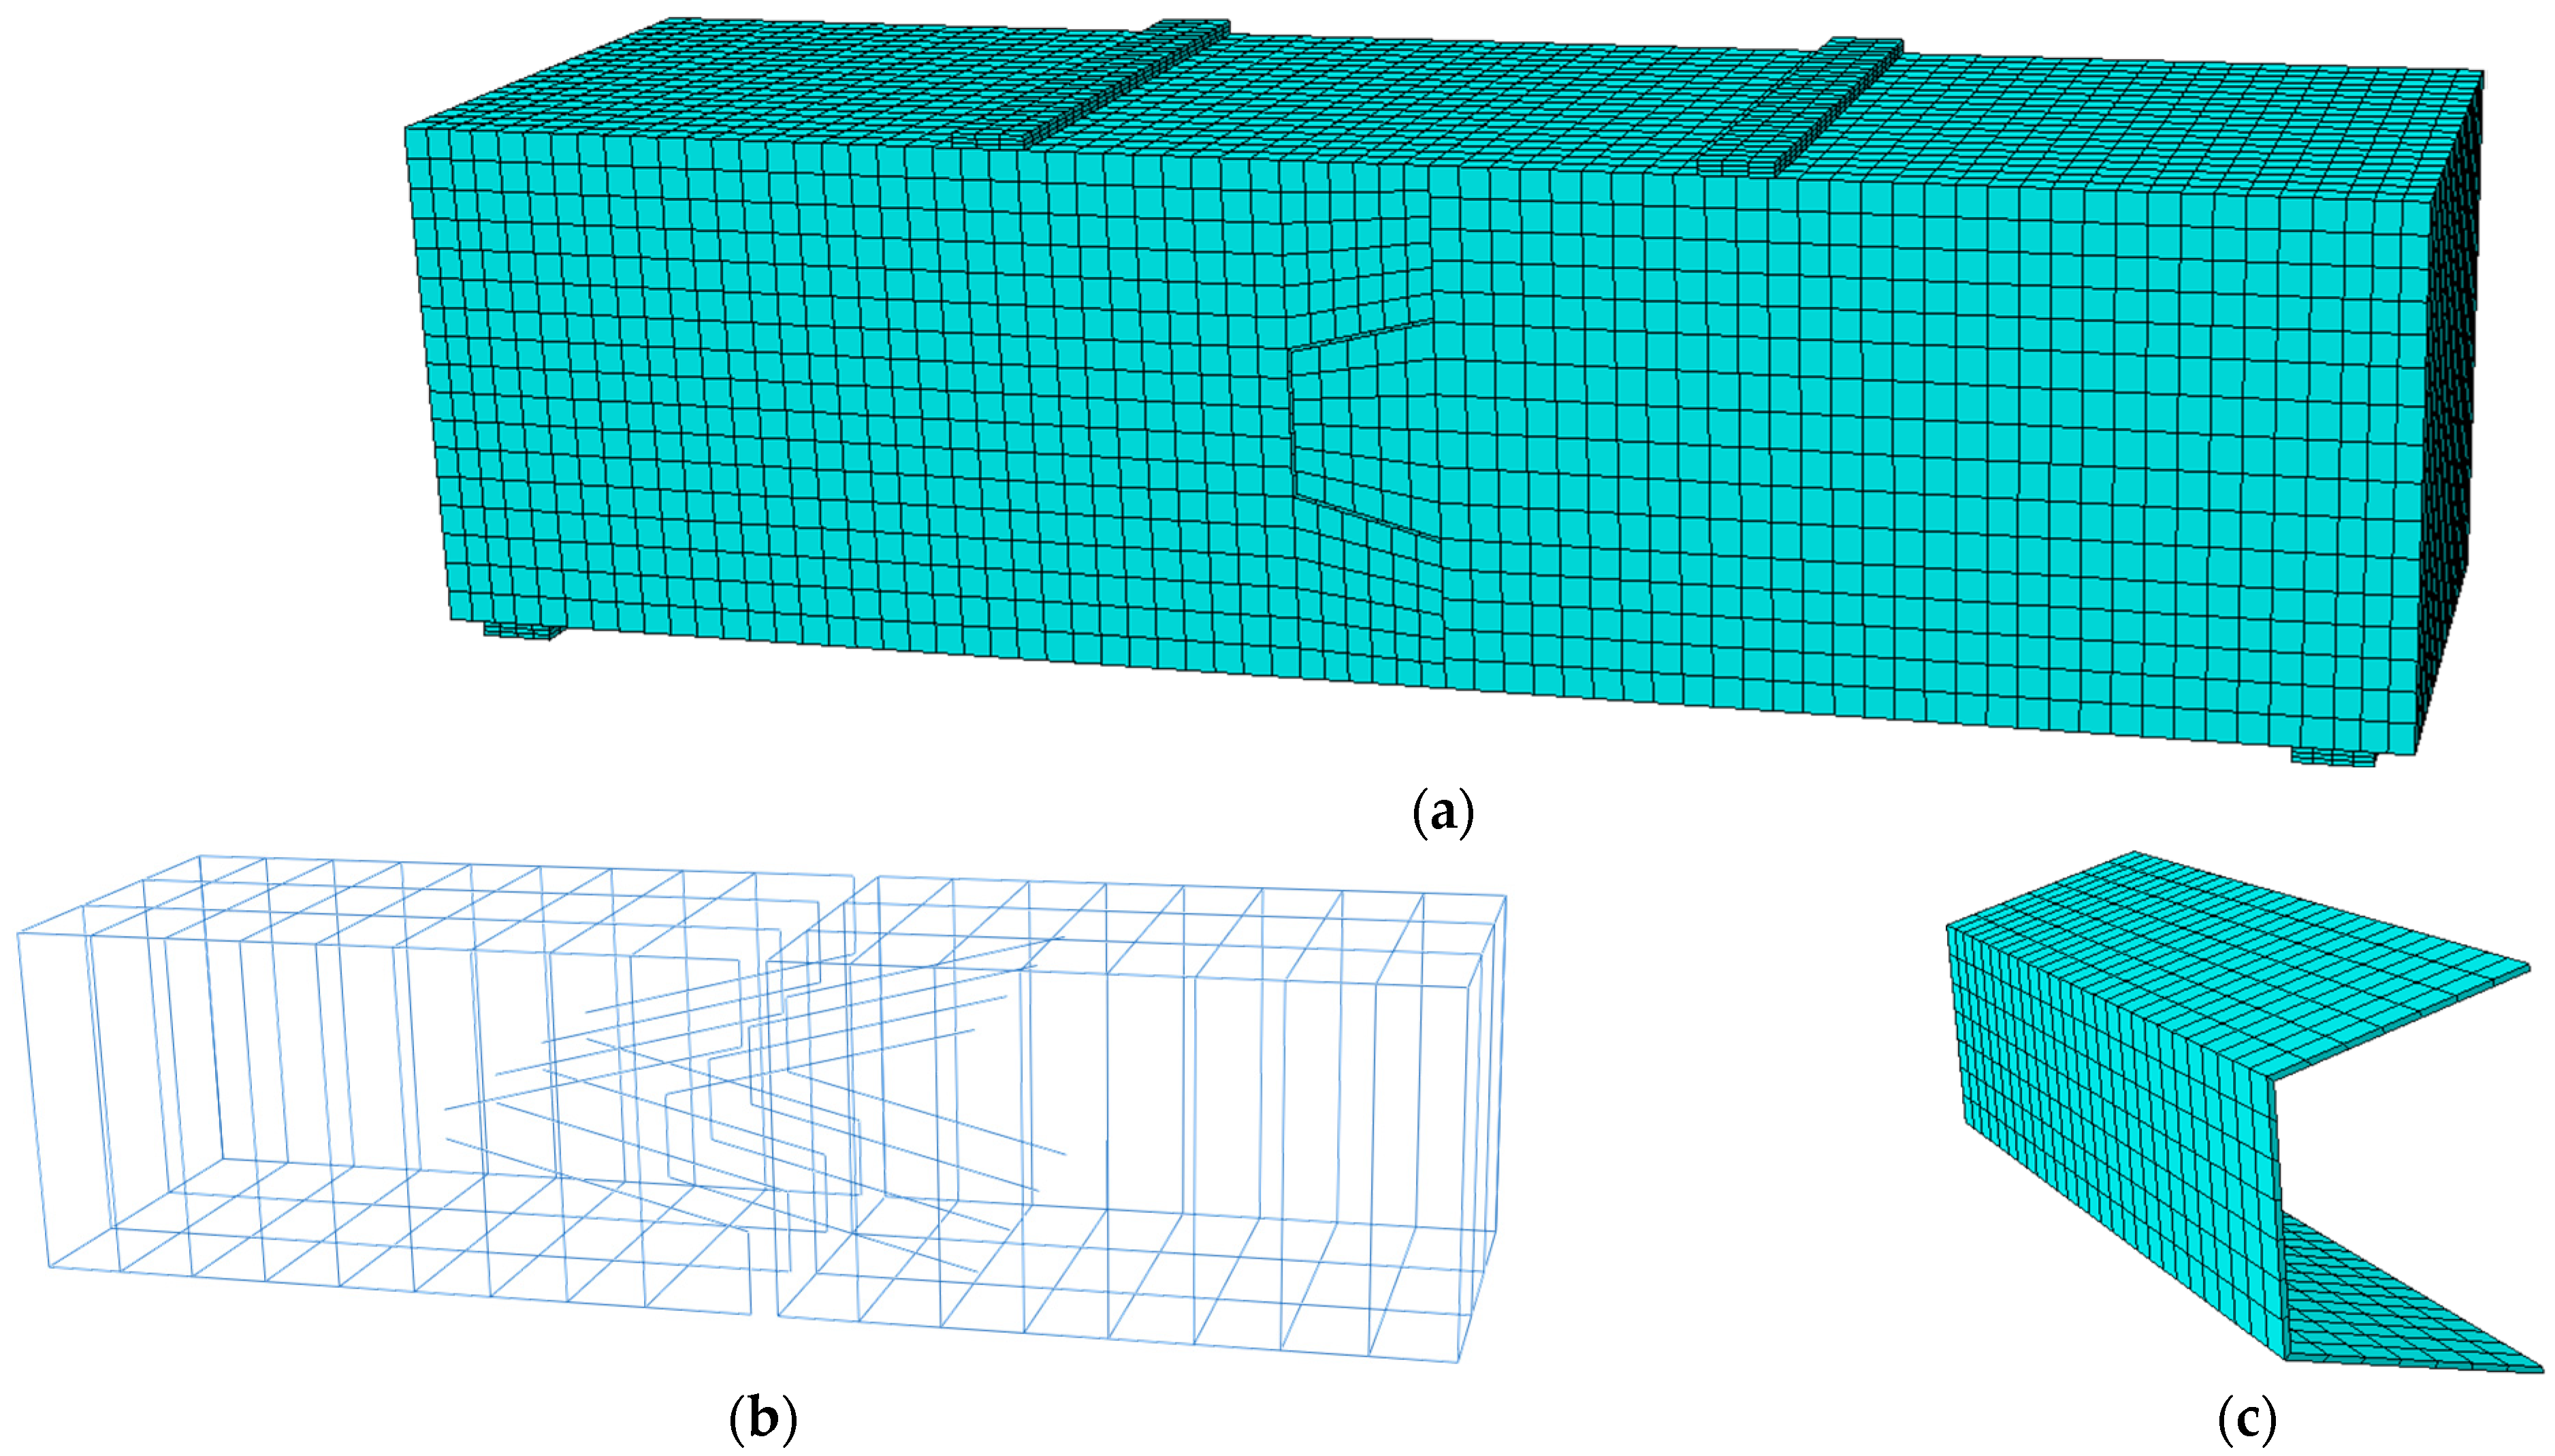
A finite element model (FEM) of the GMTJ for prefabricated underground stations was established based on the ABAQUS2025 software. The model incorporated material nonlinearities, and the ABAQUS/Standard implicit solver was employed to conduct numerical analysis on the mechanical response of the GMTJ components. The finite element model was consistent with the experimental specimens in terms of geometric dimensions, reinforcement layout, and material parameters to ensure comparability between the numerical results and experimental conditions. The mesh discretization and the models of individual components are shown in Figure 3. The mesh was refined to ensure computational accuracy while maintaining computational efficiency. For the reinforcement cage, the longitudinal bars as well as the reinforcement in the tenon and mortise regions were HRB400 steel bars with a diameter of 25 mm, and the stirrups were HRB400 bars with a diameter of 12 mm. The spacing of the longitudinal bars and stirrups was 150 mm, and the concrete cover thickness was 40 mm. The steel plates, concrete, and grouting materials were all modeled using eight-node 3D solid reduced-integration elements (C3D8R), with the element size controlled within the range of 30 mm to 50 mm. The reinforcement was modeled using two-node 3D truss elements (T3D2), with an element length of 20 mm. The entire model consisted of 27,069 elements and 32,210 nodes.

2.3. Material Constitutive Models

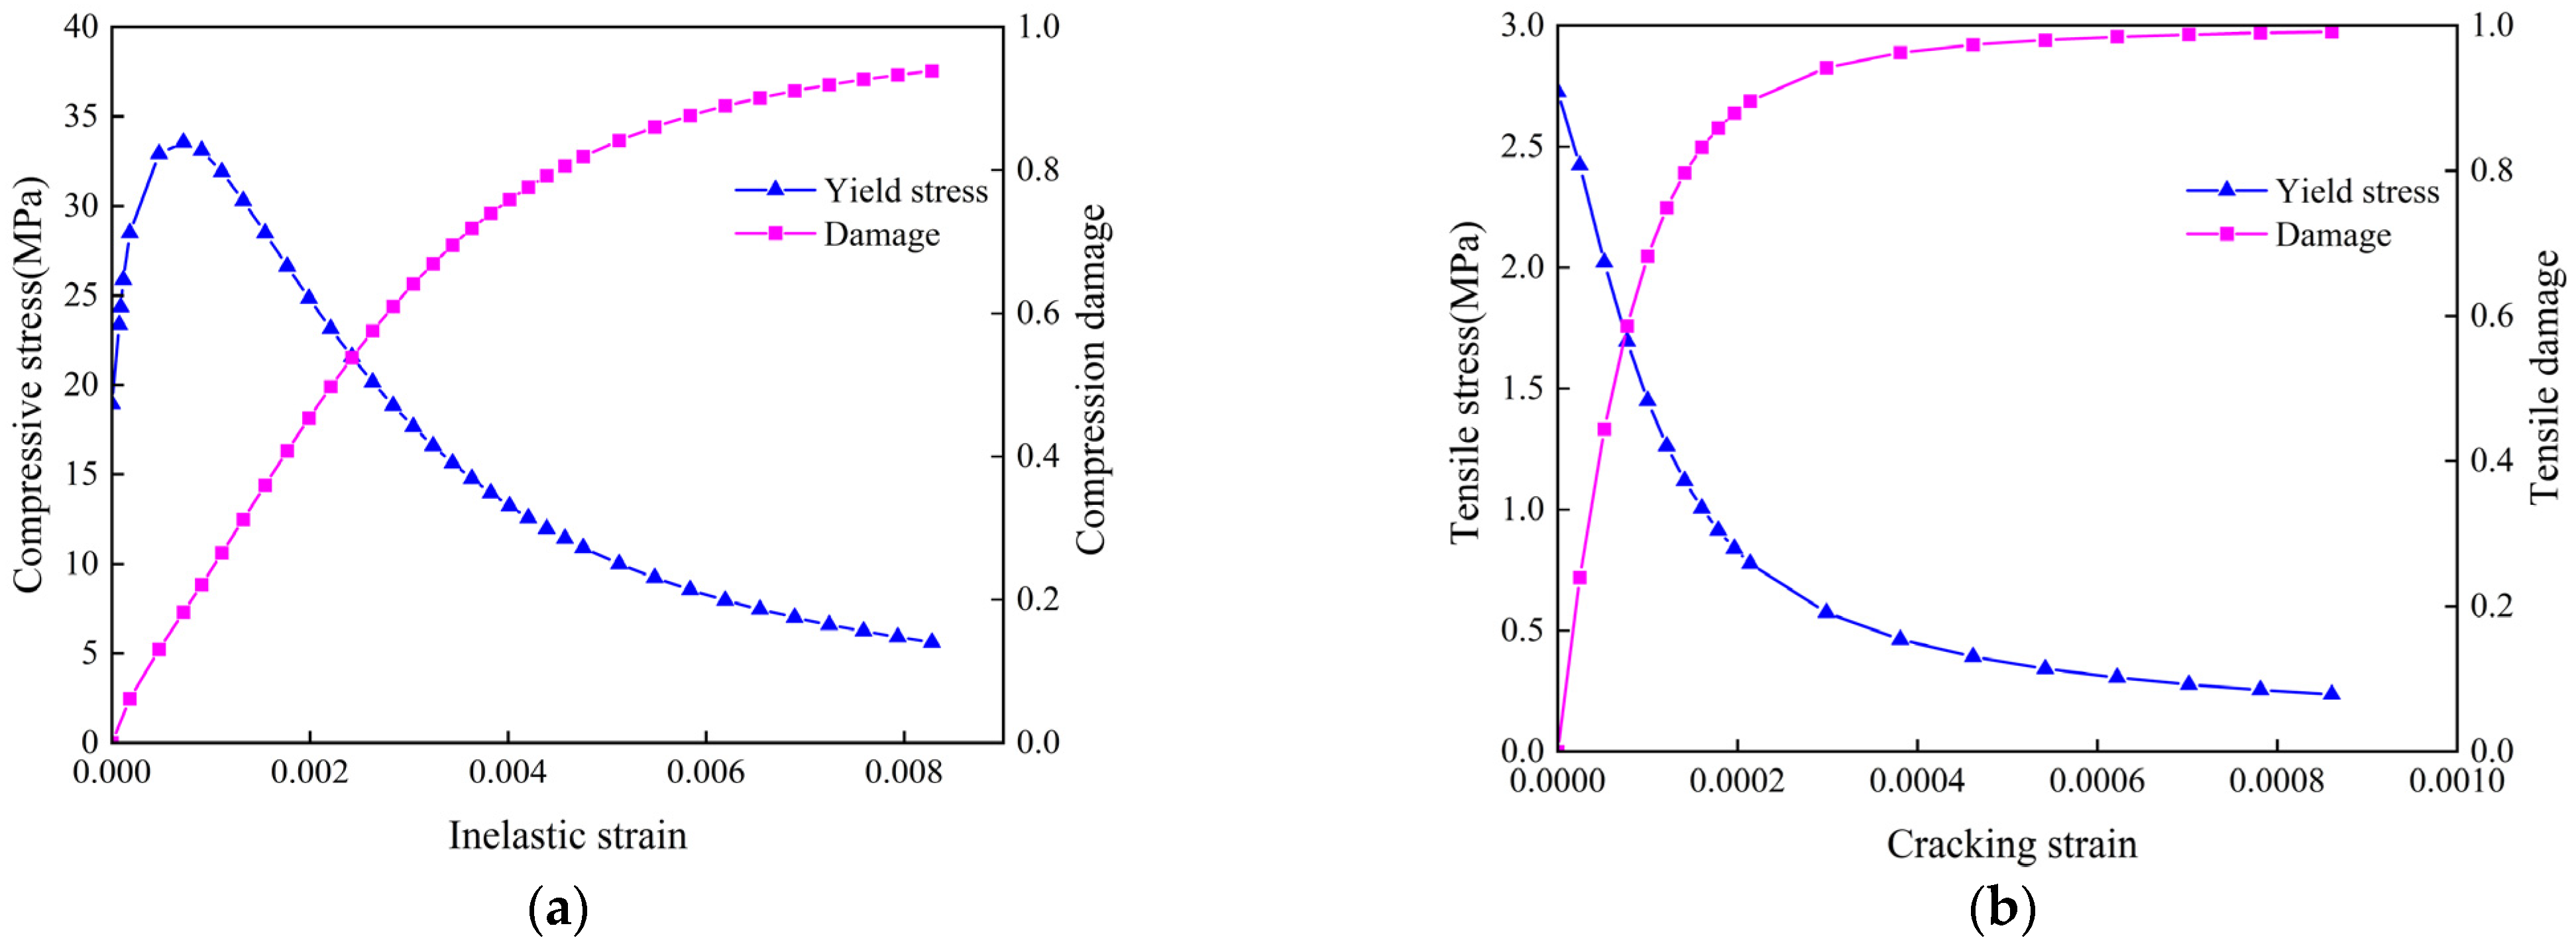
The Concrete Damaged Plasticity (CDP) model provided by ABAQUS can simulate the mechanical characteristics of concrete, including the stiffness degradation mechanism and the stiffness recovery under cyclic loading. Therefore, the concrete in the GMTJ components is described using the CDP model [25]. The main plastic parameters of the model are as follows: the dilation angle is 30°, the eccentricity is 0.1, the ratio of initial biaxial compressive yield stress to initial uniaxial compressive yield stress (fb0/fc0) is 1.16, the shape factor of the yield surface (K) is 0.6667, and the viscosity parameter is 0.0005. The uniaxial stress–strain relationship and damage factors of concrete were determined according to the Code for Design of Concrete Structures (GB 50010) [26]. The inelastic stress–strain curves and damage evolution curves of concrete under tension and compression were obtained through calculations, as shown in Figure 4. For the reinforcement, a bilinear elastic–plastic model with linear hardening was adopted to simulate the stress–strain relationship during both the tension and compression stages [21]. The modified epoxy resin was modeled using an ideal elastic–plastic model, while the steel plates were treated as ideal elastic bodies. In the test, the primary function of the steel bearing plate was to distribute the concentrated load applied at the loading end, ensuring a more uniform transfer of the load to the specimen’s loading surface. The plate itself did not participate in the actual load-resisting process of the specimen nor did it affect the characterization of its mechanical performance. Therefore, the steel bearing plate was modeled as an ideal elastic body [19]. Table 1 listed the mechanical performance of the main components for the GMTJ.

2.4. Interaction Definitions and Boundary Conditions

The interaction between the joint and the grouting layer is critical for reflecting the bond strength of the GMTJ. In the finite element model, surface-to-surface contact was employed between the prefabricated concrete GMTJ components and the grouting layer, and the interface behavior was simulated using a hybrid cohesive–friction model. The surface-based cohesive behavior in ABAQUS is suitable for bonding problems where the interface thickness is negligible. It allows for the simultaneous definition of the stress-relative displacement relationship in the normal and two tangential directions to characterize the interfacial mechanical performance between the concrete and the grouting layer.
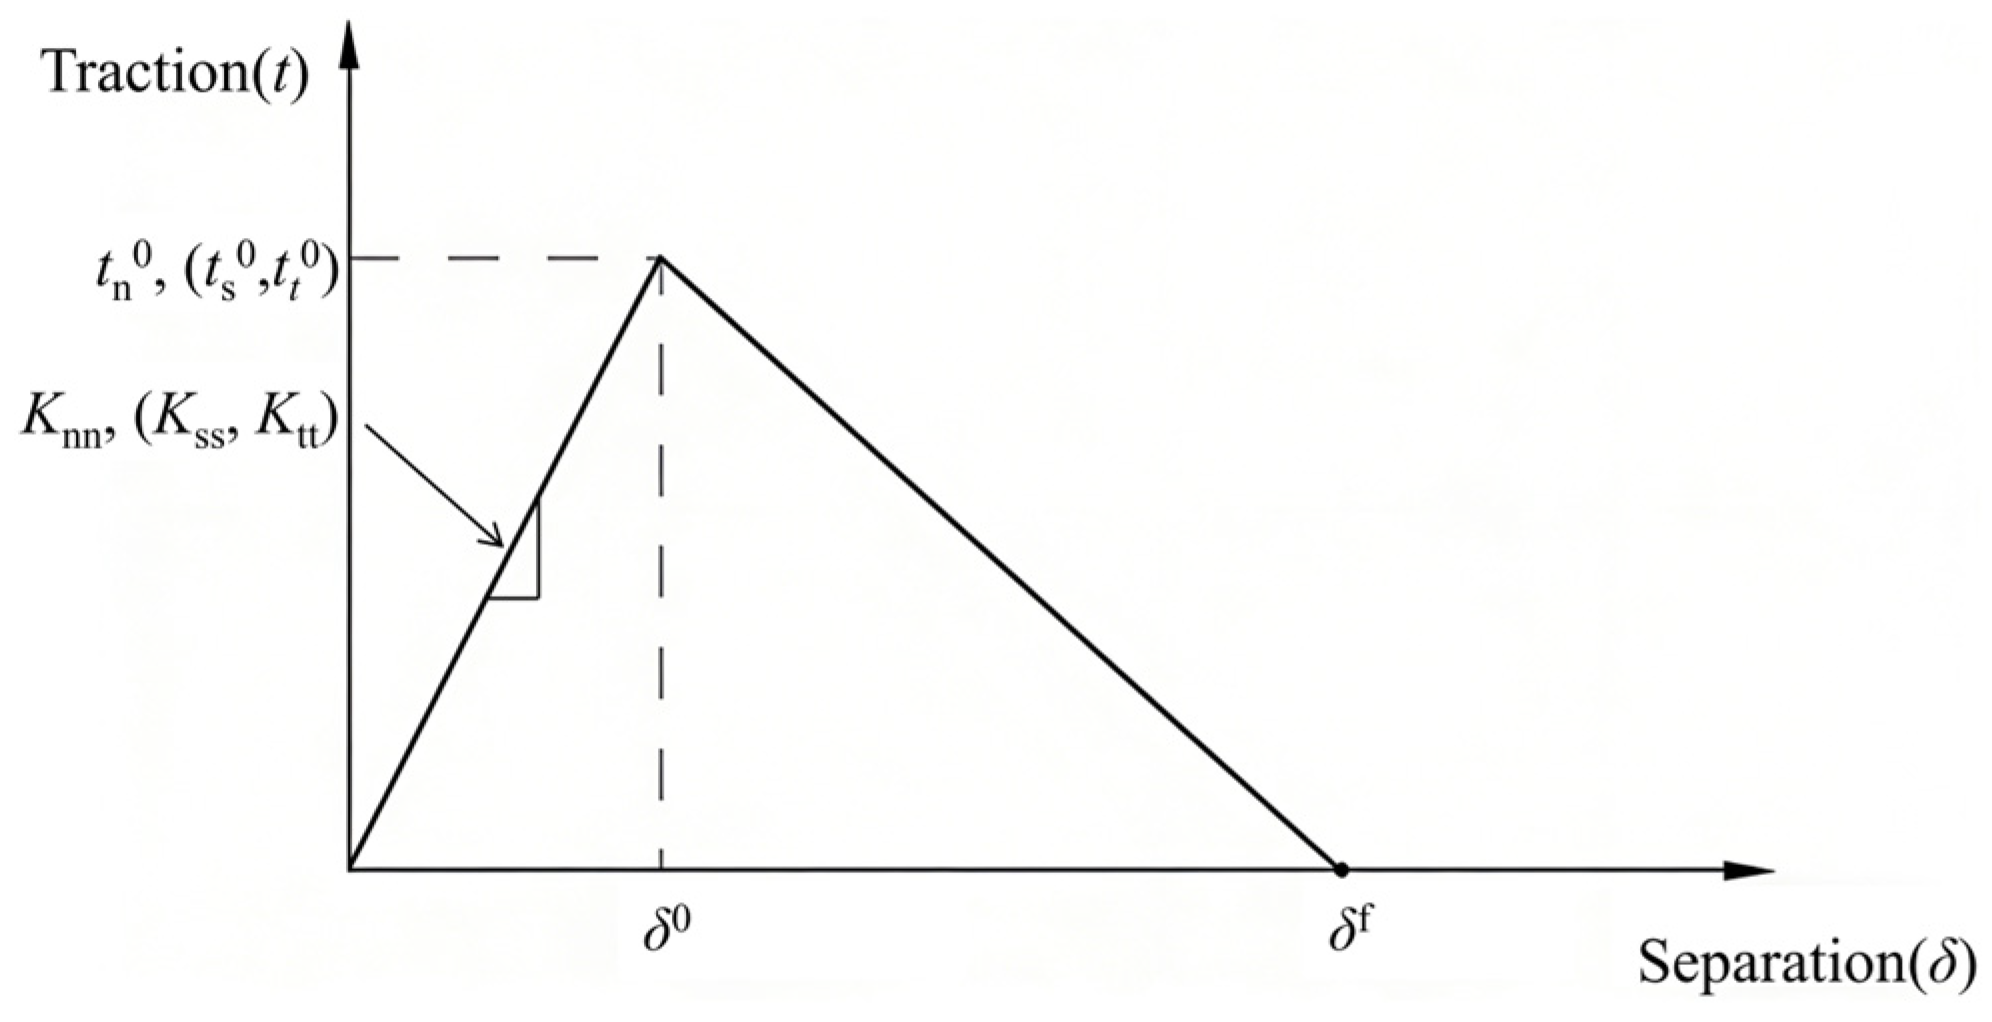
The basic constitutive form of the cohesive traction–separation relationship in three directions is shown in Figure 5, expressed as t = , where the interface behavior in each direction is assumed to be independent. The model consists of a linear elastic stage followed by a damage evolution (softening) stage. K represents the stiffness, including the normal elastic stiffness Knn and the tangential elastic stiffnesses Kss, Ktt. The normal stiffness is assumed to be nearly infinite; when Knn reaches the order of 104 MPa/mm or higher, the numerical results become stable [27]. The values of Kss, Ktt are both taken as 10 MPa/mm [28]. The nominal traction vector t consists of three components, tn, ts and tt, representing the normal traction and the two tangential traction components, respectively.
The interface damage initiation criterion adopts a quadratic nominal stress criterion [29,30]. Damage begins to develop in the bonded interface when the combined nominal stress from the three traction components reaches the peak stress, at which point stiffness degradation starts and the corresponding separation reaches δ0. When the relative displacement increases to the failure displacement δf, the nominal traction t reduces to zero, indicating complete loss of cohesion. The value of δf is taken as 1 mm. The quadratic nominal stress criterion is expressed in Equation (1):
t n t n 0 2 + t s t s 0 2 + t t t t 0 2 = 1
where t n 0 , t s 0 and t t 0 are the peak nominal stresses in the three orthogonal directions, each taken as 3 MPa [31]. The symbol ⟨ ⟩ denotes the Macaulay brackets, which ensure that damage in the cohesive interface can be initiated only under tensile conditions, while compressive stresses do not trigger damage.
For the cohesive–friction model, when the cohesive model is in the elastic stage, the friction model remains inactive, and the interfacial shear stress is solely provided by the cohesive model. As the cohesive model enters the damage stage, its load-bearing capacity gradually diminishes with damage evolution, and the friction model begins to contribute, generating shear stress. During the transition from initial damage to complete degradation of the cohesive model, the interfacial shear stress is jointly borne by both the cohesive and friction models. Once the cohesive model has completely failed, the interfacial shear stress is solely provided by the friction model. Therefore, the hybrid cohesive–friction model can reasonably reflect the mechanical transition of the interface from bonding-controlled behavior to friction-controlled behavior. When defining the aforementioned contact behavior in ABAQUS, “Hard Contact” was assigned to the normal direction of the interface to prevent mutual penetration between the concrete and the grouting layer, ensuring full transmission of normal pressure. The tangential behavior was modeled using a penalty-based friction formulation, and the friction coefficient was taken as 0.6 with reference to ACI 318-11 [32].
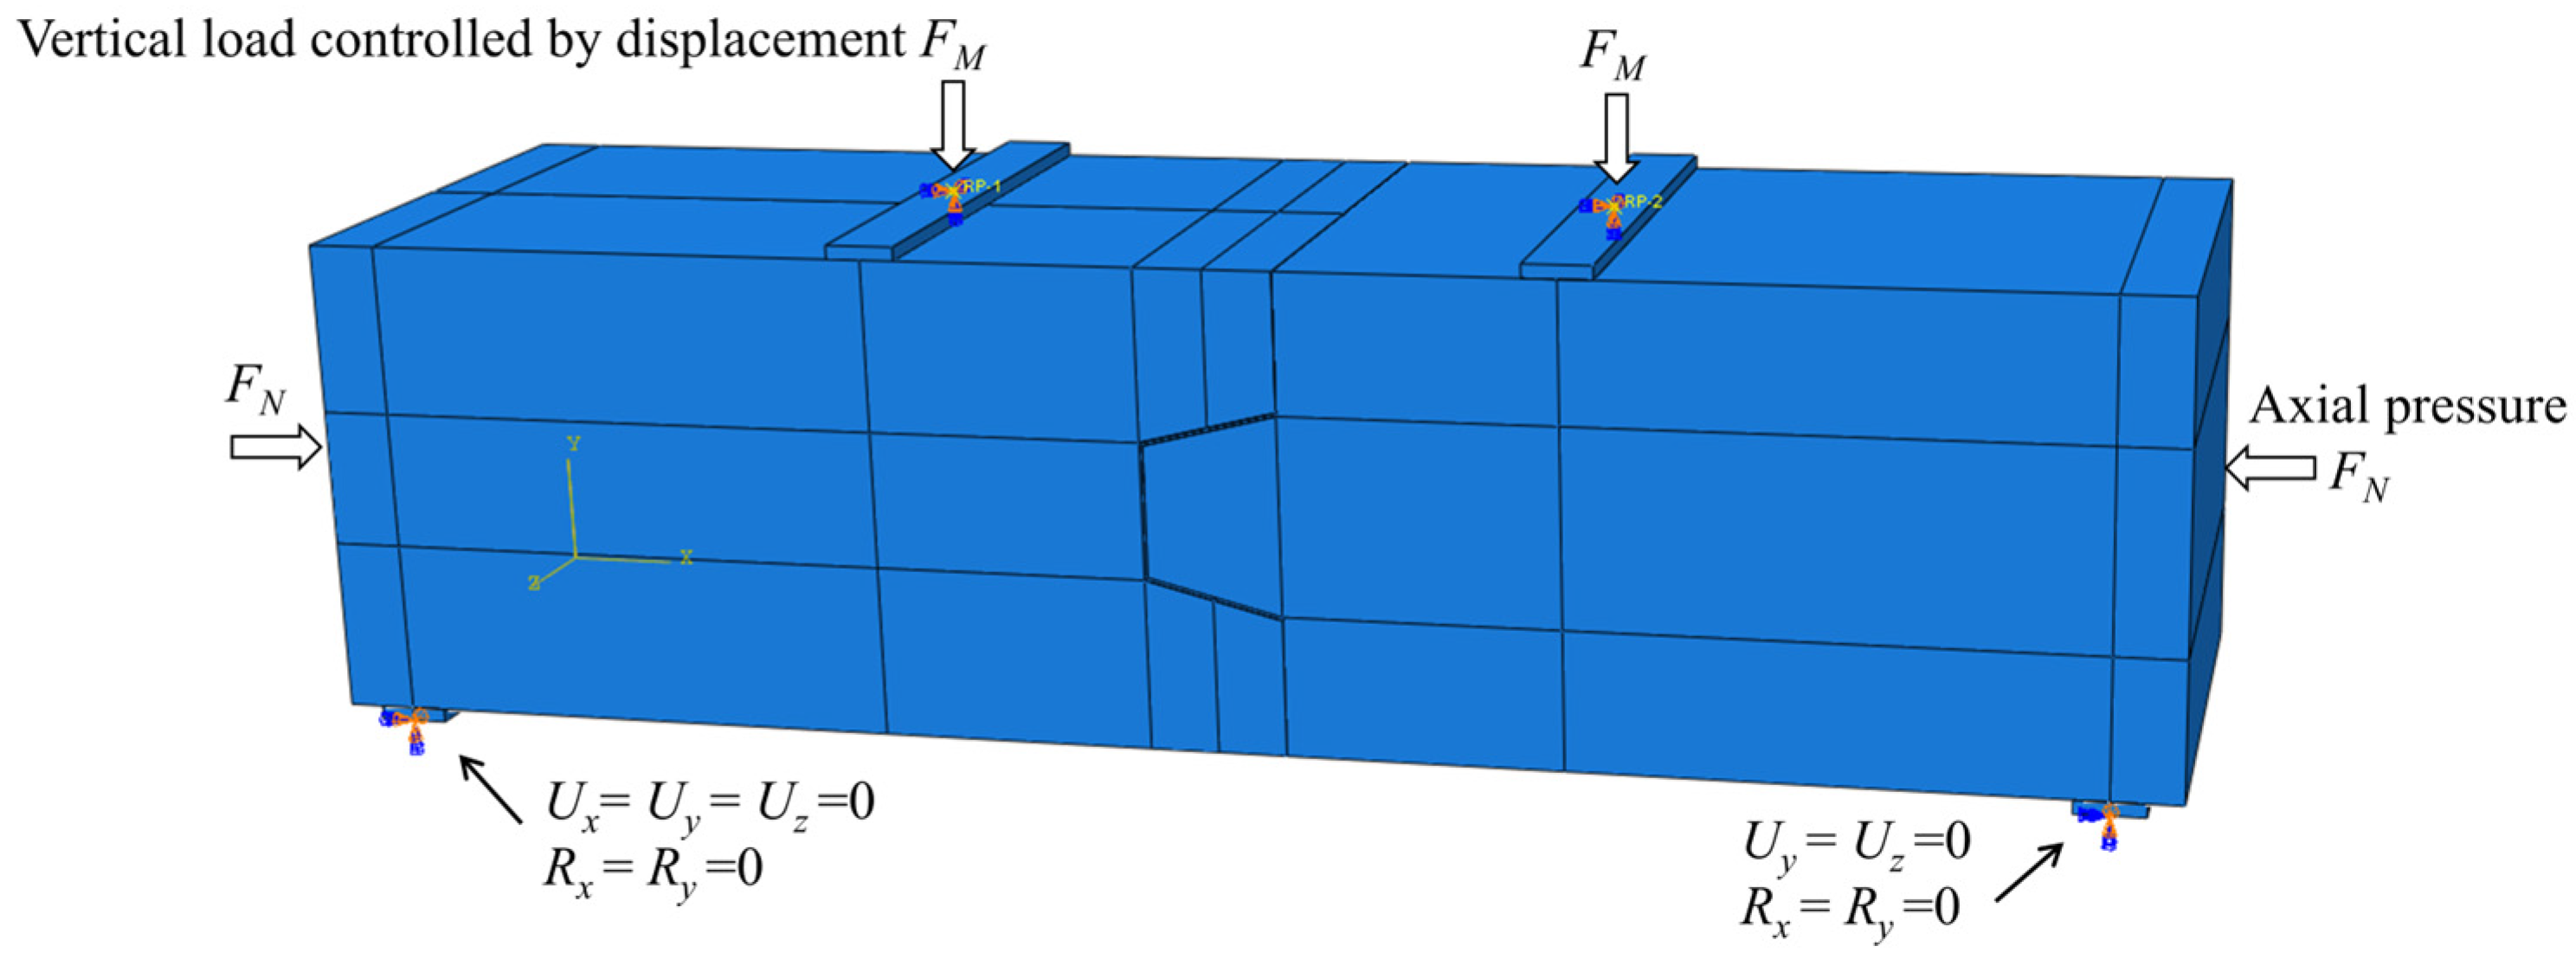
Since no relative slip between the reinforcement and concrete was observed during the experimental loading process, the bond–slip effect was neglected [19,21]. The interaction between the reinforcement and concrete was simulated using the embedded element method. A tie constraint was applied to the contact areas between the steel plates and the GMTJ components. The boundary conditions and loading scheme of the model are shown in Figure 6. The left end of the GMTJ was defined as a fixed hinge support, restraining displacements in the X, Y, and Z directions as well as rotations about the X and Y axes. The right end was defined as a sliding hinge support, restraining displacements in the Y and Z directions and rotations about the X and Y axes.
Steel backing plates of the same specifications were symmetrically arranged at 500 mm on both sides of the mid-span section. Coupling constraints were defined at the center of the top surface of each steel plate to apply the bending moment loads. In the mechanical performance test of the joint, a more realistic representation of its in-service behavior was achieved by considering the combined effects of overburden pressure, surface loads, self-weight of the structural components, and additional operational loads in underground stations. Accordingly, an axial load of 1600 kN was applied, and the same axial pressure was imposed on both sides of the GMTJ model, consistent with the loading configuration used in the experiment. The loading procedure consisted of three steps. The first step was an initial analysis step in which the boundary conditions were assigned. In the second step, the horizontal axial load was applied at a constant rate. In the third step, bending moments were applied uniformly at the two sides of the mid-span region.

2.5. Validation of the Numerical Model

To verify the accuracy and rationality of the finite element model for subsequent parametric analysis, this section extracts the distribution of maximum principal plastic strain (PE, Max, Principal), concrete tension damage fields, load–displacement relationships, and moment–rotation curves at the mid-span of the joint. A comparative analysis is then conducted between the numerical results and the experimental data.

2.5.1. Comparative Analysis of Joint Failure Modes

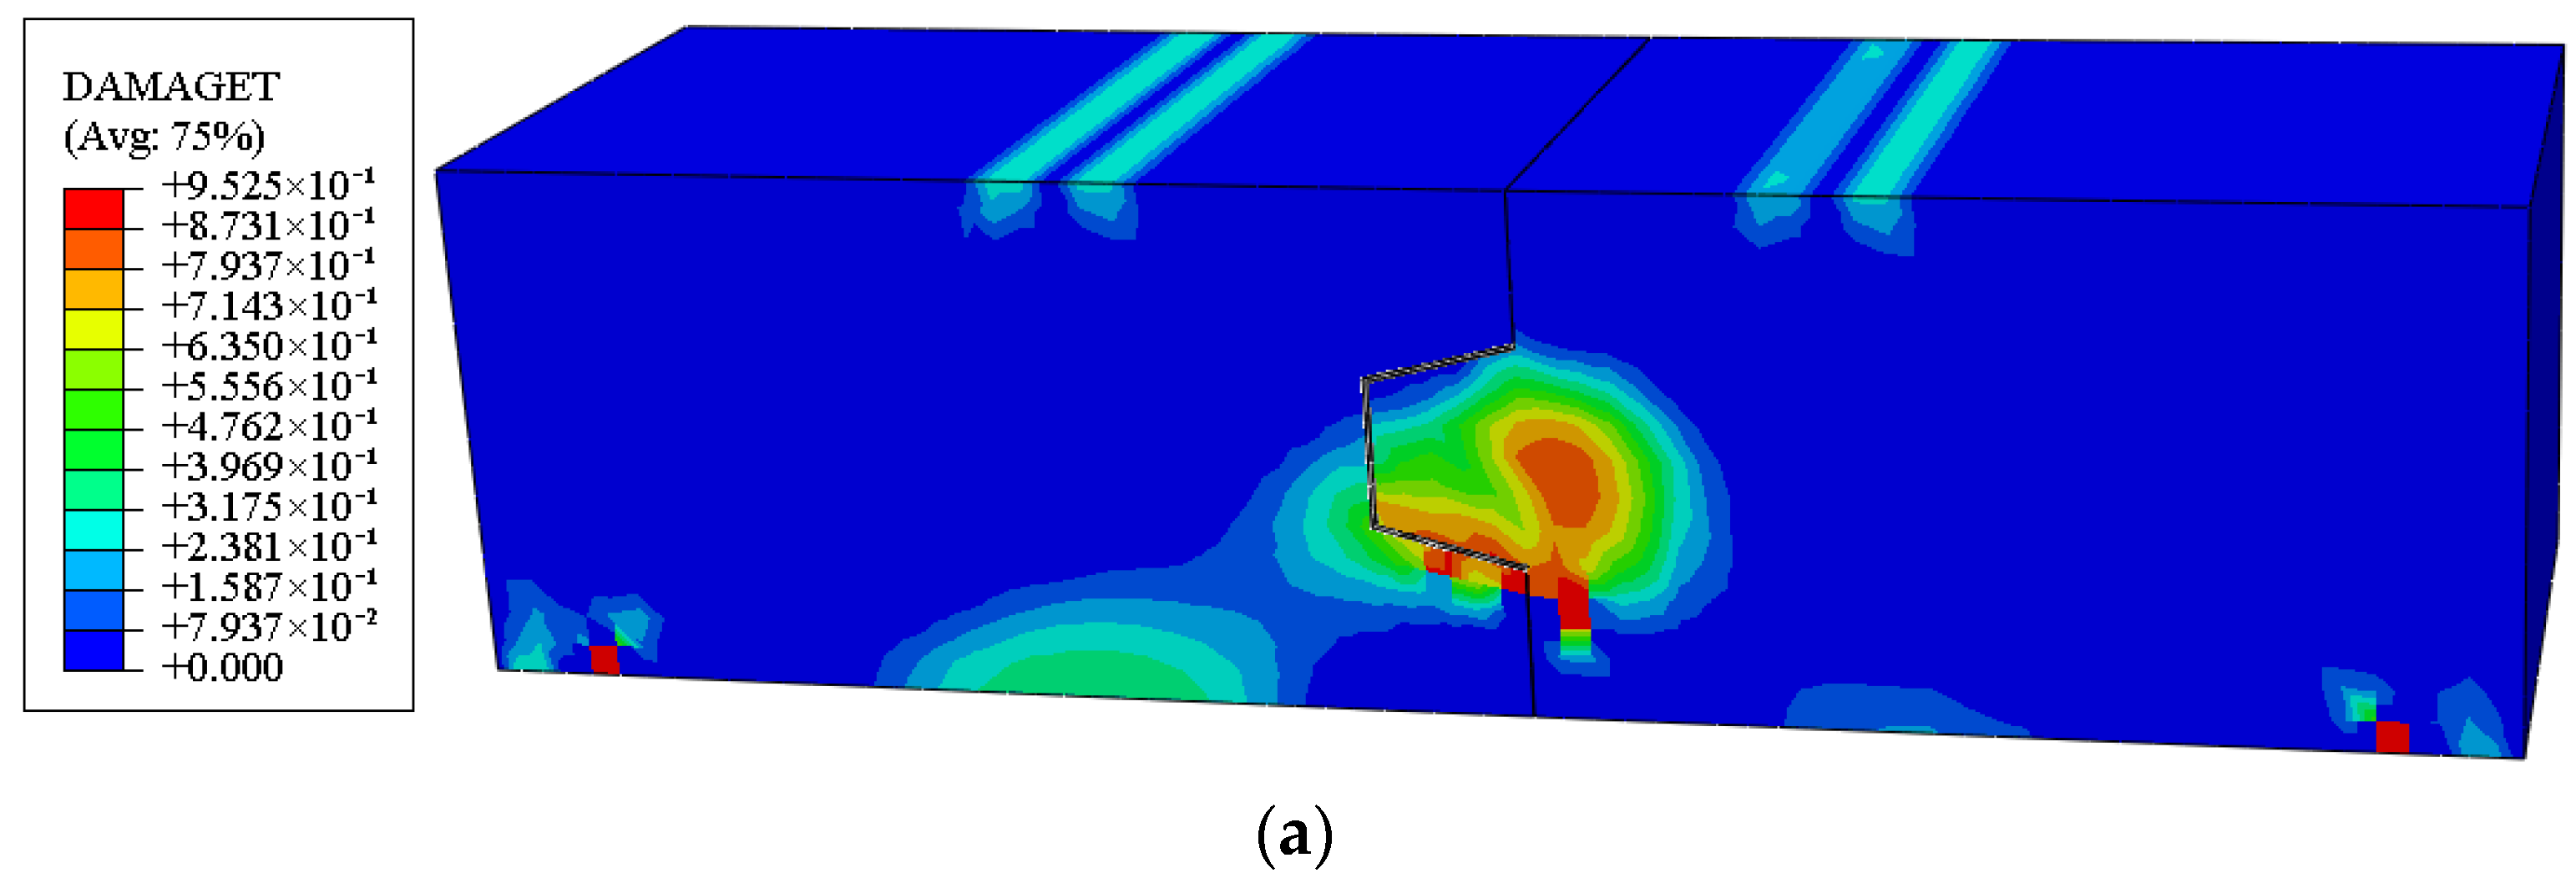
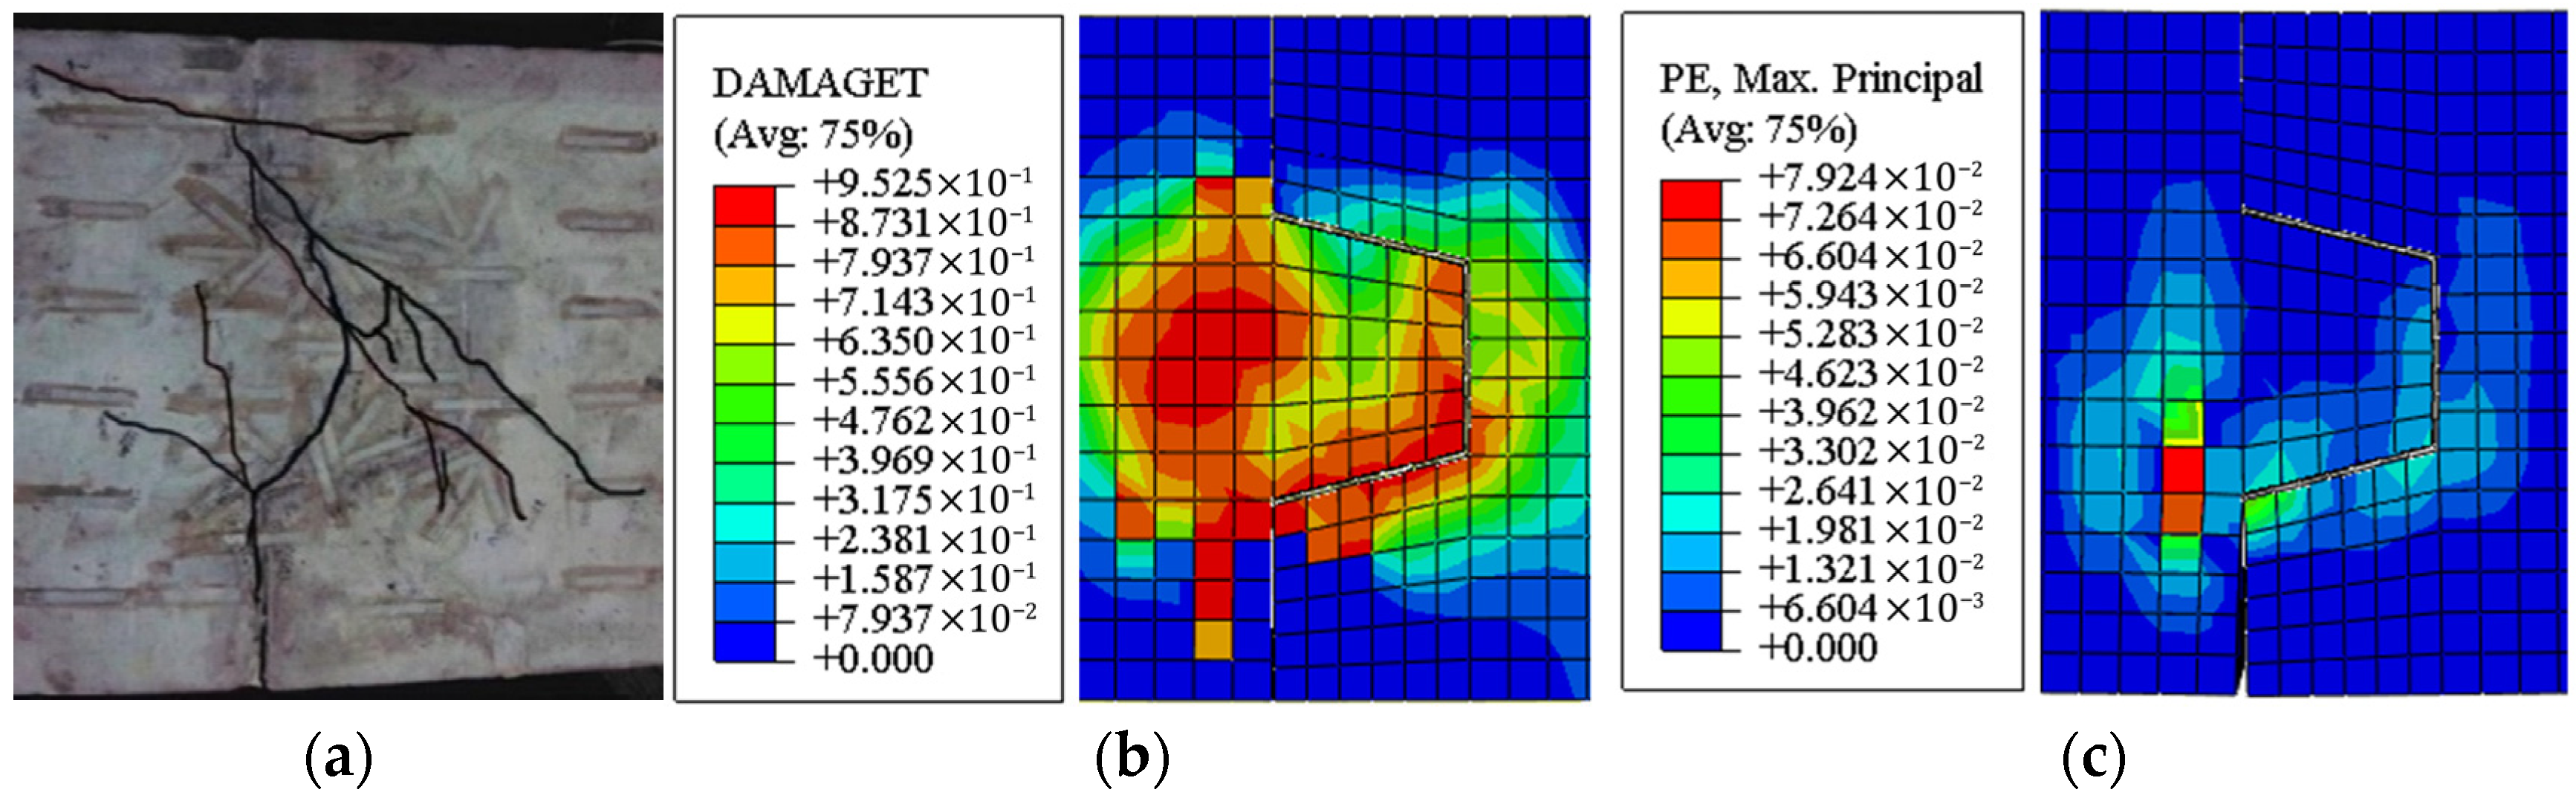
The tension damage contours and maximum principal plastic strain contours from the ABAQUS analysis results can be used to characterize the crack distribution and failure modes of the model. Figure 7 illustrates the comparison between the final failure mode, tension damage distribution, and maximum principal plastic strain distribution of the GMTJ model.
According to the experimental results in Figure 7a, crack extension in the GMTJ initiates near the joint interface in the tension zone. As the bending moment increases, the cracks gradually develop until severe concrete cracking occurs at the root and mid-section of the joint. As shown in Figure 7b,c, the regions where the tension damage factor exceeds 0.85 are concentrated at the root and mid-section of the GMTJ. Furthermore, the maximum principal plastic strain is primarily localized within the same area. This indicates that the simulated concrete failure mode and crack extension are in good agreement with the experimental observations. Consequently, it demonstrates that the finite element model, element types, and meshing strategy adopted in this study for the GMTJ components are both reasonable and accurate.
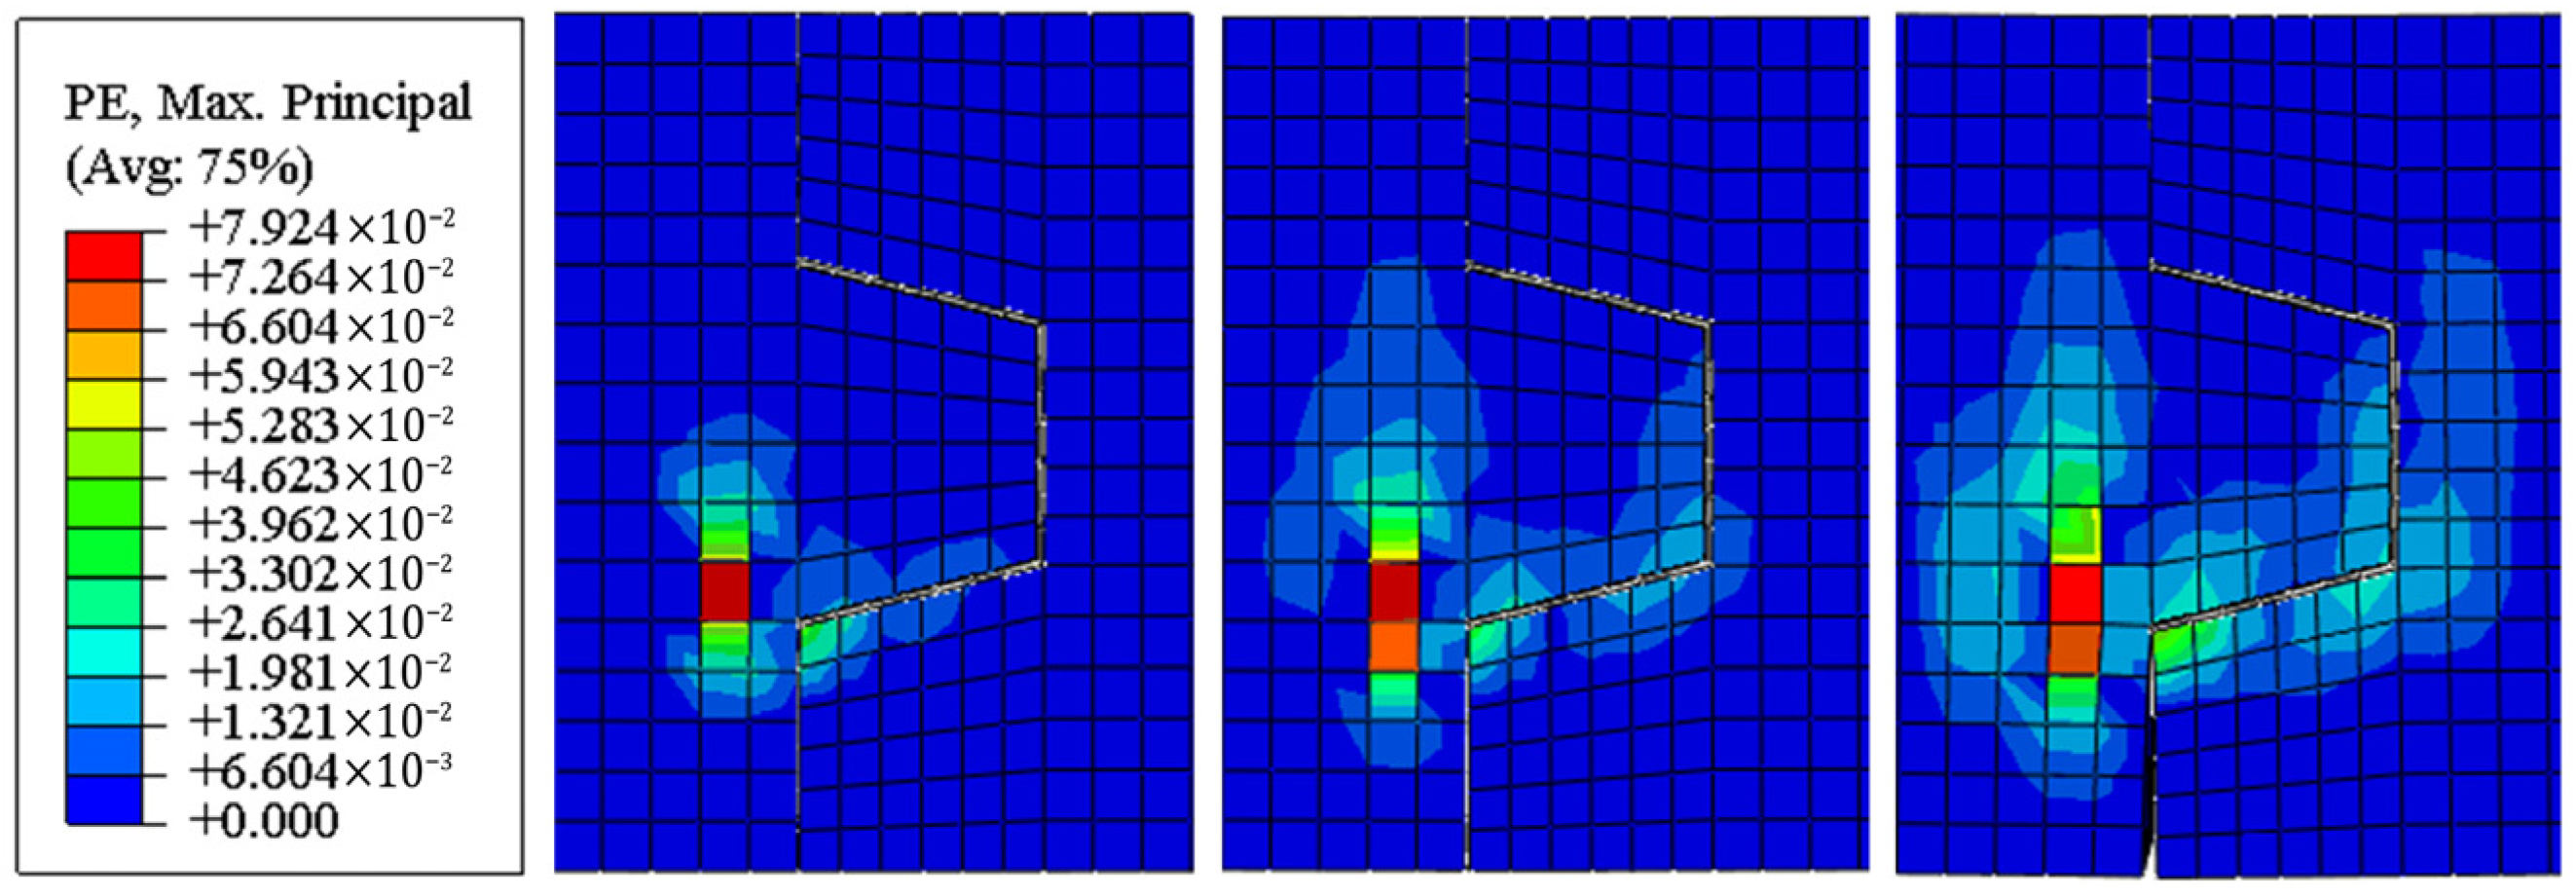
Figure 8 presents the crack development contour of the GMTJ during the bending moment loading process. The initial cracking occurred at the end of the grouted segment on the tension side of the joint. As the bending moment increased, the cracks primarily propagated along the root and mid-region of the tenon. When the specimen reached its ultimate load-carrying capacity, the cracks extended toward the tenon end and eventually penetrated the entire tenon region [33,34].

2.5.2. Comparative Analysis of Load–Displacement and Moment–Rotation Relationships at the Mid-Span of the Joint

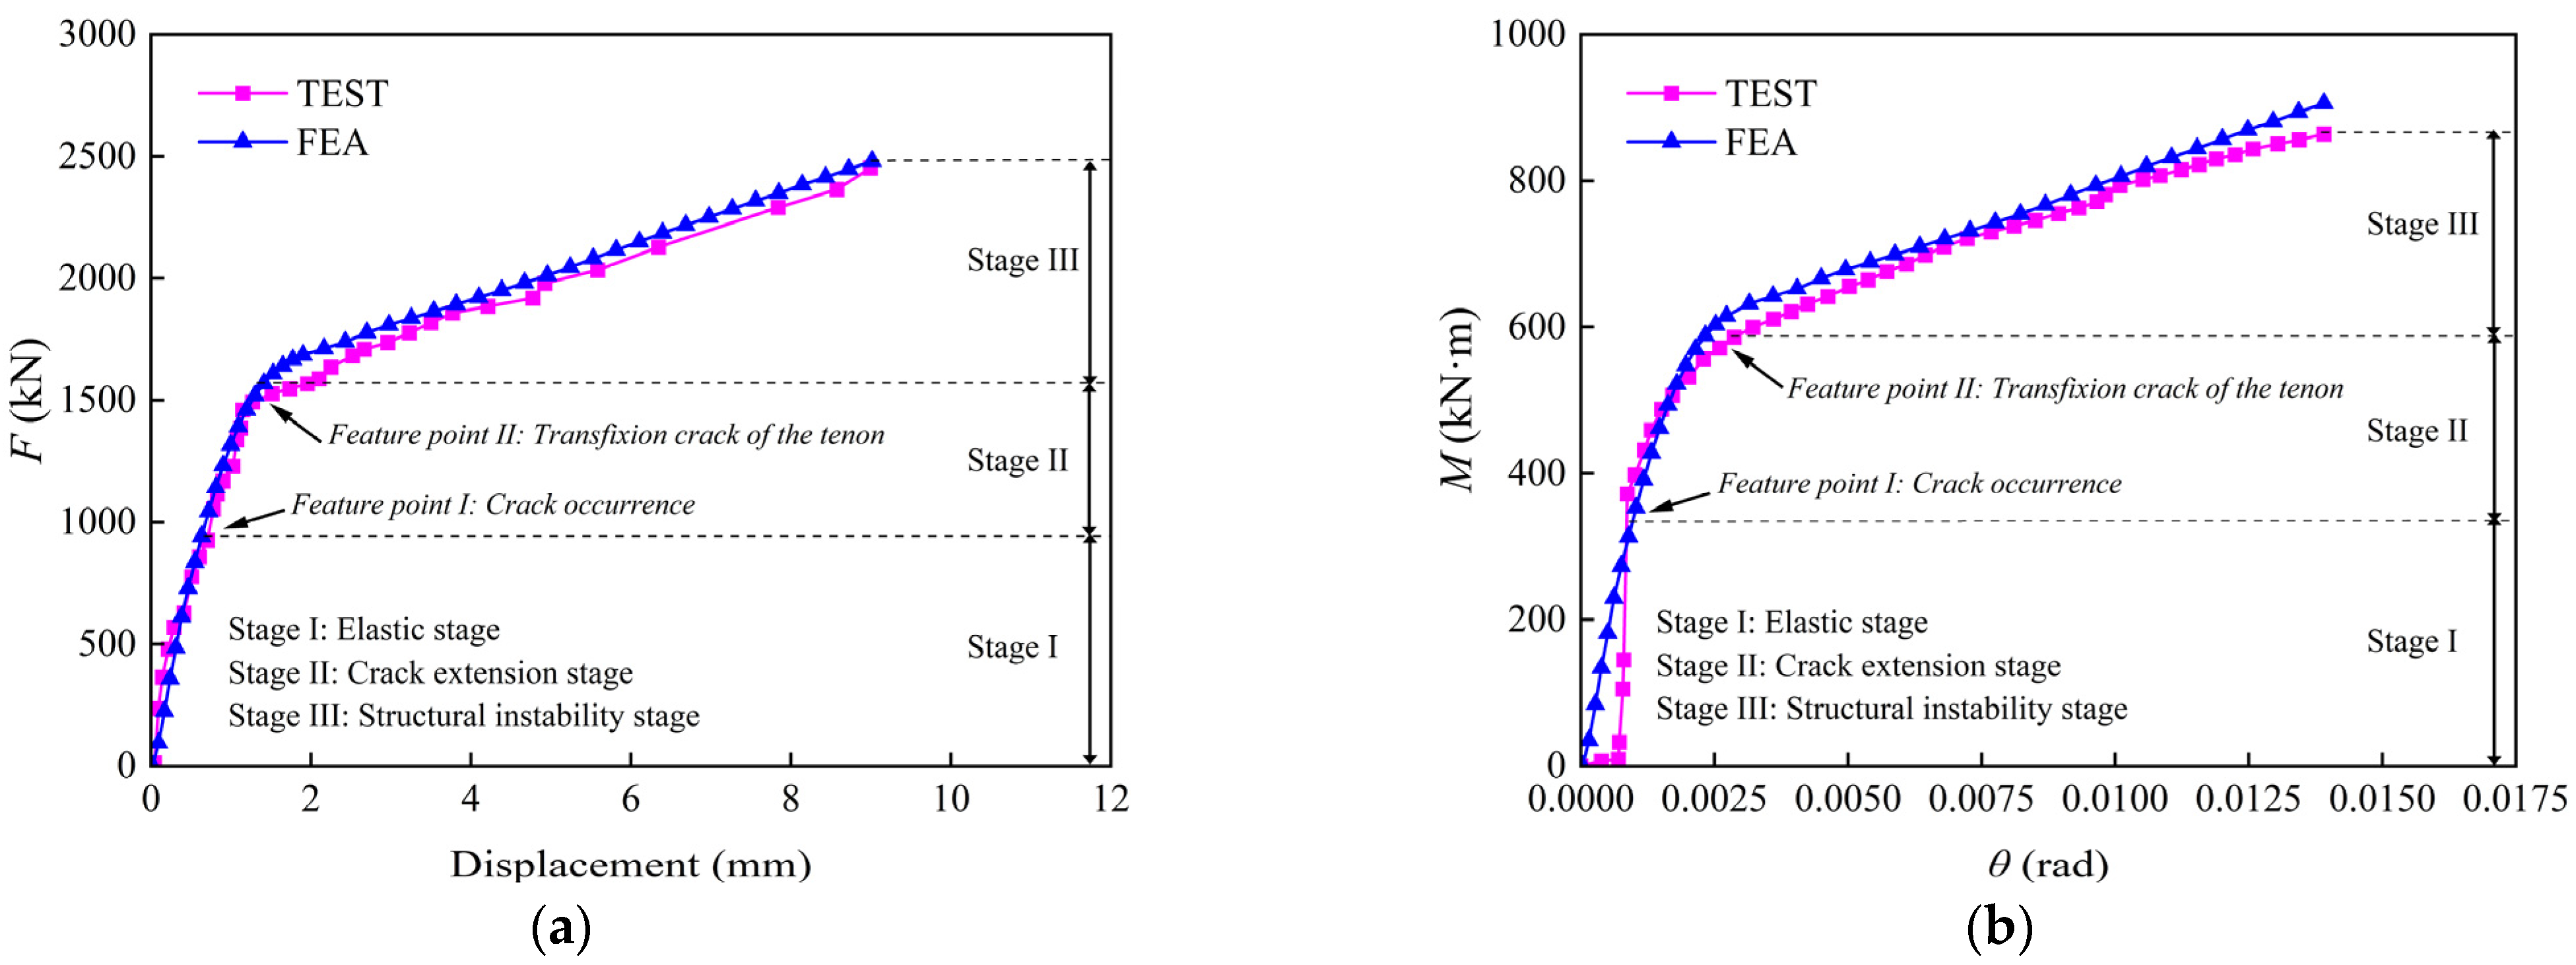
The mid-span displacement and rotation of the GMTJ components are macroscopic manifestations of the mechanical performance at the joint, reflecting its capacity to resist bending moments. Furthermore, the joint rotation serves as the fundamental basis for calculating the rotational stiffness of the interface. Figure 9 shows the load–displacement curves and moment–rotation curves at the mid-span of the GMTJ components obtained from the finite element analysis. In Stage I, the GMTJ is in the elastic stage, where the concrete has not yet cracked. When the loading reaches Feature Point I, the joint enters Stage II, the crack extension stage. At this point, cracks initiate in the concrete and gradually extend until they penetrate the entire tenon. The flexural stiffness kθ of the joint in Stage II is 30% to 80% of that in Stage I. Upon reaching Feature Point II, the joint enters Stage III, the structural instability and failure stage. At this stage, the kθ of the joint falls below 30% of that in Stage I and continues to decrease. Stage I and Stage II, culminating at Feature Point II, represent the primary bearing phases where the GMTJ develops its bending capacity. Typically, these two stages are considered the total load-bearing capacity of the joint. By comparing the curves with the experimental results, it can be observed that the experimental and finite element analysis show close agreement. This indicates that the numerical results are reasonable and accurate, and can precisely represent the load–displacement and moment–rotation relationships of the GMTJ.
The mechanical performance indicators obtained from both the experiments and finite element analysis are summarized in Table 2. Compared with the experimental results, the average errors for Feature Point I and Feature Point II in the simulated load–displacement and moment–rotation curves are 7% and 5.8%, respectively, both of which are within a 10% discrepancy range. The average flexural stiffness of the joint in the three stages obtained from both the experiment and the finite element analysis is listed in Table 3. The discrepancies in flexural stiffness for Stages II and III are relatively small, whereas the error in Stage I reaches 34%. This may be attributed to the fact that, in full-scale specimens cast for laboratory testing, the actual concrete strength is often higher than the design strength specified in the Code for Design of Concrete Structures [26], resulting in a slightly lower flexural stiffness predicted by the finite element analysis in Stage I compared with the experimental results. These results indicate that the numerical calculations are accurate and fundamentally consistent with the experimental data. This demonstrates that the finite element model can effectively simulate the entire loading process of the GMTJ components and is suitable for further parametric studies.

2.6. Parametric Analysis

In prefabricated subway stations, the joints between precast components govern the mechanical performance of the entire station structure. Therefore, investigating the effects of different concrete strength grades and longitudinal reinforcement ratios on the mechanical performance of the joints is of significant practical importance. When investigating the effects of different concrete strength grades on the mechanical performance and failure modes of the GMTJ components, the variables include the elastic modulus and the constitutive model of the joint components. In contrast, when studying the impact of the longitudinal reinforcement ratio, the primary variable is the number of longitudinal reinforcement bars in the joint. According to the provisions of the Code for Design of Concrete Structures [26], the specific parameters of the modified numerical models are listed in Table 4. The naming convention for each case is as follows: “C” represents the concrete strength grade, and “N” represents the number of longitudinal reinforcement bars in the tension and compression zones of the GMTJ.

3. Influence of Concrete Strength Grade on the GMTJ

3.1. Mechanical Performance

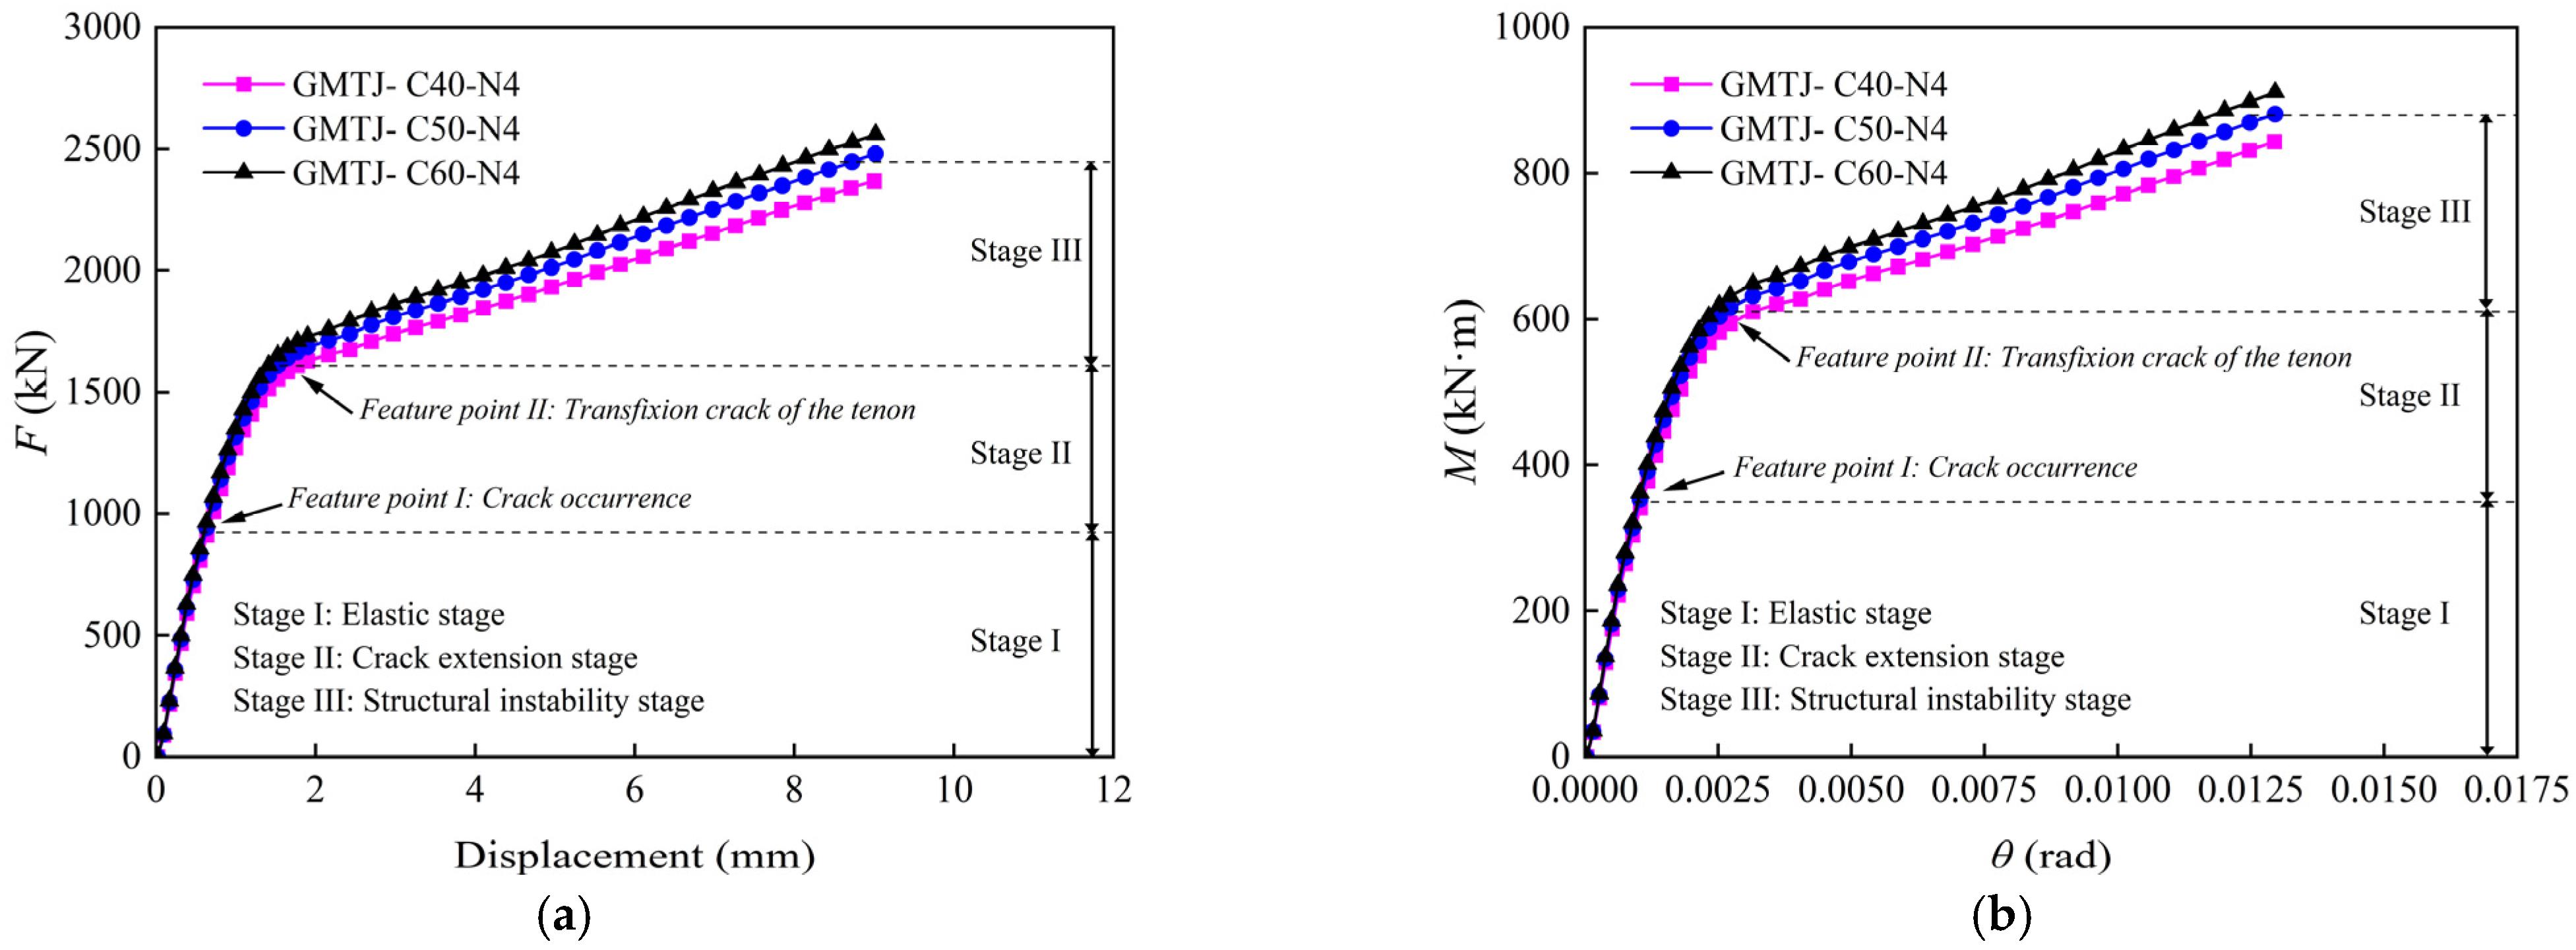
When the concrete strength grade of the GMTJ components varies from C40 to C60, the mid-span load–displacement and moment–rotation relationship curves obtained through finite element analysis are shown in Figure 10.
As shown in Figure 10, the load–displacement and moment–rotation curves of the GMTJ models exhibit the same evolutionary trend across different concrete strength grades. In Stage I, the concrete strength grade has a minimal impact on the elastic limit and bending stiffness of the GMTJ components. When subjected to the same bending moment, the mid-span displacement and joint rotation remain essentially identical across different concrete strength grades. However, the bending capacity at the point of tenon crack transfixion in the tenon increases with the enhancement of the concrete strength grade. When the concrete strength grade increases from C40 to C60, the loads at the point of tenon crack transfixion are 1504.1 kN, 1608.6 kN, and 1683.8 kN, with corresponding bending moments of 563.7 kN·m, 603.2 kN·m, and 631.4 kN·m, respectively. As the concrete strength increases from C40 to C50, the bearing capacity improves by 7.0%. Subsequently, when the grade increases from C50 to C60, the bearing capacity further increases by 4.95%. When the load or bending moment of the GMTJ components is kept constant, increasing the concrete strength grade can effectively reduce the displacement and rotation of the joint, thereby enhancing the bending stiffness and deformation resistance of the structure. Consequently, when there are strict requirements regarding the displacement and rotational deformation of the joint components, appropriately increasing the concrete strength grade can be considered, provided that economic constraints are satisfied.

3.2. Stress Distribution

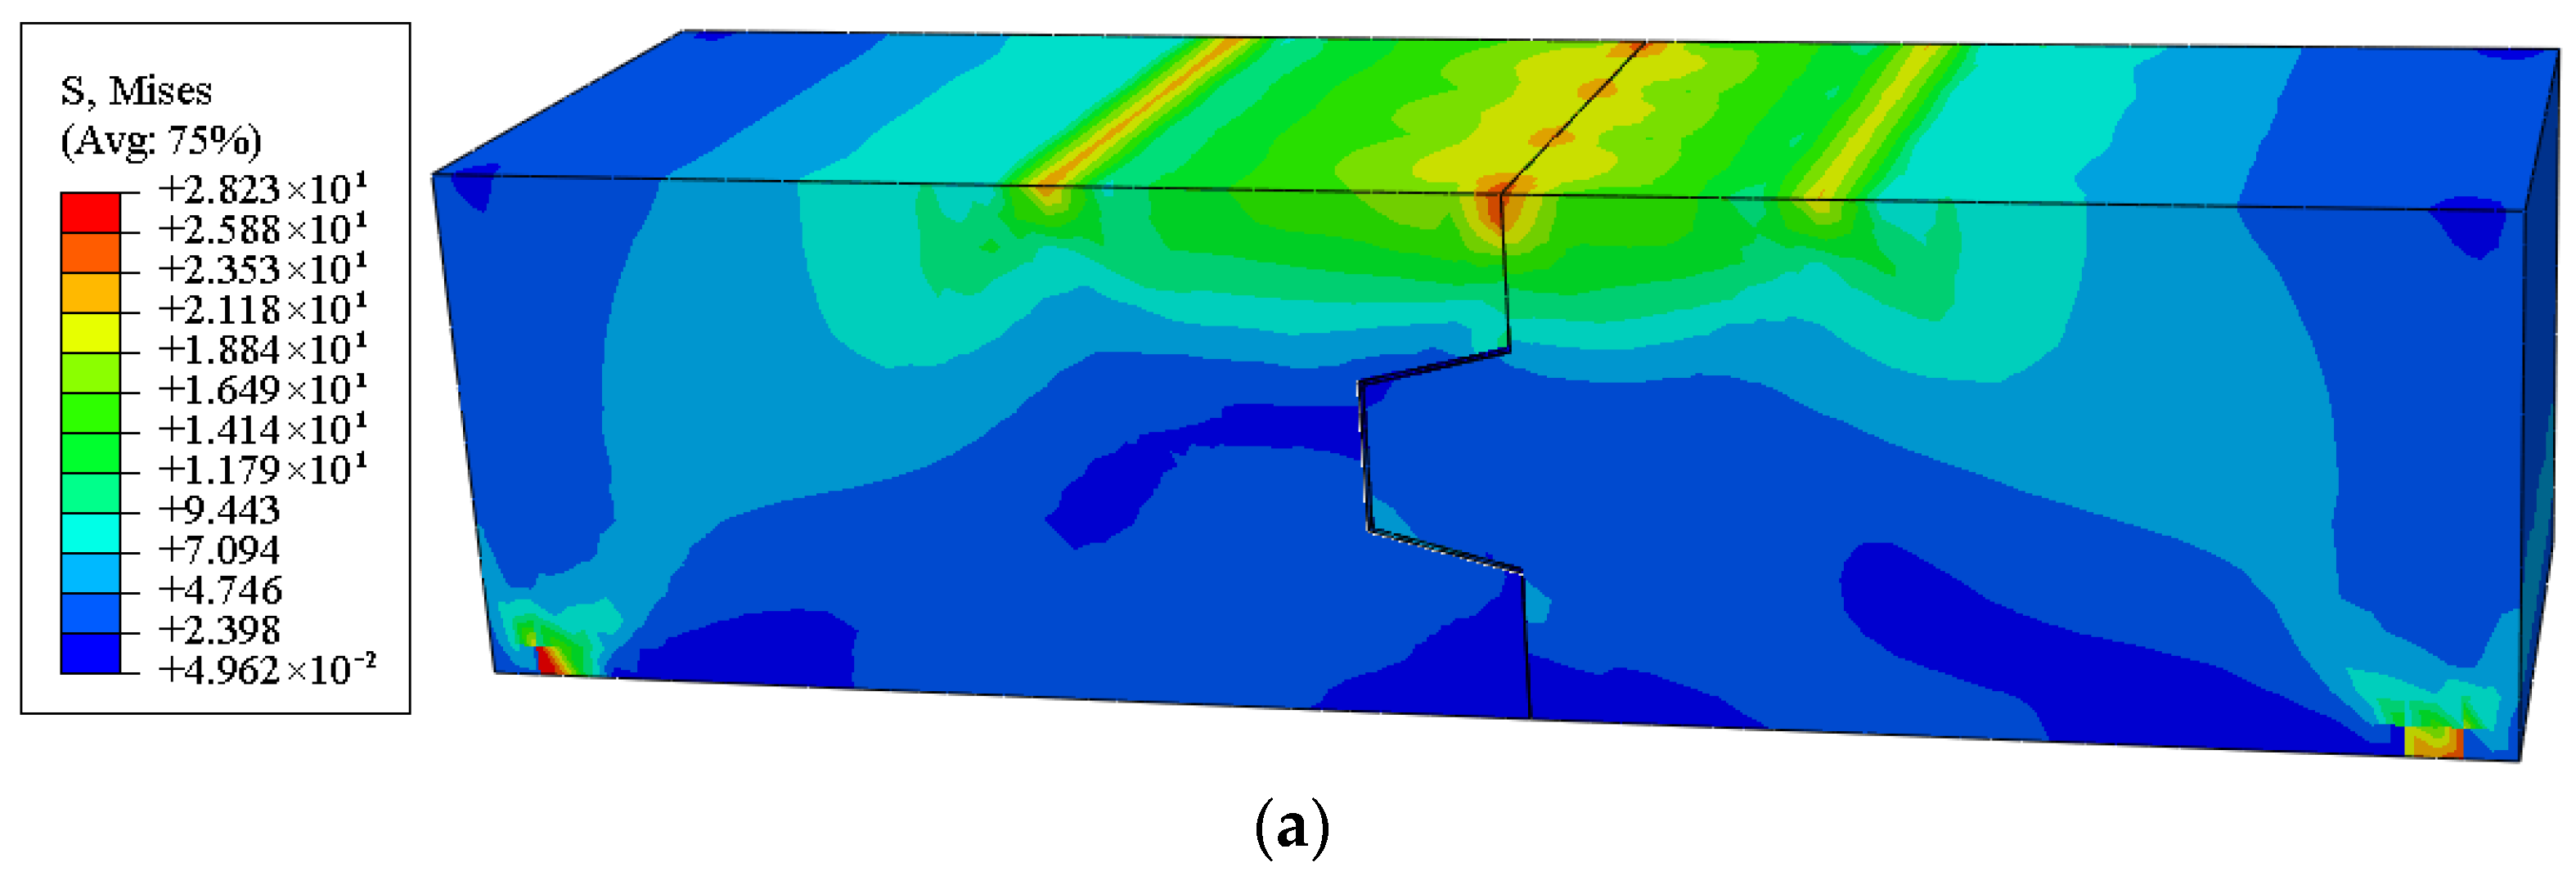
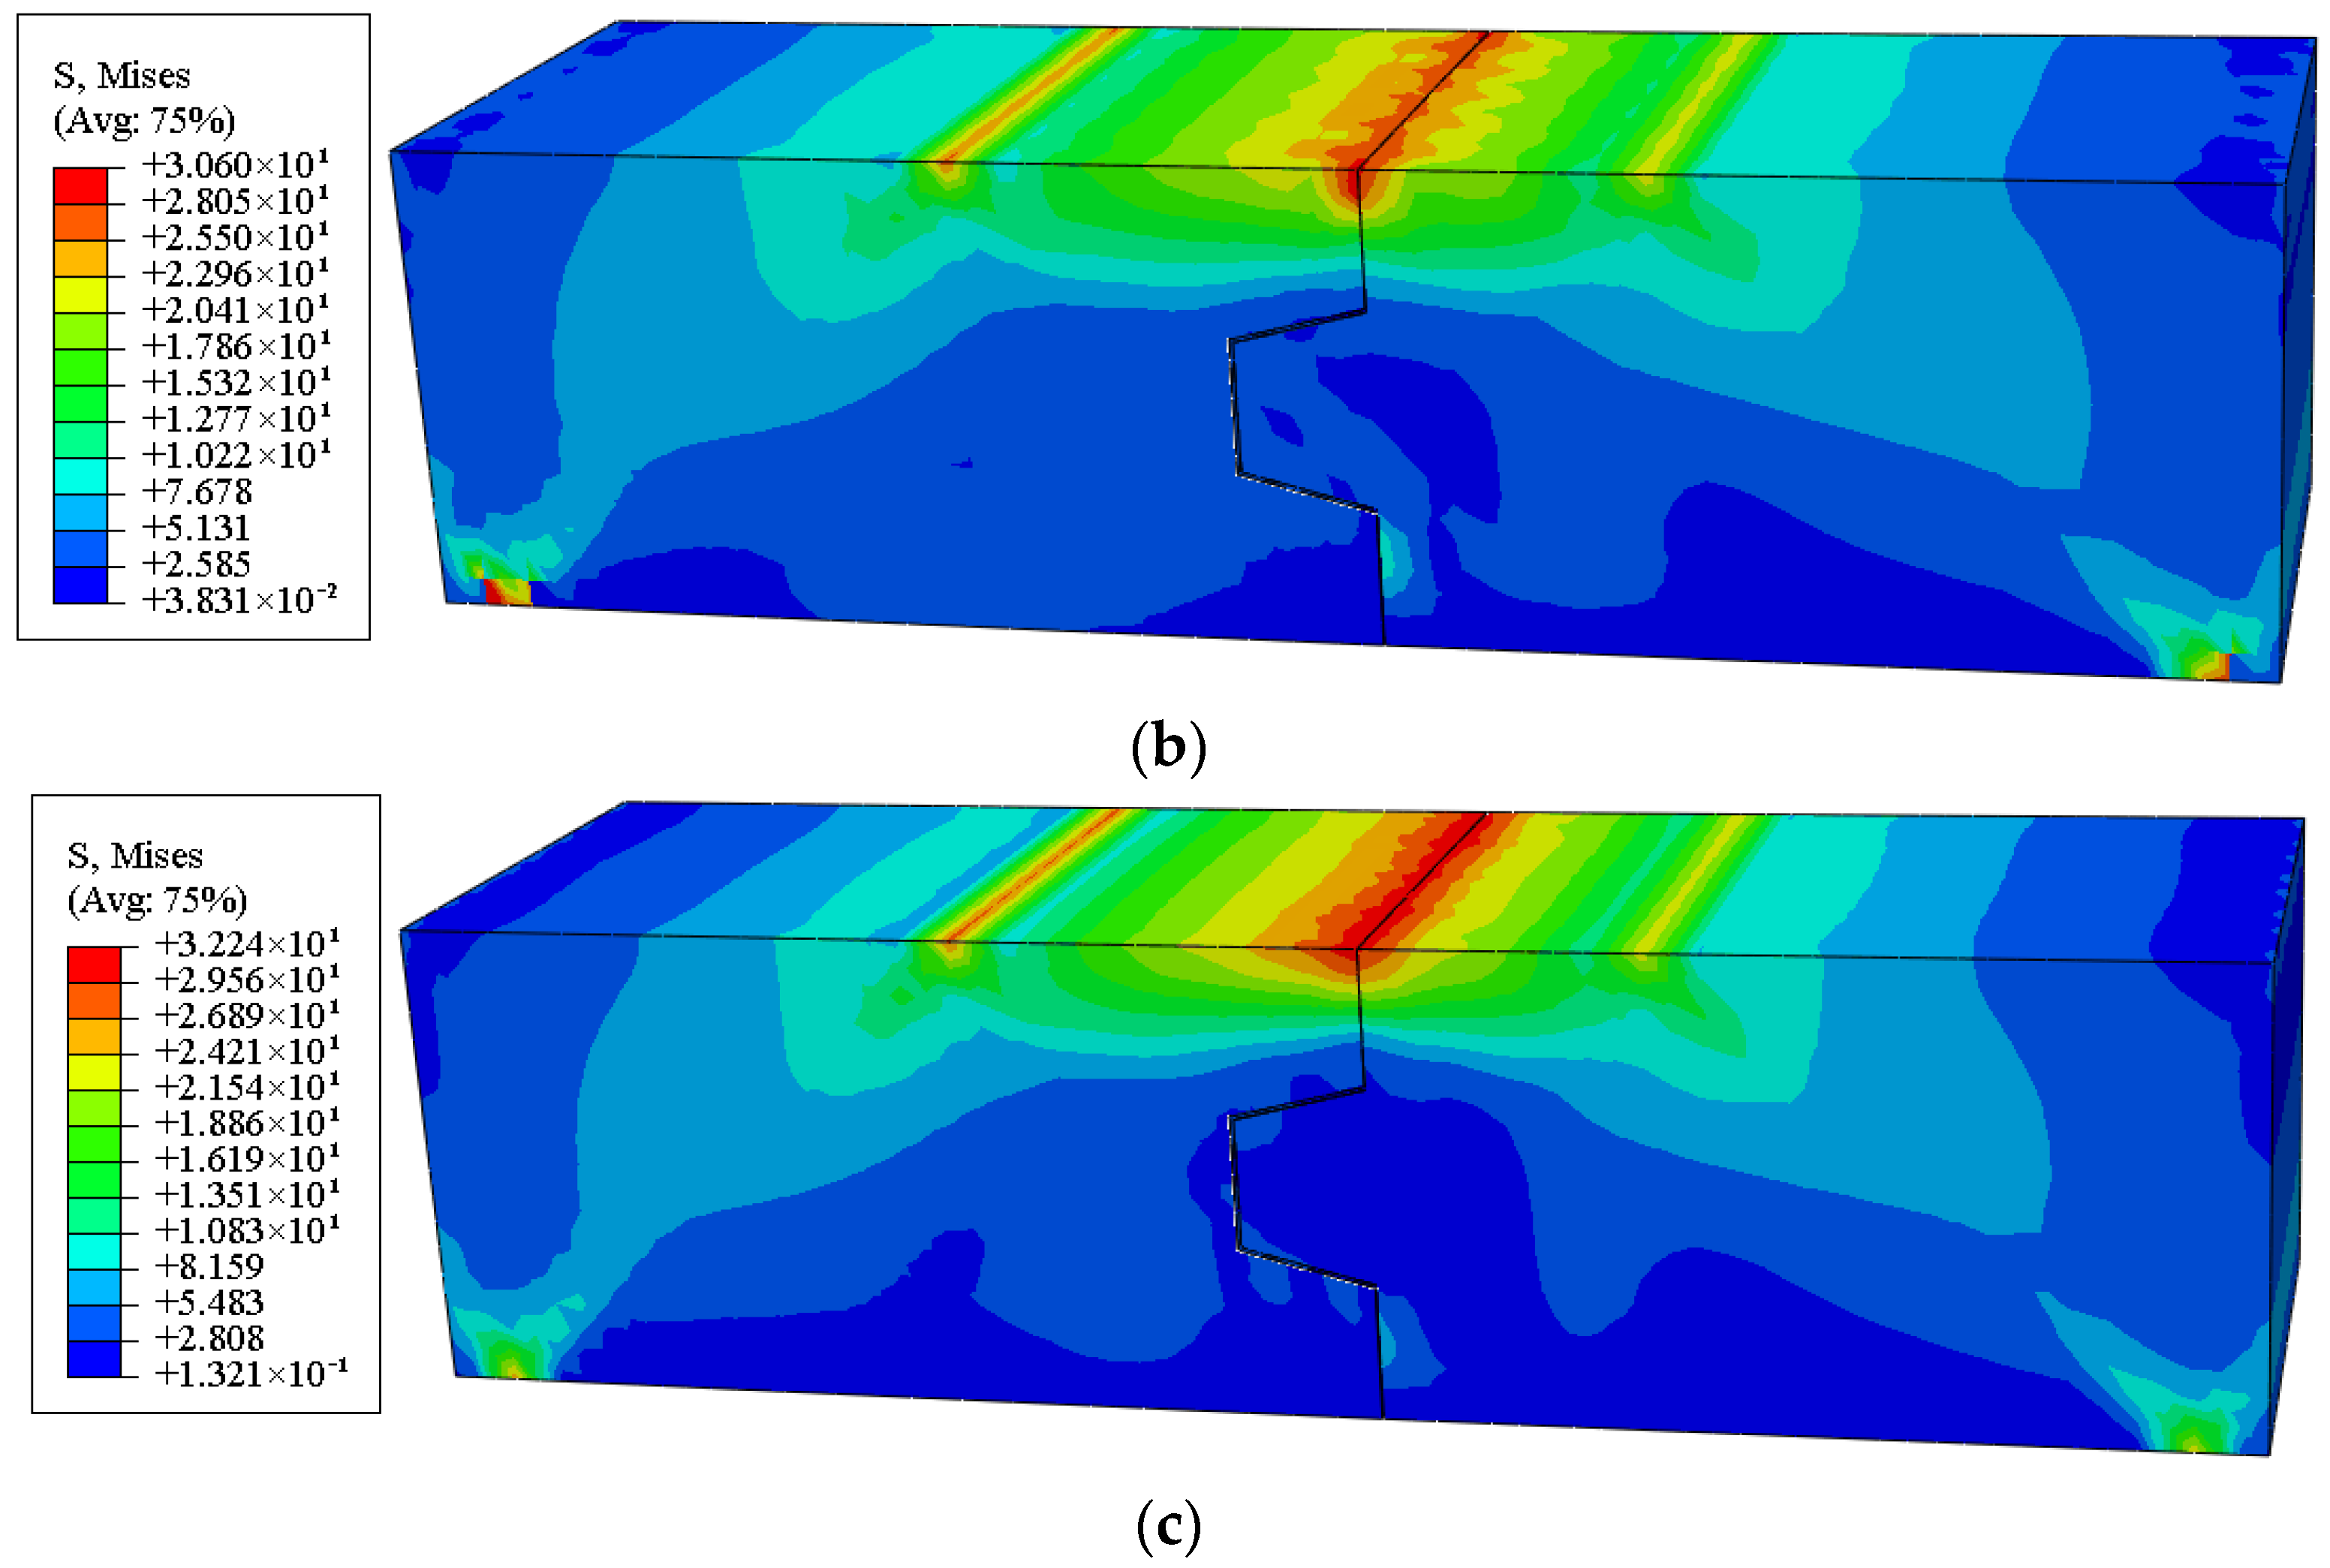
Figure 11 shows the stress distribution contours of the GMTJ components at the state of tenon crack transfixion.
The stress distributions of the joint components with different concrete strength grades are similar. For all GMTJ components, the peak stress occurs in the concrete at the joint interface within the compression zone. This is attributed to the separation of the lower contact surfaces when the joint component is subjected to a bending moment, causing the joint interface at the upper end to become the primary compression zone. By comparing the stress contours, it can be observed that at the stage of tenon crack transfixion, both the stress near the joint interface in the compression zone and the peak stress of the joint component increase to varying degrees as the concrete grade improves. When the concrete strength grade increases from C40 to C60, the peak stress values of the concrete are 25.3, 28.2, and 30.7 MPa, respectively. This indicates that increasing the concrete strength grade can effectively enhance the flexural bearing capacity of the GMTJ components. As the concrete strength increases from C40 to C50, the flexural capacity improves by 11.5%, and when it further increases from C50 to C60, the capacity increases by 8.9%.

3.3. Principal Plastic Tensile Strain

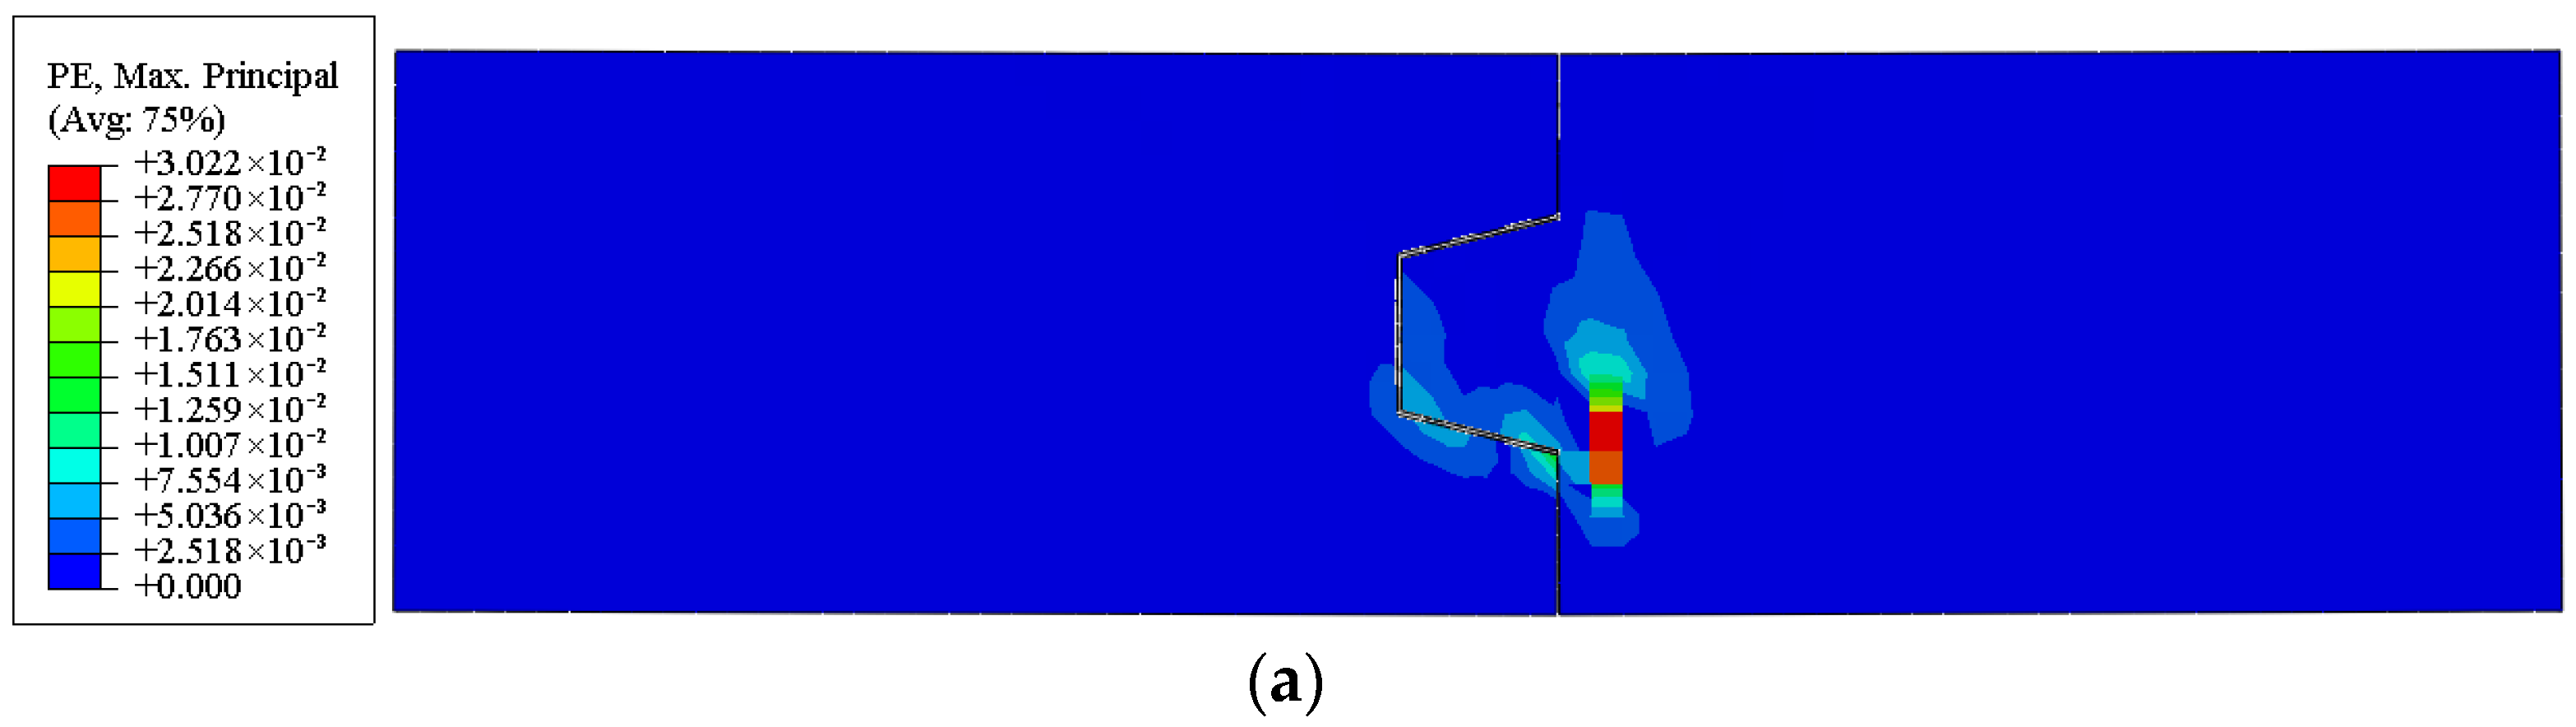
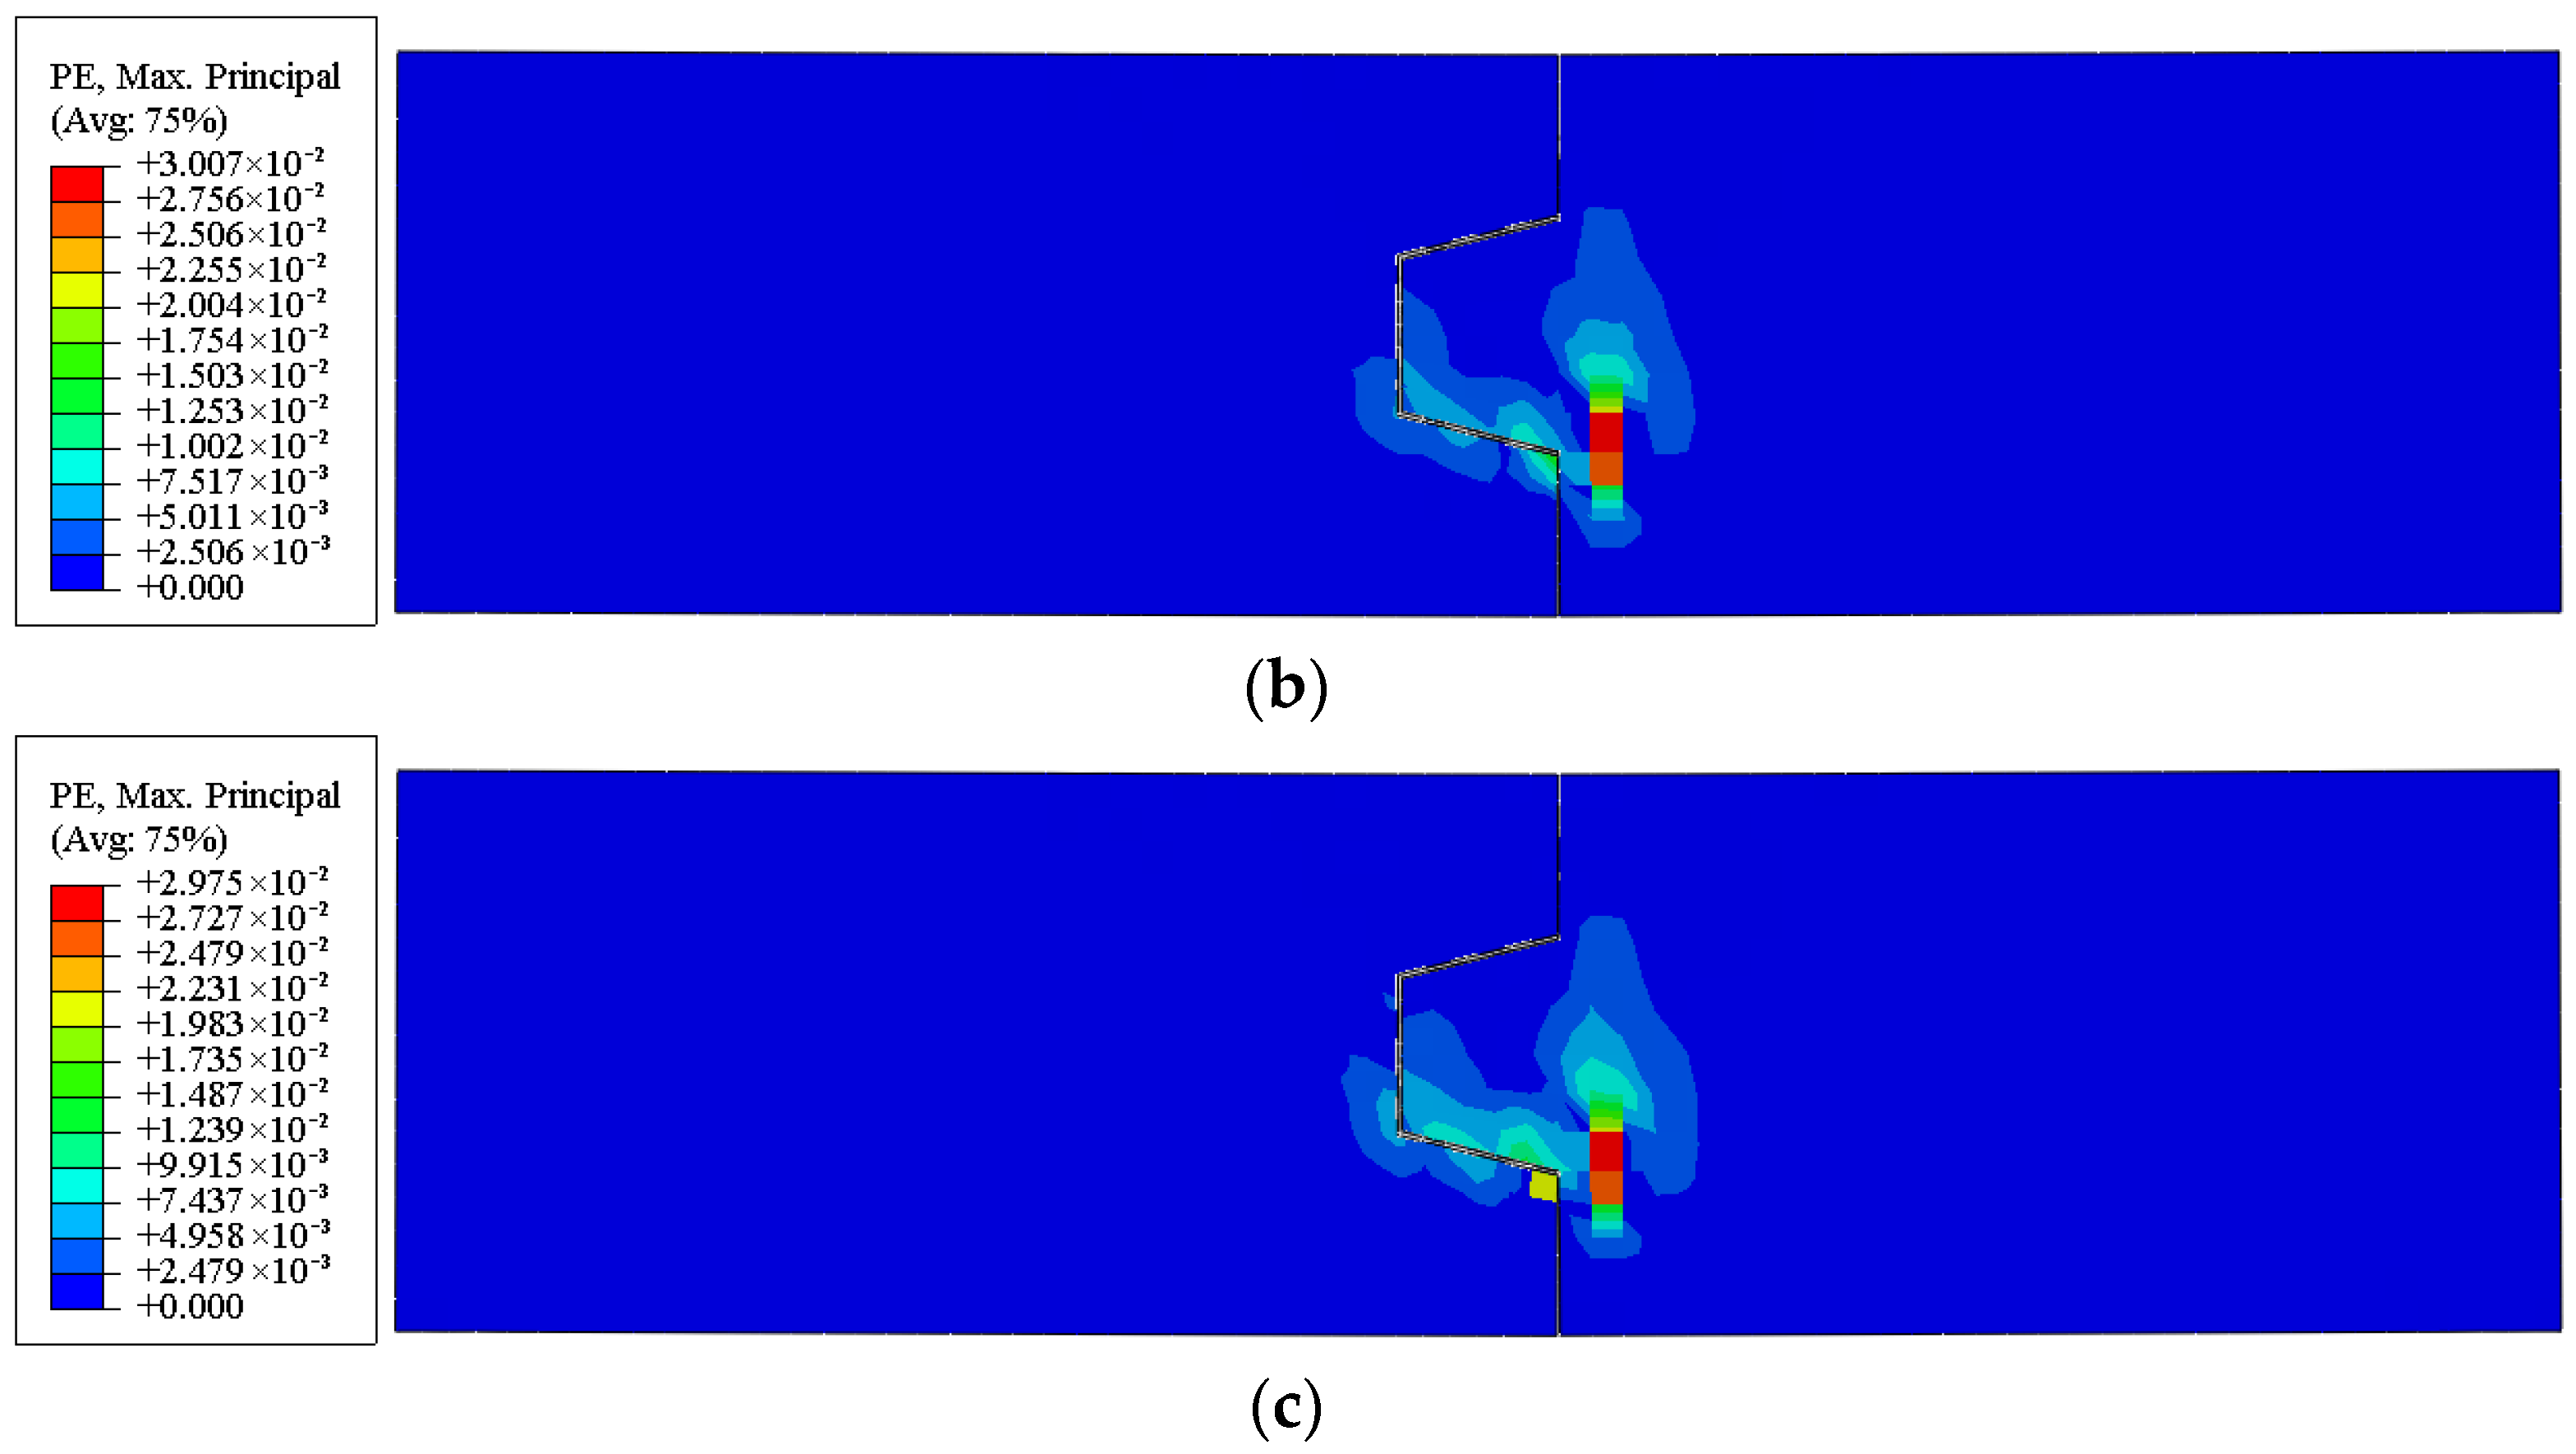
Figure 12 shows the concrete principal plastic tensile strain contours of the GMTJ components at the point of tenon crack transfixion.
According to the concrete plastic strain distribution in Figure 12, the maximum values of the principal plastic tensile strain in all three models occur near the root of the tenon. By comparing the principal plastic tensile strains of different concrete strength grades, it can be concluded that when the vertical displacement of the joint is kept constant, increasing the concrete strength grade leads to a decrease in the maximum plastic strain value and a reduction in the plastic strain area of the component. This is because the increase in concrete strength grade enhances the section modulus of the GMTJ components, which reduces the maximum principal stress at the tenon section. Consequently, the cracking moment of the tenon is increased, thereby slowing down the plastic development of the concrete in the tenon region. Therefore, increasing the concrete strength grade can effectively control the crack extension rate in the joint area.

3.4. Tensile Damage

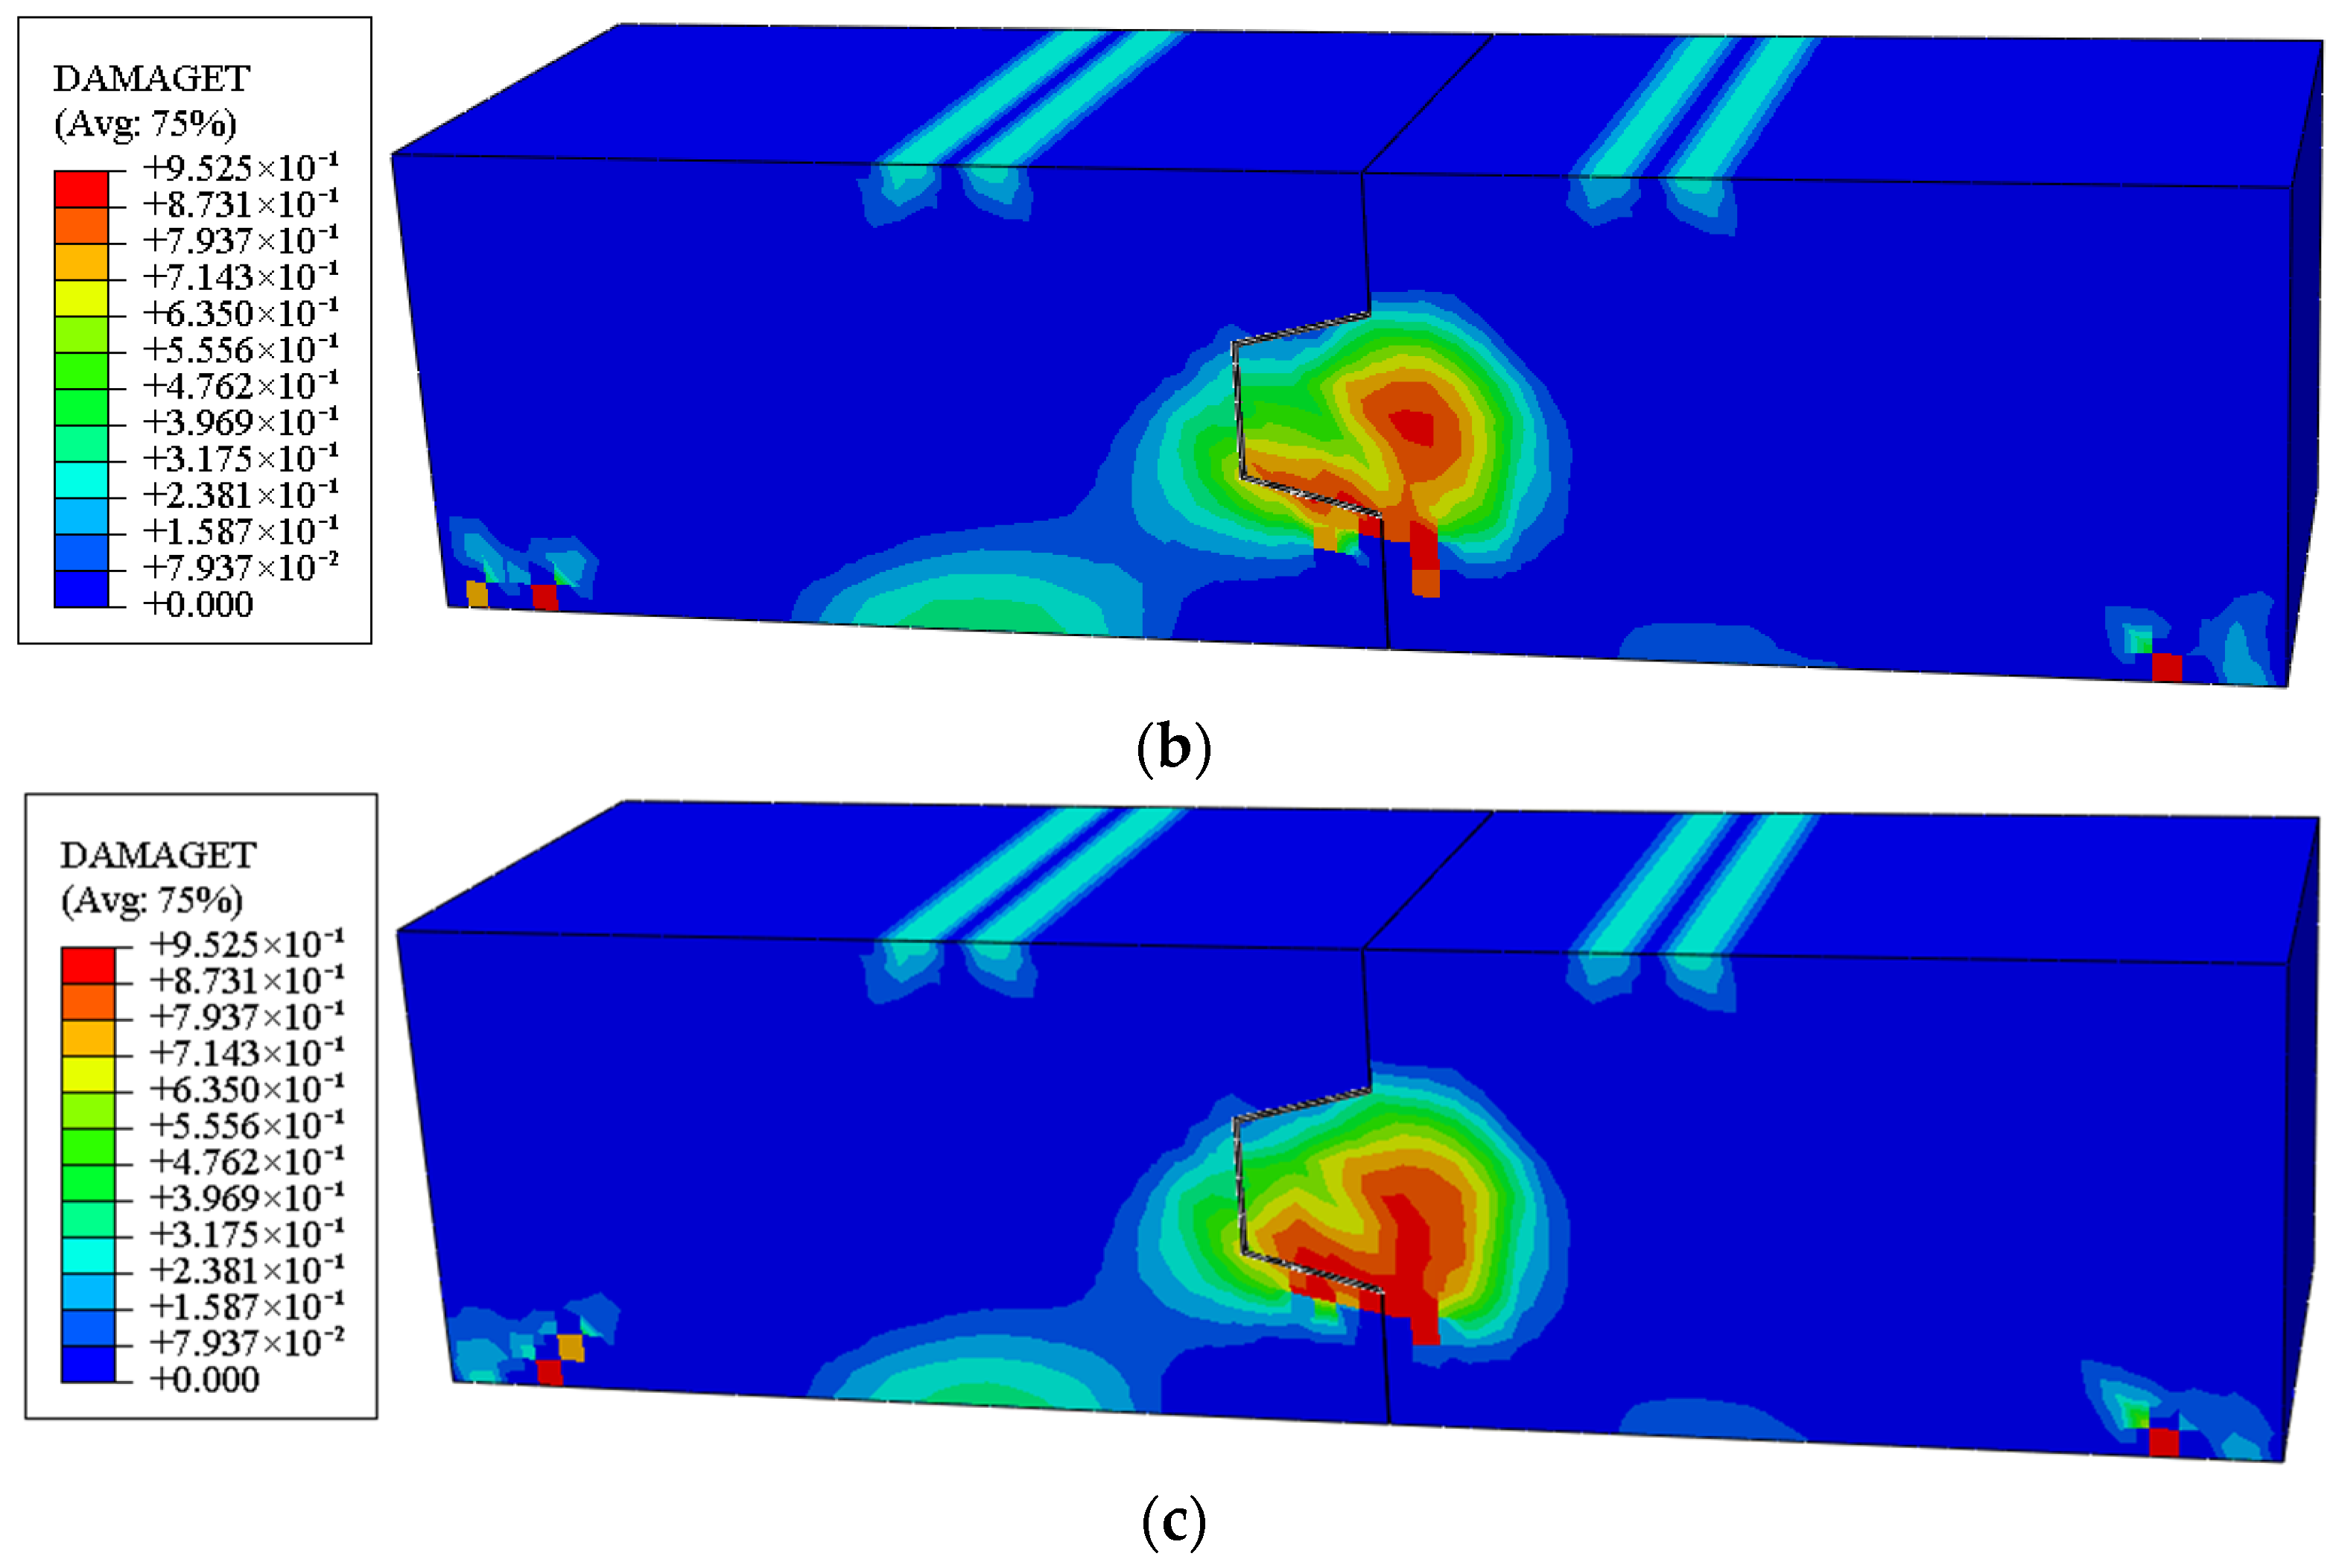
Figure 13 shows the tensile damage contours of components with different concrete strength grades at the point of tenon crack transfixion.
As shown in Figure 13, the crushed concrete zones of the GMTJ components are concentrated at the tenon root and the regions surrounding the tenon. Through comparative analysis, it can be observed that as the concrete strength grade increases, the extent of the high-damage zone (where the damage factor exceeds 0.85) decreases, and the damage propagation path exhibits a receding trend from the middle of the tenon toward the root. It is inferred that under sustained loading, the tenon–groove contact interface is in a complex state of combined compression–shear stress. As the structure approaches its ultimate bearing capacity, the concrete in the tenon generates extensive cracking and fails under the influence of tensile stress. Increasing the concrete strength grade directly enhances the tensile strength of the material, thereby increasing the critical bending moment required for cracking in the tension zone and delaying the propagation of damage to the surrounding areas. Therefore, an increase in concrete strength grade can constrain the development of concrete damage by raising the cracking load, thereby effectively suppressing the extent of failure in the tenon region.

4. Influence of Longitudinal Reinforcement Ratio on the GMTJ

4.1. Mechanical Performance

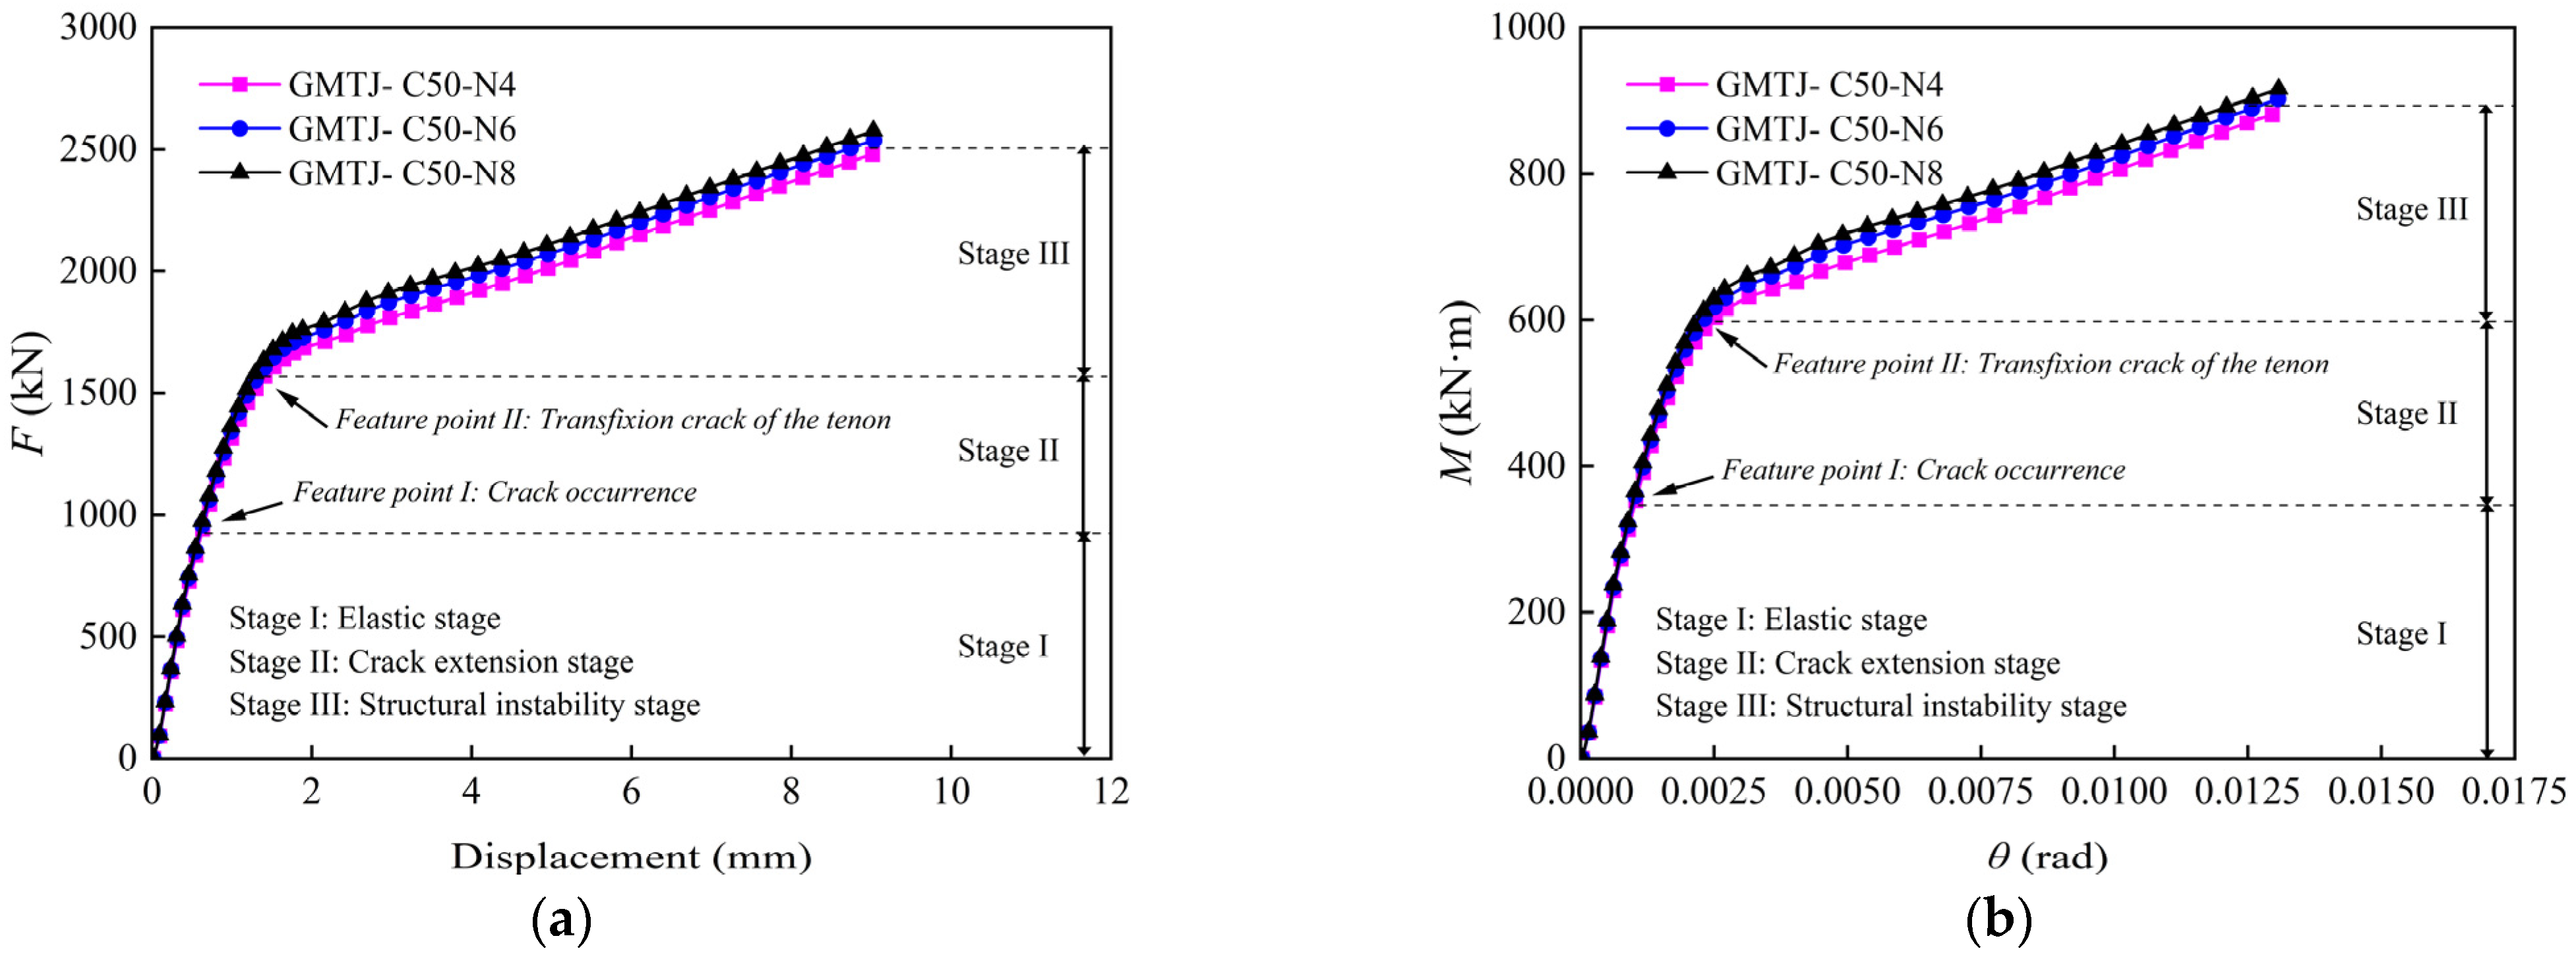
Figure 14 shows the load–displacement and moment–rotation relationship curves of the GMTJ with different longitudinal reinforcement ratios obtained from the finite element analysis.
As shown in Figure 12, during the elastic stage (Stage I), the load–displacement and moment–rotation curves of the specimens under various cases basically overlap. This indicates that the variation in the longitudinal reinforcement ratio has virtually no influence on the load–displacement and moment–rotation relationships of the GMTJ during the elastic stage. However, an increase in the longitudinal reinforcement ratio can enhance the bearing capacity of the joint during the crack extension stage (Stage II). Specifically, compared with the benchmark specimen GMTJ-C50-N4, the longitudinal reinforcement ratios of GMTJ-C50-N6 and GMTJ-C50-N8 are increased by 50% and 100%, respectively, resulting in increases of 6.20% and 10.5% in their corresponding tenon crack transfixion loads. Furthermore, although increasing the longitudinal reinforcement ratio has an insignificant effect on the initial flexural stiffness of the joint, it can enhance the flexural stiffness during the crack extension stage.

4.2. Stress Distribution

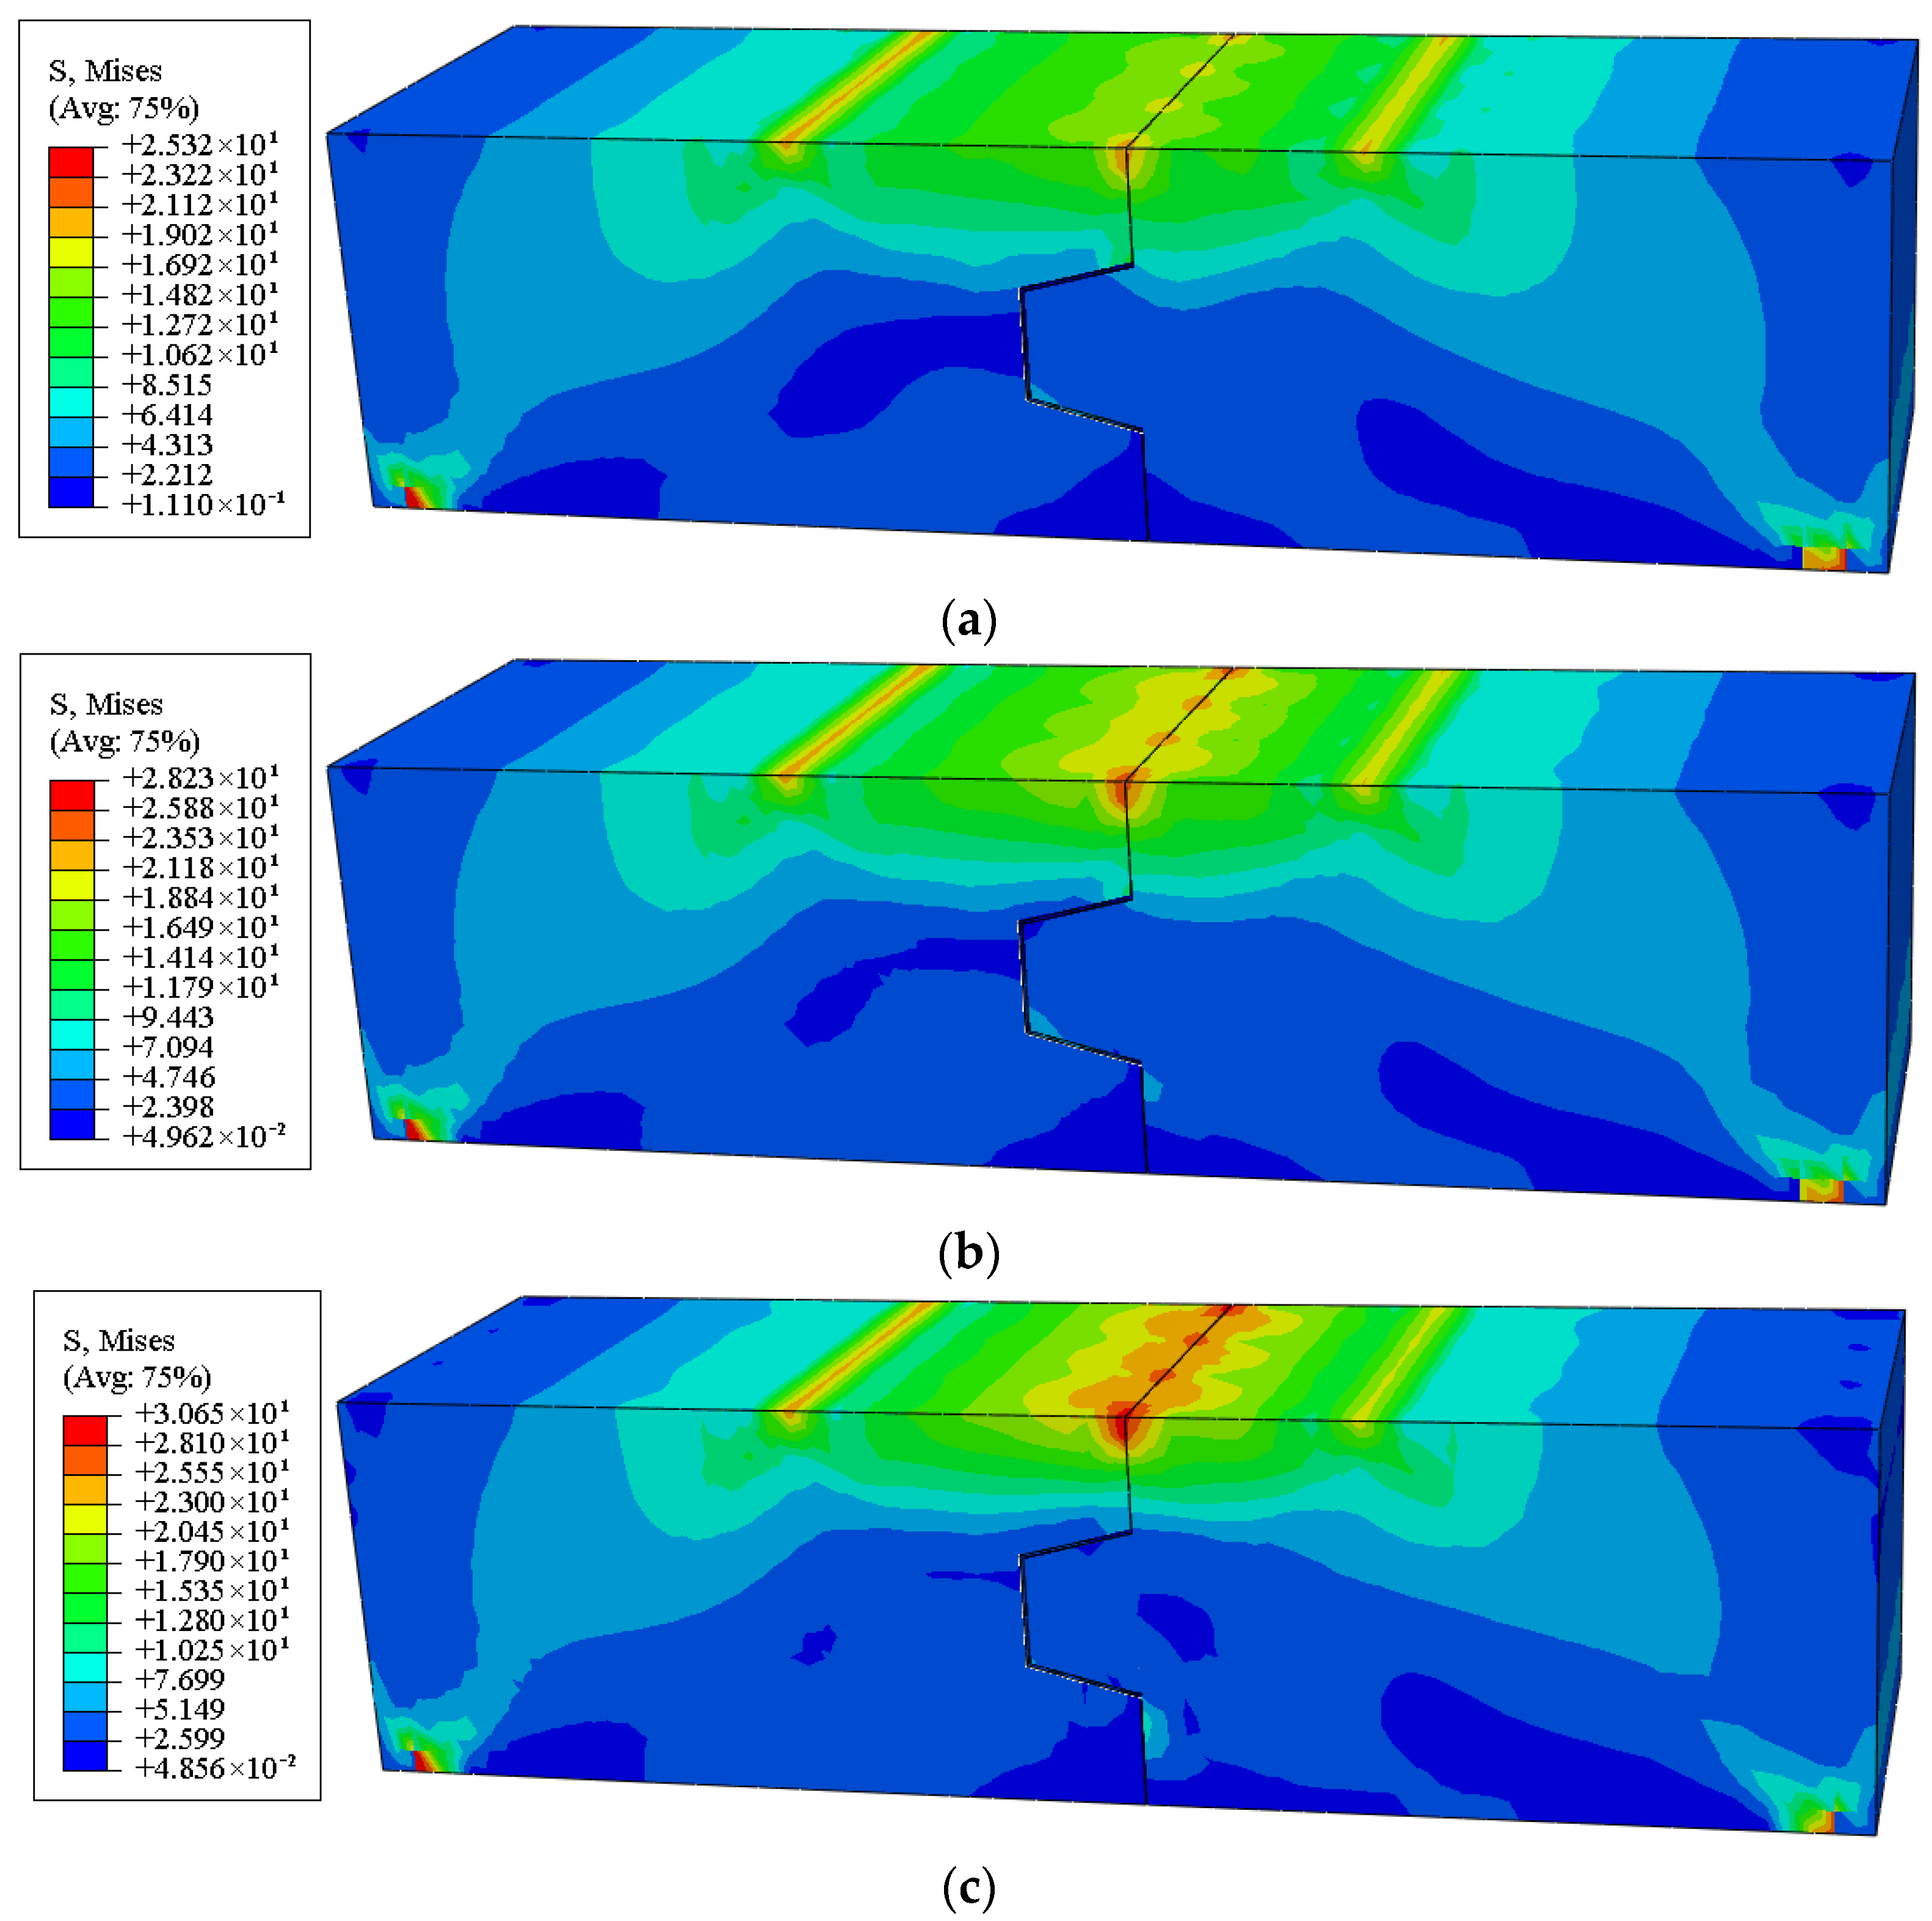
Figure 15 shows the stress contours of components with different longitudinal reinforcement ratios at the point of tenon crack transfixion.
As shown in Figure 13, the high-stress regions under different cases exhibit consistent distribution patterns. When the bottom contact interface opens under bending, significant stress concentration develops near the joint in the upper compression zone of the component. A comparative analysis of the stress contours shows that, during the stage of tenon crack propagation, both the local stress in the compression zone and the overall peak stress increase with the longitudinal reinforcement ratio. When the ratio increases from 0.70% to 1.40%, the corresponding peak stresses are 28.2 MPa, 30.6 MPa, and 32.2 MPa, respectively. These results confirm that increasing the longitudinal reinforcement ratio enhances the flexural capacity of the GMTJ. However, the increased flexural capacity also leads the joint to resist larger bending moments at the failure stage, thereby intensifying the crushing effect and stress concentration in the upper compression zone.

4.3. Principal Plastic Tensile Strain

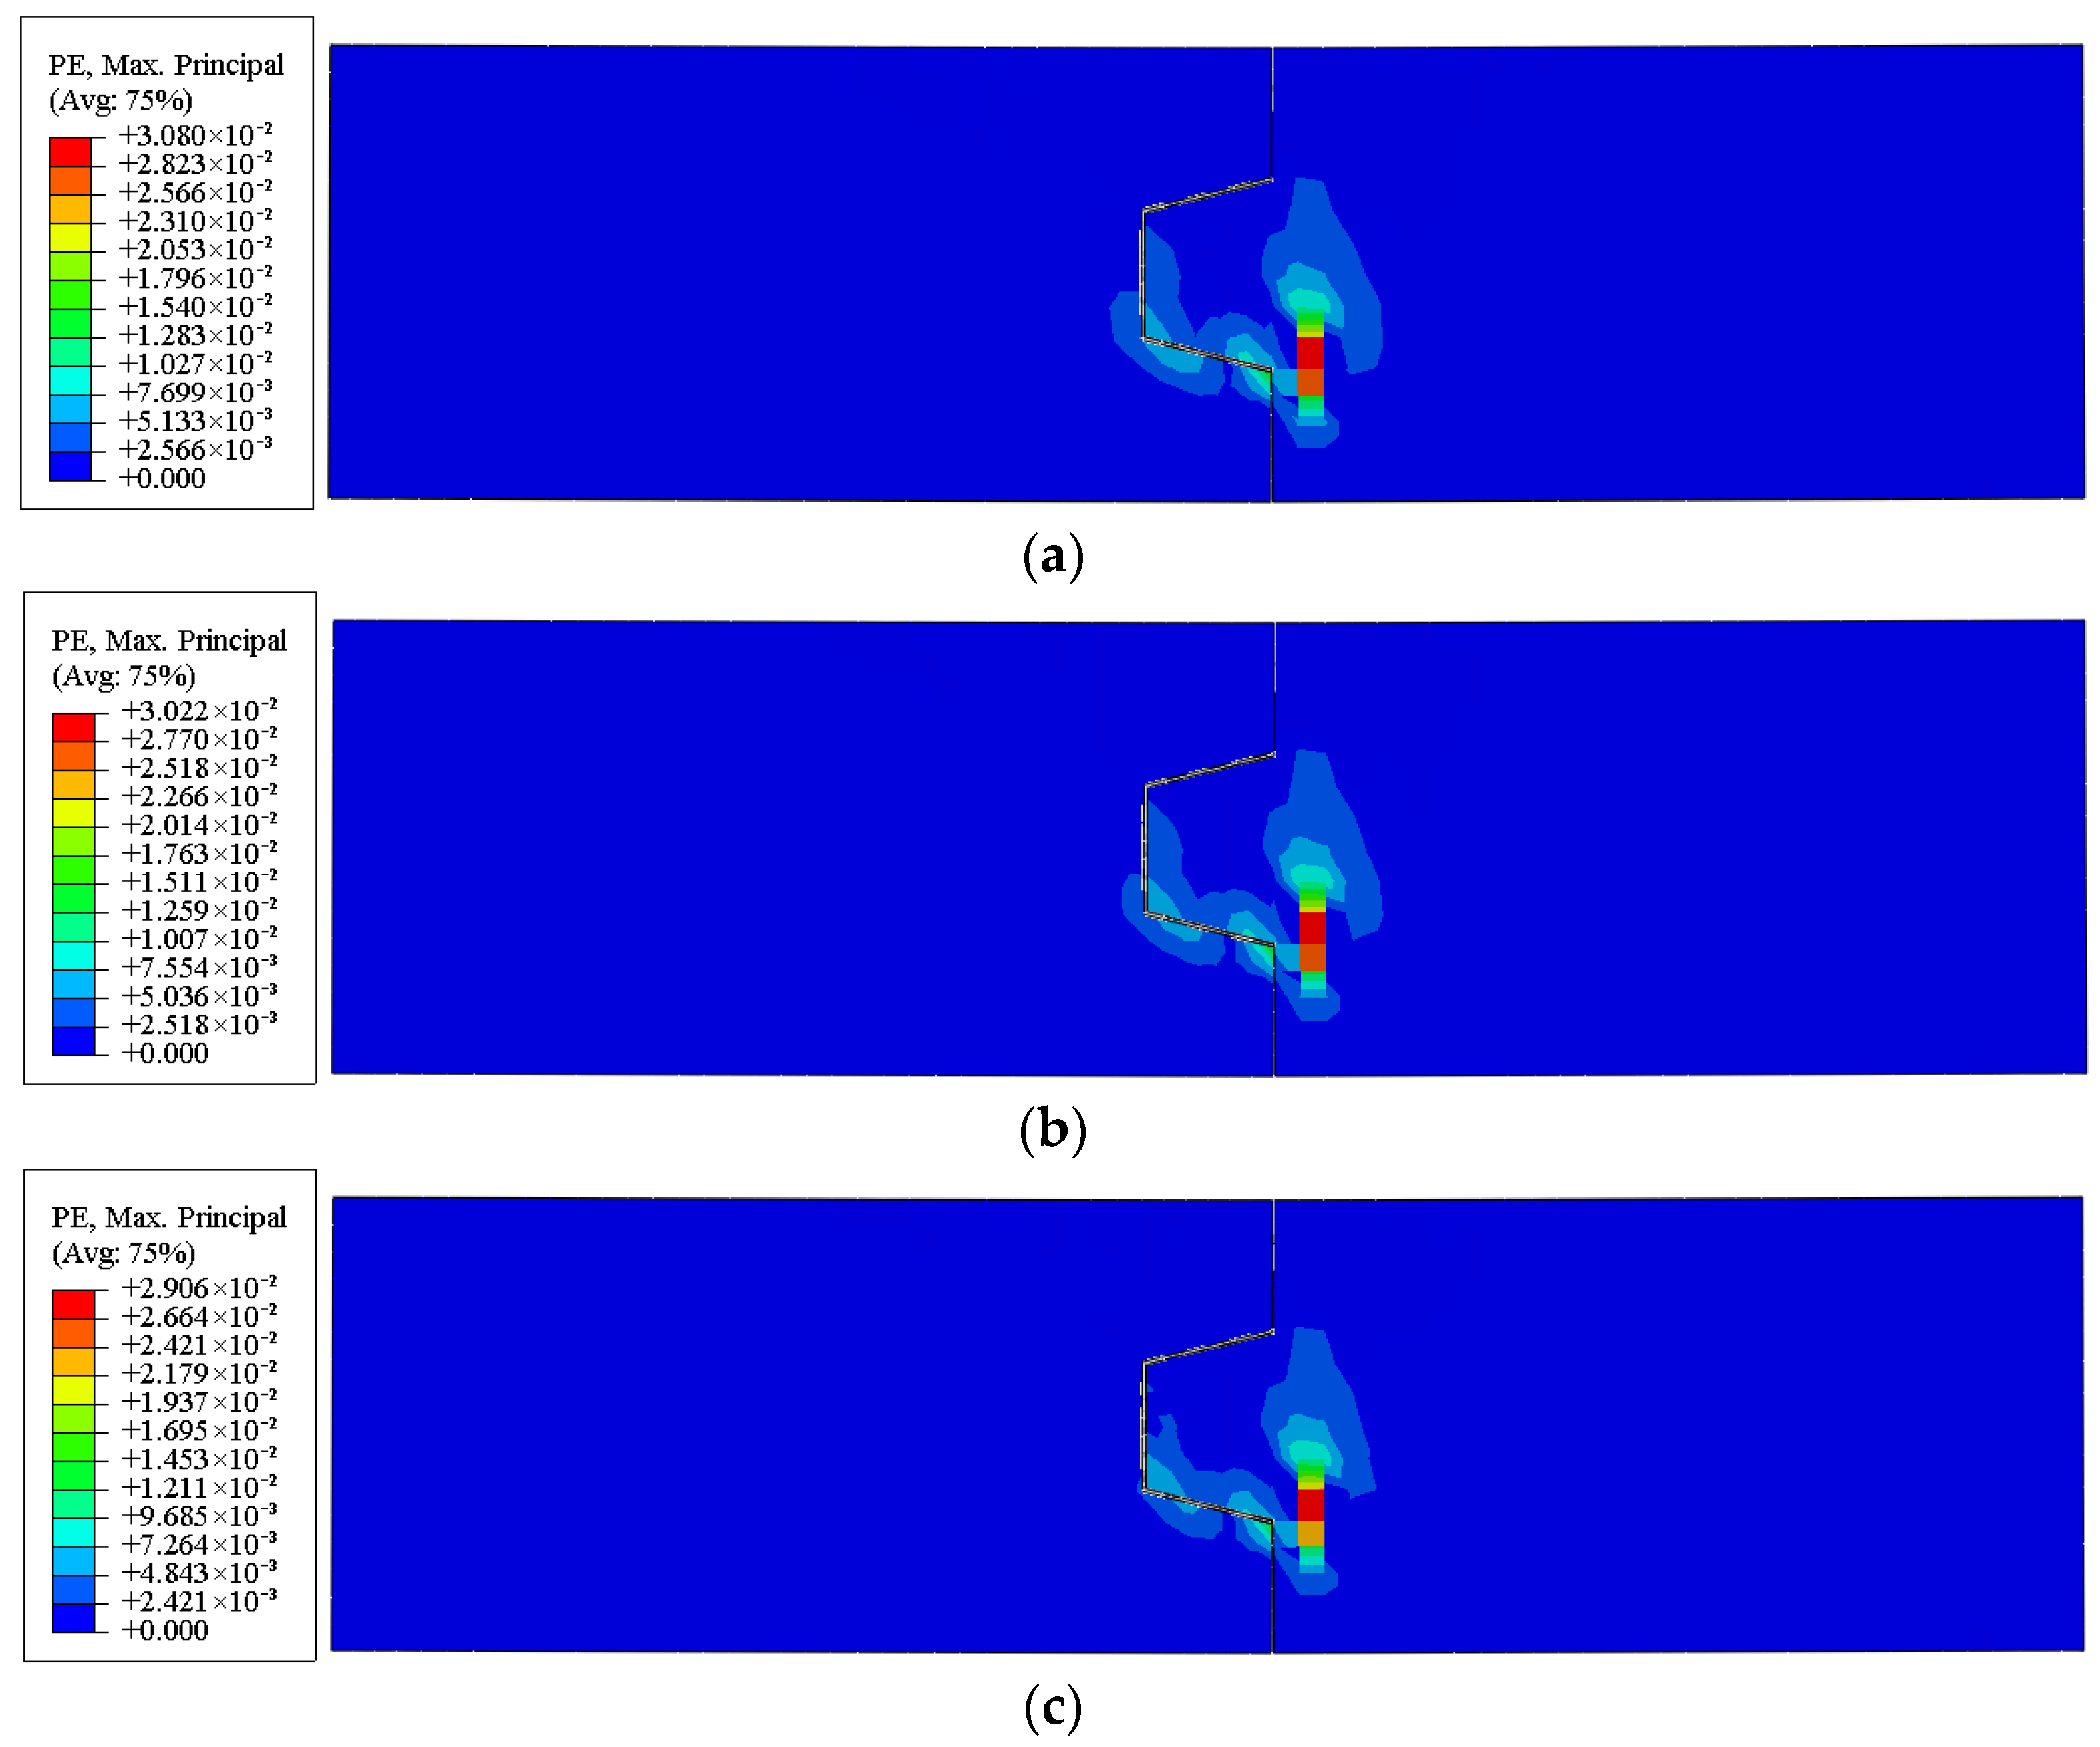
Figure 16 shows the concrete principal plastic tensile strain contours of the GMTJ with different longitudinal reinforcement ratios at the same vertical displacement.
The concrete plastic strain distribution shown in Figure 14 indicates that the increase in the longitudinal reinforcement ratio significantly accelerates the plastic evolution of the concrete in the tenon region. The potential reason is that while increasing the longitudinal reinforcement ratio effectively enhances the overall flexural capacity of the GMTJ, it simultaneously increases the bending moment demand on the component under identical displacement conditions. Since no additional reinforcement was provided in the tenon region, the improvement in the overall flexural capacity of the member does not fully correspond to the enhancement of the local flexural capacity of the tenon. As the bending moment continues to increase, the tenon is subjected to higher levels of tensile stress and combined shear–compression stresses, which ultimately lead to more rapid stress concentration, thereby triggering accelerated plastic development and crack penetration. This phenomenon confirms that merely increasing the longitudinal reinforcement ratio is insufficient to improve the localized durability. To effectively suppress the crack extension rate in the tenon region, localized reinforcement design must be implemented, enhancing the flexural resistance moment of the area to control the plastic development of the tenon.

4.4. Tensile Damage

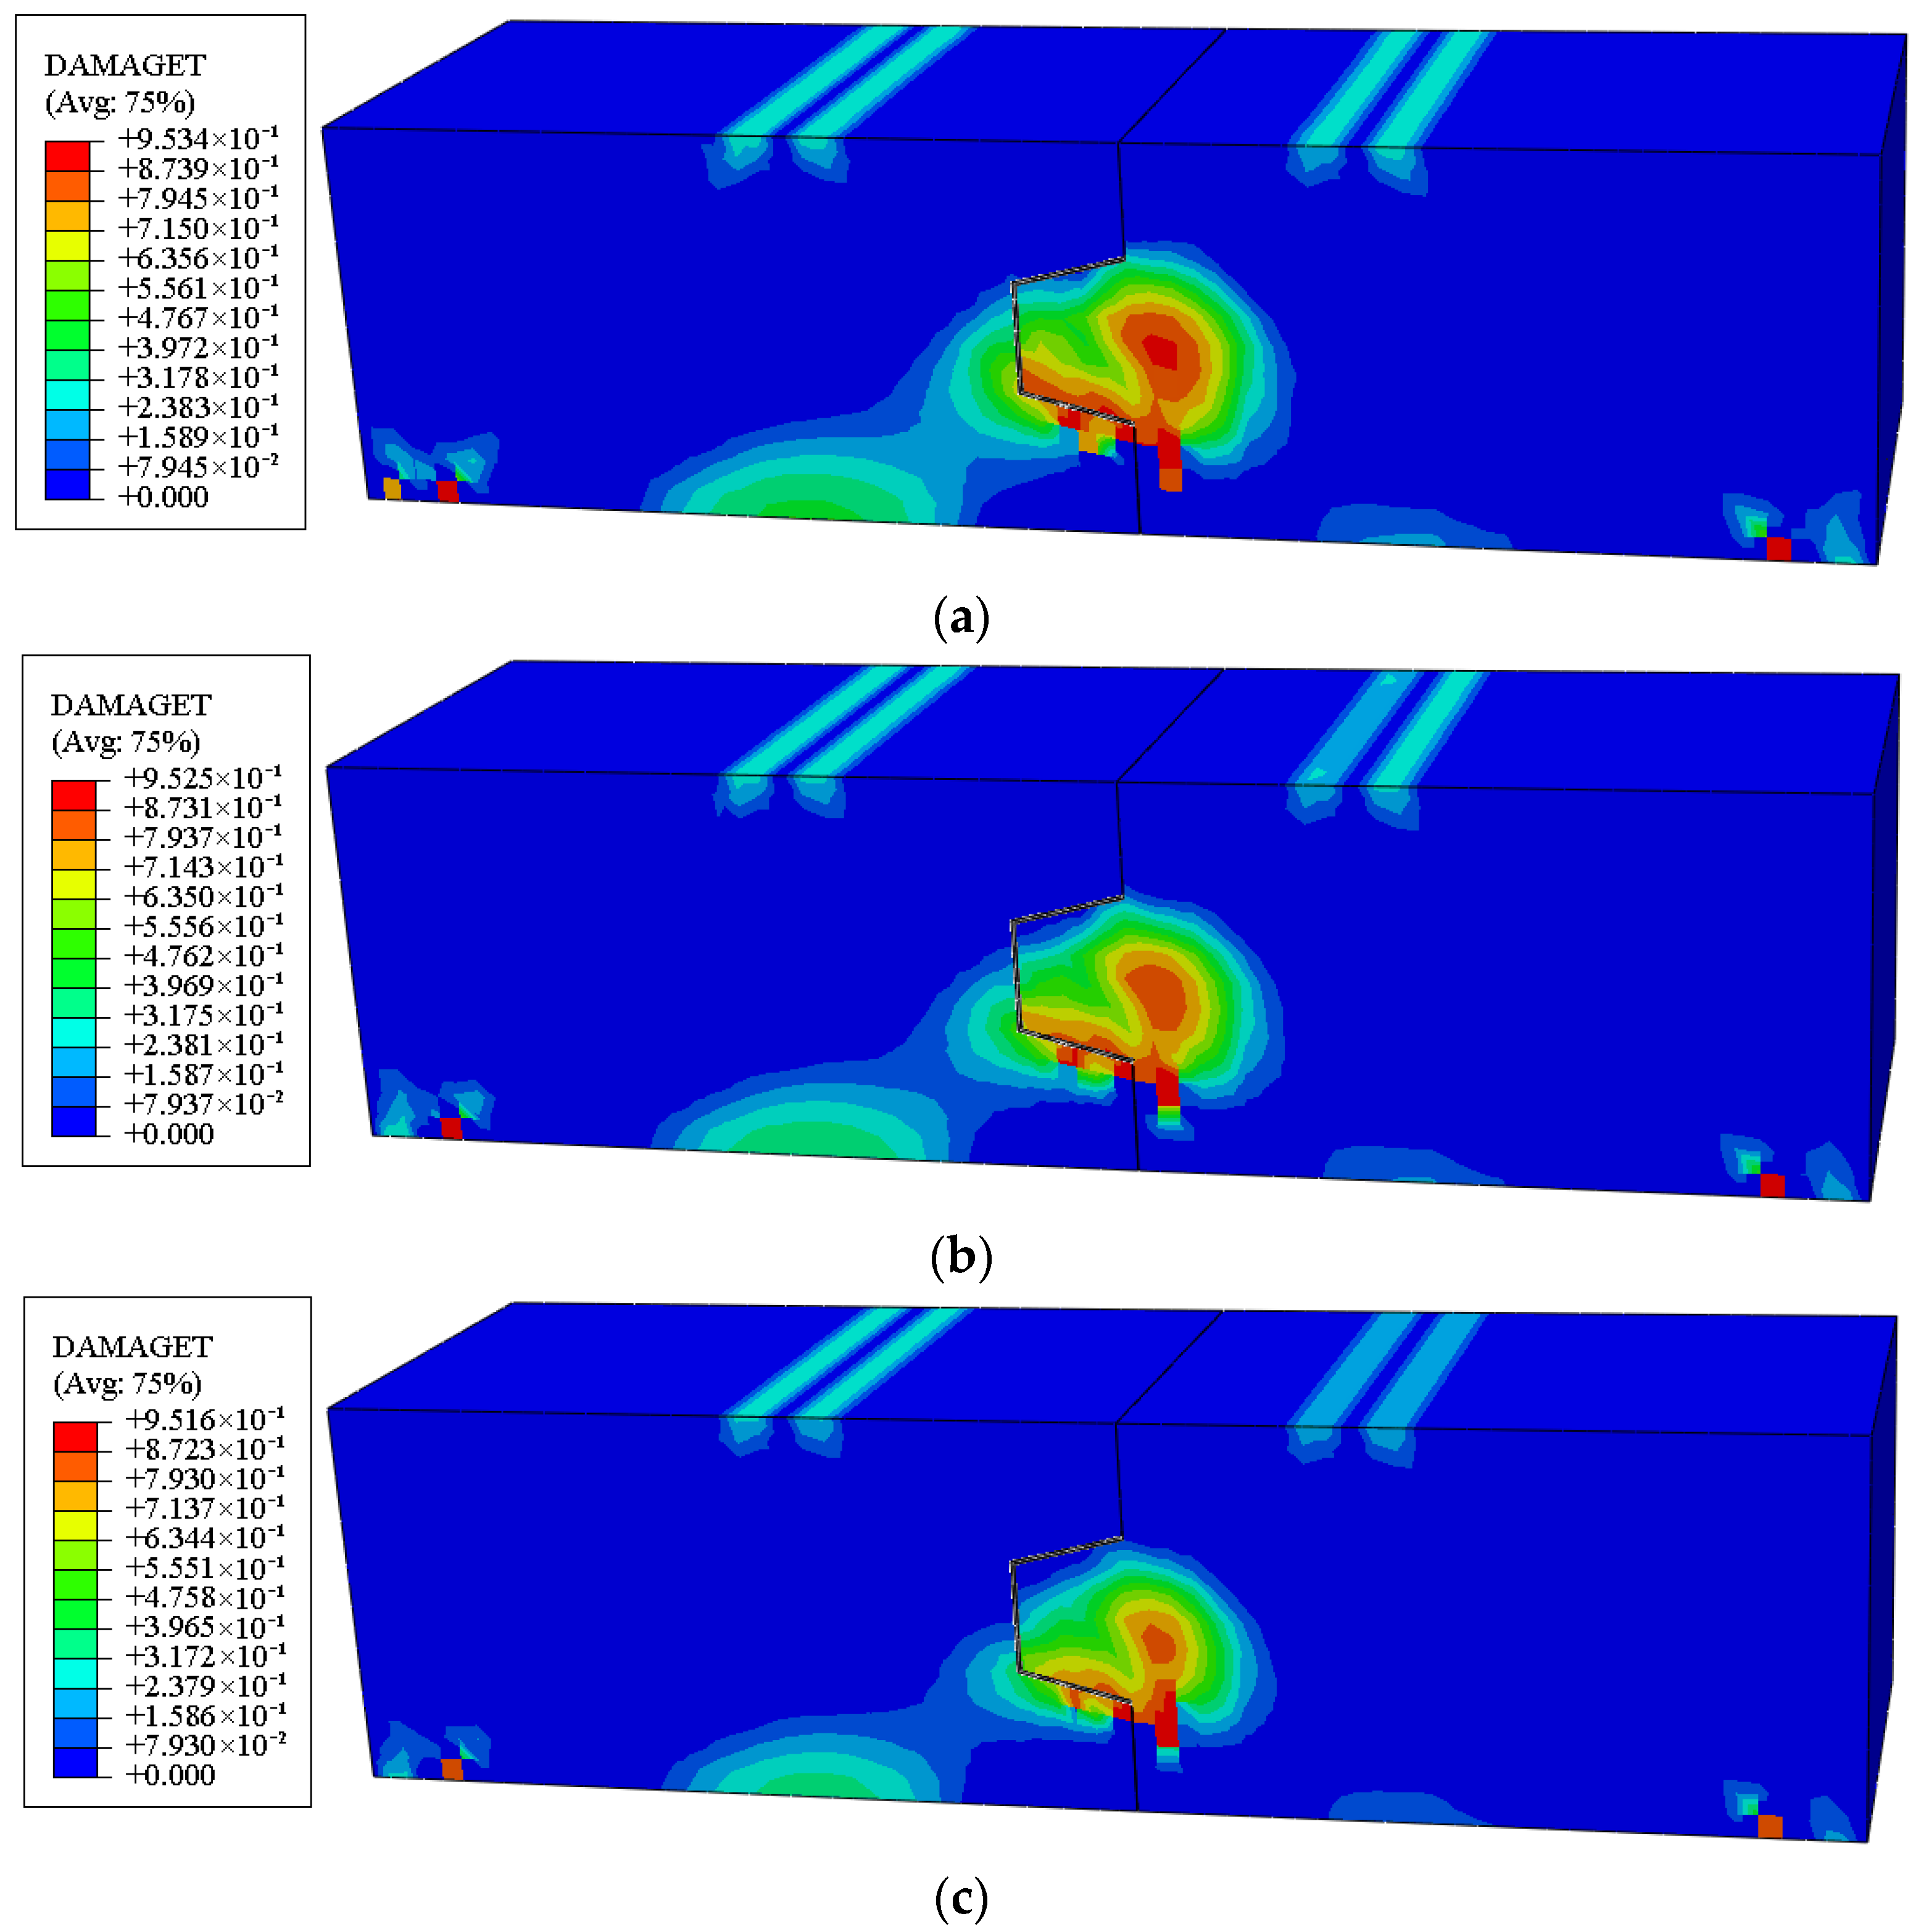
Figure 17 shows the concrete tensile damage contours of the GMTJ at the point of tenon crack transfixion.
As shown in Figure 17, the longitudinal reinforcement ratio has a significant influence on the damage evolution of the GMTJ. As the reinforcement ratio increases, the area of high tensile damage strain in the tenon and its root gradually expands and leads to transfixion towards the top. This indicates that increasing the longitudinal reinforcement ratio will exacerbate the tensile damage of the GMTJ within the tenon region. This is because, although increasing the longitudinal reinforcement ratio enhances the overall flexural stiffness and load-carrying capacity of the member, no additional reinforcement was provided locally in the tenon region. The absence of supplemental reinforcement within the tenon results in a mismatch between the improvement in the global flexural capacity of the member and the local flexural resistance of the tenon. During the process in which tensile damage develops in the tenon region, the higher bending moment induced by the increased longitudinal reinforcement must be resisted by the concrete section in the tenon, causing this region to become a stress concentration zone. Consequently, a larger extent of tensile damage is triggered, accelerating the shear–compression coupled failure at the tenon root.

5. Conclusions

In this study, the Grout-filled Mortise and Tenon Joint (GMTJ) was selected as the research topic. Taking into account material nonlinearities and the cohesive–friction hybrid constitutive relationship at the grout–concrete interface, the pressure-bending performance of the GMTJ was analyzed using the finite element software ABAQUS2025. The failure modes, mid-span load–displacement curves, and moment–rotation curves of the GMTJ were analyzed and validated. By comparing the numerical results with experimental data, the accuracy of the established finite element model was verified. Based on the validated model, a parametric study was conducted to systematically investigate the effects of different concrete strength grades and longitudinal reinforcement ratios on the mechanical performance of the GMTJ. The influences of these parameters on the mechanical performance, stress distribution, and damage evolution laws of the GMTJ were revealed. The primary conclusions are as follows:
(1)
The developed finite element model of the GMTJ is capable of accurately reproducing the crack initiation, propagation, and final failure patterns observed in the test. The load–displacement and moment–rotation relationships show good agreement with the experimental results, with the errors in characteristic loads maintained within a reasonable range. Therefore, the model can be reliably used to analyze the mechanical behavior and damage evolution of GMTJs.
(2)
Although increasing the concrete strength has a limited effect on the elastic stiffness of the node, it can significantly enhance the crack-penetration load of the tenon and suppress the development of tensile damage in the tenon region. This improvement is manifested by delayed crack propagation, a reduced damage zone, and an increased ultimate load-carrying capacity, thereby enhancing the deformation resistance of the structure.
(3)
Increasing the longitudinal reinforcement ratio enhances the post-cracking flexural stiffness and ultimate load-carrying capacity of GMTJs. However, since no reinforcement is provided in the tenon region, a higher reinforcement ratio leads to accelerated plastic development and enlarged damage in the tenon concrete under larger bending moments. This indicates that increasing only the global longitudinal reinforcement ratio is insufficient to effectively suppress crack penetration and damage progression in the tenon region.
Therefore, in engineering design, local strengthening of the tenon core region should be considered. One approach is to ensure that the number of longitudinal reinforcement bars in the GMTJ is consistent with that in the tenon region. Alternatively, additional longitudinal bars and stirrups may be placed at the tenon root or along the tenon sidewalls to enhance the tensile and shear resistance of this critical zone, thereby further improving the ductility and ultimate load-carrying capacity of GMTJs.
It should be noted that the finite element model developed in this study employs a uniform mesh size, which may influence the contour results obtained from the analysis. In practical engineering applications, a more efficient and commonly adopted approach is to refine the mesh in critical regions while using a coarser mesh elsewhere, thereby significantly reducing computational cost. Future research may focus on this aspect to further improve the finite element model of the GMTJ developed in this study [35]. Moreover, the parametric analysis in this study includes only three concrete strength grades and three longitudinal reinforcement configurations, all based on the same reference GMTJ model. Therefore, the conclusions primarily reflect the mechanical behavior associated with this specific structural configuration and material combination. Although the results provide valuable insights into the key influencing mechanisms of GMTJs, their general applicability may be limited by the relatively narrow parameter range. Future research may expand the scope of the parametric analysis to further investigate the mechanical behavior of prefabricated underground stations under various mortise–tenon joint configurations and material combinations, thereby verifying and refining the findings of this study.

Author Contributions

Conceptualization, Y.Y. and G.Y.; Methodology, Y.Y. and G.Y.; Formal analysis, F.L.; Data curation, F.L.; Writing—original draft, F.L. and T.L.; Writing—review and editing, Y.Y. and G.Y. All authors have read and agreed to the published version of the manuscript.

Funding

This research received no external funding.

Data Availability Statement

The original contributions presented in this study are included in the article. Further inquiries can be directed to the corresponding author.

Conflicts of Interest

Author Ting Lei was employed by the company Chongqing Transportation Construction Management Co., Ltd. The remaining authors declare that the research was conducted in the absence of any commercial or financial relationships that could be construed as a potential conflict of interest.

References

  1. Feng, S.; Guan, D.; Guo, Z. Seismic behavior of U-shaped bar overlapping connections for sidewall bottom joints in prefabricated subway stations. Structures 2025, 71, 108193. [Google Scholar] [CrossRef] [Scilit]
  2. Feng, S.; Guo, Z.; Guan, D.; Li, X. Tensile anchorage and seismic performance of U-bar connections between sidewall and bottom slabs for prefabricated subway station structures. Constr. Build. Mater. 2025, 472, 140825. [Google Scholar] [CrossRef] [Scilit]
  3. Yang, X.; Huang, M.; Lin, F. Research strategies on new prefabricated technology for underground metro stations. Urban Rail Transit 2019, 5, 145–154. [Google Scholar] [CrossRef] [Scilit]
  4. Yang, X.; Lin, F. Research on prefabricated metro station structure and key assembly technologies. Tunn. Undergr. Space Technol. 2024, 153, 106029. [Google Scholar] [CrossRef] [Scilit]
  5. Liu, T.; Lu, J.; Wang, D.; Liu, H. Experimental investigation of the mechanical behaviour of wall-beam-strut joints for prefabricated underground construction. Int. J. Concr. Struct. Mater. 2021, 15, 2. [Google Scholar] [CrossRef] [Scilit]
  6. Liu, T.; Lu, J.; Wang, D.; Liu, H.; Mo, N.; Zhai, L. 3D nonlinear finite element modelling of mechanical behavior of a new wall-beam-strut joint for prefabricated underground construction and validation again experimental testing. Structures 2021, 33, 3202–3221. [Google Scholar] [CrossRef] [Scilit]
  7. Liu, H.; Chen, J.; Xu, C.; Du, X. Seismic performance of precast column connected with grouted sleeve connectors. J. Build. Eng. 2020, 31, 101410. [Google Scholar] [CrossRef] [Scilit]
  8. Liu, H.; Wang, Z.; Du, X.; Shen, G.Q.P. The seismic behaviour of precast concrete interior joints with different connection methods in assembled monolithic subway station. Eng. Struct. 2021, 232, 111799. [Google Scholar] [CrossRef] [Scilit]
  9. Nong, X.; Xiang, B.; Ding, X.; Zhao, W.; Zhai, L. Flexural performance study of the CHC joint based on experimental methods. Proc. Inst. Civ. Eng. Struct. Build. 2024, 178, 135–145. [Google Scholar] [CrossRef] [Scilit]
  10. Nong, X.; Xiang, B.; Wu, J.; Ding, X.; Zhao, W.; Gao, S. A theoretical model for estimating the flexural stiffness of CHC joints. Proc. Inst. Civ. Eng. Struct. Build. 2025, 178, 451–461. [Google Scholar] [CrossRef] [Scilit]
  11. Lin, F.; Yang, X. Mechanical properties analysis of joints for prefabricated metro station structure based on whole-process in-situ monitoring. Tunn. Undergr. Space Technol. 2023, 138, 105202. [Google Scholar] [CrossRef] [Scilit]
  12. Yang, X.; Lin, F. Prefabrication technology for underground metro station structure. Tunn. Undergr. Space Technol. 2021, 108, 103717. [Google Scholar] [CrossRef] [Scilit]
  13. Yang, X.; Lin, F.; Huang, M. Experimental research on bending bearing capability of grouted double mortise-tenon joint for prefabricated metro station structure. Adv. Civ. Eng. 2021, 2021, 6635409. [Google Scholar] [CrossRef] [Scilit]
  14. Yang, X.; Lin, F.; Huang, M. Experimental analysis of bending stiffness characteristics of grouted double mortise-tenon joint for prefabricated metro station structure. Adv. Civ. Eng. 2021, 2021, 9958436. [Google Scholar] [CrossRef] [Scilit]
  15. Yang, X.; Lin, F.; Huang, M. Analysis of the law of joint deformation for grouted mortise-tenon joint. Adv. Civ. Eng. 2022, 2022, 2909993. [Google Scholar] [CrossRef] [Scilit]
  16. Xiang, B.; Cui, L.; Ding, W.; Tang, W.; Yue, T.; Qin, W. Study on the influence of geometric parameters and shape optimization of single tenon joint in assembled subway station. Adv. Civ. Eng. 2023, 2023, 5278404. [Google Scholar] [CrossRef] [Scilit]
  17. Su, H.; Li, Z.; Wang, C.; Zheng, M. Experiment study on the grouting material for the fabricated metro station’s joint with tenon and mortise. Sci. Adv. Mater. 2017, 9, 1644–1652. [Google Scholar] [CrossRef] [Scilit]
  18. He, H.; Li, Z. Experimental and numerical study on seismic performance of mortise-tenon joints in prefabricated sidewalls of assembled subway stations. Int. J. Civ. Eng. 2025, 23, 1393–1406. [Google Scholar] [CrossRef] [Scilit]
  19. Yang, X.; Shi, Z.; Lin, F. Influence of geometrical parameters on performance of grouted mortise and tenon joints for application in prefabricated underground structures. Adv. Civ. Eng. 2019, 2019, 3747982. [Google Scholar] [CrossRef] [Scilit]
  20. Cao, D.; Kong, D. Comparative study of force and deformation characteristics of closed cavity thin-walled components in prefabricated metro station. Appl. Sci. 2025, 15, 9674. [Google Scholar] [CrossRef] [Scilit]
  21. Wu, C.; Lu, D.; Ma, C.; El Naggar, M.H.; Du, X. Structural design and seismic performance analysis of partially prefabricated subway station structure. Tunn. Undergr. Space Technol. 2023, 140, 105264. [Google Scholar] [CrossRef] [Scilit]
  22. Ding, P.; Tao, L.; Yang, X.; Zhao, J.; Shi, C. Three-dimensional dynamic response analysis of a single-ring structure in a prefabricated subway station. Sustain. Cities Soc. 2019, 45, 271–286. [Google Scholar] [CrossRef] [Scilit]
  23. Gao, S.; Zhao, W.; Xie, K. The effect of CHC joints on the mechanical performance of prefabricated subway stations. Proc. Inst. Civ. Eng. Struct. Build. 2025, 178, 581–590. [Google Scholar] [CrossRef] [Scilit]
  24. Qiu, T.; Zhang, J.; Chen, X.; Xu, Z.; Su, D.; Song, R.; Cui, T. Design and testing of multischeme horizontal joints for prefabricated two-walls-in-one diaphragm wall. Structures 2023, 51, 1354–1371. [Google Scholar] [CrossRef] [Scilit]
  25. Wu, Y.; Ding, W.; Li, S.; Qiao, Y. Effect of oblique bolt arrangement on flexural behavior of segmental joint for shield tunnel. Tunn. Undergr. Space Technol. 2023, 135, 105043. [Google Scholar] [CrossRef] [Scilit]
  26. GB 50010-2010; Code for Design of Concrete Structures. China Architecture & Building Press: Beijing, China, 2011.
  27. Mollazadeh, M.H.; Wang, Y.C. New insights into the mechanism of load introduction into concrete-filled steel tubular column through shear connection. Eng. Struct. 2014, 75, 139–151. [Google Scholar] [CrossRef] [Scilit]
  28. Cong, L.I.; Qi, F. Research on numerical simulation of cohesive behavior in shearkey-less grouted connection. South. Energy Constr. 2023, 9, 1–5. [Google Scholar] [CrossRef]
  29. Zhao, H.; Zhao, J.; Shi, G.; Shao, N.; Zhou, L. Investigation of pocket base connections for steel latticed columns: Simulation, mechanical model, and design. Structures 2025, 82, 110619. [Google Scholar] [CrossRef] [Scilit]
  30. Shi, G.; Zhao, J.; Zhao, H. Experimental and numerical study of pocket base connections for steel latticed columns under cyclic loadings. Structures 2025, 79, 109398. [Google Scholar] [CrossRef] [Scilit]
  31. Fan, Q.; Lin, F. Numerical Study on Bending Performance of Grouted Mortise-Tenon Joint Considering Bonding Strength of Grouting Interface. Tunn. Constr. 2025, 45, 532–538. [Google Scholar] [CrossRef]
  32. ACI 318-11; Building Code Requirements for Structural Concrete (ACI 318-11) and Commentary. ACI: Farmington Hills, MI, USA, 2011.
  33. Huang, J.; Zhao, H.; Gao, Y.; Shi, G. Numerical study on cyclic behaviour of triple grades hybrid high-performance steel structure. Eng. Struct. 2025, 327, 119605. [Google Scholar] [CrossRef] [Scilit]
  34. Huang, J.; Zhao, H.; Gao, Y.; Shi, G. Finite element analysis and design of triple grades hybrid high-performance steel structure (TGHSS). Eng. Struct. 2025, 330, 119909. [Google Scholar] [CrossRef] [Scilit]
  35. Shi, G.; Hou, L.; Zhao, H. Numerical study on the seismic behaviour of high-strength steel moment-resisting frames: Multi-scale modelling and validation. Thin Walled Struct. 2025, 208, 112807. [Google Scholar] [CrossRef] [Scilit]
Figure 1. Grouted mortise–tenon joint [11].
Buildings 16 01646 g001
Figure 2. Dimensions of the GMTJ component and the on-site experimental loading system.
Buildings 16 01646 g002
Figure 3. Finite element model of the GMTJ components: (a) GMTJ and steel plates; (b) reinforcement cage; (c) modified epoxy resin grouting layer.
Buildings 16 01646 g003
Figure 4. Stress–strain curves and damage evolution curves of C50 concrete under uniaxial stress: (a) compressive stage; (b) tensile stage.
Buildings 16 01646 g004
Figure 5. Bonding failure contact model relation between contact stress and contact separation distance.
Buildings 16 01646 g005
Figure 6. Schematic diagram of boundary conditions and loading methods for the finite element model.
Buildings 16 01646 g006
Figure 7. Comparison between experimental final failure modes and finite element analysis: (a) failure mode; (b) tension damage distribution; (c) maximum principal plastic strain distribution.
Buildings 16 01646 g007
Figure 8. Crack development contour.
Buildings 16 01646 g008
Figure 9. Comparison between numerical and experimental results: (a) load–displacement curves; (b) moment–rotation curves.
Buildings 16 01646 g009
Figure 10. Mechanical performance of GMTJ components with different concrete strength grades: (a) load–displacement curves; (b) moment–rotation curves.
Buildings 16 01646 g010
Figure 11. Stress contours of components with different concrete strength grades at the point of tenon crack transfixion: (a) GMTJ-C40-N4; (b) GMTJ-C50-N4; (c) GMTJ-C60-N4.
Buildings 16 01646 g011
Figure 12. Principal plastic tensile strain contours of components with different concrete strength grades at the same displacement: (a) GMTJ-C40-N4; (b) GMTJ-C50-N4; (c) GMTJ-C60-N4.
Buildings 16 01646 g012
Figure 13. Tensile damage contours of components with different concrete strength grades at the point of tenon crack transfixion: (a) GMTJ-C40-N4; (b) GMTJ-C50-N4; (c) GMTJ-C60-N4.
Buildings 16 01646 g013
Figure 14. Mechanical performance of GMTJ components with different longitudinal reinforcement ratios: (a) load–displacement curves; (b) moment–rotation curves.
Buildings 16 01646 g014
Figure 15. Stress contours of components with different longitudinal reinforcement ratios at the point of tenon crack transfixion: (a) GMTJ-C50-N4; (b) GMTJ-C50-N6; (c) GMTJ-C50-N8.
Buildings 16 01646 g015aBuildings 16 01646 g015b
Figure 16. Principal plastic tensile strain contours of GMTJ with different longitudinal reinforcement ratios at the same displacement: (a) GMTJ-C50-N4; (b) GMTJ-C50-N6; (c) GMTJ-C50-N8.
Buildings 16 01646 g016aBuildings 16 01646 g016b
Figure 17. Concrete tensile damage contours of GMTJ with different longitudinal reinforcement ratios at the point of tenon crack transfixion: (a) GMTJ-C50-N4; (b) GMTJ-C50-N6; (c) GMTJ-C50-N8.
Buildings 16 01646 g017aBuildings 16 01646 g017b
Table 1. Mechanical parameters of different materials.
MateriaGradeElastic
Module
(GPa)
Yield
Stress
(MPa)
Yield
Strain
Ultimate
Stress
(MPa)
Poisson’s
Ratio
ConcreteC50 (compression)34.55418.90.0005833.60.2
C50 (tensile)34.5542.730.000082.730.2
Reinforcing barHRB4002004000.0025400.3
Modified epoxy resin-2.5600.03600.3
Steel plateQ235200---0.3
Table 2. Comparison between finite element analysis and experimental results.
Fcr
(kN)
Δcr
(mm)
Mcr
(kN·m)
θcr
(rad)
Fy
(kN)
Δy
(mm)
My
(kN·m)
θy
(rad)
TEST925.70.71333.40.00091527.01.51586.20.0029
FEA941.80.64353.20.00101608.61.65603.20.0027
TEST/FEA0.981.110.940.900.950.920.971.07
Note: Fcr and Mcr are the load and bending moment at Feature Point I, while Δcr and θcr are the mid-span displacement and rotation at Feature Point I; Fy, My are the load and bending moment at Feature Point II, while Δy and θy are the mid-span displacement and rotation at Feature Point II.
Table 3. Comparison of kθ between different stages.
Stage I: kθ
(kN·m/rad)
Stage II: kθ
(kN·m/rad)
Stage III: kθ
(kN·m/rad)
TEST4.7 × 1051.3 × 1052.5 × 104
FEA3.5 × 1051.5 × 1052.7 × 104
TEST/FEA1.340.870.93
Table 4. Design schemes for key parameters.
Working ConditionGradeElastic
Modulus
(GPa)
Yield
Compressive
Stress (MPa)
Ultimate
Compressive
Stress (MPa)
Ultimate
Tensile
Stress (MPa)
Longitudinal
Reinforcement
Ratio
GMTJ-C50-N4 (Standard)C5034.518.933.62.730.70%
GMTJ-C40-N4C4032.514.926.82.390.70%
GMTJ-C60-N4C6036.023.138.52.850.70%
GMTJ-C50-N6C5034.518.933.62.731.05%
GMTJ-C50-N8C5034.518.933.62.731.40%
Disclaimer/Publisher’s Note: The statements, opinions and data contained in all publications are solely those of the individual author(s) and contributor(s) and not of MDPI and/or the editor(s). MDPI and/or the editor(s) disclaim responsibility for any injury to people or property resulting from any ideas, methods, instructions or products referred to in the content.