Article

Large-Scale Model Tests on the Performance and Mechanism of Vertical–Inclined Pile Wall (VIPW) Structures in Excavation

by
Haozhen Yue
1,*,
Yapeng Zhang
2,
Chaoyi Sun
3,
Yun Zheng
3 and
Demin Xue
1
1
Zhejiang Engineering Research Center of Digital Highway Applied Technology, Zhejiang Institute of Communications, Hangzhou 311112, China
2
Construction Engineering School, Zhejiang College of Construction, Hangzhou 311231, China
3
State Key Laboratory of Geomechanics and Geotechnical Engineering Safety, Institute of Rock and Soil Mechanics, Chinese Academy of Sciences, Wuhan 430071, China
*
Author to whom correspondence should be addressed.
Buildings 2026, 16(8), 1588; https://doi.org/10.3390/buildings16081588
Submission received: 18 March 2026 / Revised: 9 April 2026 / Accepted: 14 April 2026 / Published: 17 April 2026

Abstract

With the acceleration of urbanization, deep and large foundation pit projects have become increasingly common, posing challenges for retaining structural performance. This study investigates the mechanism of the recently proposed vertical–inclined pile wall (VIPW) through physical model tests. Six sets of large-scale model tests of foundation pit excavation under 1 g gravity conditions were carried out. Among these tests, one employed the soldier pile wall (SPW) as the support system, while the remaining five adopted the VIPW. By monitoring and analyzing the distribution and variation in the vertical pile deformation, surface settlement, pile bending moment, and inclined pile top axial force during the excavation process, the action mechanism of the VIPW was revealed, and it was verified that VIPWs exhibit better support performance than SPWs. Furthermore, four key parameters, including the embedded depth, the inclination angle, the support position of the inclined piles, and the embedded depth of the vertical piles, were varied to study their influence on the deformation and force characteristics of the VIPW, providing a theoretical basis for structural optimization design. Moreover, by comparing the instability and failure characteristics of the foundation pit, it was proved that the VIPW can effectively ensure the stability of the foundation pit.

1. Introduction

With rapid urbanization, above-ground space is becoming saturated, leading to increased urban crowding. To address challenges related to population, resources, and the environment, more high-rise buildings and large underground projects are being constructed. Consequently, numerous large-scale deep foundation pits are being constructed in densely populated urban areas. The excavation of foundation pits induces the redistribution of ground stress and soil deformation, which may exert adverse impacts on adjacent structures [1,2]. Improper selection of retaining structures and unreasonable excavation procedures can result in damage to adjacent buildings and even casualties, thereby posing a serious threat to the safety, lives, and property of on-site workers and surrounding residents [3,4,5].
To control deformation during the excavation process and ensure construction safety, various retaining and protection measures have been developed and adopted [6,7], with the most frequently used being cantilever, anchored, and strutted retaining structures [8]. The performance and working mechanisms of these structures have been investigated using a variety of research approaches [9,10,11,12,13,14,15,16,17,18]. Yu et al. [19] studied the bending moment of the diaphragm wall, surface settlement, and tunnel deformation using a centrifugal model test and numerical simulation. They concluded that diaphragm walls present convex deformation towards the foundation pit, and the surface settlement outside the diaphragm wall appears to be of the concave groove type. Yi et al. [20] analyzed a progressive collapse incident in a propped excavation through 2D and 3D simulations. It was found that inconsistent strut elevations caused excessive bending in the connecting capping beam, leading to its fracture and the subsequent overturning failure of the corner section. In situ monitoring and numerical methods were employed by Wang et al. [21] to investigate the composite soil nailing wall–anchored soldier pile wall retaining system, finding that the retaining piles’ bending moments and lateral displacement extrema rise with excavation depth. Increasing the retaining pile rigidity/embedded depth or anchor prestress controls lateral displacement effectively within a certain range, with negligible effectiveness beyond this range. Mao et al. [22] compared the protective effects of pile–anchor and double-row pile support via scaled model tests and numerical simulations, and found pile–anchor support to be markedly superior for controlling soil deformation and reducing subway disturbances in loess area foundation pit excavations adjacent to subways, making it preferable if conditions allow.
However, these retaining structures have certain shortcomings. For example, in internal bracing retaining structures, the local failure of several struts may occur, which causes the bracing axial forces to transfer to adjacent struts, induces further strut failure, and ultimately leads to instability and subsequent failure of the foundation pit [2,23]. Meanwhile, for large-scale foundation pit projects, the use of internal bracings is both costly and time-consuming [24]. For anchor bolt (cable) support, such structures do not occupy the inner pit space and facilitate earth excavation within the foundation pit. However, their reliability is relatively low, thus leading to a relatively high level of construction risk [25,26].
In recent years, with the continuous growth in the demand for foundation pit engineering construction, various new types of retaining structures have emerged. Among these, inclined pile retaining structures have been proposed and subjected to systematic research. Branch et al. [27] and Jeldes Isaac et al. [28] proposed the piling-framed retaining wall (PFRW) system. This system employs inclined piles to replace traditional anchor cable structures, which not only effectively expands the application scope of the retaining structure but also significantly controls foundation pit deformation and enhances the safety and stability of foundation pit construction. Zheng et al. [29,30,31,32,33] proposed converting some of the vertical piles into inclined piles. They investigated various excavation retaining structures, including the inclined framed retaining wall (IFRW), the inclined-vertical framed retaining wall (IVFRW), and the inclined alternating combination steel pipe pile retaining structure (IACSPPRS). Wang et al. [34] used finite element simulation to investigate the deformation mechanism of soil mass during foundation pit excavation under the action of inclined pile retaining structures, particularly the relationship between the displacement distribution of the soil between piles and the soil inside and outside the foundation pit. Xie et al. [35] systematically investigated the deformation characteristics, mechanical mechanism, and stability of the IFRW under excavation and overload conditions using a combined approach of field tests and numerical simulations. However, the connection between the inclined piles and vertical piles in the structures proposed was located at the ground surface at the top of the foundation pit or the capping beam, and no research has been conducted on the effects of different inclined pile support positions, inclined pile angles, inclined pile lengths, and vertical pile lengths on the retaining effect.
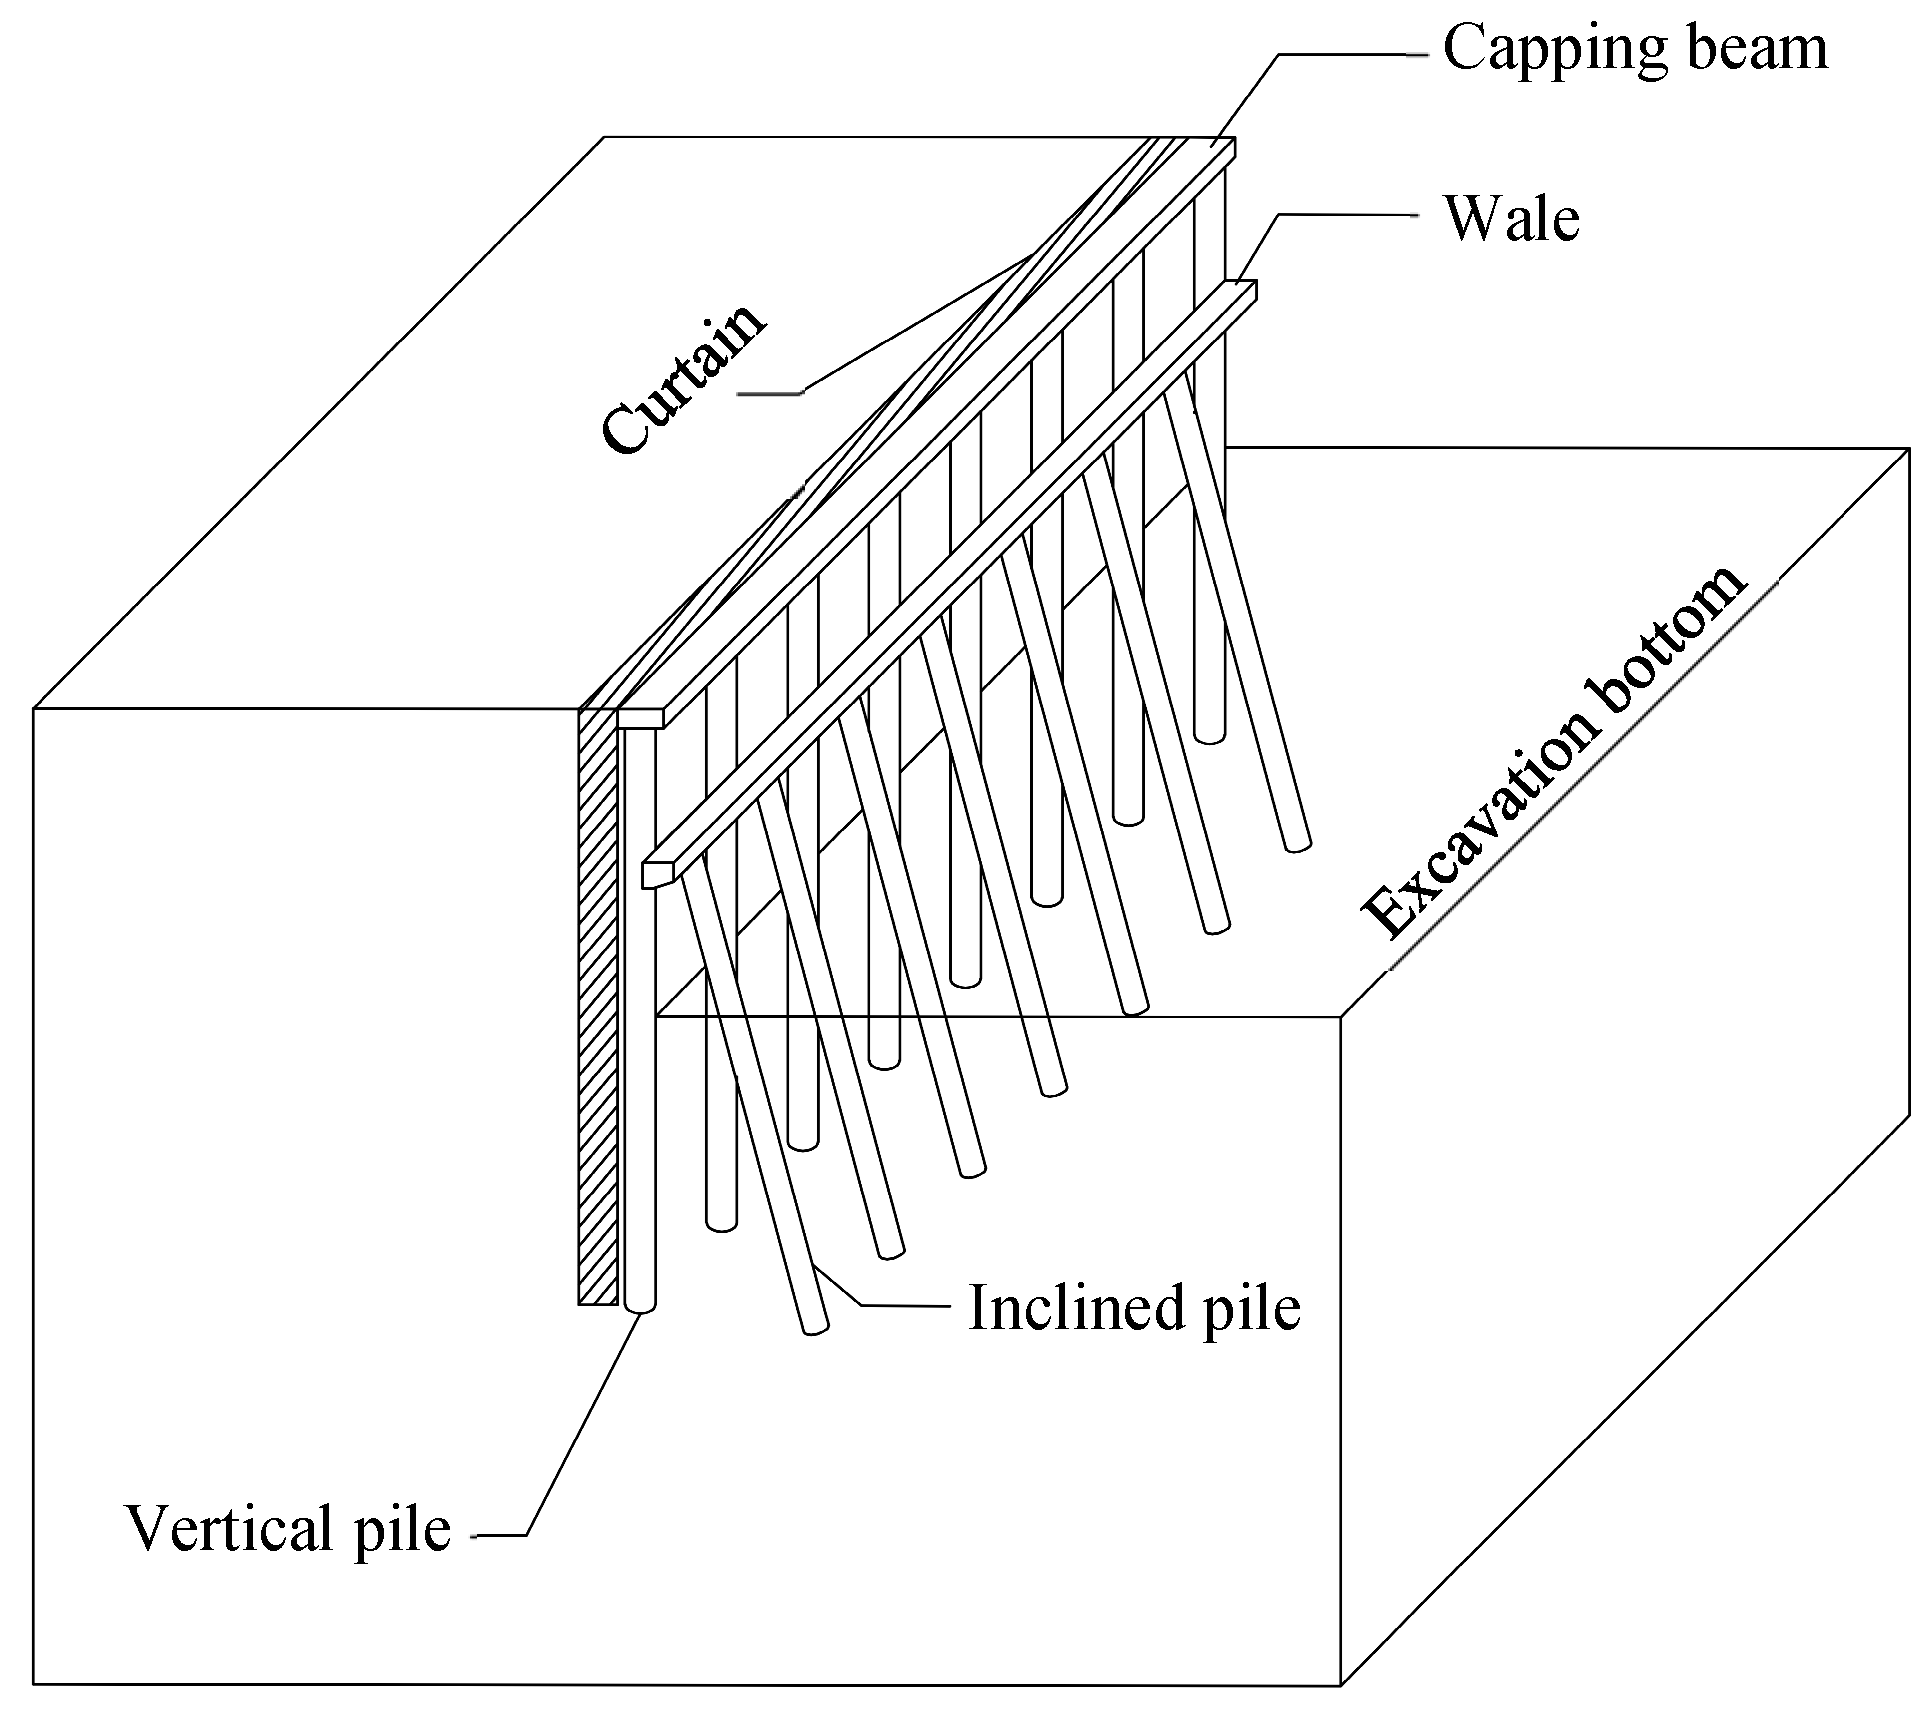
Zhang et al. [36] innovatively proposed designing inclined piles directly in the pit and providing their support at an appropriate position below the top of vertical piles; this support structure is exactly the vertical–inclined pile wall (VIPW) proposed in this paper. The basic configuration of the VIPW is illustrated in Figure 1. The VIPW structure mainly optimizes the connection configuration between the inclined and vertical piles. By adjusting the position of the inclined piles, the VIPW can adapt to a wider range of excavation depths and geological conditions, ensuring an optimal internal force distribution of the retaining structure and minimizing foundation pit deformation.
However, Zhang et al. [36] only adopted numerical simulation to study its performance; the basic mechanism still lacks sufficient understanding, and the mechanical properties of various composite structures have not yet been fully studied. To fill this research gap, more experimental data are urgently needed for a better understanding of the performance and working mechanism of VIPWs during foundation pit excavation.
In this study, a series of 1 g experimental model tests were carried out to investigate the performance and working mechanism of the VIPW. In the experiment, laser displacement sensors, resistance strain gauges, and micrometers were arranged to record the whole excavation process. The influence on the supporting effect was studied by changing the inclination angle, the length of inclined pile, and the supporting position. Particle image velocimetry (PIV) technology was also employed to explore the soil movement behind the vertical piles. The deformation and bending moment distribution of the vertical piles, surface settlement and soil movement behind the vertical piles, and bending moment distribution of the inclined piles are discussed in detail. The findings are potentially important for the practical use of herringbone retaining structures in future large-scale deep excavation constructions.

2. Model Tests of VIPW

2.1. Scaling Ratio of the Models

The full VIPW consists of vertical piles, batter piles, a capping beam, and a wale [35]. The vertical piles are distributed along the edge of the excavation for resisting earth pressure acting on their back side, and they are mainly subjected to bending moment load. Thus, the bending stiffness EI is the significant parameter reflecting the lateral bearing capacity of the vertical piles [37]. The inclined piles are built inside the excavation and are linked to the vertical piles via the wale. They provide support axial force to limit the horizontal displacement of the vertical piles. Thus, the compressive stiffness EA is the significant parameter reflecting the compressive deformation capacity of the inclined piles. The capping beam and wale are located on the top and at a certain depth below the ground surface, respectively. The beam is used to increase the vertical piles’ integrity. The wale is used to link the vertical piles and inclined piles together and transfers some of the load acting on the vertical piles to the inclined batter piles. The capping beam and wale are not the main structures limiting the deformation. Therefore, their model material only needs to meet a certain strength and take geometric similarity into account.
In this paper, the geometric dimensions and mechanical parameters of the VIPW model were reasonably determined through the similarity of bending stiffness EI and the compressive stiffness EA principle, respectively. Table 1 shows the main scale relations of the 1 g physical modeling in the tests (prototype/model).
Considering the excavation scale and model test equipment size, the geometric similarity ratio of the model test is Cl = 20. The gravitational acceleration of the model is consistent with that of the prototype. Therefore, the similarity ratio Cg of gravitational acceleration g is equal to 1.
Due to the difference in the soil void ratio between the model and the prototype, the density similarity ratio Cρ at the reference point is not equal to the geometric similarity ratio Cl. However, the density difference in the reference point soil layer between the model and the prototype is so small that it can be ignored. Thus, it can be considered that the density similarity ratio Cρ = 1 [38,39]. According to the similarity criterion, the similarity ratio of each physical quantity can be calculated.

2.2. Experimental Program and Setup

2.2.1. The Large-Scale Model Platform of Combined Steel Structure

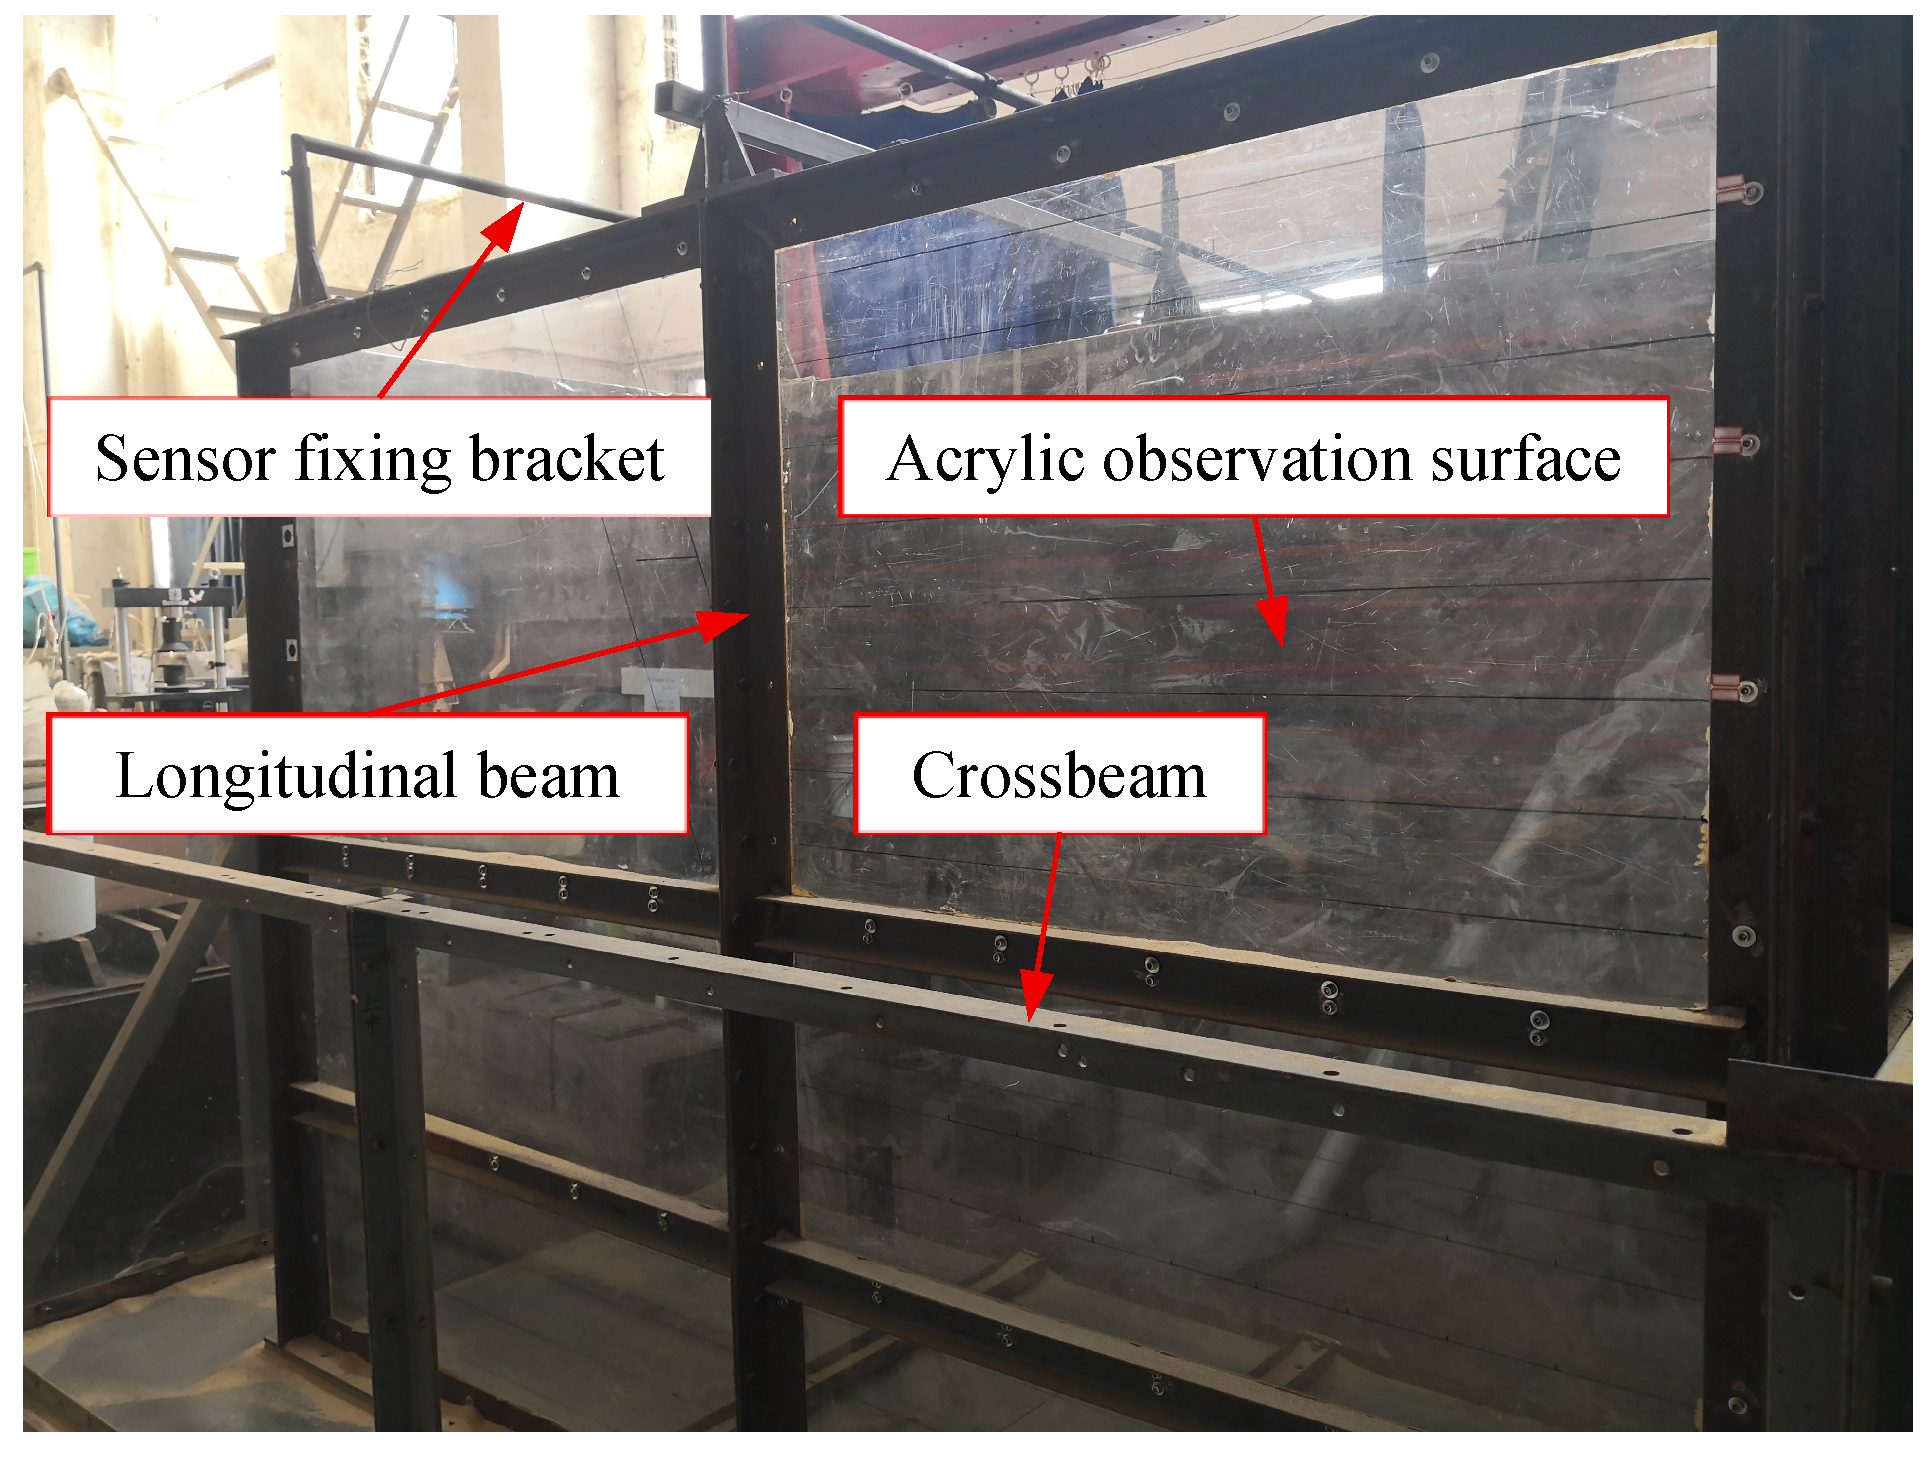
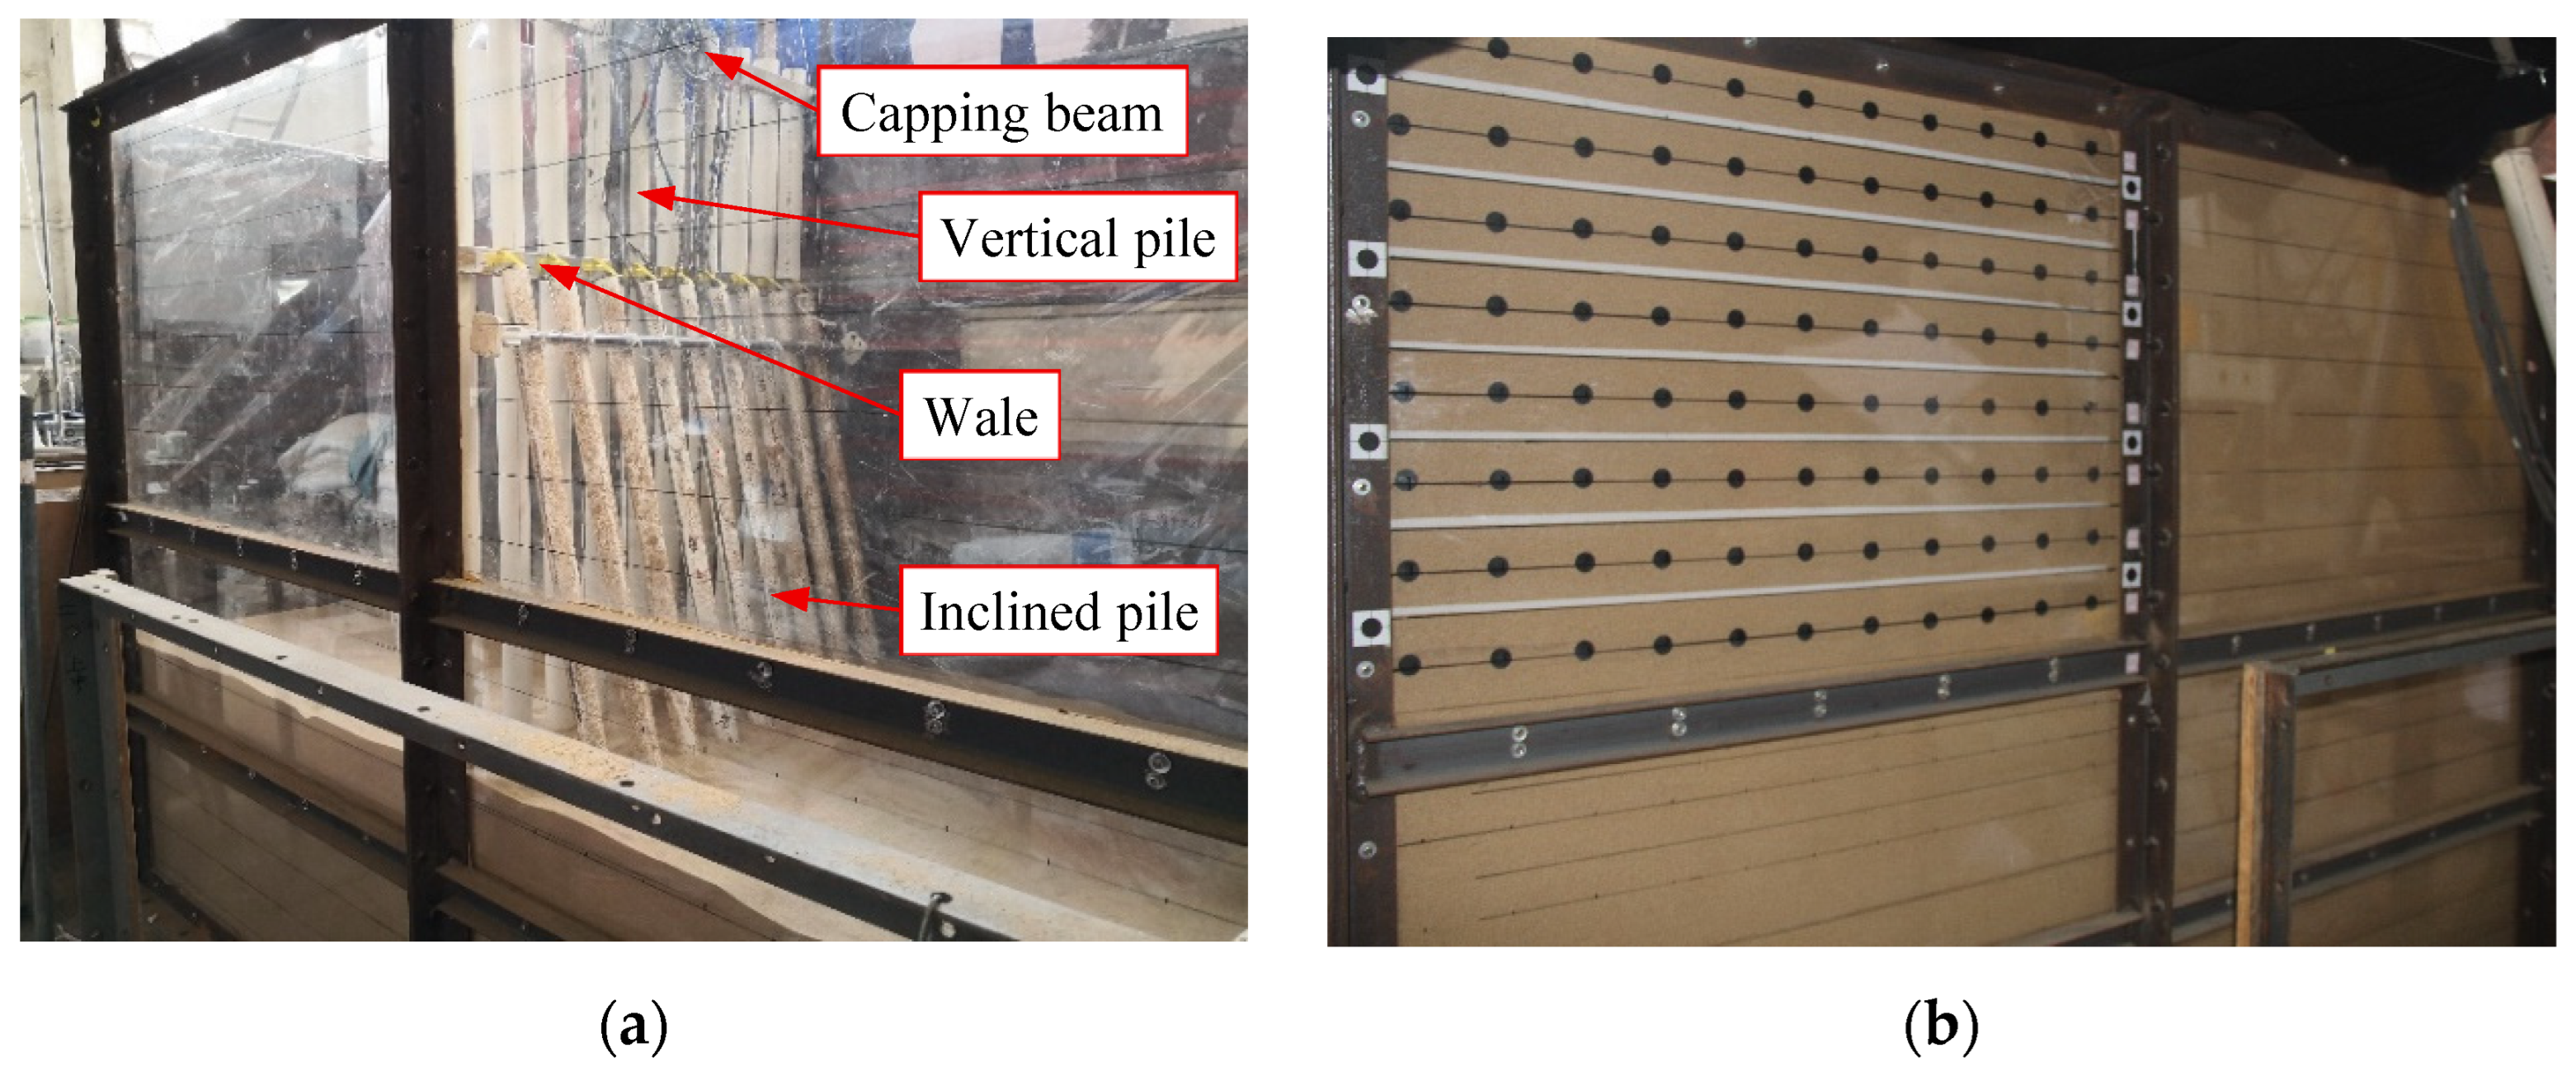
The model tests were conducted in a model box made of steel (see Figure 2). The size of the test model box was 2.4 m × 1 m × 1.8 m (length × width × height). Clear plexiglass with a thickness of 2 cm was installed on one side of the model box to facilitate observation and record the test process. The model box was polished internally to minimize the side friction that may develop between the container and the soil.

2.2.2. Excavation-Supported System

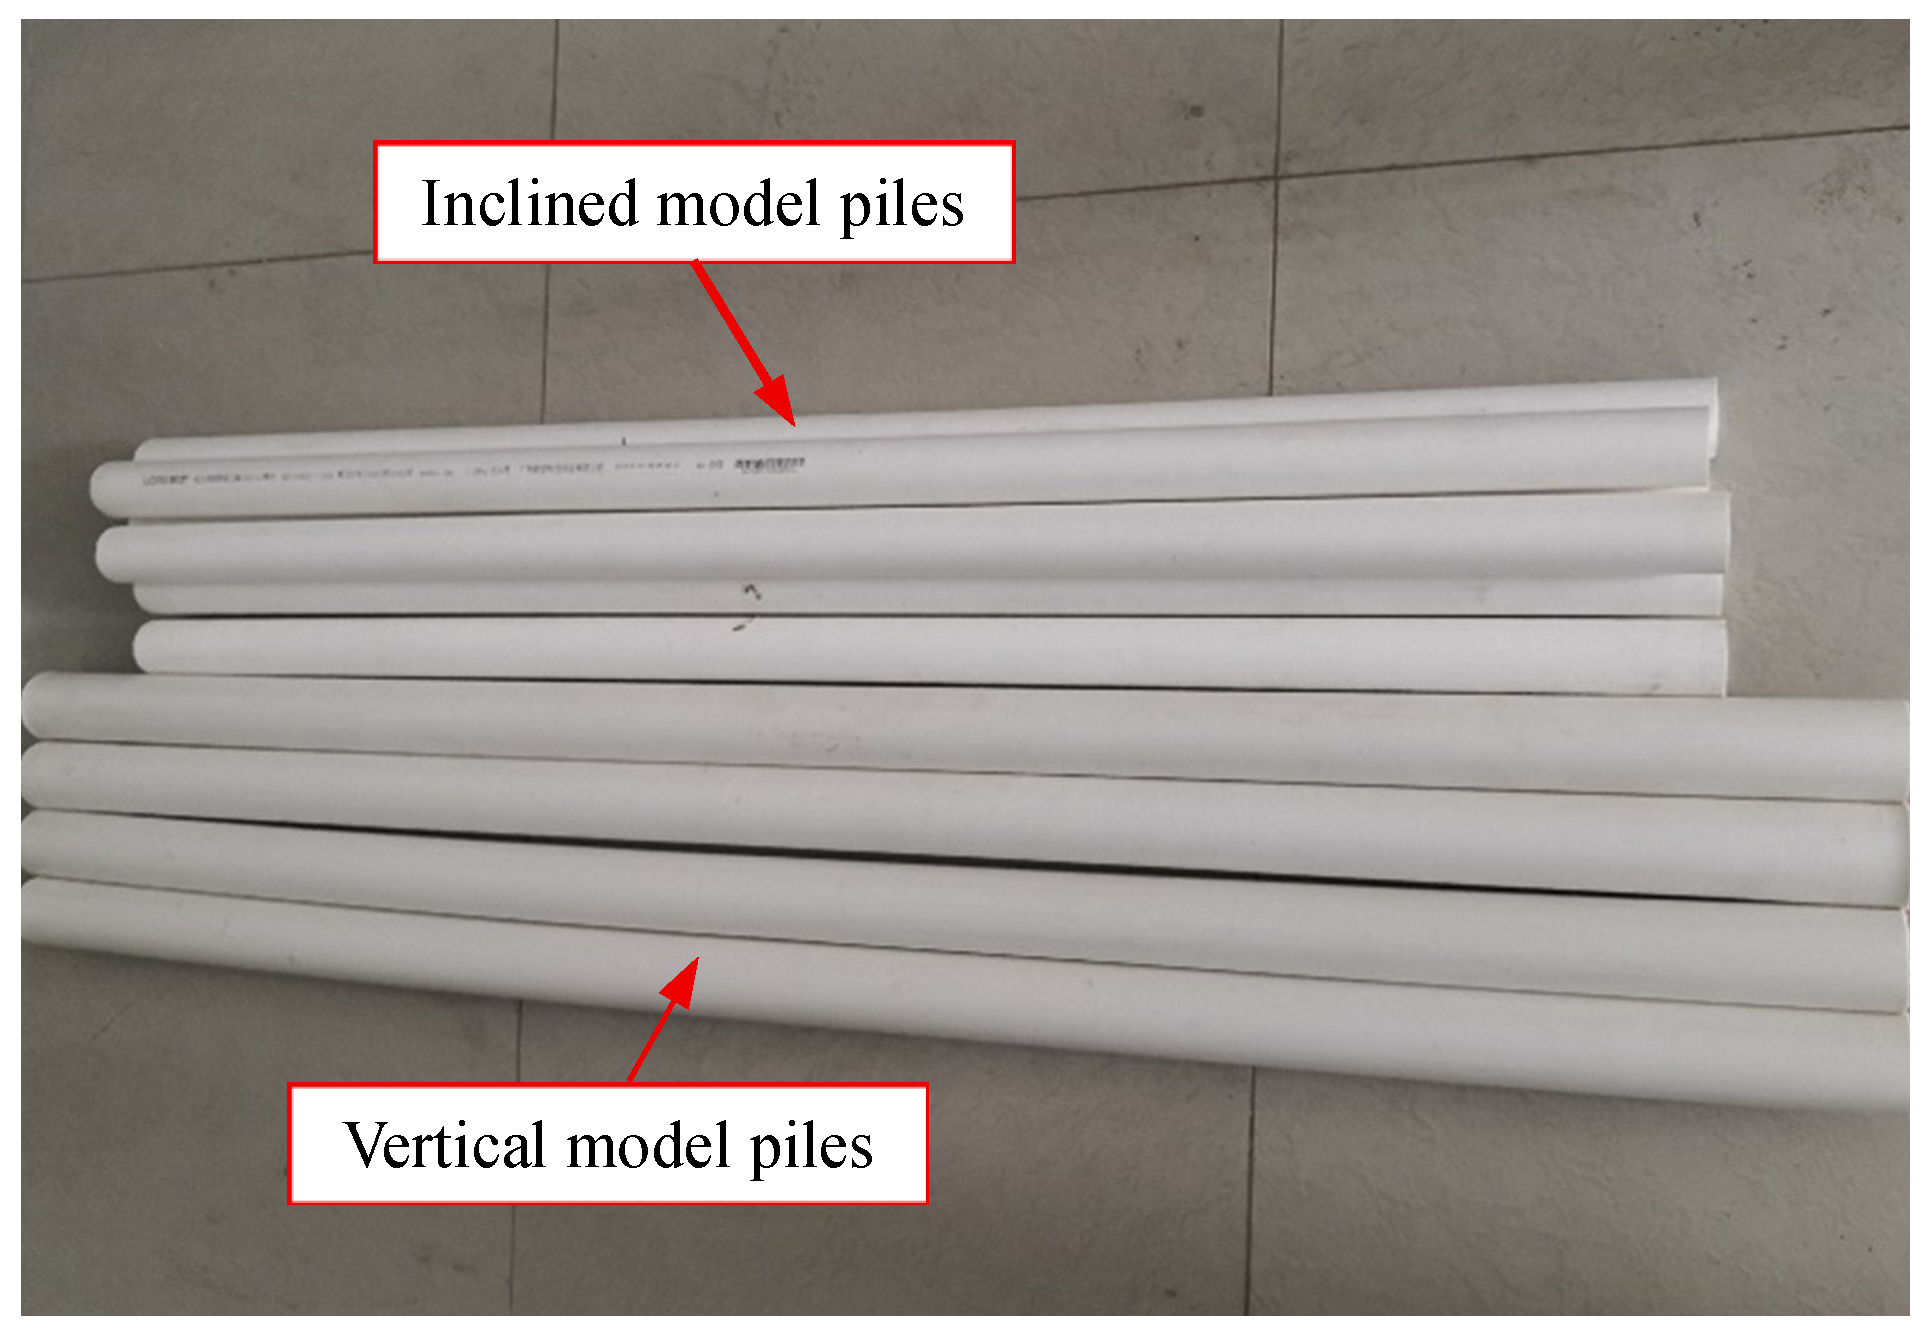
The model piles, including vertical piles and inclined piles, were fabricated from round PVC pipes (see Figure 3). The outside diameter of the vertical pile was 50 mm, and the wall thickness was 2 mm. The outside diameter of the inclined pile was 40 mm, and the wall thickness was 2 mm. The lengths design of the model piles were described in Section 2.3.
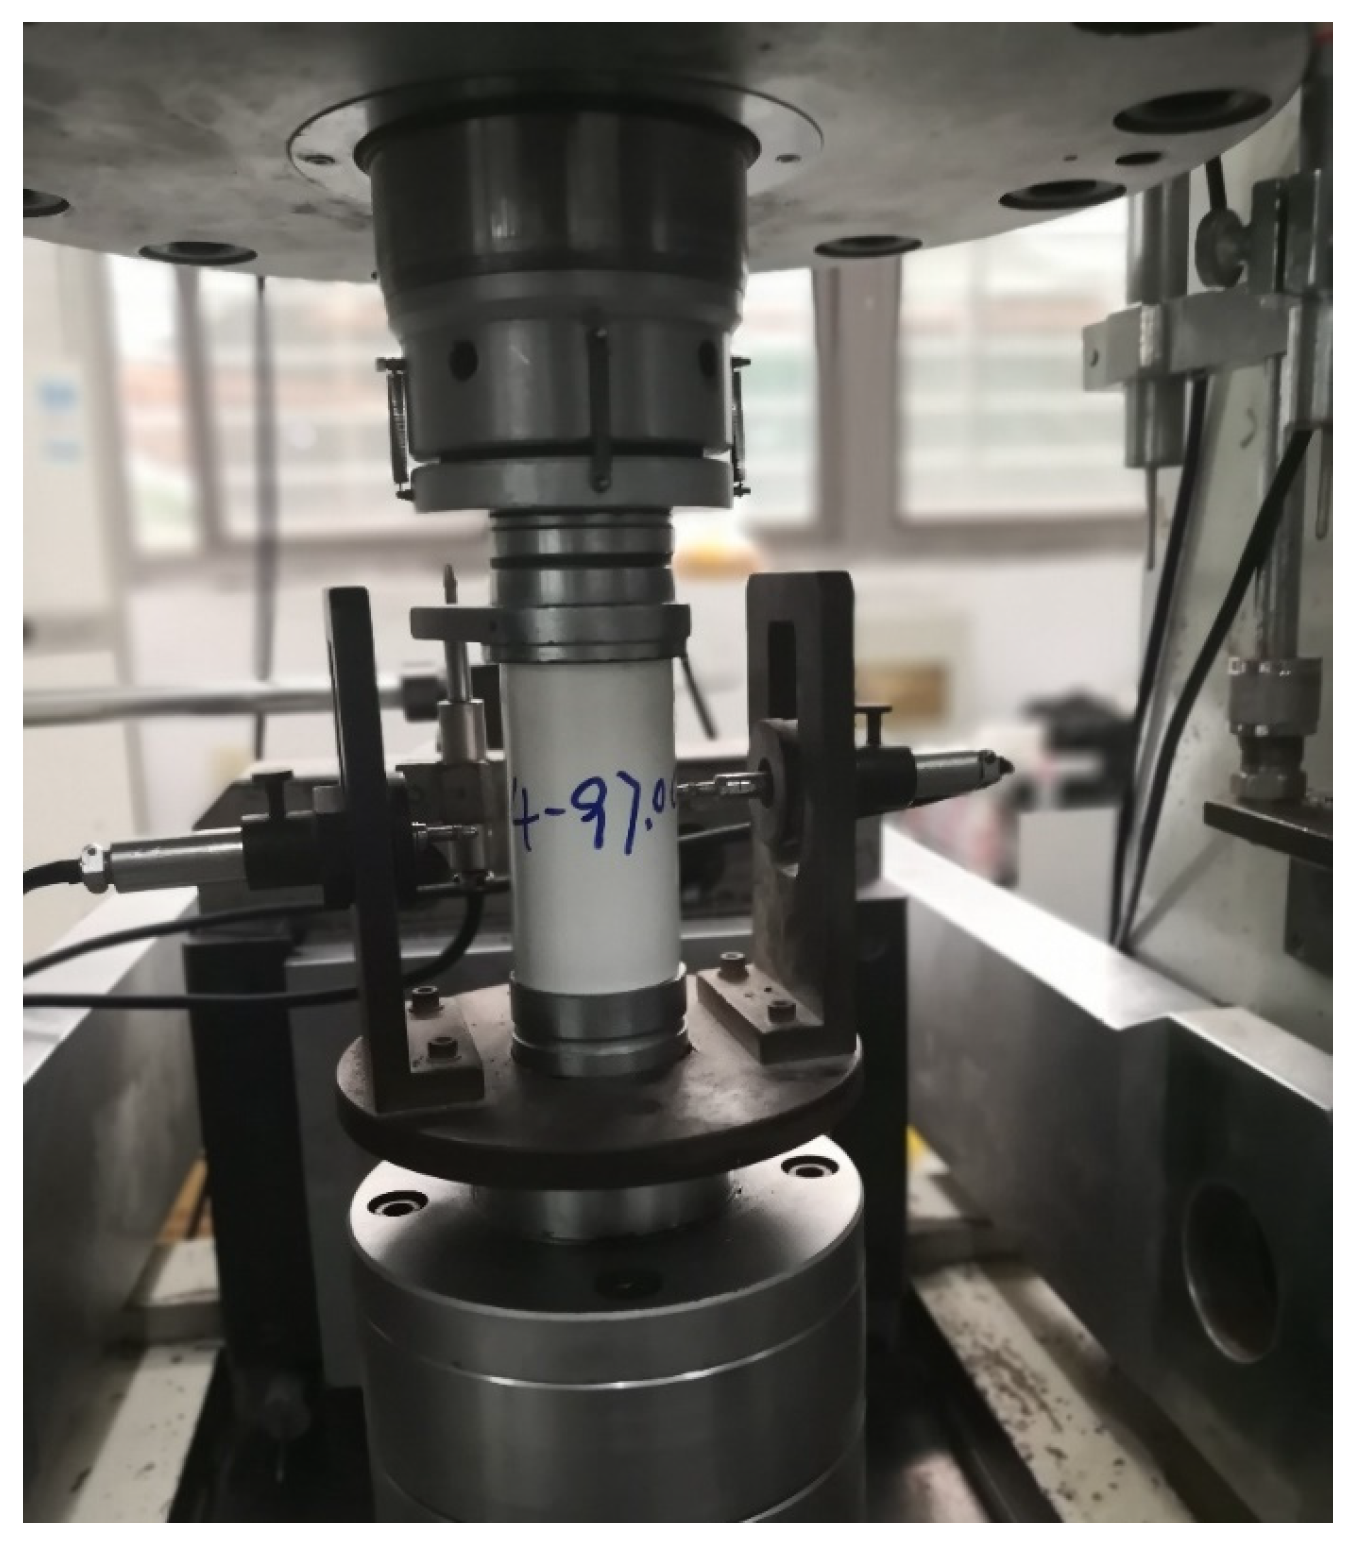
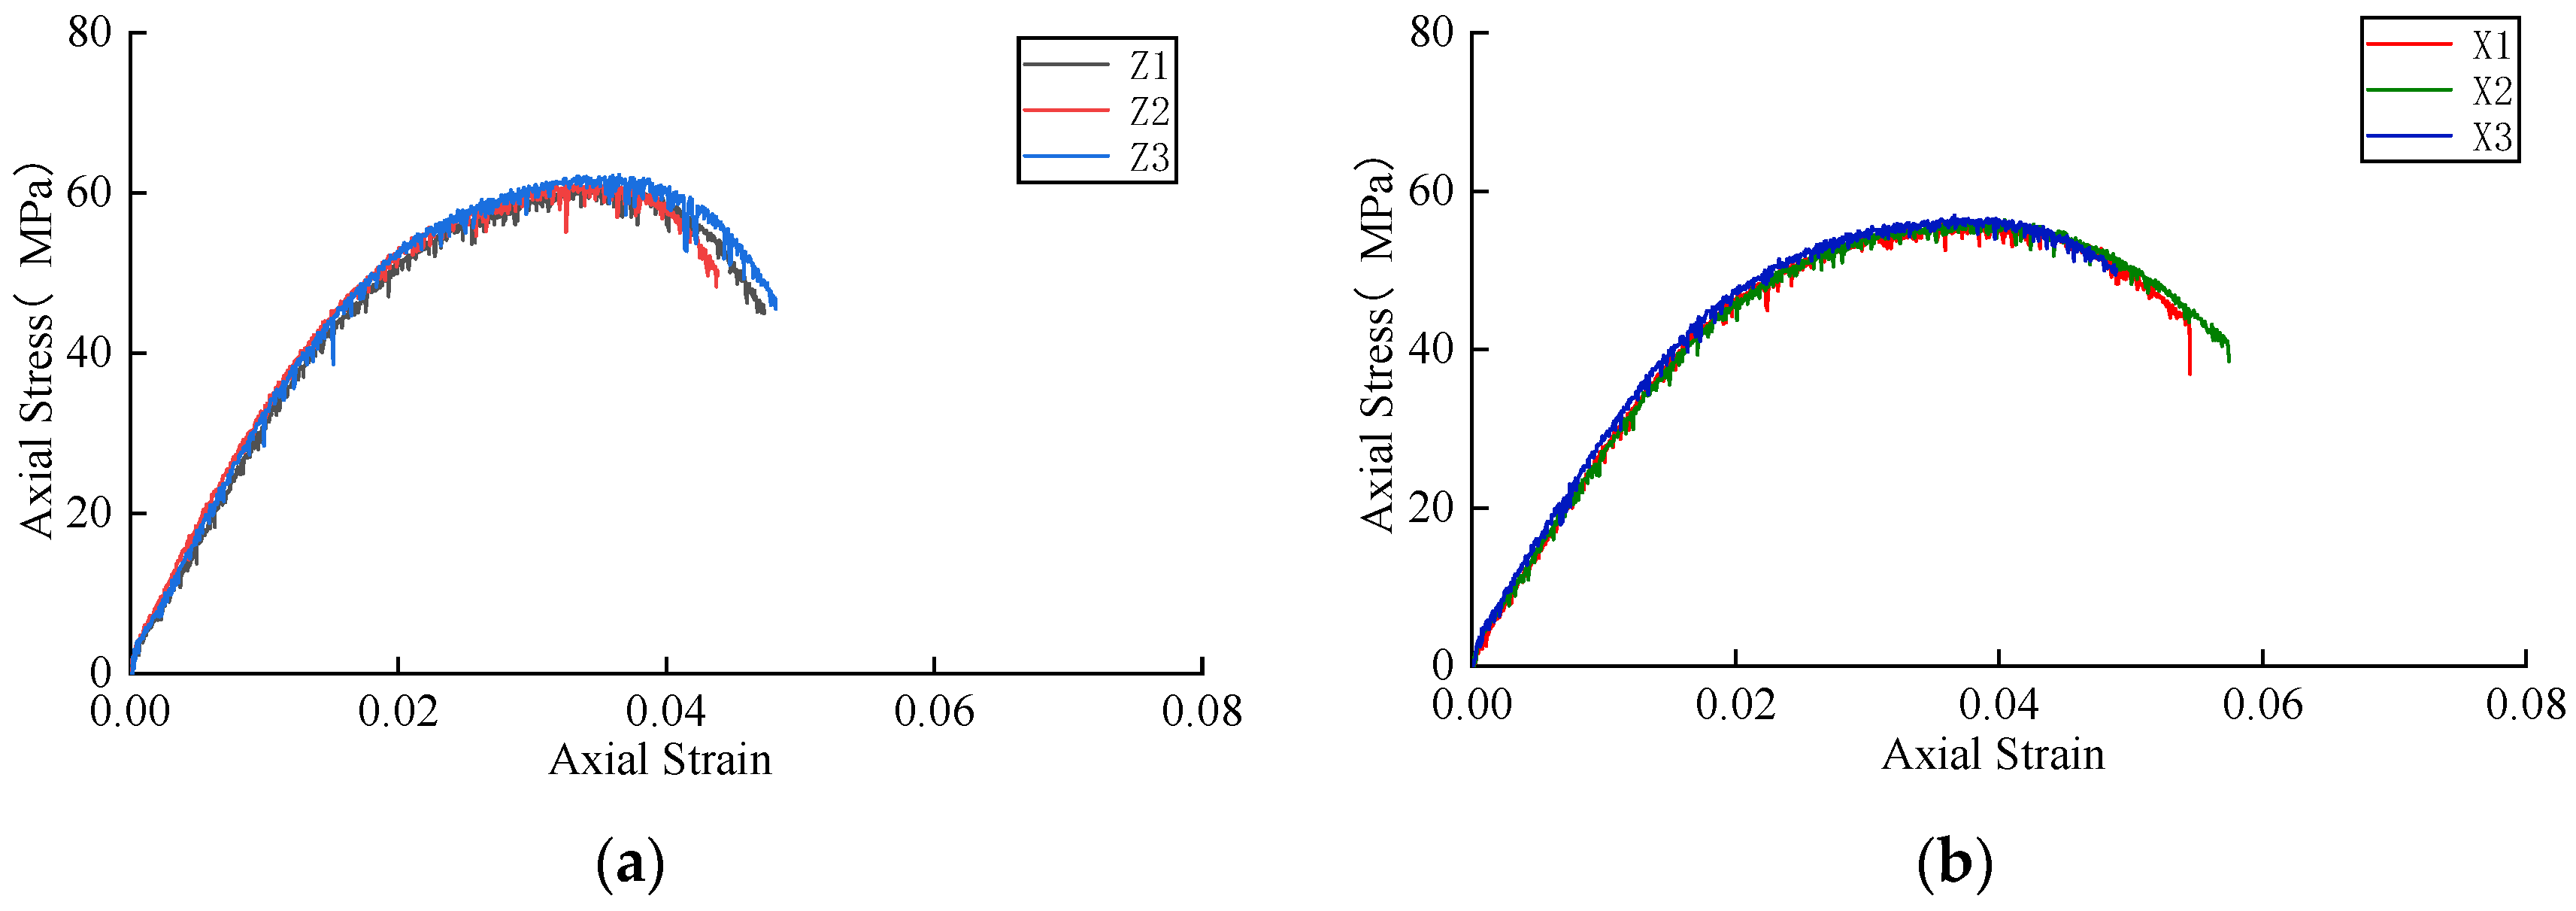
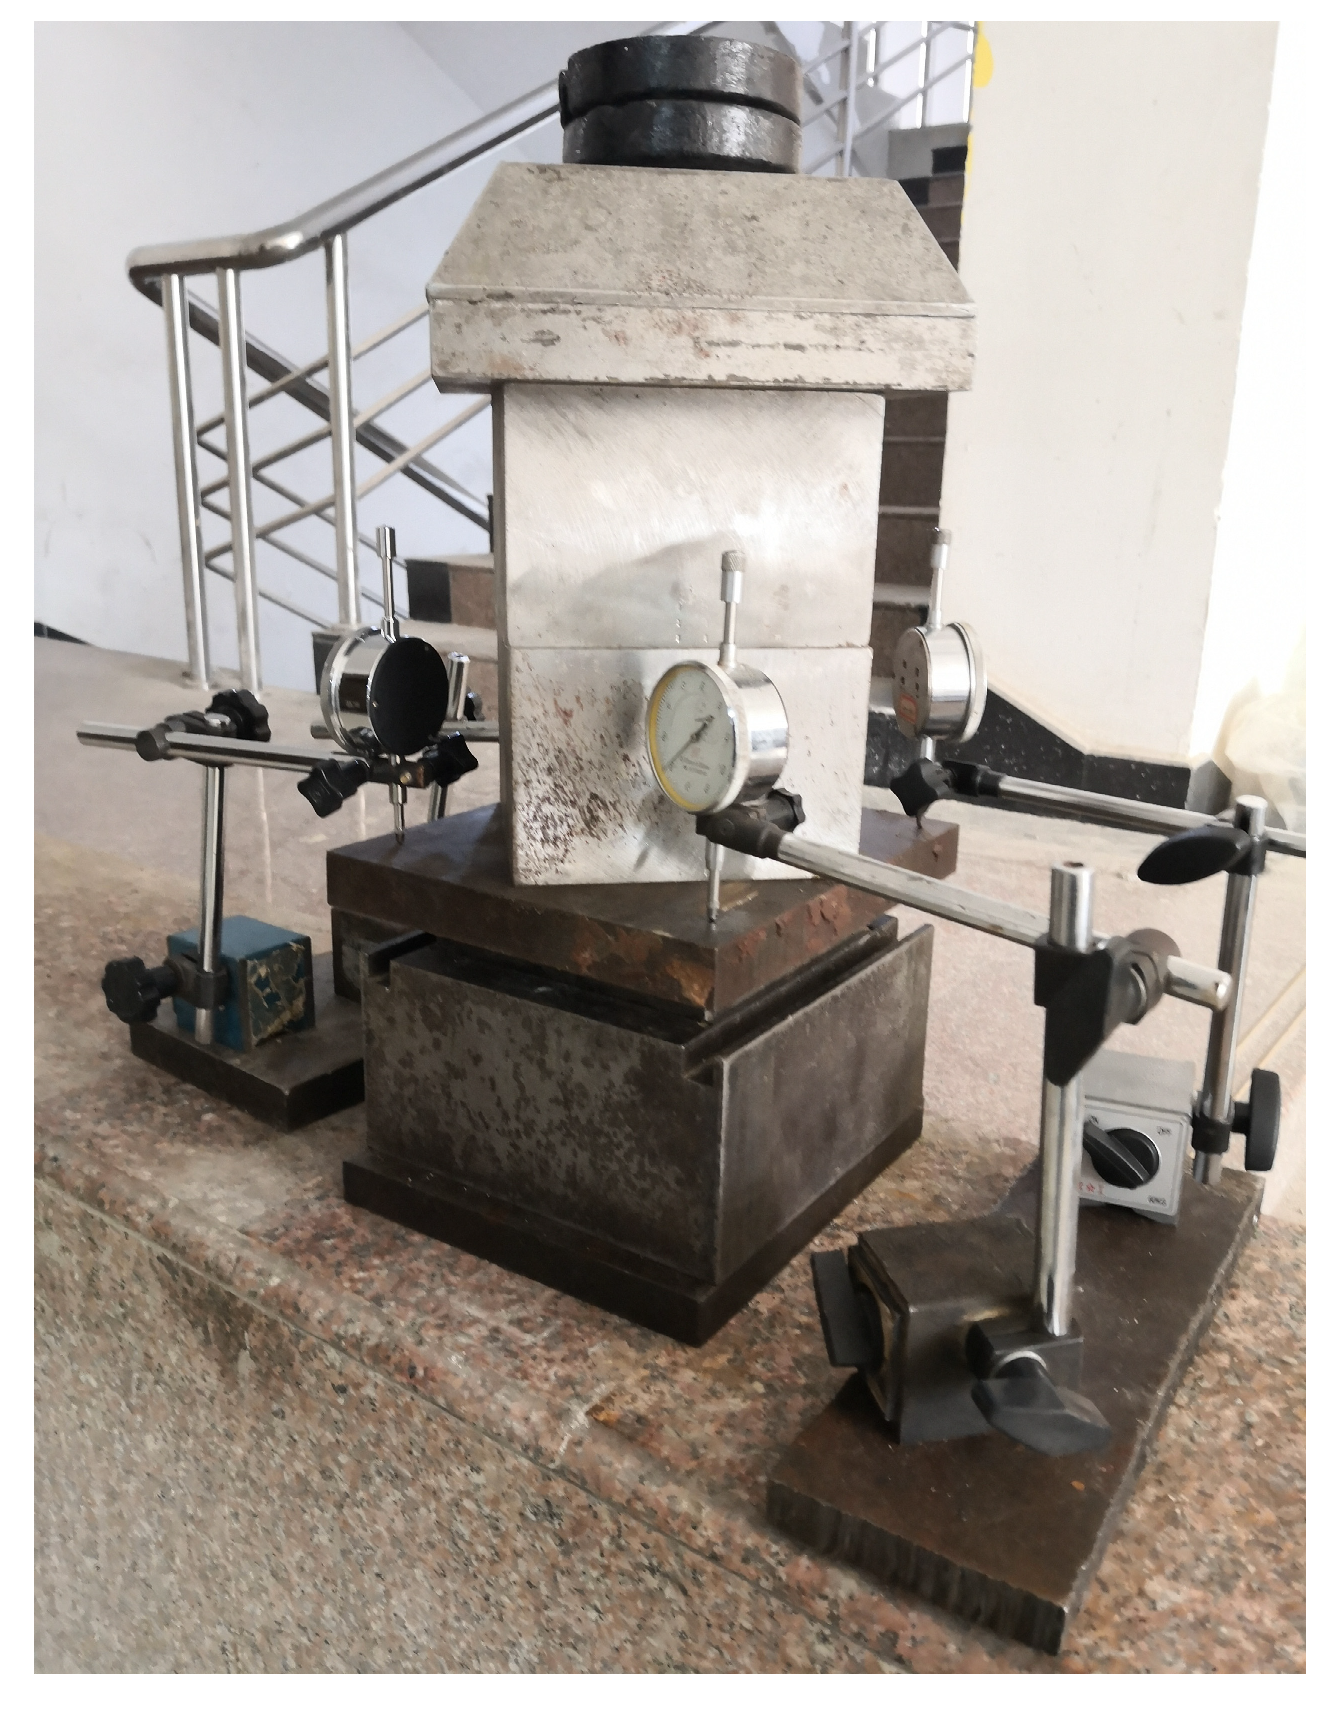
Uniaxial compression tests were carried out on two kinds of PVC pipes, in order to obtain their Young’s moduli (see Figure 4). The obtained Young’s moduli of the pile models are listed in Table 2. The height-to-diameter ratio of the PVC plastic pipe specimen was 2, which can reduce the end effect of the specimen. The displacement control method was used in these tests. Figure 5 shows the axial stress–strain relationship curve of the PVC pile models. It can be noted in Figure 5 that there are obvious linear elastic deformation stages in the stress–strain curves. The model piles were subjected to limited load during excavations in the tests. Thus, it can be considered that the piles were in the elastic deformation stage. According to the experimental results, the Young’s modulus (E) of the PVC pipes used in the model tests was calculated according to the following formula [40,41].
E = m a x σ A σ B ε A ε B
where σA and σB are the stress corresponding to point A and point B on the stress–strain curve, respectively. εA and εB are the strain of point A and point B, respectively.
σA and σB are assumed to obey the following equation:
σ A σ B = 50 % σ 0
where σ0 is the peak stress.
Table 2 shows the Young’s moduli of the pile models calculated according to Equations (1) and (2). The bending stiffness (EI) of the vertical pile model is 286.3 N·m2, for a pile with a diameter of 1 m, and for the prototype it is 9.16 × 10⁵ kN·m2. The compressive stiffness (EA) of the inclined pile model is 6.8 × 10⁵ N, as the pile with a diameter of 0.8 m, and for the prototype it is 5.44 × 10⁹ N.
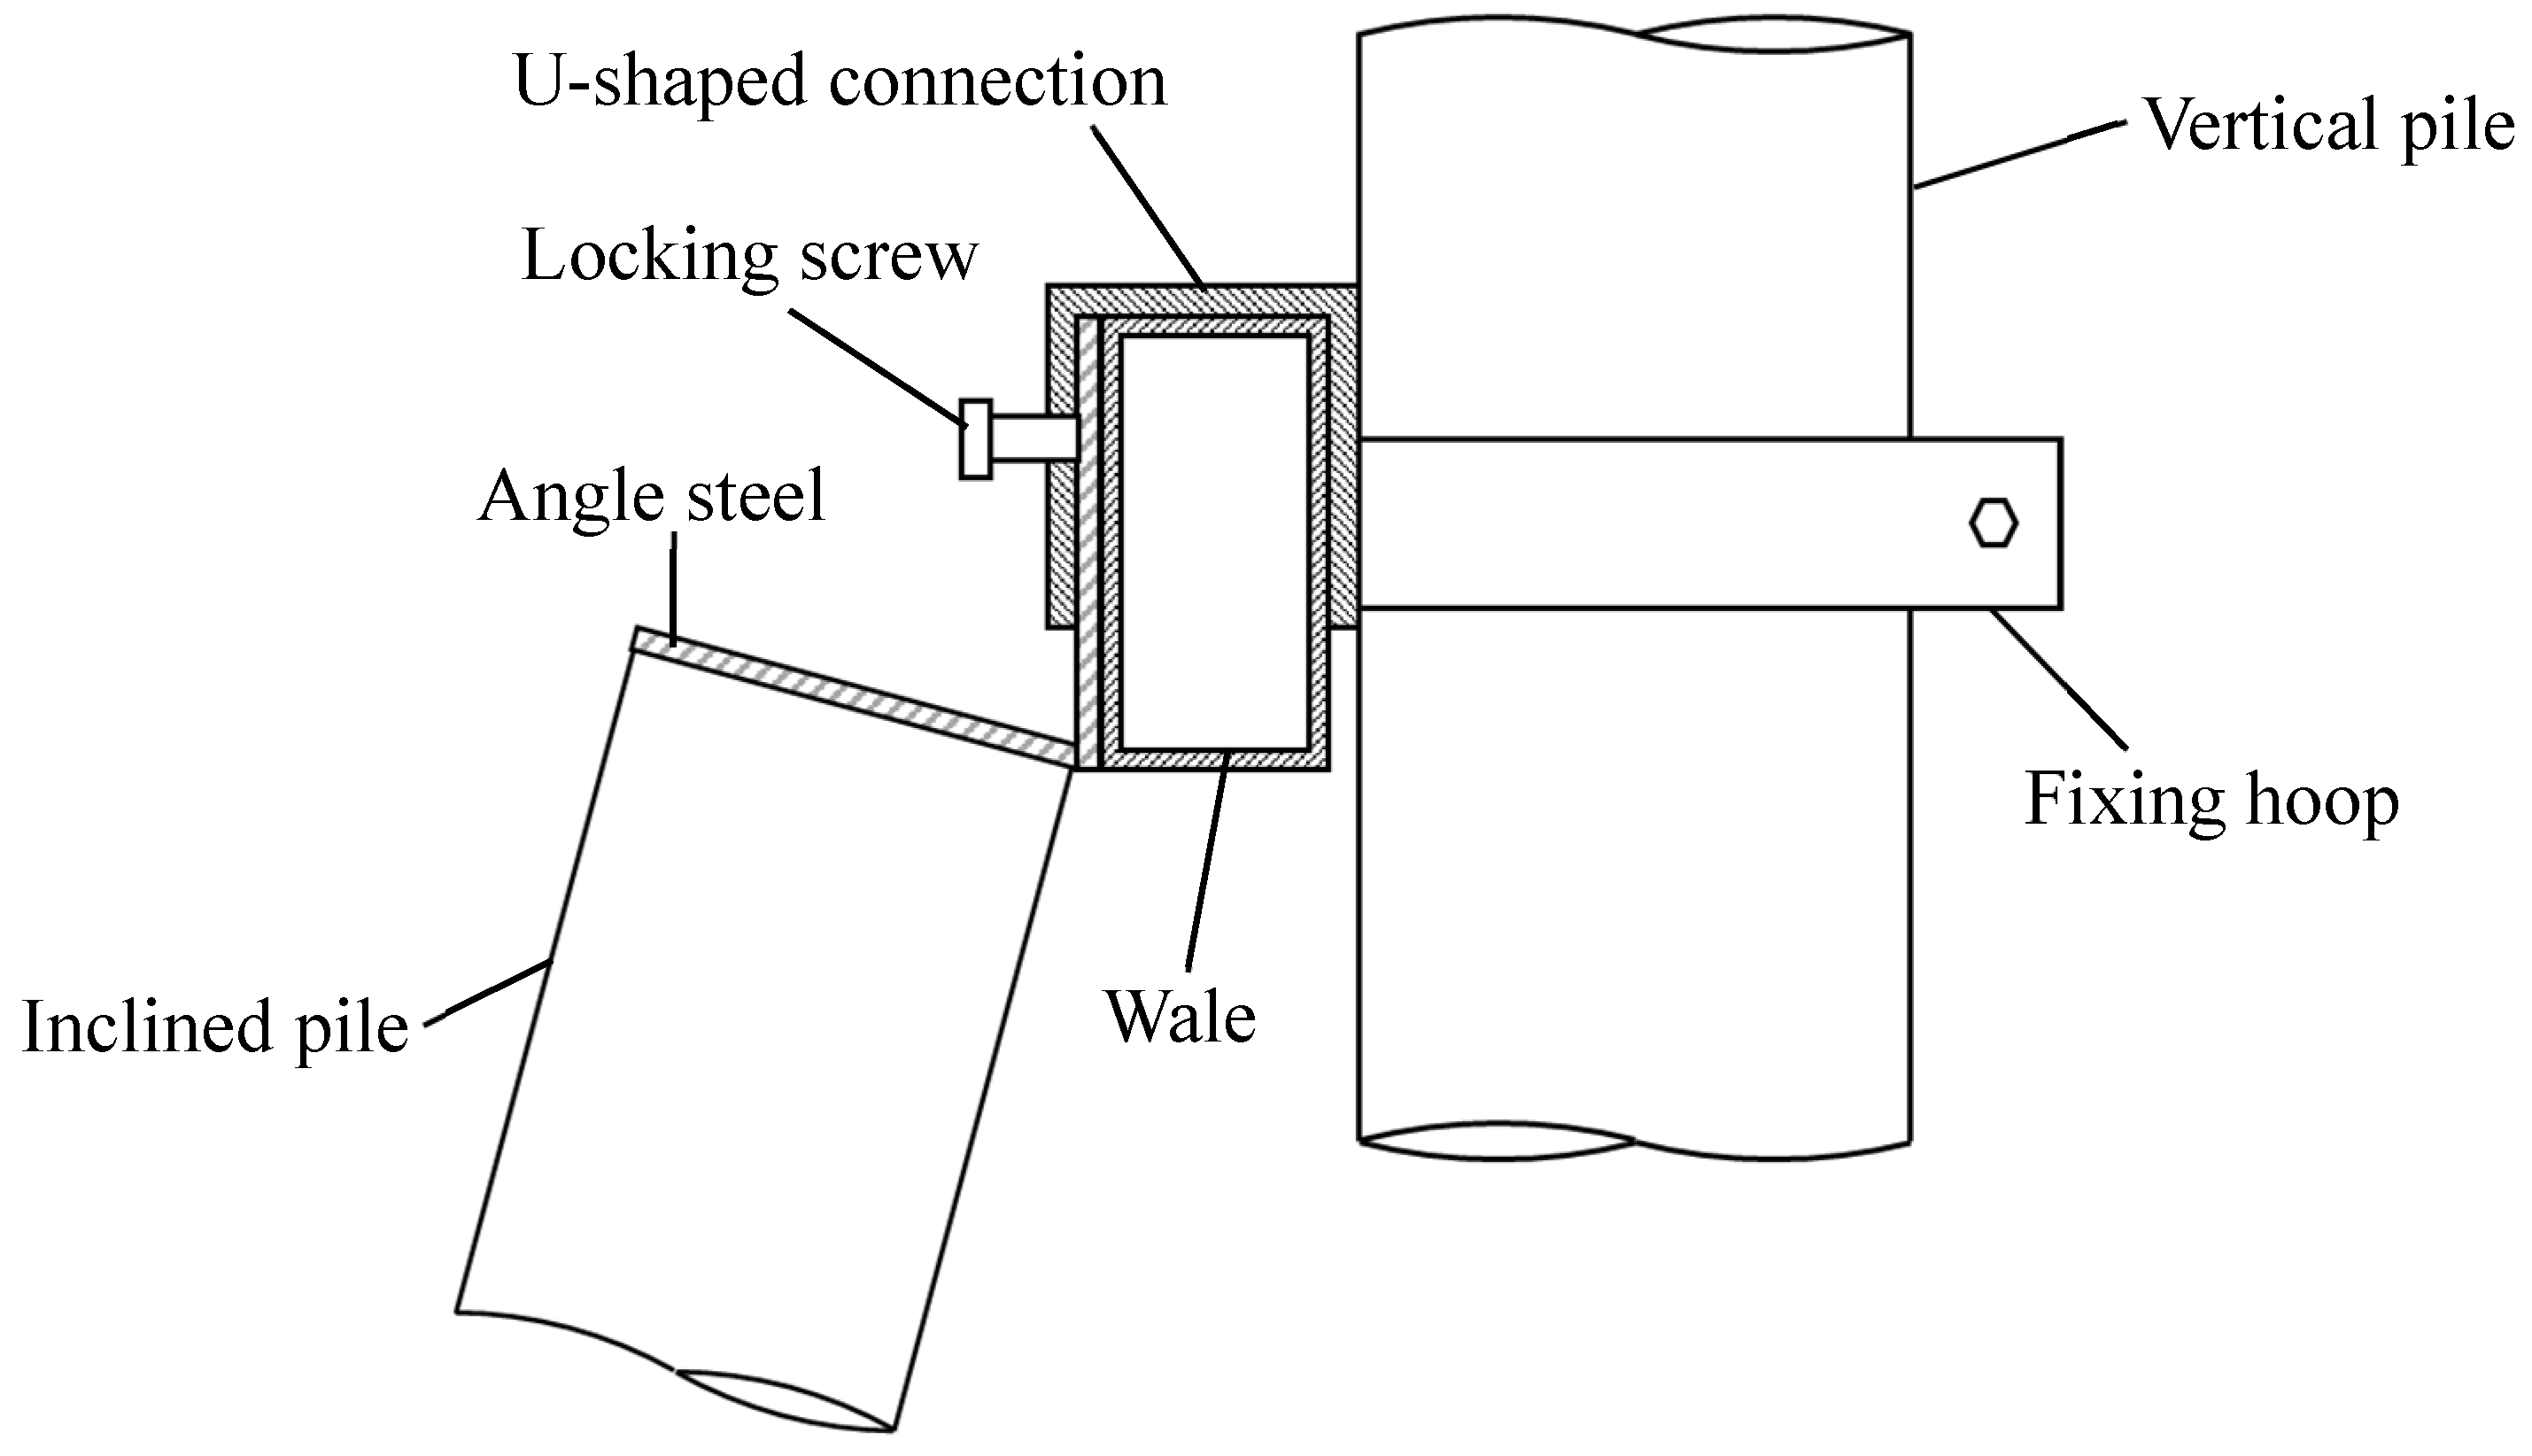
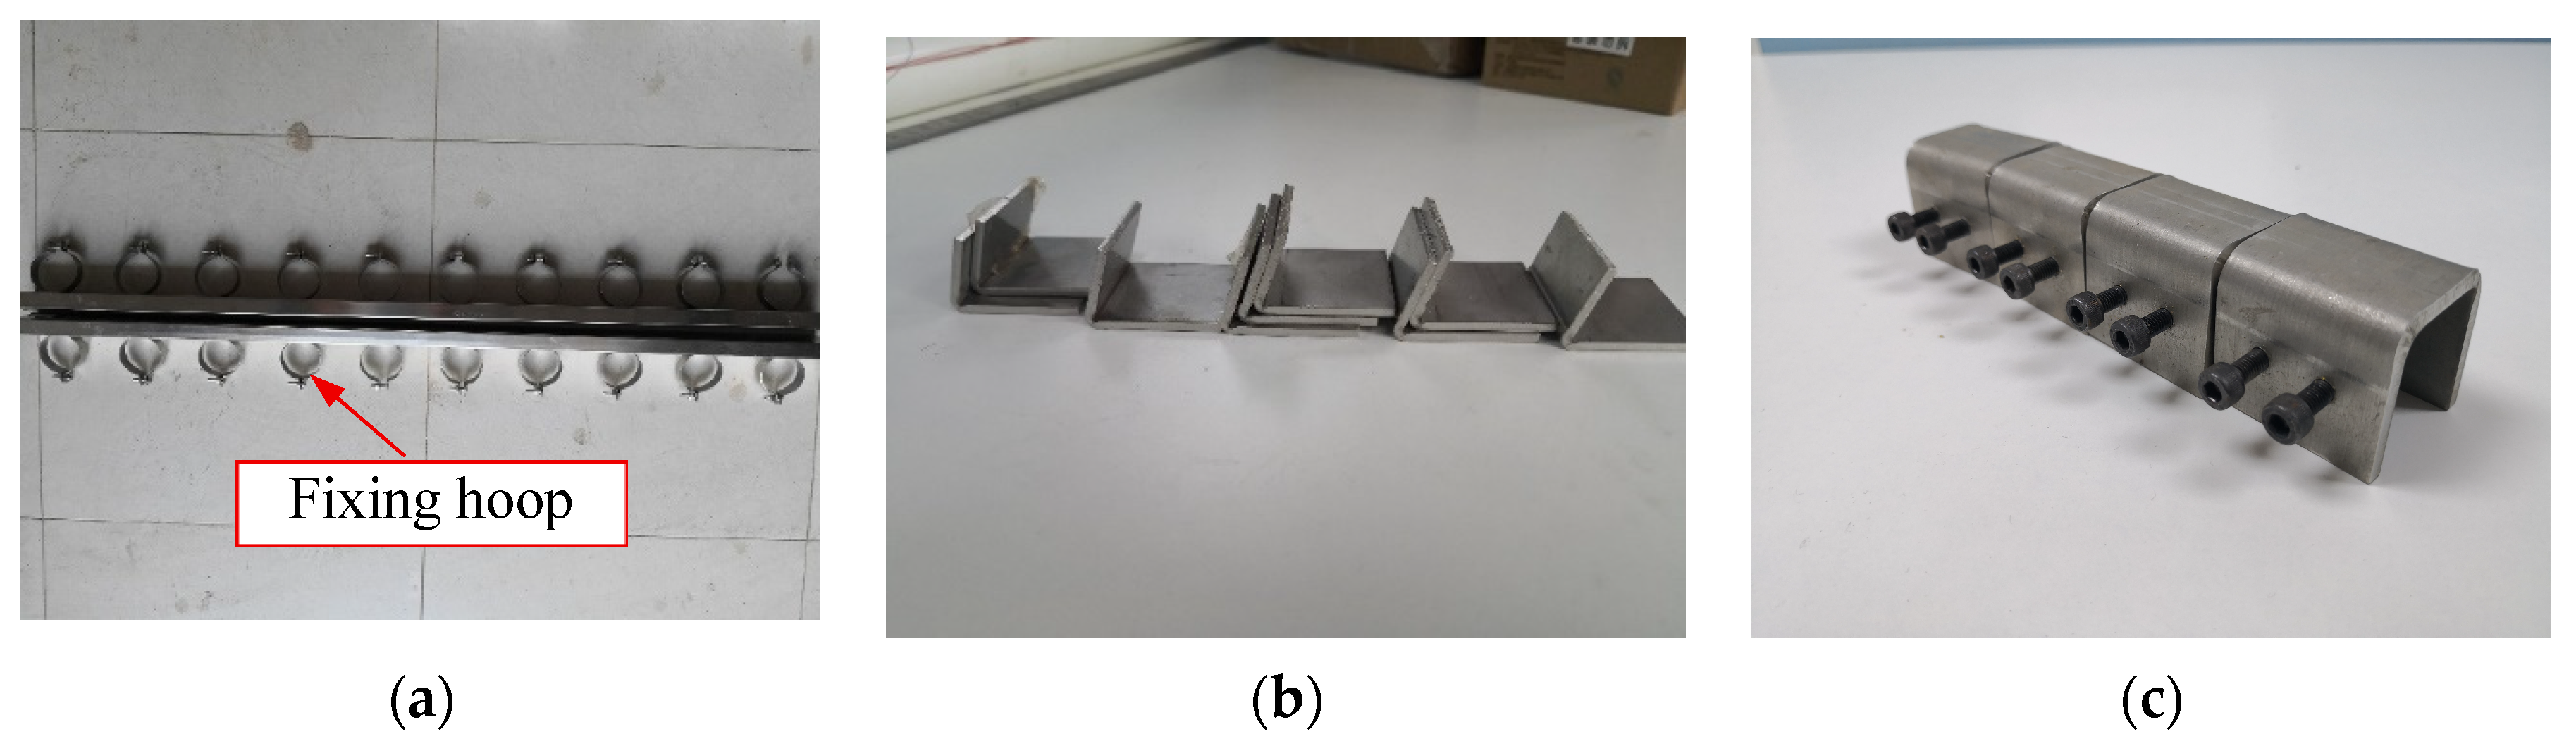
The capping beam, wale, and the connection between them mainly transfer load between the vertical piles and inclined piles. Thus, they are made of stainless steel material, regardless of their material similarity. The section shapes of the capping beam and wale are rectangular, with a height of 40 mm, width of 20 mm, and length of 980 mm. Figure 6 shows a diagram of the connection between a vertical pile and inclined pile. The capping beam, wale, and vertical and inclined piles are installed according to Figure 6. Figure 7 shows photos of the wale model and the connector.
In order to simulate the soil retaining effect of the vertical piles and shotcrete between them, polyester (PET) film with a thickness of 0.038 mm was pasted on the back side of the model piles to prevent sand leakage from the cracks between piles. The impact of the PET film on the flexural stiffness of the vertical piles can be ignored.

2.2.3. Soil Preparation

The model tests were performed in dry sand. Table 3 presents the particle size distribution of the soil. The coefficient of the nonuniformity Cu was 1.81, and the coefficient of curvature Cs was 0.88. The grain size d50 was less than 0.5 mm. Dv/d50 > 100 and Di/d50 > 80, where Dv is the diameter of the vertical pile and Di is the diameter of the inclined pile. Thus, the grain-size effect could be ignored. Table 4 presents the main physical and mechanical parameters of the soil.

2.2.4. Monitoring Program

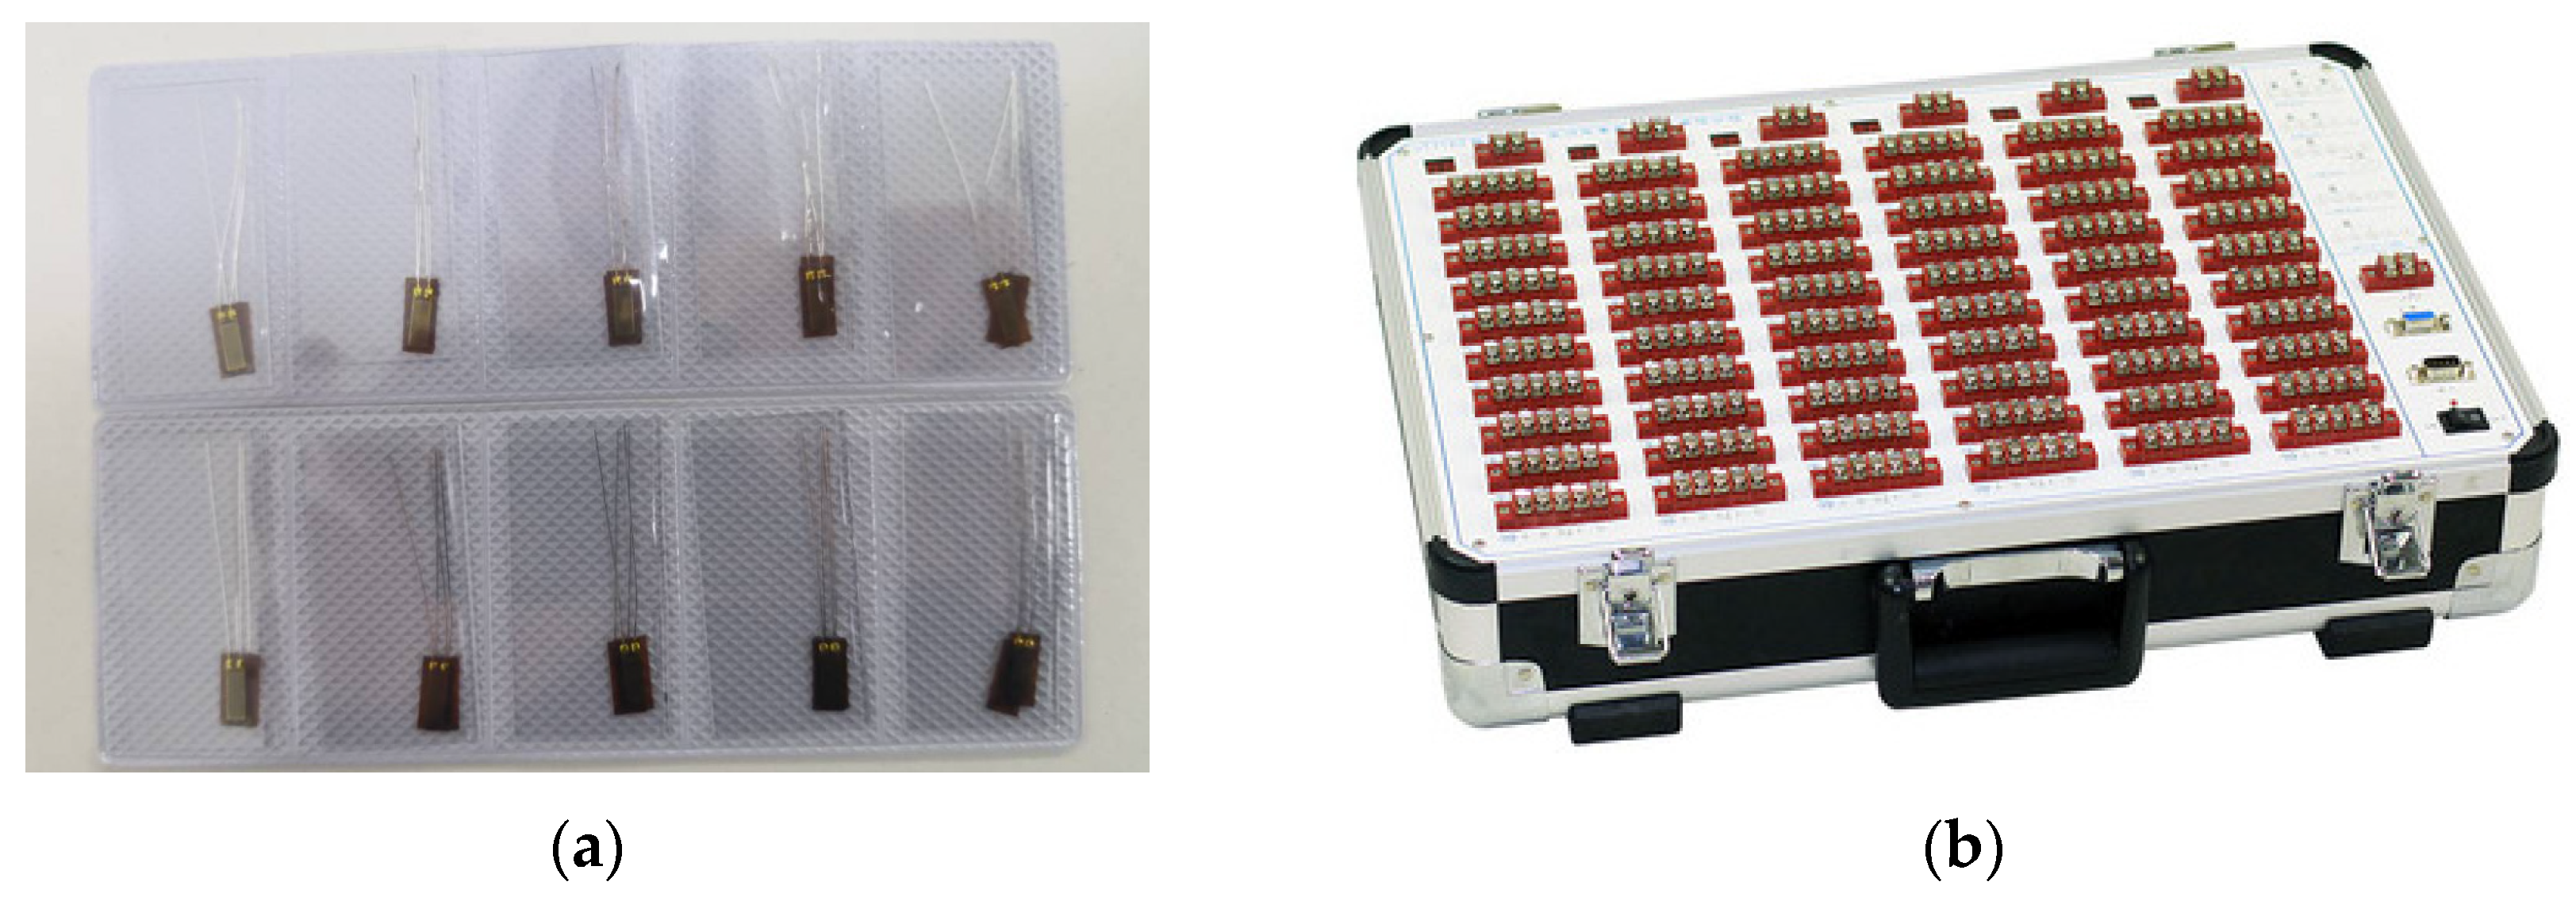
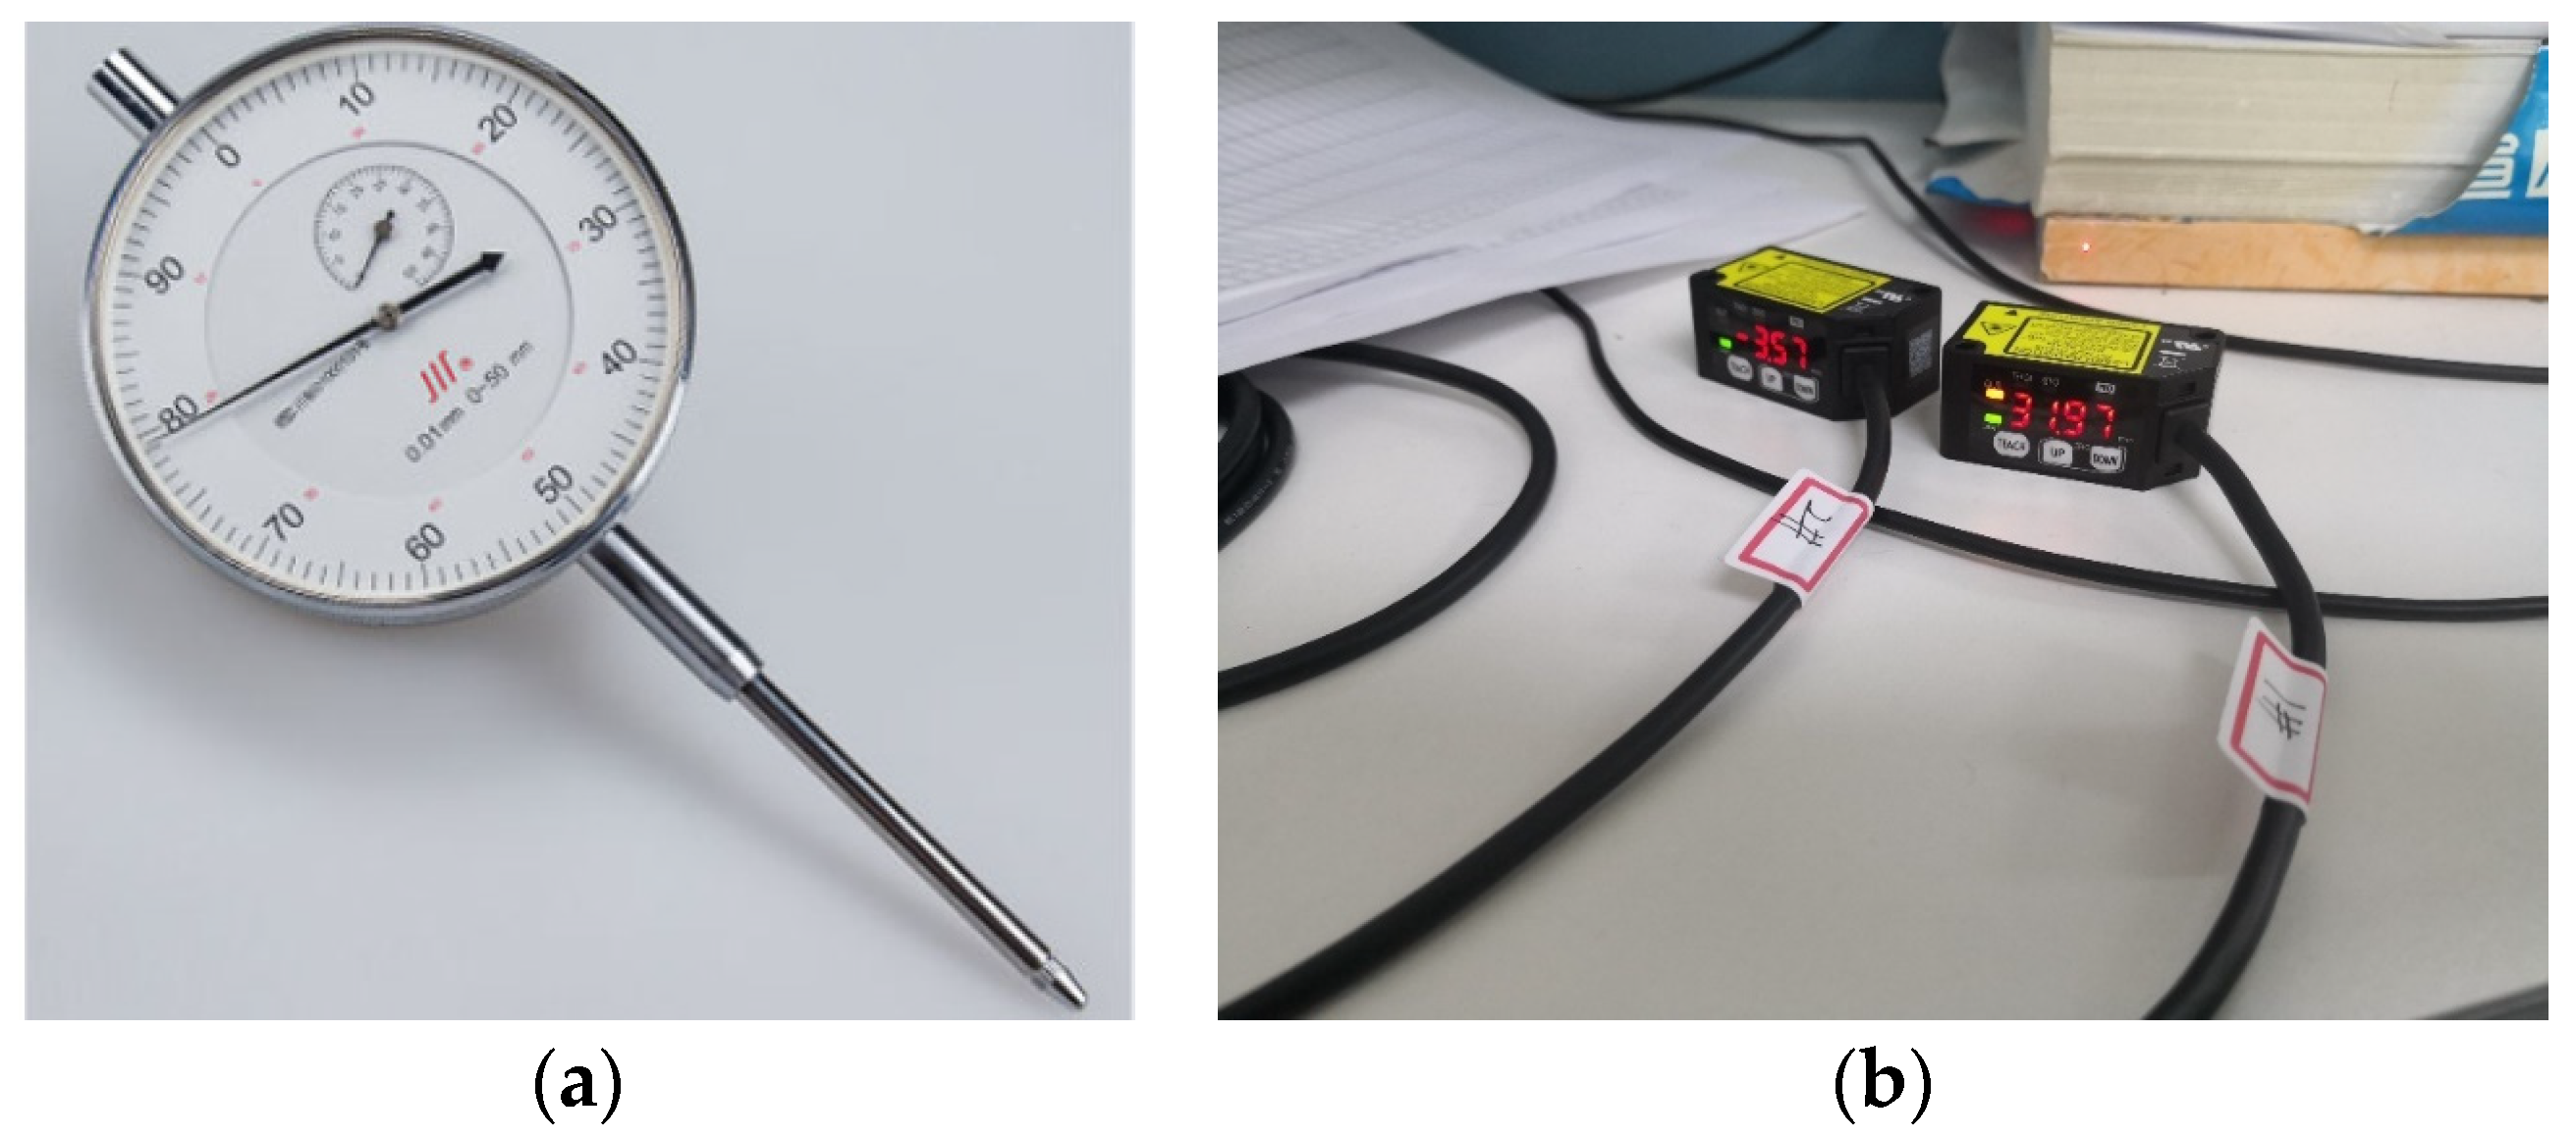
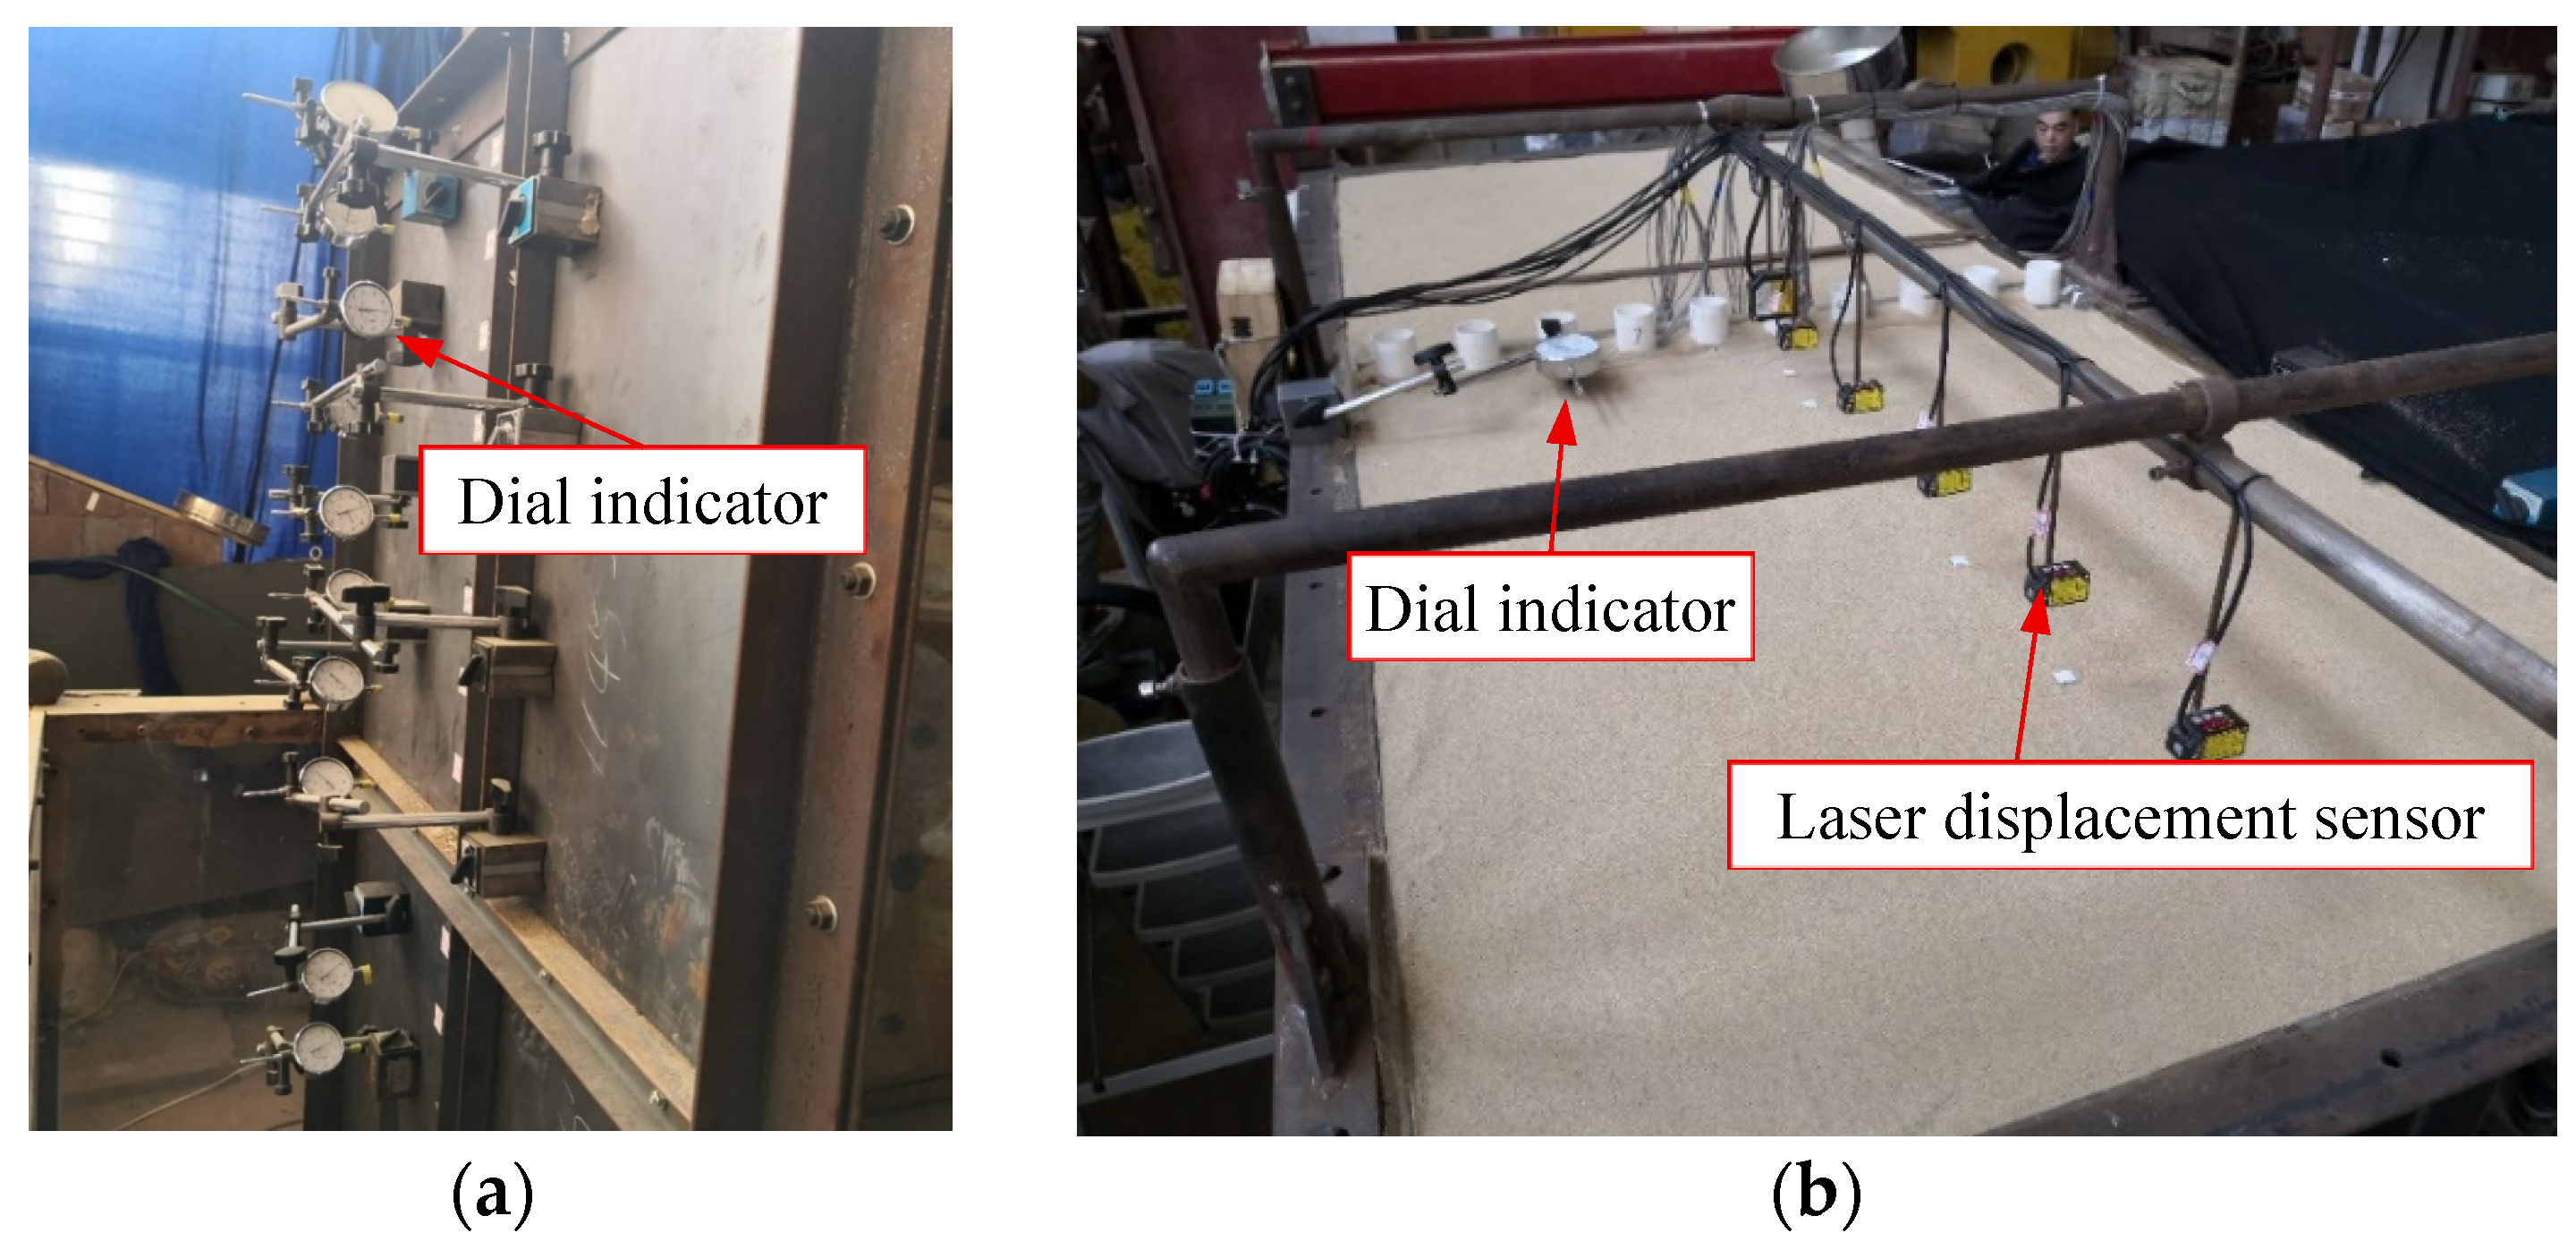
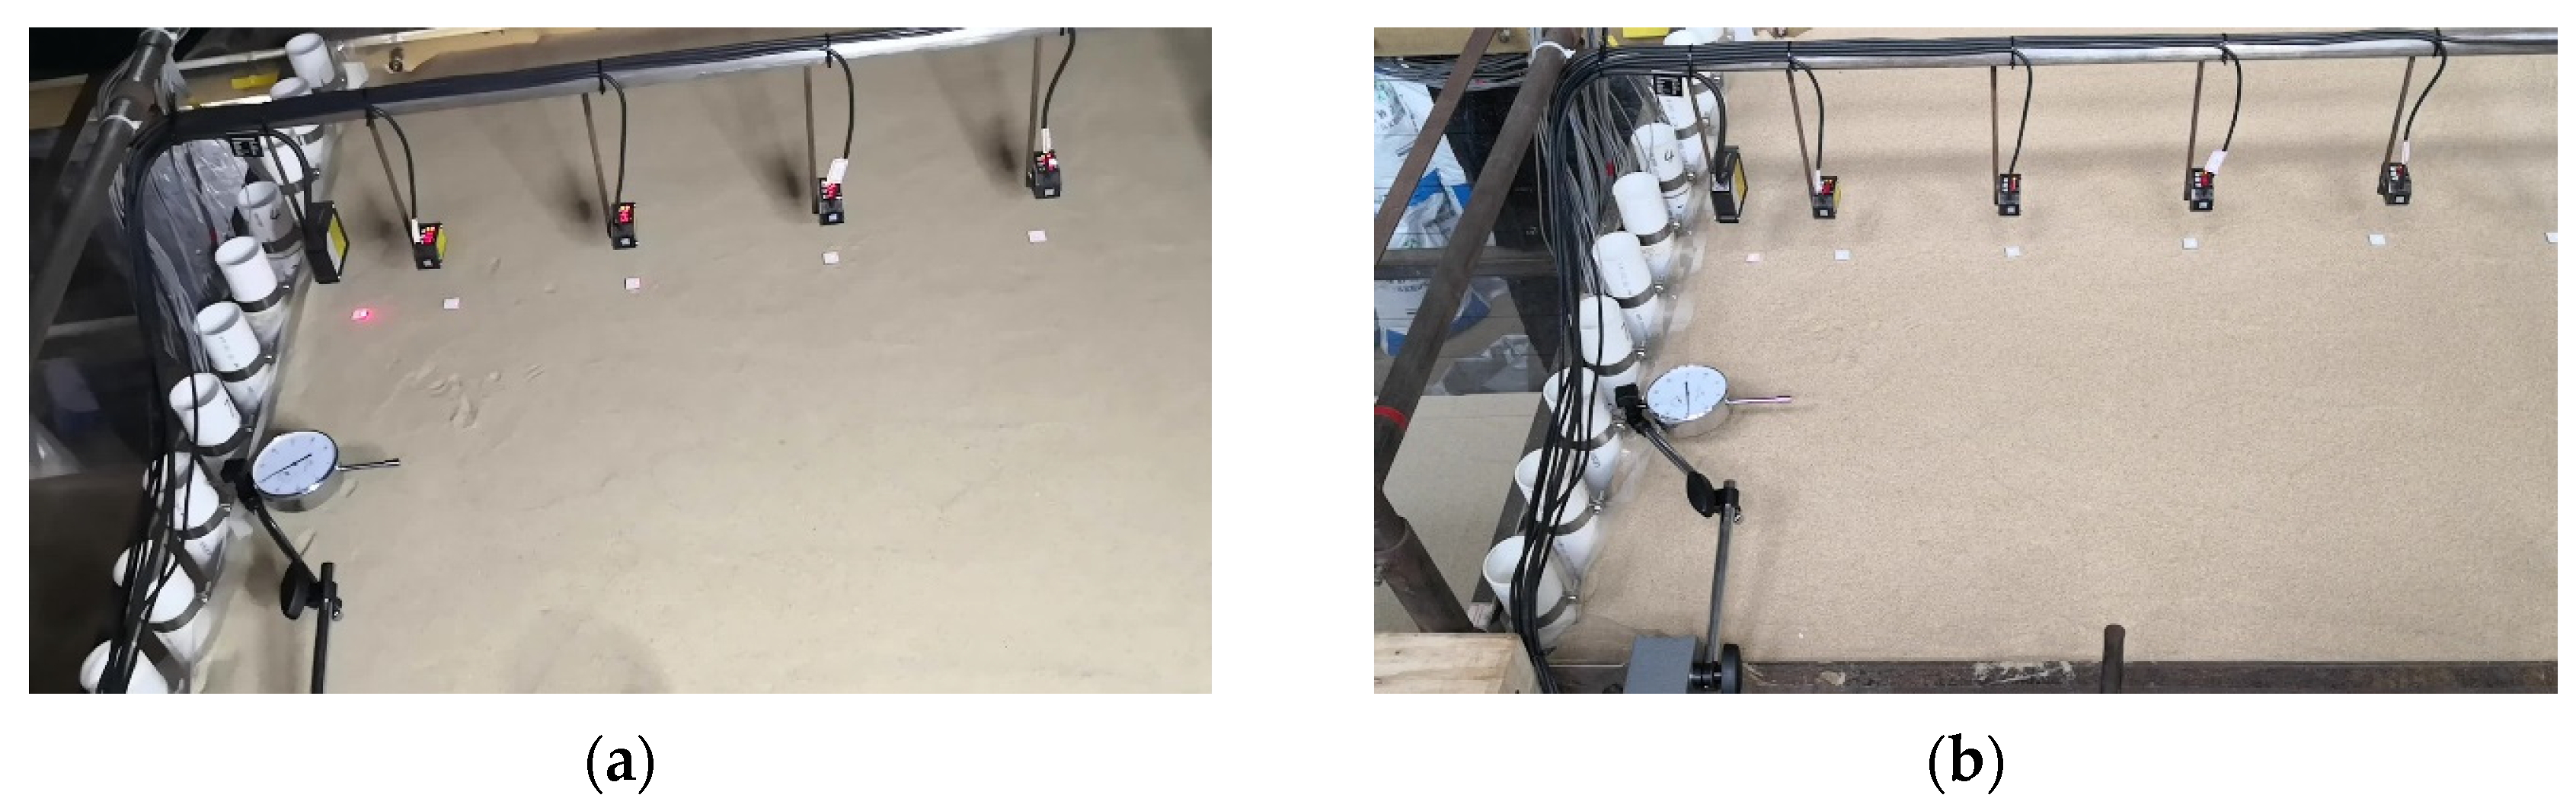
In order to better understand the performance of the VIPW during foundation pit excavation, a series of instruments were installed in each group of experimental models. Figure 8 shows photos of the displacement sensors, including the dial indicator for monitoring horizontal displacement of the vertical pile (see Figure 8a) and the laser displacement sensors for monitoring settlement (see Figure 8b). Figure 9 shows the strain acquisition system, including multiple strain gauges (see Figure 9a) and strain acquisition instrument (see Figure 9b).
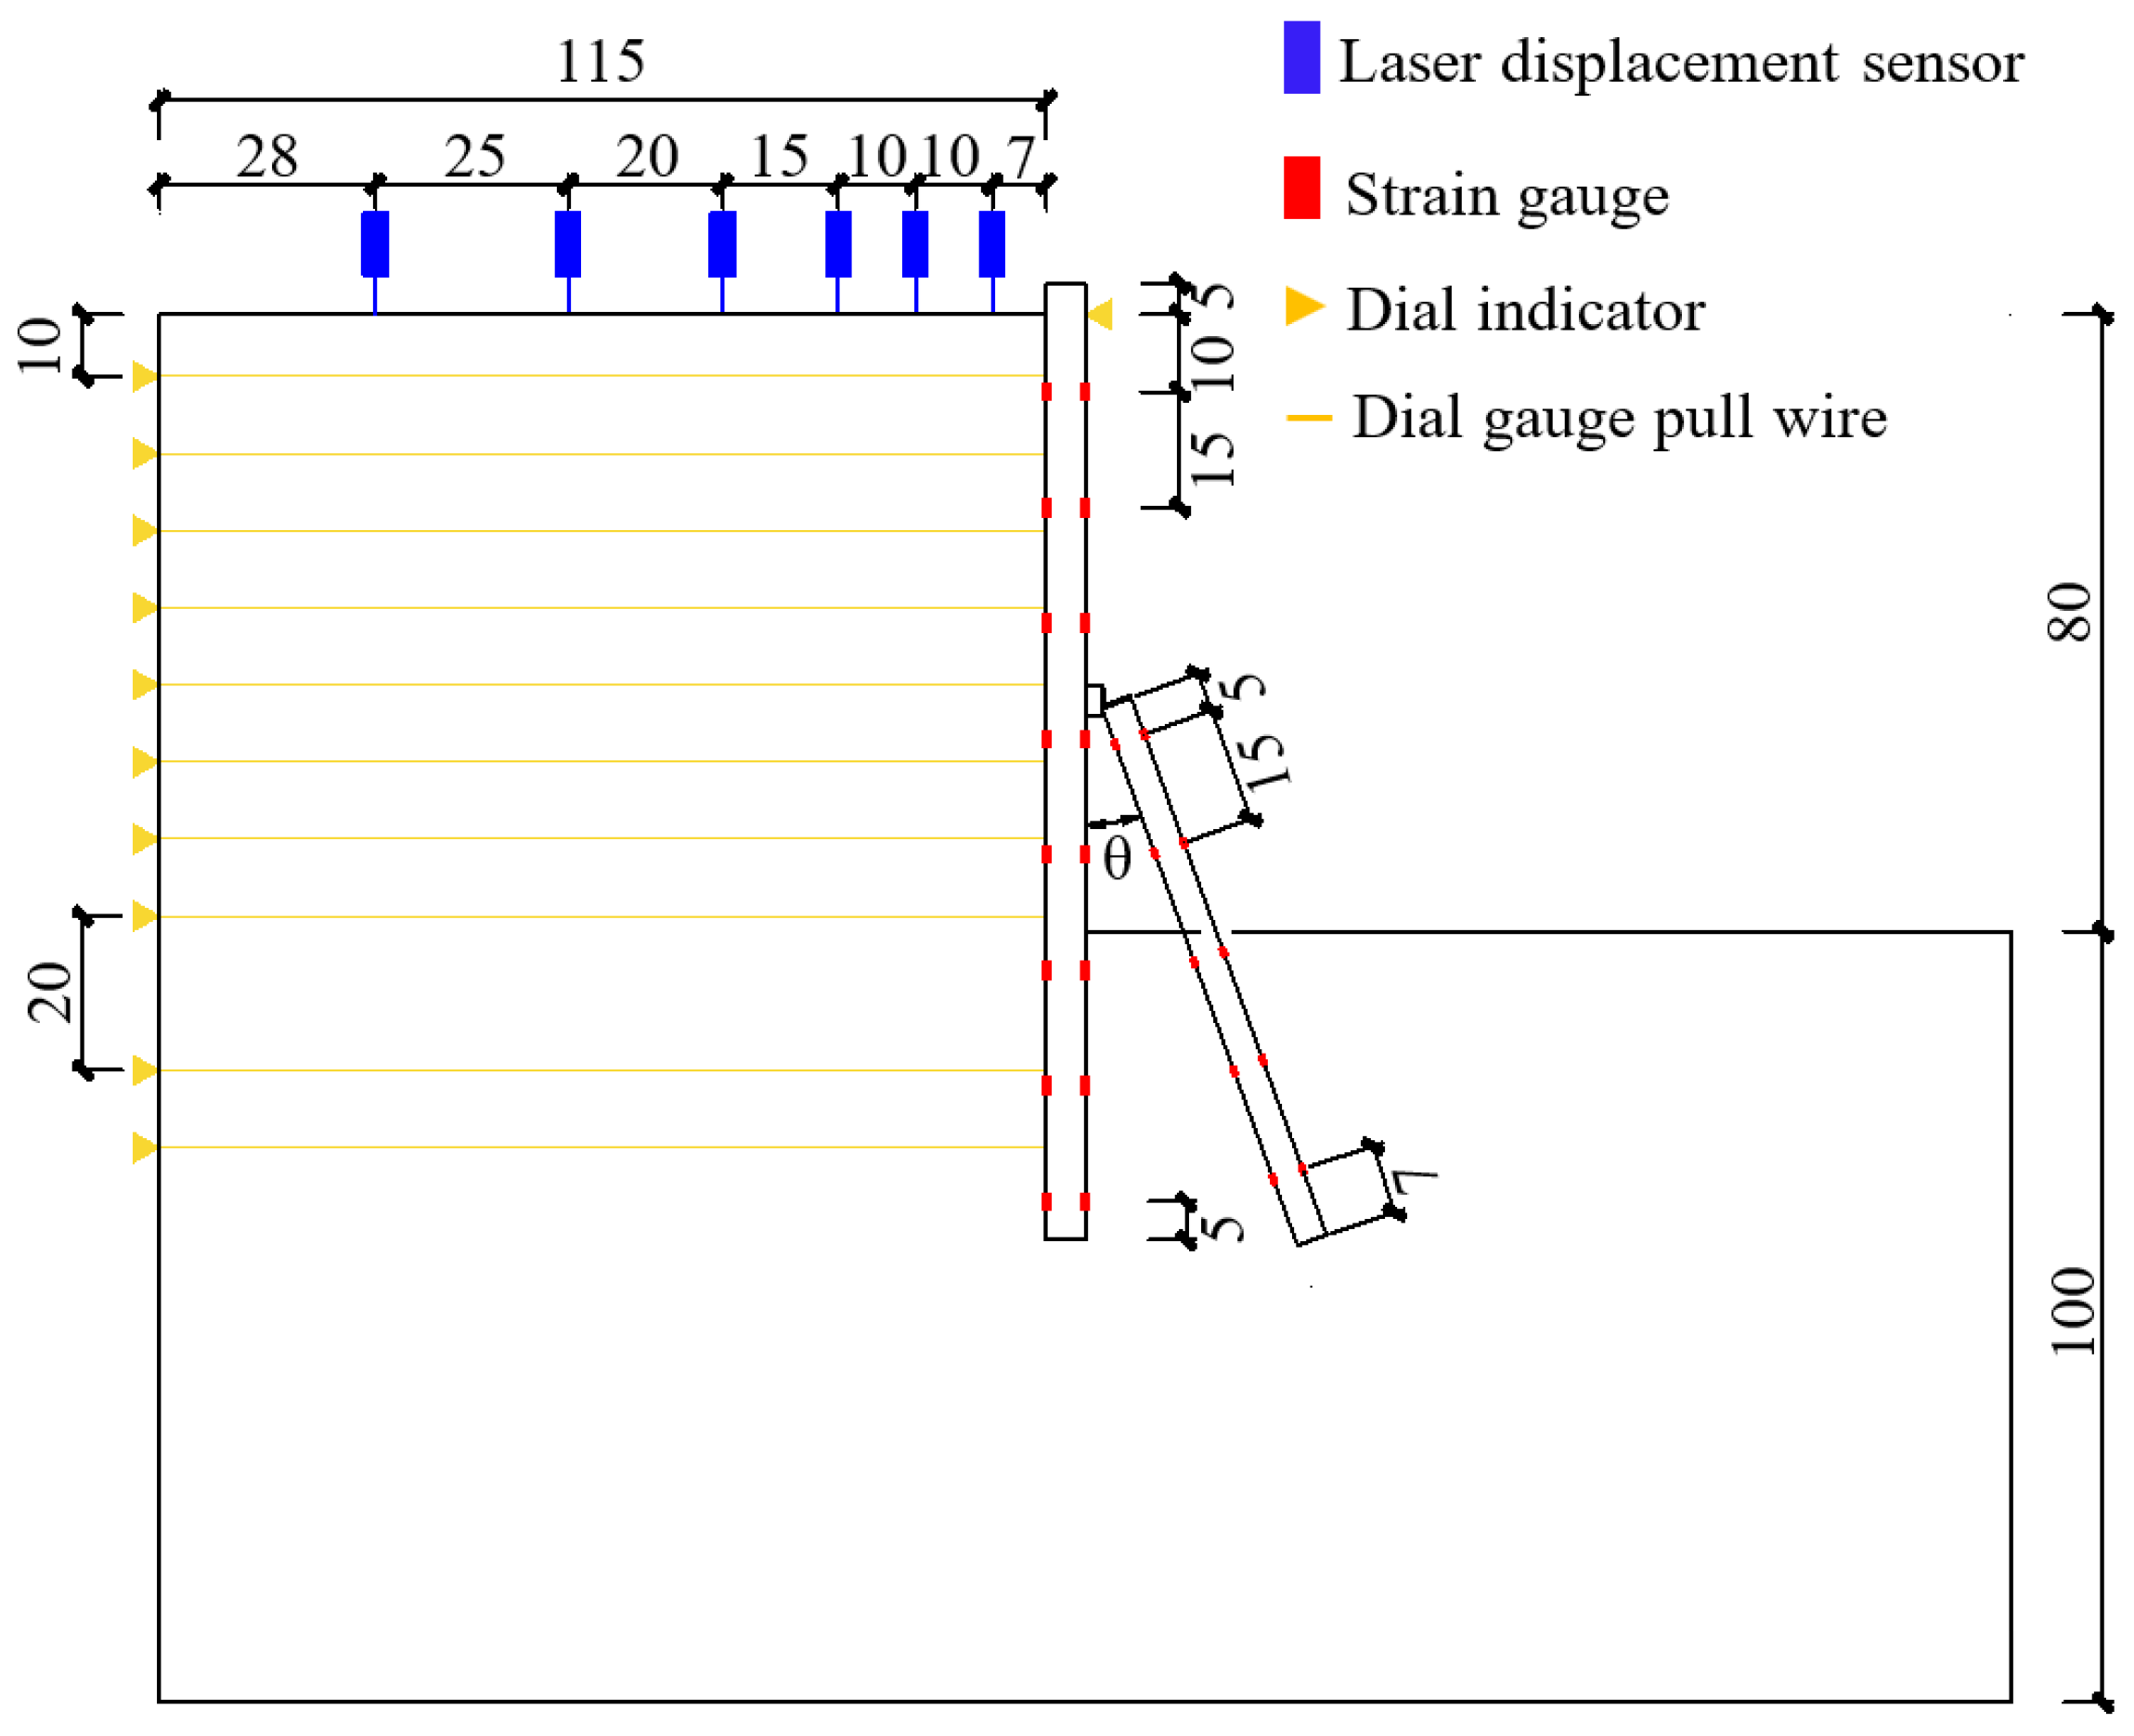
In groups R0–R5, Z6 is the monitoring vertical pile for horizontal displacement, and Z4, Z5, and Z7 are the monitoring vertical piles for strain. X4 to X6 are the monitoring inclined piles for strain in groups R1–R5. Laser displacement sensors are installed above the ground surface behind the vertical piles. Figure 10 shows the sensor layout of the test model.

2.3. Test Scheme

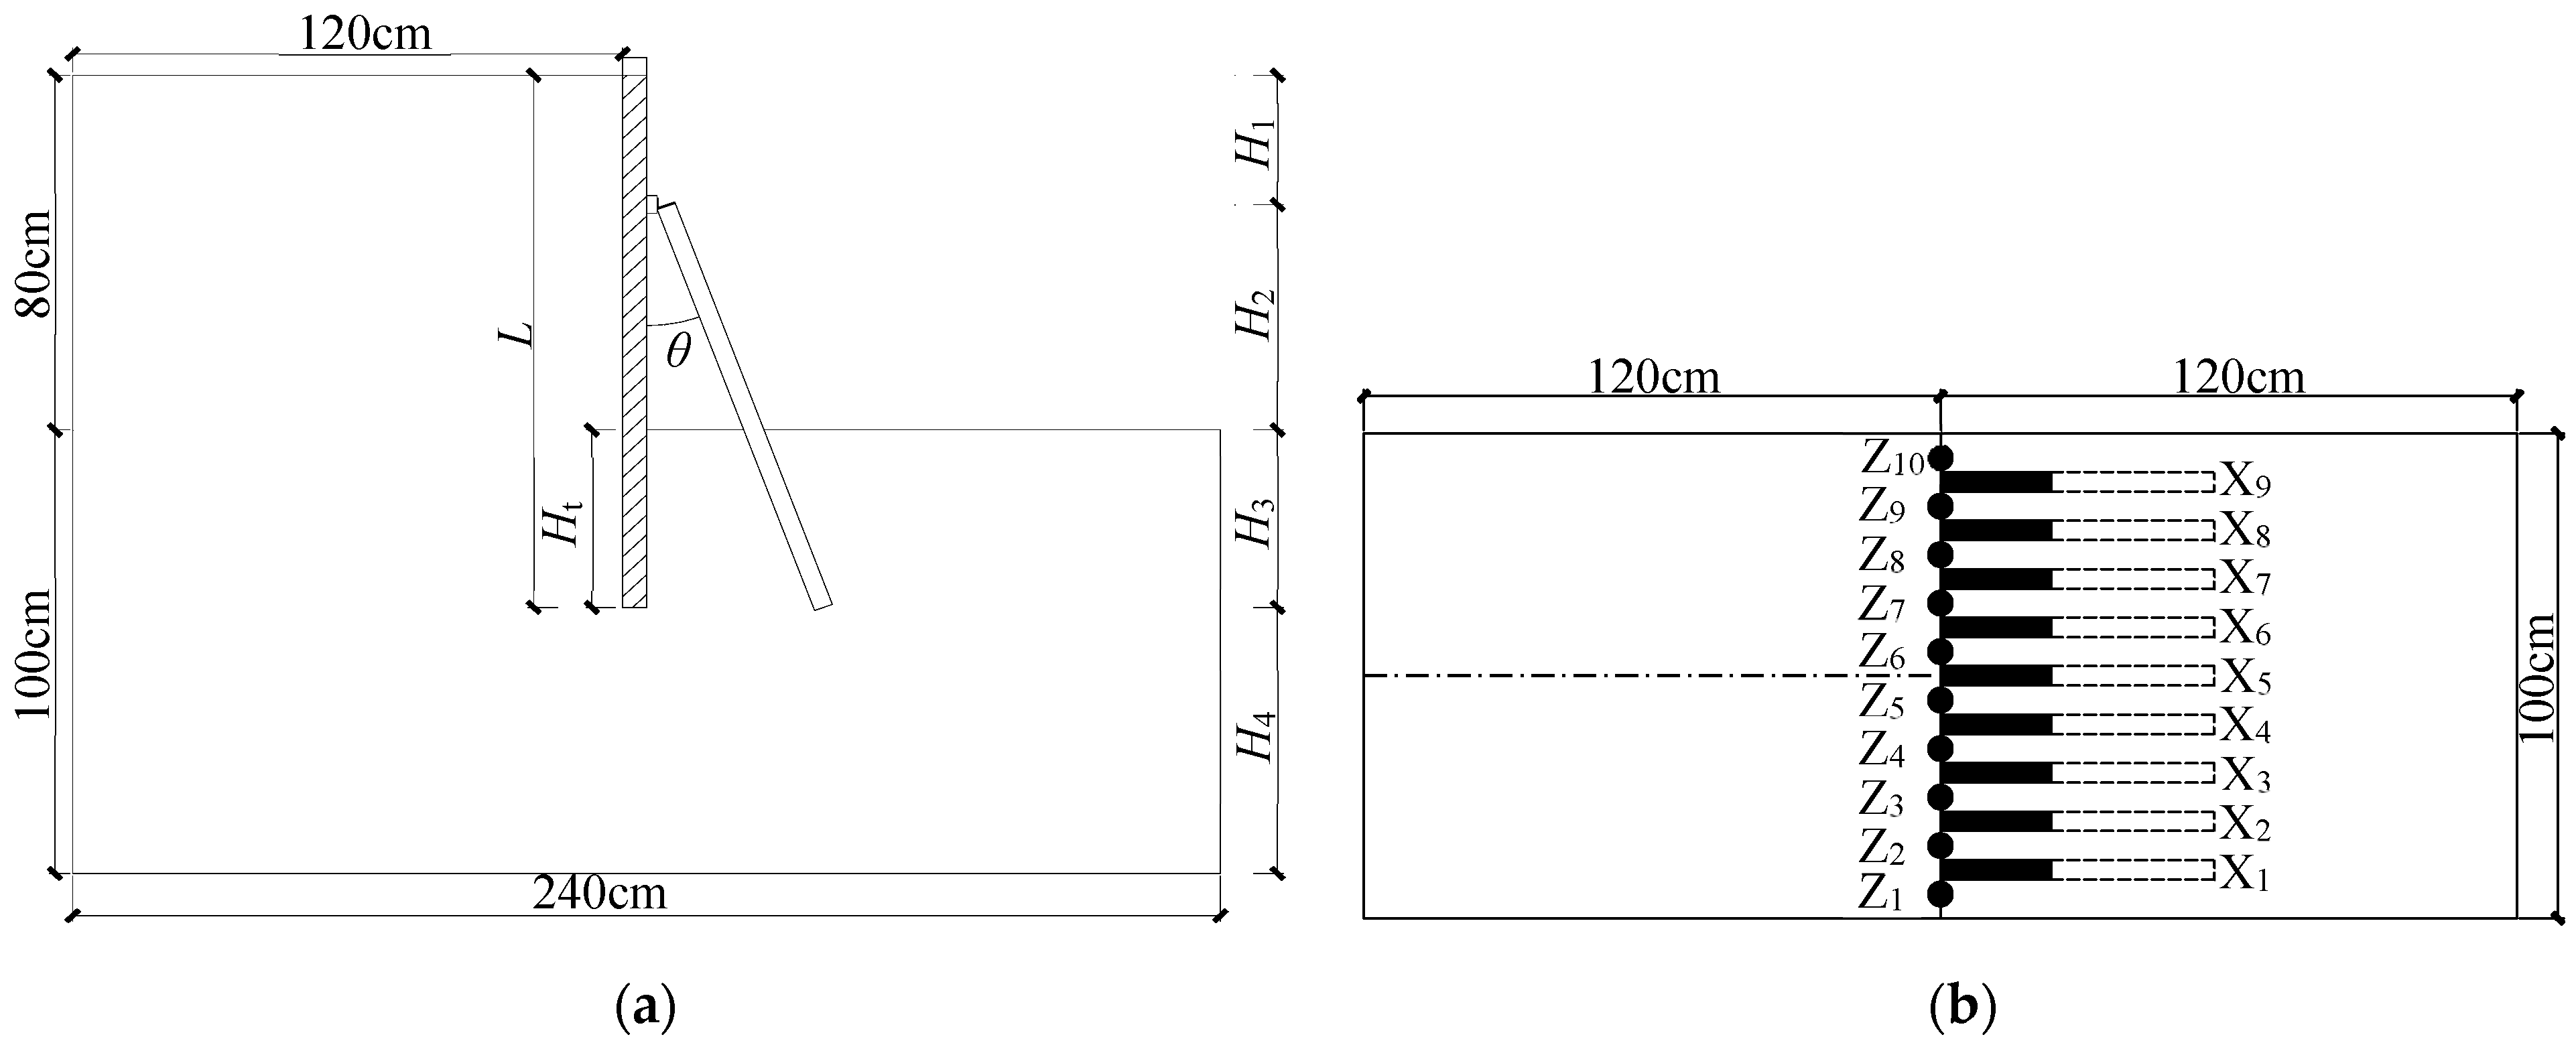
Different retaining structures, including a VIPW and soldier pile wall (SPW), were employed in the model tests. Figure 11 shows the layout diagram of the VIPW model. The arrangement of the SPW is the same as that of the vertical piles in the VIPW model. Table 5 lists the details of the experimental scheme. Excavation in group R0 is protected by an SPW, whereas groups R1–R5 use a VIPW. The center–center spacing of the vertical piles is 10 cm; i.e., twice their diameter. The inclined piles lie in between each pair of adjacent vertical piles with a center–center spacing of 10 cm (see Figure 11b).
The excavation process is divided into two stages. Firstly, sand is removed from ground level to the position of the wale (H1). There is no connection between the inclined pile and the wale, and no force is transferred between them in this stage. In the second stage, the inclined piles are linked to the wale, and the excavation is continued to the position of the foundation bottom (H2).

2.4. Test Procedures

2.4.1. Preparation of Model Piles

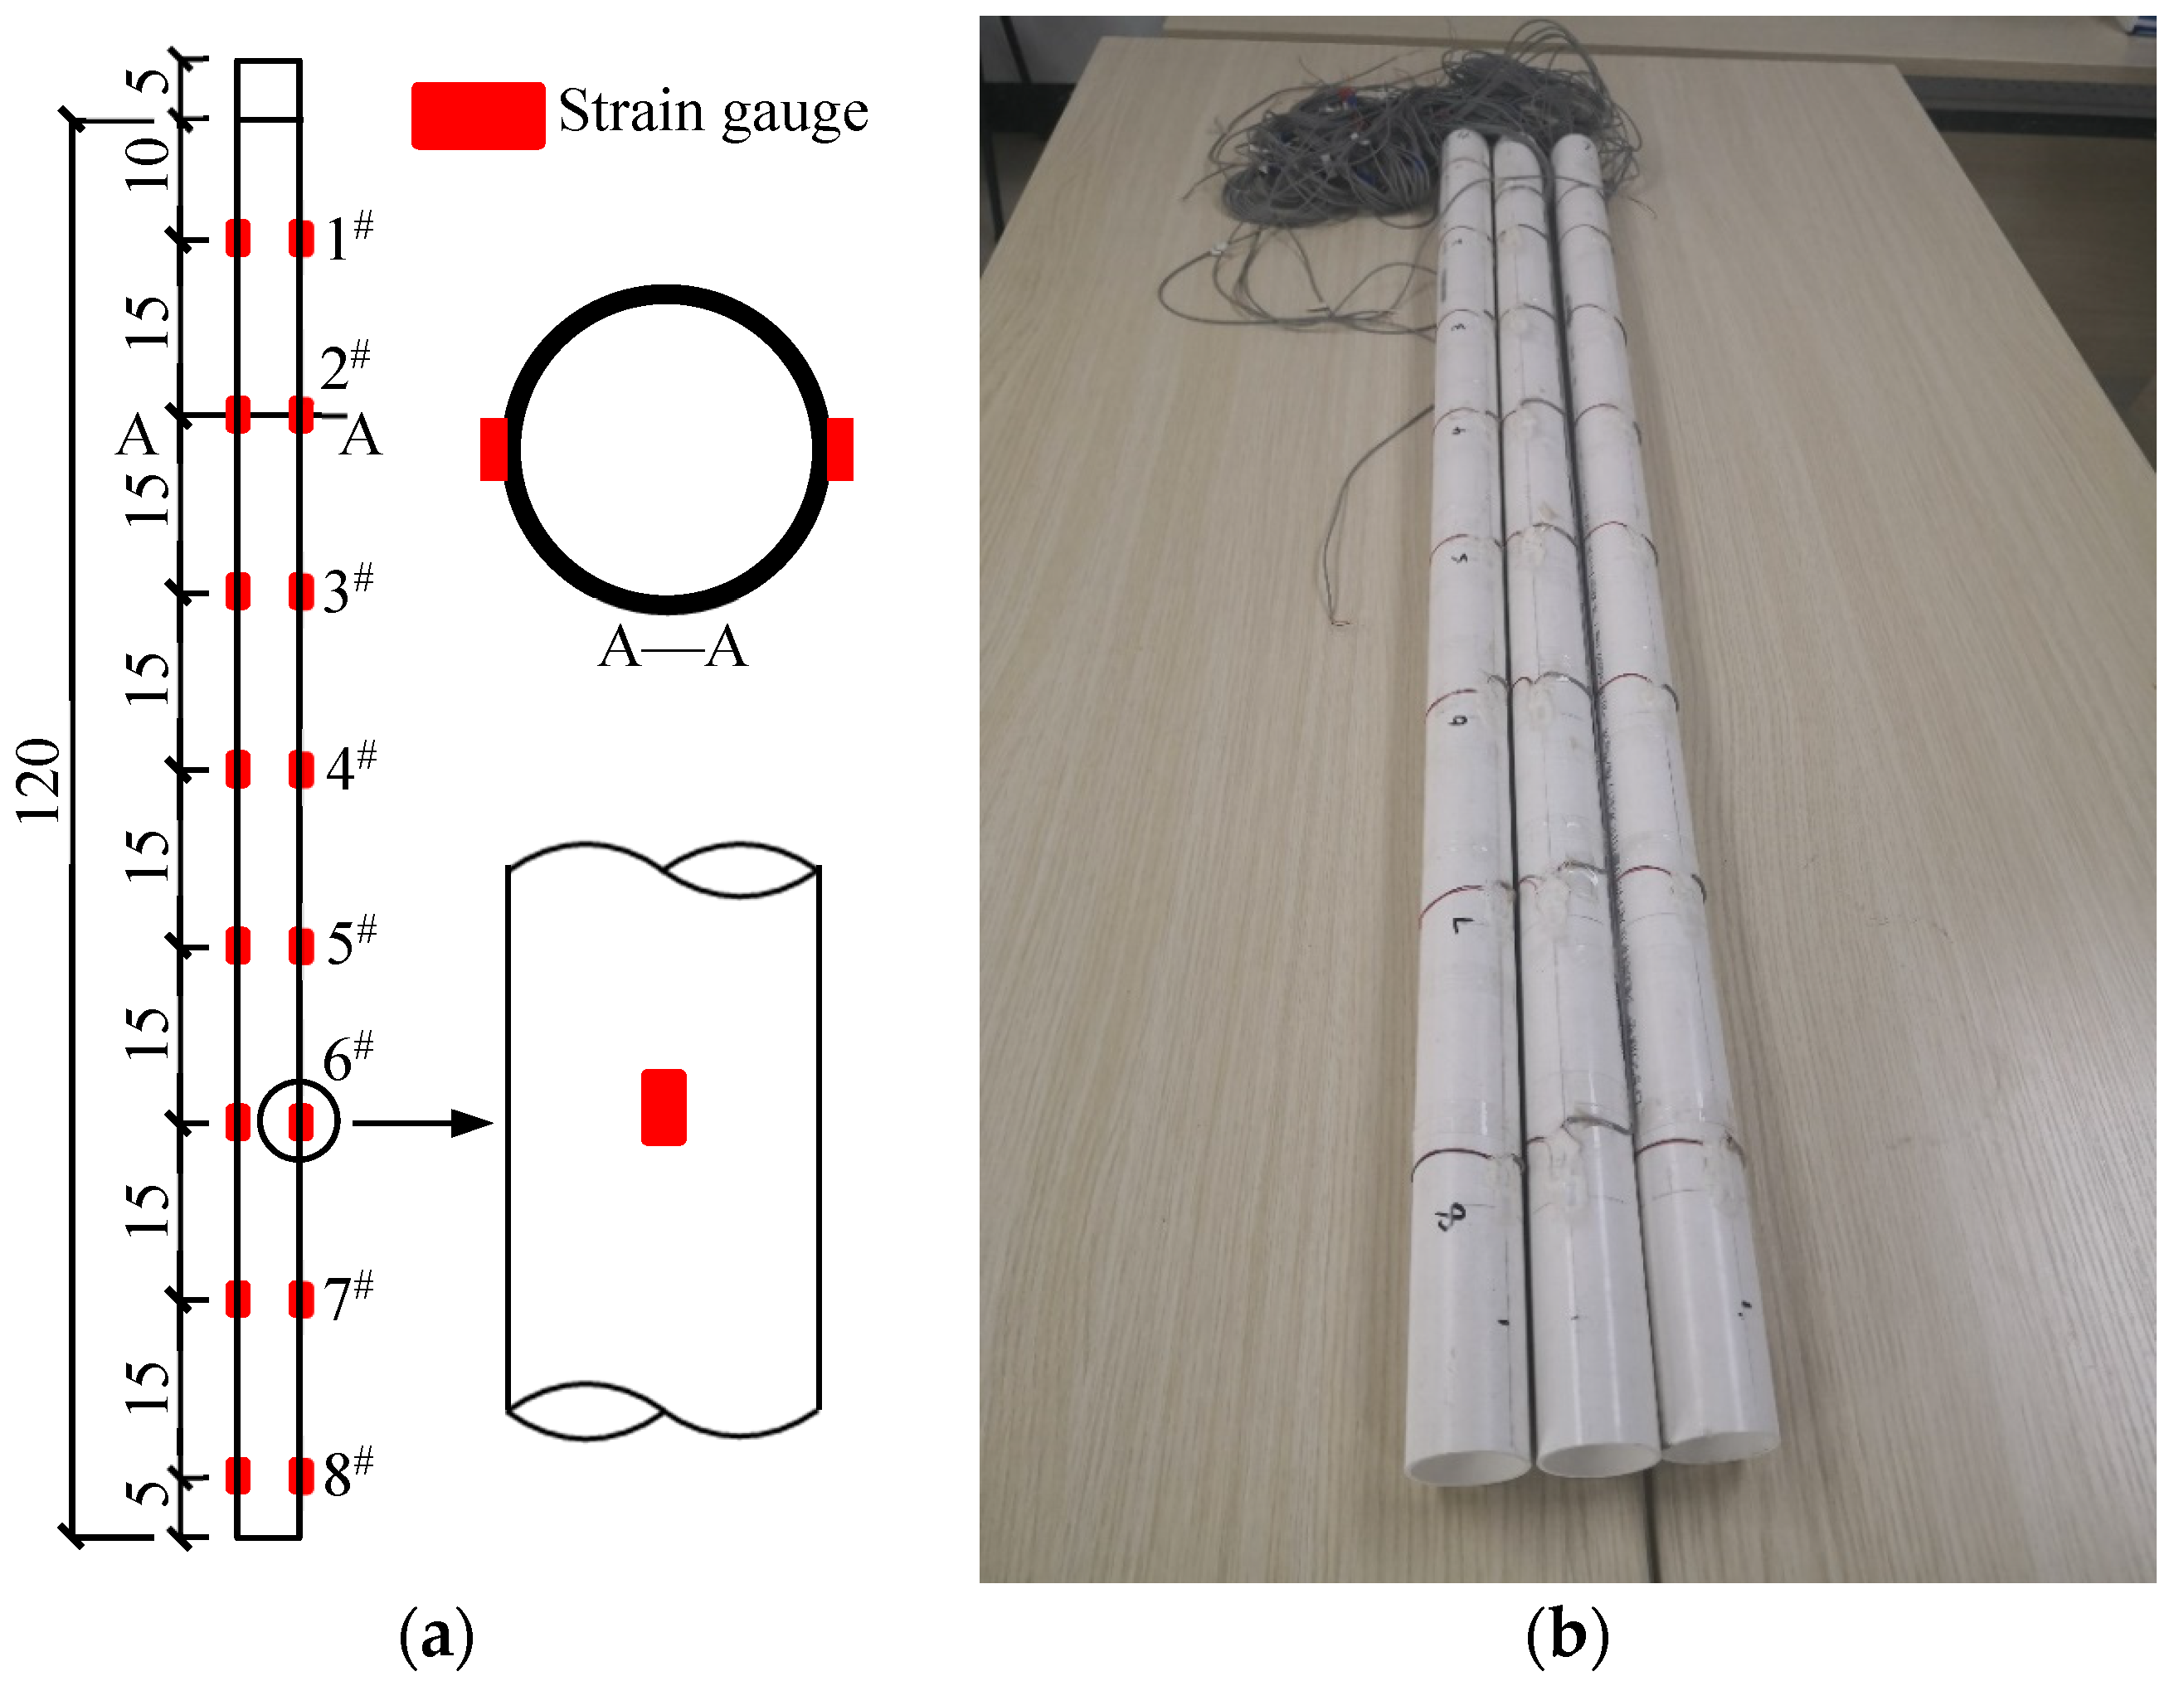
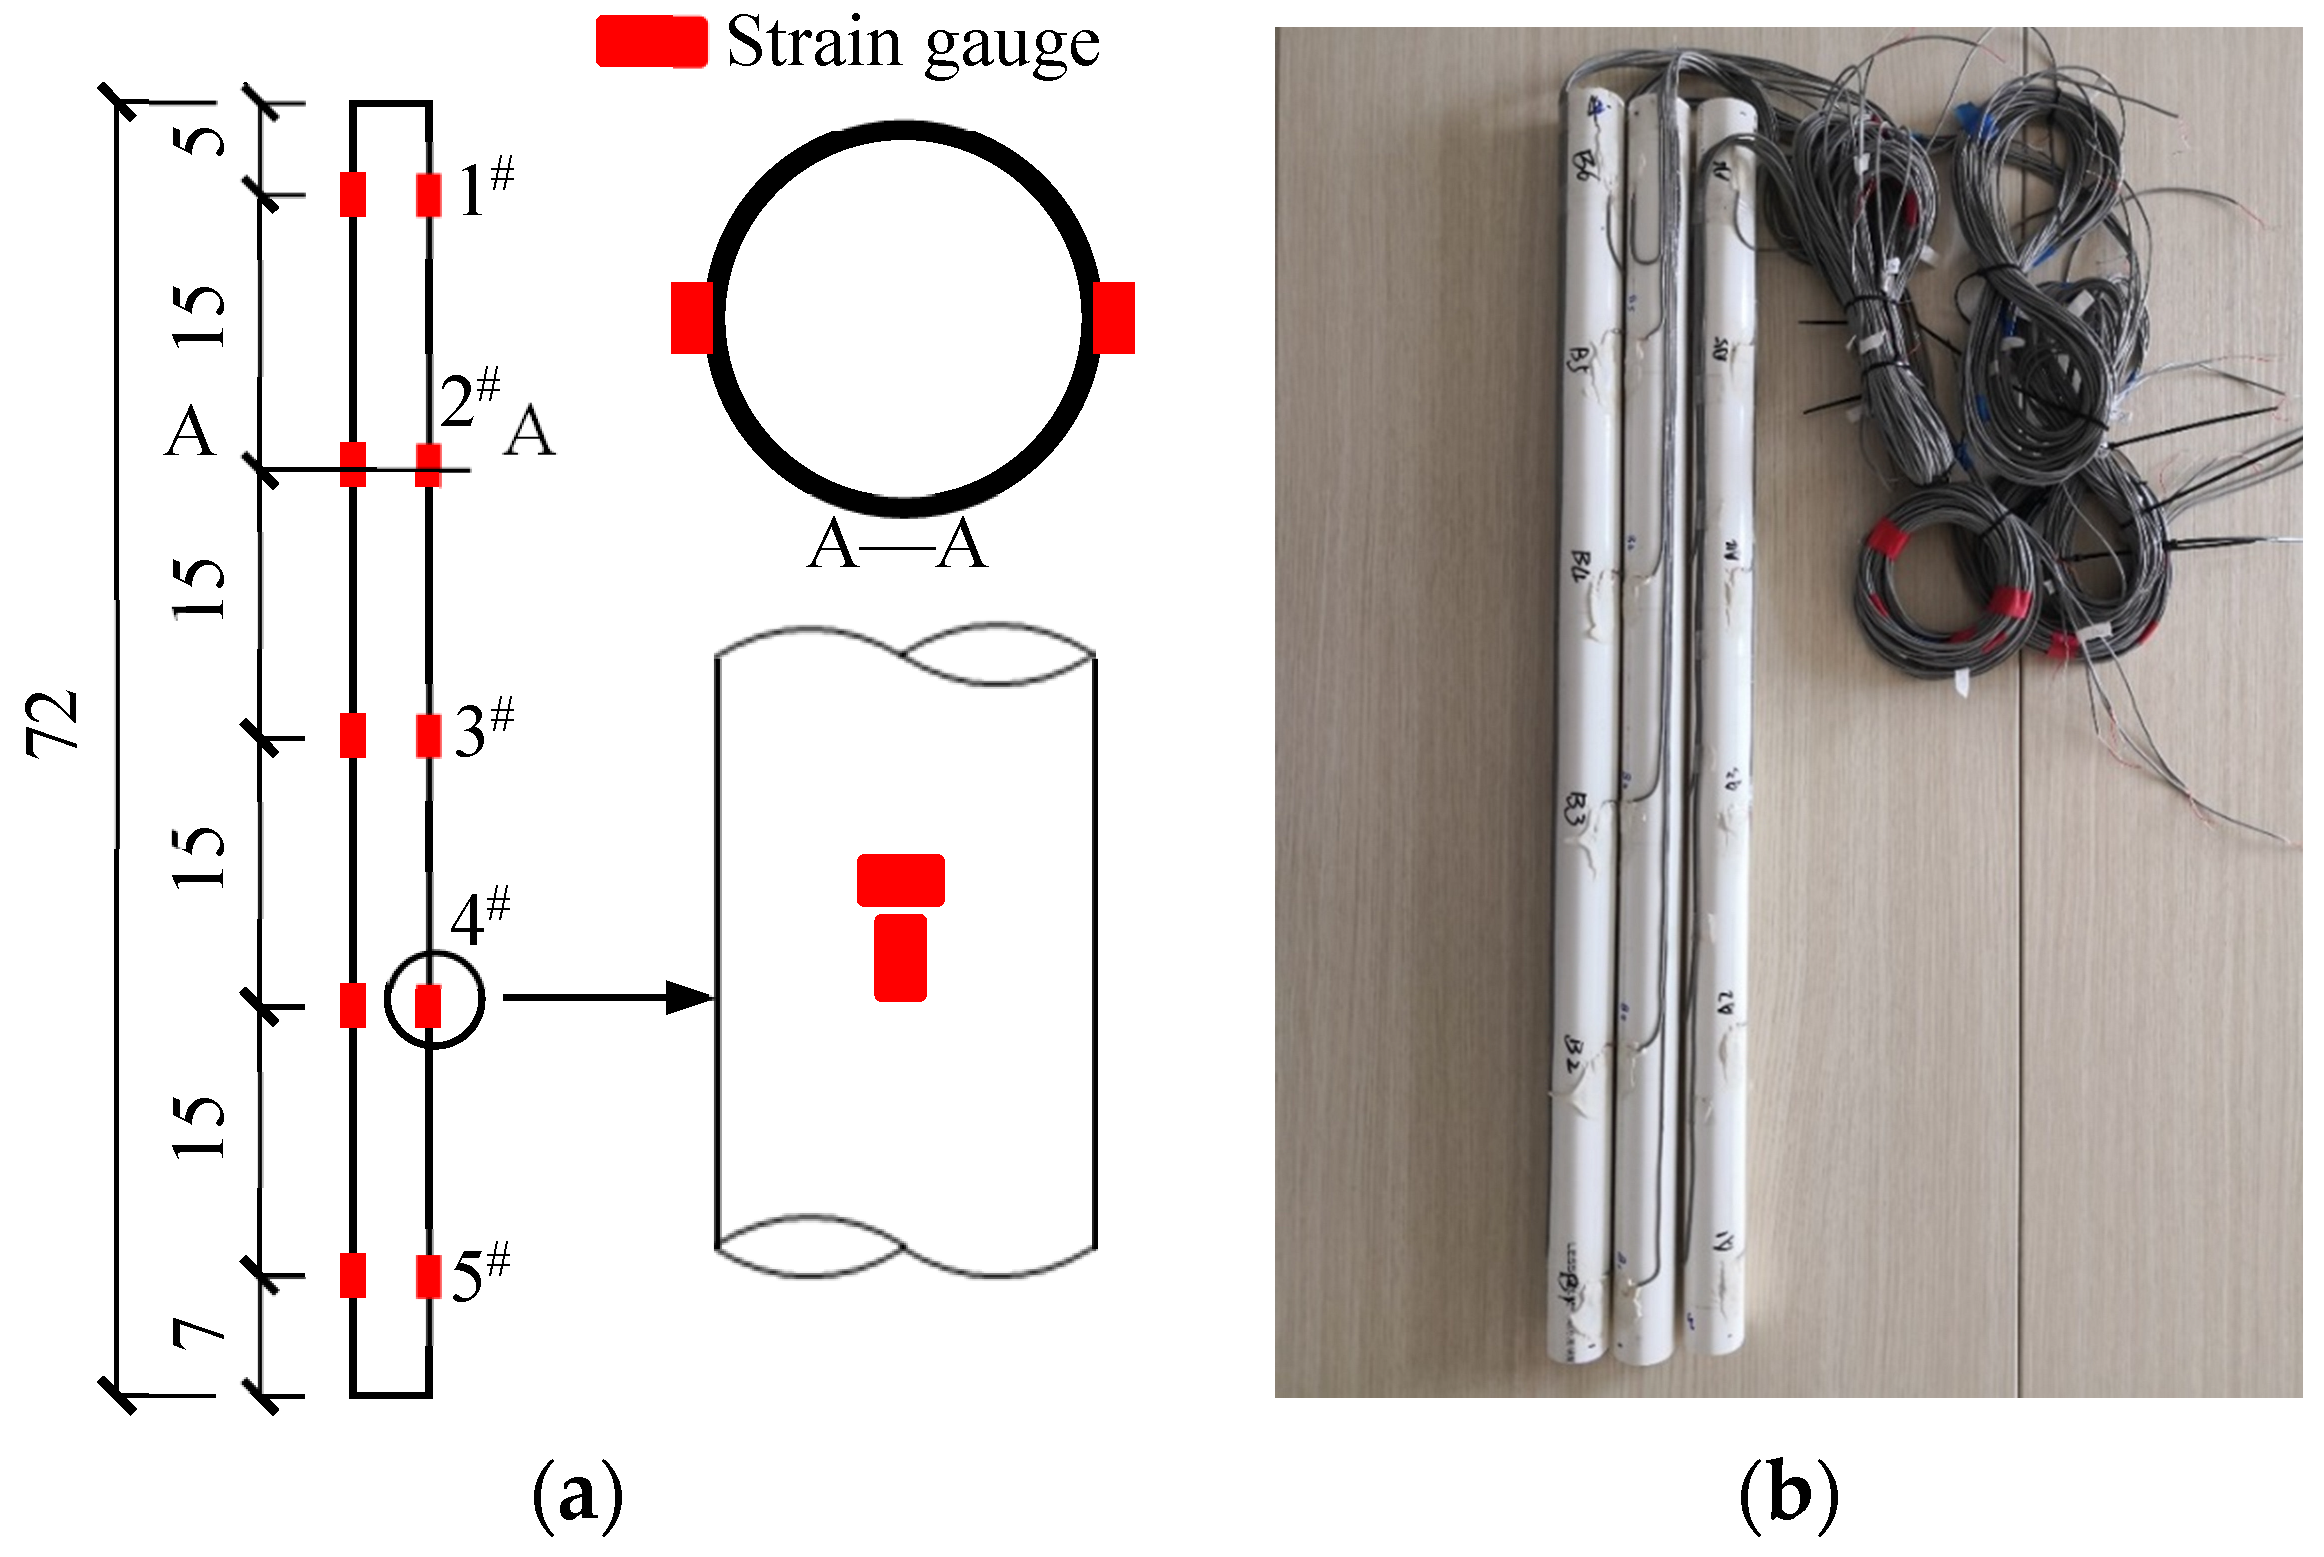
The model piles were manufactured according to Table 5. Figure 12 shows the strain gauge arrangement of the vertical pile model and Figure 13 shows the strain gauge arrangement of the inclined pile model. A half-bridge circuit was realized by a pair of strain gauges symmetrically pasted on both sides of the vertical model pile (Side A and Side B). Thus, the bending strain of the vertical model piles could be recorded through several pairs of strain gauges at a distance of 15 cm along the pile shaft, as shown in Figure 12a. The internal force distribution of the inclined pile is complicated, and its strain is affected by both axial forces and horizontal forces. Therefore, a pair of strain gauges were pasted perpendicularly to each other at each monitoring point to form a half-bridge circuit on one side of the inclined model pile, and several half-bridge circuits were symmetrically pasted on both sides (Side A and Side B) at a distance of 15 cm along the inclined pile shaft (X4 to X6), as shown in Figure 13a. As a result, the strain of each monitoring point before and behind the pile could be recorded during excavations. The surfaces of the strain gauges were coated with room temperature-vulcanized silicone rubber (Figure 12b and Figure 13b).
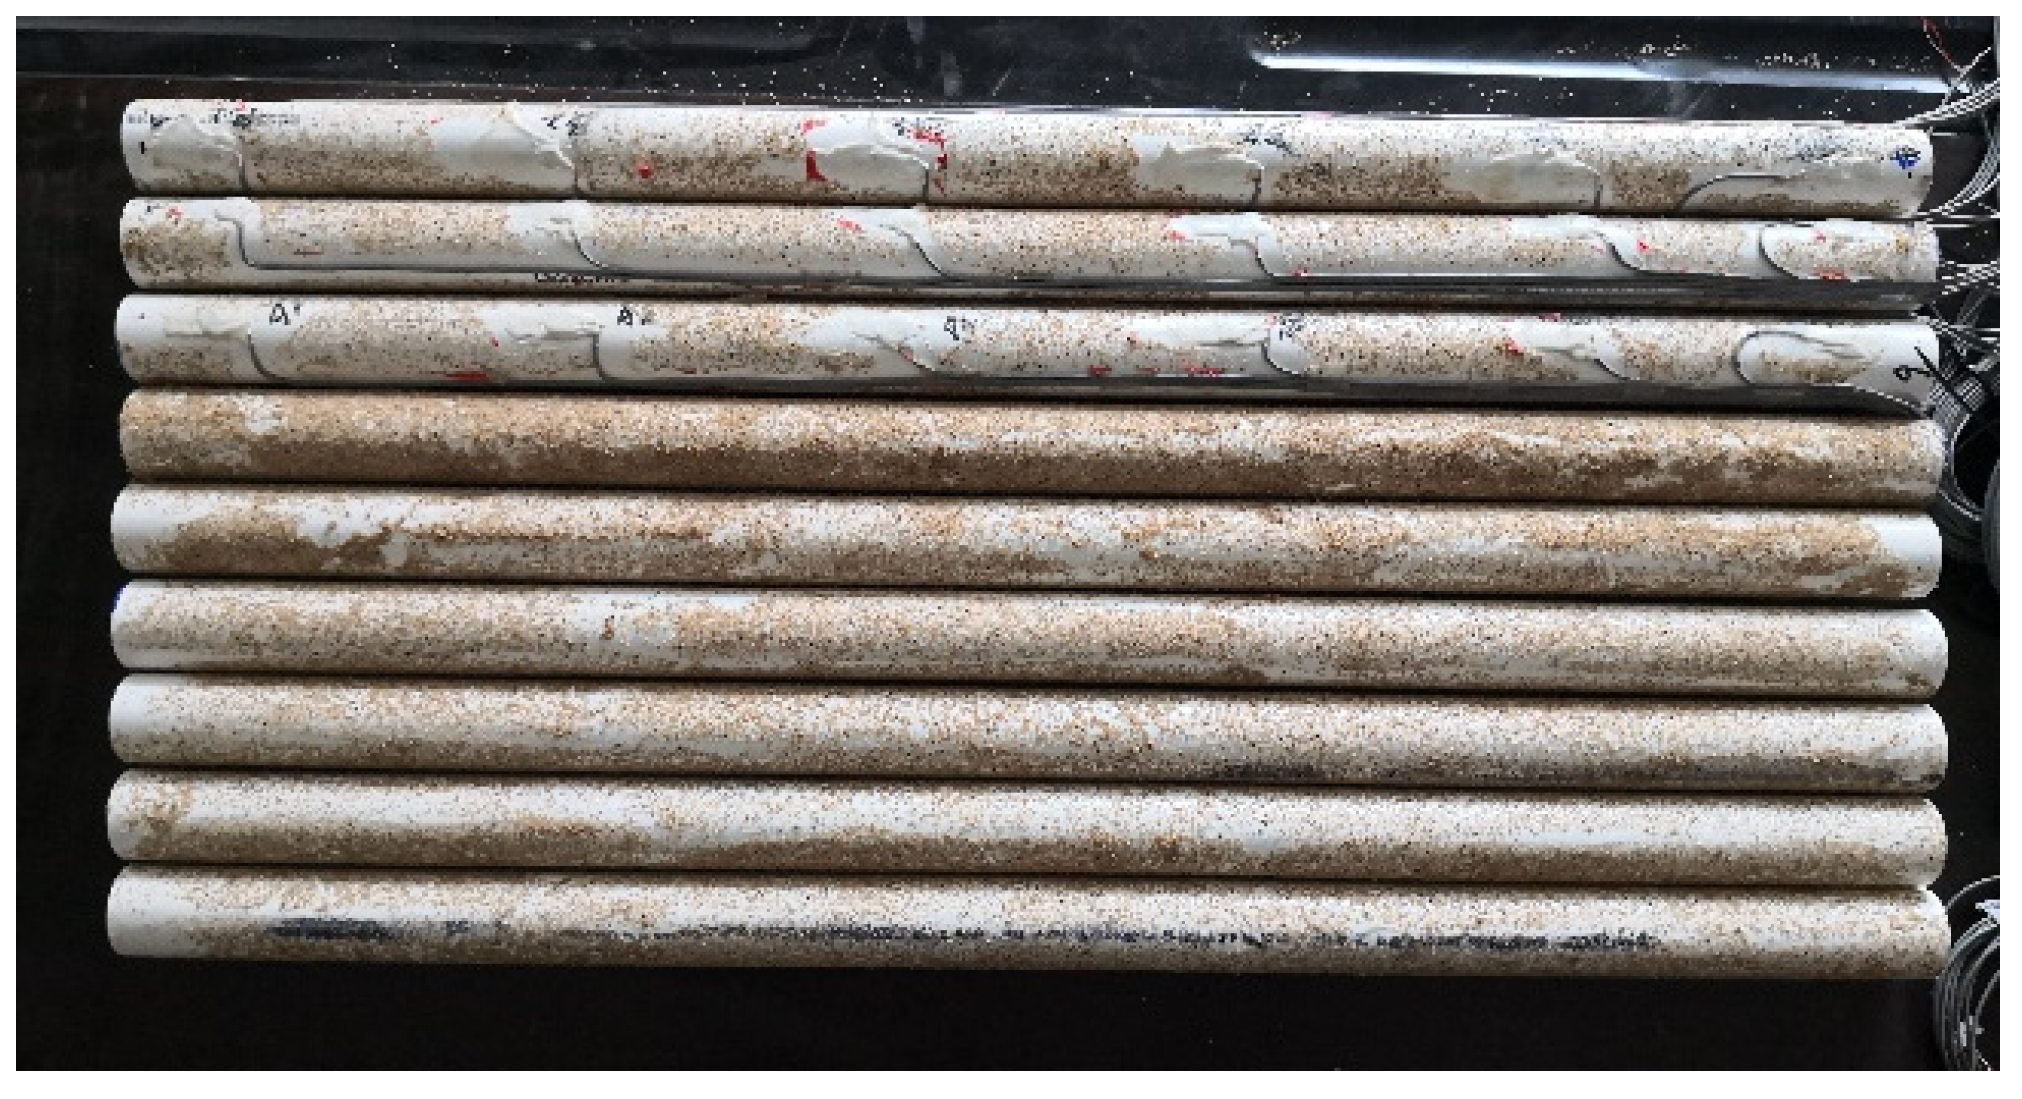
The surface of the PVC pipe is relatively smooth. In order to make the strength properties of the pile–soil interface in the tests realistic, fine sand was pasted on the surface of the inclined model piles, as shown in Figure 14.

2.4.2. Coefficient Calibrating Testing for Strain Gauges on Monitoring Pile

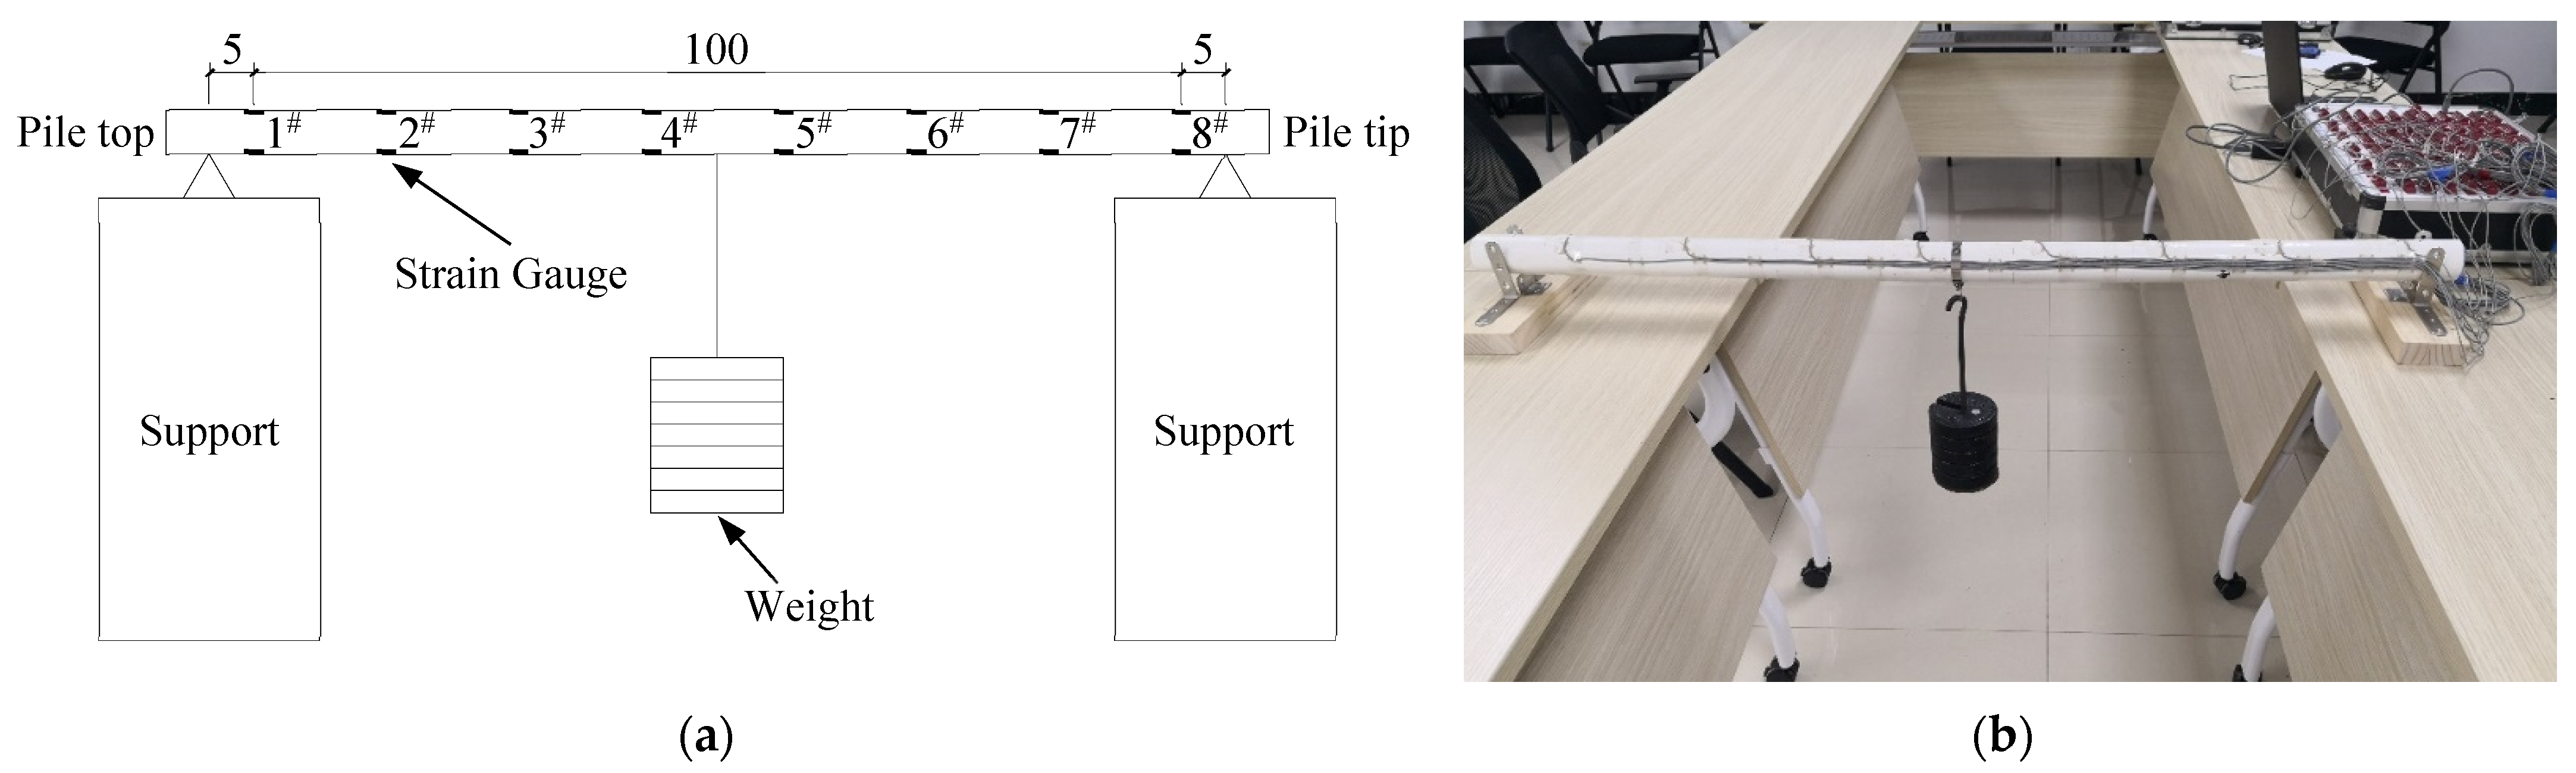
The uncertainty factors, such as the accuracy error of the strain gauge itself and the non-standardization of the pasting process, lead to the differences between the measured and real values. Thus, the strain gauges were calibrated to obtain their sensitivity coefficient through the simply supported beam loading test. Figure 15 shows the calibration coefficient testing of the vertical piles from groups R1–R5. Loads were applied on the middle of the model beam in 7 stages. A force of 4.5 N was loaded at the first stage and 10 N was loaded each time at the remaining stages. The bending moment (M) of each monitoring point was calculated according to the loading weights. According to the theory of material mechanics, M and εmax are linearly elastic. The relationship between M and εmax was fitted using the least squares method. The relationships between M and εmax of the Z4 (vertical model pile) and X5 (inclined model pile) model piles in group R5 are given as examples in Table 6 and Table 7.
The results show that the correlation coefficient between M and εmax for the vertical piles fluctuates between 0.0122 and 0.0138, while that for the inclined piles fluctuates between 0.0062 and 0.0069. The coefficient of determination (R2) equals 1 in all cases, indicating a strong linear relationship between M and εmax. The model piles in the calibration test are in the elastic deformation stage. The maximum load on the VIPW structure in the excavation model test is lower than that on the model piles in the calibration test, indicating that the VIPW structure in the excavation model test also remains in the elastic deformation stage.

2.4.3. Foundation Soil Preparation and Pile Model Installation

Static testing was carried out to determine the pore ratio of each soil layer. Soil sample was preloaded in the tests, as shown in Figure 16. The loading weight was equal to the stress at the center of each layer in the excavation model. The results show that the pore ratio of different soil layers after preloading ranged from 0.775 to 0.787, and the density ranged from 1.49 to 1.50 g/cm3. Thus, it is assumed that the soil in the model was homogeneous, and its density was taken as 1.495 g/cm3.
Sand was poured into the model box in layers using a quality control method. The “zero distance” compaction method was used in order to avoid an uneven distribution of the sand compactness; that is, a tamper was used to fine-tune the sand surface to a defined height to ensure the corresponding porosity and soil layer surface smoothness of each soil layer. The height of each soil layer was 10 cm. The length of the model box was 2.4 m, and its width was 1.0 m. The mass of each layer of soil was 359 kg. The foundation soil stood for 24 h after filling to ensure that it was compacted and stable under self-weight.
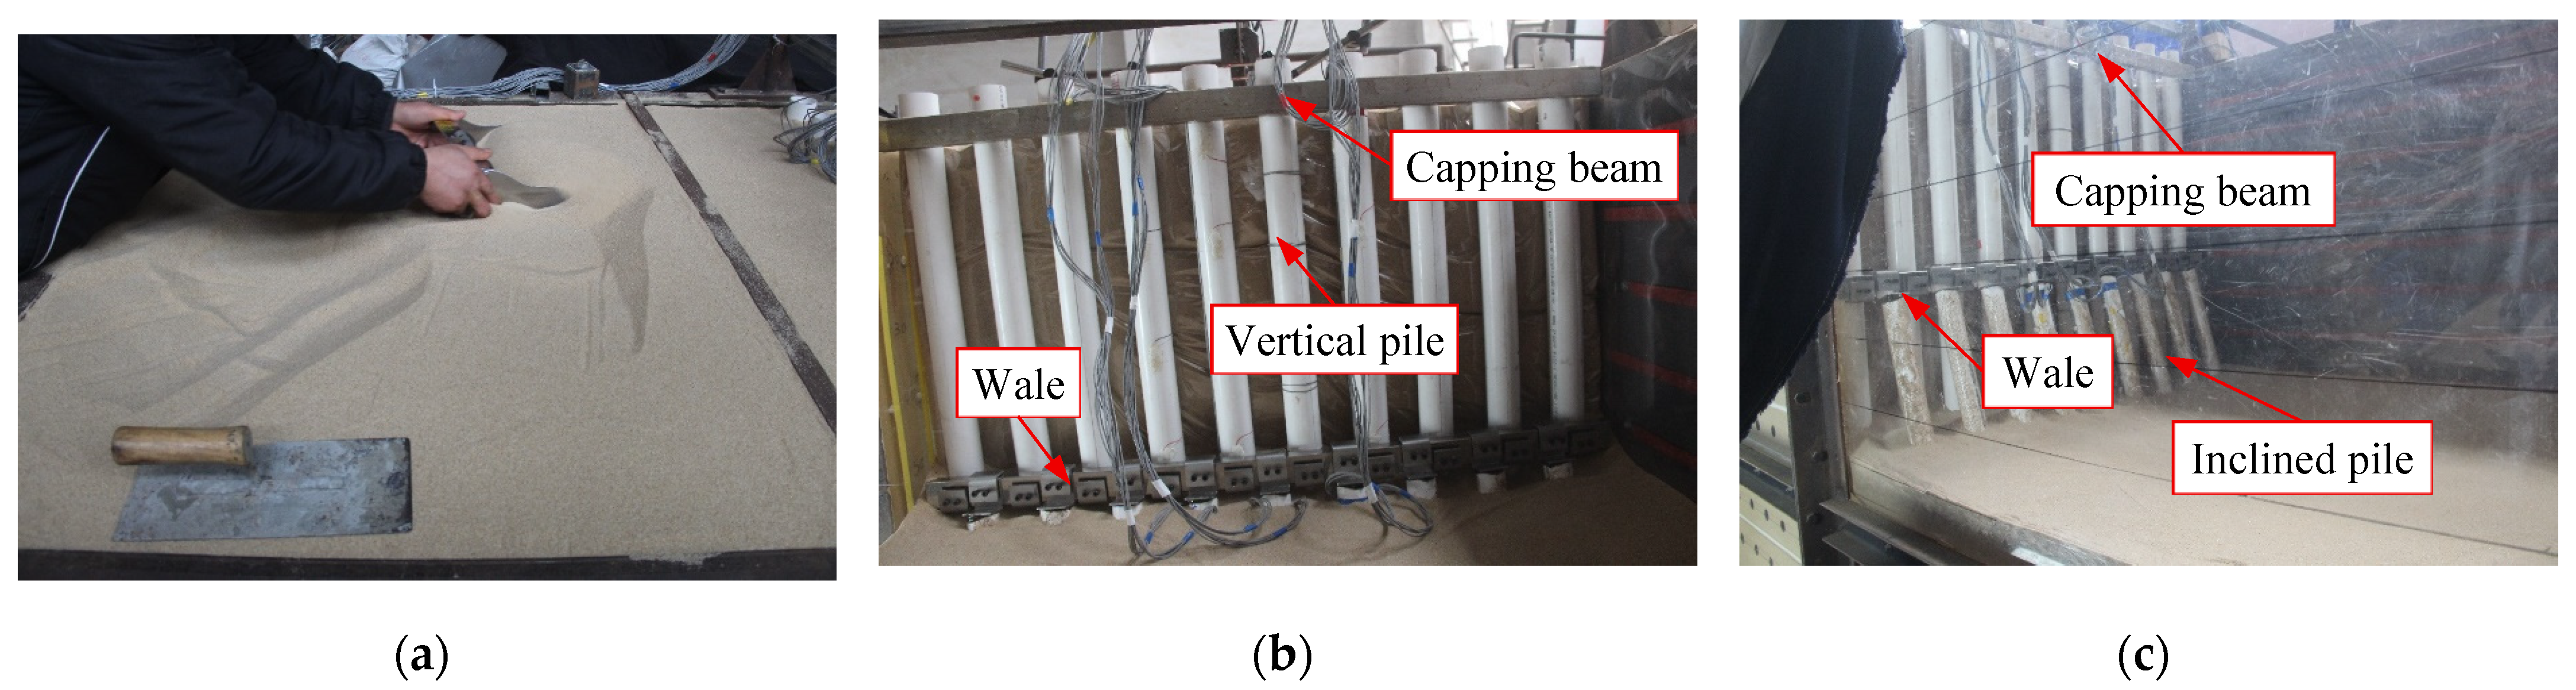
The VIPW model was installed after filling to a depth of 60 cm of soil (50.4 cm for R4). The actual length of the vertical model piles used in the tests was 5 cm greater than the effective pile length (L) listed in Table 5. The extra 5 cm length was above the ground surface for the convenience of installing the dial indicator on the pile top to monitor the horizontal displacement. The capping beam was installed 5 cm below the top of the vertical piles. The wale was installed on the vertical piles at a distance of H1 below the ground surface. In this process, there was no contact and load transformation between the vertical piles and inclined piles. Figure 17 shows photos of the test model. Figure 17a shows the VIPW model installation in group R1. Figure 17b is the side view of the model box after filling it with sand.

2.4.4. Displacement Sensor Installation and Instrumentation Debugging

After finishing filling the foundation soil, 6 laser displacement sensors were installed above the center line of the ground surface, and dial indicators were installed on the side and top of the model box to monitor the horizontal displacement of the vertical pile (Figure 10). Figure 18 shows photos of the model after sensor installation.

2.4.5. Excavation Process

Sand was removed from the model box in eight stages. Figure 19 shows the process of excavation. Sand of 10 cm thickness was removed at each stage (see Figure 19a). Sand was removed to a depth of H1, where the wale was installed, followed by installing the connector to link the inclined piles with the vertical piles (see Figure 19b). After that, excavation was continued until the bottom was reached (see Figure 19c).

3. Analysis of Test Results

3.1. Deformation of Vertical Piles

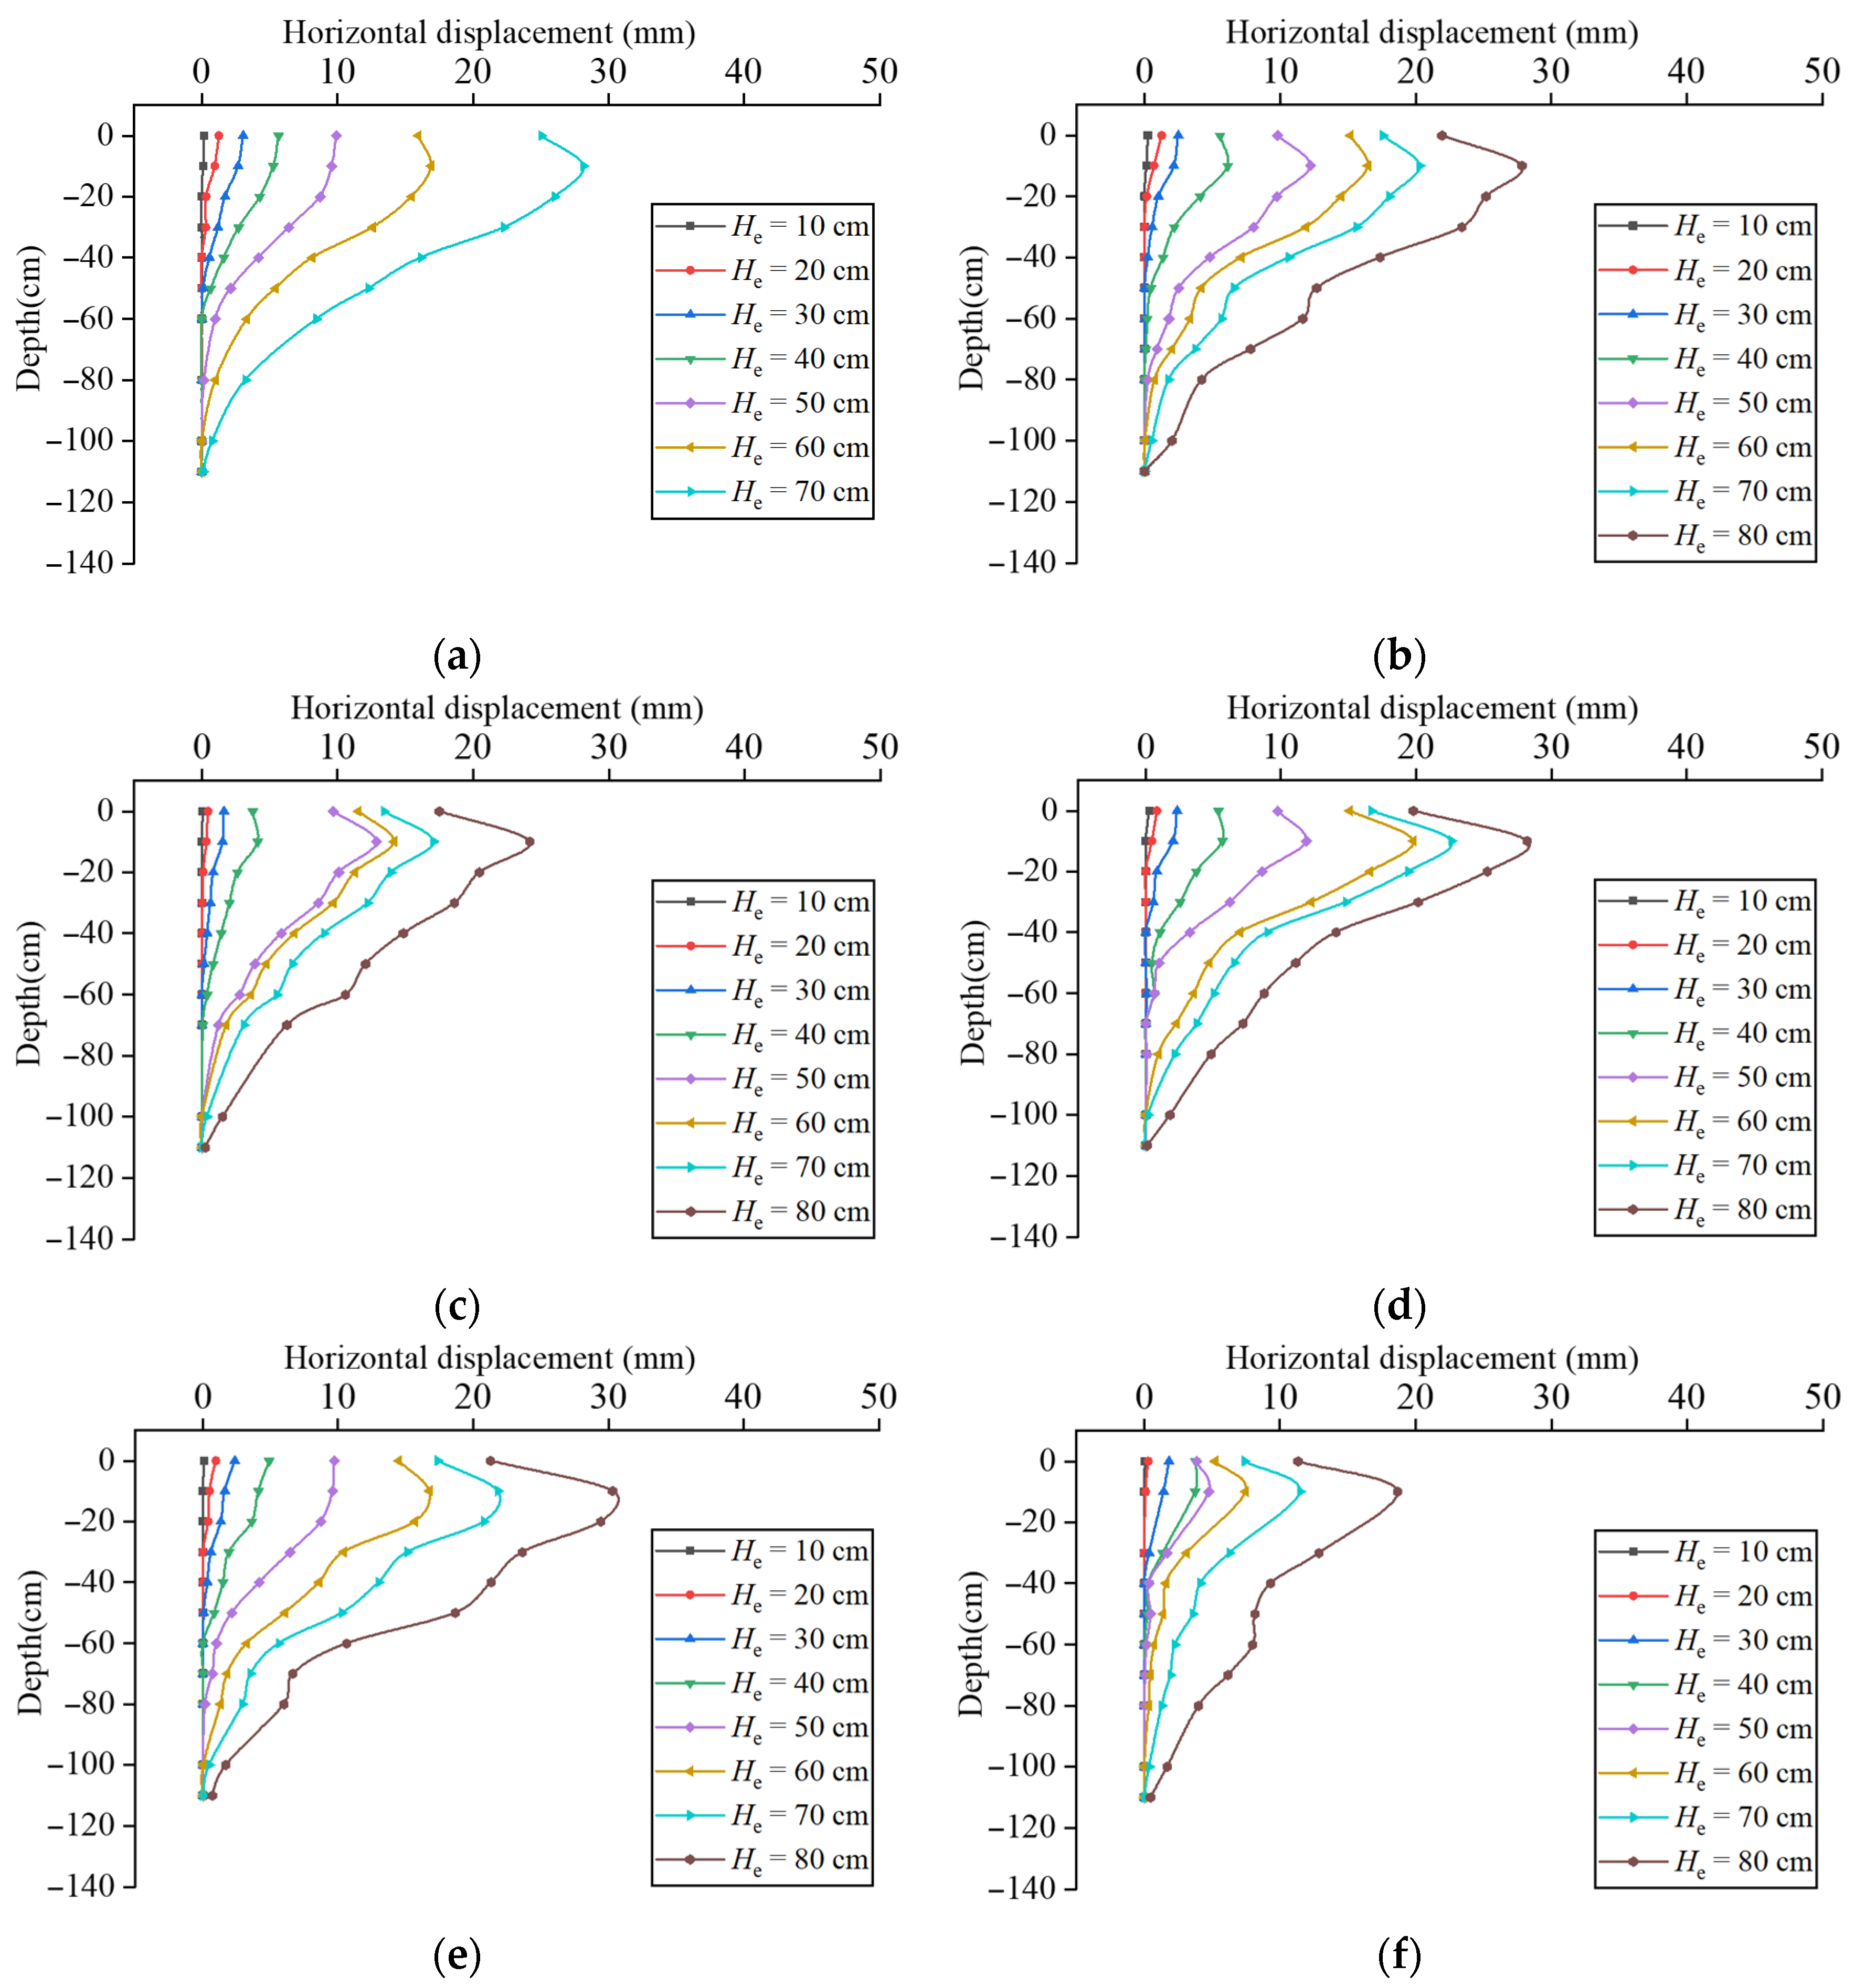
Figure 20 presents the horizontal displacement distribution of the vertical piles for different excavation depths (He) in groups R0–R5. Collapse happened when the excavation depth was 80 cm in group R0, and the final displacements of the vertical piles exceeded the measuring range of the dial indicators on the side of the model box. Thus, the deflection was not recorded, as shown in Figure 20a.
It can be seen from Figure 20 that the deformation of the vertical piles in groups R0–R5 gradually increased during excavation, even though the excavations had different retaining structures. In the early stage of excavation, the maximum deformation developed at the pile top and the deformation showed a triangular distribution in group R0 (see Figure 20a). When the excavation depth exceeded 50 cm in group R0, the displacement at the pile top was not the maximum; instead, an obvious “bulging” phenomenon was observed at the measuring point at −10 cm. The main reason for this phenomenon was that, at this stage, the settlement deformation of the soil outside the pit was relatively large. The lead wires connecting the dial gauges to the pile model at each measuring point experienced a downward displacement component due to the settlement deformation of the soil (see Figure 10 for the wiring method), resulting in an overestimation of the measured values. This phenomenon also exists in the measured horizontal displacement values of the vertical piles in groups R1 to R5 described below. However, the test results indicate that this phenomenon does not affect the overall distribution characteristics of the horizontal displacement of the vertical piles.
The lateral deformation presents two stages during excavations in groups R1–R5 (see Figure 20b–f): (i) when the sand was removed from ground level to H1 (where the wale is installed), the lateral deformation distribution exhibited a triangular pattern, similar to that of the cantilever retaining structure-protected excavation in group R0; (ii) when the sand was removed from H1 to the excavation bottom (ranging from −50 cm to −80 cm in groups R1–R4 and from −40 cm to −80 cm in group R5), the deflection of the vertical piles at the position 10 cm below the wale tended to show a local convexity toward the pit. The lateral deformation thus showed a combination of triangular and parabolic distributions.
Comparing Figure 20a with Figure 20b–f, it is clear that the lateral deformation in group R0 is larger than that in groups R1–R5, during removal of sand from −50 cm to −80 cm. Moreover, in groups R1–R5, the lateral deformation at the measuring points of the vertical piles is not smoothly distributed: at the elevation of the wale, the lateral deformation distribution shows a turning point toward a decreasing trend.
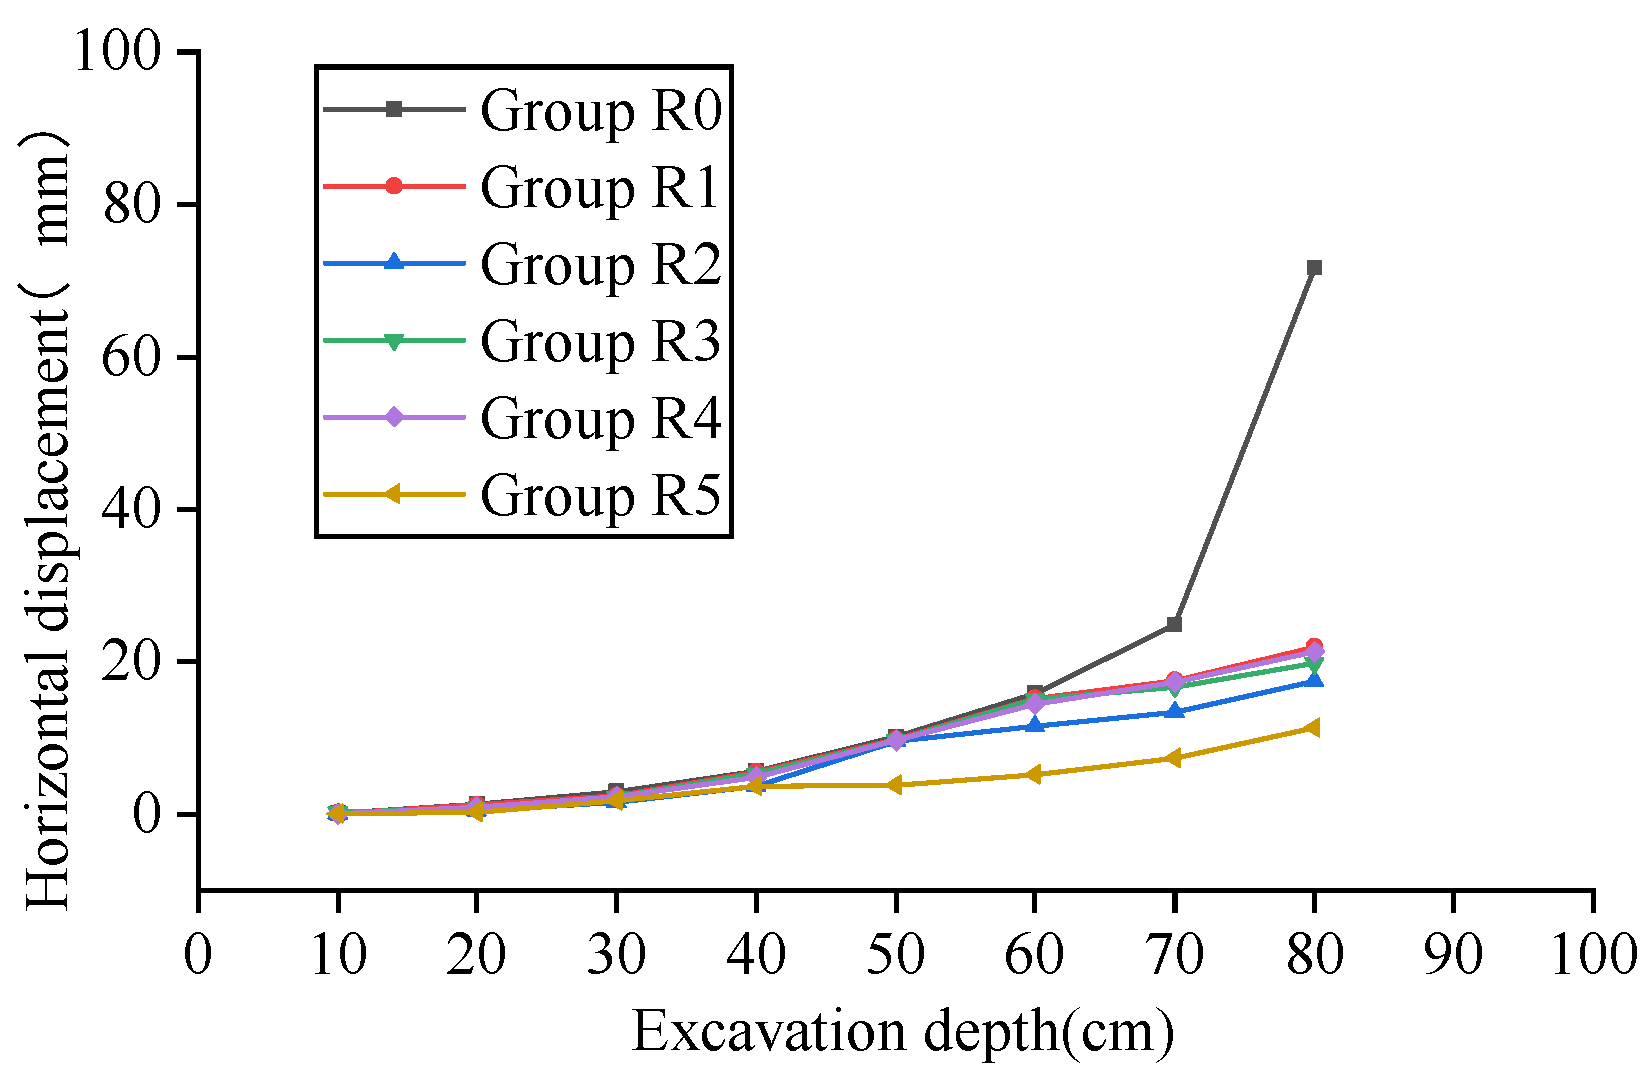
Figure 21 presents horizontal displacements at the top of vertical piles for different groups. The results depicted in Figure 21 indicate that the lateral deformation at the vertical pile head increased during the excavation process in group R0. The lateral deformation increased significantly, with an increase of 46.9 mm during the excavation of the −70 cm to −80 cm soil layer, accounting for 65.4% of the final deformation (71.7 mm). However, the increases in lateral deformation in groups R1–R5 were smaller than that in group R0. The final deformations of groups R1–R5 were 22.0 mm, 17.5 mm, 19.8 mm, 21.3 mm, and 11.3 mm, which were 30.68%, 24.41%, 27.62%, 29.71%, and 5.76% of that in group R0, respectively. This comparison reveals that the VIPW can effectively control the lateral deformation induced by the excavation process, thus making excavation safer.
It can also be observed that the increase in lateral deformation in group R5 was smaller than that in the other groups when excavating the −40 cm to −80 cm soil layer. This indicates that the inclined piles started to work after removing soil below −40 cm. A similar phenomenon also occurred in groups R1–R4. The inclined piles started to work after removing soil below −50 cm in group R2, while they did so after removing soil below −60 cm in groups R1, R3, and R4.
The final lateral deformation can be arranged in ascending order as follows: HdR5 < HdR2 < HdR3 < HdR4 < HdR1 <HdR0. Raising the supporting position of the inclined piles or increasing the length of their embedded depth can improve the deformation control ability of VIPWs. Increasing the embedded depth of the vertical piles may have little effect on improving the deformation resistance of VIPWs.

3.2. Surface Settlement

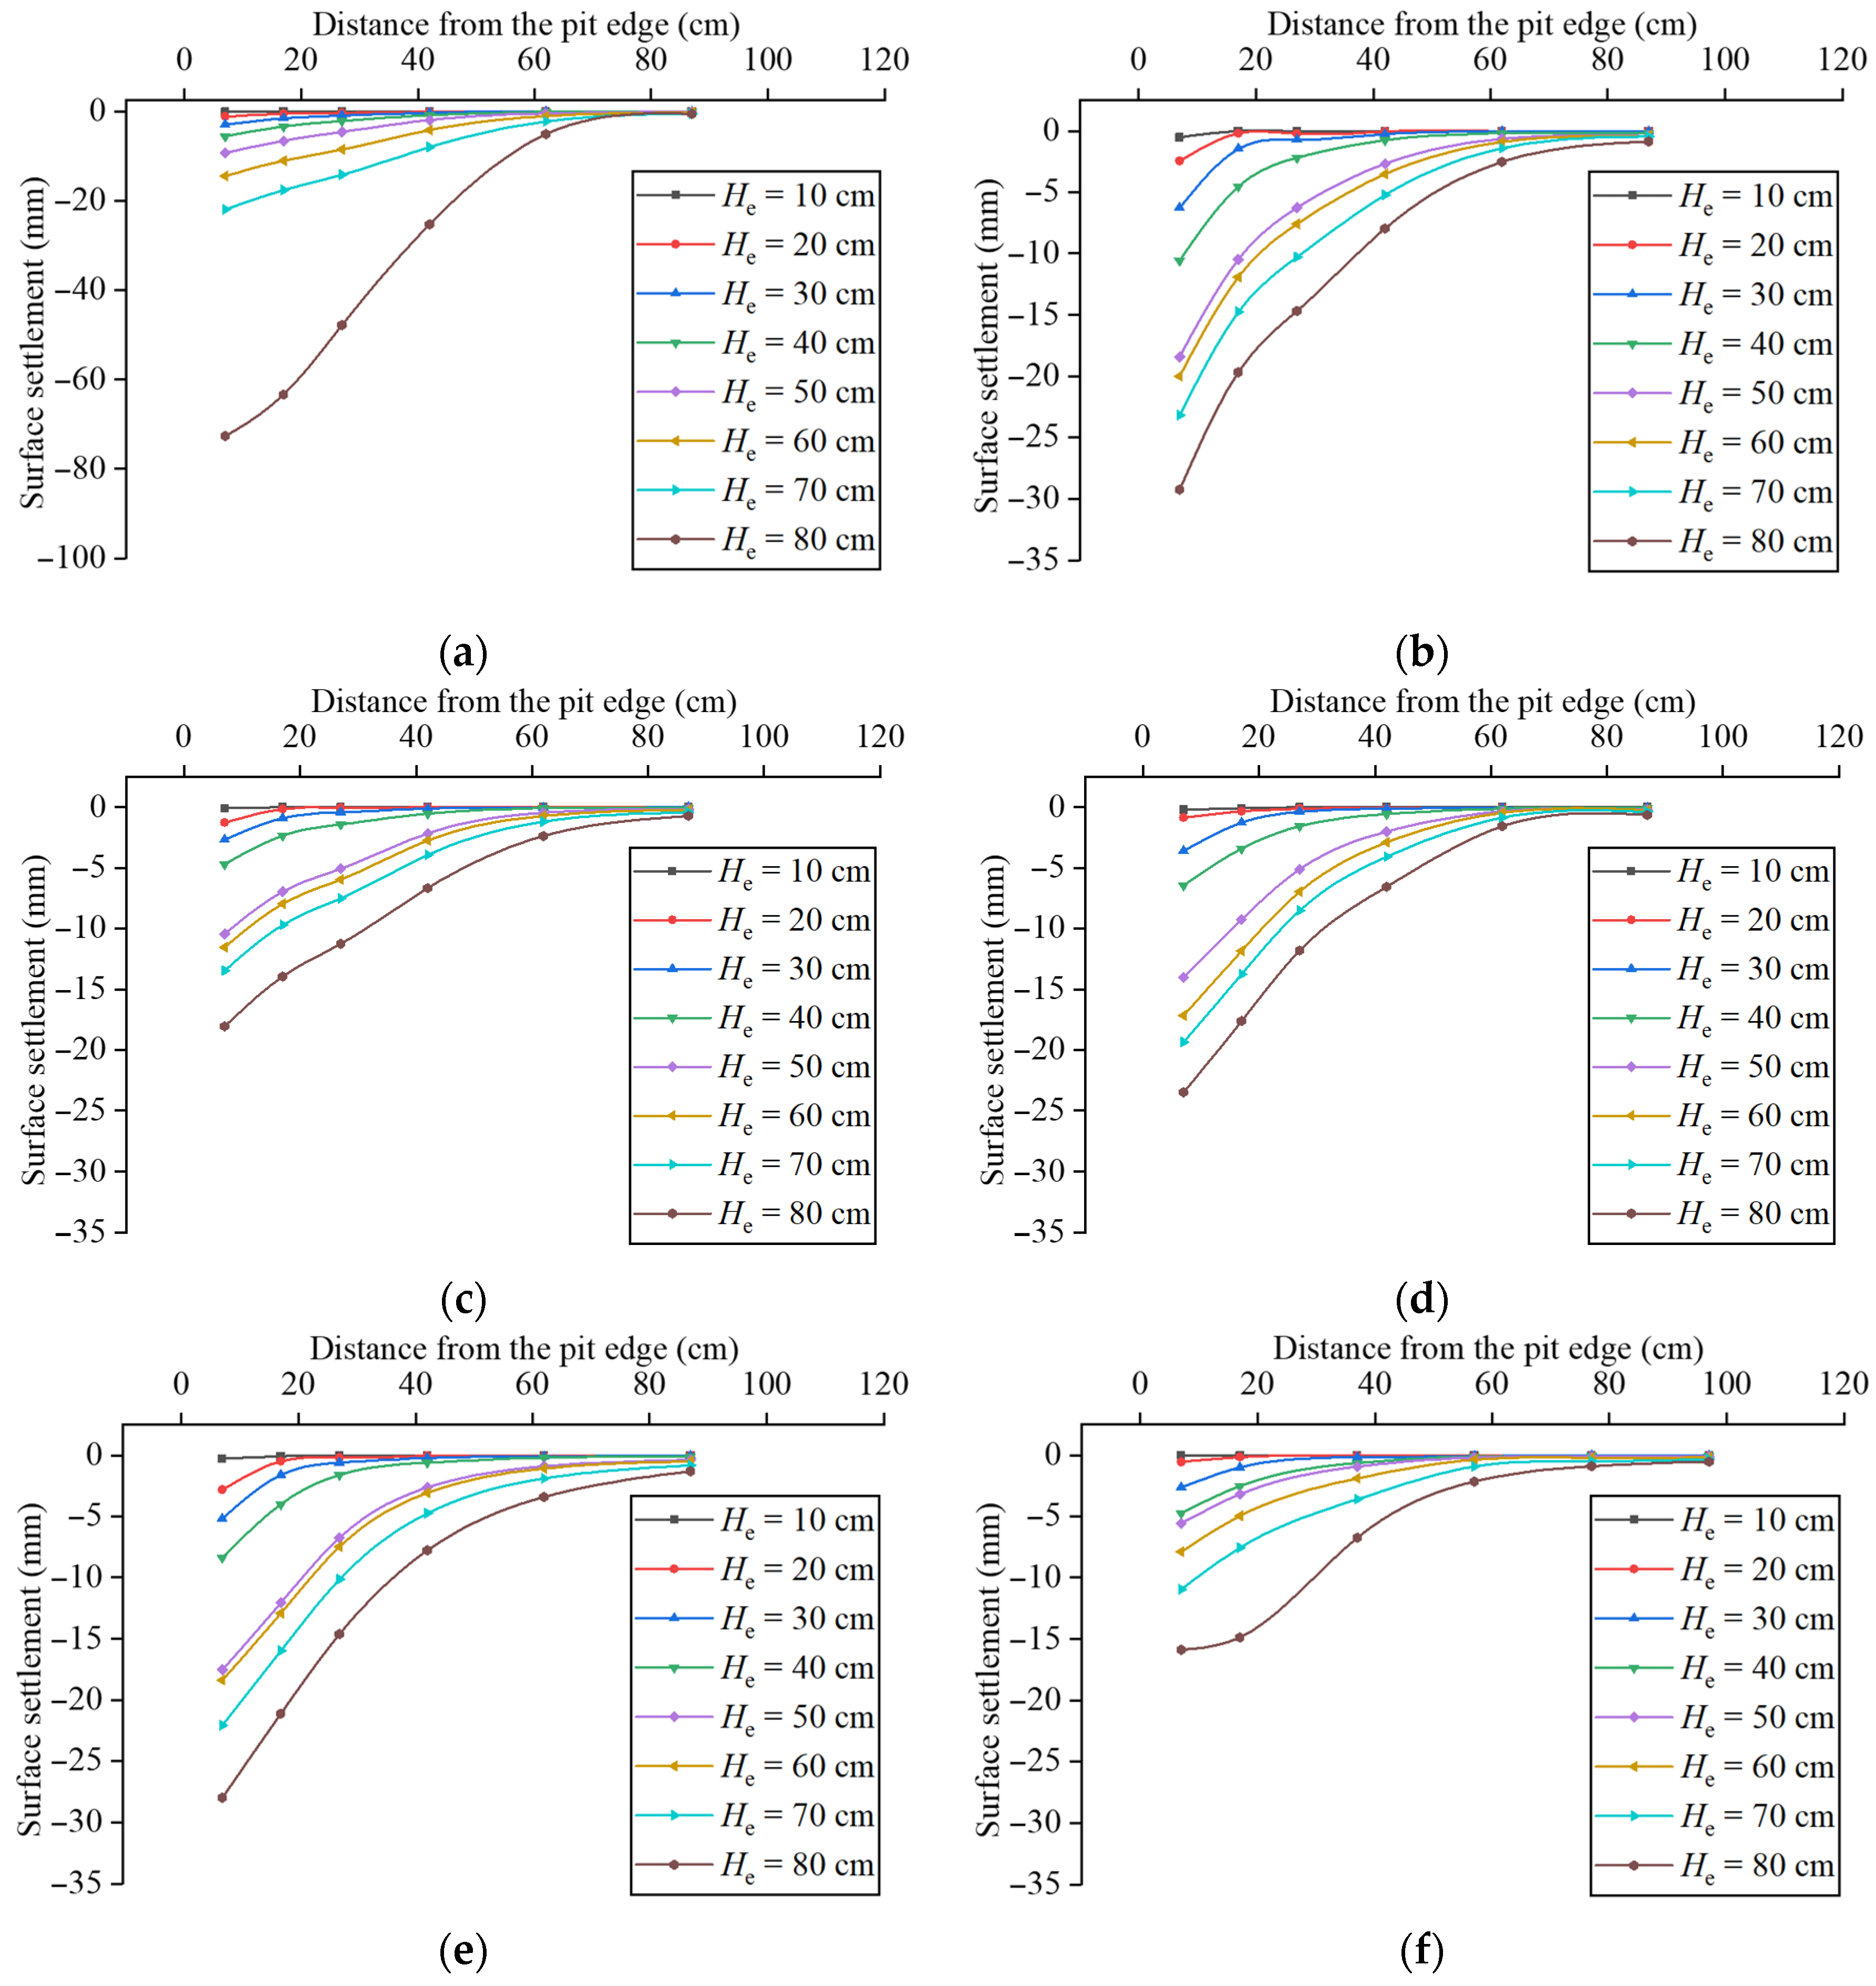
Figure 22 presents the surface settlement for different excavation depths (He) in groups R0–R5. It can be seen that the distributions of surface settlement in different tests are similar. The settlement is larger in the area near the pit than that some distance away from the edge of the pit, developing as a triangular distribution. The settlement in group R0 increased significantly when removing the soil layer from −70 cm to −80 cm. The settlement also developed in two stages, consistent with the lateral deformation: (i) when the sand was removed from ground level to H1, only the vertical piles acted as a cantilever; (ii) when the sand was removed from H1 to the pit bottom, the VIPW functioned in this stage.
Figure 22a shows that the surface settlement increased significantly when removing the soil layer from 70 cm to −80 cm in group R0, similar to the lateral deformation. Comparing Figure 22a with Figure 22b–f, it is clear that the surface settlement in groups R1–R5 is smaller than that in group R0 in the second stage.
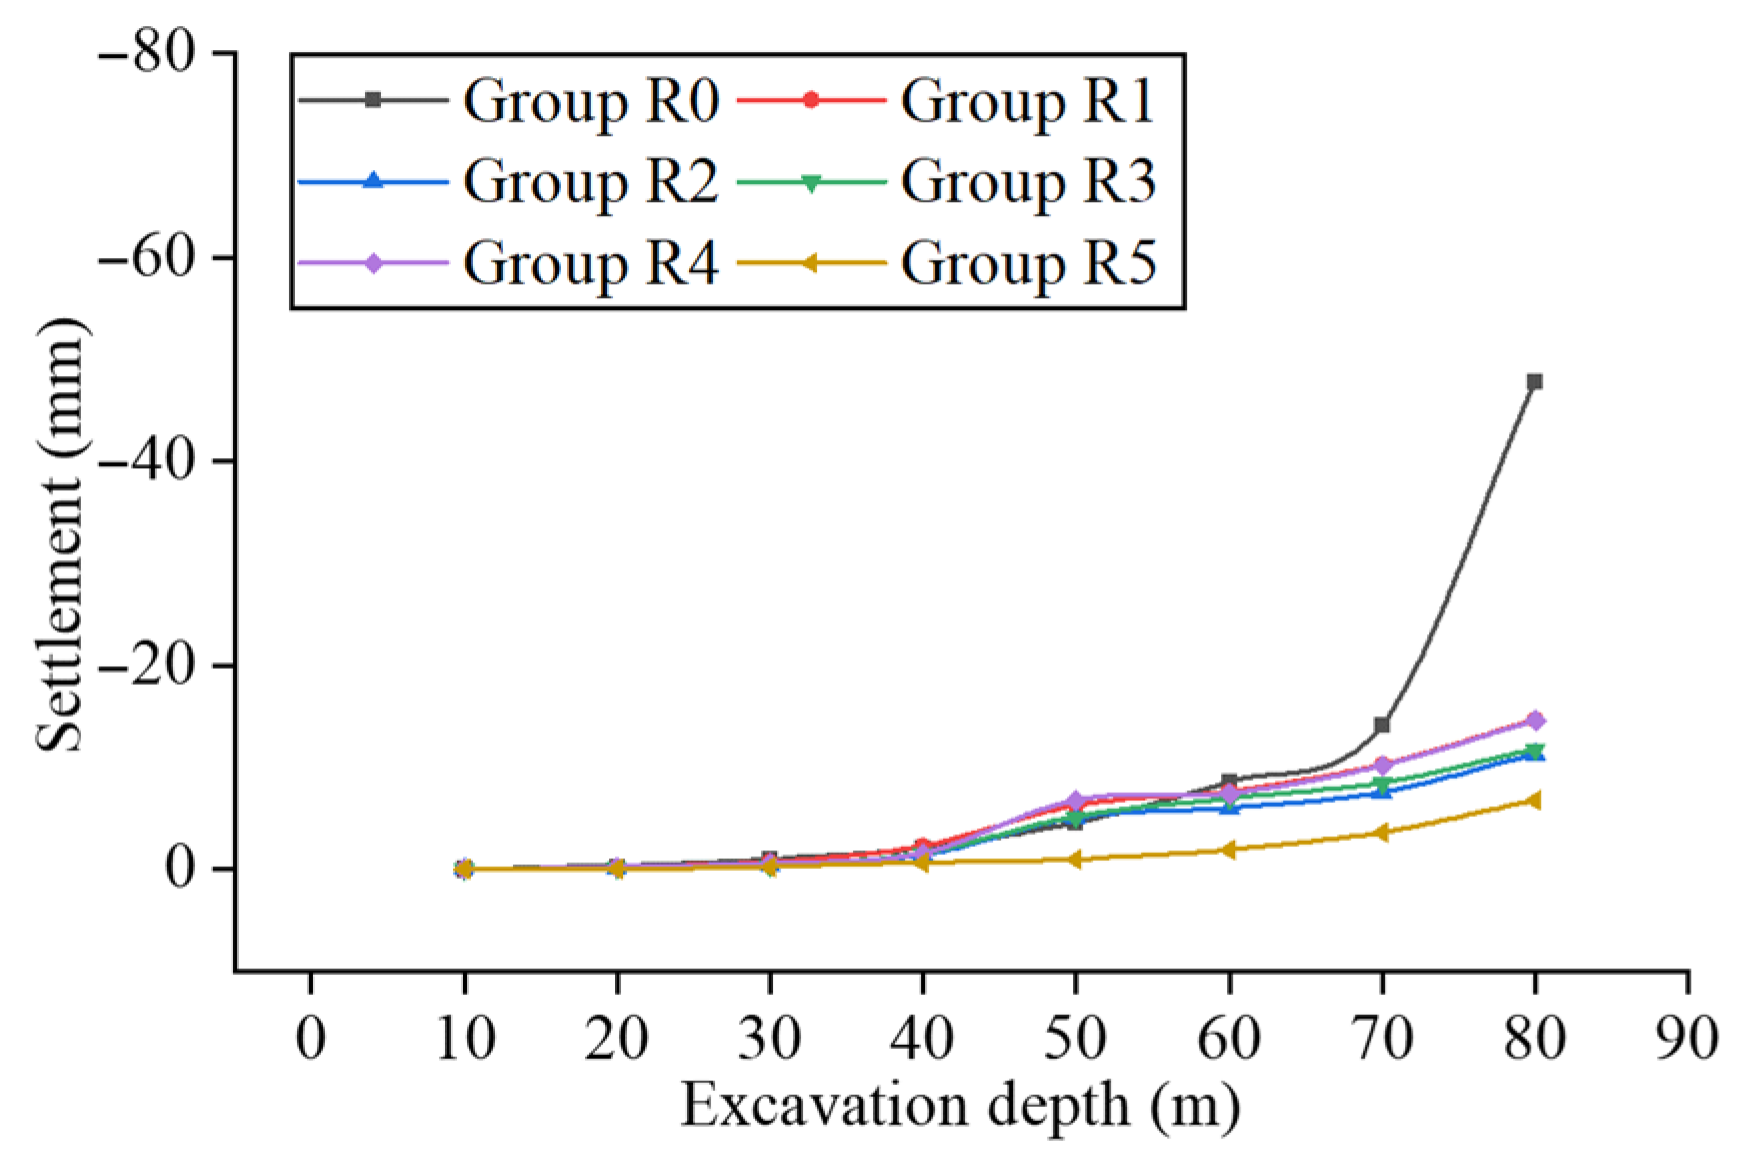
Figure 23 presents the surface settlement at a point 27 cm away from the edge of the pit in groups R0–R5. As can be seen from Figure 23, with the increase in excavation depth, the settlement deformation of group R0 gradually increases, and the growth rate also gradually rises. During the excavation of the 70–80 cm soil layer in group R0, the settlement deformation increases sharply, with an increase of 33.6 mm at this stage, accounting for 70.4% of the total deformation (47.7 mm). This implies that collapse happened during this process. However, the surface settlement in groups R1–R5 is smaller than that in R0, and no sharp increase happened in the whole excavation process. The final settlement in groups R1–R5 was 14.7 mm, 11.2 mm, 11.8 mm, 14.6 mm, and 6.7 mm, respectively, approximately 30.8%, 23.6%, 24.7%, 30.6%, and 14.1% that of group R0. This comparison reveals that VIPWs can effectively control the surface settlement induced by the excavation process.
It can also be observed that the surface settlement increases for groups R1–R5 start to show differences when excavating the soil layer below −40 cm. The increase in surface settlement in group R5 is less than in the other tests. The increase in surface settlement in groups R1–R4 becomes small when excavating the soil layer below −50 cm. This phenomenon implies that the inclined piles start to work when excavating the soil layer below −40 cm in group R5, and below −50 cm in groups R1–R4.
In conclusion, the order of surface settlement is DR5 < DR2 < DR3 < DR4 < DR1 < DR0 when excavating the soil layer below −80 cm, which is consistent with the horizontal displacement distribution of the vertical piles described above. Therefore, appropriately increasing the supporting position of the inclined piles and increasing the depth from the excavation bottom to the tip of the inclined pile can improve the deformation control ability of the VIPW. Increasing the dip angle of the inclined piles has little effect on improving the ability of the VIPW to resist deformation. Increasing the depth from the excavation bottom to the tip of the vertical piles may not significantly improve the ability of the VIPW to resist deformation.
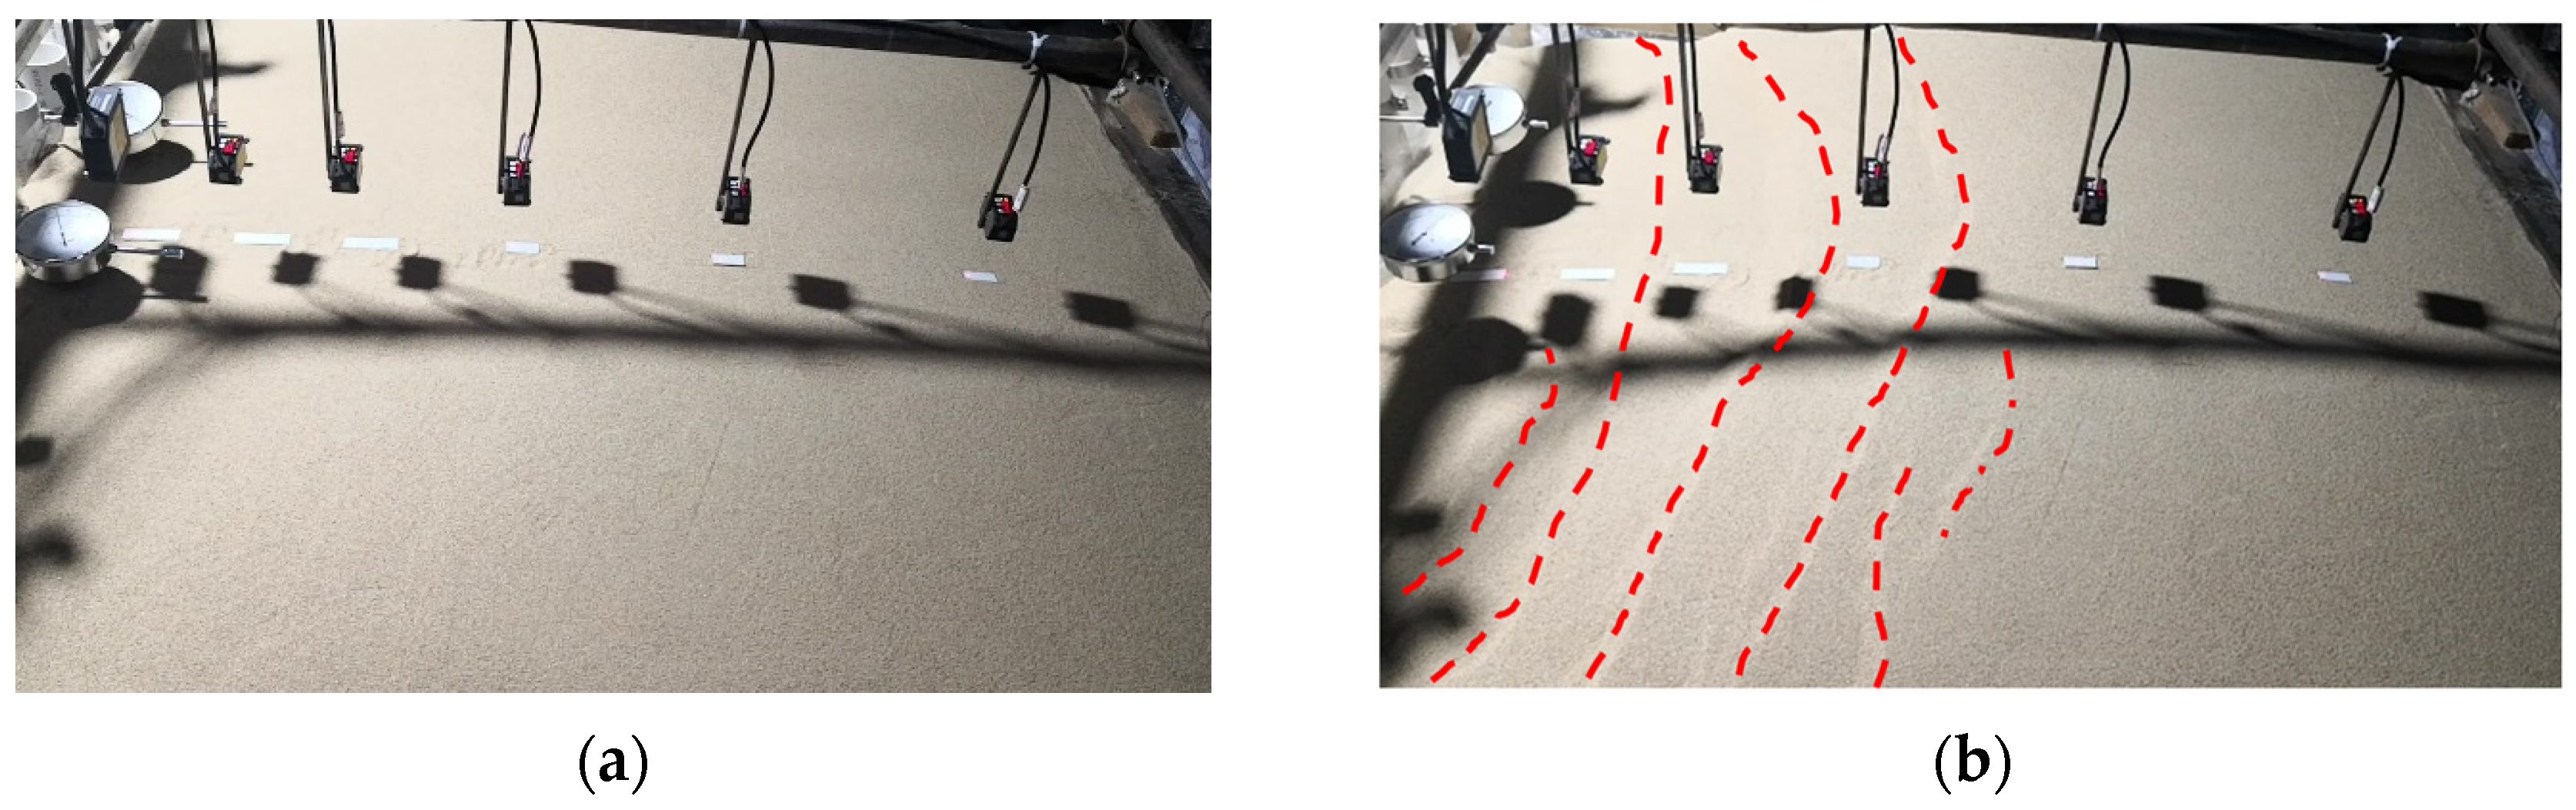
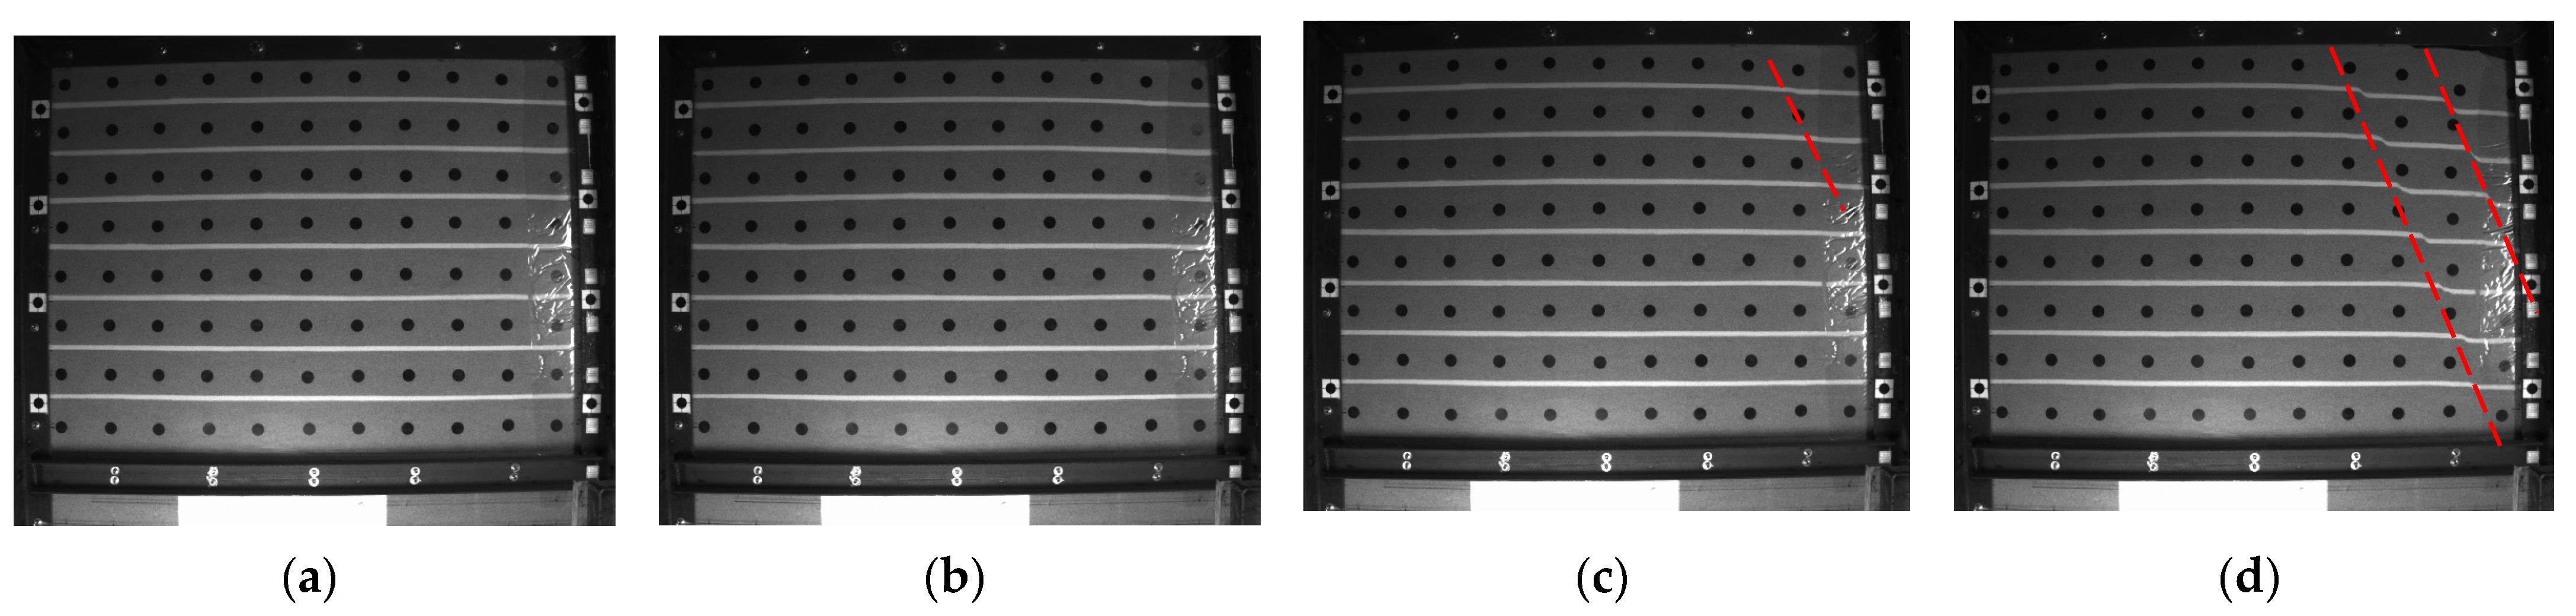
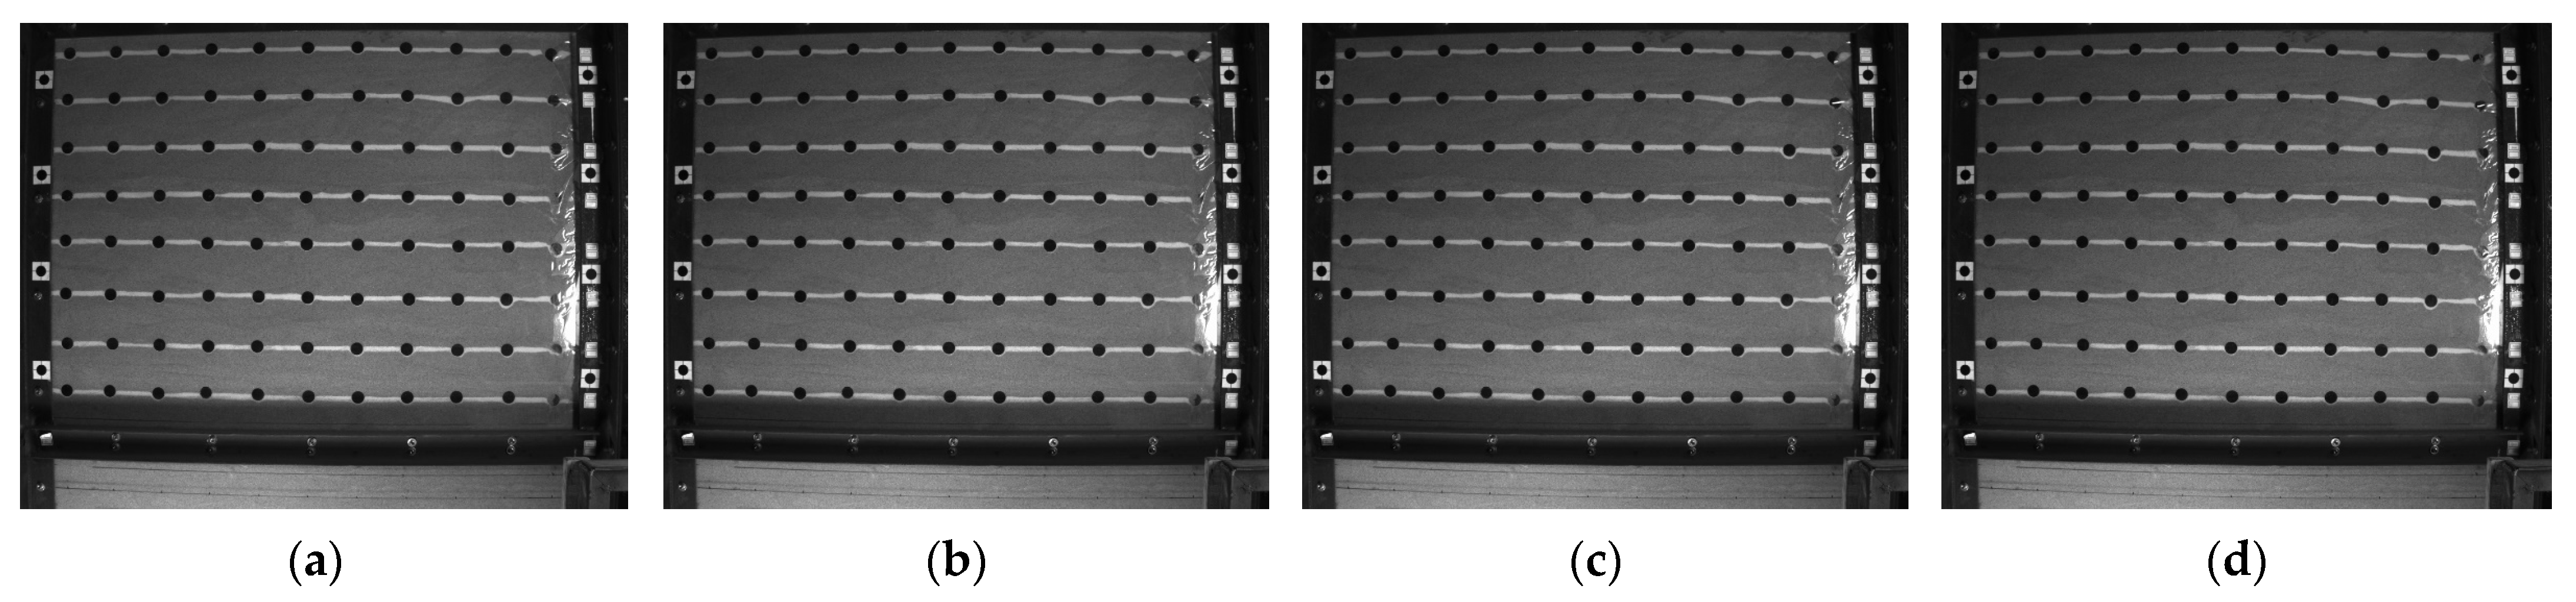
Due to space limitations, Figure 24 and Figure 25 only show the surface conditions of group R0 and group R5 when the excavation depths are 70 cm and 80 cm (the surface conditions of groups R1–R4 are similar to those of group R5).
Figure 24 shows that in group R0, when the excavation depth is 80 cm, there are obvious sliding steps on the surface (the red dotted lines in Figure 24b), and significant settlement deformation occurs near the edge of the excavation, indicating that the excavation is unstable. In group R5 (Figure 25), the surface settlement deformation is small, and there is no sliding step. This shows that with increases in excavation depth, the VIPW can effectively control the deformation of excavation and ensure the stability of excavation.

3.3. Bending Moment of Vertical Piles

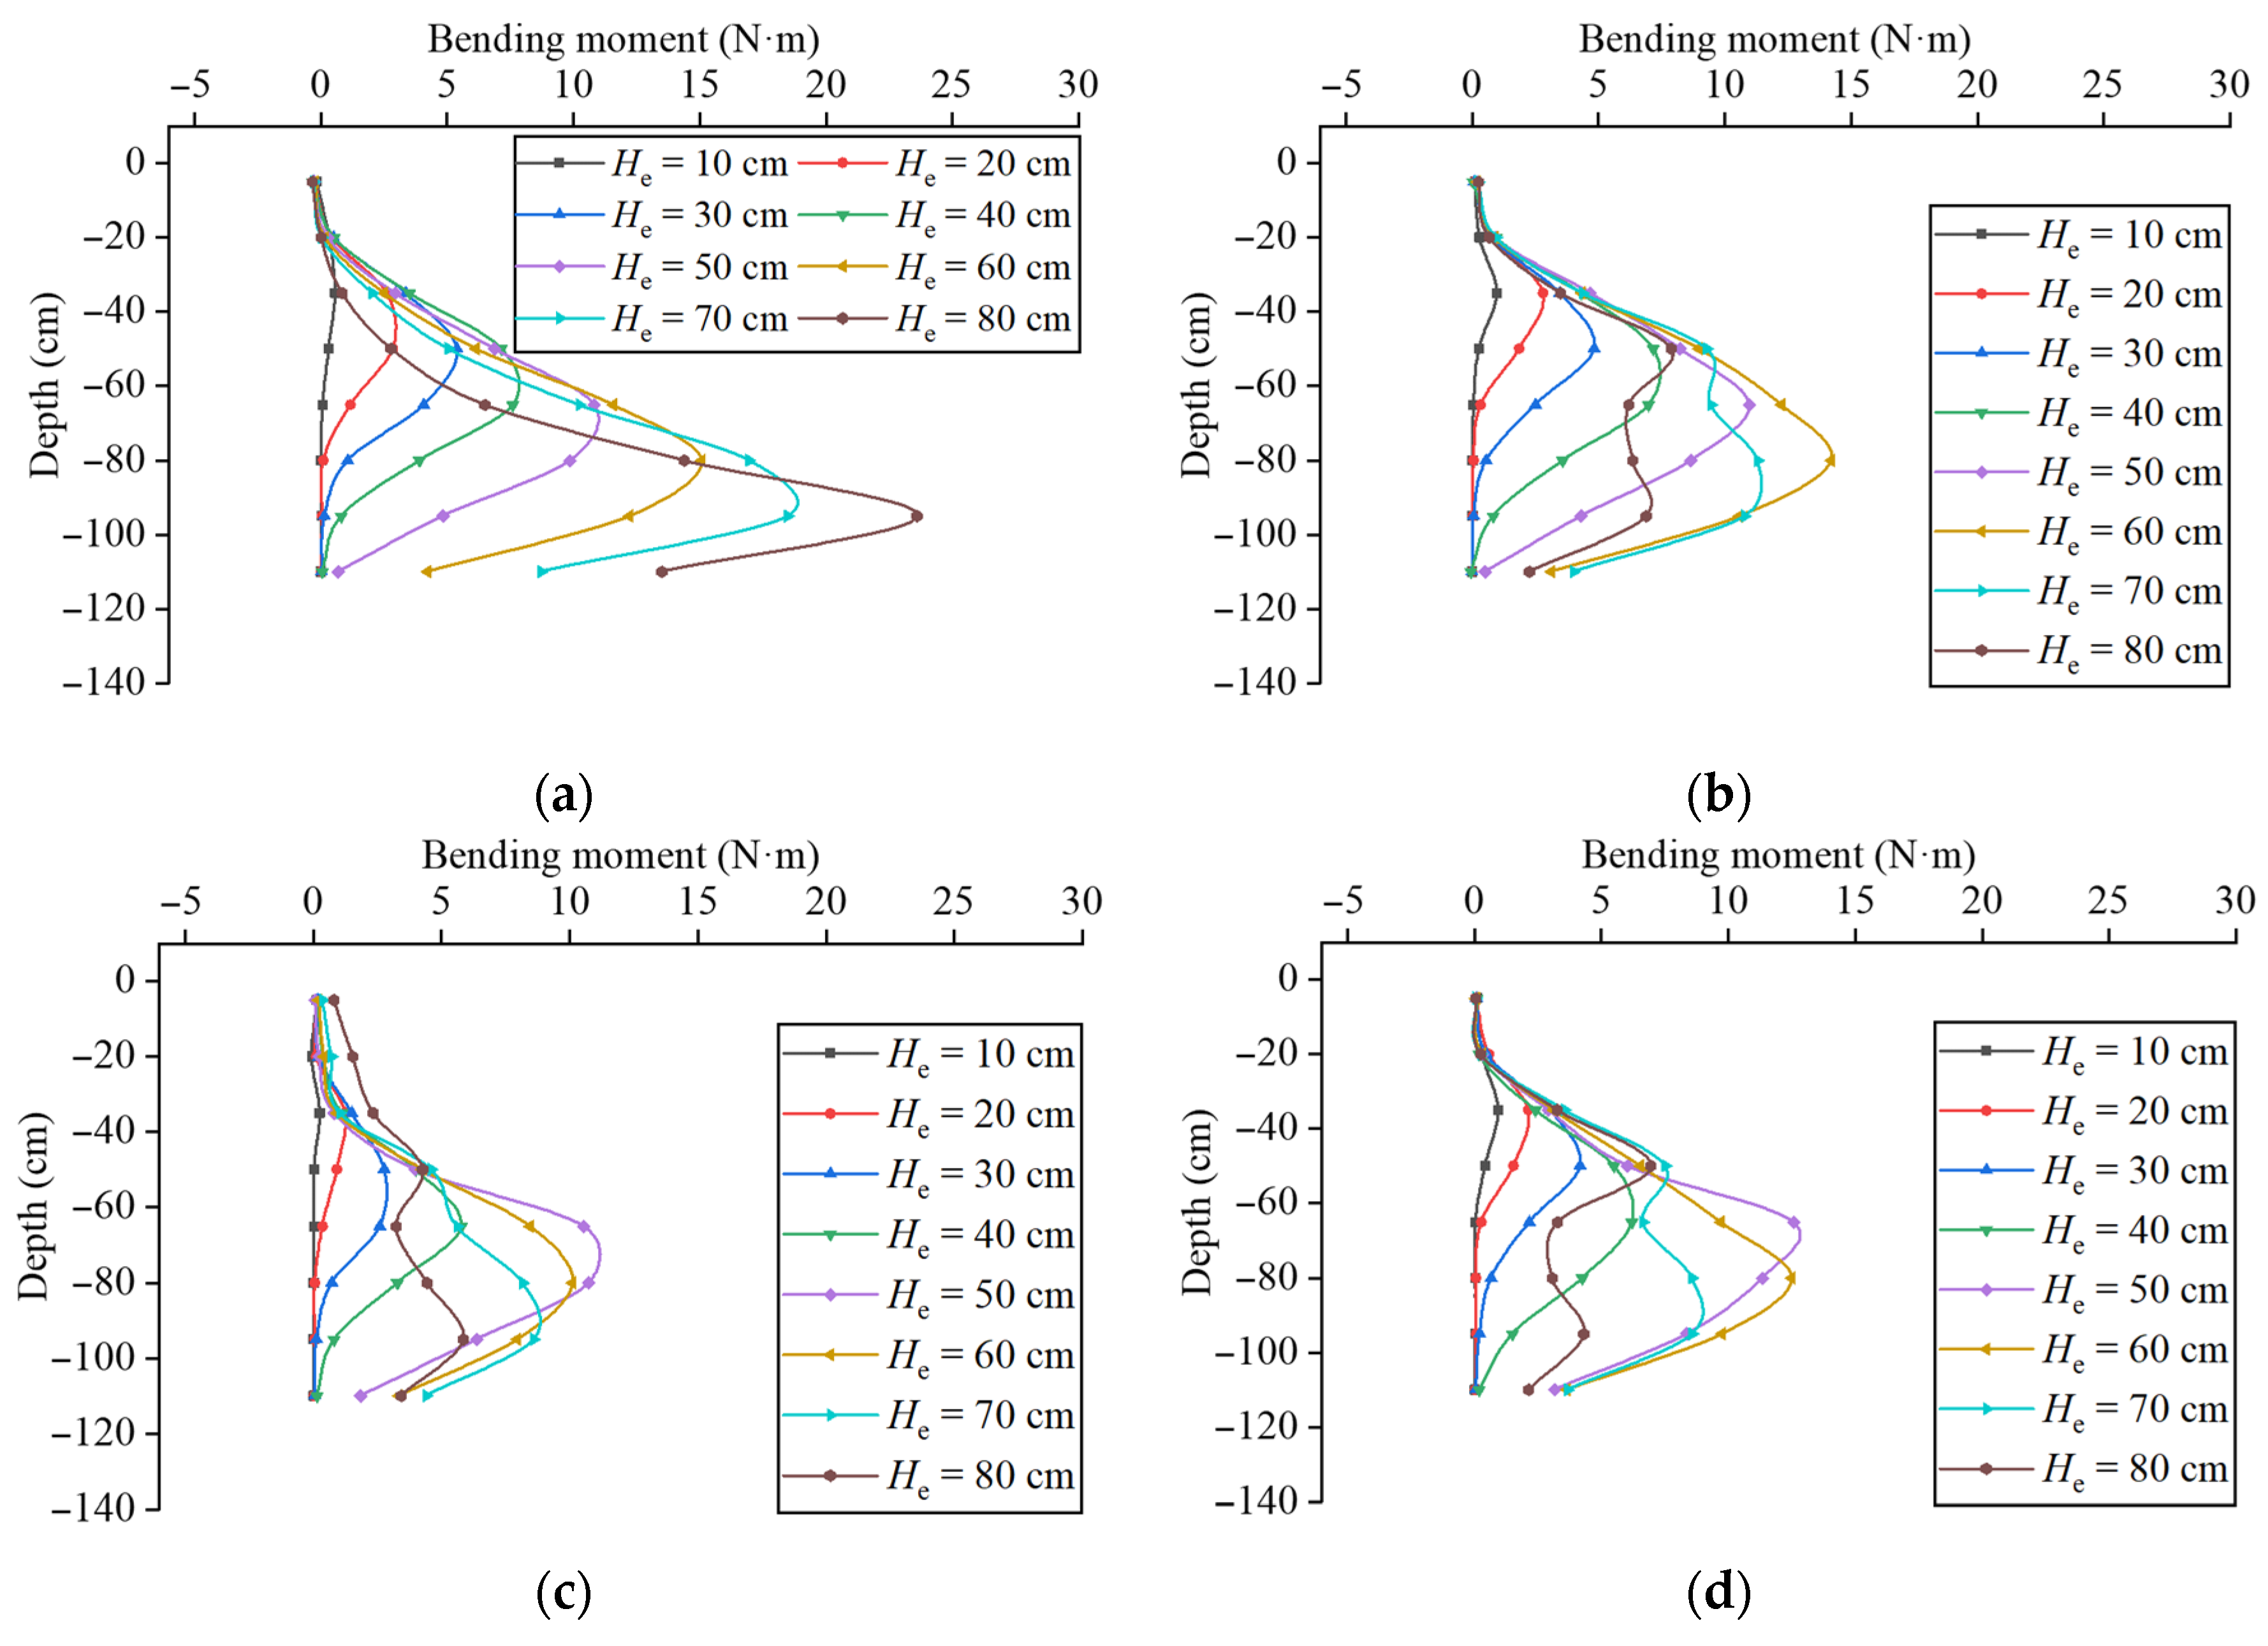
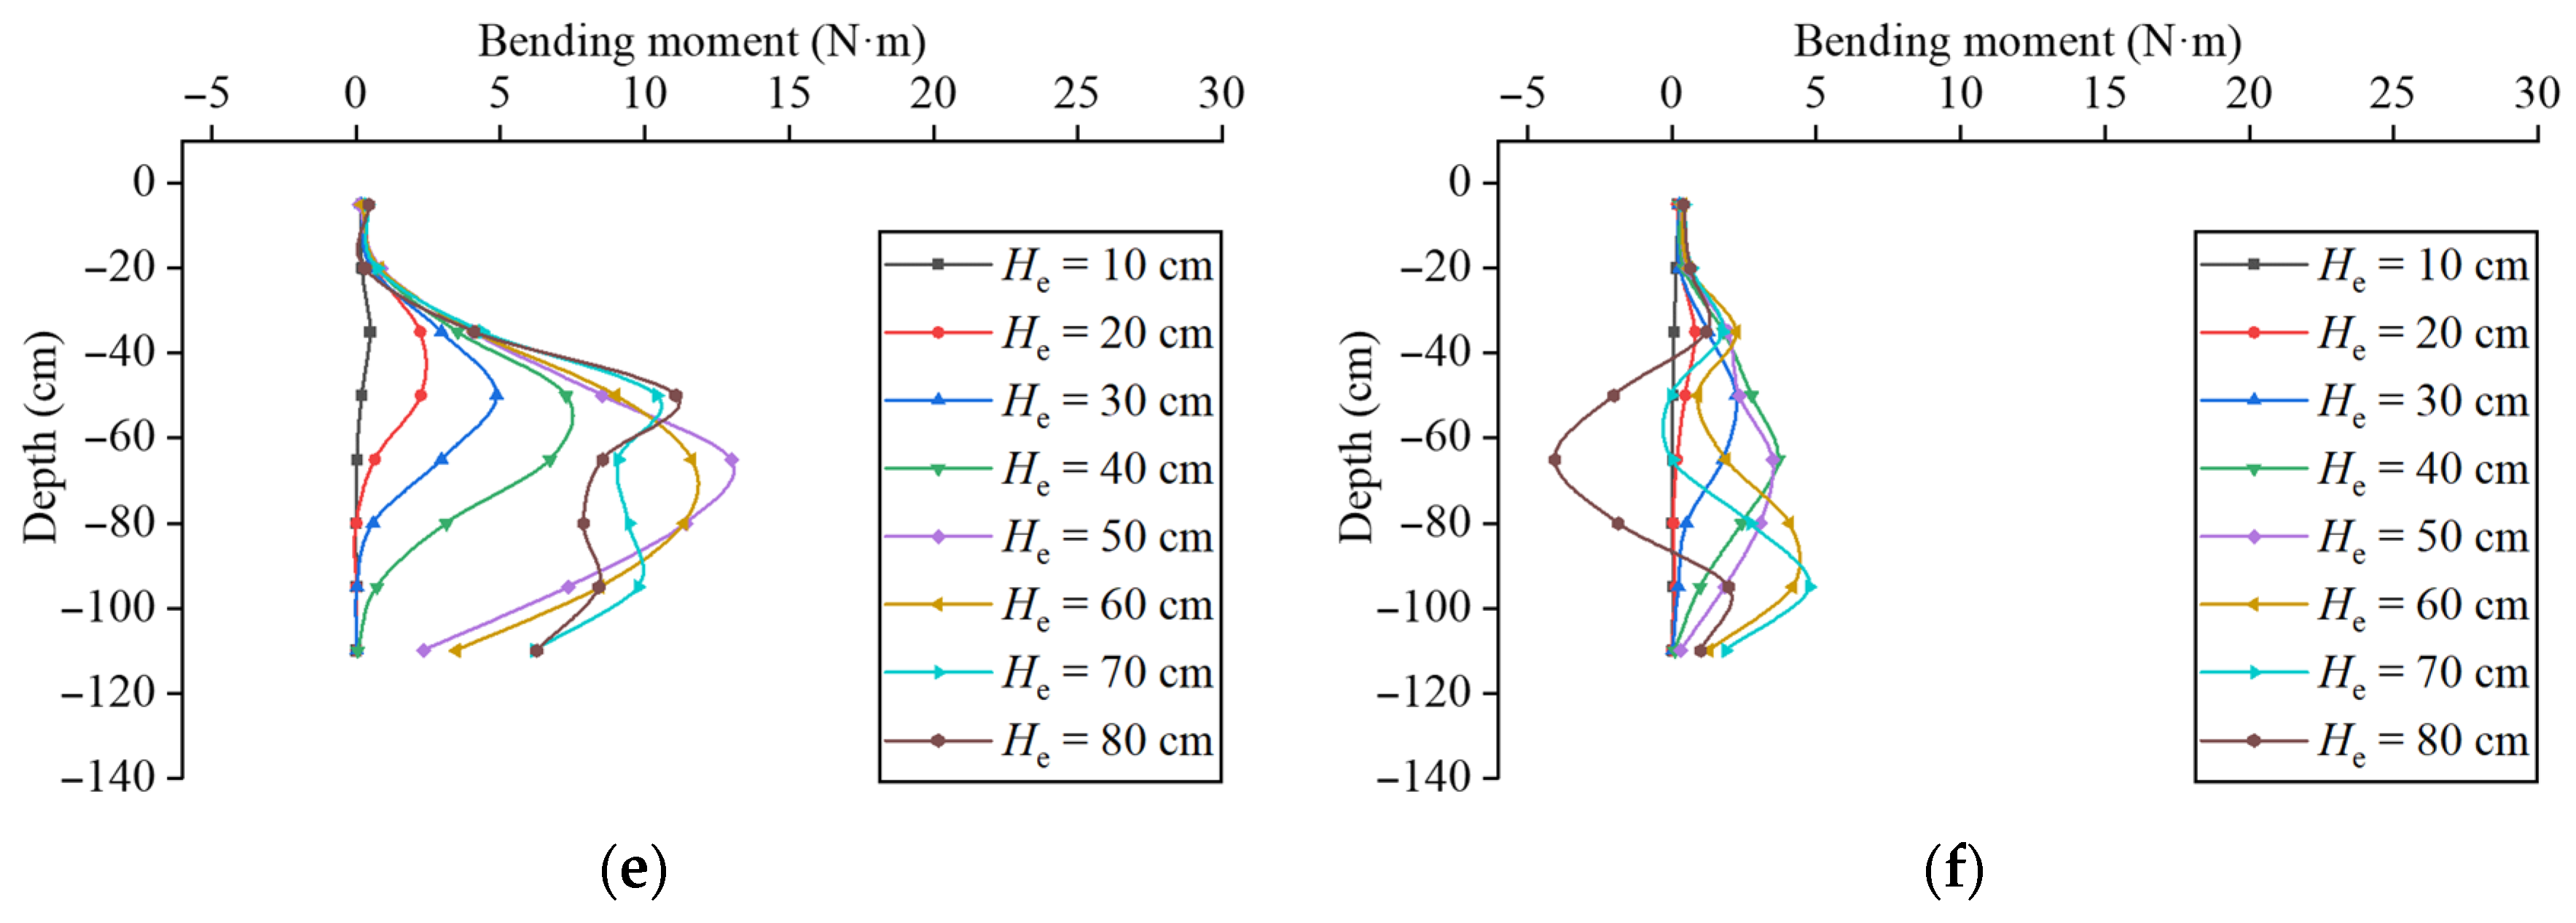
The strains of the vertical piles were converted into bending moments according to Table 6, and the bending moment distribution of the vertical piles for different excavation depths (He) is shown in Figure 26.
From Figure 26a, it can be seen that the bending moment distribution of the vertical pile in group R0 shows obvious parabolic characteristics. The maximum bending moment occurs in the range of 15–30 cm below the excavation surface. This conclusion is consistent with Coulomb’s earth pressure theory, which states that the distributions of active earth pressure behind the pile and passive earth pressure at the pit bottom both increase linearly with depth. Under the combined action of active and passive earth pressures, the maximum bending moment occurs near the pit bottom of the pile. Moreover, the maximum bending moment gradually increases with increases in excavation depth.
When the excavation depth is greater than 50 cm in group R0, the bending moment value above the excavation surface will decrease. The reason for this phenomenon is that with the increase in excavation depth, the horizontal displacement of the vertical pile increases, the earth pressure behind the pile gradually changes from the static earth pressure to the active earth pressure, the settlement deformation of the top of the pit increases, and the effective depth of the soil layer in the active area behind the vertical pile decreases, as shown in Figure 24b. The resultant force of the earth pressure acting on the vertical pile in this area decreases, which leads to a decrease in the bending moment of the vertical pile in the range above the excavation surface. This phenomenon is consistent with the deformation characteristics of the pit shown above.
It can be seen from Figure 26b–f that the bending moment distributions of the vertical piles in groups R1–R5 are similar throughout the whole excavation process, which can be divided into two stages: (1) During excavation of the soil layer above the wale (50 cm for groups R1–R4 and 40 cm for group R5), the bending moment distribution characteristics of the vertical piles are the same as those of R0, exhibiting the typical behavior of a cantilever retaining structure. With an increase in the excavation depth, the bending moment values increase continuously, and the maximum bending moment occurs near the excavation surface or at a certain depth below it. (2) During excavation from the wale level down to the bottom of the foundation pit (80 cm depth), the maximum positive bending moment of the vertical piles gradually decreases; in other words, the bending moment values in the zone below the wale gradually decrease as the excavation depth increases. At the same time, there are three convex (concave) points in the bending moment curve during this process, which are as follows: (i) the first convex point is located at or near the wale (due to the distribution density of the measuring points, the position of R5 is 35 cm); (ii) the second concave point is located in the range of 15 cm to 25 cm below the wale (the positions of R1 to R4 are 65 cm, while that of R5 is 45 to 65 cm); (iii) the third convex point is located 15 to 20 cm below the excavation face in each excavation step.
Comparing Figure 26a with Figure 26b–f, it can be seen that when the excavation depth is greater than 50 cm, the bending moment values of the vertical piles in groups R1–R5 are significantly smaller than those in R0. Therefore, it can be judged that due to the support force provided by the inclined pile, the bending moment distribution of the vertical pile is changed and the maximum bending moment value is reduced. In order to analyze the relationship between the bending moments of different groups during the excavation, the maximum bending moments of the vertical piles in each excavation step are selected as the analysis objects, and curves of the maximum bending moment for each group of vertical piles under different excavation depths are drawn (Figure 27).
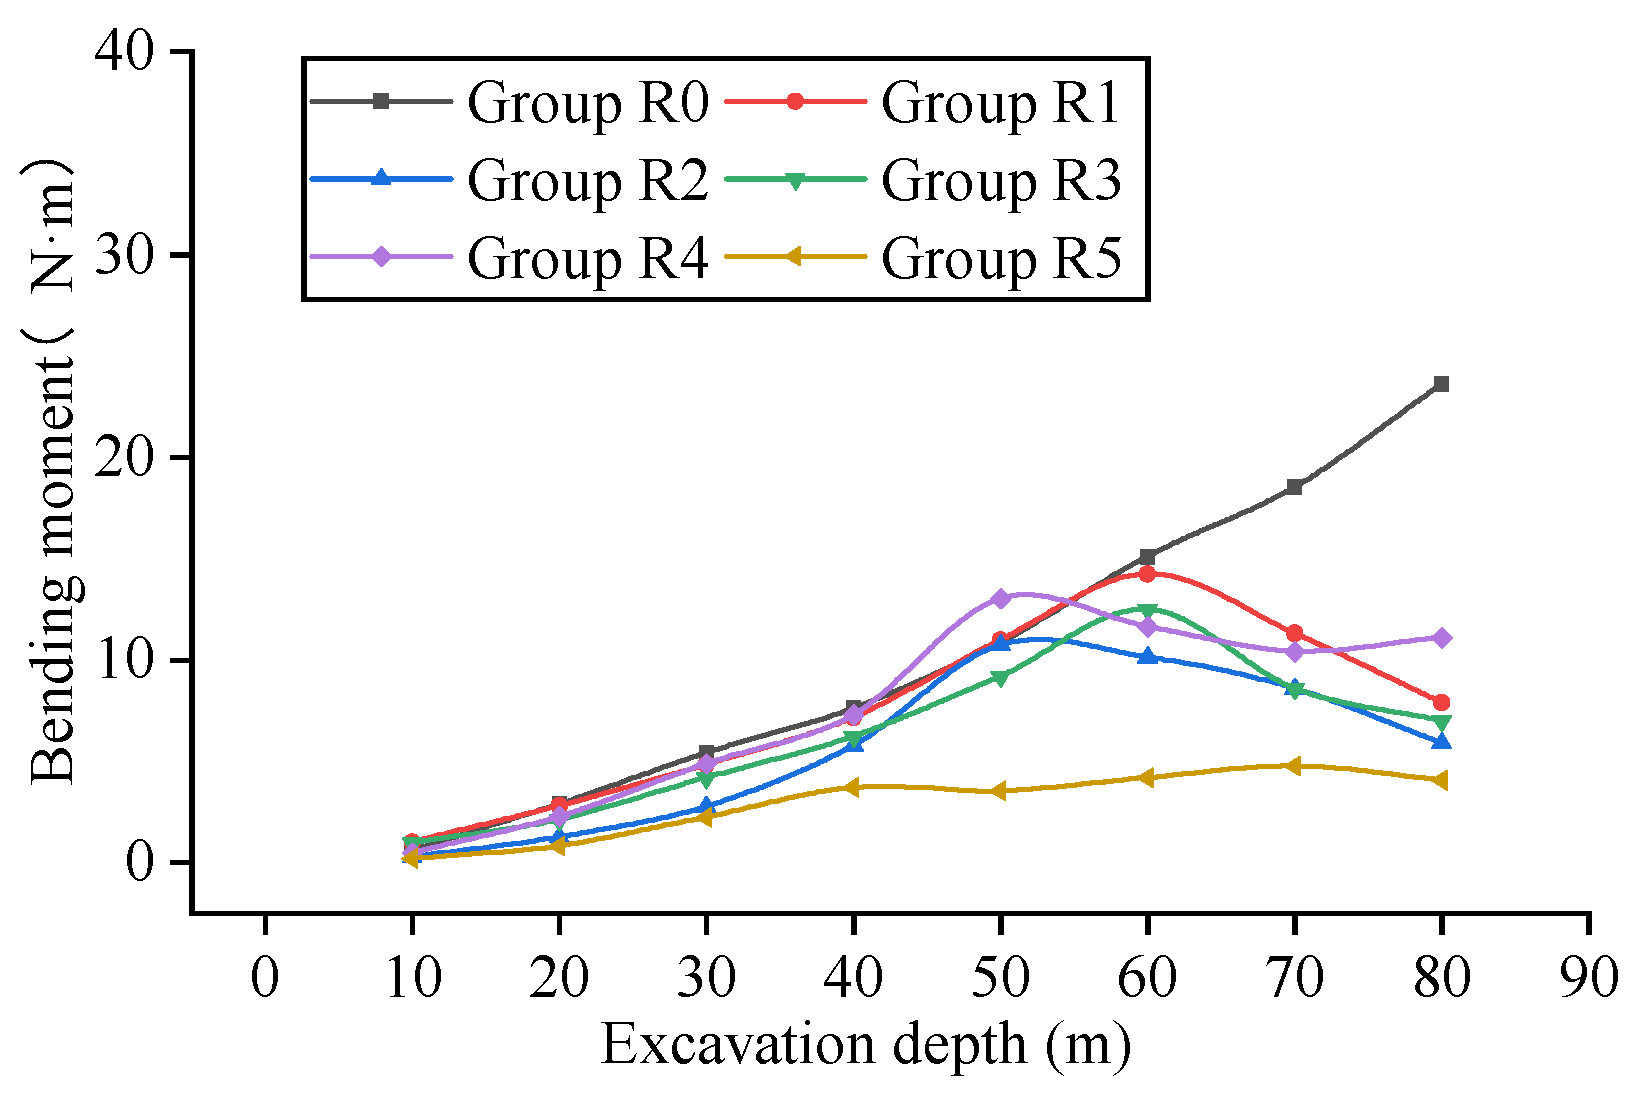
From Figure 27, it can be observed that as the excavation depth increases, the maximum bending moment of the vertical piles in group R0 continues to increase. When the excavation reaches the bottom (80 cm), the maximum bending moment is 23.6 N·m. In groups R1–R5, when the excavation reaches 80 cm, the maximum bending moments of the vertical piles are significantly smaller than that in group R0, and the final bending moments are 7.9 N·m (R1), 5.9 N·m (R2), 7.0 N·m (R3), 11.1 N·m (R4), and 4.1 N·m (R5), respectively. Notably, a point of contraflexure occurs in group R5, resulting in a negative maximum bending moment, and the maximum bending moments in groups R1–R5 are 33.5%, 25.0%, 29.7%, 47.0%, and 17.4% of the maximum bending moment in group R0, respectively. This shows that the VIPW can improve the internal force distribution of the retaining structure and reduce its maximum bending moment value, which is conducive to safety during the excavation process, and can reduce the reinforcement ratio of the retaining structure, thereby reducing costs.
Figure 27 also indicates that during the excavation of soil layers between 0 and 40 cm, the slope of the bending moment curve for the vertical pile in each group is similar and gradually increases. When the excavation depth exceeds 40 cm, differences gradually emerge among the maximum bending moment values of all test groups. The growth rate of the bending moment values in group R5 significantly slows down and is smaller than those in the other groups. Moreover, a negative bending moment occurs at an excavation depth of 80 cm, indicating that the inclined pile support in group R5 effectively begins to function after reaching the 40 cm position. This provides a counteracting support force to the vertical pile, limiting its lateral deformation and altering its internal force distribution. When the excavation depth reaches 50 cm for groups R2 and R4, and 60 cm for groups R1 and R3, the maximum bending moments of the vertical piles begin to decrease. This indicates that the inclined piles start to function, altering the distribution of internal forces. It can be observed that during the excavation process, the bending moment changes for the vertical piles in the VIPWs from groups R1 to R5 are divided into two stages. The first stage involves excavating the soil layer from the ground surface to the wale, while the second stage involves excavating the soil layer from the wale to the pit bottom. In the first stage, the ground settlement deformation is the same as that of the cantilevered retaining structure model. In the second stage, the inclined piles and vertical piles form a herringbone retaining structure, working together, during which the maximum bending moments of the vertical piles gradually decrease.
In summary, when the excavation depth reaches the bottom (80 cm), the maximum bending moments of the vertical piles follow an ascending order: MR5 < MR2 < MR3 < MR1 < MR4 < MR0. This trend is largely consistent with the previously observed patterns of lateral deformation in the vertical piles and ground surface settlement. Increasing the support position of the inclined pile (group R5) can enable it to provide stabilizing effects during the early stages of excavation, significantly improving the internal force distribution of the vertical pile. However, this adjustment may induce larger negative bending moment zone in the vertical pile. Enhancing the embedment depth of the inclined pile into the soil increases its bearing capacity, inherent stiffness, and stability, which effectively reduces the lateral deformation of the herringbone pile retaining structure. Consequently, this approach also reduces the maximum bending moment value of the vertical pile.

3.4. Internal Force of Inclined Piles

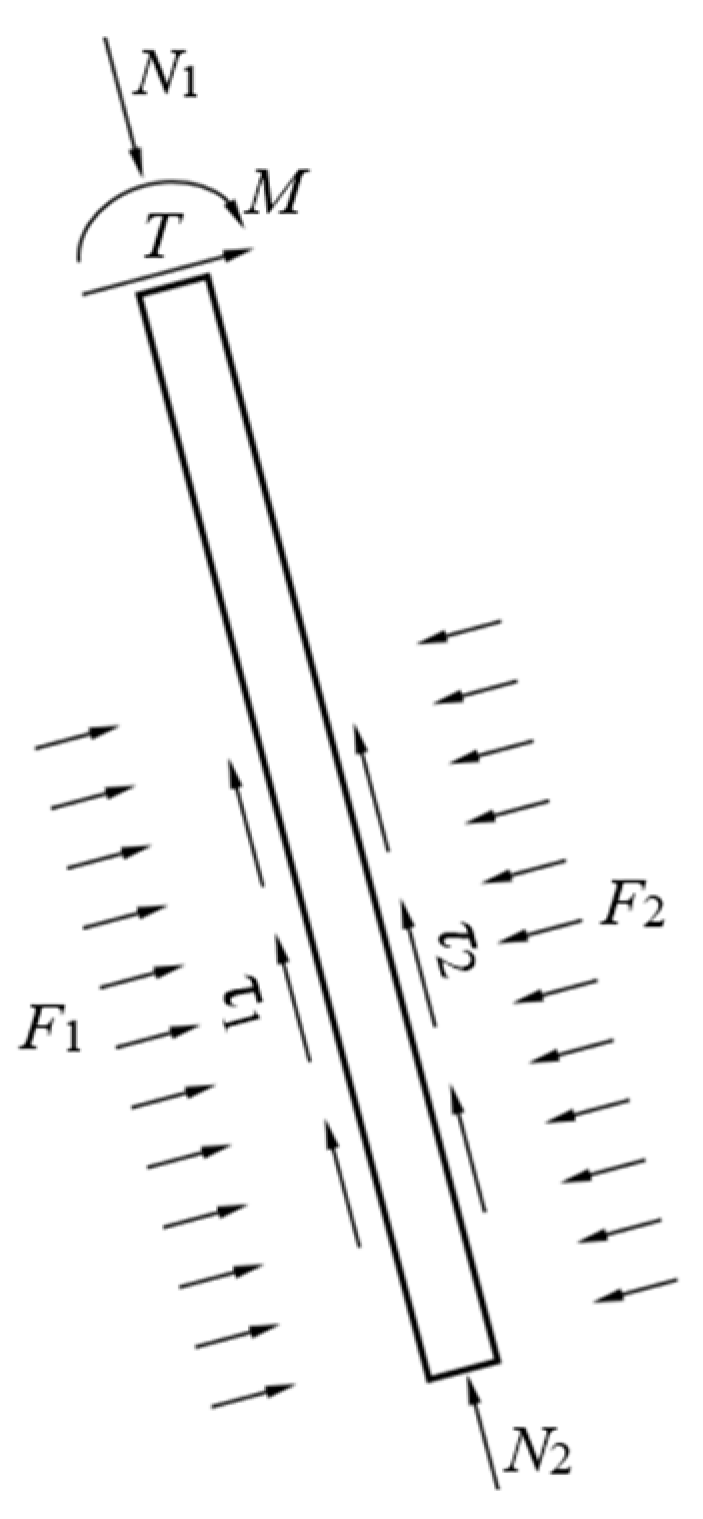
During the excavation process, inclined piles experience complex mechanical behavior. When the pile head is rigidly connected to the wale, the pile head is subjected to a bending moment (M), axial force (N1), and tangential force (T) from the wale. Along the pile shaft, the soil exerts normal forces (F1, F2) and tangential shear forces (τ1, τ2) on its surface, while the pile tip is loaded by a soil-induced axial force (N2). Figure 28 shows a schematic diagram of these forces acting on the inclined pile. The strain values measured by strain gauge sensors represent the resultant strain caused by the combined forces at each measurement point. By conducting a mechanical analysis on any cross-section of the inclined pile, it is evident that the internal forces include the bending moment, shear force, and axial force. Based on the principles of material mechanics, when the span of a beam exceeds five times its depth, the influence of shear force and lateral compressive stresses on the bending normal stress at any point of the cross-section can be neglected. The inclined piles used in the tests have a length significantly greater than five times their diameter. Therefore, the bending normal stress on their cross-sections can be derived using the stress formula for a beam under pure bending [42]. Specifically, the maximum tensile stress and maximum compressive stress occur at two points located above and below the neutral axis, corresponding to the maximum tensile strain and maximum compressive strain, respectively. Under axial force, a uniformly distributed normal stress is generated across the cross-section, corresponding to axial tensile/compressive strain values. Under shear force, the cross-section undergoes relative shear deformation. Although this deformation is perpendicular to the outer surface of the inclined pile, strain gauges (which have a finite length along the axial direction of the pile) will still be affected by the shear-induced deformation, thereby influencing the accuracy of their measurement of axial strain values along the pile’s longitudinal axis. To simplify the analysis, it is assumed here that the influence of shear deformation (induced by shear forces) on the strain gauge measurements is negligible. Therefore, the strain values measured by the gauges are attributed solely to the tensile/compressive strains generated by the bending moment and axial force acting on the cross-section.
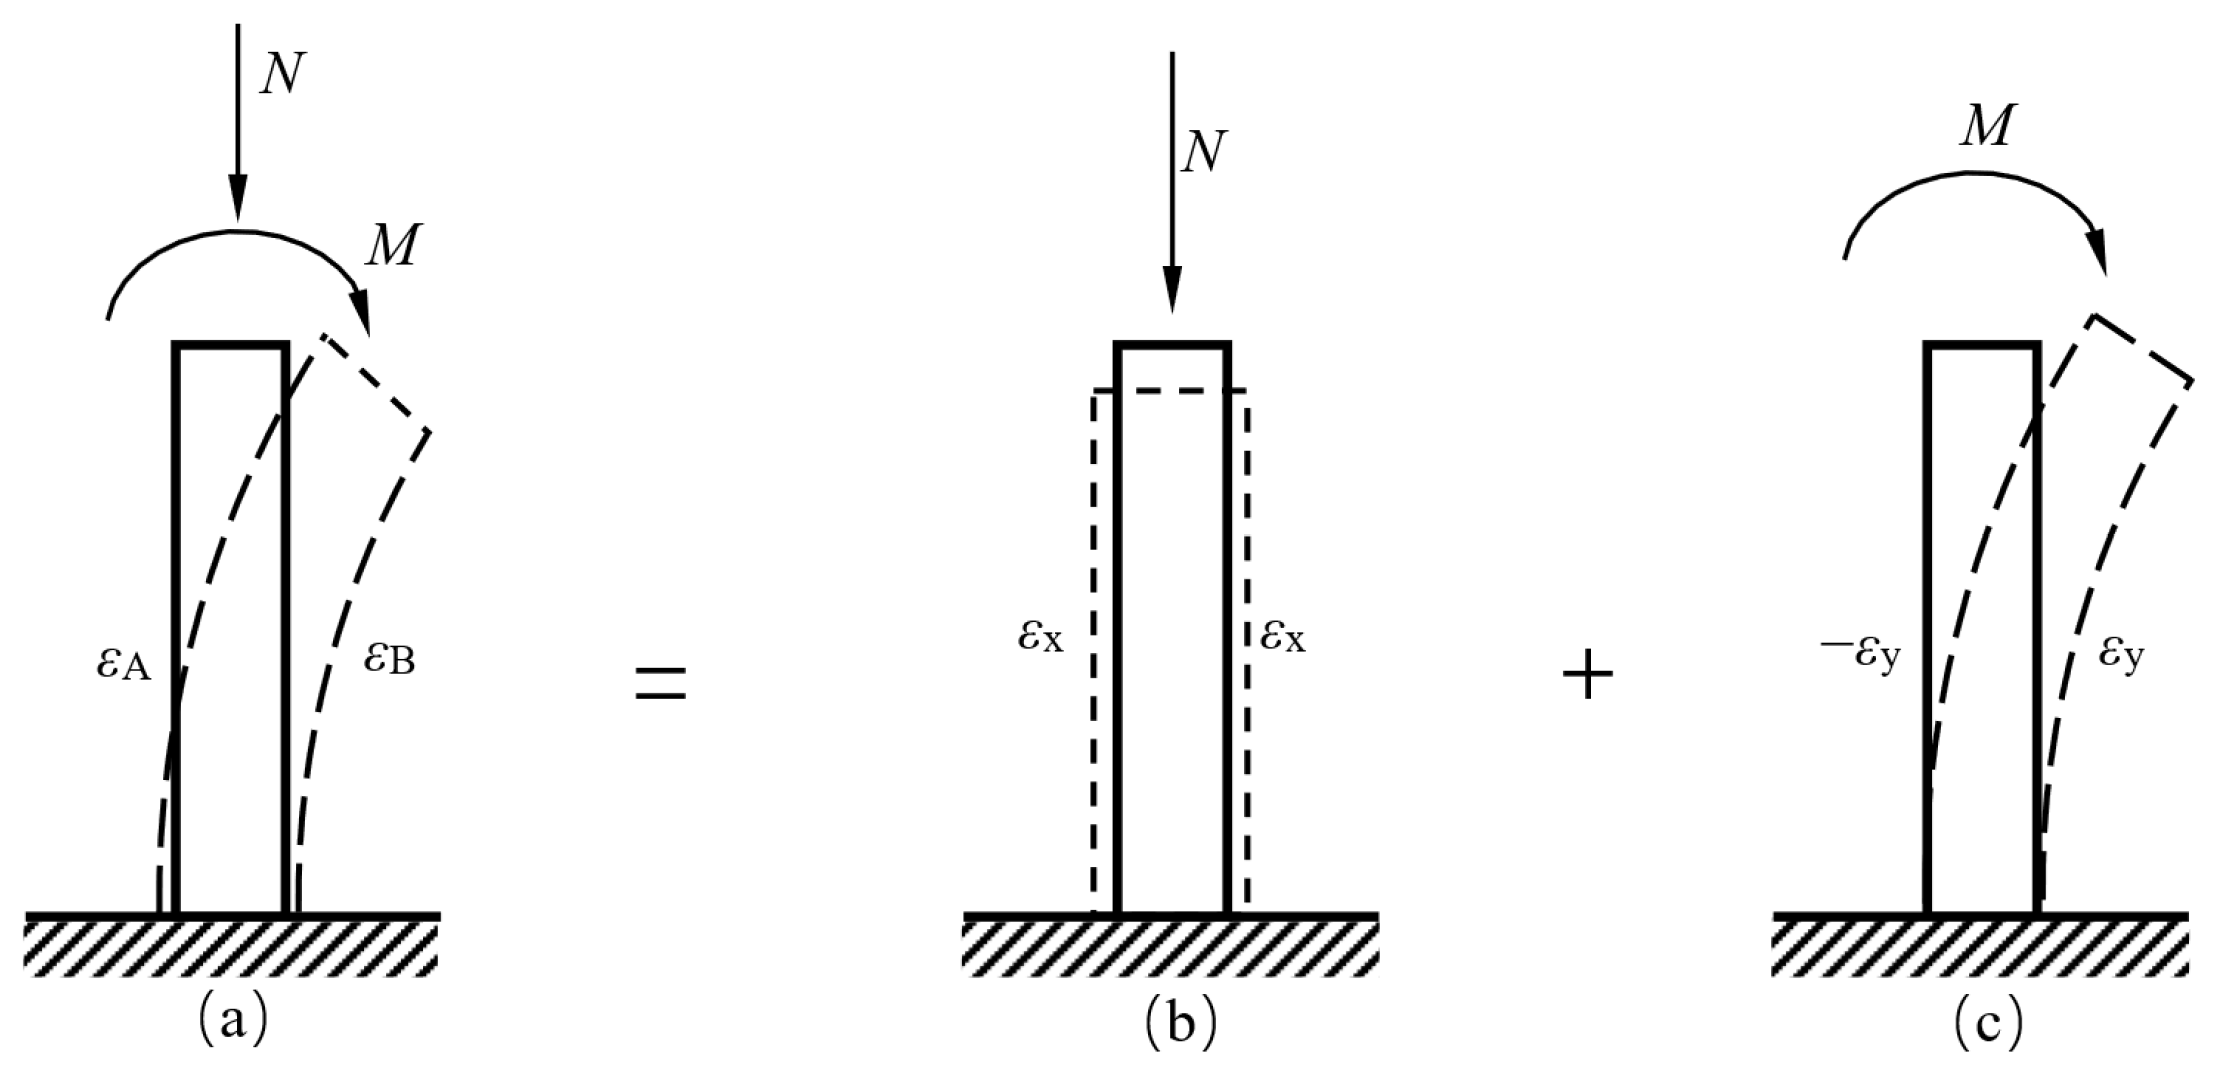
By selecting a cross-section of the inclined pile as the analytical subject, and simplifying it to a hollow cylindrical member as shown in Figure 29a, the section is subjected to a bending moment M and an axial force N. Under the combined action of these two loads, the member undergoes composite deformations, including axial compression (or tension) and bending deformation. Under the assumptions of linear elastic material behavior and small deformations, the stresses and deformations caused by the two types of loading can be calculated separately. The total stress and total strain on the cross-section can then be determined using the superposition principle. Specifically, the combined loading and deformation shown in Figure 29a can be decomposed into the superposition of the individual loading and deformation states illustrated in Figure 29b,c. Assume that the strains at the edge points on both sides of the cross-section under the combined action of bending moment M and axial force N are εA and εB, respectively. Under the axial force N alone, the cross-section develops a uniformly distributed axial strain εx. Under the bending moment M alone, the edge points on both sides of the cross-section experience strains equal in magnitude but opposite in direction, denoted as −εy and εy. Based on Hooke’s law and the superposition principle, the formula for calculating the combined deformation of the cross-section can be derived as follows:
ε A = ε x ε y
ε B = ε x + ε y
By combining Equations (3) and (4), the following can be derived:
ε x = ε A + ε B 2
ε y = ε A ε B 2
Based on Equations (5) and (6) and the relationships between bending moment, axial stress, and strain at each measurement point provided in Table 7, the strain values measured at the inclined pile monitoring points during excavation are converted into bending moment M and axial stress σ. The axial force N is derived from the uniformly distributed axial stress σ as N = σ·A, where A denotes the cross-sectional area of the inclined pile.

3.4.1. Bending Moment Distribution of Inclined Piles

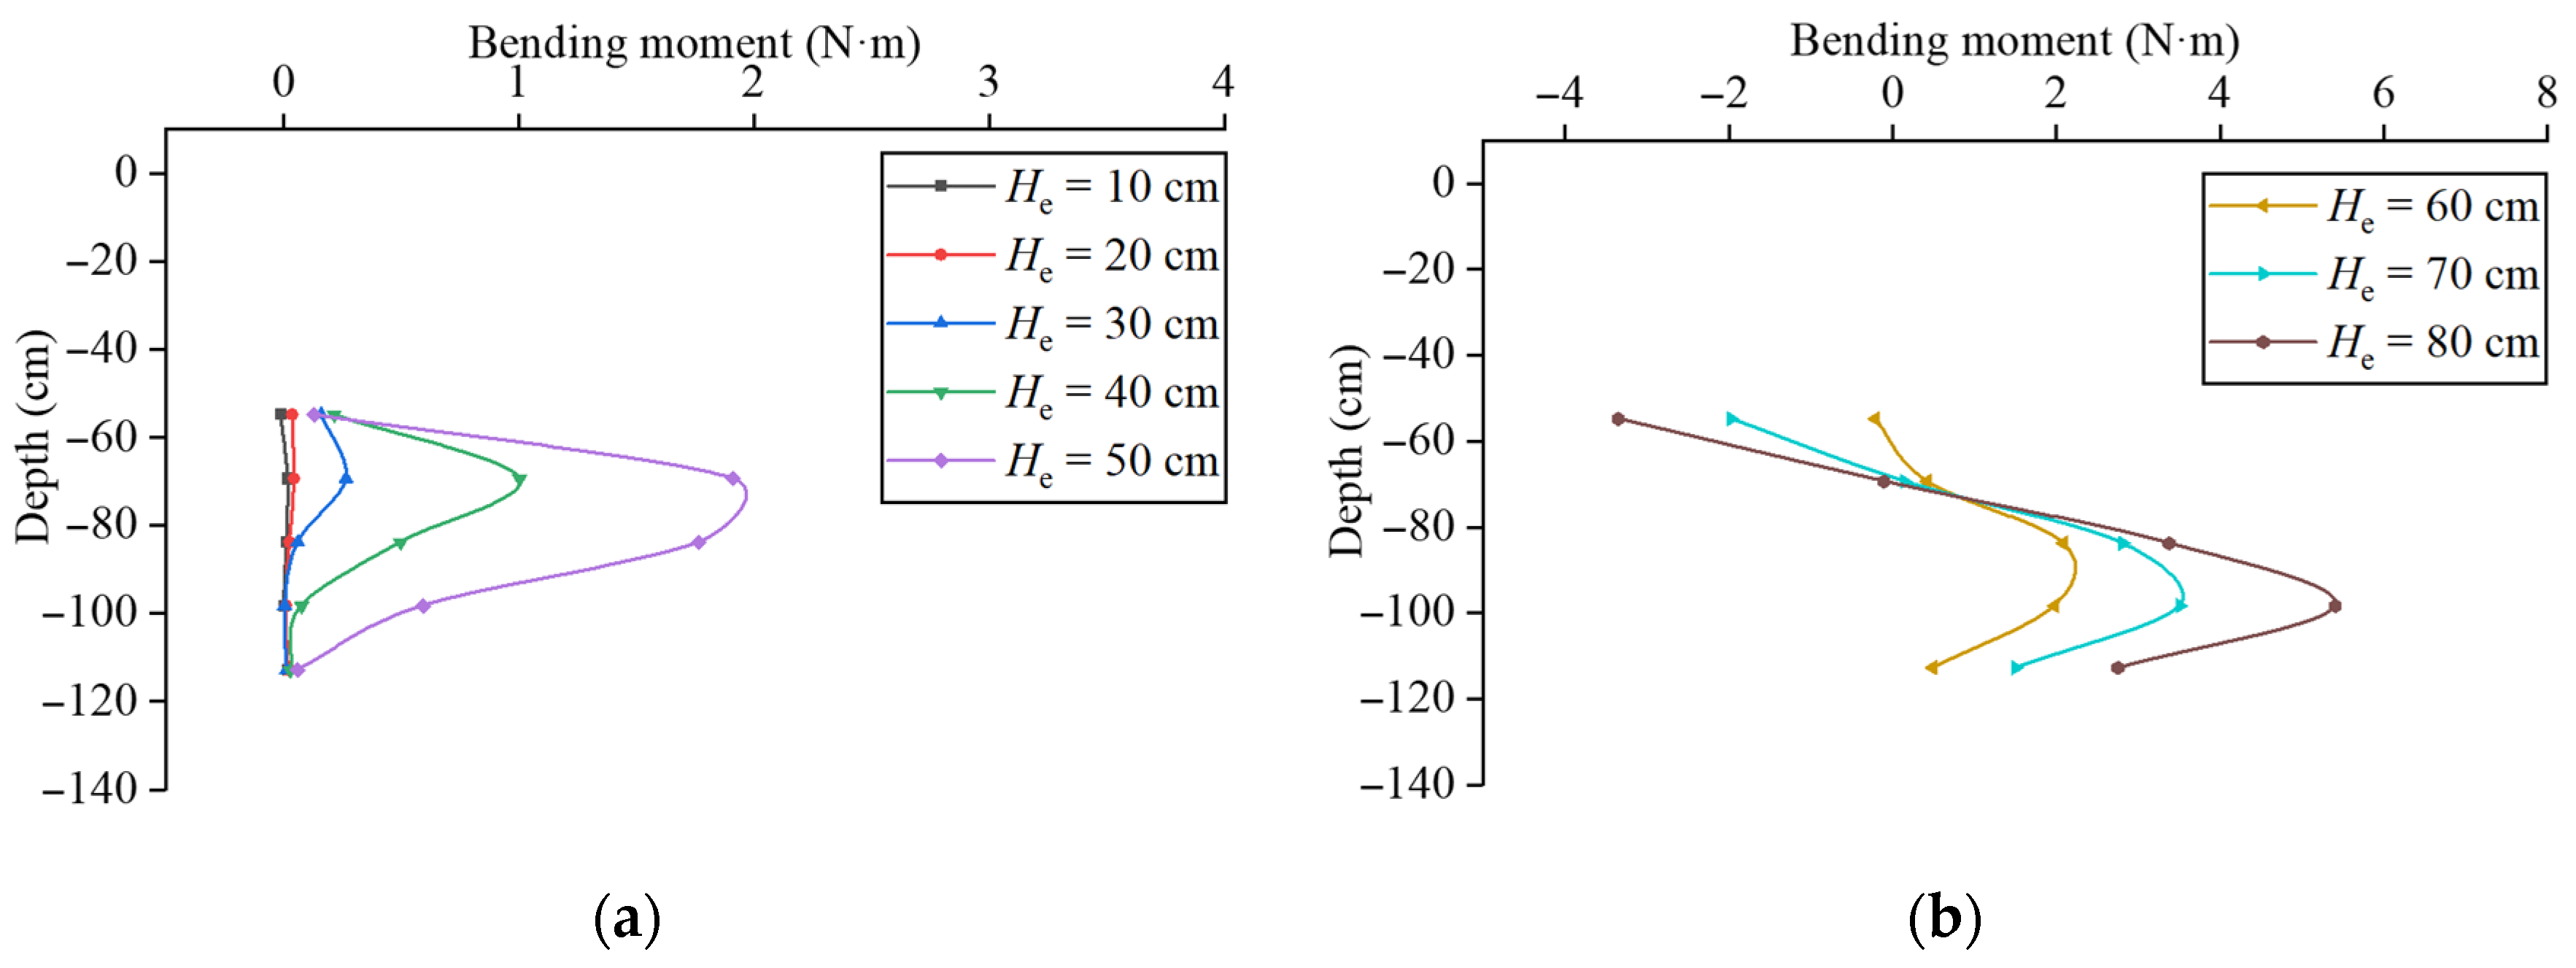
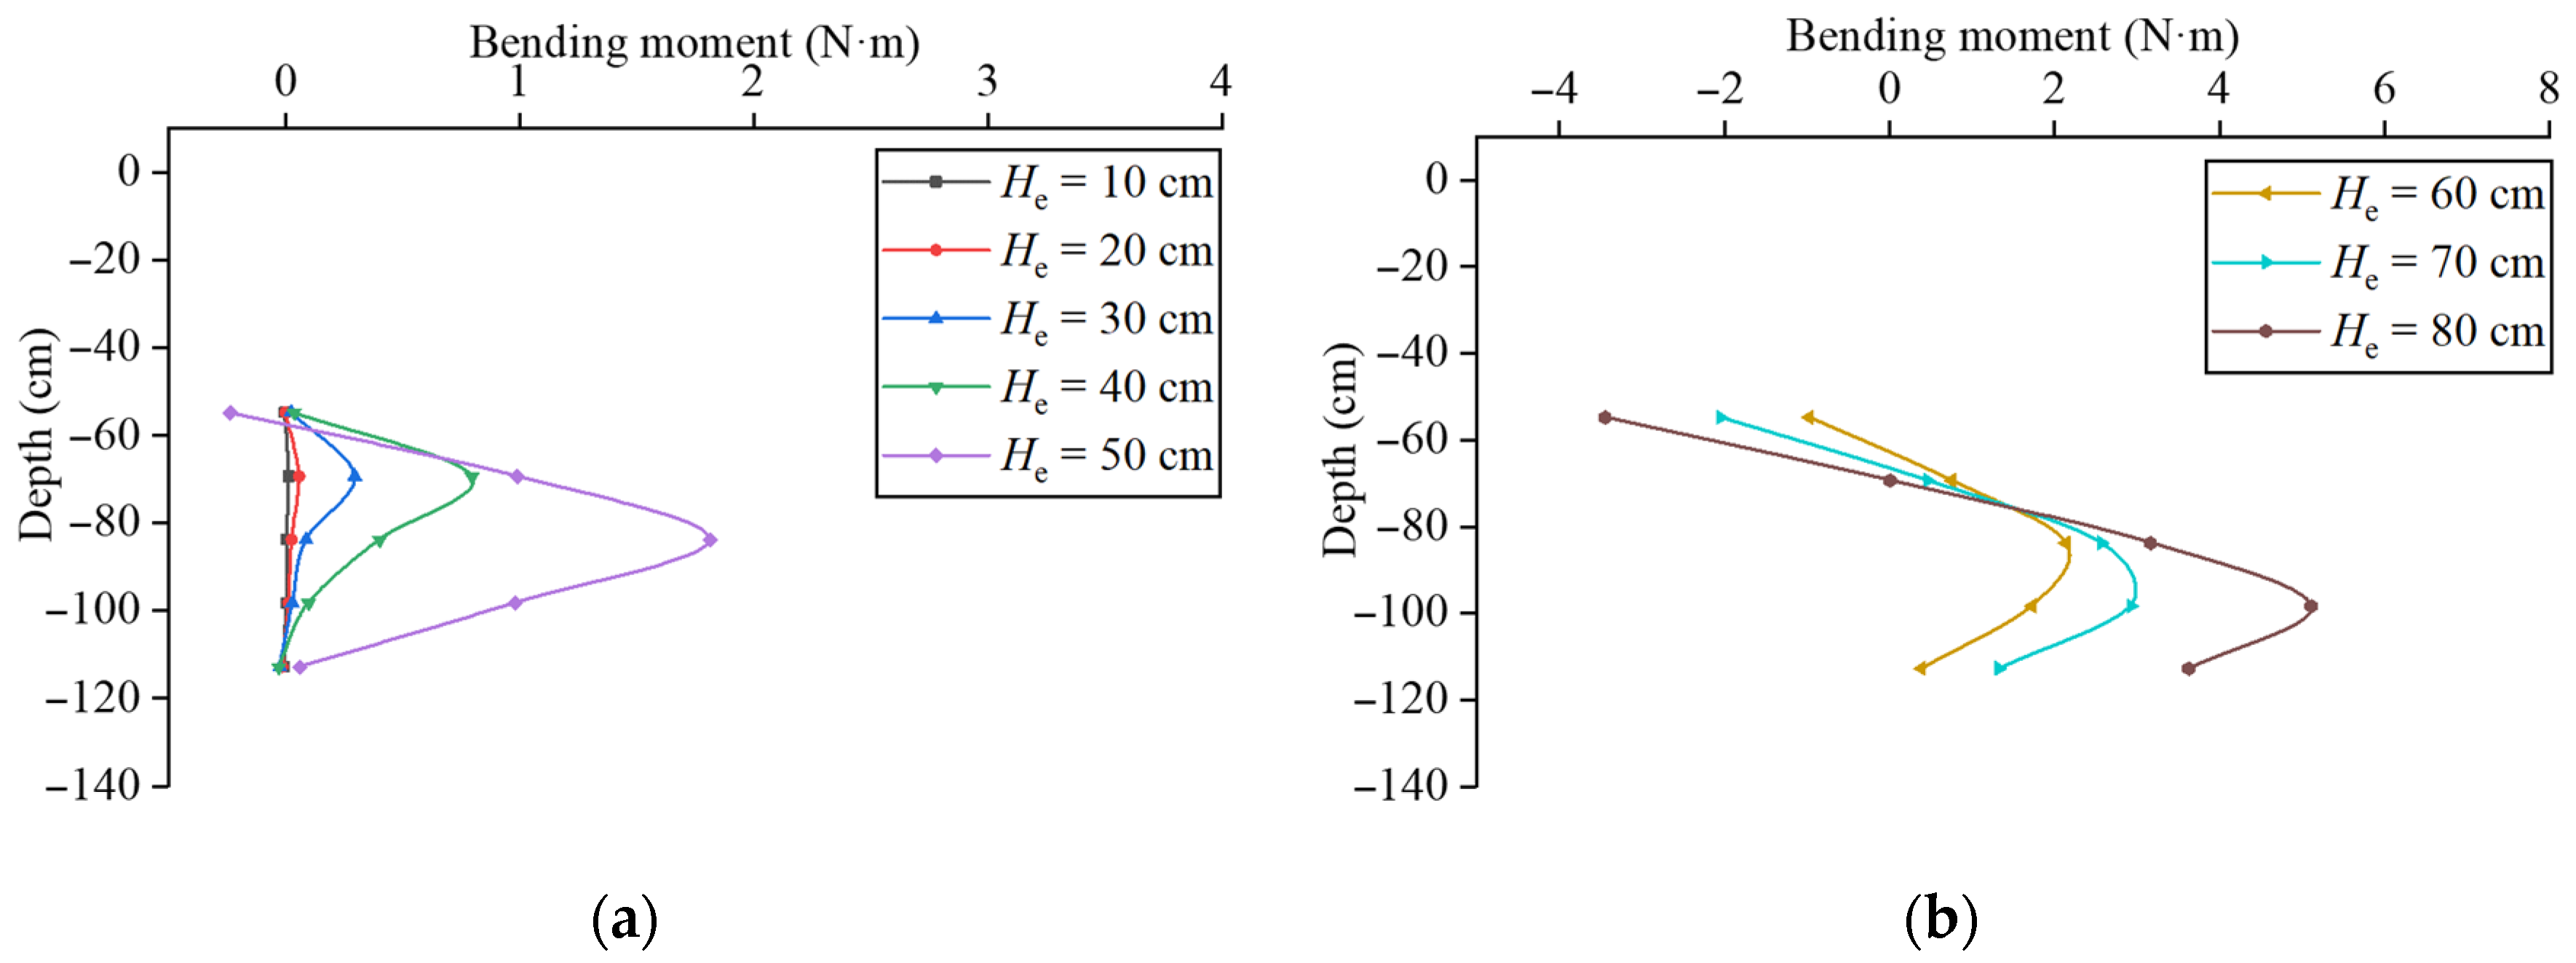
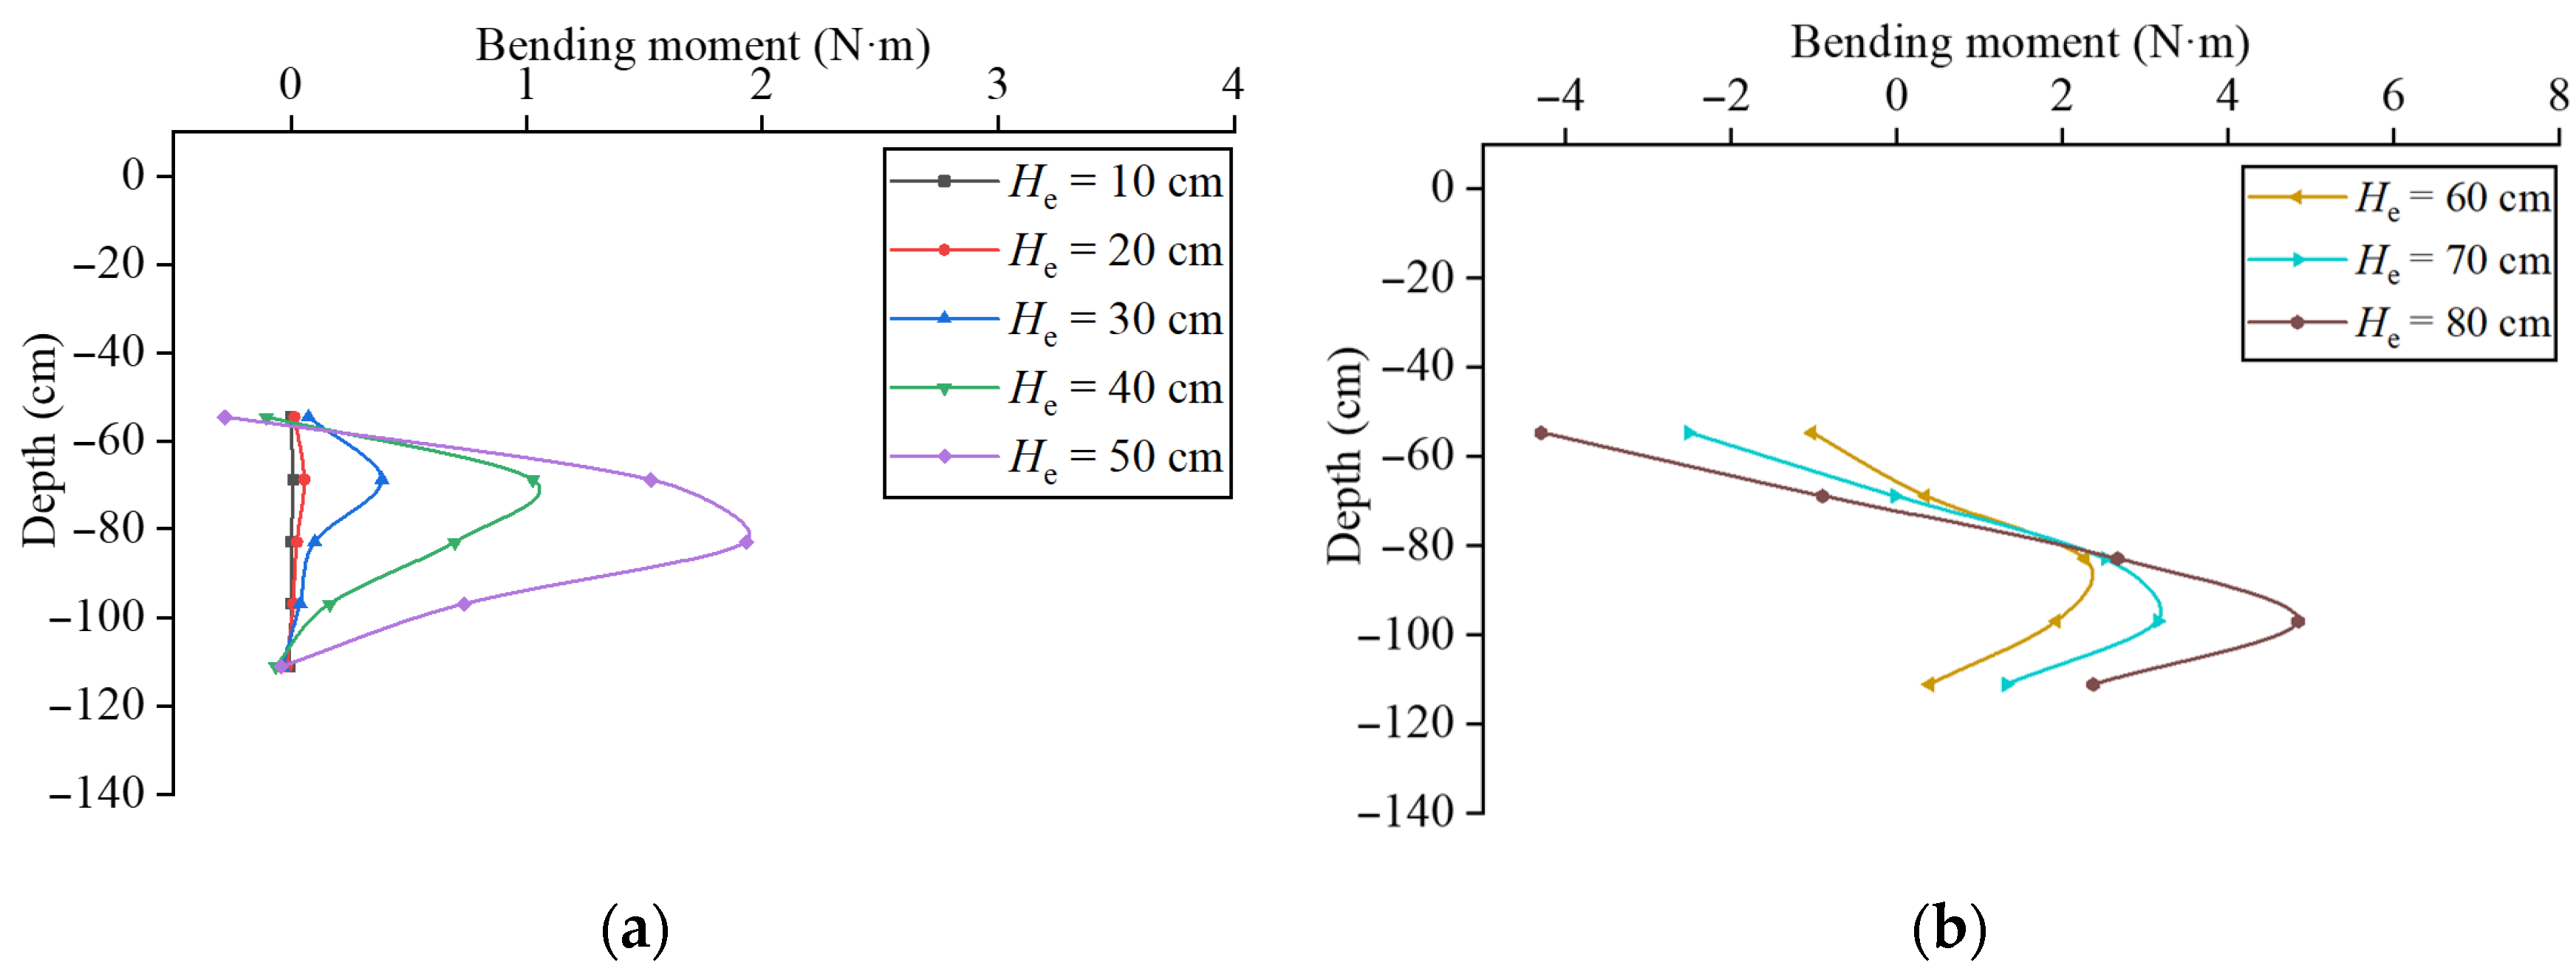
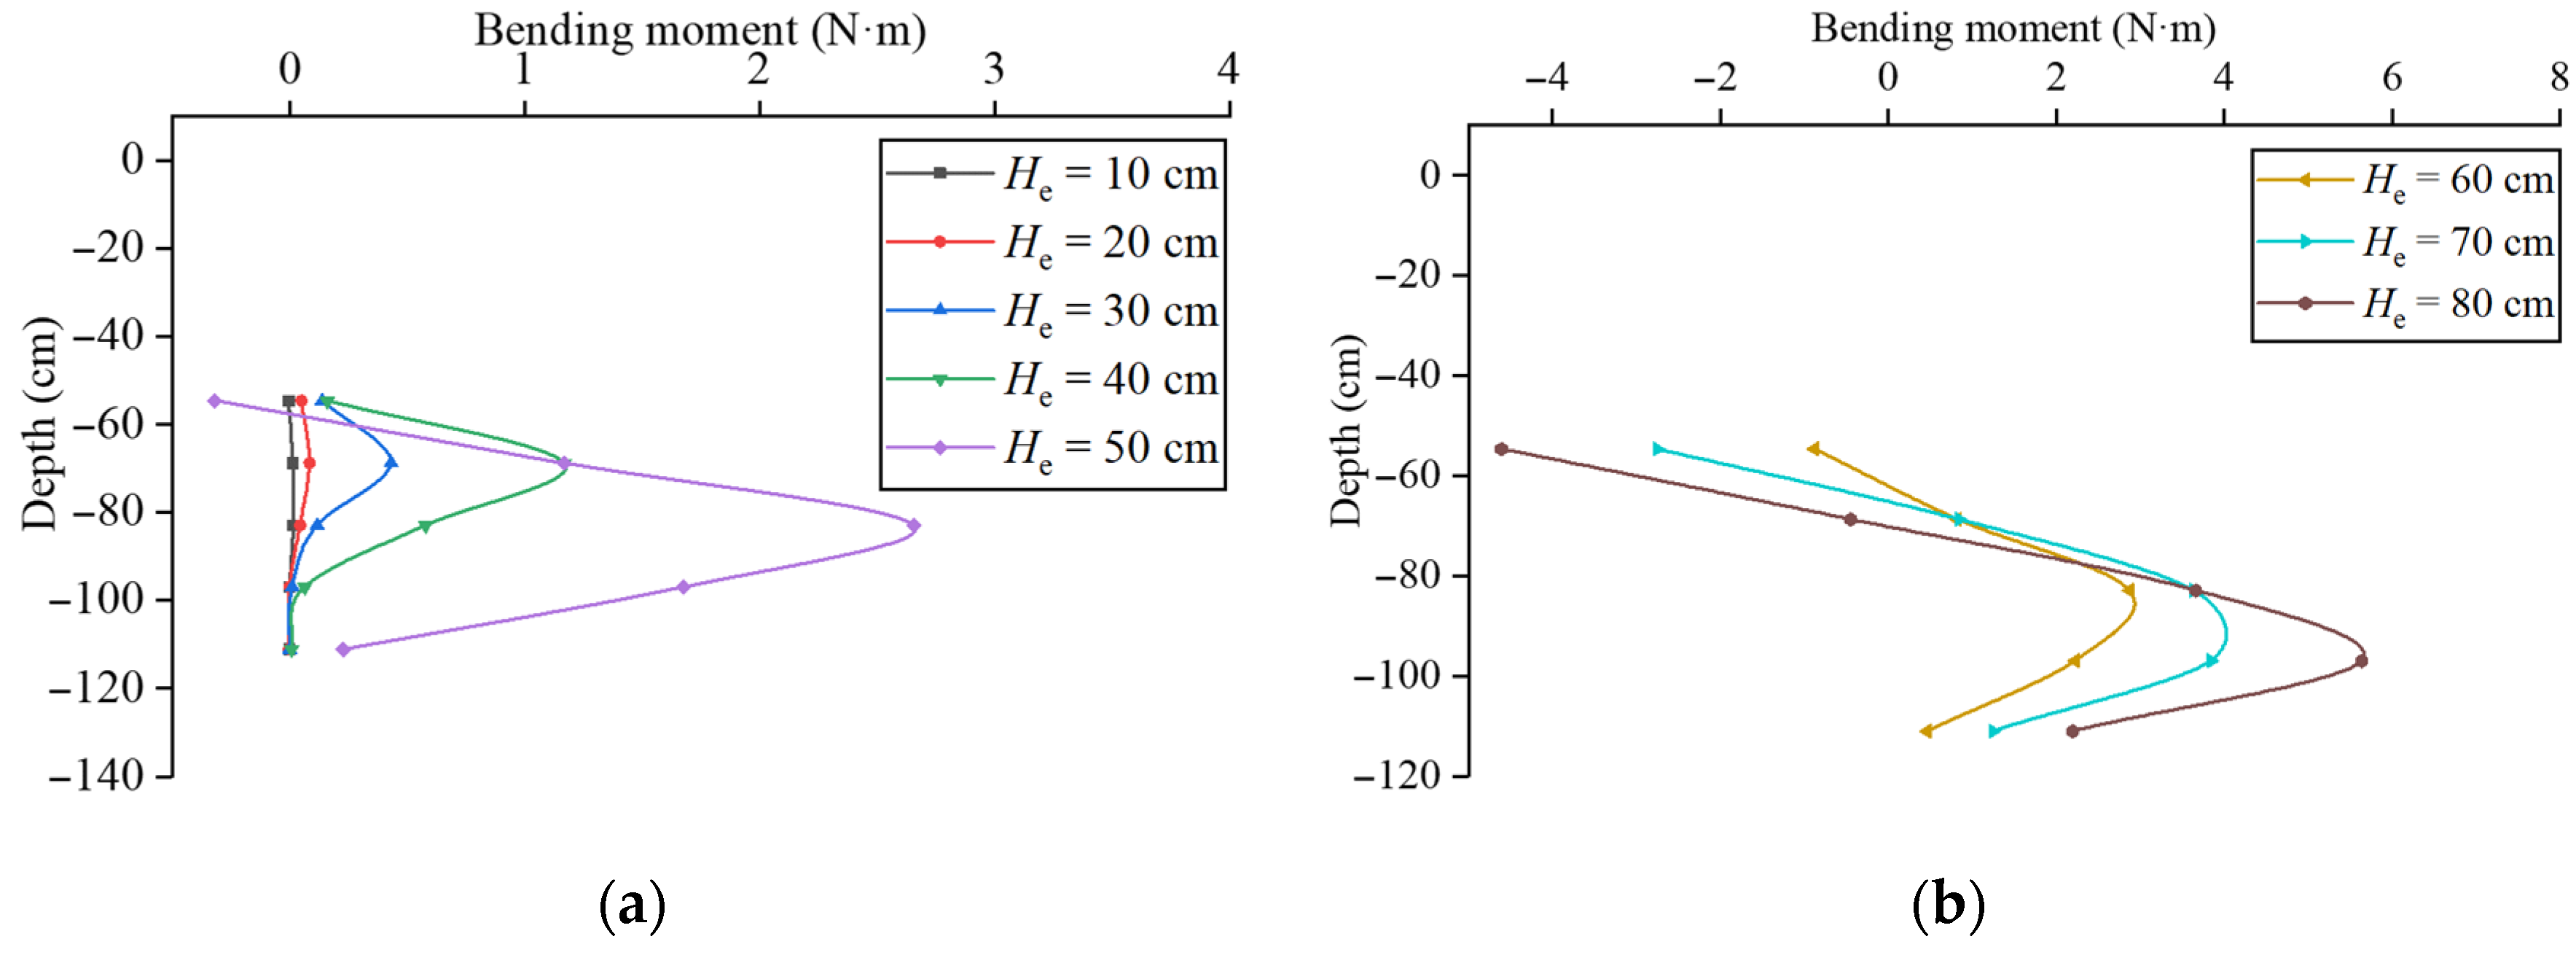
The bending moment distributions of the inclined piles in each test group during the excavation (He) are illustrated in Figure 30, Figure 31, Figure 32, Figure 33 and Figure 34. A positive bending moment is defined as tensile stress developing at the lower side of the pile cross-section. Figure 30a, Figure 31a, Figure 32a, Figure 33a and Figure 34a depict the variations in bending moment distributions of the inclined piles during the excavation of the soil layer from the ground surface to the wale. From the figures, it can be observed that during the shallow-soil excavation phase, although the pile head and wale are in a separated state with no load transfer, positive bending moments (tensile stress at the lower side) are still induced in the inclined piles. Furthermore, the bending moment magnitude gradually increases as the excavation depth progresses. The observed phenomenon arises due to excavation-induced stress relief, which triggers inward lateral compression of the retaining piles toward the pit. The compression is more obvious closer to the excavation face edges. Simultaneously, the unloaded soil at the pit bottom rebounds, with greater rebound deformation occurring closer to the excavation boundary. The inclined piles experience combined upward and inward compressive forces, where the compressive effect at the pile head exceeds that at the tip, inducing a tendency for upward rotation about the inclined pile. Soil resistance restricts this rotation, generating a bending moment that produces tensile stress on the lower side of the pile, resulting in an upward concave deformation profile. During excavation to the wale level, the maximum bending moments of the inclined piles reached approximately 2.0 N·m (except for group R5, which exhibited a lower value of 1.0 N·m), and no consistent pattern in bending moment variations was observed among the test groups.
During the excavation from the wale to the pit bottom, the tops of the inclined piles are connected to the wale, restricting the horizontal displacement of the vertical piles. Simultaneously, the vertical piles transmit loads through the wale, exerting compressive forces on the inclined piles. As shown in Figure 30b, Figure 31b, Figure 32b, Figure 33b and Figure 34b, as the excavation depth increases, the upper portion of the inclined piles develops progressively larger negative bending moments. Upon completion of excavation, the inclined piles exhibit an S-shaped deformation profile, characterized by an upward convex curvature in the upper segment and a downward convex curvature in the lower segment. This behavior stems from the combined effects of structural interactions and soil resistance. During soil excavation, the vertical piles undergo both flexural deformation and rotational displacement about a base pivot point, transmitting downward and inward loads to the inclined pile heads through the wale. The rigid connection between the inclined pile heads and the wale introduces additional bending moments from the wale’s moment couple. Under these loads, upward convex deformation (negative bending moments) initiates at the inclined pile head. As the bending moment propagates downward along the pile axis, the lever arm effect causes a gradual transition to positive bending moments. This transition reflects the dominant influence of the horizontal load component from the wale compared to the vertical component. Simultaneously, the embedded lower portion of the inclined piles is constrained by lateral soil resistance, generating downward convex deformation (positive bending moments). This dual deformation mechanism—upward curvature at the top and downward curvature at the base—creates a self-stabilizing S-shaped bending moment distribution. The positive moments at the pile tip counteract rotational tendencies induced by horizontal loads, ensuring global stability without overturning.
Table 8 lists the maximum negative bending moments of the inclined piles in groups R1–R5 after the inclined pile takes effect, and Table 9 details the maximum positive bending moments. It can be seen from Table 8 that, among the five test groups, the maximum negative bending moments at the pile heads during the excavation from the wale to the pit bottom (80 cm depth) exhibited incremental absolute values, ranked as ΔMR5 (−2.14 N·m) < ΔMR2 (−3.20 N·m) < ΔMR1 (−3.48 N·m) < ΔMR3 (−4.02 N·m) < ΔMR4 (−4.28 N·m). It can be seen from Table 9 that the maximum positive bending moments occurred at 18.30 cm below the pit bottom (20.85 cm for group R5), with incremental magnitudes ascending as ΔMR4 (3.96 N·m) < ΔMR3 (4.11 N·m) < ΔMR2 (4.13 N·m) < ΔMR5 (4.45 N·m) < ΔMR1 (4.81 N·m). From the data above, it can be observed that raising the support elevation of inclined piles (R5) effectively reduced negative bending moments at the pile head but amplified positive bending moments along the shaft. In group R2, the extended inclined pile length enhanced passive soil reinforcement, mitigating negative bending moments at the head while increasing positive moments along the shaft due to greater soil resistance. For group R3, the larger inclination angle enlarged the lever arm of vertical force components from both the wale and pit bottom soil, intensifying both negative bending moments at the head and positive bending moments along the shaft. Conversely, group R4, with longer vertical piles, exhibited the largest negative bending moment at the head and lower positive bending moments than group R1, demonstrating that increasing the vertical pile length can modify the bending moment distribution of the inclined piles to some extent.
It can be seen from the above analysis that adjusting the geometric parameters of VIPWs—such as raising the support position of inclined piles, extending the embedded depth of inclined piles, and increasing the inclination angle of inclined piles—can effectively reduce foundation pit deformation. However, this adjustment will increase the bending moment borne by the inclined piles. Additionally, increasing the embedded depth of vertical piles can modify the bending moment distribution of inclined piles.

3.4.2. Axial Force Distribution of Inclined Piles

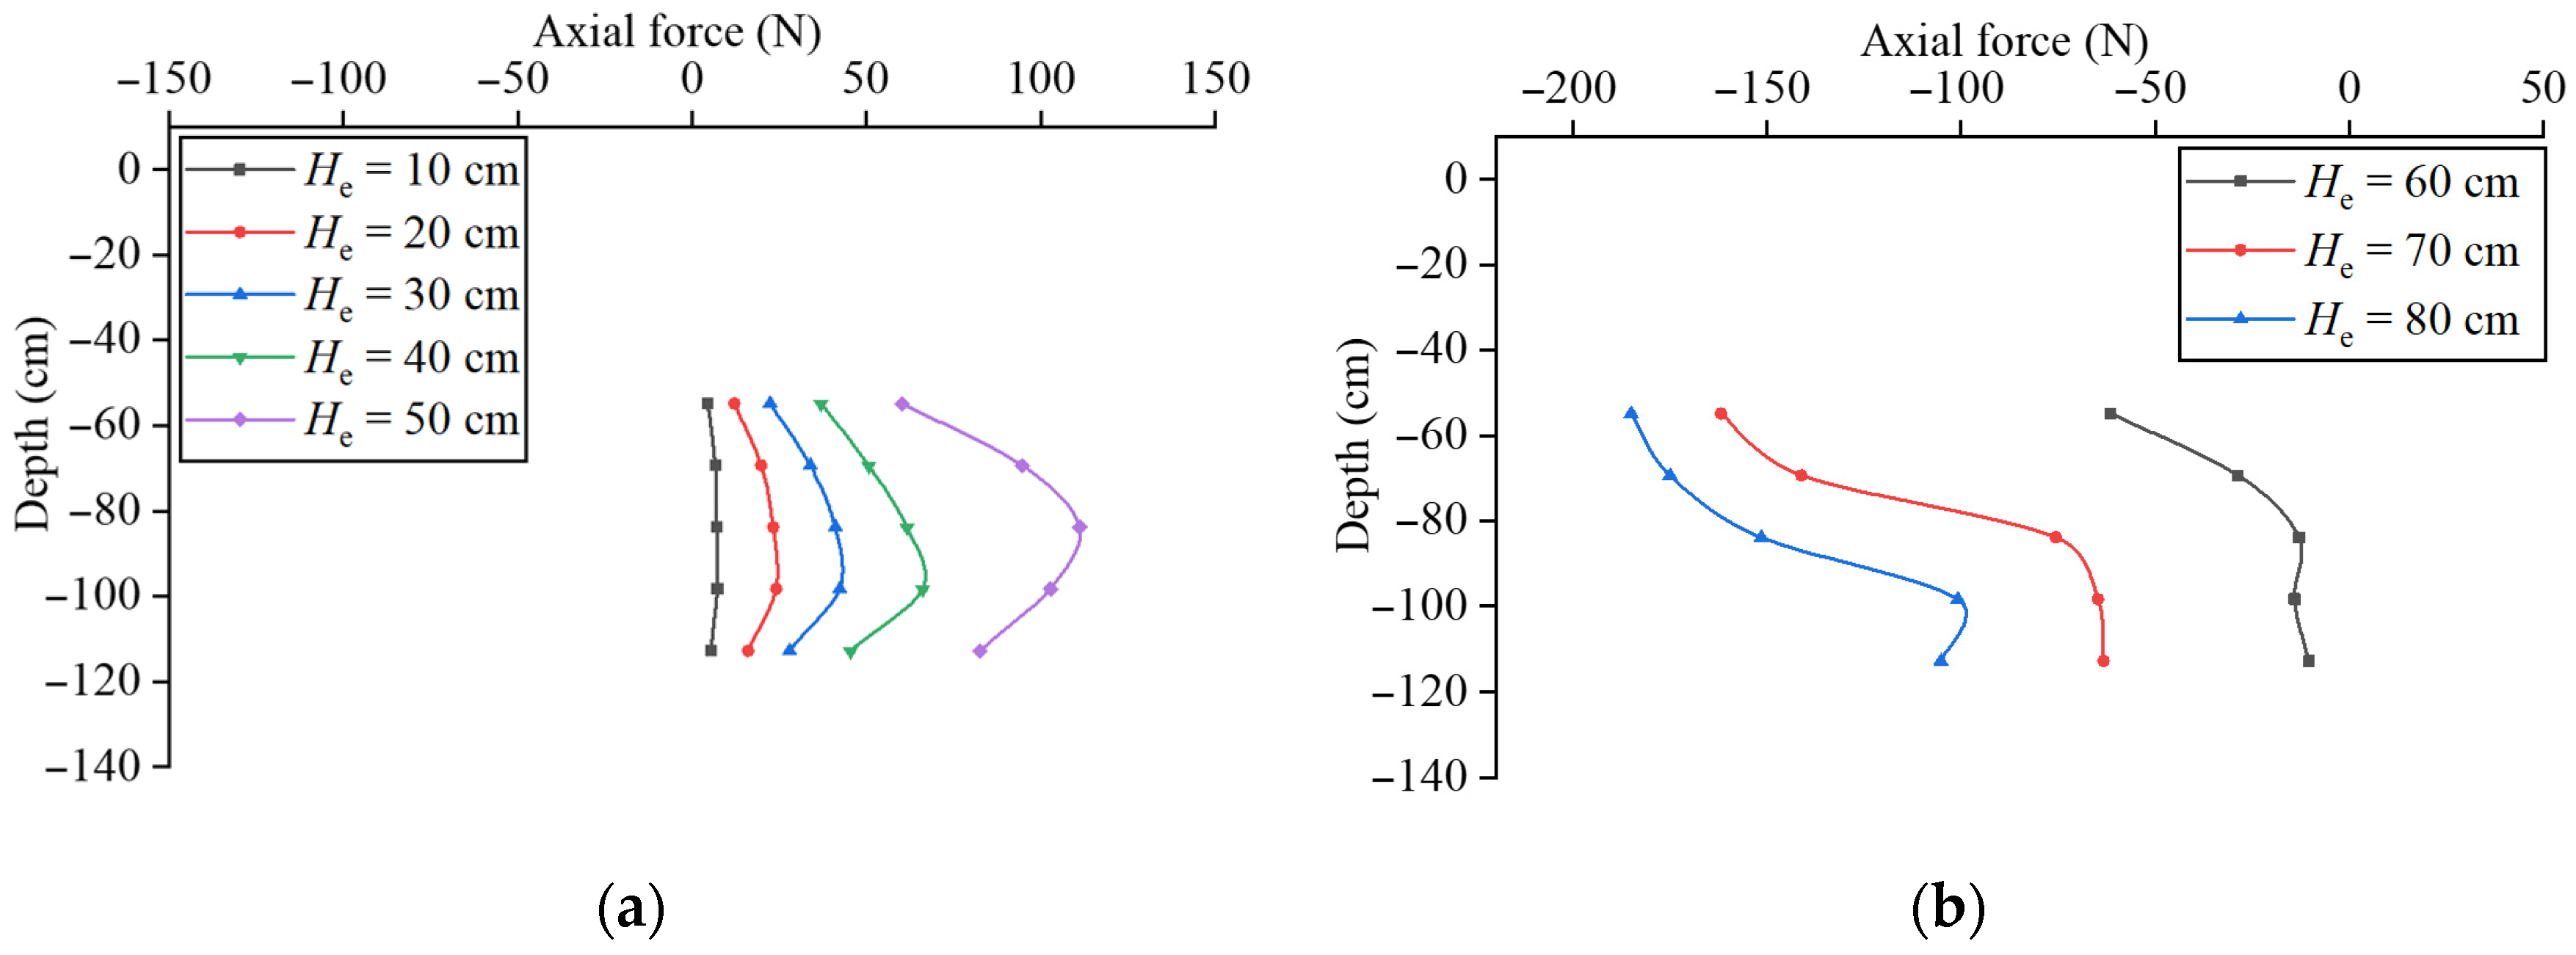
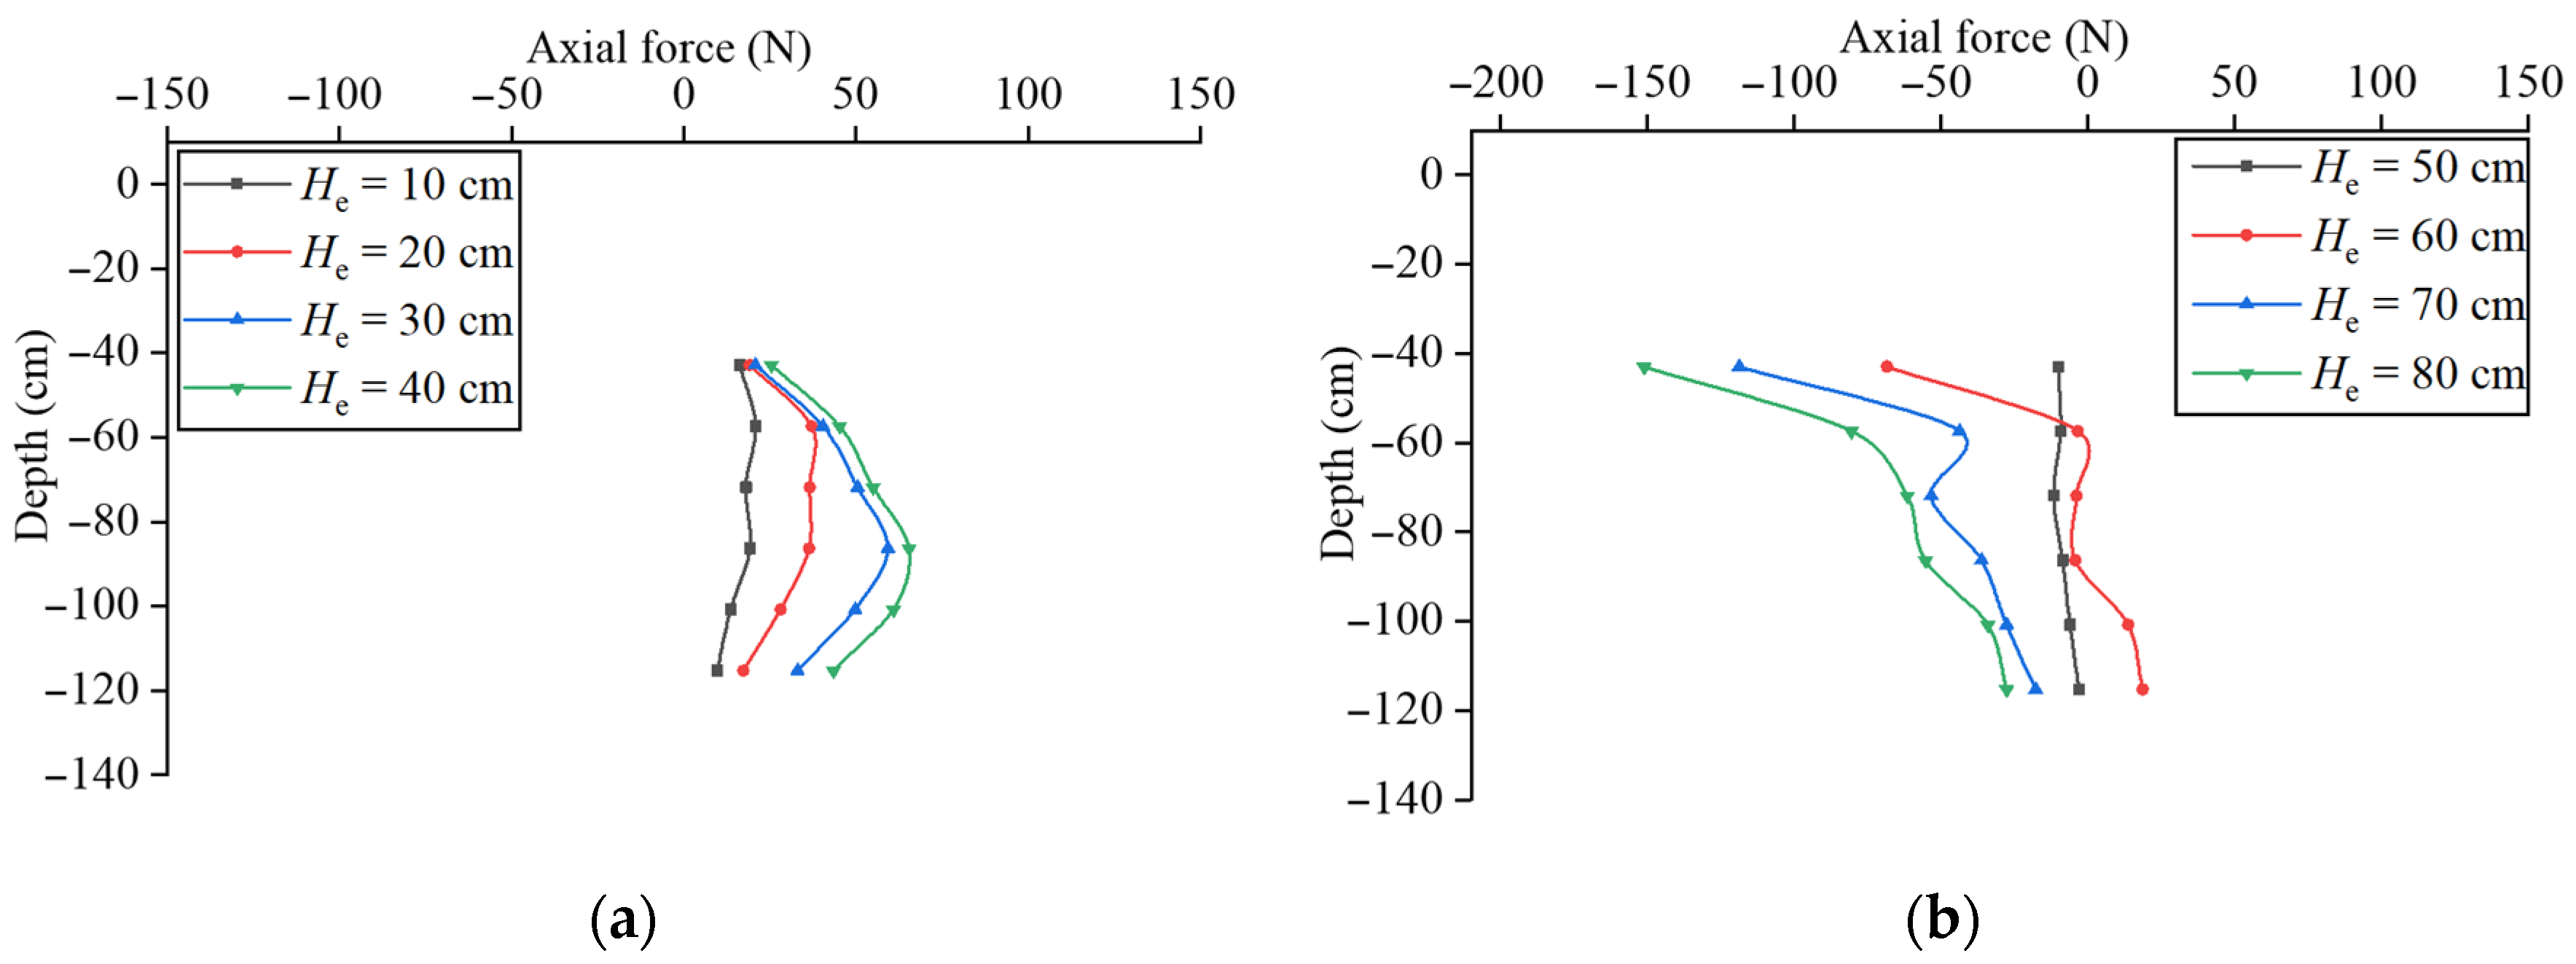
Figure 35, Figure 36, Figure 37, Figure 38 and Figure 39 show the axial force distribution of the inclined piles in each test group during the excavation process, with tensile axial force defined as positive. Here, He denotes the excavation depth. Figure 35a, Figure 36a, Figure 37a, Figure 38a and Figure 39a depict the variations in axial force distributions of the inclined piles during the excavation of the soil layer from the ground surface to the wale. As can be seen from the figures, during the excavation of the shallow soil layer, although the top of the inclined pile is separated from the wale with no load transfer occurring, the inclined pile is still subjected to axial tension. Moreover, this axial tension gradually increases as the excavation depth increases. The reason for this phenomenon is that, due to the unloading caused by excavation, the soil layer below the excavation surface undergoes rebound deformation, generating an upward frictional force along the side of the inclined pile. This drives the inclined pile toward the excavation surface. The rebound deformation is more pronounced in areas closer to the excavation surface, resulting in greater displacement at the top of the inclined pile compared to the tip, thereby subjecting the pile to axial tension. Simultaneously, the inclined pile itself rebounds due to the reduction in overburden pressure from the soil, leading to tensile strain. According to the stress–strain relationship, this is equivalent to the inclined pile being subjected to axial tension.
To analyze the variation law of the axial force of inclined piles after they are supported on the wale, a study was conducted on the variation law of the axial force of inclined piles during the process of excavating from the wale to the pit bottom in each group of tests, as shown in Figure 35b, Figure 36b, Figure 37b, Figure 38b and Figure 39b. It can be observed from the figures that in different groups the axial force of the inclined piles gradually decreases from the excavation surface to the tip of the piles, which is consistent with the axial force distribution characteristics of building pile foundations. Furthermore, as the excavation depth increases, the axial force of the inclined piles gradually increases.
Table 10 lists the increase in the inclined piles’ maximum axial force in groups R1–R5 after the inclined pile takes effect. When excavated to a depth of 80 cm, the axial loads at the tops of the inclined piles in each group are 194.19 N (R1), 193.52 N (R2), 170.79 N (R3), 185.00 N (R4), and 150.96 N (R5), respectively. When arranged in ascending order of magnitude, they follow the sequence: ΔNR5 < ΔNR3 < ΔNR4 < ΔNR2 ≈ ΔNR1. The axial load of the inclined pile in group R5 is the smallest. In group R3, as the inclination angle of the inclined pile increases, its horizontal component force increases. Therefore, the axial force it bears is smaller when the same supporting effect is achieved. For group R4, owing to the greater embedded depth of the vertical pile, its deformation resistance is enhanced to some extent. Hence, compared with group R1, the axial force of its inclined pile is slightly smaller. The axial forces of the inclined piles in group R1 and group R2 are approximately equal.
From the above analysis, it can be concluded that in the early stage of excavation, the pre-embedded inclined piles are affected by the unloading deformation of the soil layer at the pit bottom, thus generating a certain amount of tensile force. During the excavation process from the wale to the soil layer at the pit bottom, the axial forces of the inclined piles vary to a certain extent due to the different geometric forms of the herringbone retaining structure. Among these influencing factors, increasing the support position of the inclined piles enables the inclined piles to take effect in advance, resulting in a relatively smaller axial force. Additionally, increasing the inclination angle of the inclined piles can also reduce their axial force.

3.5. Unstable Failure Analysis

The previous analysis shows that in group R0, the deformation of the foundation pit increased significantly when the soil layer was excavated to a depth of 60–70 cm, and a sudden change occurred when the excavation depth reached 70–80 cm. As can be seen in Figure 24b, when the foundation pit in group R0 was excavated to a depth of 80 cm, obvious sliding steps appeared on the ground surface. This indicates that the foundation pit suffered instability failure, and its safety could not be guaranteed. In groups R1–R5, the deformation of the foundation pit was significantly smaller than that in group R0, and no sudden deformation phenomenon occurred. To further study the effect of the VIPW, the lateral deformation of each group during the excavation from 50 cm to 80 cm is analyzed. Due to space limitations, Figure 40 and Figure 41 only present the side-face photos of group R0 and group R5 at different excavation depths, illustrating their lateral deformation conditions (the deformation patterns of groups R1–R4 are similar to that of group R5).
As can be seen from Figure 40c, when the foundation pit is excavated to a depth of 70 cm, discontinuous sliding failure surfaces appear in the lateral soil of group R0 (as indicated by the red dashed lines in the figures, the same below). This indicates that the foundation pit has a tendency to undergo instability failure at this point, that is, under the action of the cantilever supporting structure, the ultimate excavation depth of the foundation pit was less than 70 cm. As can be seen from Figure 40d, when the foundation pit is excavated to a depth of 80 cm, two continuous sliding failure surfaces appeared in the soil on the side. The sliding surfaces are approximately triangular, which is consistent with the sudden change in deformation shown in Figure 21 and Figure 23. At this point, the foundation pit undergoes instability failure. The angle between the sliding surface and the horizontal plane is approximately 68.5°, which is slightly larger than the theoretical value of the sliding surface inclination angle of the soil layer under the active limit state (45 + φ/2 = 64.4°). This phenomenon may be caused by factors such as the friction at the pile–soil interface and the friction between the side wall of the model box and the soil layer. As can be seen from Figure 41d, when the foundation pit is excavated to a depth of 80 cm, no sliding failure surface appears in the soil. This indicates that under the action of the VIPW structure, the ultimate excavation depth of the foundation pit is greater than 80 cm.
In summary, under the action of VIPW structures, the excavation depth of foundation pits can be increased while ensuring safety and stability, and their supporting effect is far better than that of cantilever supporting structures.

4. Conclusions

Large-scale physical model tests were conducted to investigate the deformation and mechanical characteristics of soldier pile walls (SPWs) and vertical–inclined pile walls (VIPWs) for foundation pits, focusing on the influence of the geometric parameters of the support structures and revealing the action mechanism and stability-maintaining effect of the VIPW. The main conclusions of the research are summarized below.
(1) Compared with the SPW, the VIPW significantly reduces the lateral deformation, ground surface settlement of the foundation pit, and the maximum bending moment of vertical piles. Specifically, the maximum lateral deformation, ground surface settlement and bending moment of the optimal VIPW (group R5) are only 5.76%, 14.1%, and 17.4% those of the SPW (group R0), respectively. Additionally, the VIPW allows a stable excavation depth exceeding 80 cm without sliding failure surfaces in the surrounding soil, whereas the SPW generates discontinuous sliding surfaces at 70 cm excavation depth, demonstrating superior stability with the VIPW.
(2) In terms of deformation control (including lateral deformation and surface settlement), the deformation control performance of each test group follows the order R5 < R2 < R3 < R4 ≤ R1. The results indicate that appropriately adjusting the inclined pile support position can significantly reduce structural deformation. Moreover, increasing the embedded depth or inclination angle of inclined piles can also effectively restrain deformation. However, increasing the length of vertical piles (corresponding to group R4) exerts no significant effect on deformation reduction. The variation pattern of the maximum bending moment of vertical piles is consistent with that of deformation control, whereas the maximum bending moment in group R4 is greater than that in the other groups.
(3) In all test groups, the ranking of the maximum negative bending moment of the inclined piles is R5 < R2 < R1 < R3 < R4, while that of the maximum positive bending moment is R4 < R3 < R2 < R5 < R1. The axial force at the top of the inclined piles follows the order R5 < R3 < R4 < R2 < R1. Owing to the combined effects of the strain gauge layout on both sides of the inclined piles, as well as accidental disturbances and measurement errors in the experiments, the theoretical internal forces of the inclined piles do not present the expected regularity. Improvements in the experimental and measurement methods will be implemented in future research. Nevertheless, a clear conclusion can be drawn: raising the support position of the inclined piles can effectively reduce their internal force.
(4) Compared with existing inclined-pile retaining systems (e.g., SPW, IFRW, and IVFRW), the VIPW structure allows priority to be given to optimizing the layout position of the inclined piles, thereby achieving deformation control and reducing internal forces in the supporting structure. Meanwhile, the inclination angle and length of the inclined piles can also be optimized accordingly. Increasing the length of the vertical piles may not only fail to achieve the expected deformation control effect but also increase the maximum bending moment of the vertical piles, thus imposing higher requirements on structural reinforcement and bearing capacity design.
(5) Several limitations exist in this study: standard sand was adopted without considering the effects of cohesive soil, which is widely encountered in practical engineering, and variations in soil moisture content on the mechanical behavior and deformation of the retaining structure; the spatial constraint effect was not fully considered in the test; and certain deficiencies exist in the methods used for deformation monitoring and internal force measurement of the supporting structure, which may compromise the accuracy and completeness of the monitored data. In future research, centrifugal model tests will be conducted, and soil samples retrieved from actual engineering sites will be used in order to maximize the consistency between the model and real geological conditions. In addition, the techniques for deformation and internal force measurement will be further optimized. These improvements are expected to provide a reliable experimental scheme for further revealing the working mechanism of VIPWs, offering a theoretical basis and technical reference for the optimal design of VIPW retaining structures in engineering practice.

Author Contributions

Conceptualization, H.Y. and Y.Z. (Yapeng Zhang); methodology, Y.Z. (Yapeng Zhang); validation, H.Y., Y.Z. (Yapeng Zhang) and Y.Z. (Yun Zheng); resources, Y.Z. (Yun Zheng); data curation, H.Y.; writing—original draft preparation, H.Y.; writing—review and editing, H.Y. and Y.Z. (Yapeng Zhang); visualization, C.S.; supervision, D.X.; funding acquisition, C.S. and D.X. All authors have read and agreed to the published version of the manuscript.

Funding

This research was funded by the Open Fund of State Key Laboratory of Geohazard Prevention and Geoenvironment Protection, grant number SKLGP2024K025 and the Natural Science Foundation of Wuhan, grant number 2025040601020179.

Data Availability Statement

The data that support the findings of this study are available from the corresponding author upon reasonable request.

Acknowledgments

The authors acknowledge the support from the following institutions: (1) Zhejiang Engineering Research Center of Digital Highway Applied Technology, Zhejiang Institute of Communications; (2) Construction Engineering School, Zhejiang College of Construction; and (3) State Key Laboratory of Geomechanics and Geotechnical Engineering Safety, Institute of Rock and Soil Mechanics, Chinese Academy of Sciences.

Conflicts of Interest

The authors declare that they have no known competing financial interests or personal relationships that could have appeared to influence the work reported in this paper.

References

  1. Zeng, F.Y.; Zhang, Z.J.; Wang, J.H.; Li, M.G. Observed performance of two adjacent and concurrently excavated deep foundation pits in soft clay. J. Perform. Constr. Facil. 2018, 32, 04018040. [Google Scholar] [CrossRef] [Scilit]
  2. Zhang, W.; Zhang, R.; Wang, W.; Zhang, F.; Goh, A.T.C. A multivariate adaptive regression splines model for determining horizontal wall deflection envelope for braced excavations in clays. Tunn. Undergr. Space Technol. 2019, 84, 461–471. [Google Scholar] [CrossRef] [Scilit]
  3. Wu, G.; Tan, Y.; Zeng, J.; Zheng, J.; Zhang, R.; Liu, Y.; Yue, S.L. Laboratory tests of an eccentrically loaded strip footing above single underlying void. J. Build. Eng. 2025, 111, 113211. [Google Scholar] [CrossRef] [Scilit]
  4. Öser, C.; Sayin, B. Geotechnical assessment and rehabilitation of retaining structures collapsed partially due to environmental effects. Eng. Fail. Anal. 2021, 119, 104998. [Google Scholar] [CrossRef] [Scilit]
  5. Zhuang, Y.; Cui, X.; Hu, S. Numerical simulation and simplified analytical method to evaluate the displacement of adjacent tunnels caused by excavation. Tunn. Undergr. Space Technol. 2023, 132, 104879. [Google Scholar] [CrossRef] [Scilit]
  6. Zheng, G.; Lei, Y.W.; Cheng, X.S.; Li, X.Y.; Wang, R.Z. Experimental study on progressive collapse mechanism in braced and tied-back retaining systems of deep excavations. Can. Geotech. J. 2021, 58, 540–564. [Google Scholar] [CrossRef] [Scilit]
  7. Zhang, W.; Heng, C.; Xu, C.; Zhou, Z.; Mao, L. Research on Support Technology of a soil-rock combination deep excavation in Qingdao. KSCE J. Civ. Eng. 2024, 28, 3208–3223. [Google Scholar] [CrossRef] [Scilit]
  8. Su, T.; Zhou, Y.; Wang, Z.; Ye, S. Large scale model test study of foundation pit supported by pile anchors. Appl. Sci. 2022, 12, 9792. [Google Scholar] [CrossRef] [Scilit]
  9. Sun, C.; Chen, C.; Liu, C.; Zheng, Y.; Xia, K.; Fan, K.; Zhang, H. Dynamic response analysis of concealed bedding rock slopes using discrete element method. Eng. Anal. Bound. Elem. 2026, 182, 106555. [Google Scholar] [CrossRef] [Scilit]
  10. Sun, C.; Liu, C.; Yuan, J. Mechanical behavior analysis of fully grouted bolts under shear throughout the entire elastic–plastic process. Eng. Fail. Anal. 2025, 171, 109340. [Google Scholar] [CrossRef] [Scilit]
  11. Sun, C.; Chen, C.; Zheng, Y.; Zhang, W.; Liu, F. Numerical and theoretical study of bi-planar failure in footwall slopes. Eng. Geol. 2019, 260, 105234. [Google Scholar] [CrossRef] [Scilit]
  12. Wang, Y.; Shi, Y.; Yang, T.Y. Structural Performance Warning Based on Computer Intelligent Monitoring and Fractional-Order Multi-Rate Kalman Fusion Method. Fractal Fract. 2026, 10, 186. [Google Scholar] [CrossRef] [Scilit]
  13. Shi, Y.; Wang, Y.; Wang, L.N.; Wang, W.N.; Yang, T.Y. Bridge Tower Warning Method Based on Improved Multi-Rate Fusion Under Strong Wind Action. Buildings 2025, 15, 2733. [Google Scholar] [CrossRef] [Scilit]
  14. Shi, Y.; Wang, Y.; Wang, L.N.; Wang, W.N.; Yang, T.Y. Bridge Cable Performance Warning Method Based on Temperature and Displacement Monitoring Data. Buildings 2025, 15, 2342. [Google Scholar] [CrossRef] [Scilit]
  15. Liu, S.W.; Zhang, Q.Q.; Feng, R.F. Small-scale test on the response of adjacent piles caused by shield tunnel excavation in sand. Transp. Geotech. 2026, 58, 101942. [Google Scholar] [CrossRef] [Scilit]
  16. Zhang, J.Z.; Huang, H.W.; Zhang, D.M.; Phoon, K.K. Experimental study of the coupling effect on segmental shield tunnel lining under surcharge loading and excavation unloading. Tunn. Undergr. Space Technol. 2023, 140, 105199. [Google Scholar] [CrossRef] [Scilit]
  17. Zhang, Z.; Gao, Y.; Zheng, X.; Cao, J.; Chen, Y. Development and application of similar materials for foundation pit excavation model test of metro station. Appl. Sci. 2022, 12, 12880. [Google Scholar] [CrossRef] [Scilit]
  18. Hassan, M.M.; Yun, J.S.; Rahman, M.M.; Choo, Y.W.; Han, J.T.; Kim, D. Centrifugal test replicated numerical model updating for 3D strutted deep excavation with the response-surface method. Appl. Sci. 2022, 12, 10665. [Google Scholar] [CrossRef] [Scilit]
  19. Yu, Z.T.; Wang, H.Y.; Wang, W.; Ling, D.S.; Zhang, X.D.; Wang, C.; Qu, Y.H. Experimental and numerical investigation on the effects of foundation pit excavation on adjacent tunnels in soft soil. Math. Probl. Eng. 2021, 2021, 5587857. [Google Scholar] [CrossRef] [Scilit]
  20. Yi, F.; Zheng, G.; Cheng, X.; Huang, T.; Jia, J.; Wang, Z. Progressive collapse analysis of the corner strut subsystem in a propped excavation with inadequate system safety performance. Eng. Fail. Anal. 2024, 160, 108231. [Google Scholar] [CrossRef] [Scilit]
  21. Wang, S.; Li, Q.; Dong, J.; Wang, J.; Wang, M. Comparative investigation on deformation monitoring and numerical simulation of the deepest excavation in Beijing. Bull. Eng. Geol. Environ. 2021, 80, 1233–1247. [Google Scholar] [CrossRef] [Scilit]
  22. Mao, Z.; Ding, T.; Hu, F.; Ye, S.; Ding, L.; Shu, R.; Song, M. The deformation characteristics and patterns of adjacent existing metro structures caused by foundation pit excavation under different support forms. Buildings 2025, 15, 4178. [Google Scholar] [CrossRef] [Scilit]
  23. Zhang, W.; Zhang, R.; Fu, Y.; Goh, A.T.C.; Zhang, F. 2D and 3D numerical analysis on strut responses due to one-strut failure. Geomech. Eng. 2018, 15, 965–972. [Google Scholar] [CrossRef]
  24. Zheng, G.; He, X.; Zhou, H.; Diao, Y.; Li, Z.; Liu, X. Performance of inclined-vertical framed retaining wall for excavation in clay. Tunn. Undergr. Space Technol. 2022, 130, 104767. [Google Scholar] [CrossRef] [Scilit]
  25. Fang, J.; Lin, S.; Liu, K. Multi-scale study of load-bearing mechanism of uplift piles based on model tests and numerical simulations. Sci. Rep. 2023, 13, 6410. [Google Scholar] [CrossRef] [Scilit] [PubMed]
  26. Qiu, H.; Zhou, Y.; Ayasrah, M.M. Impact study of deep foundations construction of inclined and straight combined support piles on adjacent pile foundations. Appl. Sci. 2023, 13, 1810. [Google Scholar] [CrossRef] [Scilit]
  27. Branch, E.L.; Drumm, E.C.; Bennett, R.M.; Haddad, S. Numerical analysis of a novel piling framed retaining wall system. In Proceedings of the 12th International Conference of International Association for Computer Methods and Advances in Geomechanics (IACMAG), Goa, India, 1–6 October 2008. [Google Scholar]
  28. Jeldes, I.A.; Drumm, E.C.; Bennett, R.M.; Zisi, N.N. Piling framed concrete retaining wall: Design pressures and stability evaluation. Pract. Period. Struct. Des. Constr. 2015, 20, 04014041. [Google Scholar] [CrossRef] [Scilit]
  29. Zheng, G.; Wang, Y.; Zhang, P.; Cheng, X.; Cheng, W.; Zhao, Y.; Li, X. Performances and working mechanisms of inclined retaining structures for deep excavations. Adv. Civ. Eng. 2020, 2020, 1740418. [Google Scholar] [CrossRef] [Scilit]
  30. Zheng, G.; Guo, Z.; Zhou, H.; Yu, D.; Wang, E.; He, X.; Liu, Z. Parametric studies of wall displacement in excavations with inclined framed retaining walls. Int. J. Geomech. 2022, 22, 04022157. [Google Scholar] [CrossRef] [Scilit]
  31. Zheng, G.; Liu, Z.P.; Zhou, H.Z.; He, X.P.; Guo, Z.Y. Behaviour of an outward inclined-vertical framed retaining wall of an excavation. Acta Geotech. 2022, 17, 5521–5532. [Google Scholar] [CrossRef] [Scilit]
  32. Zheng, G.; Guo, Z.; Zhou, H.; Tan, Y.; Wang, Z.; Li, S. Multibench-retained excavations with inclined–vertical framed retaining walls in soft soils: Observations and numerical investigation. J. Geotech. Geoenviron. Eng. 2024, 150, 05024003. [Google Scholar] [CrossRef] [Scilit]
  33. Gan, F.; Zheng, G.; Li, M.; Liu, J.; Zhou, H.; Cao, T.; Wang, H. Large-scale model tests on inclined steel pipe pile retaining structures upon excavation. J. Rock Mech. Geotech. Eng. 2025; in press. [CrossRef] [Scilit]
  34. Wang, Y.; Cheng, X.; Zheng, G. Numerical analysis of soil deformation in the excavation with loose sand retained by inclined retaining piles. Sci. Rep. 2024, 14, 31434. [Google Scholar] [CrossRef] [Scilit] [PubMed]
  35. Xie, B.L.; Liu, Y.C.; Jiang, H.; Guo, H.; Li, B.B. Analysis of the stability of inclined and vertical form retaining walls under foundation excavation and surcharge loading: Experiments and numerical simulation. Eng. Fail. Anal. 2025, 184, 110295. [Google Scholar] [CrossRef] [Scilit]
  36. Zhang, Y.; Chen, C.; Lei, M.; Zheng, Y.; Zhang, H.; Shao, Y. Preliminary numerical analysis of a novel retaining system in dry sandy soil and its first application to a deep excavation in Wuhan (China). Appl. Sci. 2020, 10, 2006. [Google Scholar] [CrossRef] [Scilit]
  37. Wei, S.; Liang, R.; Mei, G.; El Naggar, M.H.; Sun, L.; Jia, J.; Wu, W. Experimental investigation on the deformation characteristics of locking-steel-pipe (LSP) pile retaining structure during excavation in sand. Undergr. Space 2022, 7, 1098–1114. [Google Scholar] [CrossRef] [Scilit]
  38. Gibson, A.D. Physical Scale Modeling of Geotechnical Structures at One-G. Ph.D. Thesis, California Institute of Technology, Pasadena, CA, USA, 1997. [Google Scholar]
  39. Scott, R.F. Centrifuge modeling and technology: A survey. Rev. Fr. Geotech. 1989, 48, 15–34. [Google Scholar] [CrossRef] [Scilit]
  40. You, M.Q.; Su, C.D.; Gou, Y. Experimental study on strength and deformation characteristics of marble specimens with holes. Chin. J. Rock Mech. Eng. 2007, 26, 2420–2429. [Google Scholar]
  41. Zhang, Y.P.; Zheng, X.G.; Jin, X.G. Stability analysis of jointed surrounding rock of twin tunnels with small spacing based on Hoek-Brown criterion. Technol. Highw. Transp. 2014, 48–52+57. [Google Scholar]
  42. Yan, S.P. Mechanics of Materials; Science Press: Beijing, China, 2012. [Google Scholar]
Figure 1. Basic configuration of the vertical–inclined pile wall (VIPW). Reprint with permission [36]; 2020, MDPI.
Buildings 16 01588 g001
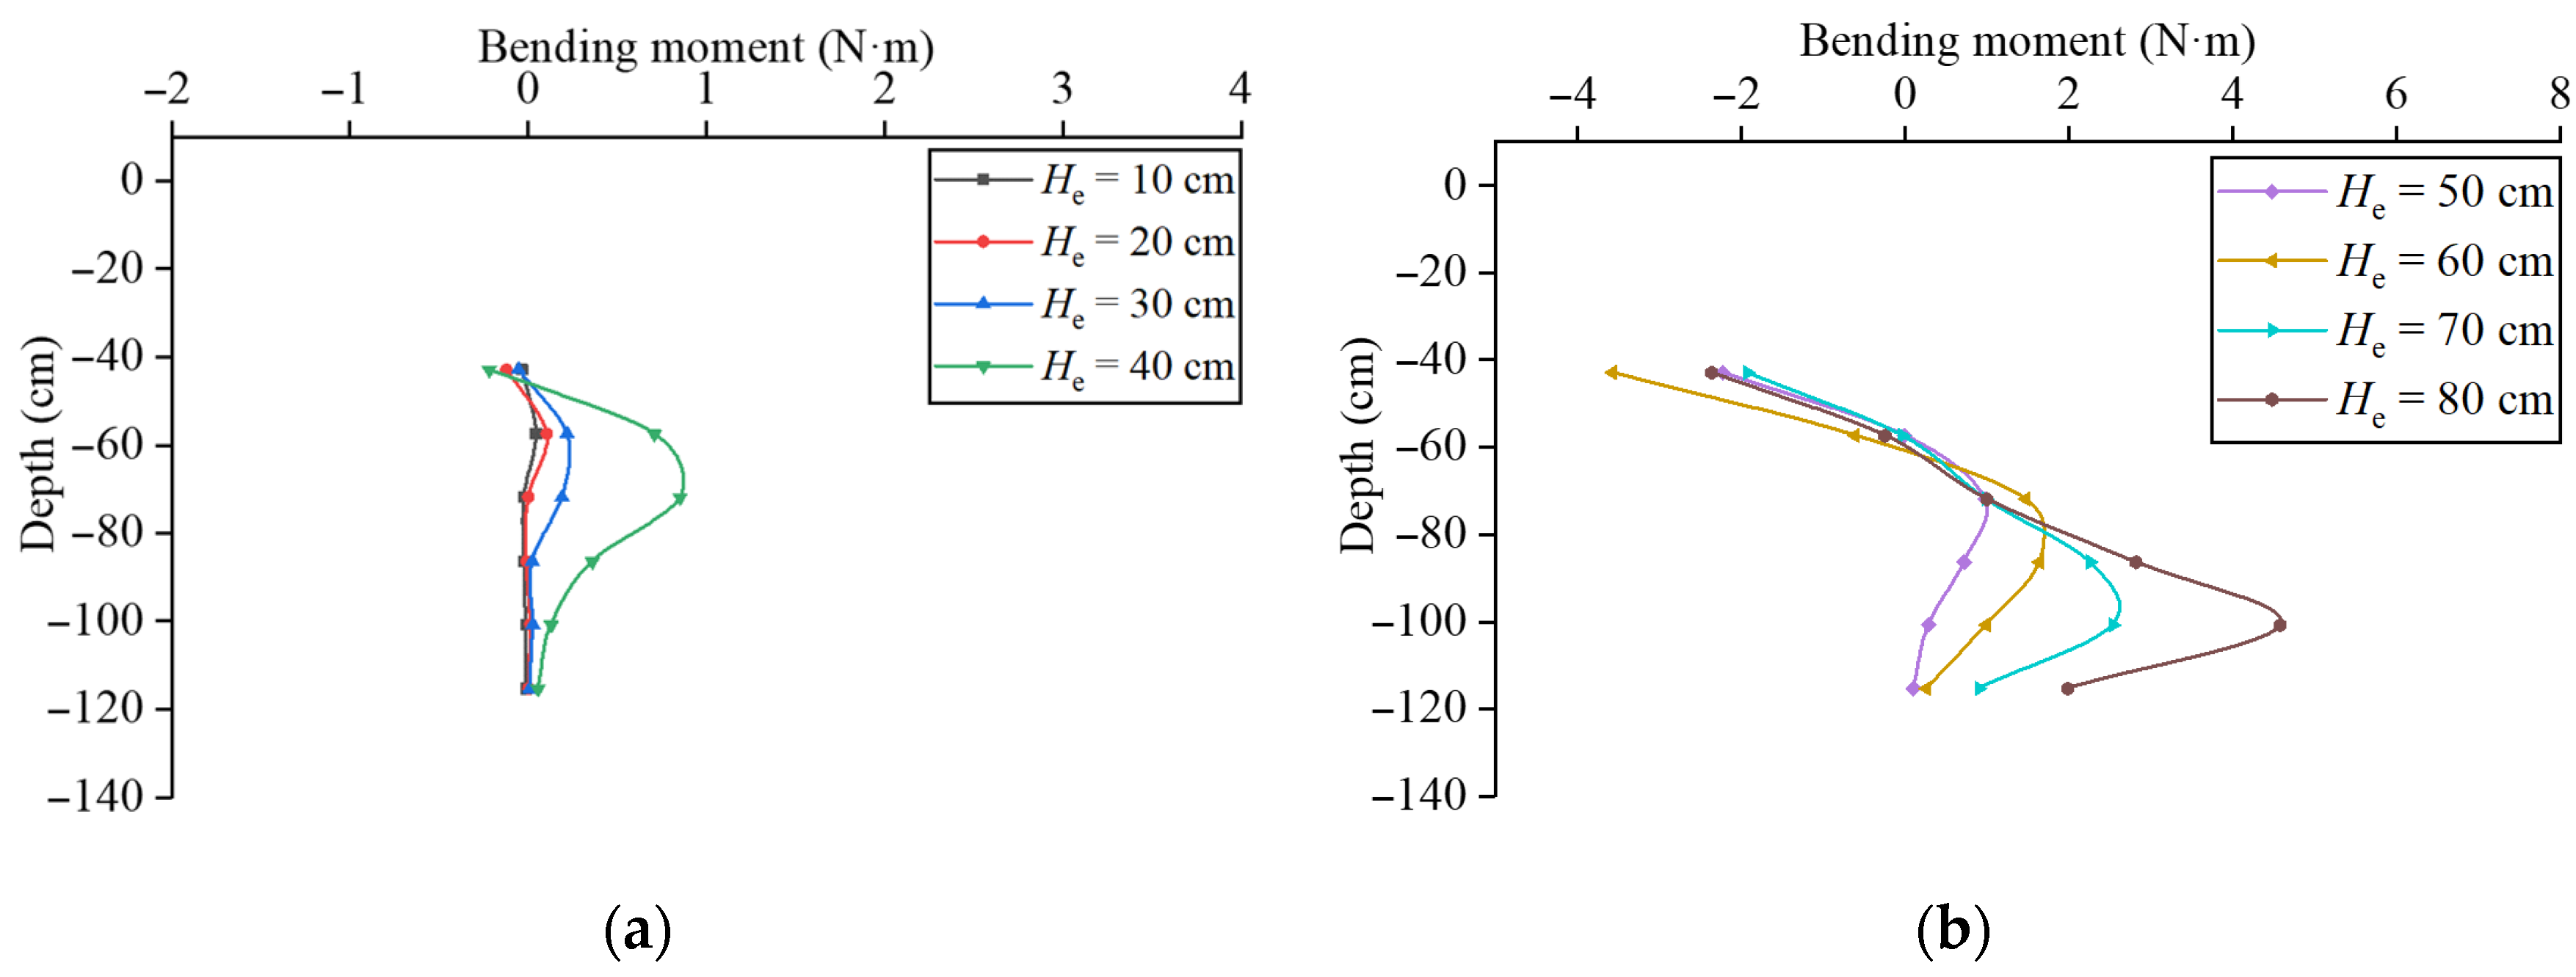
Figure 2. Model box.
Buildings 16 01588 g002
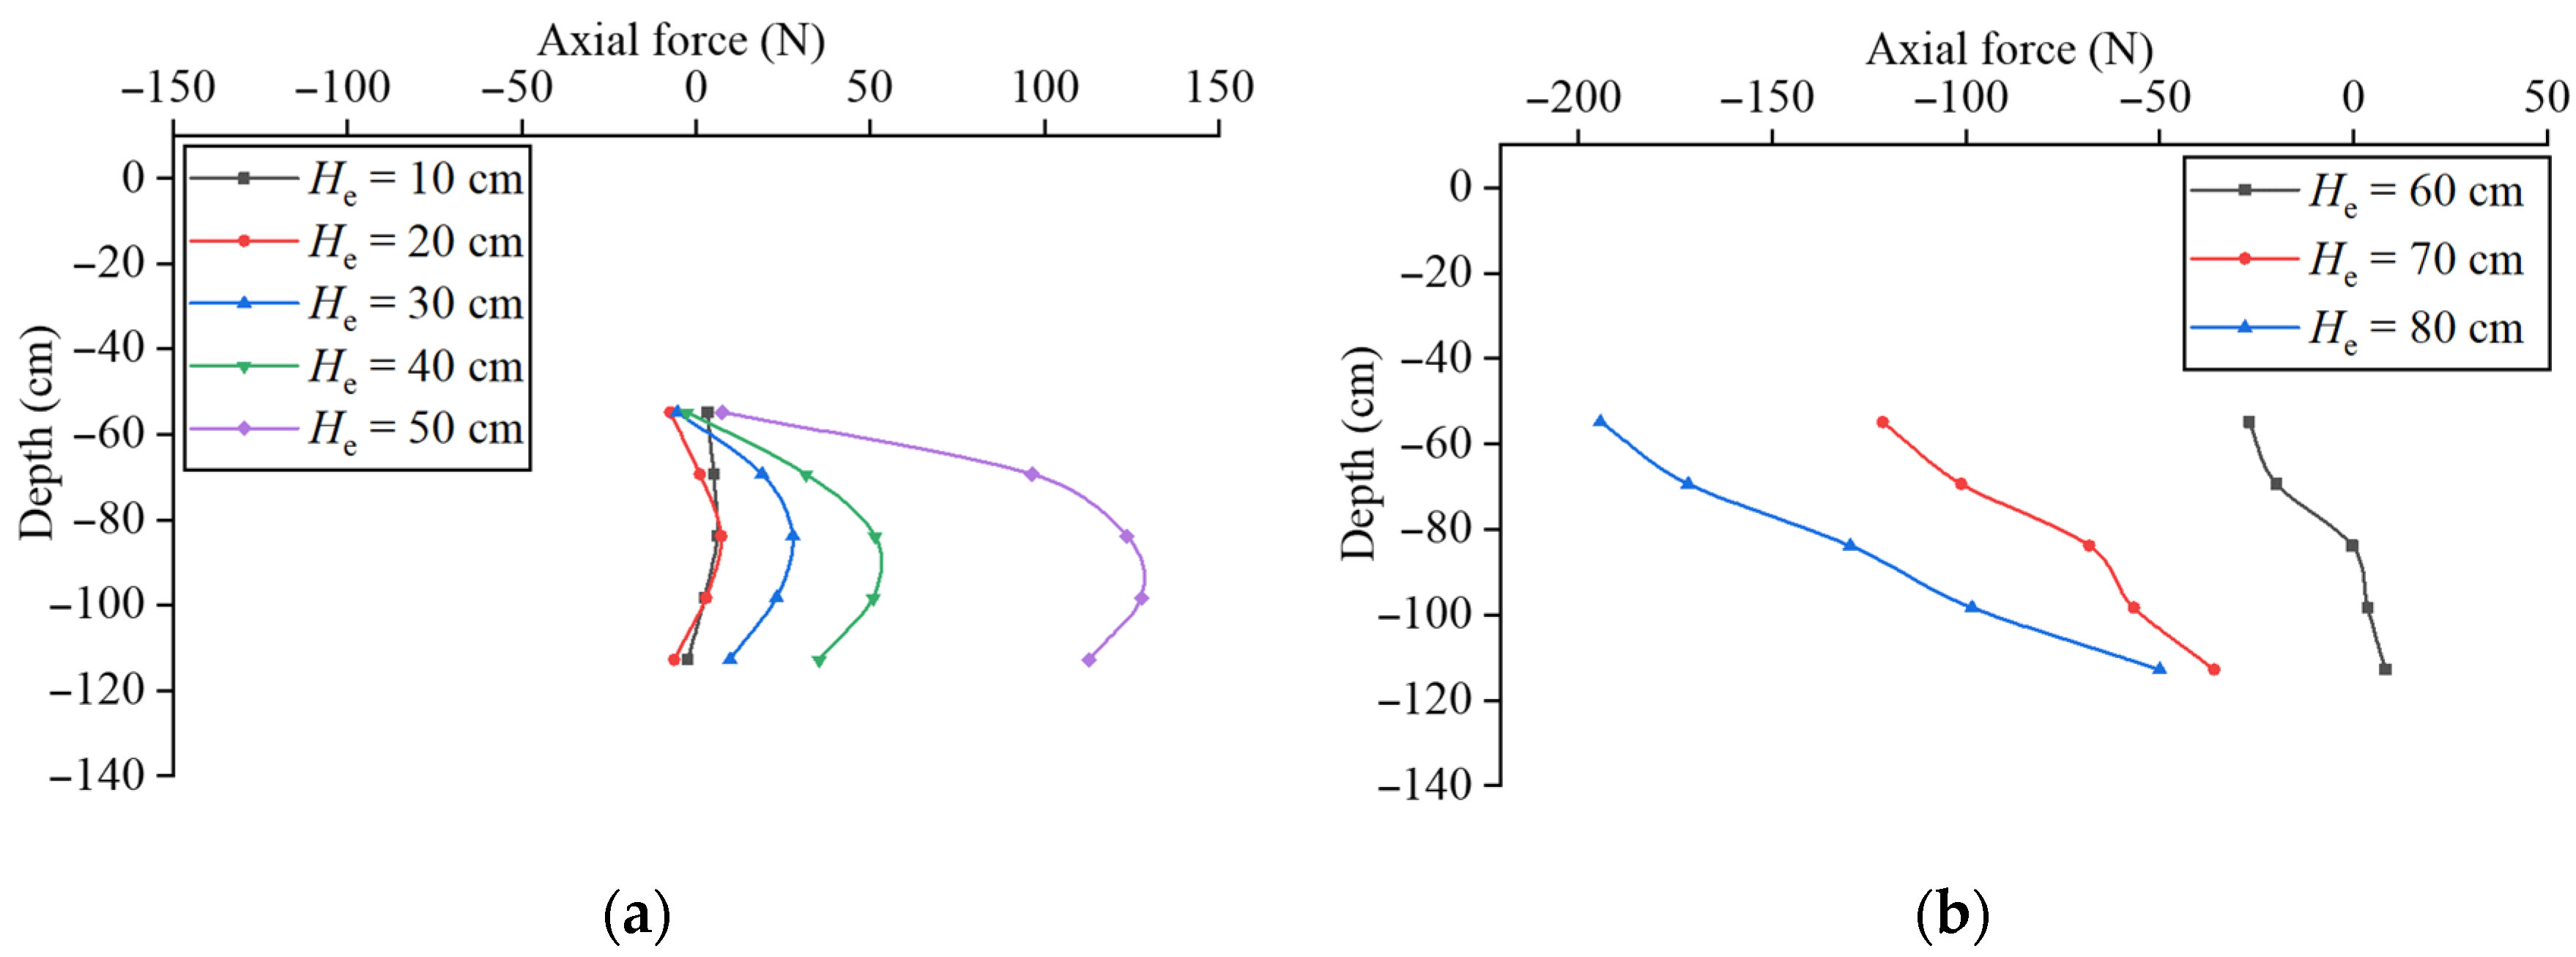
Figure 3. Pile models.
Buildings 16 01588 g003
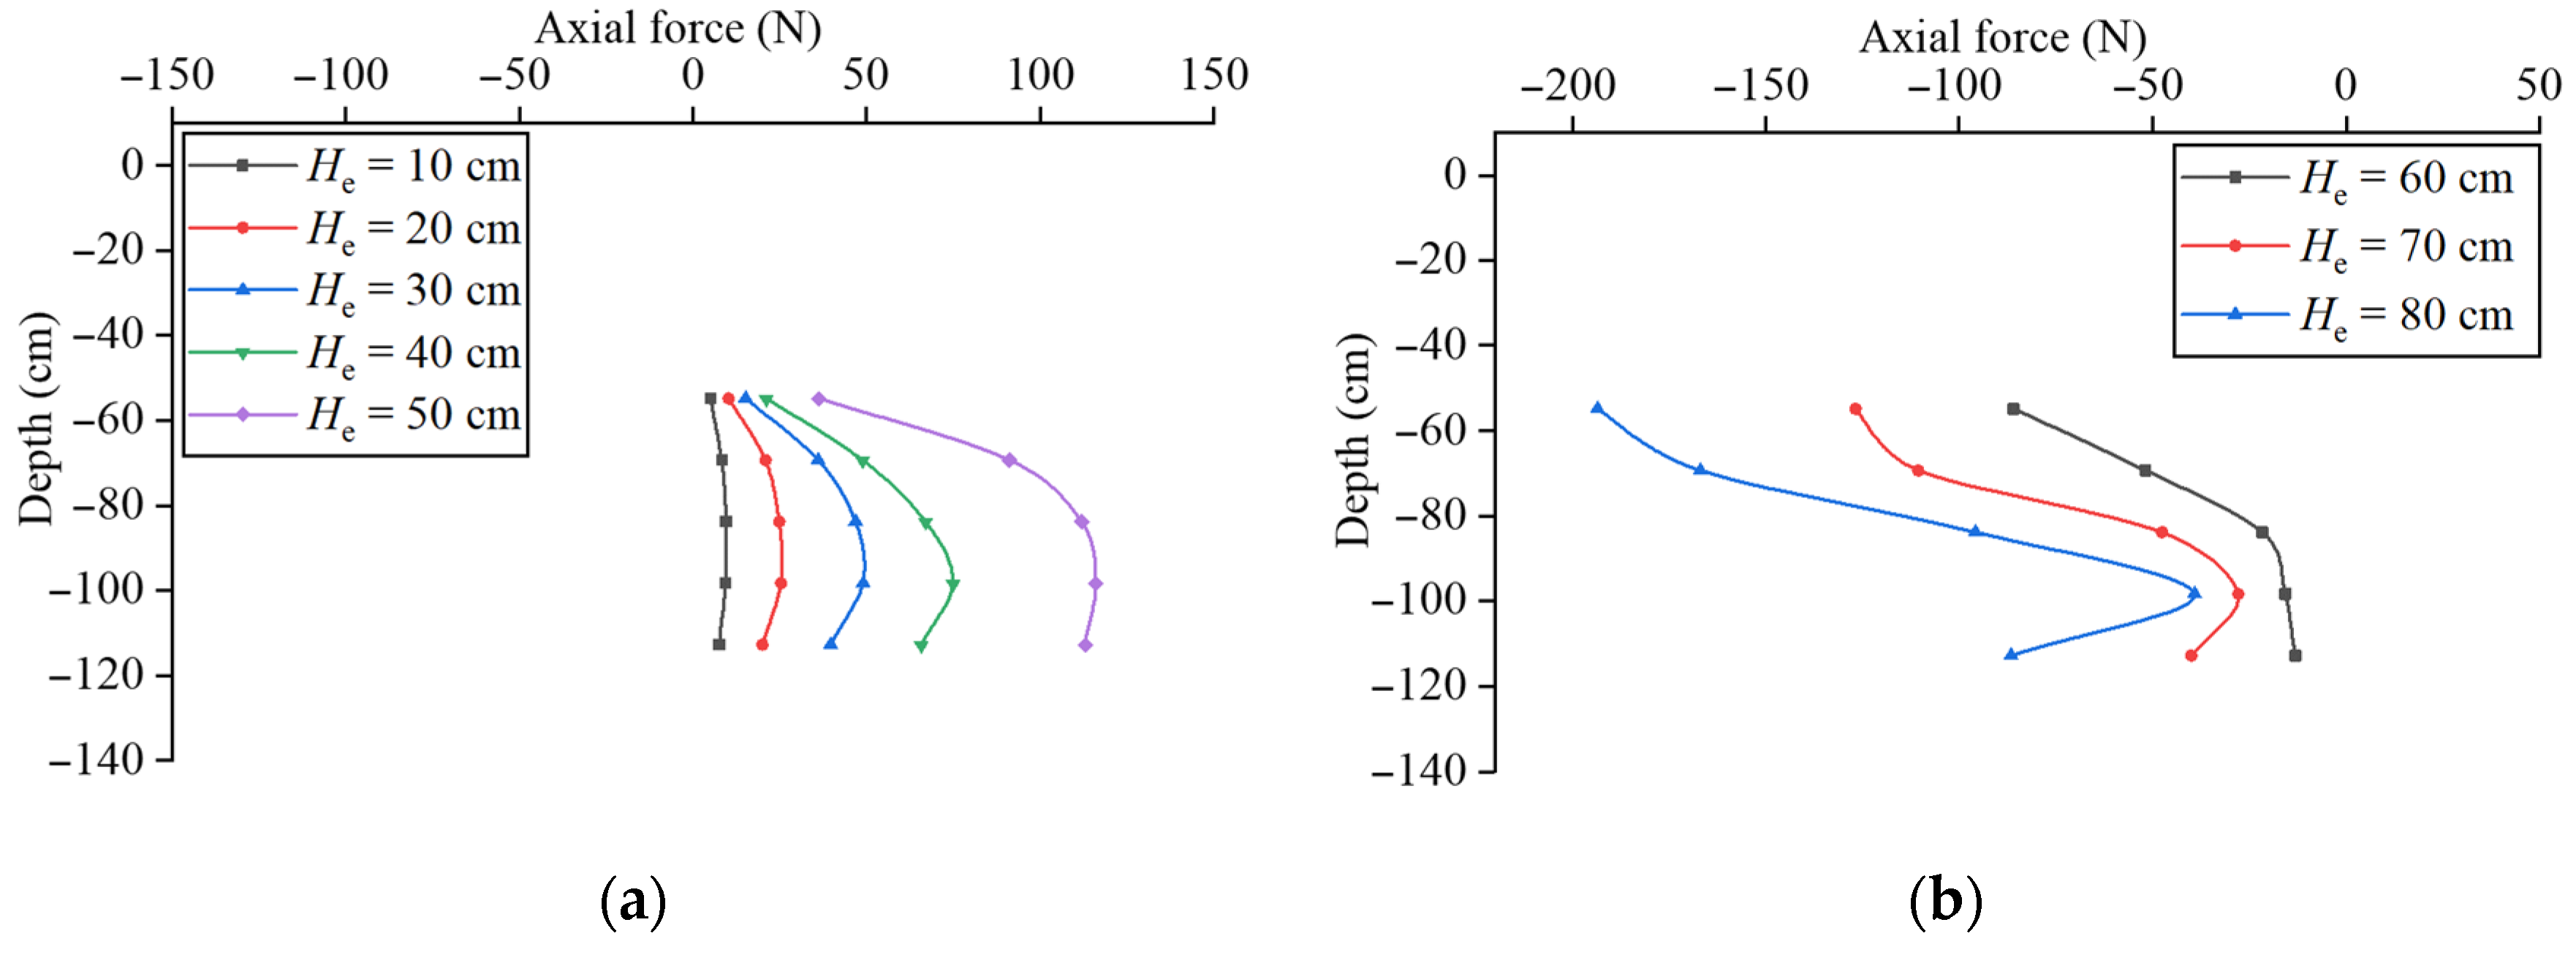
Figure 4. Uniaxial compression test of pile model.
Buildings 16 01588 g004
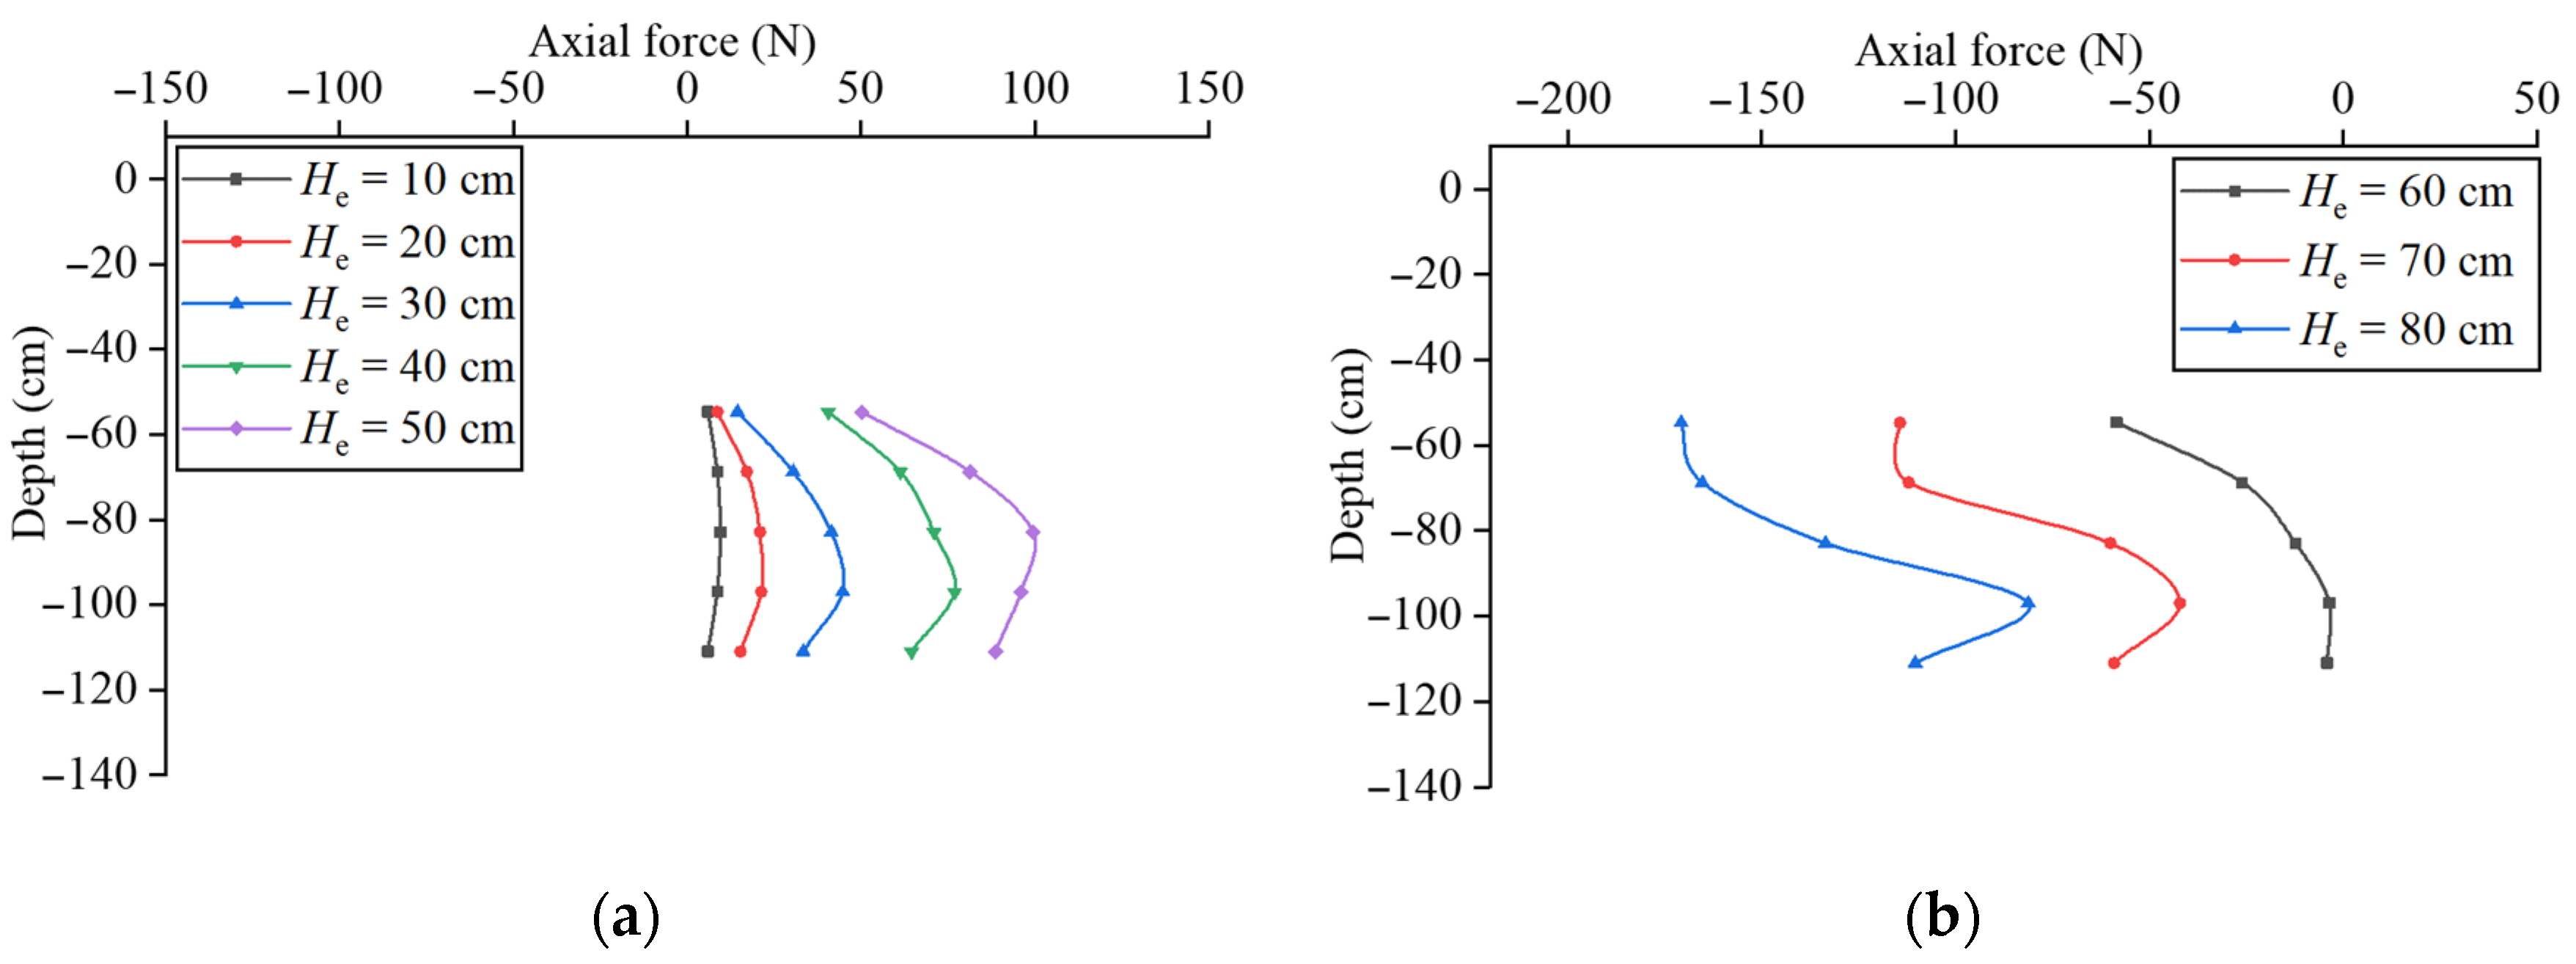
Figure 5. Axial stress–strain relationship curve of PVC pile models: (a) vertical model piles; (b) inclined model piles.
Buildings 16 01588 g005
Figure 6. Diagram of connection between vertical pile and inclined pile.
Buildings 16 01588 g006
Figure 7. Wale model and connector: (a) wale; (b) angle steel; (c) U-shaped connection.
Buildings 16 01588 g007
Figure 8. Photos of displacement sensors: (a) dial indicator; (b) laser displacement sensor.
Buildings 16 01588 g008
Figure 9. Strain acquisition system: (a) strain gauge; (b) strain acquisition instrument.
Buildings 16 01588 g009
Figure 10. Sensor layout of test model (units: cm).
Buildings 16 01588 g010
Figure 11. Layout diagram of the VIPW model: (a) sectional view; (b) plan view. Ht = depth from the excavation bottom to the tip of vertical pile; L = length of vertical pile; Lx = length of inclined pile; θ = dip angle of inclined pile; H1 = depth from the wale to the ground surface; H2 = depth from the wale to the excavation bottom; H3 = depth from the excavation bottom to the tip of inclined pile; H1 + H2 = depth from the ground surface to the excavation bottom. Z1 to Z10 are the ten vertical piles distributed along the edge of the excavation, with a center-to-center spacing of 10 cm; X1 to X9 are the nine inclined piles tilting to the inner side of the excavation, with a center-to-center spacing of 10 cm.
Buildings 16 01588 g011
Figure 12. Strain gauge arrangement of vertical pile model: (a) strain gauge measuring point layout (units: cm); (b) installation status of strain gauges.
Buildings 16 01588 g012
Figure 13. Strain gauge arrangement of inclined pile model: (a) strain gauge measuring point layout (units: cm); (b) installation status of strain gauges.
Buildings 16 01588 g013
Figure 14. Photo of the inclined model piles with fine sand pasted on their surface.
Buildings 16 01588 g014
Figure 15. Coefficient calibrating testing of vertical piles: (a) model pile calibration diagram (units: cm); (b) model pile calibration photos.
Buildings 16 01588 g015
Figure 16. Static testing of soil sample.
Buildings 16 01588 g016
Figure 17. Photos of test model: (a) photo of VIPW model installation in group R1; (b) photo of the completion of the filling.
Buildings 16 01588 g017
Figure 18. Photos of model after sensor installation: (a) installation of dial indicator; (b) installation of laser displacement meter.
Buildings 16 01588 g018
Figure 19. Process of excavation: (a) excavation of foundation pit; (b) connection between wale and inclined pile; (c) completion of excavation.
Buildings 16 01588 g019
Figure 20. Horizontal displacement distribution of the vertical piles for different excavation depths: (a) group R0; (b) group R1; (c) group R2; (d) group R3; (e) group R4; (f) group R5.
Buildings 16 01588 g020
Figure 21. Horizontal displacements at the top of vertical piles for different groups.
Buildings 16 01588 g021
Figure 22. Surface settlement for different excavation depths: (a) group R0; (b) group R1; (c) group R2; (d) group R3; (e) group R4; (f) group R5.
Buildings 16 01588 g022
Figure 23. Surface settlement for different tests.
Buildings 16 01588 g023
Figure 24. Surface photos of group R0 for different excavation depths: (a) He = 70 cm; (b) He = 80 cm.
Buildings 16 01588 g024
Figure 25. Surface photos of group R5 for different excavation depths: (a) He = 70 cm; (b) He = 80 cm.
Buildings 16 01588 g025
Figure 26. Bending moment distribution of vertical piles for different excavation depths: (a) group R0; (b) group R1; (c) group R2; (d) group R3; (e) group R4; (f) group R5.
Buildings 16 01588 g026aBuildings 16 01588 g026b
Figure 27. Maximum bending moment in vertical pile for different tests.
Buildings 16 01588 g027
Figure 28. Stress diagram of an inclined pile. M is the bending moment at the pile head. N1 and N2 are the axial forces at the pile top and pile tip, respectively. T is the tangential force at the pile top. F1, F2 are the normal forces exerted by the soil along the pile shaft, and τ1, τ2 are the tangential shear forces at the corresponding locations.
Buildings 16 01588 g028
Figure 29. Stress and deformation in cross-section of cylinder.
Buildings 16 01588 g029
Figure 30. Bending moment distribution of inclined pile in group R1: (a) before the inclined pile takes effect; (b) after the inclined pile takes effect.
Buildings 16 01588 g030
Figure 31. Bending moment distribution of inclined pile in group R2: (a) before the inclined pile takes effect; (b) after the inclined pile takes effect.
Buildings 16 01588 g031
Figure 32. Bending moment distribution of inclined pile in group R3: (a) before the inclined pile takes effect; (b) after the inclined pile takes effect.
Buildings 16 01588 g032
Figure 33. Bending moment distribution of inclined pile in group R4: (a) before the inclined pile takes effect; (b) after the inclined pile takes effect.
Buildings 16 01588 g033
Figure 34. Bending moment distribution of inclined pile in group R5: (a) before the inclined pile takes effect; (b) after the inclined pile takes effect.
Buildings 16 01588 g034
Figure 35. Axial force distribution of inclined pile in group R1: (a) before the inclined pile takes effect; (b) the relative value after the inclined pile takes effect.
Buildings 16 01588 g035
Figure 36. Axial force distribution of inclined pile in group R2: (a) before the inclined pile takes effect; (b) the relative value after the inclined pile takes effect.
Buildings 16 01588 g036
Figure 37. Axial force distribution of inclined pile in group R3: (a) before the inclined pile takes effect; (b) the relative value after the inclined pile takes effect.
Buildings 16 01588 g037
Figure 38. Axial force distribution of inclined pile in group R4: (a) before the inclined pile takes effect; (b) the relative value after the inclined pile takes effect.
Buildings 16 01588 g038
Figure 39. Axial force distribution of inclined pile in group R5: (a) before the inclined pile takes effect; (b) the relative value after the inclined pile takes effect.
Buildings 16 01588 g039
Figure 40. Side-face photos of R0 for different excavation depths: (a) He = 50 cm; (b) He = 60 cm; (c) He = 70 cm; (d) He = 80 cm.
Buildings 16 01588 g040
Figure 41. Side-face photos of R5 for different excavation depths: (a) He = 50 cm; (b) He = 60 cm; (c) He = 70 cm; (d) He = 80 cm.
Buildings 16 01588 g041
Table 1. The main scale relations of 1 g physical modeling in tests (prototype/model).
Quantity to Be ScaledScaling FactorPrototype-to-Model RatioQuantity to Be
Scaled
Scaling FactorPrototype-to-Model Ratio
Length C l 20Cohesion C c = C l C ρ C g 20
Density C ρ 1Friction angle C φ 1
Mass C m = C l 3 C ρ 203Force C F = C l 3 C ρ C g 203
Gravitational acceleration C g 1Poisson’s ratio C v 1
Stress C σ = C l C ρ C g 20Strain C ε 1
Area C A = C l 2 202Bending moment C M = C l 4 C ρ C g 204
Inertia moment C I = C l 4 204Young’s modulus C c = C l C ρ C g 20
Bending stiffness C E I = C l 5 C ρ C g 205Compressive stiffness C E A = C l 3 C ρ C g 203
Table 2. Young’s modulus (E) of pile models.
NumberDiameter (mm)Thickness (mm)Height (mm)Young’s
Modulus (GPa)
Average Young’s Modulus (GPa)
Z1502.097.03.163.29
Z2502.096.43.37
Z3502.097.03.35
X1402.076.72.832.85
X2402.076.32.79
X3402.076.72.94
Note: Z1, Z2, and Z3 denote the vertical piles and X1, X2, and X3 denote the inclined piles.
Table 3. Particle size distribution of the soil.
Particle Size (mm)20.50.250.0750.005
The mass percentage of particles smaller than a specified particle size (%)10059.80.900
Table 4. Physical and mechanical parameters of the soil.
Soil Typeωρdmax (g/cm3)ρdmin (g/cm3)Gsφ (°)c (kPa)
Medium sand0.1%1.661.452.6638.80
Note: ω = water content of soil; ρdmax = maximum dry density of soil; ρdmin = minimum density of soil; Gs = specific gravity; φ = internal friction angle of soil; c = cohesion of soil.
Table 5. Experimental scheme.
NumberH1 + H2 (cm)L (cm)Lx (cm)θ (°)H1 (cm)H3 (cm)
R080120----
R18012072155040
R28012082155049.6
R38012074205040
R480129.672155040
R58012083154040
Table 6. Relationship between M and εmax of vertical model pile.
Pile
Number
Strain NumberRelationship Between
M and εmax
Pile NumberStrain NumberRelationship Between
M and εmax
Z41# M = 0.0122 ε m a x   ( R 2 = 1 ) Z48# M = 0.0125 ε m a x   ( R 2 = 1 )
Z42# M = 0.0136 ε m a x   ( R 2 = 1 ) Z47# M = 0.0135 ε m a x   ( R 2 = 1 )
Z43# M = 0.0136 ε m a x   ( R 2 = 1 ) Z46# M = 0.0133 ε m a x   ( R 2 = 1 )
Z44# M = 0.0138 ε m a x   ( R 2 = 1 ) Z45# M = 0.0133 ε m a x   ( R 2 = 1 )
Table 7. Relationship between M and εmax of inclined model pile.
Pile
Number
Strain
Number
Relationship Between
M and εmax
Strain
Number
Relationship Between
M and εmax
X5A-1# M = 0.0067 ε m a x   ( R 2 = 1 ) B-1# M = 0.0066 ε m a x   ( R 2 = 1 )
X5A-2# M = 0.0062 ε m a x   ( R 2 = 1 ) B-2# M = 0.0065 ε m a x   ( R 2 = 1 )
X5A-3# M = 0.0066 ε m a x   ( R 2 = 1 ) B-3# M = 0.0065 ε m a x   ( R 2 = 1 )
X5A-4# M = 0.0069 ε m a x   ( R 2 = 1 ) B-4# M = 0.0066 ε m a x   ( R 2 = 1 )
X5A-5# M = 0.0068 ε m a x   ( R 2 = 1 ) B-5# M = 0.0066 ε m a x   ( R 2 = 1 )
X5A-6# M = 0.0069 ε m a x   ( R 2 = 1 ) B-6# M = 0.0068 ε m a x   ( R 2 = 1 )
Table 8. Maximum negative bending moment of inclined piles (bending moment at the pile top) (units: N·m).
GroupDepth of ExcavationΔM
40 cm50 cm60 cm70 cm80 cm
R10.220.13−0.21−1.98−3.35−3.48
R20.04−0.24−0.97−2.05−3.44−3.20
R3−0.10−0.28−1.02−2.51−4.30−4.02
R40.16−0.32−0.88−2.76−4.60−4.28
R5−0.22−2.23−3.57−1.93−2.36−2.14
Note: In groups R1–R4, ΔM is calculated as the bending moment at an excavation depth of 80 cm minus that at 50 cm (the support position of the inclined piles in groups R1–R4 is 50 cm). In group R5, ΔM is calculated as the bending moment at an excavation depth of 80 cm minus that at 40 cm (the support position of the inclined piles in group R5 is 40 cm).
Table 9. Maximum positive bending moment of inclined piles (at excavation depths of 40, 50, 60, and 70 cm, the locations of the maximum positive bending moment are consistent with that at 80 cm) (units: N·m).
GroupDepth of ExcavationΔM
40 cm50 cm60 cm70 cm80 cm
R10.08 0.59 1.98 3.51 5.41 4.81
R20.10 0.98 1.73 2.92 5.11 4.13
R30.17 0.74 1.93 3.15 4.85 4.11
R40.07 1.68 2.22 3.85 5.64 3.96
R50.13 0.29 0.99 2.53 4.58 4.45
Note: In groups R1–R4, ΔM is calculated as the bending moment at an excavation depth of 80 cm minus that at 50 cm (the support position of the inclined piles in groups R1–R4 is 50 cm). In group R5, ΔM is calculated as the bending moment at an excavation depth of 80 cm minus that at 40 cm (the support position of the inclined piles in group R5 is 40 cm).
Table 10. ΔN of the inclined piles’ maximum axial force (ΔN of the axial force at the pile top) (units: N).
GroupDepth of Excavation
50 cm60 cm70 cm80 cm
R1/−26.94−121.39−194.19
R2/−86.00−126.68−193.52
R3/−58.53−114.36−170.79
R4/−61.58−161.89−185.00
R5−10.01−68.30−118.62−150.96
Note: In groups R1–R4, ΔN is calculated as the axial force at an excavation depth of 60, 70, 80 cm minus that at 50 cm (the support position of the inclined piles in groups R1–R4 is 50 cm). In group R5, ΔN is calculated as the axial force at an excavation depth of 50, 60, 70, 80 cm minus that at 40 cm (the support position of the inclined piles in group R5 is 40 cm).
Disclaimer/Publisher’s Note: The statements, opinions and data contained in all publications are solely those of the individual author(s) and contributor(s) and not of MDPI and/or the editor(s). MDPI and/or the editor(s) disclaim responsibility for any injury to people or property resulting from any ideas, methods, instructions or products referred to in the content.