Article

From Space to Well-Being: Understanding the Restorative Potential of Urban Riverfront Landscapes

1
College of Art and Design, Nanjing Forestry University, Nanjing 210037, China
2
Research Center for Digital Innovation Design, Nanjing Forestry University, Nanjing 210037, China
3
Jin Pu Research Institute, Nanjing Forestry University, Nanjing 210037, China
4
Faculty of Humanities and Arts, Macau University of Science and Technology, Macau, China
5
Co-Innovation Center for the Sustainable Forestry in Southern China, Nanjing Forestry University, Nanjing 210037, China
*
Authors to whom correspondence should be addressed.
Buildings 2026, 16(6), 1235; https://doi.org/10.3390/buildings16061235
Submission received: 30 January 2026 / Revised: 28 February 2026 / Accepted: 13 March 2026 / Published: 20 March 2026
(This article belongs to the Special Issue Urban Wellbeing: The Impact of Spatial Parameters—2nd Edition)

Abstract

Urban riverfronts, as integral components of the urban built environment, serve as essential blue–green infrastructure that offers restorative opportunities to residents in high-density areas. However, the mechanisms through which specific spatial qualities influence well-being outcomes remain underexplored. Guided by Attention Restoration Theory (ART) and Stress Recovery Theory (SRT), this study investigates the associations among spatial perception, perceived restorativeness, environmental sensitivity, and subjective well-being along the Yangtze Riverfront in Nanjing, China. A cross-sectional survey (N = 551) was conducted across six riverfront segments, using a 96-item questionnaire to assess five spatial perception dimensions, four restorativeness dimensions, and four well-being dimensions. Structural equation modeling (SEM) results indicate that spatial perception is positively associated with perceived restorativeness (β = 0.320, p < 0.001), with aesthetic perception demonstrating the strongest relative contribution (β = 0.265). Perceived restorativeness, in turn, significantly contributes to well-being (β = 0.540, p < 0.001), partially mediating the relationship between spatial perception and well-being (indirect effect (β = 0.173; 41.69% of total effect). Notably, environmental sensitivity moderated the spatial–restorative link (β = 0.799, p < 0.001), with restorative benefits being significantly amplified for individuals with higher sensitivity. These findings highlight aesthetics, accessibility, and perceived safety as priority targets for urban design. This study offers actionable insights for optimizing riverfront landscapes as vital urban health resources.

1. Introduction

The accelerating pace of urbanization has intensified psychological stressors for residents in densely built environments, contributing to elevated risks of stress, anxiety, and attention fatigue and increasing the demand for restorative urban environments [1,2,3,4]. In response, research and practice in urban design and the management of the built environment have increasingly emphasized the health-supporting functions of urban blue–green infrastructure [5,6]. Urban blue spaces, including natural water bodies such as rivers, lakes, and coastlines, as well as constructed aquatic features, have gained increasing attention as a distinctive category of restorative environments, providing benefits beyond those offered by green spaces alone [7,8]. Empirical studies and evidence syntheses generally report positive associations between access to blue spaces and mental health outcomes, such as lower stress and improved subjective well-being [7,8,9,10]. For example, cross-national research has linked recreational engagement with blue spaces to better mental health indicators [7], while systematic review evidence has summarized plausible pathways including stress regulation, attentional recovery, and facilitation of physical activity [8].
Two complementary theoretical frameworks have significantly advanced the understanding of environment–health relationships: Attention Restoration Theory (ART) and Stress Recovery Theory (SRT). According to ART, natural environments help recover from directed attention fatigue by providing four restorative qualities: being away, fascination, extent, and compatibility [11,12]. SRT, in turn, focuses on affective and physiological recovery processes, suggesting that exposure to natural settings is associated with rapid positive affective responses and reduced physiological arousal [13]. Contemporary scholarship increasingly advocates integrative approaches that jointly consider attentional and stress-related pathways to capture the multifaceted nature of restorative experiences [14,15]. A widely used operationalization of these theoretical constructs is perceived restorativeness, commonly assessed with the Perceived Restorativeness Scale (PRS) and its subsequent adaptations [16,17,18,19]. Prior research has shown that perceived restorativeness can function as a mechanism linking environmental attributes to psychological outcomes in various settings [17]. In parallel, place attachment—the emotional bond that individuals develop with specific locations over time [20]—has been repeatedly associated with well-being-related outcomes and may co-evolve with restorative experiences in everyday landscapes [21,22,23].
Despite these advances, several knowledge gaps remain salient for urban riverfronts, which typically integrate blue and green elements and are increasingly prioritized in urban renewal and waterfront revitalization agendas. First, compared with studies focusing on blue or green spaces separately, the hybrid blue–green character of riverfront landscapes and the ways residents perceive their spatial qualities remain insufficiently examined [10,24]. Second, while the impact of environmental features is widely recognized, there is limited evidence regarding how specific dimensions of the perceived built environment—such as spatial scale, boundaries, accessibility, aesthetics, and safety—collectively influence perceived restorativeness and well-being outcomes in riverfront contexts [25,26]. Third, while individual differences in environmental sensitivity are known to shape psychological responses, the extent to which this sensitivity moderates the relationship between built-environment qualities and restorative experiences remains empirically underspecified [4,23]. Fourth, although riverfront regeneration has been widely implemented across Chinese cities, empirical research connecting residents’ perceptions of transformed waterfront spaces to well-being outcomes remains comparatively sparse [27,28].
To address these gaps, this study applies environmental psychology frameworks to examine the associations between spatial perception and residents’ well-being along the Yangtze Riverfront in Nanjing, China. Specifically, we aim to: (1) develop and validate a multidimensional scale of riverfront spatial perception encompassing spatial scale, boundary perception, accessibility perception, aesthetic perception, and safety perception; (2) examine the associations between spatial perception (overall and by dimension) and perceived restorativeness; (3) test whether perceived restorativeness mediates the association between spatial perception and well-being outcomes (stress reduction, mood enhancement, place attachment, and life satisfaction); and (4) evaluate whether environmental sensitivity moderates the spatial–restorative link, thereby identifying potential boundary conditions for the restorative effects of urban riverfronts. By integrating ART- and SRT-informed pathways within a unified analytical model, the study contributes to research on restorative urban landscapes and provides evidence-informed implications for riverfront planning and management.

2. Materials and Methods

2.1. Theoretical Framework and Hypotheses

2.1.1. Spatial Perception and Perceived Restorativeness

Spatial perception in landscapes involves how individuals interpret and mentally process various physical and spatial features of an environment, such as its scale, boundaries, readability, and connectivity [25,29]. Previous studies have emphasized the importance of spatial and visual elements in shaping how people experience a landscape, suggesting that features like scale, enclosure, and visual connectivity play a key role in how environments are assessed and used [29]. In blue–green environments, emerging evidence suggests that spatial configurations and perceptual attributes are associated with variation in restorative experiences, implying that the arrangement and legibility of spatial elements may be consequential for psychological outcomes [26].
According to Attention Restoration Theory (ART), environments seen as ‘restorative’ typically have four main qualities: being away, fascination, extent, and compatibility, which together help recover from mental fatigue caused by focused attention [11,12]. Empirical studies have reported significant associations between landscape spatial characteristics and perceived restorativeness in urban green/park settings [18,19]. Additionally, research from waterfront areas suggests that certain landscape features attract attention in different ways, influencing people’s preferences and highlighting the importance of perceptual processing in how environments are experienced [30].
Based on these theoretical and empirical considerations, we propose:
H1. 
Spatial perception of riverfront landscapes is positively associated with perceived restorativeness.
H1a–H1e. 
Each spatial perception dimension—(a) spatial scale, (b) boundary perception, (c) accessibility perception, (d) aesthetic perception, and (e) safety perception—is positively associated with perceived restorativeness.

2.1.2. Perceived Restorativeness and Residents’ Well-Being

A substantial body of research indicates that perceived restorativeness is associated with multiple facets of psychological well-being [5,6,8]. Both ART and Stress Recovery Theory (SRT) suggest that environments appraised as restorative are linked to favorable psychological states and outcomes, such as stress alleviation and improved affect [11,13]. Empirical studies in urban settings have reported relationships between perceived environmental qualities, perceived restorativeness, and mental health indicators [27,31]. Moreover, restorative experiences may be related to stronger person–place bonds: individuals who repeatedly experience psychological benefits in a setting may develop greater place attachment, which is itself associated with well-being-related outcomes [21,22,32].
Accordingly, we propose:
H2. 
Perceived restorativeness is positively associated with residents’ well-being.
H2a–H2d. 
Perceived restorativeness is positively associated with (a) stress reduction, (b) mood enhancement, (c) place attachment, and (d) life satisfaction.

2.1.3. Mediating Role of Perceived Restorativeness

Environmental psychology research increasingly emphasizes mechanisms through which perceived environmental attributes translate into well-being-related outcomes [14,17]. Evidence suggests that cognitive appraisal factors, such as perceived environmental quality and restorativeness, can serve as pathways linking environmental characteristics to psychological outcomes [17,27,31]. This mechanism aligns with ART/SRT-informed propositions that environmental stimuli are cognitively and affectively processed before manifesting as restoration-related outcomes [11,12,13].
Therefore, we propose the following:
H3. 
Perceived restorativeness mediates the relationship between spatial perception and residents’ well-being.

2.1.4. Moderating Role of Environmental Sensitivity

Individual differences may condition how perceived spatial qualities relate to restorative evaluations. Environmental sensitivity (and related predispositions, such as connectedness to nature) has been proposed as a boundary condition in environment restoration pathways, with prior studies suggesting that individual characteristics can shape restorative responses to environmental exposure [4,23,33,34].
Given this moderation perspective, we propose the following:
H4. 
Environmental sensitivity moderates the relationship between spatial perception and perceived restorativeness (i.e., the strength of the spatial perception–restorativeness association varies across levels of environmental sensitivity).
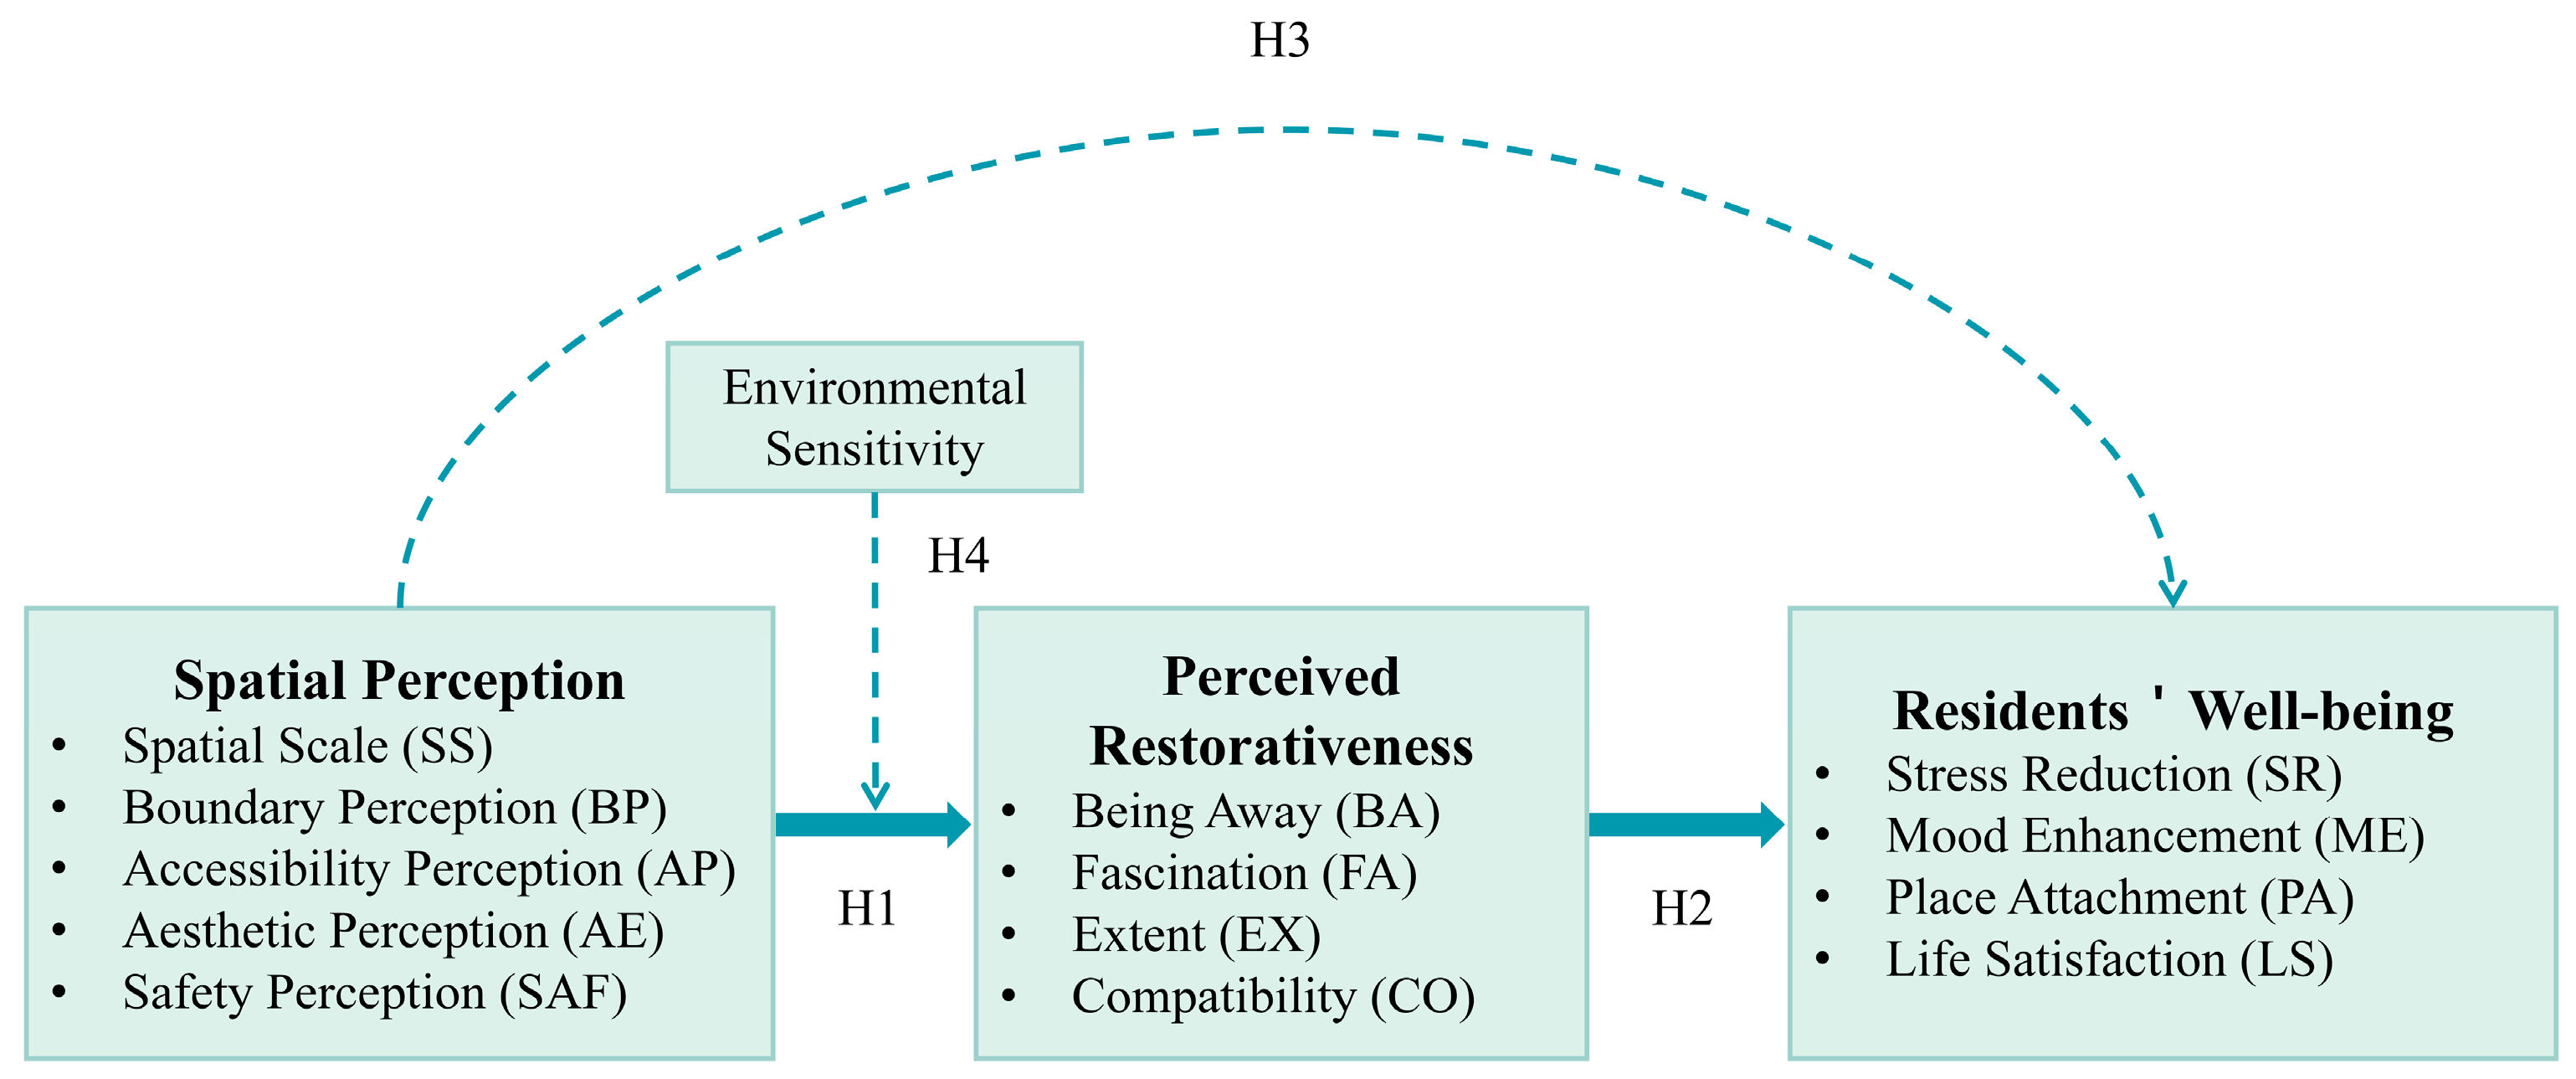
The theoretical model integrating these hypotheses is presented in Figure 1.

2.2. Study Area

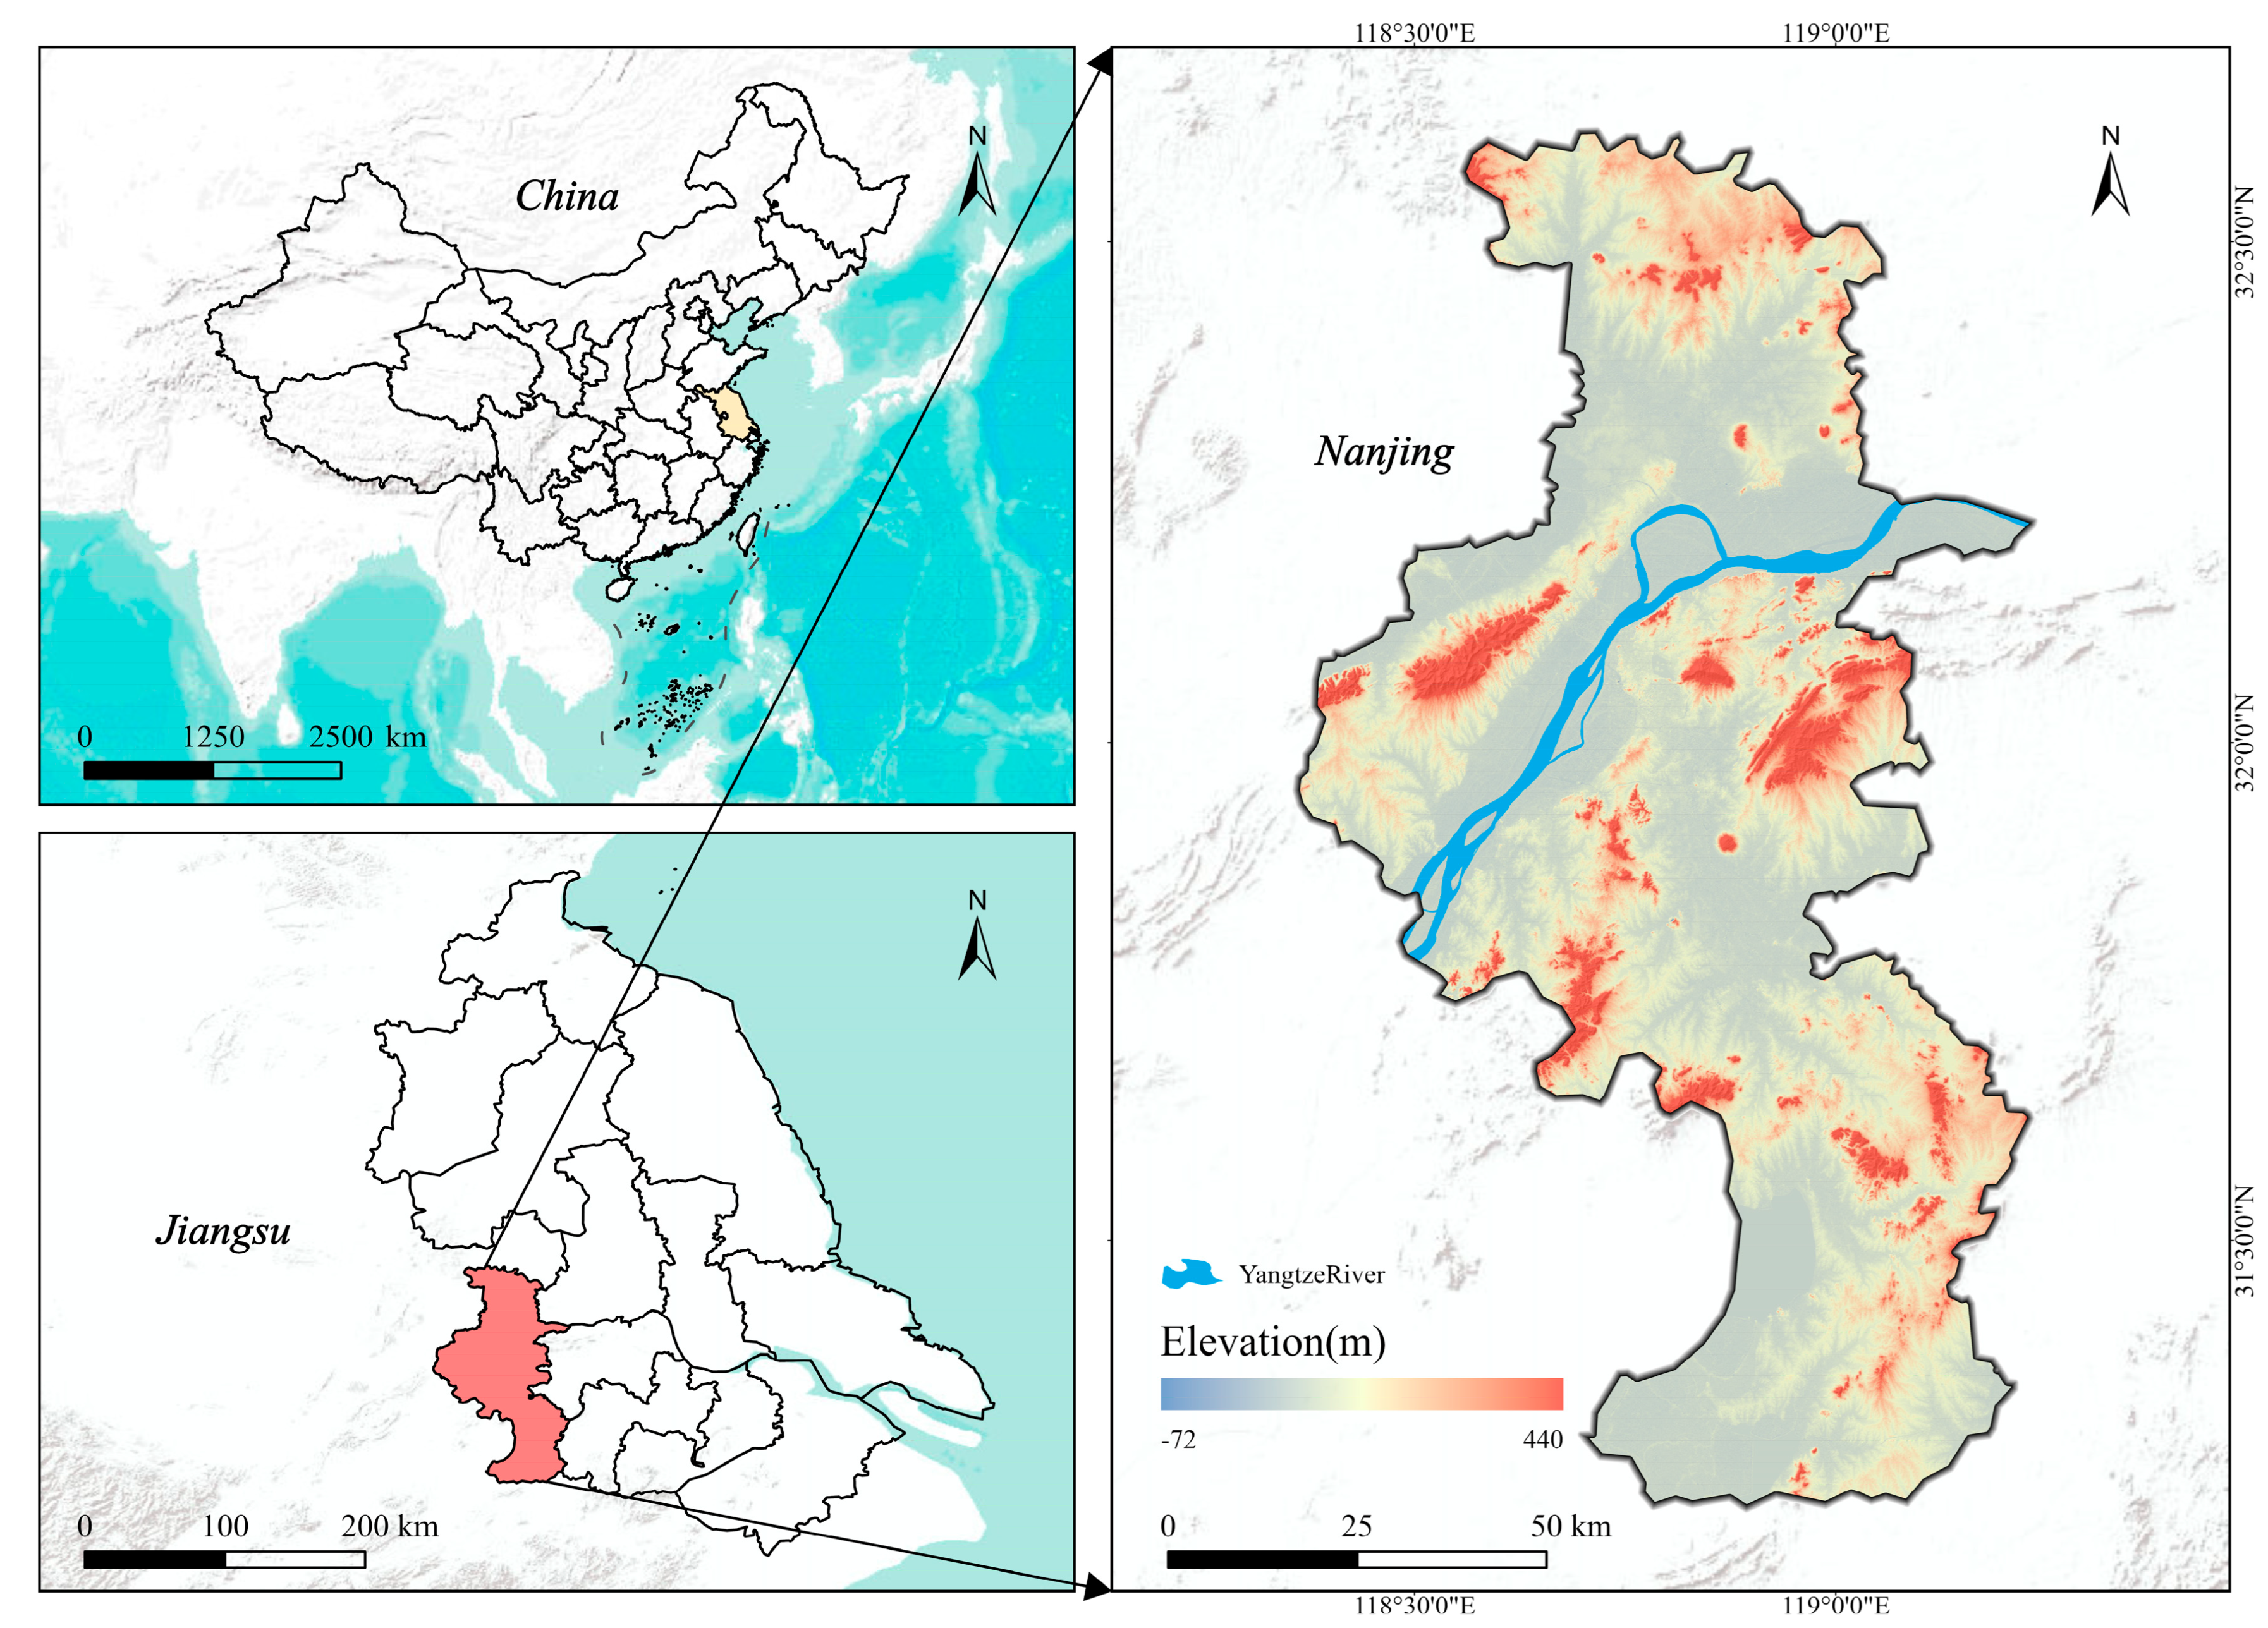
The study was conducted along the Yangtze Riverfront in Nanjing, the capital of Jiangsu Province, China. Located in the lower reaches of the Yangtze River, Nanjing’s urban area is organized on both riverbanks, forming the northern (Jiangbei) and southern (Jiangnan) districts. As a major historical and cultural city, Nanjing has implemented extensive urban renewal programs in recent years, within which riverfront regeneration and landscape improvement have been highlighted to support ecological-civilization goals and urban livability enhancement [35]. Within the municipal boundary, the Yangtze riverfront corridor spans approximately 97 km and contains heterogeneous riverfront typologies, ranging from relatively natural riparian zones to highly urbanized waterfront developments [28,35].
The geographic location of Nanjing within Jiangsu Province and China is illustrated in Figure 2.
The selection of Nanjing’s Yangtze Riverfront as the empirical setting was based on theoretical, methodological, and practical considerations. From a theoretical perspective, Nanjing exemplifies the hybrid blue–green infrastructure model that has emerged in Chinese urban riverfront development, integrating ecological restoration objectives, cultural heritage preservation, and contemporary recreational functions within a unified waterfront system. This provides an appropriate context for examining how diverse spatial configurations relate to restorative experiences within a common metropolitan governance and cultural framework. Methodologically, focusing on segments within a single city enables comparison across riverfront typologies while minimizing confounding factors that would arise in multi-city studies (e.g., regional economic disparities, climate variation, different governance structures). The recent completion of major riverfront regeneration phases (2015–2020) created substantial spatial-perceptual variation across segments while maintaining temporal comparability. Practically, the Nanjing Yangtze Riverfront spans approximately 97 km within the municipal boundary and includes a wide range of typologies from historical-cultural waterfronts to naturalistic riparian zones to contemporary leisure parks, providing the environmental diversity necessary to test the proposed framework. Regarding the areas adjacent to Nanjing’s riverfront, the upstream sections extending toward Anhui Province remain predominantly rural and agricultural with limited developed waterfront infrastructure, while downstream sections toward Zhenjiang feature smaller-scale urban waterfronts with lower visitor volumes and less intensive recreational use. By focusing on Nanjing’s municipal riverfront, the study captures the portion of the Yangtze corridor where resident–environment interactions are most frequent and where waterfront spatial qualities are most likely to be consequential for urban population health and well-being.
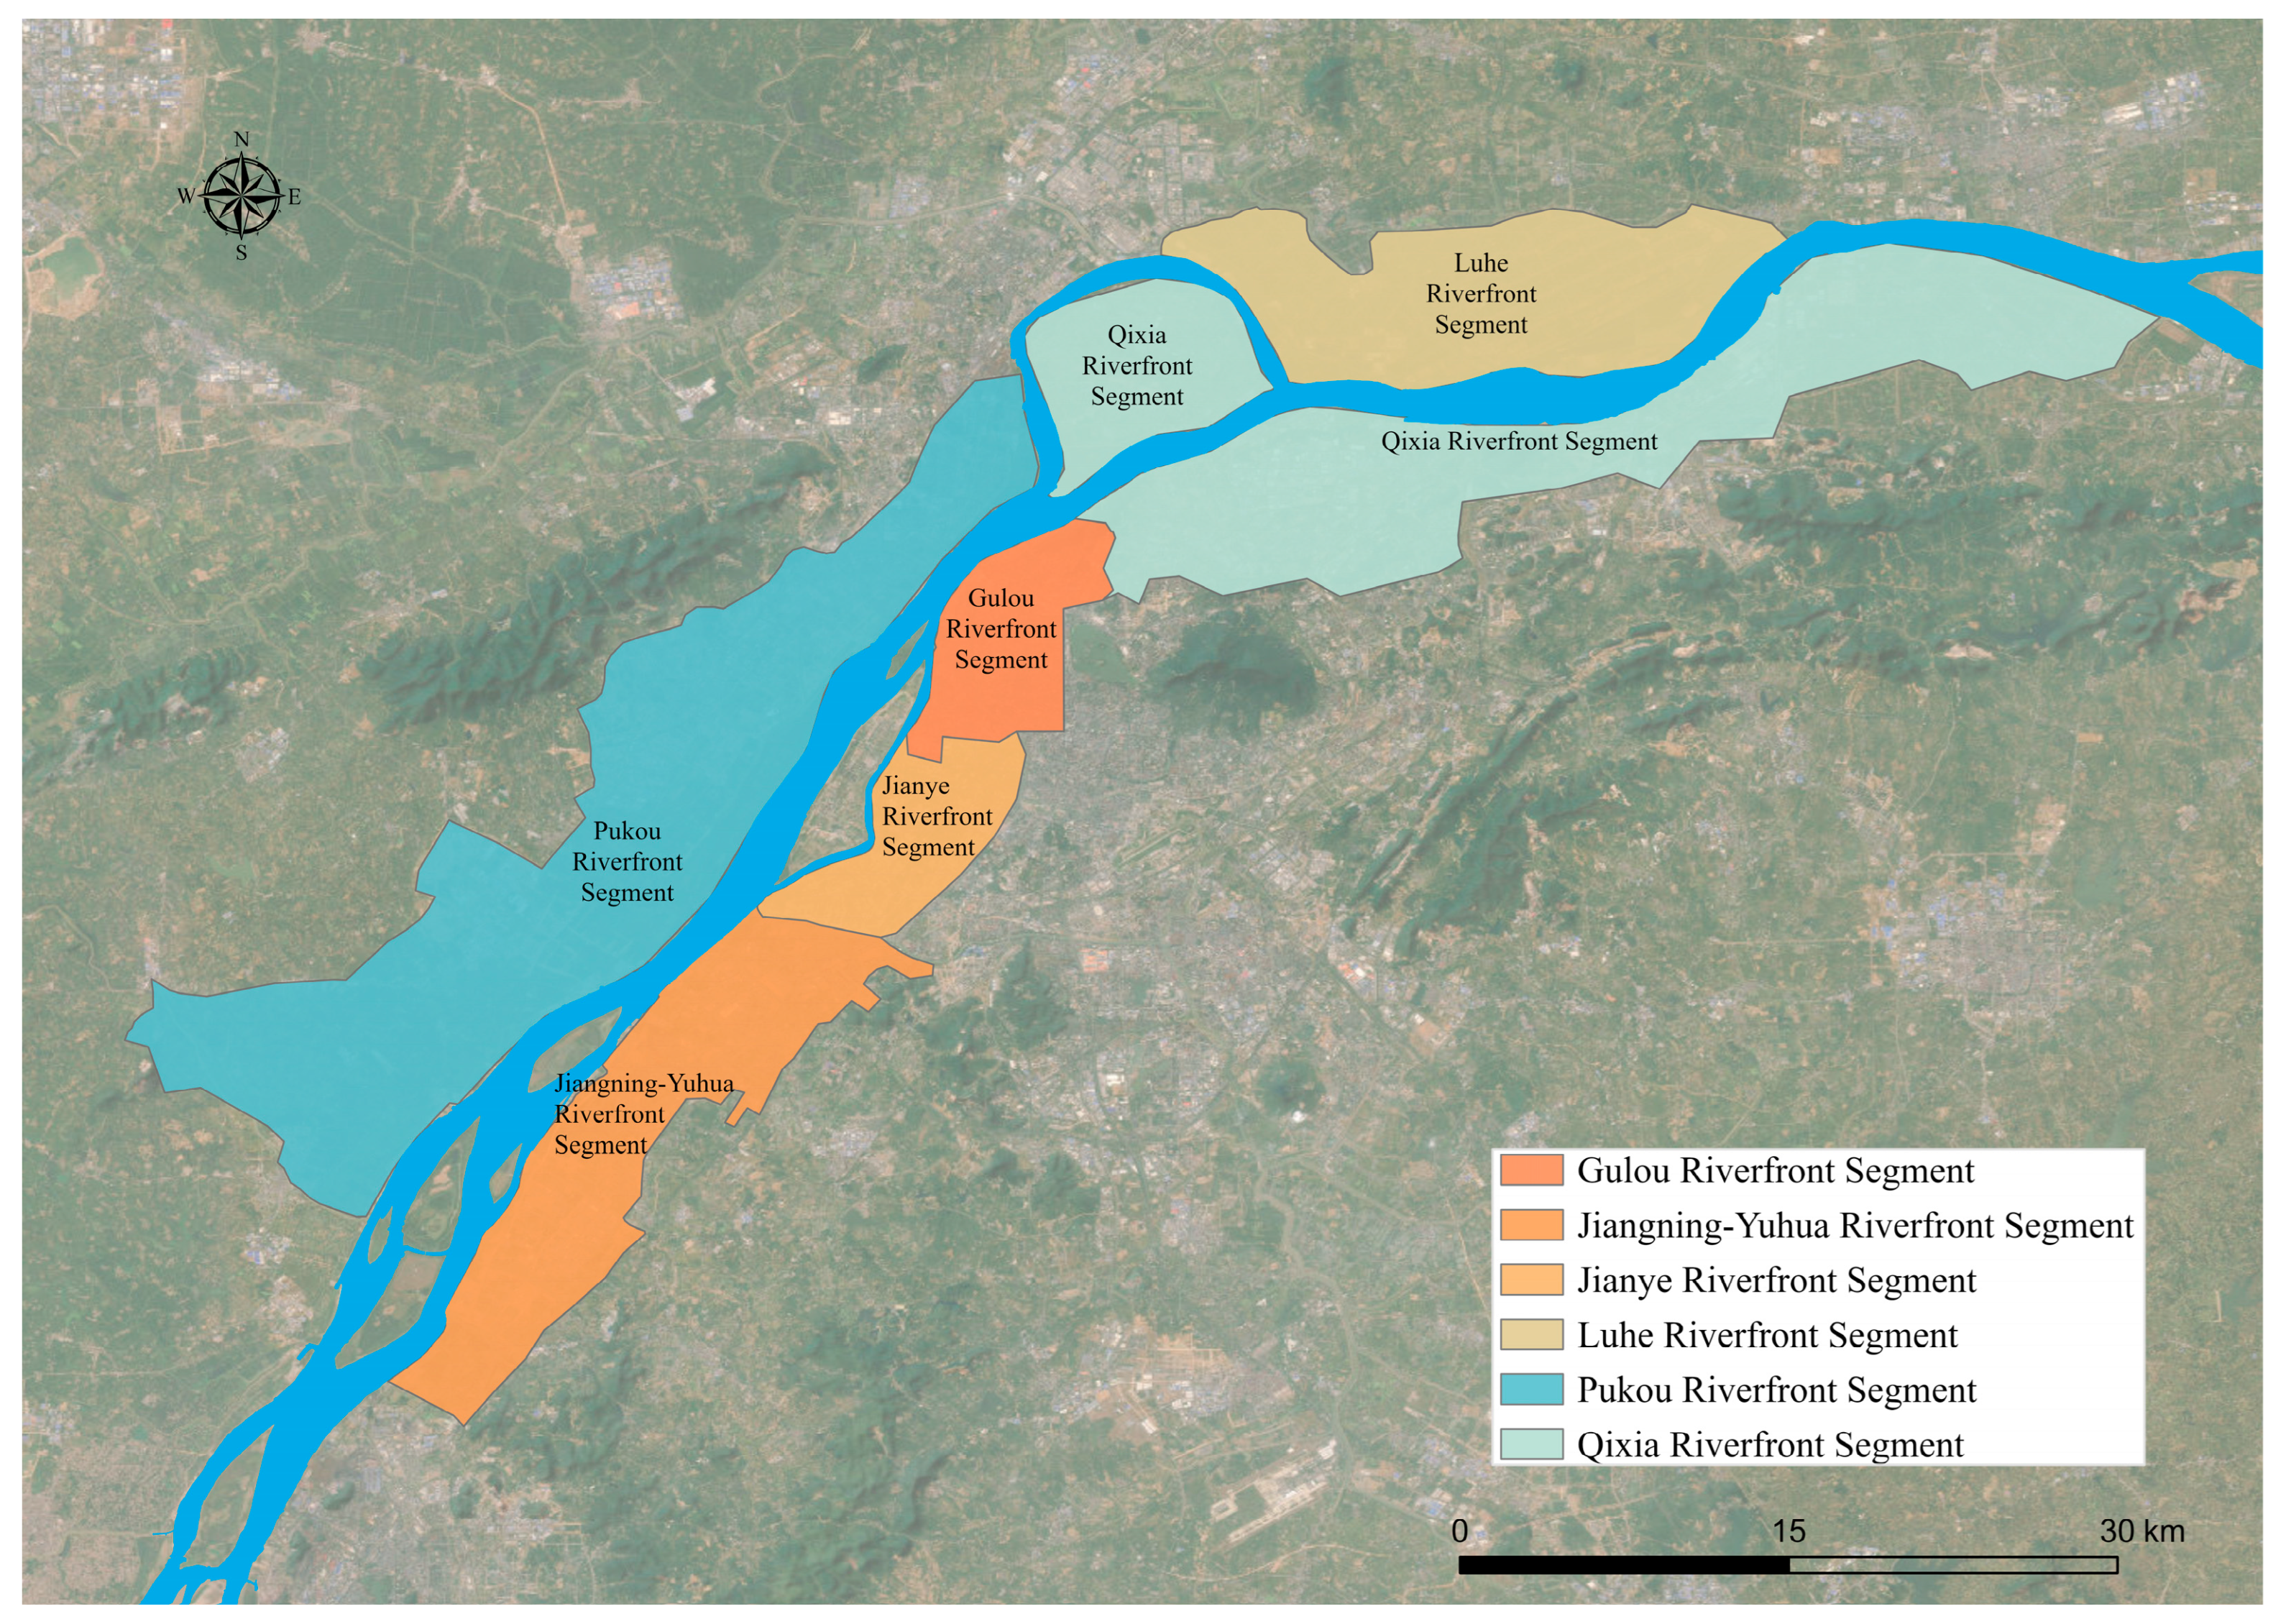
In order to capture the diversity of riverfront typologies, this study selected six riverfront segments based on administrative divisions and practical conditions: Jiangning-Yuhua Riverfront Segment, Jianye Riverfront Segment, Gulou Riverfront Segment, Qixia Riverfront Segment, Pukou Riverfront Segment, and Luhe Riverfront Segment. These segments represent the major riverfront environments in Nanjing and provide a foundation for examining variations in residents’ spatial perceptions across different riverfront settings.
The spatial distribution of the six riverfront segments within the Nanjing urban area is presented in Figure 3.

2.3. Questionnaire Design

The survey instrument consisted of seven sections and 96 items, covering respondents’ demographic characteristics, riverfront use behaviors, and key study constructs, including spatial perception, perceived restorativeness, psychological well-being, and environmental sensitivity. All scales were adapted from established measures and underwent standardized cross-cultural adaptation procedures following Beaton et al. [36]. Specifically, the questionnaire was translated using independent forward and backward translation between Chinese and English, followed by expert review by three environmental psychology researchers. Cognitive interviews with ten potential respondents were conducted to identify ambiguous wording and improve item clarity, and a pilot test (n = 50) was performed to assess preliminary reliability and refine item phrasing where necessary. All measurement instruments underwent rigorous cross-cultural adaptation procedures to support conceptual equivalence and contextual appropriateness for the Chinese riverfront setting. Following the guidelines proposed by Beaton et al. [36], the adaptation process involved: independent forward translation from English to Chinese by two bilingual researchers, synthesis and reconciliation of the forward translations, backward translation from Chinese to English by a third independent translator, expert review by a panel of three environmental psychology researchers with expertise in Chinese urban contexts to assess conceptual equivalence and cultural appropriateness, cognitive interviews with ten potential respondents to identify ambiguous or culturally inappropriate items, and pilot testing (n = 50) to assess preliminary psychometric properties. Particular attention was given during the expert review phase to ensuring that constructs and items originally developed in Western settings were conceptually appropriate for Chinese urban riverfront contexts. For instance, items in restorativeness scales that referenced “wilderness” or “escape from urban life” were modified to emphasize “natural elements integrated within urban settings” and “respite from daily routines,” reflecting the reality that Chinese riverfront spaces function as urban recreational infrastructure rather than wilderness areas. Similarly, safety-related items were adapted to reflect context-specific concerns such as water edge barriers, pedestrian-vehicle separation, and infrastructure maintenance quality, rather than crime-related fears that may be more salient in other cultural contexts. Psychological well-being was operationalized through four dimensions. Stress Reduction was assessed using six items adapted from the Perceived Stress Scale [37], which captures perceived uncontrollability and overload in daily life. Mood Enhancement was measured with six items derived from the Positive and Negative Affect Schedule [38], focusing on positive affective states associated with environmental exposure. Life Satisfaction was evaluated using six items based on the Satisfaction with Life Scale [39], a widely validated measure of global cognitive well-being judgments. Place Attachment was assessed with seven items adapted from Williams and Vaske [20], capturing both place identity and place dependence dimensions.
The Spatial Perception scale was developed through a theory-driven approach grounded in landscape spatial analysis frameworks. The selection of dimensions was guided by three primary considerations: theoretical grounding in established landscape perception research, relevance to riverfront-specific spatial characteristics, and conceptual distinctiveness to support adequate construct independence. Based on Liu and Nijhuis’s [25] systematic framework for characterizing spatial–visual landscape qualities and Jiang et al.’s [29] examination of perceptual dimensions in urban waterfront contexts, five dimensions were identified as particularly salient for riverfront environments. Spatial Scale captures perceptions of openness, enclosure, and proportional relationships between landscape elements—fundamental spatial attributes that structure environmental experience. Boundary Perception addresses the clarity, permeability, and visual quality of edges and transitions between zones, which are especially consequential in waterfront settings where land–water interfaces create defining spatial boundaries. Accessibility Perception encompasses both physical ease of approach and psychological sense of welcome, reflecting evidence that perceived accessibility mediates environmental engagement and use. Aesthetic Perception was included given consistent documentation across diverse settings of strong associations between environmental visual quality and restorative outcomes. Safety Perception was retained as a baseline enabling condition, recognizing that perceived risk or discomfort may override other spatial qualities in determining environmental experience and use. The pilot testing phase (n = 50) suggested acceptable preliminary distinctiveness among dimensions among these five dimensions, with inter-dimension correlations ranging from r = 0.35 to r = 0.54, below levels that would suggest redundancy. The questionnaire structure, constructs, and source references are summarized in Table 1.

2.4. Data Collection

Data were collected via a multi-channel hybrid sampling approach conducted between September and December 2025. To ensure a broad representation of riverfront users across different ages and digital literacy levels, the survey combined online administration (Wenjuanxing) with intensive on-site distribution. Participants were recruited via community-based WeChat groups and through on-site recruitment at key riverfront access points during both weekdays and weekends. To accommodate participants less comfortable with digital interfaces, such as elderly residents, paper-based questionnaires were provided as an alternative to digital QR codes. All paper-based responses were manually digitized by research assistants and verified through a double-entry verification process to ensure accuracy. Notably, 21.78% of the final valid sample (n = 120) was obtained through these paper-based questionnaires, which significantly improved the inclusion of older residents who are often underrepresented in purely digital surveys.
Given the recruitment approach, the study relied on convenience and snowball sampling; therefore, the resulting sample reflects voluntary participation and should not be interpreted as population-representative. Data quality control procedures followed established recommendations [40]. Responses were excluded if they met any of the following criteria: (1) missing data exceeding 10% of items; (2) completion time shorter than 5 min; (3) straight-lining (identical responses for ≥10 consecutive items); (4) failed consistency checks; or (5) respondents younger than 18 years. Of the 598 initial responses, 47 were excluded (7.9%), resulting in a final analytic sample of 551 valid questionnaires.
Sample characteristics are summarized in Table 2. The distribution of respondents across the six riverfront segments is reported in Table 3 and was relatively balanced (range: n = 78 in Gulou to n = 113 in Pukou). While sample sizes are adequate for exploratory analyses, segment-level findings should still be interpreted with caution given the convenience sampling approach. In addition, self-selection may introduce bias if individuals with stronger interests or more favorable perceptions of riverfront environments were more likely to participate; this limitation is considered when interpreting the results.

2.5. Data Analysis

Data analyses were performed using SPSS 27.0 and AMOS 26.0. SPSS 27.0 was used for descriptive statistics, internal consistency checks, and exploratory factor analysis, whereas AMOS 26.0 was used for confirmatory factor analysis and structural equation modeling. Mediation effects were tested using a nonparametric bootstrap procedure with 5000 resamples to obtain bias-corrected 95% confidence intervals for indirect effects. Moderation was examined using the PROCESS macro (Model 1) in SPSS 27.0, following the interaction-testing procedures recommended by Aiken and West [41].
Common method bias was evaluated using two complementary approaches. First, Harman’s single-factor test was conducted by loading all measurement items into an unrotated exploratory factor analysis; a single factor accounting for <50% of the total variance was taken as an initial indication that common method variance was unlikely to be a dominant concern. Second, a more stringent assessment was conducted using the unmeasured latent method construct (ULMC) technique following Kock et al. [40], in which a common latent factor was added to the confirmatory factor analysis model to capture potential method-related shared variance.
Scale reliability was assessed using Cronbach’s α, with values ≥ 0.70 indicating acceptable internal consistency. Convergent validity was evaluated using average variance extracted (AVE ≥ 0.50) and composite reliability (CR ≥ 0.70). Discriminant validity was assessed using both the traditional Fornell–Larcker criterion and the more robust heterotrait–monotrait ratio (HTMT) to rigorously establish construct distinctiveness.
Model fit was evaluated using multiple indices, with the following criteria: χ2/df < 3.0, RMSEA < 0.08, CFI > 0.90, TLI > 0.90, and SRMR < 0.08 [42]. As a contextual descriptive check, between-segment differences in mean levels of key constructs were examined using one-way ANOVA, with η2 reported as the effect size; given the uneven segment sample sizes, these segment-level comparisons were treated as exploratory. The analytical framework and corresponding statistical procedures are summarized in Table 4. The analytical workflow followed a predefined hierarchical sequence: (1) data screening and quality control, (2) descriptive statistics and internal consistency reliability assessment, (3) measurement model evaluation (EFA/CFA, convergent validity, discriminant validity, and common method bias diagnostics), (4) structural model estimation and model-fit evaluation, (5) hypothesis testing (direct effects, bootstrapped mediation, and moderation), and (6) robustness checks (e.g., exploratory subgroup/segment consistency examinations). This sequencing was designed to ensure that structural inferences were made only after establishing psychometrically acceptable measurement properties.

3. Results

3.1. Descriptive Statistics

The demographic characteristics of the respondents are summarized in Table 5. The final analytic sample comprised 551 respondents, representing a 92.1% valid-case retention rate. The sample exhibited a balanced gender distribution (56.8% female, 43.2% male) and a wide age range. Reflecting the multi-channel hybrid sampling strategy, 21.78% of the valid responses (n = 120) were collected via on-site paper-based surveys. This approach successfully ensured the representation of older residents and retired individuals (9.8%), who are often underrepresented in purely digital surveys. The majority of respondents were aged between 26 and 45 (51.5%), and nearly half held a bachelor’s degree (48.1%), consistent with the demographic profile of active urban park users in Nanjing.
In terms of usage patterns, most respondents were regular visitors, with 71% visiting the riverfront at least once a week. Walking/jogging (40.8%) and relaxation/scenery viewing (28.3%) were the primary activities, and over half of the participants (58.6%) typically stayed for more than one hour per visit. These patterns suggest that the respondents have sufficient experiential familiarity with the Nanjing Yangtze Riverfront to provide informed appraisals of its spatial and restorative qualities.
Riverfront usage behaviors are summarized in Table 6. In terms of visit frequency, 30.5% of respondents reported visiting the riverfront once per week, 26.3% visited 2–3 times per week, 20.3% visited 2–3 times per month, 14.2% visited daily, and 8.7% visited once per month or less. Regarding time spent per visit, 39.0% reported staying for 1–2 h, 33.8% for 30–60 min, 14.2% for 2–3 h, 7.6% for <30 min, and 5.4% for >3 h. Walking/jogging was the most frequently reported activity (40.8%), followed by relaxation and scenic viewing (28.3%), social activities (13.1%), exercise/sports (10.5%), and other activities (7.3%).
Descriptive statistics and the bivariate correlation matrix for all measured constructs are reported in Table 7. Mean scores for the spatial perception dimensions ranged from 3.525 (Accessibility Perception) to 3.552 (Aesthetic Perception). For perceived restorativeness, mean values ranged from 3.536 (Fascination) to 3.569 (Compatibility). Mean values for well-being dimensions ranged from 3.532 (Stress Reduction) to 3.543 (Mood Enhancement) and 3.543 (Place Attachment), with Life Satisfaction at 3.539. Environmental Sensitivity had a mean of 3.534 (SD = 0.768). Standard deviations across dimensions ranged from 0.727 to 0.831, indicating adequate dispersion in responses.
All constructs were positively intercorrelated (p < 0.001). Correlations among the higher-order constructs were notably high: Spatial Perception (M = 3.537, SD = 0.586), Perceived Restorativeness (M = 3.549, SD = 0.570), and Well-being (M = 3.539, SD = 0.559) were associated, with coefficients ranging from r = 0.250 to 0.658. Environmental Sensitivity was also strongly correlated with the other constructs (r = 0.128–0.340). Given the magnitude of these correlations, results are interpreted with caution because high intercorrelations may reflect conceptual proximity among self-report measures and/or shared-method variance. Accordingly, subsequent measurement-model assessments (e.g., discriminant validity and common method bias diagnostics) were used to evaluate whether the constructs could be empirically distinguished prior to testing the structural relations.

3.2. Measurement Model Evaluation

3.2.1. Reliability Analysis

Internal consistency reliability was evaluated using Cronbach’s α (Table 8). All first-order scales met the recommended criterion (α ≥ 0.70), with α values ranging from 0.801 (Fascination) to 0.895 (Aesthetic Perception), indicating acceptable to high internal consistency. The higher-order constructs also demonstrated very high internal consistency: Perceived Restorativeness (α = 0.859), Spatial Perception (α = 0.940), and Well-being (α = 0.911). While these values suggest strong consistency, very high α coefficients may also indicate item overlap or content redundancy; therefore, convergent and discriminant validity were further examined in the subsequent measurement-model evaluation.

3.2.2. Convergent Validity

Convergent validity was evaluated using confirmatory factor analysis (CFA). As reported in Table 9, standardized factor loadings ranged from 0.680 to 0.780, meeting the commonly recommended criterion (≥0.60). The average variance extracted (AVE) values ranged from 0.501 to 0.556, exceeding the 0.50 benchmark, and composite reliability (CR) values ranged from 0.866 to 0.895, above the 0.70 threshold. Collectively, these indicators provide support for adequate convergent validity across the measured constructs.

3.2.3. Discriminant Validity

Discriminant validity was assessed using the Fornell–Larcker criterion [43]. The Fornell–Larcker results are presented in Table 10. Because the constructs examined in this study reflect theoretically adjacent components of a coherent person–environment process (spatial perception → perceived restorativeness → well-being), relatively low inter-construct associations are conceptually expected.
To provide a more stringent assessment of discriminant validity, HTMT values were computed [43]. As reported in Table 11, HTMT values ranged from 0.79 to 0.89, with several pairs approaching the more conservative 0.85 guideline. Given that spatial perception, perceived restorativeness, and well-being are theorized as closely related components within a sequential restorative process, moderate-to-high associations are conceptually expected. Importantly, all HTMT values remained below the commonly used 0.90 threshold for conceptually related constructs. In addition, the Fornell–Larcker criterion was satisfied for all construct pairs (Table 10), indicating that the square root of AVE exceeded the corresponding inter-construct correlations, which provides convergent support for discriminant validity. Taken together, these results suggest that the constructs can be distinguished at a level acceptable for the intended structural modeling, while interpretations remain cautious given the conceptual proximity of self-report measures. Future work could further strengthen this evidence by reporting HTMT bootstrap confidence intervals and/or comparing competing (e.g., higher-order or merged-construct) measurement models.

3.2.4. Common Method Bias Assessment

Because all measures were collected via self-report questionnaires at a single time point, the potential for common method bias (CMB) was evaluated using two complementary diagnostics following Kock et al. [40]. First, Harman’s single-factor test was conducted by entering all 81 measurement items into an unrotated exploratory factor analysis. As shown in Table 12, the first factor accounted for 19.214% of the total variance, well below the conventional 50% heuristic, suggesting that common method variance may be present to some extent in this cross-sectional self-report dataset. However, given that Harman’s test is widely regarded as a coarse and relatively insensitive diagnostic rather than a definitive test of method bias, this result was treated as an initial signal rather than conclusive evidence. Therefore, a more stringent follow-up assessment was performed using the unmeasured latent method construct (ULMC) approach.
Second, a more stringent assessment was conducted using the unmeasured latent method construct (ULMC) technique [40]. A common latent factor was added to the CFA model with paths specified to all indicators. As reported in Table 13, the average substantive factor loading (0.772) substantially exceeded the average method loading (0.186), yielding a substantive-to-method loading ratio of 4.15:1, which is well above the commonly referenced 2:1 guideline. In addition, introducing the method factor did not yield a statistically significant improvement in model fit (Δχ2 = 18.42, Δdf = 14, p = 0.188). Collectively, these findings indicate that while method variance cannot be entirely eliminated in a single-source, single-wave survey, it is unlikely to be the dominant driver of the observed relationships. Accordingly, the results are reported as associations, and any causal interpretations are discussed with appropriate caution.

3.3. Structural Model and Hypothesis Testing

The structural model was estimated using structural equation modeling (SEM) in AMOS 26.0. Maximum likelihood estimation was applied, and bootstrap resampling (5000 samples) was used to evaluate the statistical significance of path coefficients and indirect effects. As reported in Table 14, the model exhibited an acceptable-to-good fit to the data: χ2/df = 1.062, RMSEA = 0.011, CFI = 0.991, TLI = 0.991, and SRMR = 0.036. Overall, these indices indicate that the specified model provides a satisfactory approximation of the observed covariance structure and supports proceeding to hypothesis testing. These fit indices are notably strong. To clarify the modeling approach, the structural model was specified a priori according to the theoretical framework presented in Figure 1, and no post hoc structural paths were added for the purpose of improving model fit. Correlated residuals were not introduced at the structural level. Where applicable, any correlated residuals in the measurement model were specified only when theoretically justified within the same construct (e.g., similarly worded items), rather than as a data-driven strategy to inflate global fit. The strong fit may reflect the theoretical coherence of the ART/SRT-informed framework, the rigorous instrument adaptation procedures, and the adequate sample size supporting stable parameter estimation. Nevertheless, interpretation prioritizes effect sizes and validity diagnostics (e.g., discriminant validity and common method bias assessments) rather than relying solely on global fit indices.
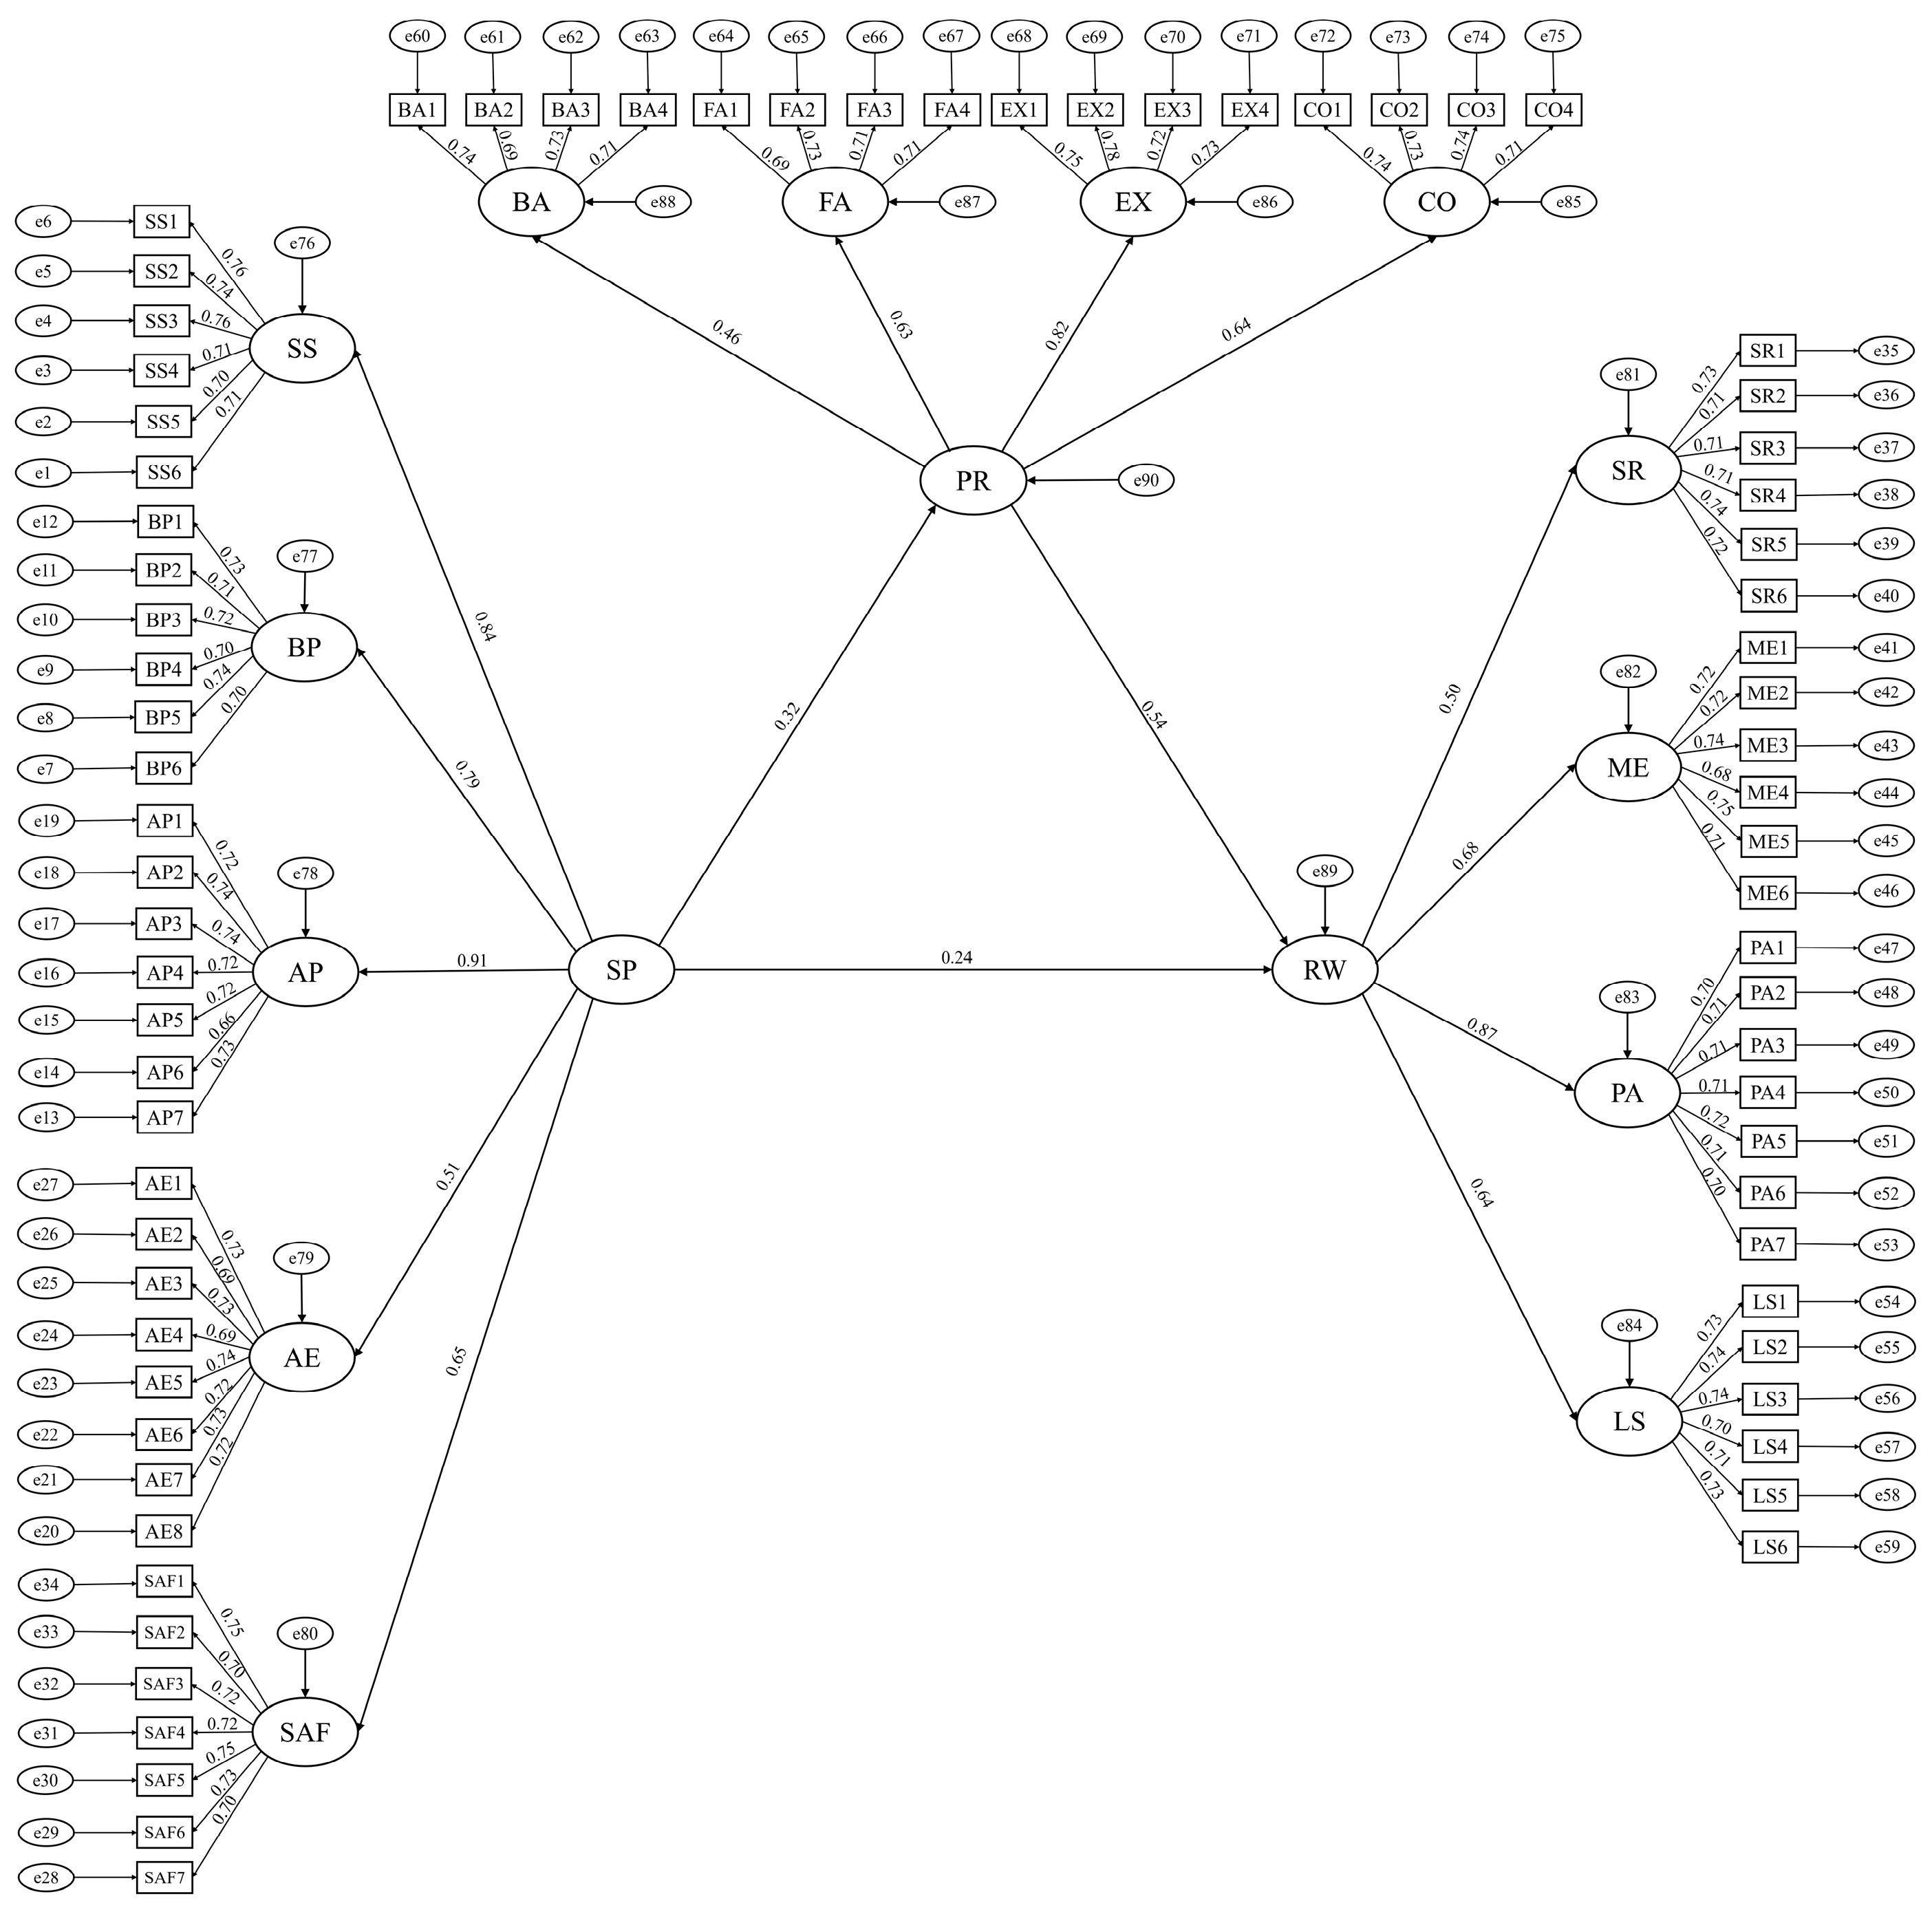
The structural model with standardized path coefficients is depicted in Figure 4. Path analysis results and hypothesis testing outcomes are presented in Table 15.
H1 hypothesized that spatial perception of riverfront landscapes is positively associated with perceived restorativeness. The SEM results indicated a strong, statistically significant association between spatial perception and perceived restorativeness (β = 0.320, p < 0.001), with the model accounting for a substantial proportion of variance in perceived restorativeness (R2 = 0.102). Accordingly, H1 was supported.
H2 posited that perceived restorativeness is positively associated with residents’ well-being. Controlling for the direct effect of spatial perception, perceived restorativeness remained significantly associated with overall well-being (β = 0.540, p < 0.001), with the model accounting for a substantial proportion of variance in perceived restorativeness (R2 = 0.434), supporting H2.

3.4. Mediation Analysis

H3 proposed that perceived restorativeness mediates the association between spatial perception and residents’ well-being. Mediation results are summarized in Table 16. The total effect of spatial perception on well-being was significant (β = 0.415, p < 0.001). After introducing perceived restorativeness as a mediator, the direct effect of spatial perception on well-being remained significant (β = 0.242, p < 0.001), and the indirect effect via perceived restorativeness was also significant (β = 0.173, 95% bootstrap CI [0.105, 0.259]). Because the bootstrap confidence interval did not include zero, the indirect effect was supported. Taken together, the simultaneous significance of both the direct and indirect paths indicates partial mediation. The indirect pathway accounted for 41.69% of the total effect, suggesting that perceived restorativeness explains a meaningful portion of the spatial perception–well-being association. Therefore, H3 was supported.

3.5. Moderation Analysis

H4 proposed that environmental sensitivity moderates the association between spatial perception and perceived restorativeness, such that the association would be stronger at higher levels of environmental sensitivity. Moderation was tested using hierarchical regression with an interaction term, following Aiken and West [41]. As reported in Table 17, the interaction between Spatial Perception and Environmental Sensitivity was statistically significant and positive (β = 0.799, p < 0.001).
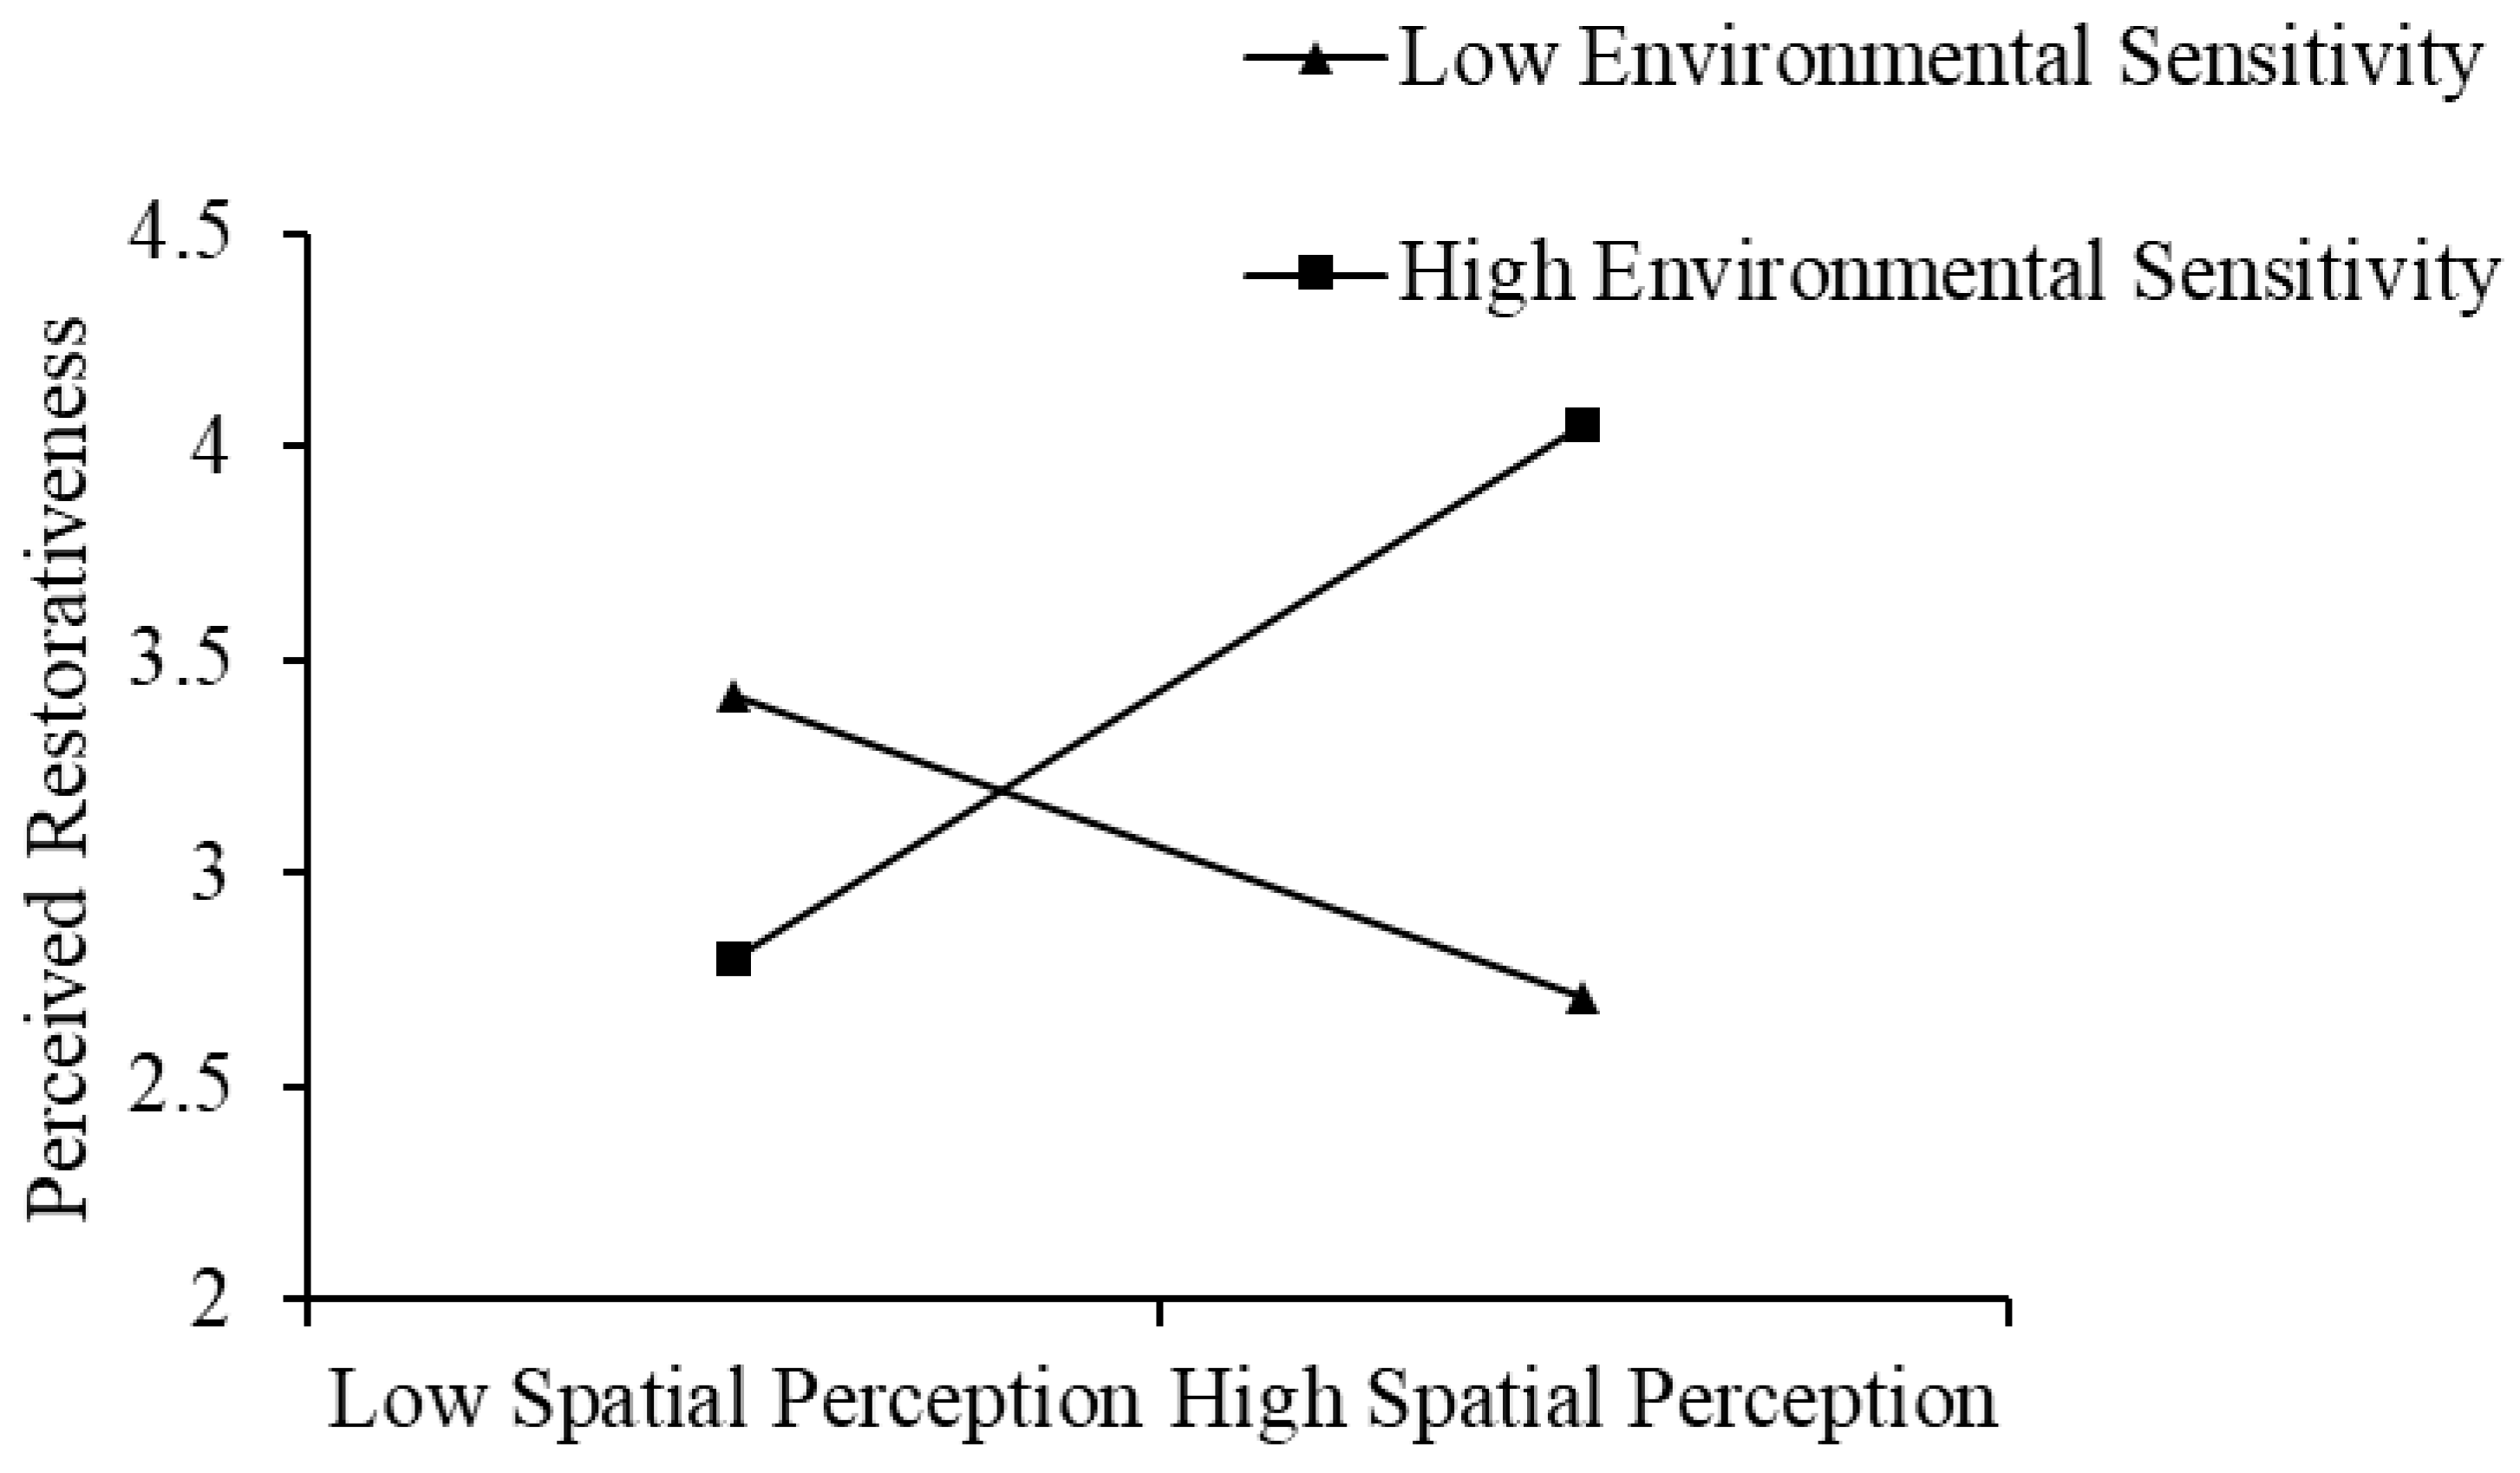
The positive interaction indicates an amplification effect: the positive association between spatial perception and perceived restorativeness was stronger at higher levels of environmental sensitivity, consistent with the hypothesized direction. Simple-slopes analysis (Figure 5) showed that at high environmental sensitivity (+1 SD), spatial perception remained positively associated with perceived restorativeness but with a stronger slope (β = 0.936, p < 0.001), whereas at low environmental sensitivity (−1 SD), the association became negative (β = −0.529, p < 0.001). These contrasting slopes reveal a significant crossover interaction: while spatial perception strongly predicts restorativeness for highly sensitive individuals, it shows an inverse relationship for those with low sensitivity.

3.6. Segment-Level Differences (One-Way ANOVA)

To explore potential segment-level variation across the six riverfront areas, we conducted one-way ANOVA with Bonferroni-adjusted post hoc comparisons and reported η2 as an effect size. These analyses are presented as exploratory/descriptive, and the six segments were selected primarily to cover diverse riverfront context typologies rather than to support strict group comparisons.
As shown in Table 18, mean levels of several constructs differed across segments; however, practical significance should be interpreted cautiously given small effect sizes. Spatial perception varied across segments (F = 3.642, p = 0.003, η2 = 0.032), accounting for approximately 3% of the total variance in mean differences, with Pukou (S5) showing higher mean values (M = 3.862) and Jiangning (S1) lower mean values (M = 3.464). Perceived restorativeness also differed (F = 6.622, p < 0.001, η2 = 0.057), accounting for approximately 6% of the total variance, with a broadly similar directional pattern across segments. Well-being showed segment-level variation (F = 9.328, p < 0.001, η2 = 0.079), accounting for approximately 8% of the total variance, with comparatively higher mean values in Gulou (S3). Environmental sensitivity showed no evidence of segment-level differences (F = 2.055, p = 0.070, η2 = 0.019). Overall, the modest η2 values suggest limited between-segment explanatory power relative to within-segment heterogeneity and individual-level differences. These segment comparisons were exploratory, based on convenience sampling across typologically diverse riverfront areas, and unequal sample sizes (n = 78 to 113) further limit generalizability. Accordingly, the results provide descriptive context on spatial variation within the Nanjing riverfront rather than evidence supporting definitive typology-based comparisons or strong between-segment inference.
Bonferroni-adjusted pairwise comparisons suggested that Qixia (S4) differed from Luhe (S6) and Jiangning (S1) on spatial perception and perceived restorativeness (p < 0.05). However, given the imbalance in segment sample sizes and the exploratory intent of these analyses, these patterns should be interpreted as indicative rather than confirmatory, and are used to provide contextual information rather than as a basis for strong between-segment inference.

3.7. Summary of Hypothesis Testing

The structural model explained a large proportion of variance in residents’ well-being (R2 = 0.434). This level of explained variance should be interpreted with caution given the single-source, cross-sectional self-report design and the conceptual proximity among the measured constructs, which may inflate shared variance. Table 19 summarizes the hypothesis-testing results. The hypothesized positive associations were supported for H1 and its sub-hypotheses (H1a–H1e), H2 and its sub-hypotheses (H2a–H2d), as well as the mediation hypothesis H3. The moderation hypothesis H4 was supported, with the interaction effect consistent with the hypothesized direction.

3.8. Robustness Checks and Subgroup Consistency

Although formal multi-group structural equation modeling (e.g., invariance testing) was beyond the scope of the current study, we conducted preliminary subgroup consistency checks to assess whether the observed associations were broadly stable across major sample characteristics. The sample included a balanced gender distribution (43.2% male, 56.8% female), diverse age representation (18–65+ years), and variation in education levels (67.3% bachelor’s degree or higher). We computed subgroup-specific bivariate correlations among spatial perception, perceived restorativeness, and well-being and found broadly similar directions and magnitudes across gender groups, age cohorts, and education levels, with no subgroup showing qualitatively contradictory patterns. Descriptive comparisons across the six riverfront segments similarly indicated that, although mean levels differed (Section 3.6), the direction of associations among key constructs remained consistent across segments. These observations, together with the overall sample size (N = 551) and the theoretical coherence of the proposed framework, suggest that the main findings are unlikely to be driven solely by a single demographic subgroup or segment-specific composition effects. Nevertheless, we acknowledge that formal multi-group invariance testing would provide more rigorous evidence of measurement and structural stability and should be prioritized in future validation work.

4. Discussion

4.1. Summary of Key Findings

This study examined the relationships among spatial perception, perceived restorativeness, environmental sensitivity, and residents’ well-being along the Nanjing Yangtze Riverfront. By operationalizing spatial perception as a multidimensional construct, this study contributes to research on urban blue–green infrastructure and well-being, offering an integrative person–environment perspective consistent with restorative environment theories.
SEM results indicated that spatial perception was positively associated with perceived restorativeness (H1: β = 0.320, p < 0.001), and perceived restorativeness was positively associated with residents’ well-being (H2: β = 0.540, p < 0.001). Given the cross-sectional, single-source self-report design, these estimates are interpreted as associations consistent with the proposed restorative process, rather than definitive causal effects. Mediation analysis further supported partial mediation (H3), with an indirect effect of β = 0.173 (95% bootstrap CI [0.105, 0.259]) accounting for 41.69% of the total effect. Moderation analysis revealed a statistically significant positive interaction (H4: β = 0.799, p < 0.001), indicating that the spatial perception–restorativeness association was stronger among individuals with higher environmental sensitivity, consistent with the hypothesized direction. The model accounted for a moderate proportion of variance in well-being (R2 = 0.434); however, this level of explained variance should be interpreted cautiously in light of potential shared-method variance and conceptual proximity among self-report constructs, despite the measurement diagnostics conducted to assess discriminant validity and common method bias.
Before examining the theoretical implications in detail, it is important to situate these findings within the broader context of blue–green infrastructure research and acknowledge the cultural and geographic specificity of the Nanjing riverfront setting. Urban riverfront regeneration in China often involves the concurrent pursuit of ecological restoration, cultural heritage preservation, and rapid urban development within relatively compressed timeframes. The Nanjing Yangtze Riverfront exemplifies this pattern, with segments integrating industrial heritage (e.g., Pukou), natural/geological features (e.g., Qixia), and contemporary recreational infrastructure (e.g., Jianye) within a single metropolitan waterfront system. This context may shape the salience and interpretation of specific spatial qualities.
The prominence of aesthetic perception as the strongest predictor of restorativeness (β = 0.265) may partly reflect context-dependent aesthetic norms and planning practices that influence how residents evaluate curated riverfront environments. Conversely, the comparatively modest association between safety perception and restorativeness (β = 0.204) may indicate that safety concerns are less salient for everyday riverfront use in this context; however, this interpretation remains context-specific and would benefit from corroboration using objective indicators (e.g., safety incident records, lighting/visibility audits, or perceived safety heterogeneity across segments). The segment-level variation further highlights that “urban riverfront” is not a uniform category but comprises diverse typologies with potentially distinct restorative affordances. The strong performance of both culturally embedded segments and naturalistic segments suggests that cultural meaning-making and ecological authenticity may both contribute to restorative appraisals—potentially through partially distinct pathways—rather than functioning as mutually exclusive sources of restorative potential. Overall, the findings are best interpreted as evidence of general relational patterns within a specific socio-cultural setting, and direct transferability to other geographic and cultural contexts should be treated cautiously.

4.2. Theoretical Implications

4.2.1. Spatial Perception and Perceived Restorativeness (H1)

The positive association between spatial perception and perceived restorativeness is consistent with core propositions in environmental psychology that emphasize perceptual appraisal as a key pathway through which environmental characteristics relate to psychological outcomes [4,5]. In the present model, the standardized association was moderate (β = 0.320), indicating that spatial perception explains approximately 10.2% of variance in perceived restorativeness. Riverfront environments that combine water, vegetation, and open views may plausibly enhance restorative appraisals. The magnitude of this coefficient is within the typical range observed in environmental psychology research and is less likely to be inflated by shared-method variance compared to higher estimates sometimes reported in single-source studies. Accordingly, the estimate is interpreted as evidence of a meaningful positive association consistent with theoretical expectations [14,15,44].
At the dimensional level, Aesthetic Perception showed the largest standardized association with perceived restorativeness (β = 0.265), followed by Accessibility Perception (β = 0.221) and Safety Perception (β = 0.204). These patterns are broadly consistent with Attention Restoration Theory (ART) [11], which posits that restorative environments support recovery through qualities that attract effortless attention and provide an interpretable, supportive setting. The prominence of aesthetic perception aligns with ART’s emphasis on fascination, whereby visually engaging scenes facilitate “soft fascination” and thereby support recovery of directed attention [11,12]. The associations of accessibility and safety with restorativeness are also theoretically plausible: environments that are easy to approach and navigate, and that are perceived as secure and comfortable, may strengthen perceived compatibility (fit with intended activities) and the experience of extent (the sense of coherent scope), thereby supporting restorative appraisal [11,45].
The findings are also compatible with Stress Reduction Theory (SRT) [13], which highlights rapid affective and physiological responses to natural settings. From an SRT perspective, favorable spatial attributes in riverfront landscapes may promote positive affect and reduce stress-related arousal, which can manifest as higher perceived restorativeness [13,46]. Taken together, the results support the practical value of integrating ART and SRT in a unified framework, as suggested in prior scholarship [14,27], while underscoring the importance of interpreting the strength of associations in light of measurement and design characteristics.

4.2.2. Perceived Restorativeness and Well-Being (H2)

The positive associations between perceived restorativeness and residents’ well-being across all four outcome dimensions (stress reduction, mood enhancement, place attachment, and life satisfaction) are consistent with prior work demonstrating the psychological benefits associated with restorative environments [5,6,8]. In the present study, perceived restorativeness showed a substantial positive association with overall well-being (β = 0.540, p < 0.001). Given the conceptual proximity among self-report well-being indicators and the cross-sectional single-source design, this coefficient is interpreted as indicating a meaningful linkage between restorative appraisal and well-being facets [17,18,47].
The comparatively strong linkage with place attachment is theoretically plausible and aligns with perspectives emphasizing that psychologically beneficial environments can foster meaningful person–place bonds that are themselves implicated in well-being [19,20,21]. Prior studies have shown close connections between restorative experiences and place-based relationships (including potential reciprocal dynamics) [17]. Extending this literature, the current model positions place attachment as a salient well-being-related outcome associated with perceived restorativeness within an integrated framework, while underscoring the need for longitudinal or multi-source designs to clarify temporal ordering and causal direction.

4.2.3. Mediation Effect of Perceived Restorativeness (H3)

The mediation results support perceived restorativeness as a partial mediator linking spatial perception to well-being (indirect effect = 0.173; proportion mediated = 41.69%), which is consistent with integrative models emphasizing perceptual appraisal and restorative processing as key pathways from environmental experience to psychological outcomes [14,17,31]. The presence of partial mediation suggests that restorative appraisal constitutes an important—but not exclusive—mechanism through which spatial environmental perceptions relate to well-being, implying that additional pathways (e.g., affective responses, activity engagement, social interaction, or place-related meanings) may also contribute. This interpretation aligns with prior evidence that perceived restorativeness can transmit the influence of environmental features to mental health-related outcomes in other settings [44].
The observed mediated proportion (41.69%) is broadly comparable to values reported in related studies on urban nature contexts, while not necessarily implying direct cross-study equivalence due to differences in settings, measures, and model specifications. For example, Peschardt and Stigsdotter [48] reported mediation proportions above 40% in an urban park context. One plausible implication is that riverfront environments may involve additional experiential components beyond those typically captured by conventional restorative constructs. In particular, water-related features could introduce sensory and symbolic cues—such as visual dynamics, acoustic qualities, and culturally embedded meanings—that may shape well-being through complementary pathways [9,49]. These possibilities remain inferential in the present study and warrant targeted measurement and longitudinal or multi-source designs to clarify mechanisms and temporal ordering.
A fundamental limitation of the mediation analysis is the cross-sectional design. While the hypothesized perception–restorativeness–well-being sequence is theoretically grounded in ART and SRT and receives statistical support in the present data, temporal ordering cannot be verified from cross-sectional data alone. Reverse or reciprocal pathways are also plausible: individuals with higher baseline well-being may appraise environments more favorably, leading to higher perceived restorativeness and more positive spatial perceptions, and place-related meanings may co-evolve with well-being through repeated visits and accumulated experiences. Accordingly, the mediation results should be interpreted as evidence of theoretically consistent associations and a plausible explanatory mechanism rather than definitive proof of causal directionality.

4.2.4. Moderation Effect of Environmental Sensitivity (H4)

The moderation analysis indicated that environmental sensitivity significantly moderated the spatial perception–restorativeness association (β = 0.799, p < 0.001), with a substantial effect size (R2 = 0.655). Consistent with the hypothesized strengthening effect, the positive coefficient suggests an amplification pattern, whereby the positive association between spatial perception and perceived restorativeness becomes stronger at higher levels of environmental sensitivity. This finding supports environmental sensitivity as a meaningful boundary condition that enhances the perception–restoration pathway.
Simple-slopes analysis revealed a notable pattern: at high environmental sensitivity (+1 SD), spatial perception was strongly positively associated with perceived restorativeness (β = 0.936, p < 0.001), whereas at low environmental sensitivity (−1 SD), the association was negative (β = −0.529, p < 0.001). This crossover interaction suggests that environmental sensitivity fundamentally shapes how individuals translate spatial perceptions into restorative appraisals. For highly sensitive individuals, favorable spatial qualities substantially enhance restorative experiences; for less sensitive individuals, spatial perception alone may be insufficient or even inversely related to restorativeness, possibly because highly structured or ‘over-designed’ environments may paradoxically increase cognitive load for individuals who prefer low-arousal or more ‘wild’ natural settings, rather than providing the expected restoration.
This finding aligns with theoretical perspectives suggesting that environmentally sensitive individuals are more attuned to and responsive to environmental stimuli, including both positive and negative qualities [23,31]. From an Attention Restoration Theory perspective, highly sensitive individuals may more readily perceive and benefit from the fascination, extent, and compatibility qualities embedded in well-designed riverfront spaces [11,12]. From a practical standpoint, this result suggests that spatial-design improvements may produce particularly strong restorative gains for environmentally sensitive users, while less sensitive individuals may require complementary interventions (e.g., programmatic activities, social facilitation, or multisensory engagement) to achieve comparable restorative outcomes [4,6].
From a building science perspective, this necessitates the creation of ‘Quiet Zones’ or sensory-friendly micro-spaces within riverfront parks. Prioritizing the needs of these sensitive groups is not merely a design preference but a matter of social sustainability and environmental justice, ensuring that urban infrastructure supports the mental health of all residents, including neurodiverse populations. From an urban resilience perspective, this necessitates a move toward “Neuro-inclusive Design.” Riverfronts should incorporate “Sensory Refuges”—sub-spaces with low-density planting, acoustic buffering from city noise, and non-reflective materials. By designing for the most sensitive 20% of the population, we inherently create more comfortable environments for the remaining 80%. This aligns with the broader goals of Social Sustainability within the Buildings framework, ensuring that blue–green infrastructure serves as an equitable public health resource rather than a source of sensory overload.
Beyond the design implications discussed above, the crossover pattern requires deeper theoretical interpretation. The negative slope at low environmental sensitivity challenges conventional restorative environment theory and suggests that spatial perception alone may be insufficient or counterproductive for individuals with low environmental attunement. From a cognitive load perspective, highly structured or visually complex riverfront environments may impose processing demands exceeding the cognitive resources or motivation of low-sensitivity individuals. For these users, elaborate spatial design elements intended to enhance aesthetic appeal may paradoxically increase perceptual burden rather than facilitate restoration, particularly if they prefer simpler, less visually demanding natural settings. Alternatively, the negative association may reflect preference-mismatch effects. Low-sensitivity individuals may prioritize functional attributes over perceptual-aesthetic qualities. When spatial perception emphasizes visual aesthetic dimensions without addressing functional needs, these users may experience reduced satisfaction and lower restorative appraisal. While the interaction was tested using mean-centered continuous variables appropriate for linear interactions, this approach may not fully capture threshold effects or nonlinear relationships across the full sensitivity spectrum that could further clarify this unexpected pattern.

4.2.5. Differentiated Spatial Perception Characteristics of Riverfront Segments

The one-way ANOVA results reveal significant spatial heterogeneity in residents’ perceptions and well-being outcomes across the six riverfront segments. Based on the mean scores (M), the segments can be categorized into three distinct performance tiers:
  • High-Performance Restorative Zones: S5 (Pukou) and S3 (Gulou)
S5 (Pukou Segment): Data indicate that S5 (Pukou Segment) ranks highest in both spatial perception (M = 3.862) and environmental sensitivity (M = 3.825). This underscores the unique appeal of the ‘Industrial Heritage + Natural Wetland’ model. The Pukou segment preserves historically significant industrial cultural landscapes while integrating them with ecological wetlands through recent urban renewal. This synergy provides high visual complexity and a sense of cultural belonging. Additionally, the large area of waterfront exposure in this segment, with expansive river views, likely contributes to its high scores in spatial perception and perceived restorativeness, enhancing the sense of fascination and extent. Such an ‘interwoven’ spatial character reinforces the restorative qualities of the riverfront environment, aligning with Attention Restoration Theory’s emphasis on visual engagement and ‘soft fascination’.
S3 (Gulou Segment): This segment, featuring the Muyan Riverside Scenic Area, demonstrates the strongest impact on restorativeness (M = 3.820). This performance can be attributed to its profound cultural heritage and excellent accessibility in the city center, facilitating a seamless transition between the ‘fast-paced city’ and ‘slow-paced nature,’ thus providing an ideal psychological buffer for residents.
2.
Balanced Restorative Zones: S2 (Jianye) and S4 (Qixia)
These two segments exhibit stable restorative functions with relatively similar mean scores across dimensions (M≈3.6–3.7).
S2 (Jianye Segment): Leveraging high green coverage and sophisticated infrastructure—including the Yuzui Wetland Park and Green Expo Park—this segment shows the highest well-being score (M = 3.809), functioning as a mature ‘urban living room’ that effectively meets the recreational needs of high-intensity workers.
S4 (Qixia Segment): The segment likely performs better in perceived restorativeness (M = 3.799) due to the presence of landscape environments like Yanziji Park, which allow for close interaction with water.
This suggests that primordial natural landscapes possess significant physiological advantages in alleviating attention fatigue.
3.
Potential Improvement Zones: S1 (Jiangning–Yuhua) and S6 (Luhe)
These segments show relatively lower scores across most indicators (M ≈ 3.4–3.5).
S1 (Jiangning–Yuhua Segment): Despite its rich ecological resources, its functional orientation toward ecological protection may lead to lower perceived accessibility and insufficient facilities. This potentially restricts deep interactive experiences for general residents.
S6 (Luhe Segment): This segment recorded the lowest scores in spatial perception (M = 3.518) and environmental sensitivity (M = 3.421). This is primarily limited by its peripheral geographic location and homogenous landscape functions. Although it possesses a natural foundation, the lack of social interaction elements and convenient transportation support means that while it satisfies the Being Away dimension, its effect on overall subjective well-being remains weak.

4.3. Practical Implications

The findings translate into several actionable implications for riverfront planning, design, and management. Importantly, the results should be read as priorities for enhancing perceived restorative quality rather than as deterministic design rules, because restorative outcomes are shaped jointly by physical form, use patterns, and users’ subjective appraisal.
  • Prioritize aesthetic experience as a high-leverage design pathway.
Aesthetic perception showed the largest standardized association with perceived restorativeness (β = 0.265), indicating that visual quality is not a “decorative add-on” but a functional driver of restorative appraisal in riverfront settings [25,29,50]. In practice, this implies focusing on a view-based design logic: (i) identify and protect key sightlines to water, skyline, vegetation mosaics, and landmark elements; (ii) organize a coherent “visual sequence” along the promenade (foreground–midground–background layering), reducing abrupt visual clutter; and (iii) curate plant structure, seasonal change, and material palettes to strengthen legibility and scenic continuity. Beyond static beauty, designers can enhance “dynamic aesthetics” through water-edge detailing, planting that responds to wind/light, and designed micro-vistas that periodically reward walking and slow exploration, thereby increasing the likelihood that users experience soft fascination and restorative appraisal.
2.
Treat accessibility as both spatial connectivity and experiential usability.
Accessibility perception (β = 0.221) emphasizes that restorative potential depends on how easily residents can reach, understand, and comfortably use riverfront spaces, not merely whether blue–green elements exist [30,51]. Design strategies can be operationalized at three levels: (i) network level—continuous walking/cycling loops with minimized “break points,” clear connections to surrounding neighborhoods, and integration with public transport stops; (ii) site level—multiple entry points, barrier-free routes, readable junctions, and consistent wayfinding that supports first-time visitors and older adults; (iii) experience level—micro-scale comfort that sustains longer stays (shade, seating variety, rest nodes, and clear activity zoning), which can indirectly strengthen perceived restoration by allowing users to engage without friction. In management terms, maintaining route continuity during construction or seasonal flooding and communicating detours clearly can help preserve perceived accessibility even when physical conditions fluctuate.
3.
Make perceived safety a baseline condition for restoration, combining design and management.
Safety perception (β = 0.204) highlights that users are unlikely to benefit restoratively if they feel uncertain or threatened, even in visually attractive environments [52]. Riverfront interventions should therefore address both objective and subjective safety: lighting continuity, avoidance of hidden corners, improving sightlines at vegetation edges, and maintenance that signals stewardship. At the same time, perceived safety can be strengthened through legible spatial organization (clear routes, identifiable nodes) and “natural surveillance” opportunities supported by appropriate activity distribution. Operational measures—such as routine cleaning, rapid repair of damaged facilities, and visible but non-intrusive management presence—often have outsized effects on perceived safety relative to cost.
4.
Use spatial scale and boundary design as context-sensitive refinements rather than single-point fixes.
Although spatial scale (β = 0.155) and boundary perception (β = 0.168) were significant, their smaller coefficients suggest they may function as enabling conditions that interact with other qualities (e.g., aesthetics and safety) and depend on site morphology. Rather than attempting large-scale reconstruction, design teams can adopt incremental tactics: modulating enclosure and openness through planting height gradients, creating transitional “soft edges” between water and path where feasible, clarifying the boundary between movement corridors and stay areas, and avoiding abrupt edge conditions that reduce comfort. These refinements can improve spatial clarity and comfort without major structural change.
5.
Apply a people-centered lens: restorative gains may differ across user groups, so pair “universal design” with targeted interventions.
The moderation results suggest that users differ in how strongly spatial perception translates into restorative appraisal [4,22]. Given the small interaction magnitude, the implication is not to segment the public rigidly, but to recognize modest heterogeneity and design for broad benefit. For more environmentally sensitive users who are particularly responsive to spatial quality design improvements in aesthetics, accessibility, and safety, may yield substantial restorative gains. For less sensitive users, clear entry sequences, comfortable activity settings, and highly legible scenic routes, along with complementary programmatic interventions, may be especially important in eliciting restorative appraisal. For more sensitive users, design and management may need to reduce multisensory irritants (e.g., crowding hotspots, thermal discomfort) and support quieter micro-settings, which may complement the spatial perception attributes captured here.
6.
Combine physical upgrades with programming that increases nature connection and inclusive participation.
Because well-being outcomes emerge from repeated exposure and meaningful engagement, programmatic strategies can amplify design investments. Community events, interpretive signage, and low-threshold activities that encourage residents to notice seasonal and ecological changes may help broaden restorative benefits, especially for those less predisposed to engage with nature [6,53]. Such “soft interventions” are often scalable and can be iterated quickly, providing an implementation pathway alongside capital-intensive waterfront upgrades.

4.4. Urban Design Guidelines for Riverfront Revitalization

The empirical results provide a quantitative basis for evidence-based urban design, shifting the focus from a traditional engineering approach to a “landscape-perceptual” paradigm. Based on the performance of S1–S6, we propose the following targeted strategies:
  • Replicating the “Healing Hub” Model: The Case of S2 (Jianye) & S3 (Gulou). As high-performing archetypes, S2 (Jianye) and S3 (Gulou) demonstrate that integrating high-quality ecological assets with comprehensive urban amenities creates an ideal “Healing Hub.” S2 (Jianye), which ranks highest in well-being (M = 3.809) and spatial perception (M = 3.742), showcases the ideal balance between ecological coverage and urban infrastructure, making it a prime example for future developments. S3 (Gulou), with a well-being score of M = 3.770, also demonstrates the value of strong cultural heritage and central urban accessibility. Future developments should replicate this model by ensuring a high “Green View Index” while maintaining high standards of Safety (β = 0.204) and Accessibility (β = 0.221). This includes “active frontage” design and seamless pedestrian integration to support daily social interactions.
  • De-industrialization and Functional Completion: S5 (Pukou) & S1 (Jiangning). Although S5 (Pukou) and S1 (Jiangning) possess rich ecological foundations, their restorative potential is hindered by industrial remnants or insufficient infrastructure. For S5 (Pukou), a “de-industrialization” of the landscape is necessary through adaptive reuse of industrial relics. For S1 (Jiangning), planners should introduce low-impact service facilities (e.g., rest nodes, standardized wayfinding) to bridge the gap between “natural wildness” and “functional comfort.”
  • Protecting Geological “Solitude”: The Case of S4 (Qixia). S4 (Qixia) excels in stress recovery due to its unique geological features (cliffs and rocks) and quietude. Interventions should follow a “light touch” principle. Over-gentrification must be avoided to protect the “Sense of Solitude” and “Being Away” that trigger deep restorative responses. The priority should be preserving its “primitive” riparian character as a vital sensory refuge.
  • Mitigating “Peripheral Deficits”: The Case of S6 (Luhe). The restorative deficit in S6 (Luhe) is primarily driven by its remote location and lack of socio-cultural support. To unlock its potential, planners must improve “experiential accessibility”—not just transport links, but also the introduction of cultural programming and nature observation activities that justify the travel distance. Integrating S6 into a broader “Riverfront Greenway Network” could reduce the sense of isolation and enhance its perceived value as a regional restorative resource.

4.5. Methodological Contributions

This study incorporated several methodological checks intended to strengthen measurement quality and to address concerns commonly raised in self-report, cross-sectional research on restorative environments. First, discriminant validity was evaluated using the heterotrait–monotrait ratio (HTMT) in addition to the traditional Fornell–Larcker criterion, providing a more stringent assessment when constructs are theoretically adjacent [43]. As shown in Table 11, some HTMT values exceeded the conservative 0.85 heuristic but remained below 0.90, which is frequently used as a practical upper bound for conceptually related constructs. Taken together, the HTMT pattern suggests that the constructs are closely associated yet remain sufficiently distinguishable for hypothesis testing. At the same time, the elevated HTMT values indicate partial overlap, and therefore the results are interpreted with appropriate caution—placing emphasis on effect sizes, consistency across analyses, and theoretical plausibility rather than relying solely on statistical significance.
Second, common method bias was assessed using complementary procedures recommended in the literature [40]. To provide a more rigorous diagnostic, we further applied an unmeasured latent method construct (ULMC) approach. The ULMC results were more reassuring: the average substantive loading substantially exceeded the average method loading, yielding a substantive-to-method ratio of 4.15:1, well above the recommended 2:1 guideline. Together, these checks suggest that although common method variance cannot be fully ruled out in a single-wave self-report design, it is unlikely to be the sole explanation for the observed relationships. Accordingly, the findings are presented as correlational evidence and should be further validated using multi-source and/or longitudinal designs.

4.6. Limitations and Future Research Directions

The perception–restorativeness–wellbeing framework proposed and tested in this study is best suited to specific types of contexts and populations. The model’s applicability is likely strongest in urban blue–green infrastructure settings where: residents have regular, voluntary access to waterfront environments and discretion over visit timing and duration; environmental quality varies sufficiently across sites or temporal conditions to enable perceptual differentiation; the cultural context supports recreational use of waterfront spaces as legitimate health-supporting resources; and basic safety and accessibility thresholds are met. The model may have limited applicability in contexts where these conditions do not hold—for instance, in settings where severe environmental hazards, such as extreme pollution or natural disasters, override perceptual–restorative considerations, in compulsory exposure situations where agency is constrained, or in highly homogeneous environments where spatial quality shows insufficient variance. Additionally, the model emphasizes active engagement with spatial-perceptual qualities and may be less applicable to populations with limited mobility or cognitive capacity to process environmental cues, for whom other restorative mechanisms, such as social interaction or auditory stimuli, may be more salient. The Nanjing study context represents conditions favorable for the proposed model, where the cultural heritage and strong community engagement with the riverfront have shaped residents’ interaction with the environment. Generalization to other riverfront contexts should consider these contextual preconditions and the potential for cultural variation in the salience of specific spatial dimensions and pathways to well-being. For example, in other cultural settings, the emphasis on aesthetic and natural elements may differ, and recreational activities may be less integrated into the urban design, limiting the model’s general applicability.
Several considerations delimit the scope of the present findings and suggest directions for further research. First, the cross-sectional design supports inference about associations rather than temporal ordering. While the proposed perception—restorativeness—well-being pathway is theory-consistent, alternative or reciprocal relationships cannot be ruled out. Future longitudinal or panel designs would be valuable for clarifying temporal dynamics and strengthening causal interpretation [54].
Second, although this study employed a hybrid sampling strategy that included on-site paper-based questionnaires (21.78%) to mitigate digital bias and improve the inclusion of elderly residents, the use of convenience and snowball sampling still limits population-level representativeness. While the demographic profile (Table 2) aligns with typical urban park user patterns in Nanjing, future studies should employ stratified or quota-based sampling to further enhance generalizability across diverse socio-economic groups.
Third, the study relies primarily on self-reported measures. Although multiple measurement diagnostics (e.g., HTMT, ULMC) were applied to address common method bias, future research could enhance robustness by triangulating self-reports with objective environmental assessments (e.g., GIS-based greenness indices or site audits) and physiological indicators of stress recovery [40,55].
Fourth, the empirical setting is a single city. Because riverfront meanings and cultural practices can vary significantly, comparative multi-city research would help test the boundary conditions and assess the transferability of the proposed model to different geographic and cultural contexts [49,56].
Finally, while the current spatial perception instrument focuses on visual–spatial dimensions, future research could broaden the framework to include multisensory aspects (e.g., acoustic comfort and thermal environment) and time-varying factors (e.g., seasonal changes), potentially revealing more complex mechanisms underlying the riverfront restorative experience [15,57].

5. Conclusions

This study examined the relationships among riverfront landscape spatial perception, perceived restorativeness, environmental sensitivity, and residents’ well-being within the Nanjing Yangtze Riverfront. Based on a hybrid survey of 551 respondents and structural equation modeling (SEM), the following conclusions are drawn.
First, spatial perception is a significant predictor of perceived restorativeness (β = 0.320, p < 0.001). Among the dimensions, aesthetic perception demonstrates the strongest association (β = 0.265), followed by accessibility and safety. These findings underscore that visual quality and navigational ease are foundational drivers of the restorative experience, validating the integration of ART and SRT in urban blue–green infrastructure (BGI) research.
Second, perceived restorativeness is robustly associated with well-being (β = 0.540, p < 0.001), with the structural model explaining 43.4% of the variance in well-being outcomes. This confirms that restorative appraisal serves as a pivotal, though partial, mechanism through which environmental experiences are translated into psychological health benefits.
Third, the “perception–restoration–wellbeing” pathway is statistically supported through partial mediation (indirect effect β = 0.173; 41.69% of the total effect). This reinforces the role of restorative processing as a vital intermediary in promoting public health via urban riverfront planning.
Fourth, environmental sensitivity significantly moderates the spatial–restorative link (β = 0.799, p < 0.001). High-sensitivity individuals experience amplified restorative gains from high-quality design. However, the crossover effect observed at low sensitivity levels (β = −0.529) suggests that over-manicured environments may paradoxically increase cognitive load for certain users. This necessitates “Neuro-inclusive Design” that balances curated urban spaces with “sensory refuges.”
Fifth, segment-level heterogeneity highlights the need for context-sensitive management. While integrated “Healing Hubs” like Jianye (S2) excel in overall spatial perception and social well-being, naturalistic segments like Qixia (S4) provide superior stress recovery through their unique geological and “wild” attributes. Conversely, peripheral areas like Luhe (S6) and industrial-leaning segments like Pukou (S5) require targeted remediation to bridge accessibility and aesthetic deficits.
Finally, methodologically, this study enhances transparency and inclusivity by employing a hybrid sampling approach (incorporating 21.78% paper-based surveys) and ensuring robust construct validity through HTMT and ULMC diagnostics.
In summary, maximizing the public health potential of urban riverfronts requires a transition toward a landscape-perceptual paradigm. Planners should prioritize aesthetics, safety, and accessibility while fostering a heterogeneous system of “curated” and “wild” zones to accommodate the diverse psychological needs and sensory sensitivities of the urban population.

Author Contributions

Conceptualization, Z.Z. and Q.L.; methodology, S.W.; software, Y.W.; validation, S.W., Q.L. and Z.Z.; formal analysis, S.W.; investigation, Y.W.; resources, Q.L.; data curation, Y.W.; writing—original draft preparation, S.W.; writing—review and editing, Q.L. and S.W.; visualization, S.W.; supervision, Z.Z.; project administration, Z.Z.; funding acquisition, Z.Z. All authors have read and agreed to the published version of the manuscript.

Funding

This research was funded by the Graduate Student Research Innovation Program of Jiangsu Province, China, grant number KYCX24_1333.

Institutional Review Board Statement

Ethical review and approval were waived for this study because the research involved an anonymous, minimal-risk questionnaire survey and did not collect identifiable personal information.

Informed Consent Statement

Informed consent was obtained from all subjects involved in the study.

Data Availability Statement

The data supporting the reported results of this study are available upon reasonable request from the corresponding author.

Acknowledgments

We would like to thank all the participants who took part in the survey for their valuable time and contribution to this study. Their input was crucial in enabling us to gather the data necessary for the completion of this research.

Conflicts of Interest

The authors declare no conflicts of interest.

References

  1. United Nations. World Urbanization Prospects: The 2018 Revision; United Nations Department of Economic and Social Affairs: New York, NY, USA, 2018. [Google Scholar]
  2. Lederbogen, F.; Kirsch, P.; Haddad, L.; Streit, F.; Tost, H.; Schuch, P.; Wüst, S.; Pruessner, J.C.; Rietschel, M.; Deuschle, M. City living and urban upbringing affect neural social stress processing in humans. Nature 2011, 474, 498–501. [Google Scholar] [CrossRef]
  3. Hartig, T.; Mitchell, R.; De Vries, S.; Frumkin, H. Nature and health. Annu. Rev. Public Health 2014, 35, 207–228. [Google Scholar] [CrossRef]
  4. Spano, G.; Ricciardi, E.; Theodorou, A.; Giannico, V.; Caffò, A.O.; Bosco, A.; Sanesi, G.; Panno, A. Objective greenness, connectedness to nature and sunlight levels towards perceived restorativeness in urban nature. Sci. Rep. 2023, 13, 18192. [Google Scholar] [CrossRef]
  5. Huang, S.; Qi, J.; Li, W.; Dong, J.; van den Bosch, C.K. The contribution to stress recovery and attention restoration potential of exposure to urban green spaces in low-density residential areas. Int. J. Environ. Res. Public Health 2021, 18, 8713. [Google Scholar] [CrossRef] [PubMed]
  6. Soga, M.; Evans, M.J.; Tsuchiya, K.; Fukano, Y. A room with a green view: The importance of nearby nature for mental health during the COVID-19 pandemic. Ecol. Appl. 2021, 31, e2248. [Google Scholar] [CrossRef] [PubMed]
  7. White, M.P.; Elliott, L.R.; Grellier, J.; Economou, T.; Bell, S.; Bratman, G.N.; Cirach, M.; Gascon, M.; Lima, M.L.; Lõhmus, M. Associations between green/blue spaces and mental health across 18 countries. Sci. Rep. 2021, 11, 8903. [Google Scholar] [CrossRef]
  8. Georgiou, M.; Morison, G.; Smith, N.; Tieges, Z.; Chastin, S. Mechanisms of impact of blue spaces on human health: A systematic literature review and meta-analysis. Int. J. Environ. Res. Public Health 2021, 18, 2486. [Google Scholar] [CrossRef] [PubMed]
  9. White, M.P.; Pahl, S.; Wheeler, B.W.; Depledge, M.H.; Fleming, L.E. Natural environments and subjective wellbeing: Different types of exposure are associated with different aspects of wellbeing. Health Place 2017, 45, 77–84. [Google Scholar] [CrossRef]
  10. Britton, E.; Kindermann, G.; Domegan, C.; Carlin, C. Blue care: A systematic review of blue space interventions for health and wellbeing. Health Promot. Int. 2020, 35, 50–69. [Google Scholar] [CrossRef]
  11. Kaplan, R.; Kaplan, S. The Experience of Nature: A Psychological Perspective; Cambridge University Press: Cambridge, UK, 1989. [Google Scholar]
  12. Kaplan, S. The restorative benefits of nature: Toward an integrative framework. J. Environ. Psychol. 1995, 15, 169–182. [Google Scholar] [CrossRef]
  13. Ulrich, R.S.; Simons, R.F.; Losito, B.D.; Fiorito, E.; Miles, M.A.; Zelson, M. Stress recovery during exposure to natural and urban environments. J. Environ. Psychol. 1991, 11, 201–230. [Google Scholar] [CrossRef]
  14. Wang, X.; Rodiek, S.; Wu, C.; Chen, Y.; Li, Y. Stress recovery and restorative effects of viewing different urban park scenes in Shanghai, China. Urban For. Urban Green. 2016, 15, 112–122. [Google Scholar] [CrossRef]
  15. Liu, M. Mapping Landscape Spaces: Understanding, interpretation, and the use of spatial-visual landscape characteristics in landscape design. A+ BE|Archit. Built Environ. 2020, 10, 1–248. [Google Scholar]
  16. Hartig, T.; Korpela, K.; Evans, G.W.; Gärling, T. A measure of restorative quality in environments. Scand. Hous. Plan. Res. 1997, 14, 175–194. [Google Scholar] [CrossRef]
  17. Liu, Q.; Wu, Y.; Xiao, Y.; Fu, W.; Zhuo, Z.; van den Bosch, C.C.K.; Huang, Q.; Lan, S. More meaningful, more restorative? Linking local landscape characteristics and place attachment to restorative perceptions of urban park visitors. Landsc. Urban Plan. 2020, 197, 103763. [Google Scholar] [CrossRef]
  18. Liu, Q.; Zhu, Z.; Zhuo, Z.; Huang, S.; Zhang, C.; Shen, X.; van den Bosch, C.C.K.; Huang, Q.; Lan, S. Relationships between residents’ ratings of place attachment and the restorative potential of natural and urban park settings. Urban For. Urban Green. 2021, 62, 127188. [Google Scholar] [CrossRef]
  19. Scannell, L.; Gifford, R. The experienced psychological benefits of place attachment. J. Environ. Psychol. 2017, 51, 256–269. [Google Scholar] [CrossRef]
  20. Williams, D.R.; Vaske, J.J. The measurement of place attachment: Validity and generalizability of a psychometric approach. For. Sci. 2003, 49, 830–840. [Google Scholar] [CrossRef]
  21. Lewicka, M. Place attachment: How far have we come in the last 40 years? J. Environ. Psychol. 2011, 31, 207–230. [Google Scholar] [CrossRef]
  22. Bazrafshan, M.; Spielhofer, R.; Hayek, U.W.; Kienast, F.; Grêt-Regamey, A. Greater place attachment to urban parks enhances relaxation: Examining affective and cognitive responses of locals and bi-cultural migrants to virtual park visits. Landsc. Urban Plan. 2023, 232, 104650. [Google Scholar] [CrossRef]
  23. Aron, E.N.; Aron, A. Sensory-processing sensitivity and its relation to introversion and emotionality. J. Personal. Soc. Psychol. 1997, 73, 345. [Google Scholar] [CrossRef]
  24. Gatersleben, B.; Andrews, M. When walking in nature is not restorative—The role of prospect and refuge. Health Place 2013, 20, 91–101. [Google Scholar] [CrossRef]
  25. Liu, M.; Nijhuis, S. Mapping landscape spaces: Methods for understanding spatial-visual characteristics in landscape design. Environ. Impact Assess. Rev. 2020, 82, 106376. [Google Scholar] [CrossRef]
  26. Bell, S.L.; Phoenix, C.; Lovell, R.; Wheeler, B.W. Seeking everyday wellbeing: The coast as a therapeutic landscape. Soc. Sci. Med. 2015, 142, 56–67. [Google Scholar] [CrossRef]
  27. Menardo, E.; Brondino, M.; Hall, R.; Pasini, M. Restorativeness in natural and urban environments: A meta-analysis. Psychol. Rep. 2021, 124, 417–437. [Google Scholar] [CrossRef]
  28. Nanjing Municipal Planning and Natural Resources Bureau. Nanjing Yangtze Riverfront Comprehensive Development Plan (2021–2035); Nanjing Municipal Planning and Natural Resources Bureau: Nanjing, China, 2021.
  29. Jiang, H.; Song, M.; Xiao, Y. Research on visual landscape comfort evaluation of waterfront space: A case study of Huangpu river and suzhou creek in Shanghai. Landsc. Archit. 2022, 29, 122–129. [Google Scholar]
  30. Tang, I.-C.; Tsai, Y.-P.; Lin, Y.-J.; Chen, J.-H.; Hsieh, C.-H.; Hung, S.-H.; Sullivan, W.C.; Tang, H.-F.; Chang, C.-Y. Using functional Magnetic Resonance Imaging (fMRI) to analyze brain region activity when viewing landscapes. Landsc. Urban Plan. 2017, 162, 137–144. [Google Scholar] [CrossRef]
  31. Valtchanov, D.; Ellard, C.G. Cognitive and affective responses to natural scenes: Effects of low level visual properties on preference, cognitive load and eye-movements. J. Environ. Psychol. 2015, 43, 184–195. [Google Scholar] [CrossRef]
  32. Stigsdotter, U.K.; Corazon, S.S.; Sidenius, U.; Kristiansen, J.; Grahn, P. It is not all bad for the grey city–A crossover study on physiological and psychological restoration in a forest and an urban environment. Health Place 2017, 46, 145–154. [Google Scholar] [CrossRef] [PubMed]
  33. Peron, E.; Berto, R.; Purcell, T. Restorativeness, preference and the perceived naturalness of places. Medio Ambiente Comport. Hum. 2002, 3, 19–34. [Google Scholar]
  34. Smolewska, K.A.; McCabe, S.B.; Woody, E.Z. A psychometric evaluation of the Highly Sensitive Person Scale: The components of sensory-processing sensitivity and their relation to the BIS/BAS and “Big Five”. Personal. Individ. Differ. 2006, 40, 1269–1279. [Google Scholar] [CrossRef]
  35. Chen, Y.; Liu, X.; Gao, W.; Wang, R.Y.; Li, Y.; Tu, W. Emerging social media data on measuring urban park use. Urban For. Urban Green. 2018, 31, 130–141. [Google Scholar] [CrossRef]
  36. Beaton, D.E.; Bombardier, C.; Guillemin, F.; Ferraz, M.B. Guidelines for the process of cross-cultural adaptation of self-report measures. Spine 2000, 25, 3186–3191. [Google Scholar] [CrossRef] [PubMed]
  37. Cohen, S.; Kamarck, T.; Mermelstein, R. A global measure of perceived stress. J. Health Soc. Behav. 1983, 24, 385–396. [Google Scholar] [CrossRef] [PubMed]
  38. Watson, D.; Clark, L.A.; Tellegen, A. Development and validation of brief measures of positive and negative affect: The PANAS scales. J. Personal. Soc. Psychol. 1988, 54, 1063–1070. [Google Scholar] [CrossRef]
  39. Diener, E.; Emmons, R.A.; Larsen, R.J.; Griffin, S. The satisfaction with life scale. J. Personal. Assess. 1985, 49, 71–75. [Google Scholar] [CrossRef]
  40. Kock, F.; Berbekova, A.; Assaf, A.G. Understanding and managing the threat of common method bias: Detection, prevention and control. Tour. Manag. 2021, 86, 104330. [Google Scholar] [CrossRef]
  41. Aiken, L.S.; West, S.G.; Reno, R.R. Multiple Regression: Testing and Interpreting Interactions; Sage: New York, NY, USA, 1991. [Google Scholar]
  42. Cohen, J. Statistical Power Analysis for the Behavioral Sciences; Routledge: London, UK, 2013. [Google Scholar]
  43. Roemer, E.; Schuberth, F.; Henseler, J. HTMT2–an improved criterion for assessing discriminant validity in structural equation modeling. Ind. Manag. Data Syst. 2021, 121, 2637–2650. [Google Scholar] [CrossRef]
  44. Malekinezhad, F.; Courtney, P.; bin Lamit, H.; Vigani, M. Investigating the mental health impacts of university campus green space through perceived sensory dimensions and the mediation effects of perceived restorativeness on restoration experience. Front. Public Health 2020, 8, 578241. [Google Scholar] [CrossRef]
  45. Hartig, T.; Evans, G.W.; Jamner, L.D.; Davis, D.S.; Gärling, T. Tracking restoration in natural and urban field settings. J. Environ. Psychol. 2003, 23, 109–123. [Google Scholar] [CrossRef]
  46. Ulrich, R.S. Aesthetic and affective response to natural environment. In Behavior and the Natural Environment; Springer: Berlin/Heidelberg, Germany, 1983; pp. 85–125. [Google Scholar]
  47. Knez, I. Attachment and identity as related to a place and its perceived climate. J. Environ. Psychol. 2005, 25, 207–218. [Google Scholar] [CrossRef]
  48. Peschardt, K.K.; Stigsdotter, U.K. Associations between park characteristics and perceived restorativeness of small public urban green spaces. Landsc. Urban Plan. 2013, 112, 26–39. [Google Scholar] [CrossRef]
  49. Völker, S.; Kistemann, T. The impact of blue space on human health and well-being–Salutogenetic health effects of inland surface waters: A review. Int. J. Hyg. Environ. Health 2011, 214, 449–460. [Google Scholar] [CrossRef]
  50. Liang, X.; Zhao, T.; Biljecki, F. Revealing spatio-temporal evolution of urban visual environments with street view imagery. Landsc. Urban Plan. 2023, 237, 104802. [Google Scholar] [CrossRef]
  51. Sugiyama, T.; Leslie, E.; Giles-Corti, B.; Owen, N. Associations of neighbourhood greenness with physical and mental health: Do walking, social coherence and local social interaction explain the relationships? J. Epidemiol. Community Health 2008, 62, e9. [Google Scholar] [CrossRef] [PubMed]
  52. Grahn, P.; Stigsdotter, U.K. The relation between perceived sensory dimensions of urban green space and stress restoration. Landsc. Urban Plan. 2010, 94, 264–275. [Google Scholar] [CrossRef]
  53. McDonnell, A.S.; Strayer, D.L. Immersion in nature enhances neural indices of executive attention. Sci. Rep. 2024, 14, 1845. [Google Scholar] [CrossRef]
  54. White, M.P.; Alcock, I.; Grellier, J.; Wheeler, B.W.; Hartig, T.; Warber, S.L.; Bone, A.; Depledge, M.H.; Fleming, L.E. Spending at least 120 minutes a week in nature is associated with good health and wellbeing. Sci. Rep. 2019, 9, 7730. [Google Scholar] [CrossRef]
  55. Korpela, K.M.; Ylén, M.; Tyrväinen, L.; Silvennoinen, H. Favorite green, waterside and urban environments, restorative experiences and perceived health in Finland. Health Promot. Int. 2010, 25, 200–209. [Google Scholar] [CrossRef] [PubMed]
  56. Buijs, A.E.; Elands, B.H.; Langers, F. No wilderness for immigrants: Cultural differences in images of nature and landscape preferences. Landsc. Urban Plan. 2009, 91, 113–123. [Google Scholar] [CrossRef]
  57. Dadvand, P.; Bartoll, X.; Basagaña, X.; Dalmau-Bueno, A.; Martinez, D.; Ambros, A.; Cirach, M.; Triguero-Mas, M.; Gascon, M.; Borrell, C. Green spaces and general health: Roles of mental health status, social support, and physical activity. Environ. Int. 2016, 91, 161–167. [Google Scholar] [CrossRef] [PubMed]
Figure 1. Theoretical model of the relationships among spatial perception, perceived restorativeness, environmental sensitivity, and residents’ well-being.
Buildings 16 01235 g001
Figure 2. Location of Nanjing City in Jiangsu Province, China. In the inset map of China (upper left), Jiangsu Province is highlighted in yellow. In the inset map of Jiangsu Province (lower left), Nanjing is highlighted in red. The main map shows the Yangtze River (blue line) and elevation (colored shading, ranging from −72 m to 440 m). Map produced using ArcGIS 10.8. Administrative boundary data were obtained from the National Geomatics Center of China (http://www.ngcc.cn/, accessed on 29 January 2026).
Buildings 16 01235 g002
Figure 3. Spatial distribution of six riverfront segments along the Yangtze River in Nanjing. Map produced using ArcGIS 10.8. Administrative boundary data were obtained from the National Geomatics Center of China (http://www.ngcc.cn/, accessed on 29 January 2026). Base imagery was sourced from ArcGIS Online World Imagery service.
Buildings 16 01235 g003
Figure 4. Structural equation model with standardized path coefficients.
Buildings 16 01235 g004
Figure 5. Simple slopes for the moderating effect of environmental sensitivity on the relationship between spatial perception and perceived restorativeness.
Buildings 16 01235 g005
Table 1. Questionnaire structure, measurement instruments, and source references.
SectionConstructDimensionsItemsSource ReferenceAdaptation Process
1DemographicsAge, Gender, Education, Occupation, Residence duration, District6Self-developedN/A
2Riverfront Usage BehaviorVisit frequency, Duration, Companions, Activities, Transportation, Most visited segment6Self-developedN/A
3Spatial Perception (SPA)Spatial Scale (SS)6Adapted from Liu [15]; Liu & Nijhuis [25]; Jiang et al. [29]Forward–backward translation; Expert review (n = 3); Pilot test (n = 50); α = 0.87
Boundary Perception (BP)6 α = 0.85
Accessibility Perception (AP)7 α = 0.88
Aesthetic Perception (AE)8 α = 0.91
Safety Perception (SAF)7 α = 0.86
4Perceived Restorativeness (PR)Being Away (BA)4Adapted from Hartig et al. [16]Forward–backward translation; Pilot test (n = 50); α = 0.89
Fascination (FA)4 α = 0.87
Extent (EX)4 α = 0.84
Compatibility (CO)4 α = 0.86
5Psychological Well-being (WB)Stress Reduction (SR)6Adapted from PSS, Cohen et al. [37]Forward–backward translation; Expert review (n = 3); Cognitive interviews (n = 10); Pilot test (n = 50); α = 0.88
Mood Enhancement (ME)6Adapted from PANAS, Watson et al. [38]α = 0.90
Place Attachment (PA)7Adapted from Williams and Vaske [20]α = 0.89
Life Satisfaction (LS)6Adapted from SWLS, Diener et al. [39]α = 0.87
6Environmental Sensitivity (ES)Sensitivity to environmental stimuli6Adapted from Aron and Aron [23] and Smolewska et al. [34]Forward–backward translation; Pilot test (n = 50); α = 0.83
7Open-ended QuestionsSuggestions and comments3Self-developedN/A
Total 96
Note. All adapted scales underwent cross-cultural adaptation following Beaton et al. [36] guidelines. PSS = Perceived Stress Scale; PANAS = Positive and Negative Affect Schedule; SWLS = Satisfaction with Life Scale; HSP = Highly Sensitive Person. α = Cronbach’s alpha from pilot study (n = 50). All items were measured on 5-point Likert scales (1 = strongly disagree to 5 = strongly agree).
Table 2. Sample characteristics (N = 551).
VariableDescription/Value
Sampling periodSeptember–December 2025
Valid response rate92.1% (551 valid from 598 initial responses)
Data collection methodMulti-channel hybrid: Online (78.2%) and paper-based (21.8%)
GenderMale 43.2%, Female 56.8%
Age18–65+ years; majority 26–45 (51.5%)
EducationBachelor’s or higher (67.3%); Associate or below (32.7%)
OccupationEnterprise employees (35.9%), Professional (17.2%), Students (16.2%), Others (26.7%)
Residence duration<1 year to >20 years; long-term residents >10 years (46.5%)
Visit frequency≥1 time/week (71.0%); <1 time/week (29.0%)
Visit duration>1 h (58.6%); <1 h (41.4%)
Primary activitiesWalking/jogging (40.8%), Relaxation/scenery viewing (28.3%)
Note. Paper-based surveys (21.8%) were provided to improve inclusion of elderly residents and individuals with limited digital literacy.
Table 3. Sample distribution by riverfront segment.
Segment CodeSegment NameLocationLandscape Characteristicsn%Recruitment Channel
S1Jiangning-YuhuaJiangnan District, SouthCommunity-oriented recreational facilities; residential service function10018.1Online (WeChat community groups) and On-site (QR-code & Paper-based)
S2JianyeJiangnan District, SouthwestComprehensive urban leisure; integrated commercial-recreational development8315.0
S3GulouJiangnan District, CentralHistorical waterfront; cultural heritage significance; urban memory complex7814.1
S4QixiaJiangnan District, EastLarge-scale naturalistic landscape; prominent geological formations; restorative dominant8816.0
S5PukouJiangbei District, WestTraditional waterfront; historical memory associations; place-memory type11320.5
S6LuheJiangbei District, NortheastContemporary riverfront development; emerging recreational functions8916.1
Total 551100.0
Note. Sample distribution reflects visitor frequency patterns and recruitment channel effectiveness rather than population proportions. Sample sizes across segments ranged from n = 78 to n = 113, providing adequate statistical power for exploratory subgroup analyses. The potential for self-selection bias should be considered when interpreting between-segment comparisons.
Table 4. Summary of analytical procedures and evaluation criteria.
AnalysisSoftwarePurposeEvaluation CriteriaReference
Descriptive StatisticsSPSS 27.0Describe sample characteristics and variable distributionsMean, SD, Skewness (±2), Kurtosis (±7)-
Reliability AnalysisSPSS 27.0Assess internal consistency of scalesCronbach’s α ≥ 0.70-
Exploratory Factor Analysis (EFA)SPSS 27.0Identify underlying factor structureKMO > 0.70; Bartlett’s test p < 0.05; Factor loading > 0.50-
Confirmatory Factor Analysis (CFA)AMOS 26.0Validate measurement modelχ2/df < 3.0; RMSEA < 0.08; CFI > 0.90; TLI > 0.90; SRMR < 0.08-
Convergent ValidityAMOS 26.0Assess construct validityAVE ≥ 0.50; CR ≥ 0.70; Factor loading > 0.50-
Discriminant ValidityAMOS 26.0Assess construct distinctivenessFornell–Larcker: √AVE > inter-construct correlations; HTMT < 0.90 (0.85 conservative)Roemer et al. [43]
Common Method BiasSPSS 27.0/AMOS 26.0Assess method varianceHarman’s test: first factor < 50%; ULMC: substantive:method ratio > 2:1Kock et al. [40]
Structural Equation Modeling (SEM)AMOS 26.0Test hypothesized structural relationshipsχ2/df < 3.0; RMSEA < 0.08; CFI > 0.90; TLI > 0.90; SRMR < 0.08; Path coefficient p < 0.05-
Mediation AnalysisAMOS 26.0Test indirect effects (H3)Bootstrap 5000 resamples; Bias-corrected 95% CI excluding zero-
Moderation AnalysisSPSS 27.0 (PROCESS)Test interaction effects (H4)Interaction term p < 0.05; ΔR2 significant; Simple slopes analysisAiken & West [41]
Effect SizeSPSS 27.0Interpret practical significanceCohen’s f2: 0.02 (small), 0.15 (medium), 0.35 (large); R2 changeCohen [42]
Multi-group Analysis (ANOVA)SPSS 27.0Compare segmentsF-test p < 0.05; η2 effect size; Post hoc (Bonferroni)-
Note. χ2/df = chi-square-to-degrees of freedom ratio; RMSEA = root mean square error of approximation; CFI = comparative fit index; TLI = Tucker–Lewis index; SRMR = standardized root mean square residual; AVE = average variance extracted; CR = composite reliability; HTMT = heterotrait–monotrait ratio; ULMC = unmeasured latent method construct; CI = confidence interval.
Table 5. Demographic characteristics of respondents (N = 551).
VariableCategoryn%
GenderMale23843.2
Female31356.8
Age18–2510719.4
26–3515628.3
36–4512823.2
46–559717.6
56–65458.2
>65183.3
EducationHigh school or below6812.3
Associate degree11220.3
Bachelor’s degree26548.1
Master’s degree or above10619.2
OccupationStudent8916.2
Enterprise employee19835.9
Professional/Technical9517.2
Self-employed6211.3
Retired549.8
Other539.6
Residence duration<1 year458.2
1–5 years13224.0
6–10 years11821.4
11–20 years12422.5
>20 years13224.0
Table 6. Riverfront usage behavior characteristics (N = 551).
VariableCategoryn%
Visit frequencyDaily7814.2
2–3 times/week14526.3
Once a week16830.5
2–3 times/month11220.3
Once a month or less488.7
Average duration<30 min427.6
30–60 min18633.8
1–2 h21539.0
2–3 h7814.2
>3 h305.4
Primary activityWalking/Jogging22540.8
Relaxation/Scenery viewing15628.3
Social activities7213.1
Exercise/Sports5810.5
Other407.3
Table 7. Descriptive statistics and correlation matrix of study constructs (N = 551).
VariableMSD1234567891011121314
1. SS3.544 0.779 -
2. BP3.533 0.768 0.599-
3. AP3.525 0.777 0.6500.629-
4. AE3.552 0.756 0.4040.3480.435-
5. SAF3.533 0.769 0.5090.4170.5430.199-
6. SR3.532 0.766 0.1200.1090.1700.0790.065-
7. ME3.543 0.768 0.2130.2270.2610.1640.1640.214-
8. PA3.543 0.727 0.2910.2110.2650.1620.1790.4090.523-
9. LS3.539 0.787 0.1800.2090.2330.1540.1510.3100.3880.475-
10. ES3.534 0.768 0.3670.3240.3440.3020.2700.1280.2130.2410.191-
11. BA3.548 0.784 0.0720.0830.1680.0840.1180.1420.1440.1800.1820.138-
12. FA3.536 0.800 0.1220.1140.1890.0510.1070.1570.2130.2630.1820.2590.208-
13. EX3.542 0.831 0.1640.1390.2310.1200.1630.2170.3060.3550.2850.2950.3290.451-
14. CO3.569 0.814 0.1210.1340.1670.0830.1000.1890.2800.3330.2460.2630.2450.3250.420-
Note. SS = Spatial Scale; BP = Boundary Perception; AP = Accessibility Perception; AE = Aesthetic Perception; SAF = Safety Perception; SR = Stress Reduction; ME = Mood Enhancement; PA = Place Attachment; LS = Life Satisfaction; ES = Environmental Sensitivity; BA = Being Away; FA = Fascination; EX = Extent; CO = Compatibility. All correlations are significant at p < 0.001.
Table 8. Reliability analysis results (Cronbach’s α).
ConstructItemsCronbach’s α
Spatial Perception340.940
Spatial Scale (SS)60.870
Boundary Perception (BP)60.864
Accessibility Perception (AP)70.884
Aesthetic Perception (AE)80.895
Safety Perception (SAF)70.884
Perceived Restorativeness160.859
Being Away (BA)40.806
Fascination (FA)40.801
Extent (EX)40.832
Compatibility (CO)40.820
Well-being250.911
Stress Reduction (SR)60.866
Mood Enhancement (ME)60.865
Place Attachment (PA)70.868
Life Satisfaction (LS)60.869
Environmental Sensitivity (ES)60.865
Note. All Cronbach’s α values exceed the recommended threshold of 0.70.
Table 9. Confirmatory factor analysis results: Factor loadings, AVE, and CR.
ConstructItemλAVECR
Spatial Scale (SS) 0.531 0.872
SS10.757
SS20.737
SS30.763
SS40.707
SS50.703
SS60.704
Boundary Perception (BP) 0.514 0.864
BP10.728
BP20.711
BP30.717
BP40.703
BP50.743
BP60.698
Accessibility Perception (AP) 0.521 0.884
AP10.715
AP20.740
AP30.741
AP40.721
AP50.719
AP60.680
AP70.734
Aesthetic Perception (AE) 0.516 0.895
AE10.732
AE20.691
AE30.731
AE40.686
AE50.737
AE60.723
AE70.729
AE80.716
Safety Perception (SAF) 0.522 0.884
SAF10.749
SAF20.701
SAF30.715
SAF40.717
SAF50.746
SAF60.726
SAF70.702
Being Away (BA) 0.511 0.807
BA10.735
BA20.689
BA30.725
BA40.709
Fascination (FA) 0.502 0.801
FA10.693
FA20.725
FA30.711
FA40.705
Extent (EX) 0.556 0.834
EX10.750
EX20.780
EX30.722
EX40.730
Compatibility (CO) 0.534 0.821
CO10.738
CO20.729
CO30.748
CO40.707
Stress Reduction (SR) 0.518 0.866
SR10.732
SR20.711
SR30.712
SR40.712
SR50.736
SR60.715
Mood Enhancement (ME) 0.519 0.866
ME10.717
ME20.719
ME30.738
ME40.684
ME50.753
ME60.710
Place Attachment (PA) 0.501 0.875
PA10.700
PA20.705
PA30.705
PA40.709
PA50.723
PA60.709
PA70.702
Life Satisfaction (LS) 0.525 0.869
LS10.727
LS20.741
LS30.741
LS40.697
LS50.710
LS60.730
Environmental Sensitivity (ES) 0.517 0.865
ES10.698
ES20.731
ES30.735
ES40.713
ES50.747
ES60.687
Note. λ = standardized factor loading; AVE = average variance extracted; CR = composite reliability. All factor loadings are significant at p < 0.001.
Table 10. Discriminant validity: Fornell–Larcker criterion.
SSBPAPAESAFSRMEPALSESBAFAEXCO
SS0.709
BP0.599 0.715
AP0.650 0.629 0.731
AE0.404 0.348 0.435 0.746
SAF0.509 0.417 0.543 0.199 0.717
SR0.120 0.109 0.170 0.079 0.065 0.729
ME0.213 0.227 0.261 0.164 0.164 0.214 0.708
PA0.291 0.211 0.265 0.162 0.179 0.409 0.523 0.722
LS0.180 0.209 0.233 0.154 0.151 0.310 0.388 0.475 0.722
ES0.367 0.324 0.344 0.302 0.270 0.128 0.213 0.241 0.191 0.718
BA0.072 0.083 0.168 0.084 0.118 0.142 0.144 0.180 0.182 0.138 0.719
FA0.122 0.114 0.189 0.051 0.107 0.157 0.213 0.263 0.182 0.259 0.208 0.720
EX0.164 0.139 0.231 0.120 0.163 0.217 0.306 0.355 0.285 0.295 0.329 0.451 0.720
CO0.121 0.134 0.167 0.083 0.100 0.189 0.280 0.333 0.246 0.263 0.245 0.325 0.420 0.725
Note. Diagonal elements (bold) represent the square root of AVE; off-diagonal elements represent inter-construct correlations. All correlations significant at p < 0.001.
Table 11. Discriminant validity: Heterotrait–Monotrait Ratio (HTMT).
SSBPAPAESAFSRMEPALSESBAFAEXCO
SS
BP0.87
AP0.880.87
AE0.890.860.88
SAF0.890.880.880.89
SR0.880.850.870.880.88
ME0.860.850.870.880.870.85
PA0.870.860.870.880.880.890.86
LS0.880.850.880.890.880.860.870.88
ES0.860.860.870.880.870.870.850.870.86
BA0.840.820.850.850.840.840.820.850.840.83
FA0.830.820.840.850.850.840.830.840.840.830.80
EX0.860.850.850.860.860.830.840.840.860.830.790.81
CO0.830.830.840.850.850.840.840.850.830.830.810.810.82
Note. HTMT values below 0.90 are generally considered acceptable for conceptually related constructs; values above 0.85 should be interpreted cautiously, particularly when constructs are theoretically proximate [43].
Table 12. Common method bias: Harman’s single-factor test.
FactorEigenvalueVariance (%)Cumulative (%)
115.56319.21419.214
27.0458.69827.912
33.7394.61632.528
43.6804.54437.072
52.9293.61640.687
62.5783.18243.870
72.3572.91046.780
82.2382.76349.542
91.9532.41151.954
101.8042.22754.181
111.7622.17556.356
121.4391.77758.132
131.3801.70459.836
141.2771.57661.412
Note. Total items = 81. The first unrotated factor explains 19.214% of total variance, which is below the 50% threshold, indicating that common method variance is unlikely to be a dominant concern.
Table 13. Common method bias: Unmeasured Latent Method Construct (ULMC) analysis.
IndicatorValue
Average substantive factor loading0.772
Average method factor loading0.186
Ratio (substantive:method)4.15:1
Δχ2 (model with vs. without CLF)18.42
Δdf14
p-value0.188
Note. CLF = common latent factor. A substantive-to-method variance ratio exceeding 2:1 suggests acceptable common method variance levels [40].
Table 14. Structural model fit indices.
Fit IndexCriterionValueEvaluation
χ22849.311
df2684
χ2/df<3.0 (good); <5.0 (acceptable)1.062Good
RMSEA<0.08 (good); <0.10 (acceptable)0.011Good
CFI>0.90 (acceptable); >0.95 (good)0.991Good
TLI>0.90 (acceptable); >0.95 (good)0.991Good
SRMR<0.080.036Good
AICLower is better3181.311
Note. χ2 = chi-square; df = degrees of freedom; RMSEA = root mean square error of approximation; CFI = comparative fit index; TLI = Tucker–Lewis index; SRMR = standardized root mean square residual; AIC = Akaike information criterion.
Table 15. Path coefficients and hypothesis testing results.
PathβSEtpResult
SP → PR0.3200.0364.817***Supported
PR → RW0.5400.1115.532***Supported
SP → RW0.2420.0354.290***
Note. *** p < 0.001; SP = Spatial Perception; PR = Perceived Restorativeness; SS = Spatial Scale; BP = Boundary Perception; AP = Accessibility Perception; AE = Aesthetic Perception; SAF = Safety Perception; SR = Stress Reduction; ME = Mood Enhancement; PA = Place Attachment; LS = Life Satisfaction; ES = Environmental Sensitivity. β = standardized path coefficient; SE = standard error.
Table 16. Mediation analysis results with bootstrap confidence intervals.
EffectPathβSE95% CIp
Total effectSP → WB0.4150.059[0.297, 0.532]<0.001
Direct effectSP → WB0.2420.063[0.116, 0.365]<0.001
Indirect effectSP → PR → WB0.1730.039[0.105, 0.259]<0.001
Mediation ratio 41.69%
Note. Bootstrap samples = 5000. CI = bias-corrected confidence interval. Partial mediation is indicated when both direct and indirect effects are significant.
Table 17. Moderation analysis results.
VariableModel 1
β
Spatial Perception (SP)0.430 ***
Environmental Sensitivity (ES)0.377 ***
SP × ES0.799 ***
R20.655
Note. *** p < 0.001.
Table 18. Multi-group comparison across riverfront segments (ANOVA).
VariableS1 (n = 100)S2 (n = 83)S3 (n = 78)S4 (n = 88)S5 (n = 113)S6 (n = 89)Fpη2
M (SD)M (SD)M (SD)M (SD)M (SD)M (SD)
Spatial Perception3.464 (0.624)3.644 (0.480)3.676 (0.527)3.499 (0.635)3.862 (0.153)3.518 (0.639)3.6420.0030.032
Perceived Restorativeness3.438 (0.641)3.683 (0.409)3.745 (0.347)3.799 (0.367)3.728 (0.339)3.668 (0.505)6.6220.0000.057
Well-being3.415 (0.627)3.676 (0.425)3.820 (0.271)3.756 (0.243)3.646 (0.448)3.797 (0.237)9.3280.0000.079
Environmental Sensitivity3.467 (0.791)3.678 (0.690)3.597 (0.740)3.493 (0.825)3.825 (0.413)3.421 (0.943)2.0550.0700.019
Note. S1 = Jiangning–Yuhua; S2 = Jianye; S3 = Gulou; S4 = Qixia; S5 = Pukou; S6 = Luhe. η2 = eta-squared effect size.
Table 19. Summary of hypothesis testing results.
HypothesisDescriptionResult
H1Spatial perception is positively associated with perceived restorativenessSupported
H2Perceived restorativeness is positively associated with well-beingSupported
H3Perceived restorativeness mediates the SP-WB relationshipSupported
H4Environmental sensitivity moderates the SP-PR relationshipSupported
Note. SP = Spatial Perception; PR = Perceived Restorativeness; WB = Well-being.
Disclaimer/Publisher’s Note: The statements, opinions and data contained in all publications are solely those of the individual author(s) and contributor(s) and not of MDPI and/or the editor(s). MDPI and/or the editor(s) disclaim responsibility for any injury to people or property resulting from any ideas, methods, instructions or products referred to in the content.