Article

Deformation Characteristics and Support Optimization for Deep Excavations in Sandy Cobble Strata Considering Adjacent Sensitive Structures: A Case Study of a Deep Excavation Project in Sichuan Province

1
School of Architecture and Civil Engineering, Chengdu University, Chengdu 610106, China
2
Geotechnical Engineering Institute, Sichuan Institute of Building Research, Chengdu 610081, China
3
Sichuan Provincial Construction Engineering Quality Inspection Center Co., Ltd., Chengdu 610081, China
*
Authors to whom correspondence should be addressed.
Buildings 2026, 16(3), 541; https://doi.org/10.3390/buildings16030541
Submission received: 28 December 2025 / Revised: 22 January 2026 / Accepted: 25 January 2026 / Published: 28 January 2026

Abstract

As China’s urban underground area grows, deep foundation pit projects in complex geological circumstances, particularly near critical infrastructure, must adhere to tight deformation control guidelines. However, limited research has been conducted on the deformation behavior of internal bracing systems in Sichuan’s sandy cobble strata. This research centers on a deep excavation near civil defense facilities in Pujiang County, Chengdu. We investigated the deformation characteristics of retaining piles and internal bracing systems using field monitoring, finite element simulations, and parameter sensitivity analysis, and proposed optimization solutions for the support scheme. Road settlement, pile-head vertical displacement, building settlement, and deep lateral displacement of retaining piles were all monitored in the field at different phases of excavation. MIDAS/GTS was used to generate a 3D finite element model that included bored piles as a contiguous pile wall. The model was verified against monitored data and showed a maximum variation of 3.7%. Parametric studies were conducted to optimize the equivalent stiffness of the contiguous pile wall and the standardized internal bracing system. The findings indicate that the maximum lateral displacement of retaining piles is the primary optimization restriction. Reducing the equivalent stiffness to 0.6t (relative to the baseline thickness t) causes displacement to surpass the warning threshold (35 mm), whereas increasing it to 1.2t or 1.4t limits deformation without incurring significant costs. Case G of the standardized internal bracing system ensures that the maximum pile displacement (21.95 mm) remains below the warning criterion (24.5 mm) while improving constructability. This work elucidates the deformation characteristics of internal bracing systems in sandy cobble strata near sensitive buildings, offering theoretical and practical assistance for comparable projects.

1. Introduction

With the continuous expansion of urban underground space in China, deep foundation pit projects increasingly exhibit characteristics such as extreme depth, large scale, close proximity to sensitive facilities, and complex geological conditions, which impose stringent requirements on deformation control of the retaining structures [1,2,3,4]. Under such complex geological and environmental conditions, internal support systems play a crucial role in maintaining the overall stability of foundation pits. The mechanical response and deformation behavior of internal support systems directly affect construction safety as well as the operational performance of surrounding infrastructure [5,6,7].
In recent years, extensive research has been conducted globally on the deformation mechanisms of deep excavations. Hsiung et al. [8] revealed through field measurements that the maximum lateral displacement of diaphragm walls in sandy soils was only 0.32% of the excavation depth. Additionally, due to the presence of a water-impermeable clay layer at the base, groundwater drawdown had a limited effect on areas outside the excavation. Moormann [9], through a statistical analysis of more than 530 international cases, identified the support system type, excavation method, and soil conditions as the primary factors influencing the deformation behavior of diaphragm walls and surface settlement patterns. In soft soil regions, both Yang et al. [10] and Xu et al. [11] observed that the maximum displacement of diaphragm walls typically occurs at a depth corresponding to 0.6–0.8 times the excavation depth. The resulting surface settlement trough generally follows a quasi-Gaussian distribution, with the influence zone extending up to 1.5–2.0 times the depth of excavation. Furthermore, the hydro-mechanical coupling effect cannot be neglected. Xia et al. [12] demonstrated that ignoring pore water pressure dissipation may result in underestimating diaphragm wall deformation by as much as 30%. Meanwhile, Gao et al. [13] highlighted that in sandy strata, although circular-shaped foundation pit excavations can reduce lateral displacement due to circumferential confinement effects, they significantly increase the risk of base heave. This effect becomes particularly pronounced under the influence of groundwater pressure, with heave magnitude potentially increasing by more than 13%. To accurately capture complex hydro-mechanical coupling effects and achieve reliable predictions, Bayesian inference techniques have been increasingly applied to soil–structure interaction problems. These methods effectively provide a robust framework to address the ill-conditioning and non-uniqueness inherent in traditional load inversion approaches, enabling realistic estimation of earth pressure distributions and reliable representation of groundwater–structure interactions in practical engineering applications [14]. Moreover, for dynamic excavation processes involving complex and irregular time-series data, adaptive Bayesian curve fitting approaches have demonstrated strong potential by significantly improving inversion efficiency under highly complex posterior distributions, and have been successfully applied to engineering problems such as shield machine attitude deviation prediction [15,16]. With regard to interactions with adjacent existing structures, Shi et al. [17] demonstrated that short, rectangular-shaped excavations cause minimal disturbance to underlying tunnels. However, neglecting three-dimensional effects may lead to significant overestimations of tunnel heave and lateral tensile strain—by up to 160% and 50%, respectively. Chen et al. [18] and Liu et al. [19] using numerical simulations, found that tunnel horizontal displacements were concentrated near excavation faces, with peak shear stresses reaching −548.64 kPa. Several studies have also shown that finite element modeling can reliably reproduce excavation-induced stress and displacement fields when appropriate constitutive models and boundary conditions are adopted, thereby supporting its applicability in geotechnical engineering analyses [20]. Mu et al. [21] further proposed a bidirectional calculation method for analyzing the response of pile–raft foundations, providing theoretical support for assessing potential damage to adjacent structures. Meanwhile, Dong et al. [22] and Li et al. [23] emphasized that factors such as concrete cracking, interface slippage, and thermal shrinkage can significantly contribute to the degradation of support system stiffness. Therefore, the appropriate reduction in relevant material parameters in numerical modeling is essential for improving predictive accuracy. To address the above challenges, novel support systems and optimization strategies have continuously emerged. Liu [24] proposed a prestressed fish-belly steel bracing system which, owing to its adjustable stiffness and active control capability, can effectively reduce retaining-structure displacement while lowering overall costs. Wang et al. [25] introduced a hydraulic servo steel bracing system that regulates axial force through real-time feedback, achieving a 25–40% reduction in deformation in ultra-deep excavations. Miao et al. [26] developed a “multi-circular-ring” internal bracing system, which successfully balanced excavation efficiency and deformation control in the Kunming Hub Project, with a maximum deep horizontal displacement of only 46 mm. In addition, Zang et al. [27] advocated a shift in design philosophy from “strength control” to “deformation control,” particularly for soft-soil regions such as the Yangtze River Delta and the Pearl River Delta. Meanwhile, Lu et al. [28] integrated game-theory-based combination weighting with cloud models to establish an intelligent multi-criteria framework for optimal selection of support schemes, encompassing safety, economic, and environmental dimensions.
Despite these advances, systematic investigations into the deformation behavior of internal bracing systems in deep excavations constructed in typical sandy cobble strata in Sichuan remain limited. In particular, the combined influence of complex local geological conditions and the proximity of sensitive structures has not been adequately addressed. Based on a representative deep excavation project adjacent to sensitive facilities in Sichuan, this study integrates field monitoring data, refined three-dimensional finite element modeling, and sensitivity analysis of internal bracing parameters. The objective is to elucidate the deformation characteristics of internal bracing systems under such conditions and to provide theoretical insights and practical guidance for similar deep excavation projects.

2. Project Overview

2.1. Overall Layout and Geological Conditions

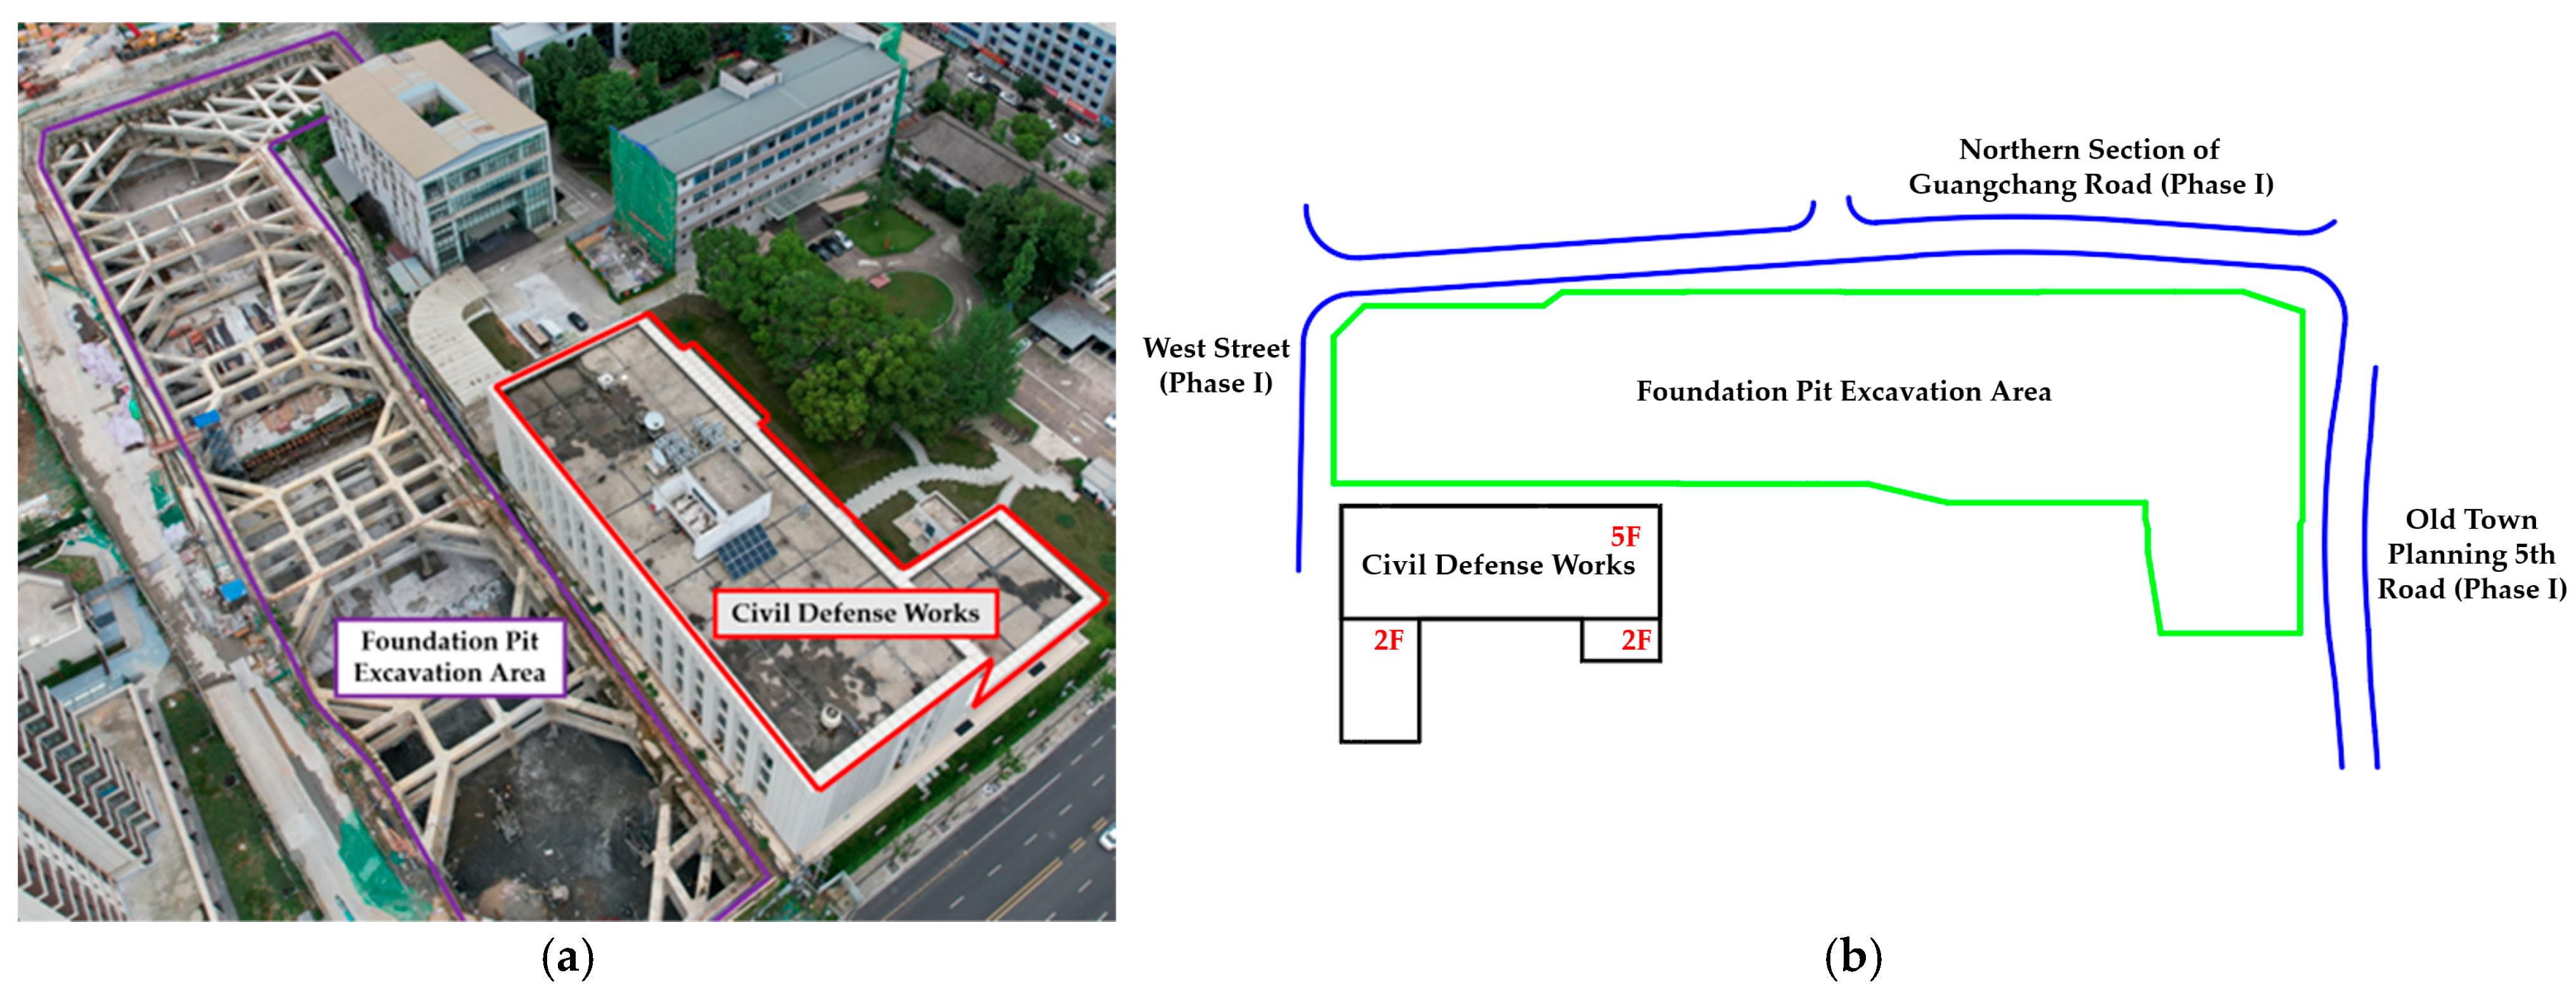
The project is located in the urban core of Pujiang County, Chengdu City, Sichuan Province, at the intersection of West Street and the northern section of the planned West Square Road. The site is adjacent to a civil defense structure, resulting in a sensitive surrounding environment with spatial constraints. The project location is shown in Figure 1. The proposed structure is an underground parking garage. The main structure consists of two levels, with local expansions to four levels, and is founded on a raft slab foundation. The maximum excavation depth reaches 21.4 m, with a minimum depth of 6.3 m. The excavation has a perimeter of approximately 609 m and covers a total area of about 10,669 m2. Due to its proximity to important public buildings and stringent deformation control requirements, the excavation is classified as Safety Grade I, with a designed service life of 12 months. The site was originally part of an old town redevelopment area. Demolition has been completed, and the general topography slopes from north to south. According to the geotechnical investigation report, the subsurface strata, from top to bottom, primarily consist of Quaternary Holocene artificial fill (including miscellaneous fill and plain fill), underlain by Quaternary Holocene alluvial–pluvial deposits (comprising silt, silty clay, fine sand, medium sand, and gravel). The sandy cobble strata are widely distributed within the excavation depth and are generally encountered at depths of approximately 3.0–15.0 m, with a large and continuous thickness. The layer consists of gravel-dominated particles (2–20 cm) accounting for about 53.0–74.8%, with sand and gravel fillings forming a coarse-grained skeleton. The compactness varies spatially from loose to dense, as indicated by N120 super-heavy dynamic penetration tests, based on which the layer is subdivided into four sublayers. Owing to its heterogeneous compactness and high permeability, the sandy cobble strata play a governing role in excavation-induced deformation and require targeted support and dewatering measures to ensure construction safety. The site groundwater is primarily pore phreatic water, stored within the Quaternary sand and gravel layers. The groundwater table depth ranges from 2.2 m to 11.9 m below ground level, corresponding to an elevation of approximately 505.3 m to 505.9 m. During excavation, groundwater levels were continuously monitored using water level pipes installed in boreholes and measured with a steel tape water level gauge. Appropriate dewatering measures were implemented to maintain the groundwater table consistently below the excavation bottom throughout construction.

2.2. Summary of Retaining Piles

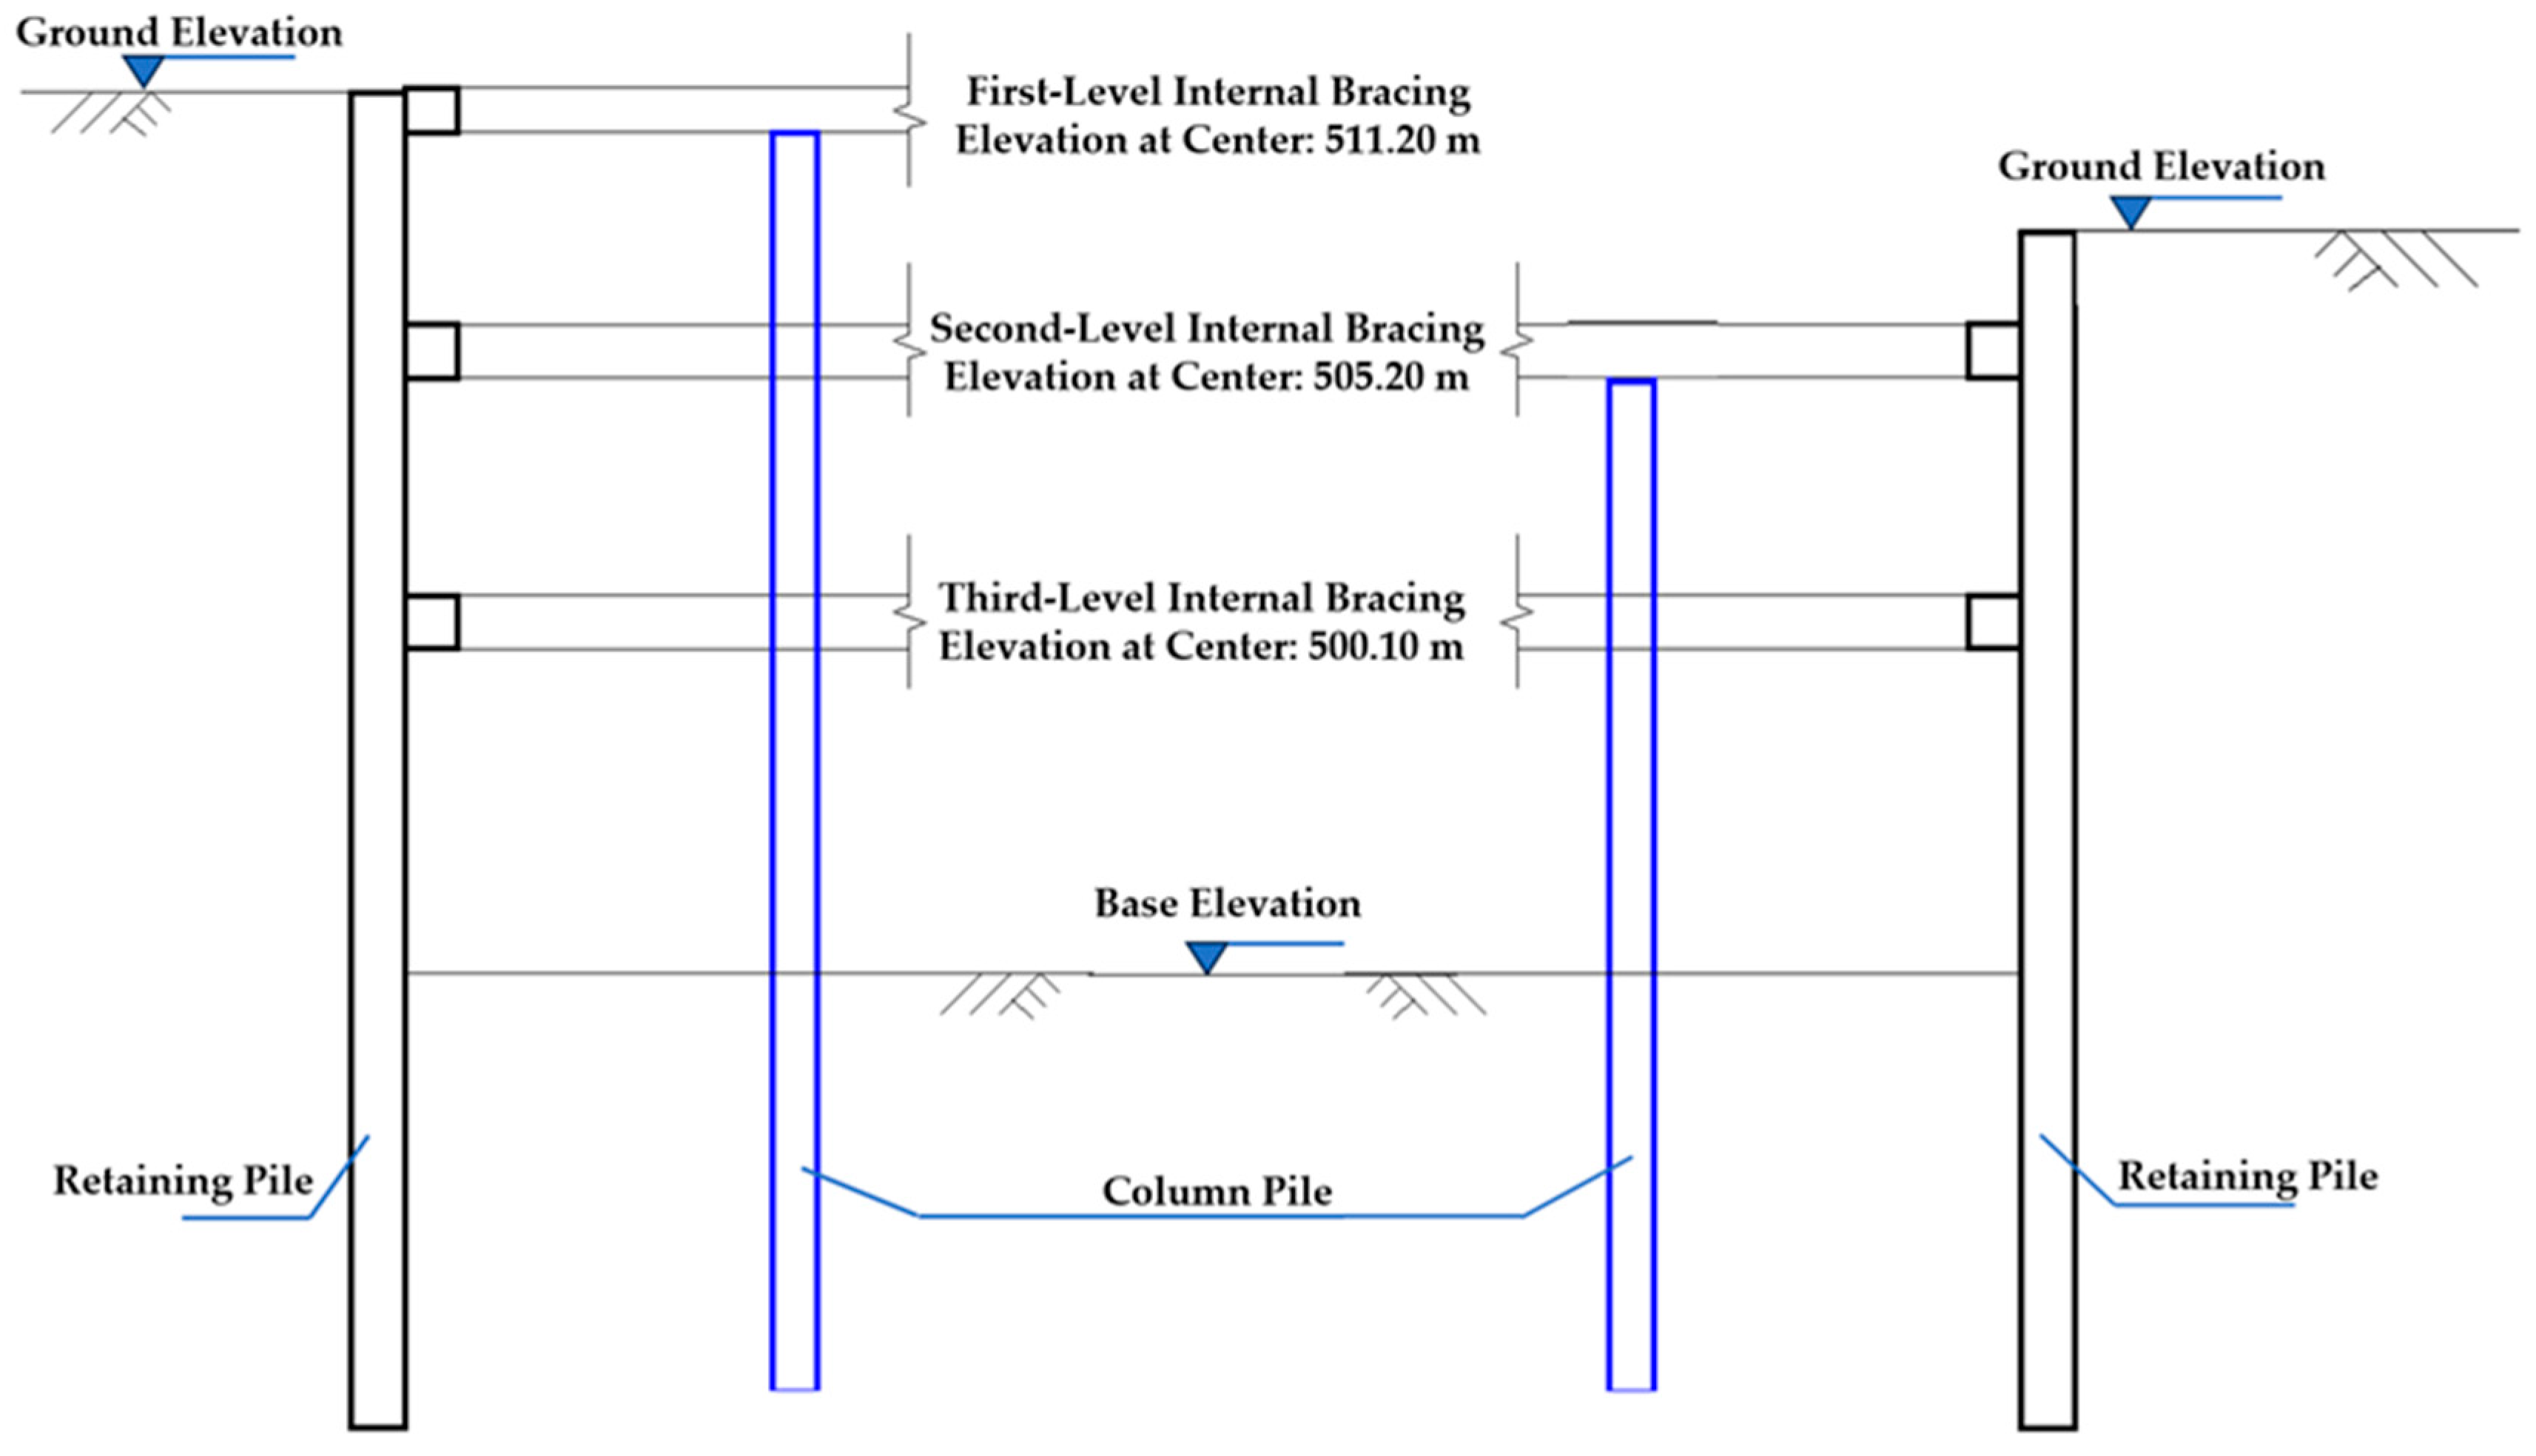
This project is located adjacent to municipal roads and civil defense facilities, with surrounding structures being sensitive to deformations of the excavation. Due to the lack of natural slopes around the site, the excavation is supported using a retaining pile and internal bracing system. For the section near the civil defense facility, bored piles and high-pressure jet grouted piles between the piles are used to prevent the extrusion of loose sand and fill materials. The high-pressure jet grouting employs a triple-tube method. The construction sections AB/BB1/B1B2/B2C/BC/CD/DE/NP/PQ/QA adopt retaining piles combined with a three-tier internal bracing system. The construction sections EF/FG1/G1G/GH/HK/KL/LM/MN employ retaining piles with a two-tier internal bracing system. A capping beam is provided at the pile heads, and waist beams are installed at the elevations corresponding to each level of internal bracing, working integrally with the retaining piles. The design parameters of the piles for each construction section are presented in Table 1, and a typical cross-section is shown in Figure 2.
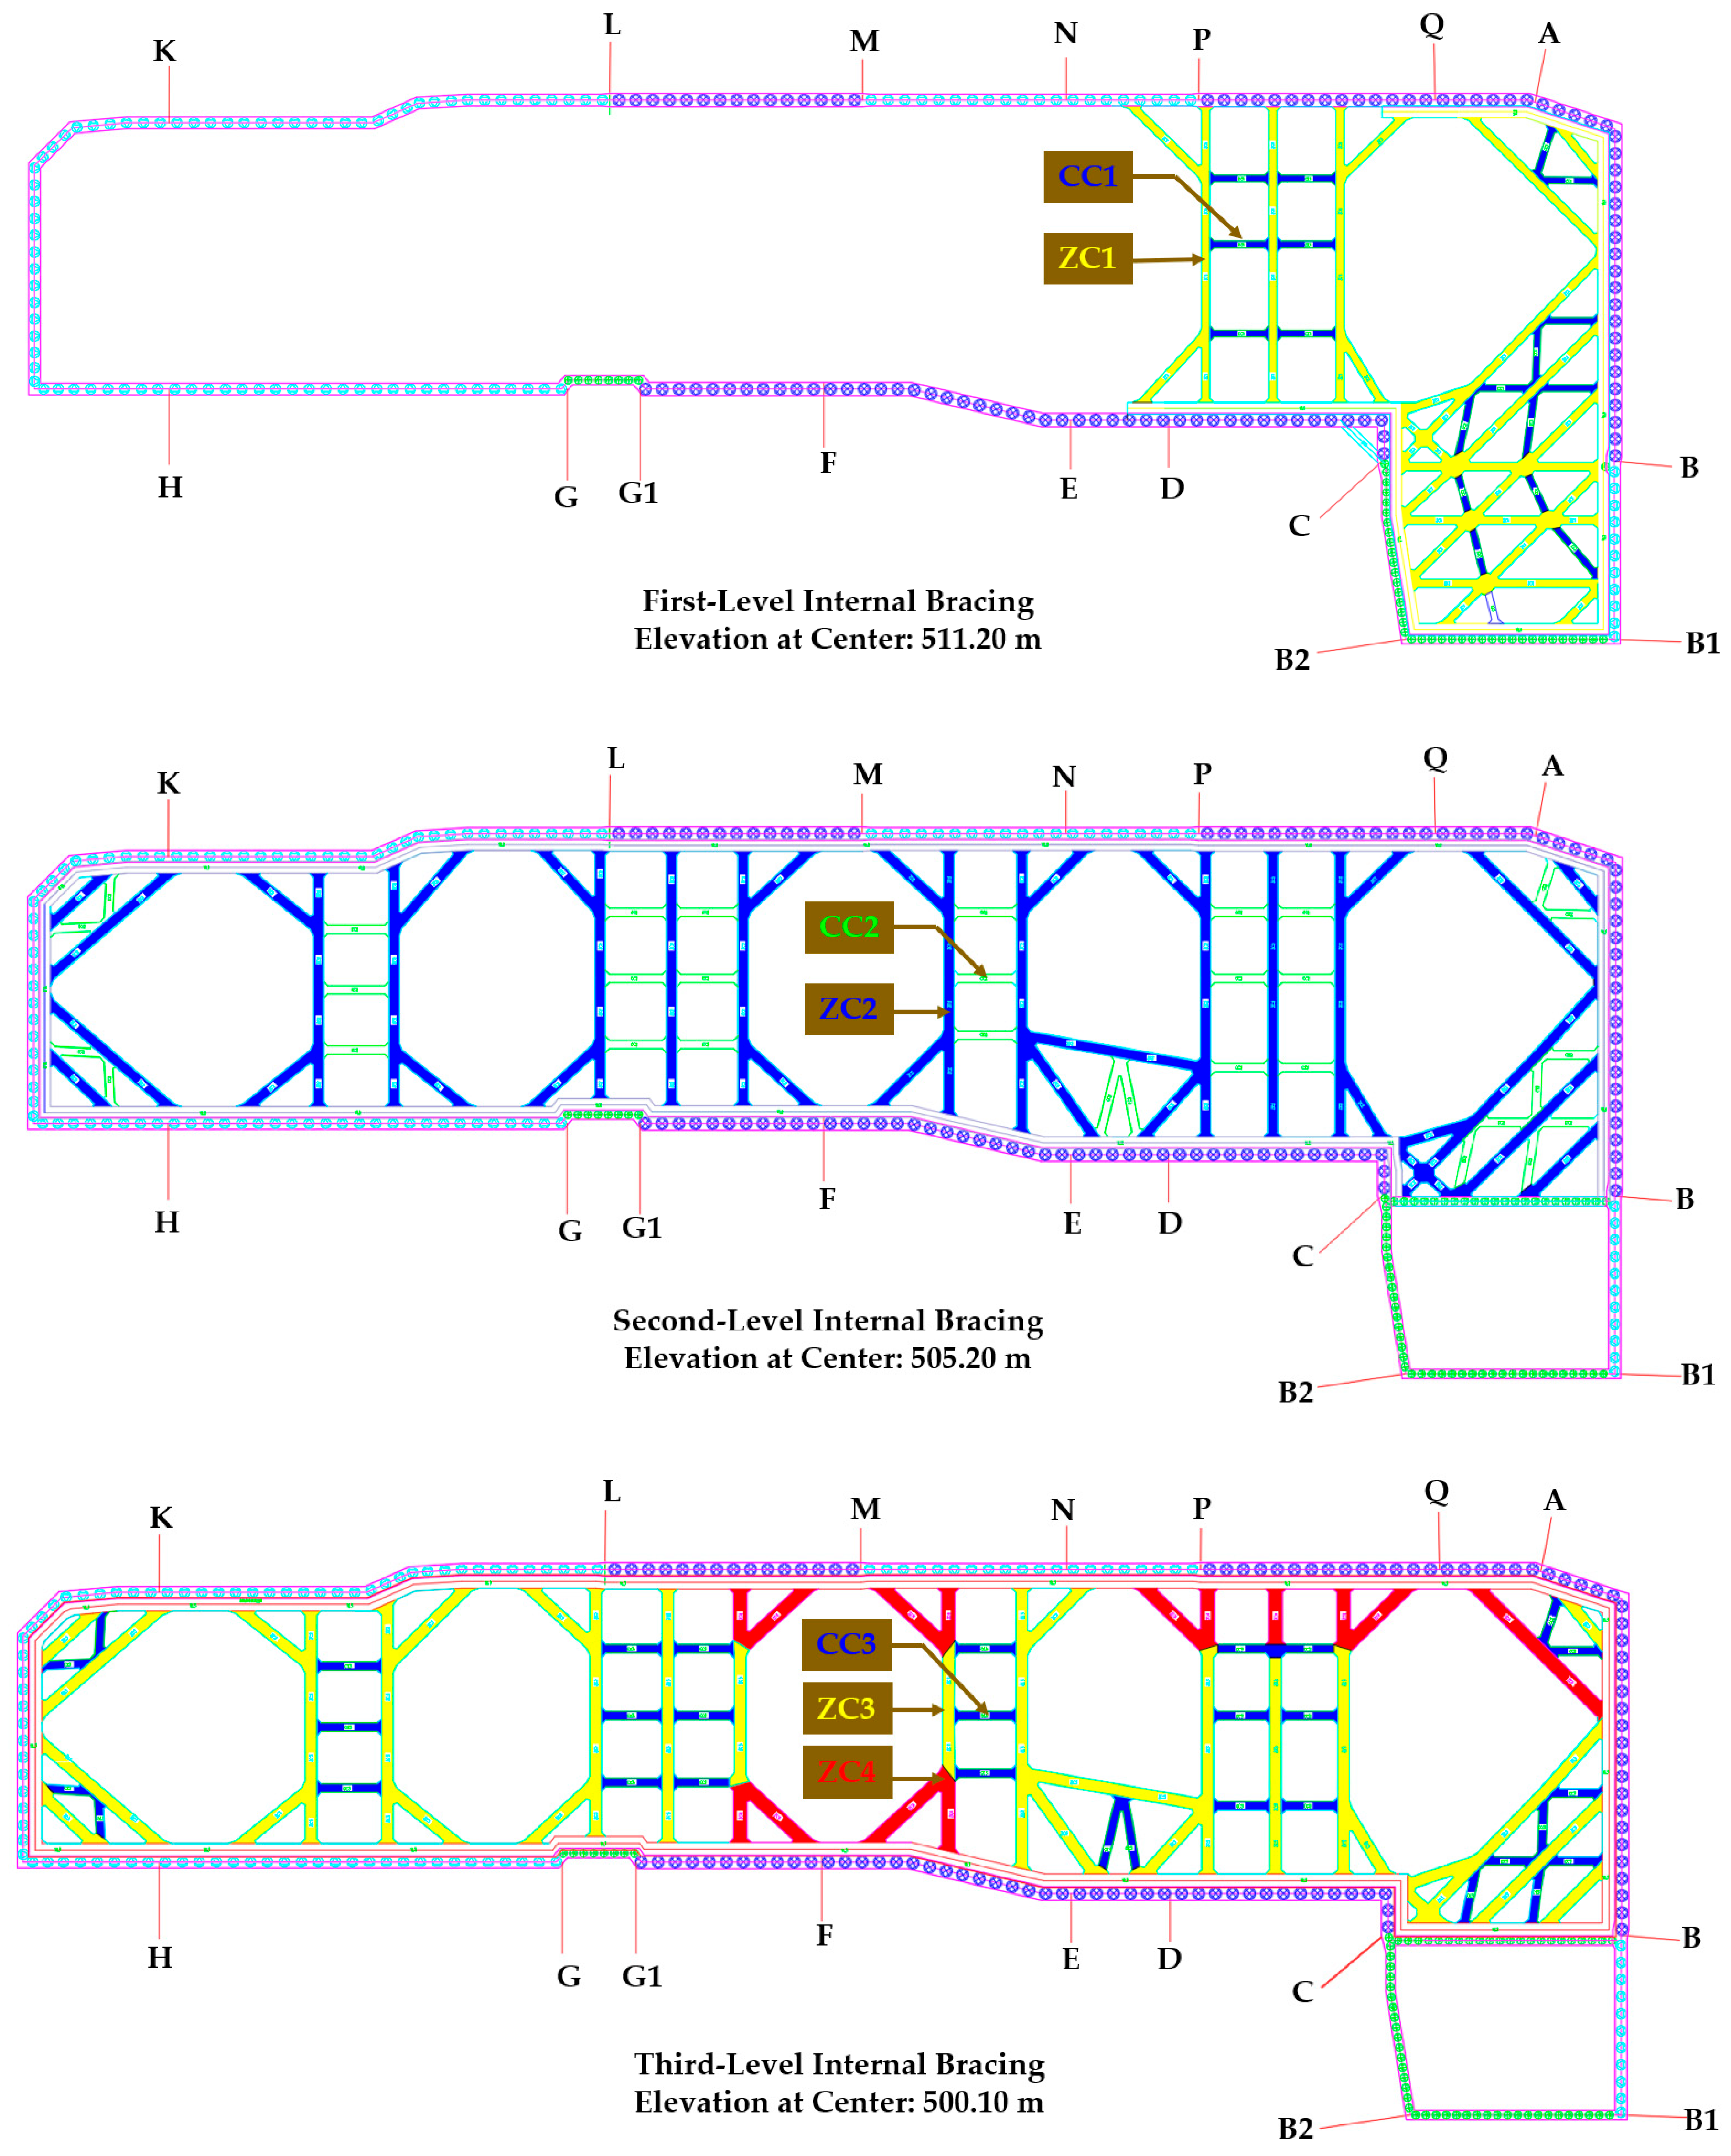
A reinforced concrete capping beam was constructed at the pile heads, with a height of 1.0 m and a width 0.2 m greater than the pile diameter. The gaps between adjacent piles were sealed using wire-mesh reinforced shotcrete. The shotcrete thickness was 80 mm, and the reinforcing mesh was arranged at a spacing of 150 mm × 150 mm. The first and second levels of internal bracing adopted C30 concrete struts, whereas the third level used C40 concrete struts. A plan view of the three-level internal bracing layout is shown in Figure 3. In each bracing level, the primary strut(s) and secondary strut were denoted as follows: Level 1: ZC1 (primary) and CC1 (secondary); Level 2: ZC2 (primary) and CC2 (secondary); Level 3: ZC3 and ZC4 (primary) and CC3 (secondary). The corresponding cross-sectional dimensions were ZC1: 1.0 m × 1.0 m; CC1: 0.8 m × 0.8 m; ZC2: 1.2 m × 1.0 m; CC2: 1.0 m × 1.0 m; ZC3: 1.4 m × 1.0 m; ZC4: 1.6 m × 1.0 m; and CC3: 1.0 m × 1.0 m.

3. Instrumentation and Monitoring Plan for the Deep Excavation

The main goal of excavation monitoring is to ensure the safety and stability of both the excavation system and its surrounding environment. By regularly assessing key indicators, the monitoring program offers timely safety alerts and supports informed construction decisions, while also creating a valuable database of engineering performance data.

3.1. Monitoring Frequency and Alarm Thresholds

Prior to excavation, monitoring points were installed and baseline measurements were conducted. During excavation, the monitoring frequency was adjusted according to the excavation depth: when the excavation depth was less than 5 m, measurements were taken once every 2 days; for depths of 5–10 m, measurements were taken once per day; and when the excavation depth exceeded 10 m, measurements were taken twice per day. After the excavation reached the design elevation and the deformation became stable, monitoring was generally conducted once every 3 days. Upon completion of the basement raft construction, if three consecutive monitoring rounds indicated no further changes, the monitoring interval could be extended to once every 15 days until backfilling. In the event of abnormal responses, the monitoring frequency was increased. More intensive monitoring was implemented under particularly hazardous conditions or during extreme rainfall events. The alert and alarm thresholds of the monitoring indices were determined by the foundation pit design institute based on the site-specific engineering geological conditions, the type of retaining and bracing system, excavation depth, and surrounding environmental constraints. These thresholds were provided in the approved design documents and were adopted in this study as governing criteria for performance assessment and optimization. To save space, only the control limits of the monitoring indices relevant to this study are presented, as summarized in Table 2.

3.2. Layout of Monitoring Points

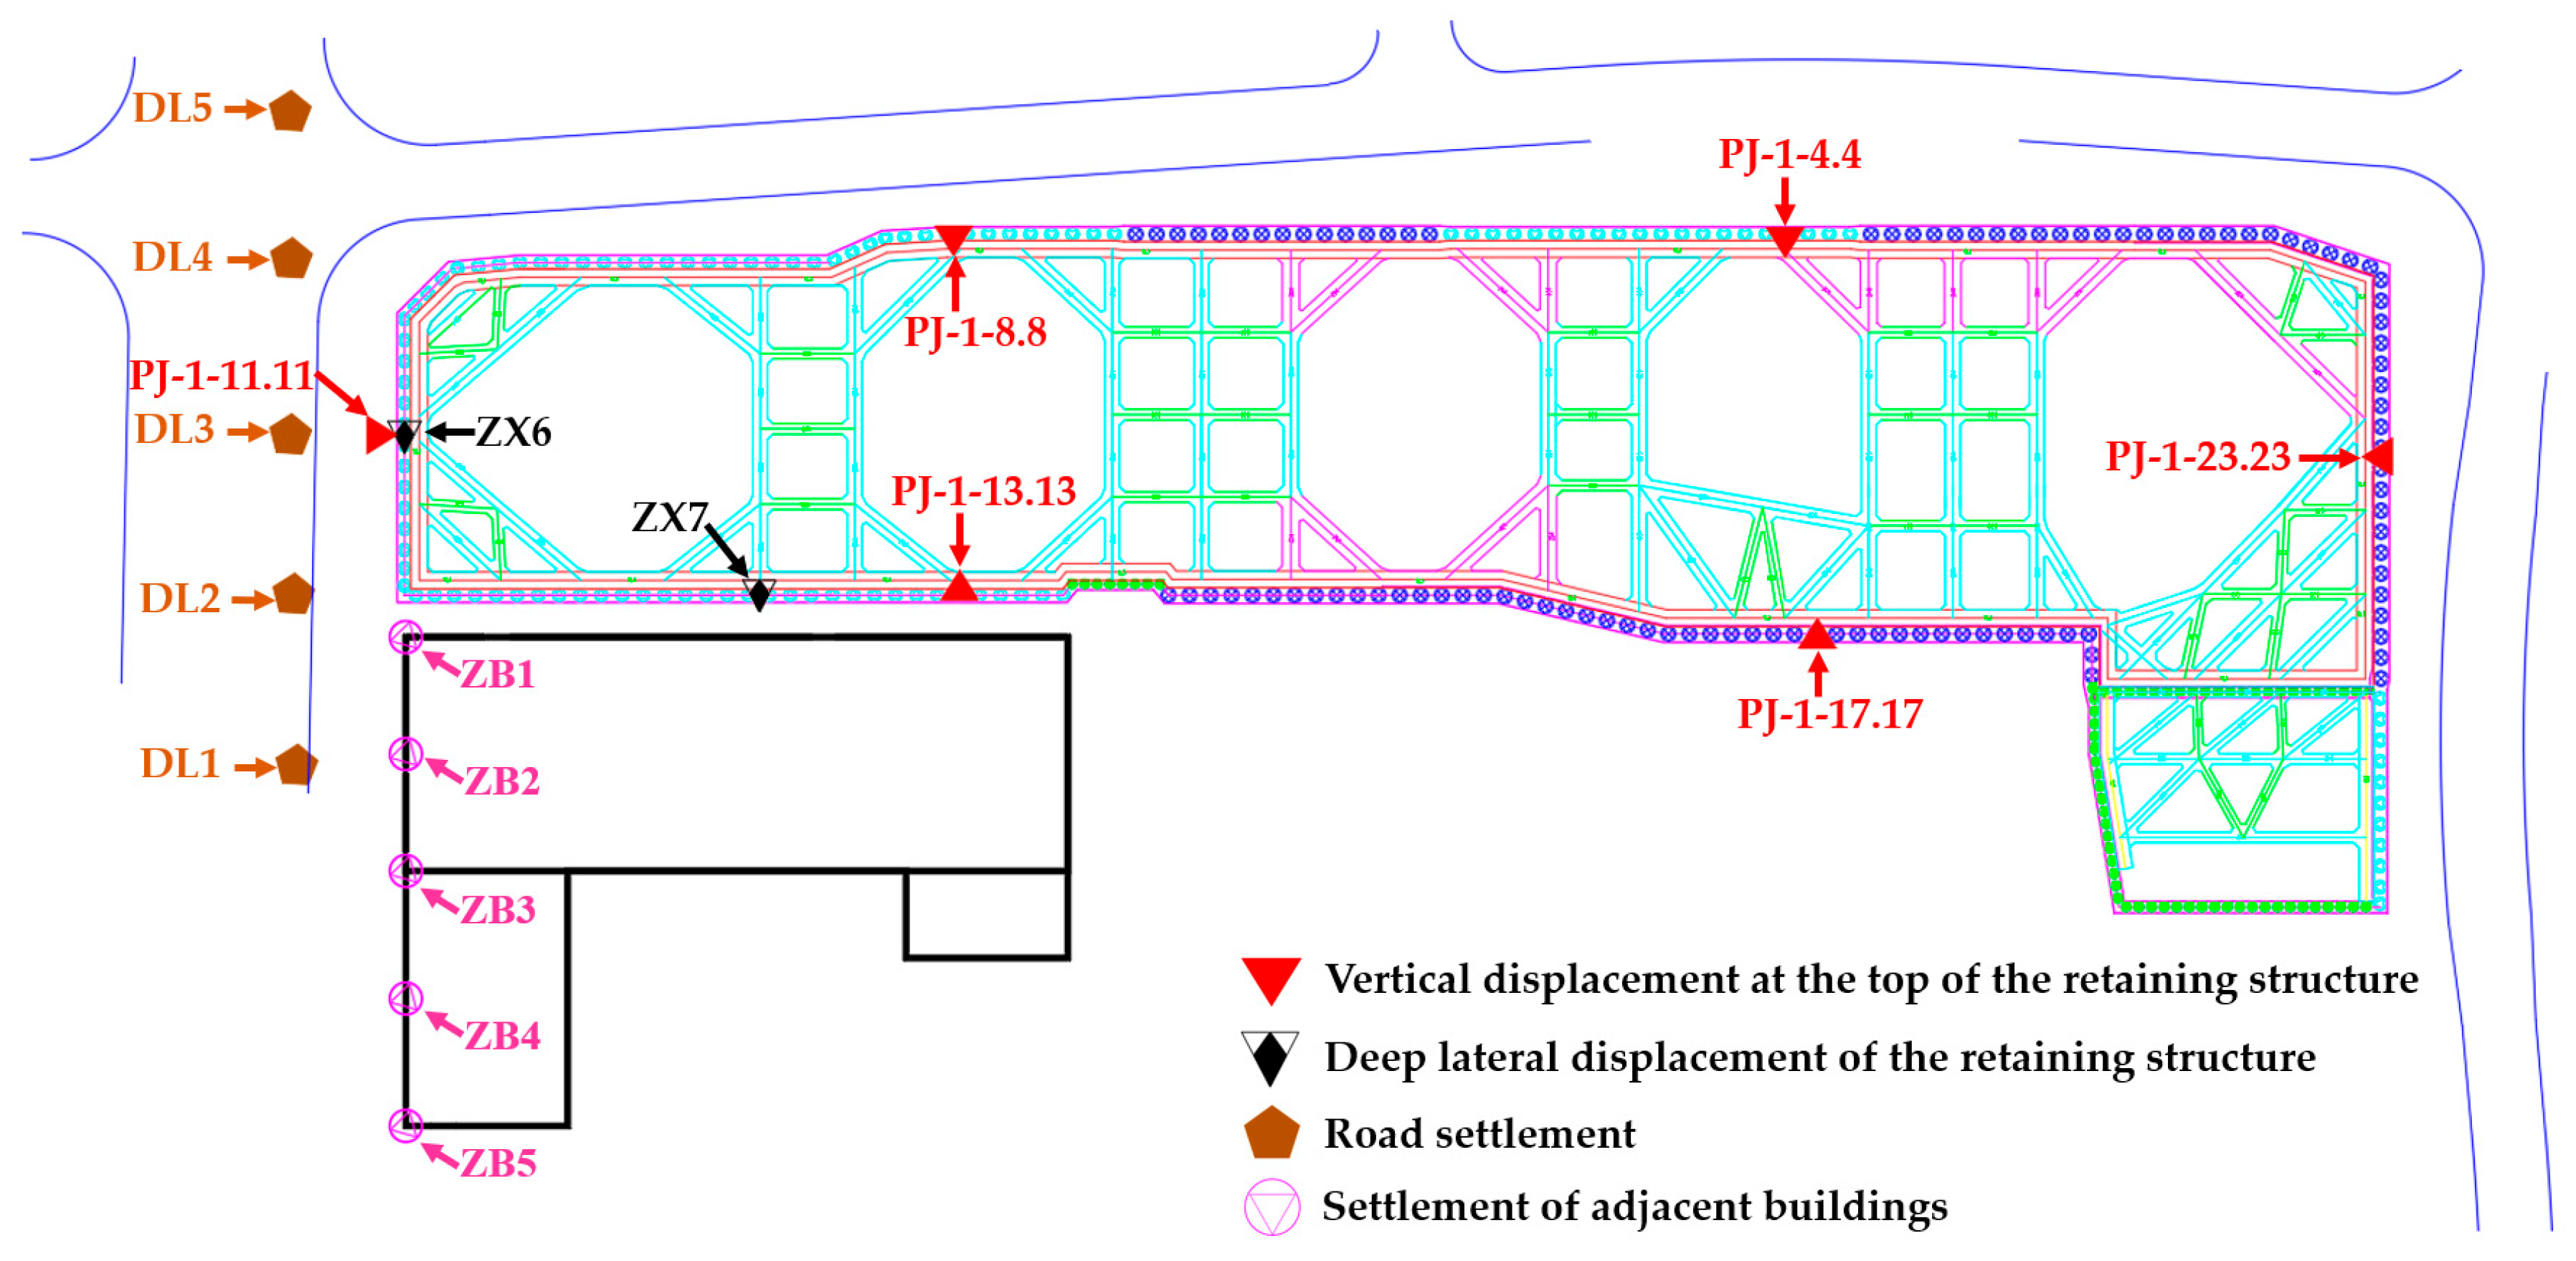
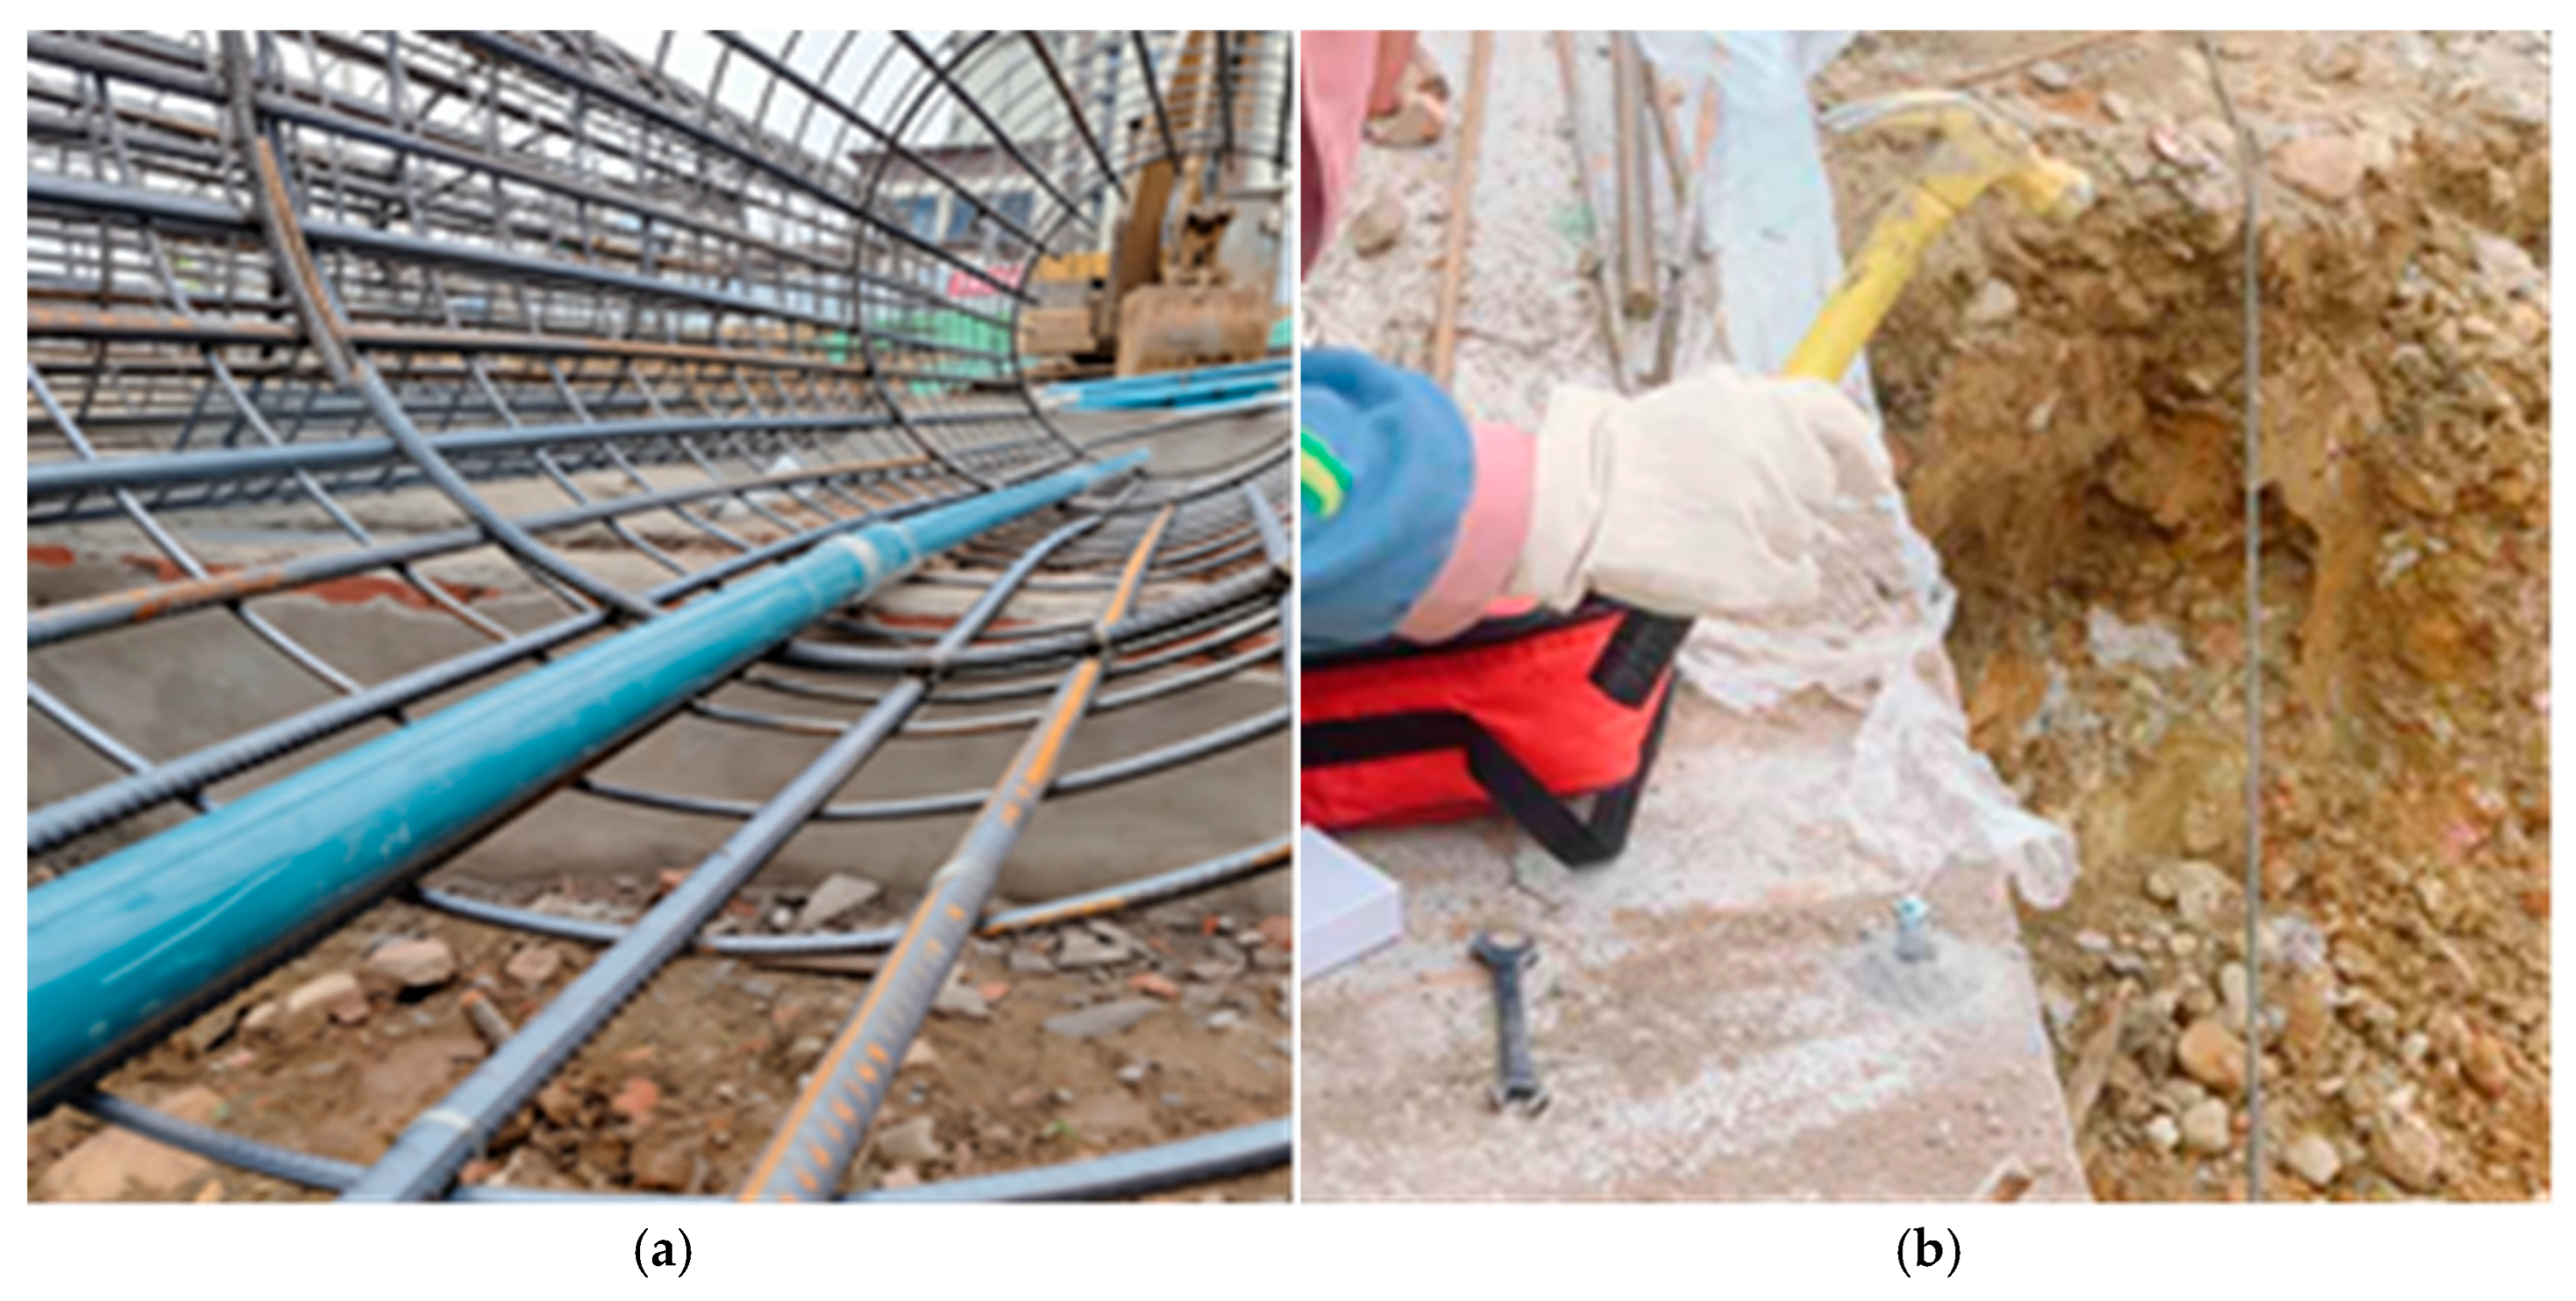
The standards primarily adopted during construction and monitoring of this excavation project include the General Code for Engineering Surveying (GB 55018—2021) [29] and the Standard for Engineering Surveying (GB 50026—2020) [30], among others. In accordance with these standards, monitoring was conducted for the horizontal and vertical displacements at the top of the retaining structure, the axial forces in the internal struts, the deep lateral displacement of the retaining piles, the vertical displacement of king posts, the settlement of adjacent buildings, and groundwater levels. Figure 4 shows the on-site layout of monitoring points for the deep lateral displacement of the contiguous pile wall and the displacements at the pile heads. Because the overall monitoring layout involved a large number of points, Figure 5 presents only the monitoring points relevant to this study. During excavation, all monitoring instruments were calibrated and verified for accuracy prior to use to ensure data reliability. The instruments and their measurement accuracies are summarized as follows: (1) Inclinometer: used to measure the lateral displacement of retaining piles, with an accuracy of 0.02 mm/0.5 m; (2) Level (automatic/digital level): used to measure the vertical displacement at the pile heads, road settlement, and settlement of adjacent buildings, with an accuracy of 0.3 mm/km.

3.3. Monitoring Data Analysis

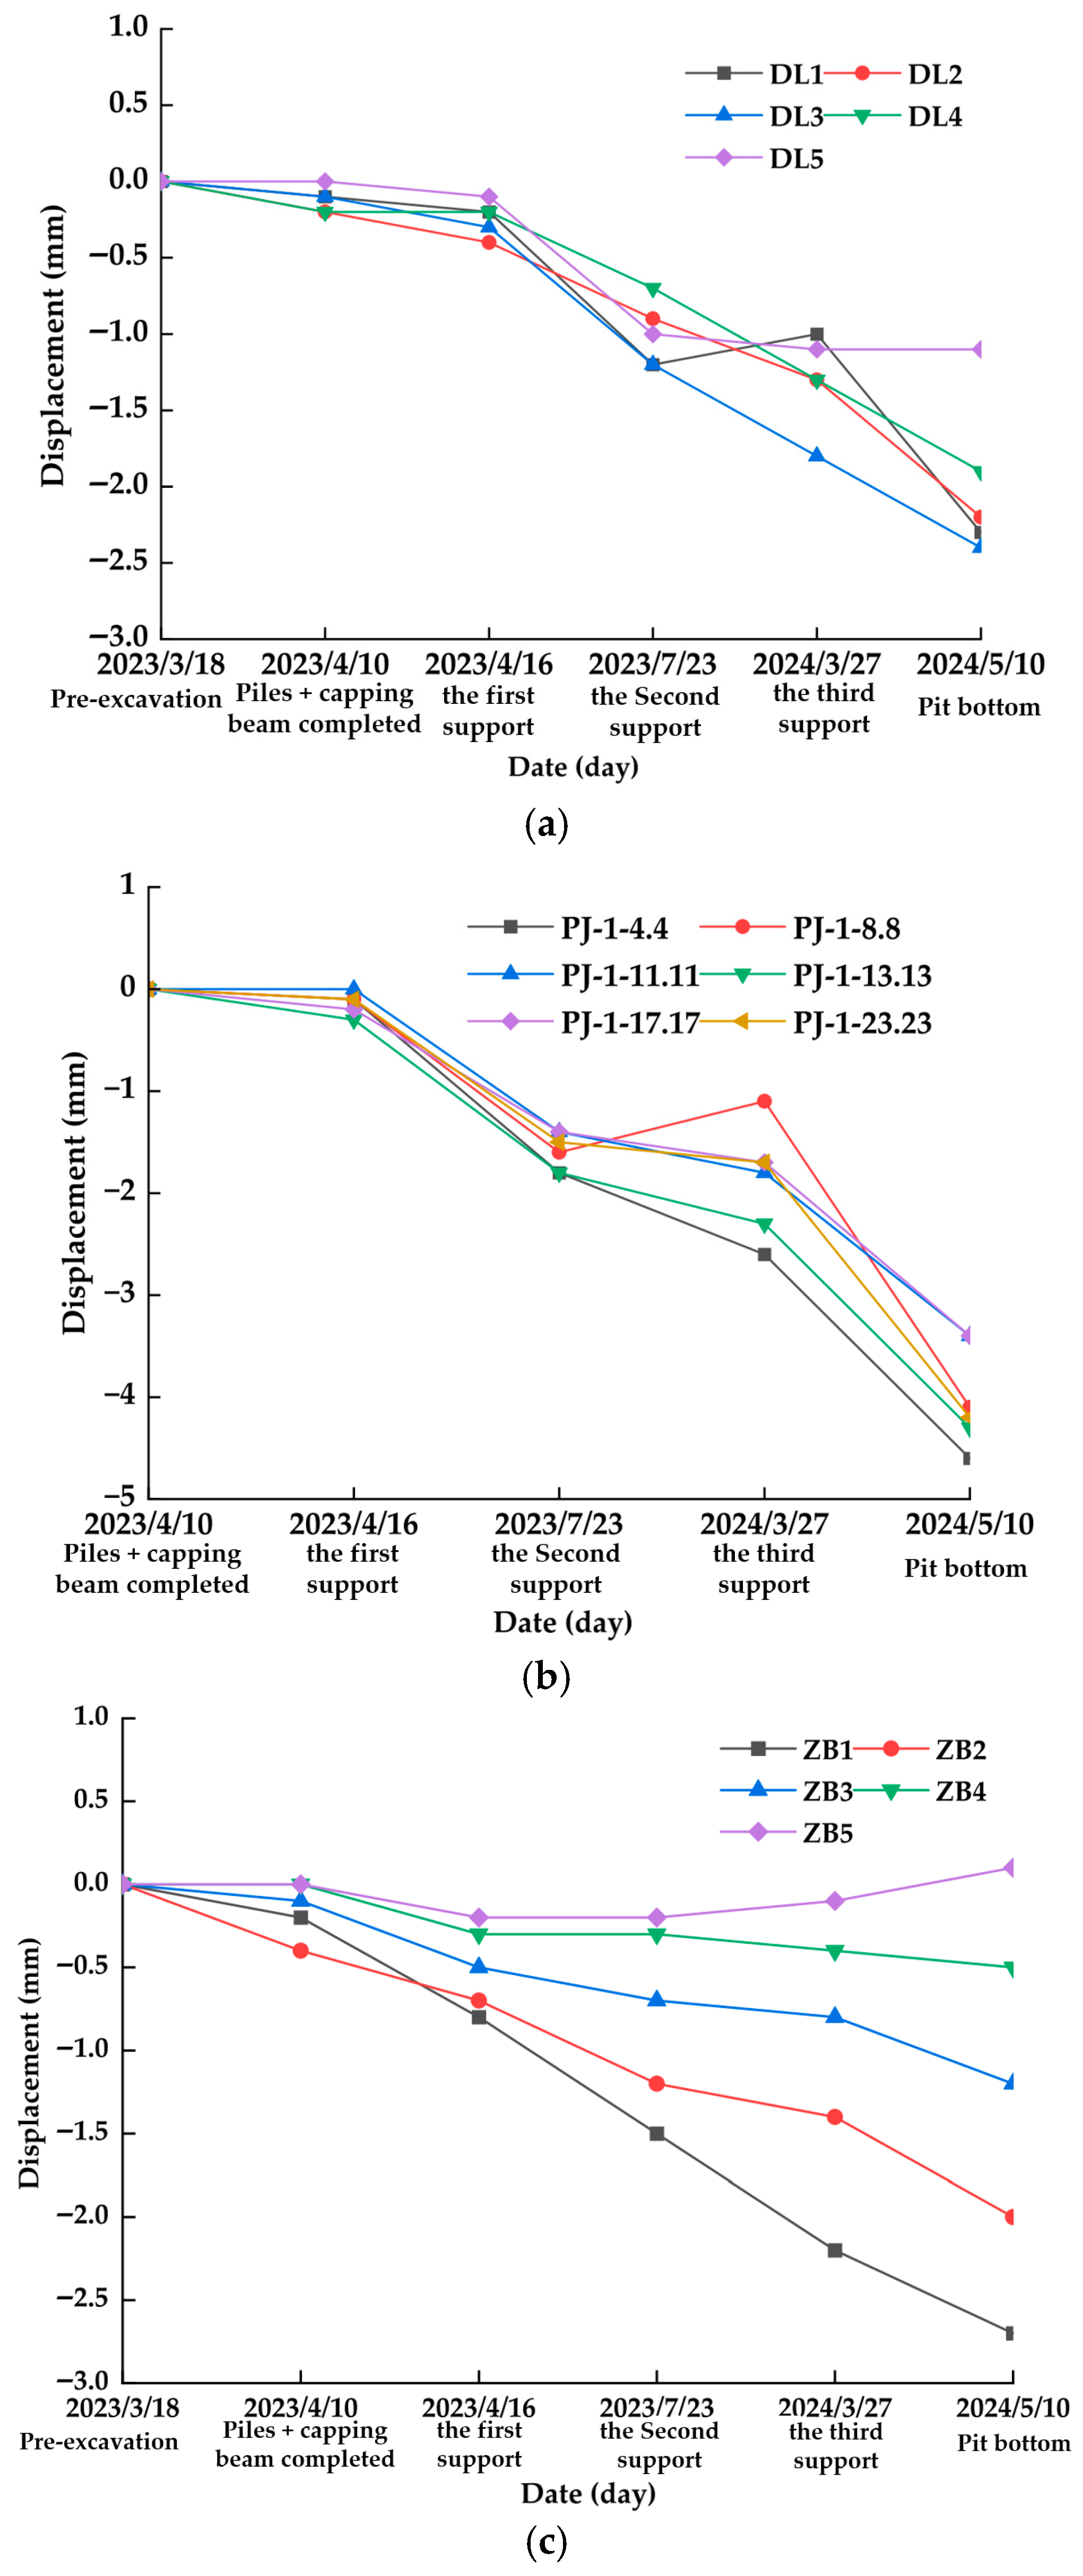
To ensure that the monitoring results accurately reflected the deformation behavior of the excavation support system and surrounding environment, representative monitoring points were selected based on their spatial distribution and engineering significance. Specifically, road settlement monitoring points (DL1–DL5) were arranged along the adjacent roadway to capture excavation-induced surface settlement. Vertical displacement monitoring points at the pile heads (PJ-1-4.4 to PJ-1-23.23) were distributed along the retaining piles to directly reflect structural deformation of the retaining system. Settlement monitoring points for adjacent buildings (ZB1–ZB5) were installed around nearby structures to evaluate the influence of excavation activities on existing buildings. In addition, two inclinometer casings (ZX6 and ZX7) were selected to characterize the deep lateral displacement profiles of the retaining piles. Given the large volume of monitoring data collected throughout construction, the analysis focused on measurements corresponding to representative excavation milestones to enhance interpretability and relevance. As illustrated in Figure 6, the selected monitoring dates correspond to key construction stages, including the initial condition prior to excavation (18 March 2023), completion of retaining pile and capping beam construction (10 April 2023), excavation to the first internal bracing level (16 April 2023), excavation to the second internal bracing level (23 July 2023), excavation to the third internal bracing level (27 March 2024), and excavation to the pit bottom (10 May 2024).

3.3.1. Analysis of Field-Monitored Settlements

The time histories of monitored deformations are illustrated in Figure 6, where three categories of responses are compared: road settlement (DL series), pile-head vertical displacement of retaining piles (PJ-1-4.4–PJ-1-23.23), and settlement of adjacent buildings (ZB series). For the road settlement (Figure 6a), the monitored values exhibited a progressive cumulative downward trend throughout excavation. The maximum settlement at the final stage occurred at DL3, reaching 2.4 mm, followed by DL1 (2.3 mm) and DL2 (2.2 mm), whereas DL5 showed the smallest cumulative settlement of 1.1 mm. In terms of stage-wise development, settlement was minor during the early stage (10 April–16 April 2023), with typical values within 0.1–0.4 mm; a noticeable increase was observed after excavation reached the second level of internal bracing (16 April–23 July 2023), during which DL1 and DL3 increased from approximately 0.2–0.3 mm to 1.2 mm (increment of about 0.9–1.0 mm); subsequent excavation to the third bracing level and finally to the pit bottom contributed additional cumulative settlement, with DL3 increasing from 1.8 mm (27 March 2024) to 2.4 mm (10 May 2024), corresponding to an increment of approximately 0.6 mm. The maximum road settlement was far below the alarm threshold (20 mm; Table 2), indicating stable development without abrupt acceleration.
Pile-head vertical displacement of the retaining piles (Figure 6b) exhibited a more pronounced response compared to road settlement, reflecting the direct structural deformation induced by excavation unloading and internal force redistribution. Among all monitoring points, PJ-1-4.4 recorded the largest cumulative settlement, reaching 4.6 mm at the final stage, followed by PJ-1-13.13 (4.3 mm) and PJ-1-23.23 (4.2 mm). Pile-head settlement remained minimal prior to excavation reaching the first bracing level but increased substantially after excavation advanced to the second bracing level. A further increase was observed during excavation to the third bracing level and the pit bottom, with PJ-1-4.4 increasing by approximately 2.0 mm during the final excavation stage. All measured values were significantly lower than the alarm threshold of 30 mm (Table 2), confirming effective deformation control by the support system.
Settlement of adjacent buildings (Figure 6c) was relatively small and developed smoothly, demonstrating a clear attenuation of excavation-induced effects with increasing distance from the excavation boundary. ZB1 experienced the largest cumulative settlement (−2.7 mm), followed by ZB2 (−2.0 mm), ZB3 (−1.2 mm), and ZB4 (−0.5 mm), while ZB5 remained nearly stable. The settlement curves exhibited no sudden jumps or short-term acceleration, and all deformation rates remained below 2.1 mm/day, indicating effective protection of surrounding buildings.

3.3.2. Field Monitoring Analysis of Deep Lateral Displacement of Retaining Piles

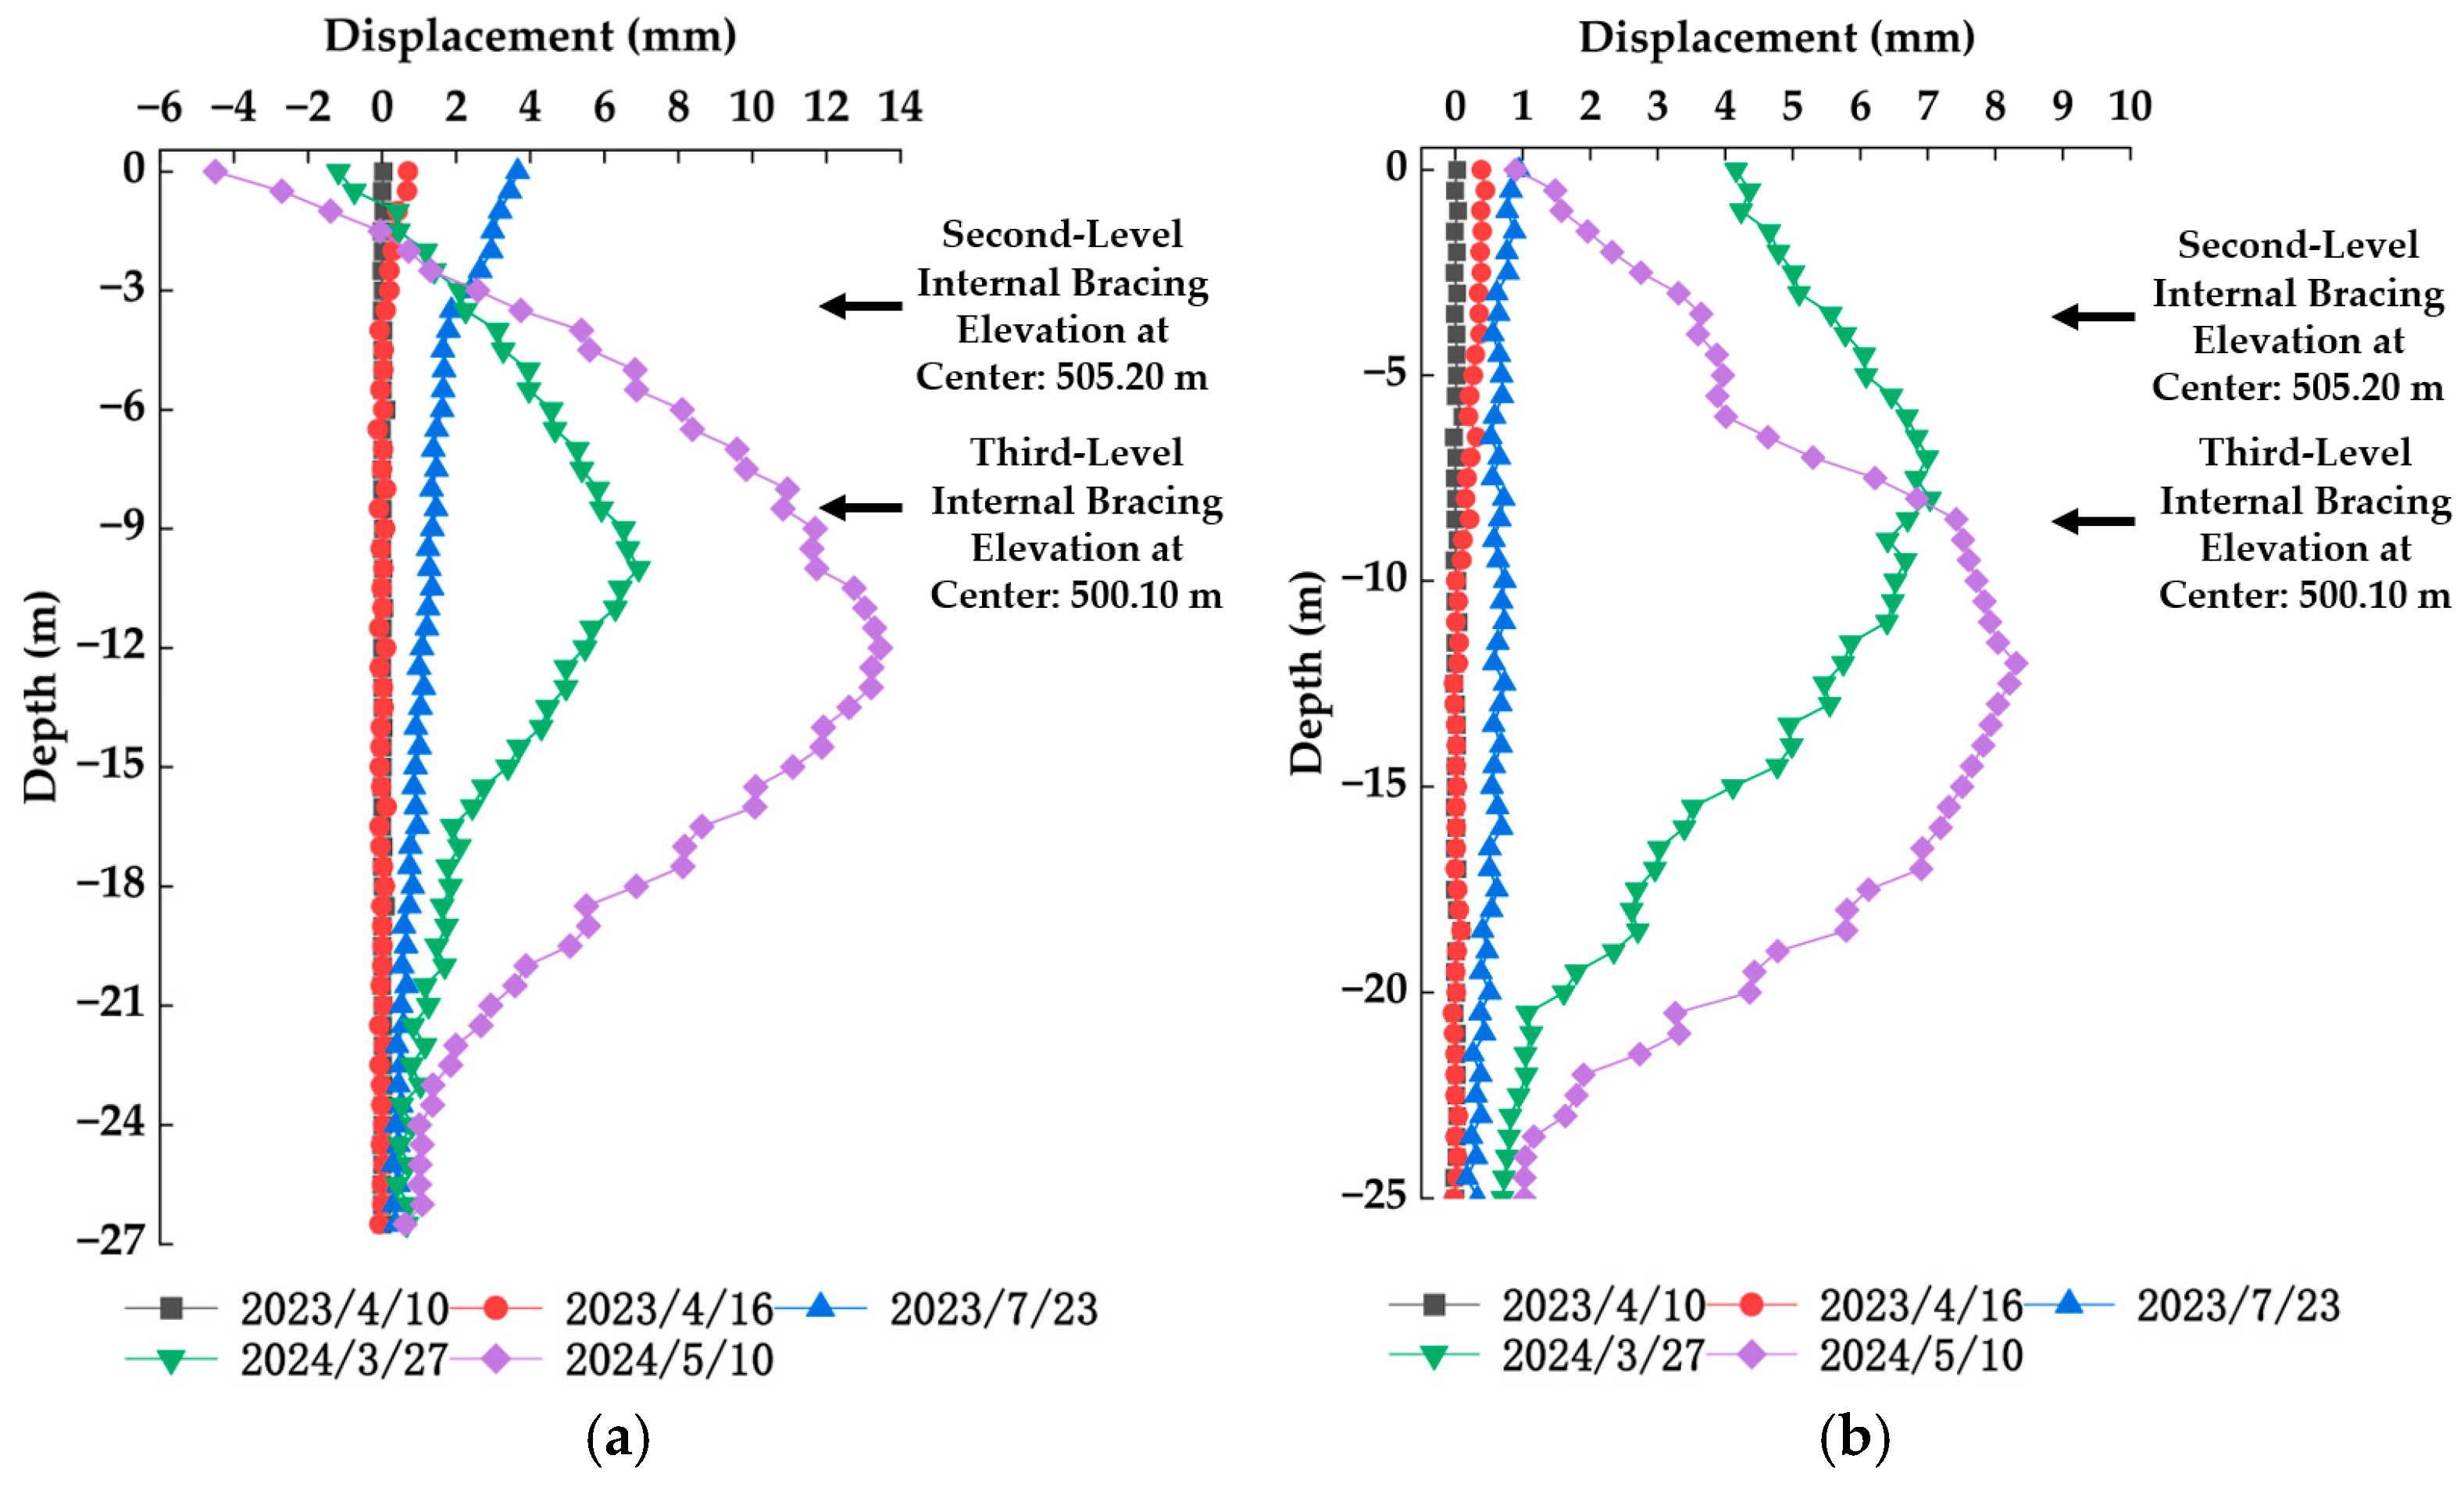
The deep lateral displacement profile measured at ZX7 (Figure 7a) exhibited a typical excavation-induced deformation pattern for multi-level braced excavations. Lateral displacement was negligible during the early stages, indicating limited deformation following completion of the retaining piles and excavation to the first bracing level. After excavation reached the second bracing level, the displacement profile gradually evolved into a bulging shape, with peak displacement concentrated at mid-depth. As excavation progressed to the third bracing level and ultimately to the pit bottom, lateral displacement increased significantly. At the final stage, the maximum displacement at ZX7 reached approximately 13.5 mm at a depth of 12–13 m, remaining well below the alert and alarm thresholds specified in Table 2. The displacement profiles measured at ZX6 (Figure 7b) exhibited a similar evolutionary trend but with consistently smaller magnitudes, indicating stronger deformation restraint at this location. At the final excavation stage, the peak displacement at ZX6 was approximately 8.3 mm, occurring at a depth of 11–13 m. Throughout the excavation process, displacement at ZX6 remained far below the prescribed control limits, demonstrating stable deformation behavior and effective lateral confinement provided by the multi-level internal bracing system.

4. Numerical Simulation of Deep Excavation

4.1. Modeling Assumptions

To reasonably simplify the computation while reflecting the engineering reality, the following basic assumptions were adopted in establishing the numerical model [31,32]:
(1)
The constitutive behavior of the soil was represented using a modified Mohr–Coulomb model. The initial in situ stress field was specified under the at-rest earth pressure condition (K0 state), using the default formulation implemented in MIDAS based on soil mechanical properties. The soil strata were assumed to be horizontally layered and homogeneous within each layer. The building structures and the retaining system components—including the raft slab, pile foundations, contiguous pile wall, capping beam, waler beam, king posts, anchors, and shotcrete lining—were simplified as isotropic linear-elastic materials.
(2)
Although the groundwater table at the site is relatively shallow and varies significantly (2.2–11.9 m below ground level), systematic dewatering was implemented prior to excavation, and the groundwater level was strictly maintained below the excavation bottom throughout subsequent construction stages. Therefore, the influence of groundwater seepage on excavation stability and deformation was neglected in the numerical simulation as an engineeringly justified simplification, which also reduces model complexity and computational cost.
(3)
The adjacent existing buildings were simplified in a rational manner by converting their superstructure loads into an equivalent uniformly distributed load applied at the top of the foundation, thereby accounting for the additional stresses imposed on the surrounding soil.
(4)
Dynamic disturbances induced by traffic loads on nearby roads and adjacent construction activities were not considered in the analysis.

4.2. Constitutive Model, Material Parameters, and Properties

According to the engineering geological investigation, the site is mainly composed of slightly to moderately dense gravel, locally interbedded with thin layers of medium sand. Such deposits are characteristic of non-cohesive soils with high friction angles and strong permeability. Owing to their pronounced dilatancy and negligible cohesion, conventional linear-elastic models are inadequate for reproducing the unloading and reloading behavior of these materials. Accordingly, the soil was modeled using the Modified Mohr–Coulomb (MMC) constitutive model implemented in MIDAS GTS NX. Within this framework, stress-path-dependent deformation is approximated by adopting stage-dependent equivalent elastic stiffness parameters, including the secant stiffness, tangent stiffness, and unloading elastic stiffness. Although this stiffness parameterization bears similarity to that of the Hardening Soil (HS) model in PLAXIS, the formulation employed in this study is specific to MIDAS GTS NX and is formally classified as a Modified Mohr–Coulomb model. It retains the classical Mohr–Coulomb failure criterion and does not incorporate the full elasto-plastic hardening mechanisms associated with the HS model. In the numerical analysis of the foundation pit excavation, accurate simulation of the mechanical responses of the soil strata, retaining structures, and adjacent buildings required appropriate assignment of material properties to each component. Based on the geological survey report, support system design drawings, the established MIDAS GTS NX numerical model, and relevant engineering experience. The reliability of numerical predictions strongly depends on the representativeness of the adopted physical–mechanical parameters, which motivates careful site-specific characterization [33]. The soil profile was idealized into several representative layers, and the corresponding mechanical parameters are summarized in Table 3. The material properties adopted for the retaining structures and surrounding buildings are presented in Table 4.
The foundation pit in this project is large in scale, and there are various types of bored cast-in-place piles. If a model were to be established for each individual pile, the number of elements would increase dramatically, significantly raising the computational complexity. Therefore, this study employs a flexural stiffness (EI) equivalence-based conversion method instead of a simple material stiffness conversion method. In the finite element model, the bored piles are equivalently modeled as a contiguous pile wall. The equivalence is established by matching the flexural stiffness EI per unit width between the discrete pile row and the equivalent contiguous pile wall, and the equivalent thickness of the contiguous pile wall is calculated using Formula (1). This equivalence concept is well established in pile foundation analysis [34]. The specific equivalent thickness of the bored piles is shown in Table 5.
( D + s ) 12 h 3 = π D 4 64
In the formula: D: Diameter of the bored pile (m). s: Clear distance between adjacent piles (m). h: Equivalent thickness of the contiguous pile wall after conversion (m).

4.3. Finite Element Model Construction

4.3.1. Selection of Model Dimensions

To accurately simulate the mechanical response during the excavation process, the finite element model must sufficiently cover the affected areas of the project, ensuring that non-physical boundary effects are avoided by not placing the boundaries too close. Based on engineering practices, the horizontal influence zone of the excavation is typically taken as 3 to 5 times the excavation depth (3∼5H) beyond the retaining structure. Vertically, the influence may extend downward to a depth of 2 to 4 times the excavation depth (2∼4H) [35]. In this project, the maximum excavation depth is 21.4 m, corresponding to horizontal influence distances of approximately 64.2 m (3H) to 107.0 m (5H). The lateral boundaries of the numerical model were placed at distances exceeding 3H from the excavation boundary in all directions, thereby ensuring that boundary effects on the numerical results are negligible. Given that the excavation depth in this project ranges from 21.4 m to 6.3 m, the dimensions of the 3D model are set to 308 m × 198 m × 76~80 m (length × width × height).

4.3.2. Mesh Generation

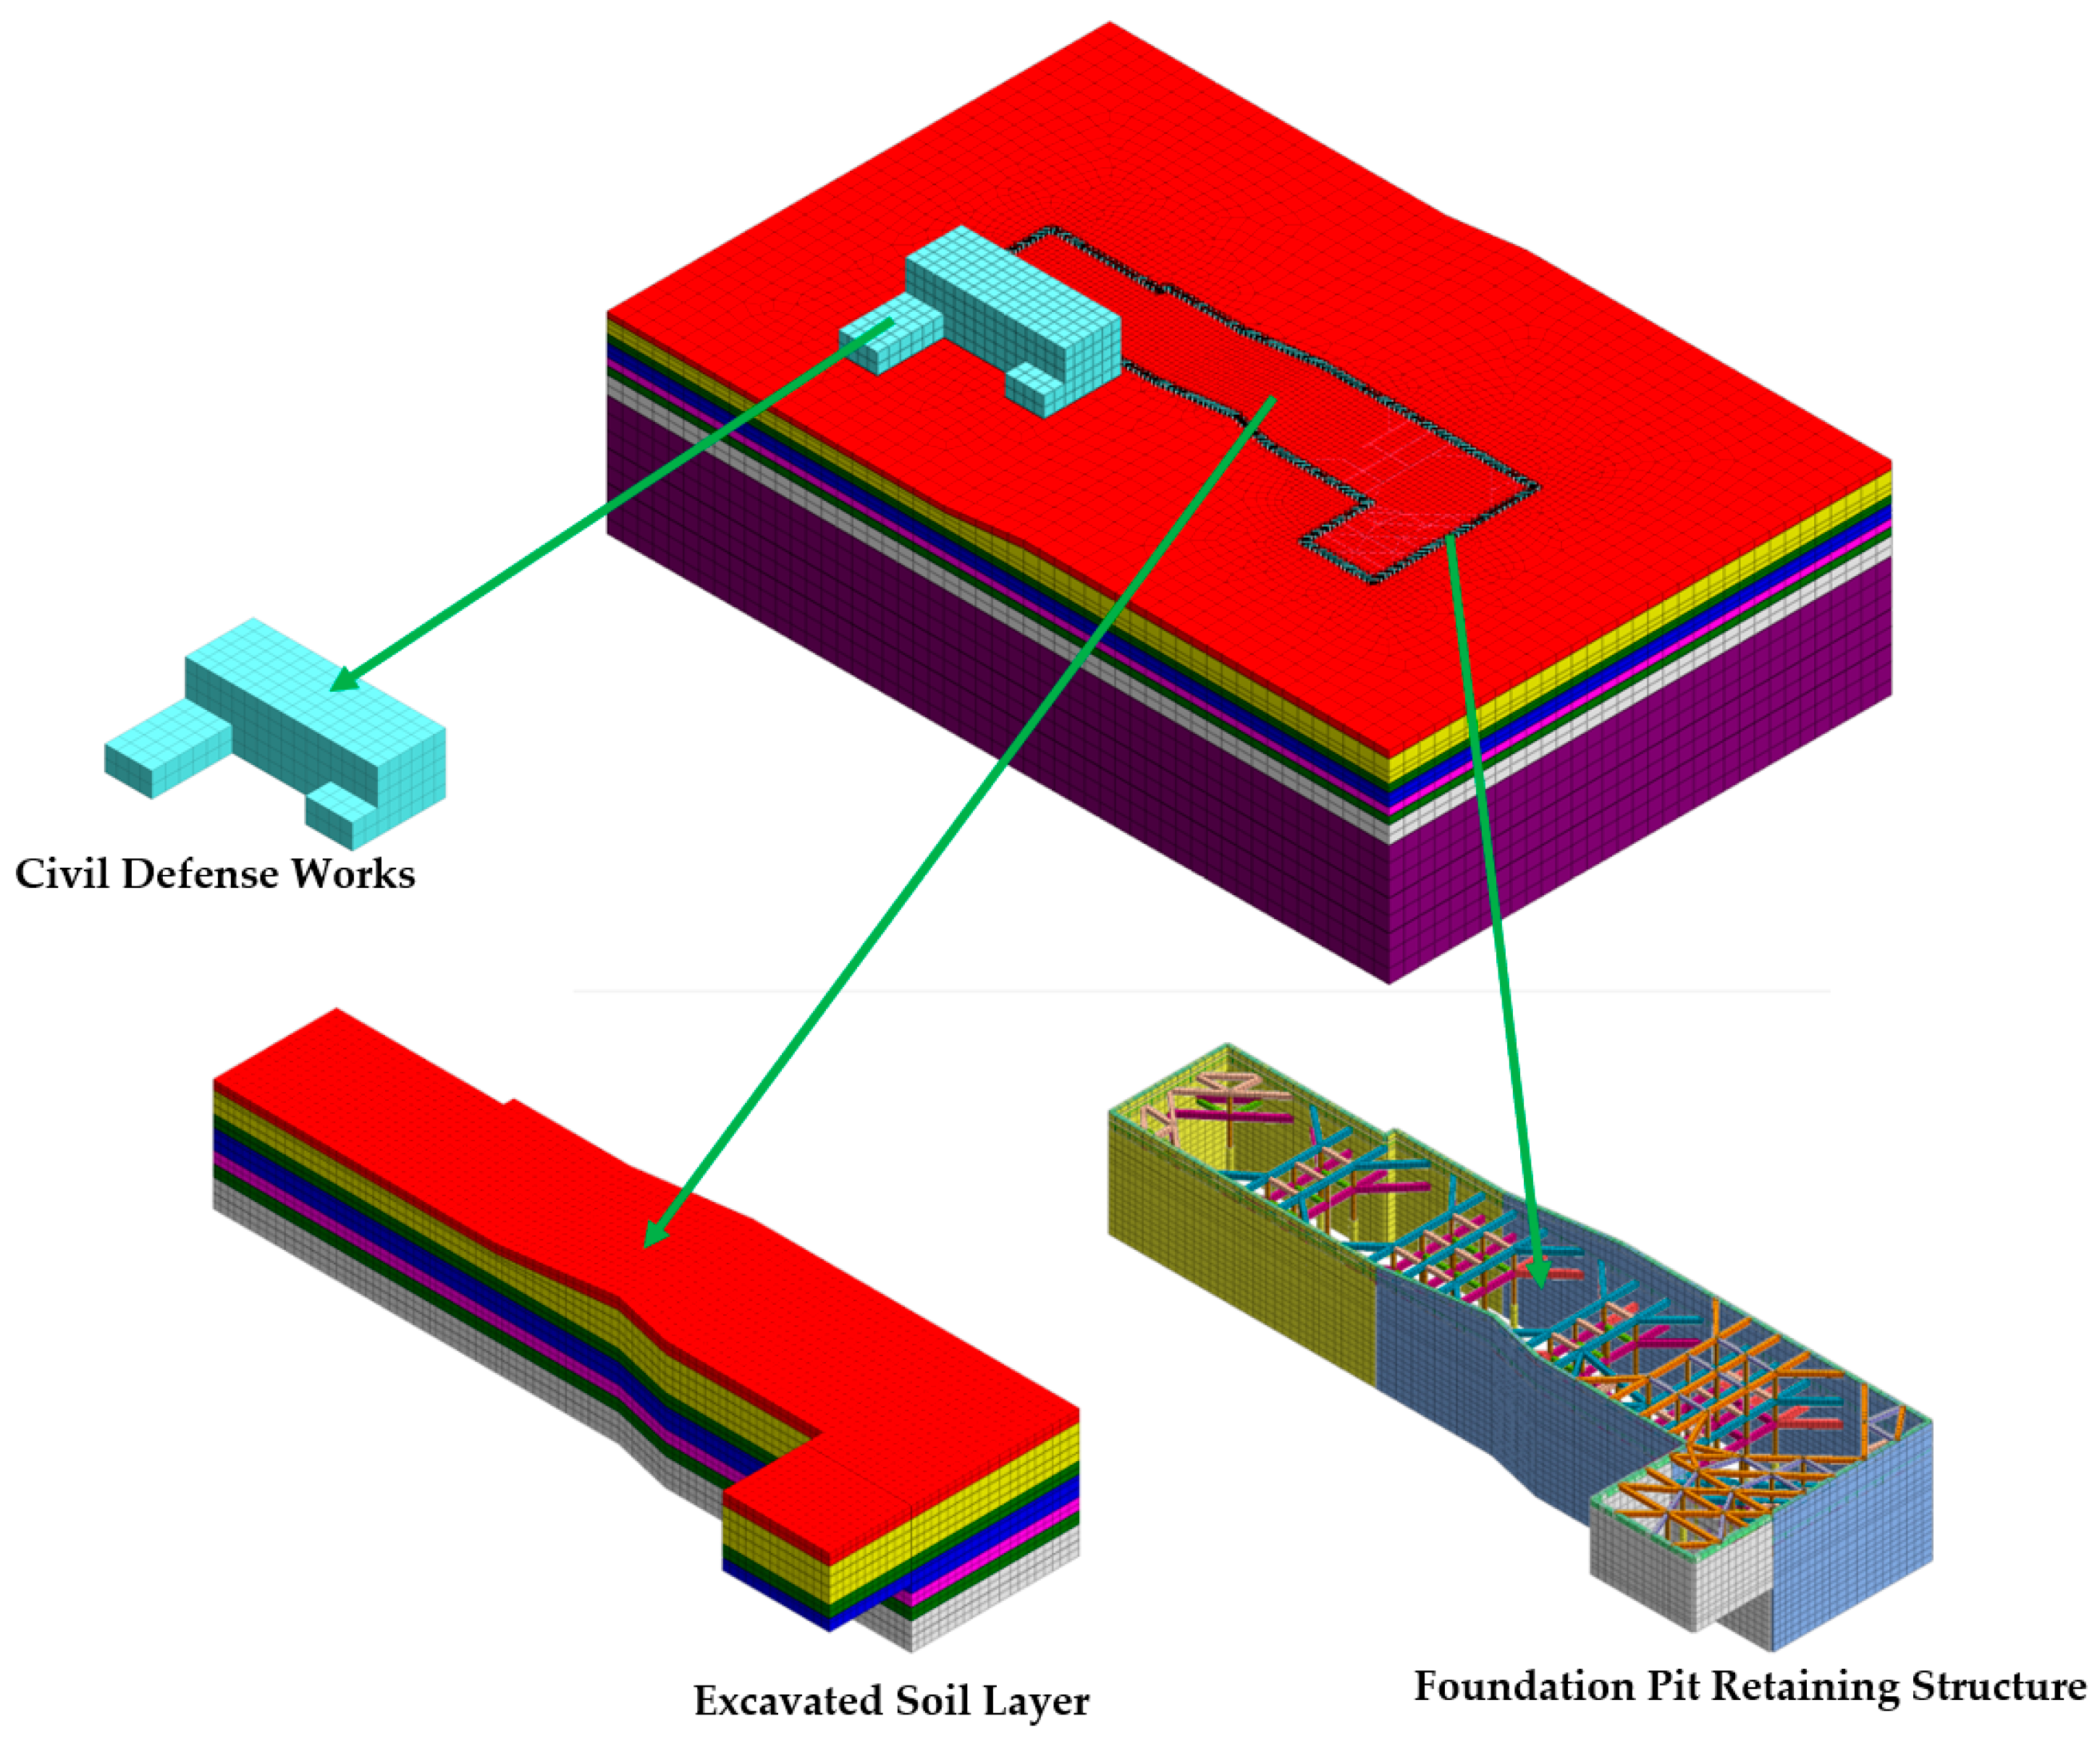
As shown in Figure 8, a hybrid meshing approach was adopted for the finite element model, where different element types and mesh sizes were applied to various regions based on the structural significance and expected stress gradient variations. The mesh was refined in the retaining structure, supporting system, and areas adjacent to the excavation to accurately capture stress concentrations and deformation characteristics, with element sizes controlled between 1.5 and 2.0 m. In regions farther from the excavation influence zone, a gradual sparse mesh was employed to manage the overall model size and improve computational efficiency, with the maximum element size not exceeding 6.0 m. The detailed element properties are shown in Table 3 and Table 4. Additionally, interface elements were introduced between the retaining structure and the soil to simulate friction and separation behavior. The mesh for the interface elements was automatically attached to the meshes of both the primary structure and soil, ensuring node compatibility. In addition, interface elements were introduced between the retaining structures and the surrounding soil to represent frictional interaction and potential separation at the soil–structure interface. The interface mesh was automatically generated and tied to the adjacent soil and structural meshes to ensure nodal compatibility. Interface properties were assigned using the built-in assistant in MIDAS GTS NX based on a virtual thickness coefficient (tv) and a strength reduction factor (R). In this project, the virtual thickness coefficient was set to 0.05 for soil–concrete interfaces. The strength reduction factor was taken as 0.90 for non-cohesive soils, including miscellaneous fill, gravel layers, and medium sand, and as 0.85 for fine-grained soils such as silt and silty clay. The final 3D finite element model of the excavation consists of approximately 140,000 solid elements and a total of 100,000 nodes, achieving a reasonable balance between computational scale and efficiency while ensuring calculation accuracy.

4.3.3. Boundary Conditions

The bottom of the model is fixed to simulate the confinement of the soil layers by the underlying hard stratum in the vertical direction. Lateral boundaries of the model are subjected to normal displacement constraints, allowing the soil to undergo vertical settlement and horizontal displacement parallel to the boundaries, which better represents the deformation characteristics of a semi-infinite foundation. The top of the model is set as a free surface to simulate the actual ground conditions.

4.3.4. Types and Application Methods of Loads

The loads applied to the model in this project primarily include initial geostatic stress, loads from adjacent buildings, loads from the retaining structure, and construction loads. The initial geostatic stress field is automatically balanced and generated through gravity loading. According to relevant standards, the building load can be calculated per square meter for each floor, typically ranging from 15 to 20 kPa per floor [36]. Since this model does not consider internal facilities of the buildings, a value of 17.5 kPa per floor is used. The retaining loads and construction process loads are simulated in stages using the “deactivation” and “activation” functions of the elements.

4.3.5. Excavation Process Setup

To accurately replicate the construction process, dynamic simulations of the excavation, the response of the retaining structure, and the sequential development of surrounding environmental deformations were performed. A detailed sequence of finite element analysis stages was established. The division of stages strictly follows the design drawings and construction plan. The model defines 12 major construction analysis steps, and the specific sequence is shown in Table 6. In Table 6, “meters below the design elevation” refers to the vertical distance measured downward from the project reference datum.

4.4. Partial Validation of the Finite Element Model

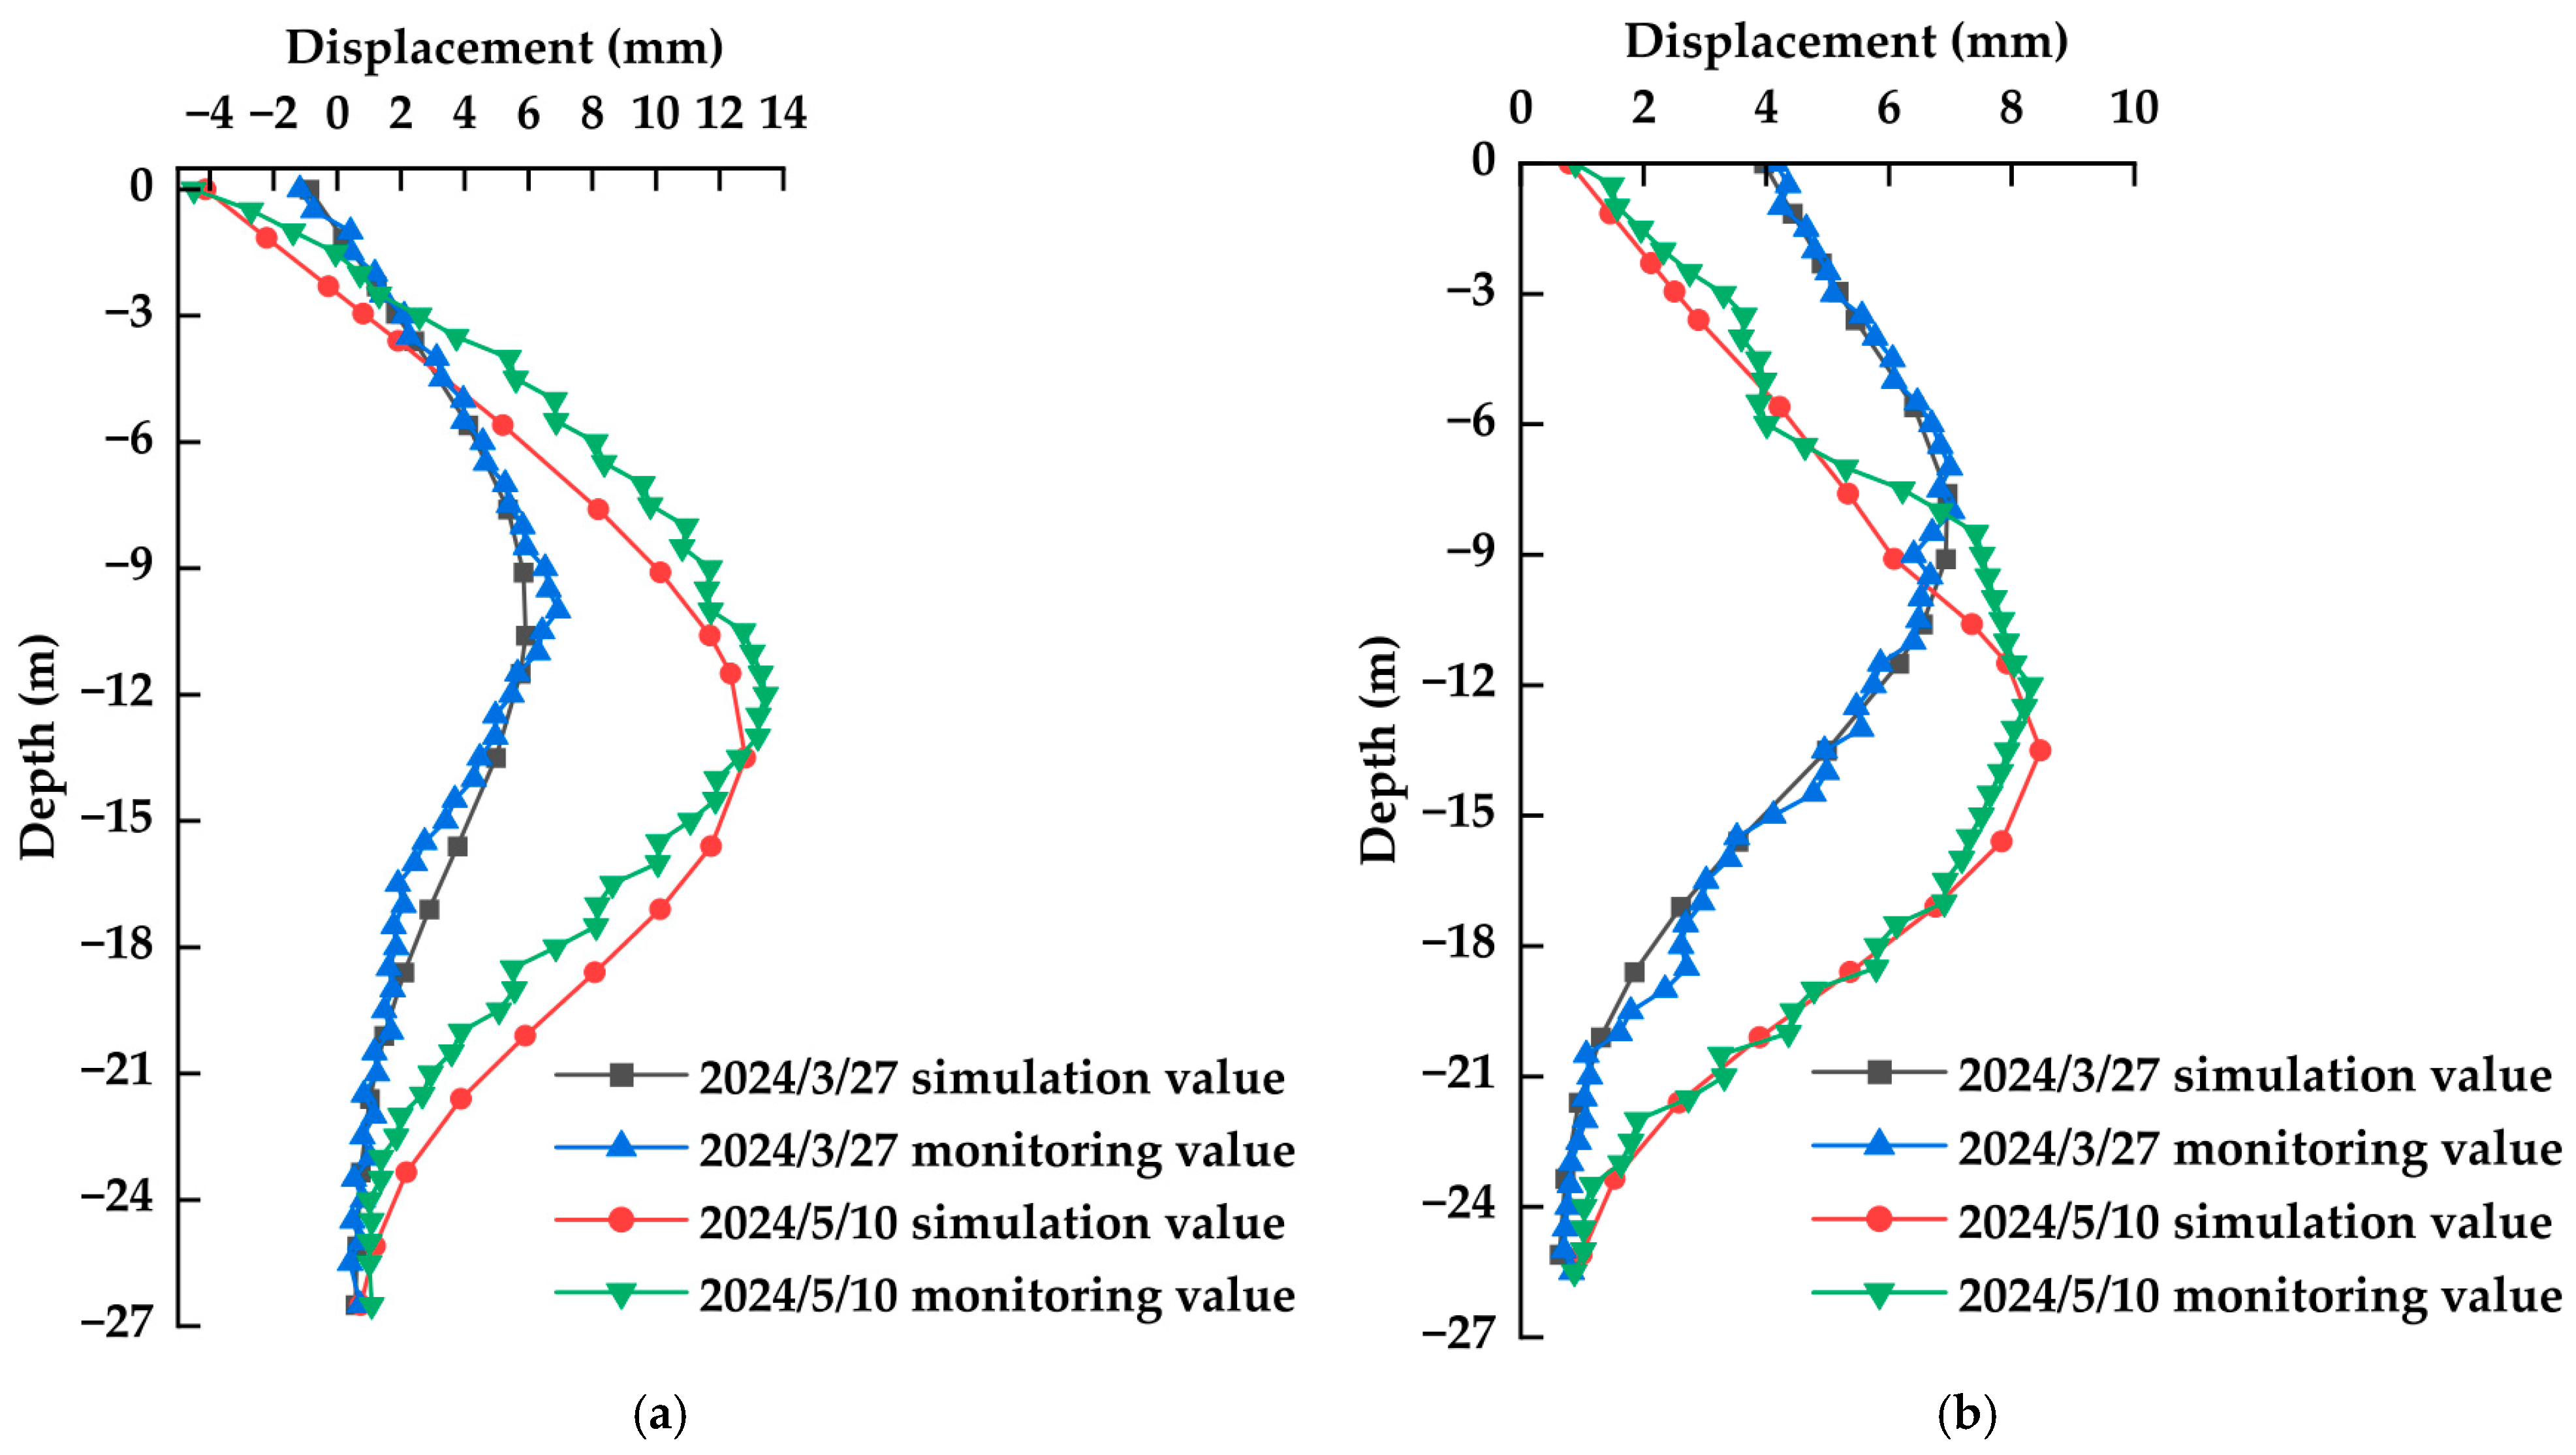
The validity of the finite element model was evaluated by comparing the simulated and measured lateral displacement data of the retaining piles at key excavation stages: 27 March 2024 (excavation to the third internal bracing level) and 10 May 2024 (excavation to the pit bottom). As shown in Figure 9, the displacement profiles for both ZX7 and ZX6 were analyzed and compared at these stages.
On 27 March 2024, when excavation reached the third internal bracing level, the simulated maximum lateral displacement for ZX7 occurred at −10.6 m, with a displacement value of 6.7 mm, while the measured maximum lateral displacement occurred at −10 m, with a value of 6.9 mm. For ZX6, the simulation predicted the maximum displacement at −7.6 m, with a value of 6.9 mm, while the measured maximum lateral displacement was observed at −8 m, with a displacement value of 7.0 mm. The deviations between the simulated and monitored values were minimal: 0.2 mm for ZX7 and 0.1 mm for ZX6, both within the acceptable range for this type of analysis. On 10 May 2024, when excavation reached the pit bottom, similar trends were observed. For ZX7, the simulated maximum displacement occurred at −13.5 m with a value of 12.9 mm, while the measured maximum lateral displacement was observed at −12 m, with a displacement of 13.4 mm. For ZX6, the simulation predicted the maximum lateral displacement at −13.5 m, with a displacement value of 8.5 mm, while the measured value was 8.3 mm at −12 m. The discrepancies—0.5 mm for ZX7 (3.7% of the measured value) and 0.2 mm for ZX6 (2.4% of the measured value). Both the simulated and monitored profiles show the maximum displacement occurring at similar depths, consistent with the typical behavior of retaining piles during excavation. In the case of ZX7, the simulated maximum displacement occurs at −13.5 m, while the maximum displacement in the monitored data occurs at −12 m, reflecting a minor shift in the location of the peak. Similarly, for ZX6, the peak displacement is observed at −13.5 m in the simulation, while the monitored value peaks at −12 m. This slight shift can be attributed to model simplifications, measurement errors, soil heterogeneity, and external loads (such as construction activities).
In conclusion, the comparison of the simulated and measured displacement profiles for ZX7 and ZX6 demonstrates that the finite element model provides a reliable representation of the lateral displacement of the retaining piles during excavation. The small discrepancies in both the magnitude and location of the maximum displacement are within acceptable limits, confirming the model’s reliability for further analysis and prediction of the excavation process.

5. Optimization Study of Foundation Pit Retaining Structure

To improve the adaptability and cost-efficiency of excavation support systems in dense urban environments while ensuring the serviceability of adjacent sensitive facilities (e.g., civil defense structures), this section investigates optimization strategies from two perspectives: (i) regulation of retaining structure stiffness and (ii) standardization of the internal bracing system. The performance of each configuration is quantitatively assessed based on the maximum settlement and overall inclination ratio of the adjacent civil defense structure, as well as the maximum deep lateral displacement of the retaining piles.

5.1. Parametric Study on Retaining Structure Stiffness

Retaining piles provide the principal lateral confinement during excavation, and their flexural stiffness largely determines the magnitude and distribution of excavation-induced deformation. In practical numerical modeling, bored cast-in-place piles are often simplified as an equivalent contiguous pile wall. In this study, stiffness is parameterized by adjusting the equivalent wall thickness (t), and five comparative cases are considered: Case A (Baseline): 1.0t; Case B: 0.6t; Case C: 0.8t; Case D: 1.2t; Case E: 1.4t.
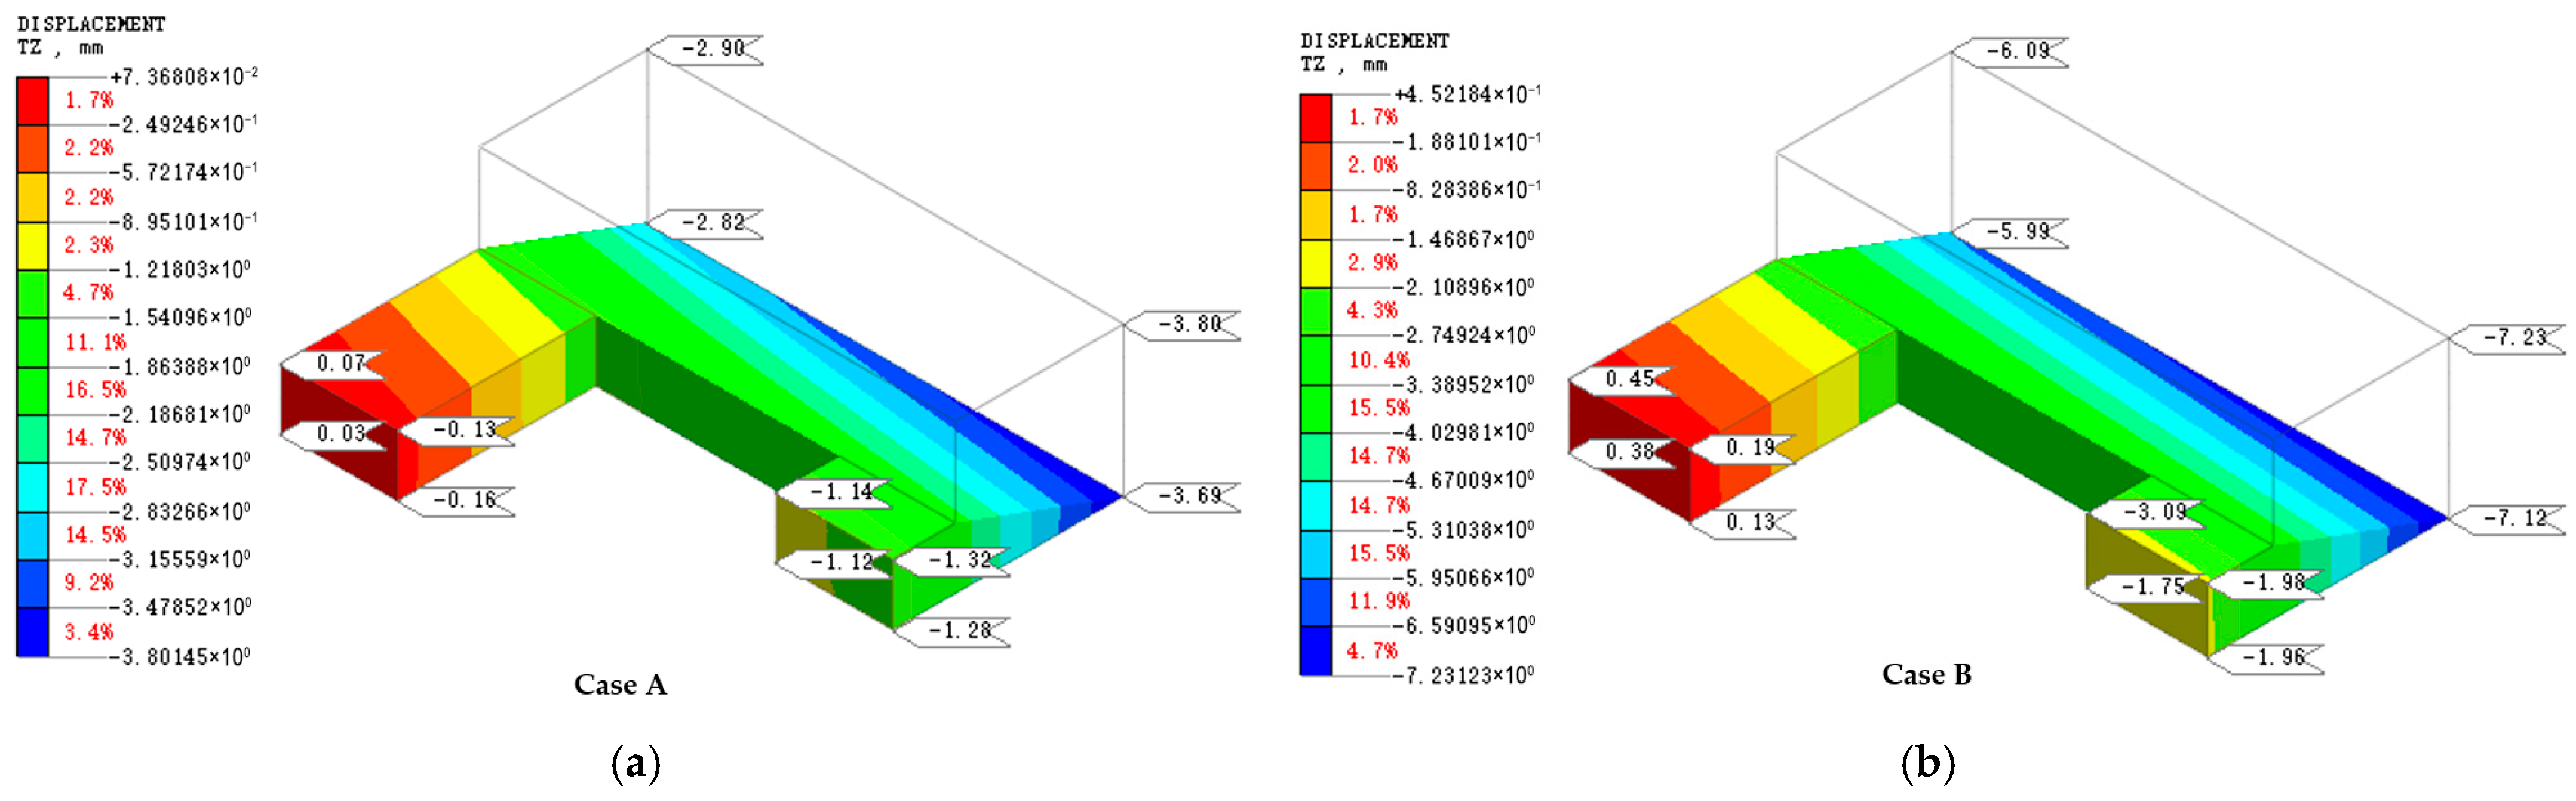
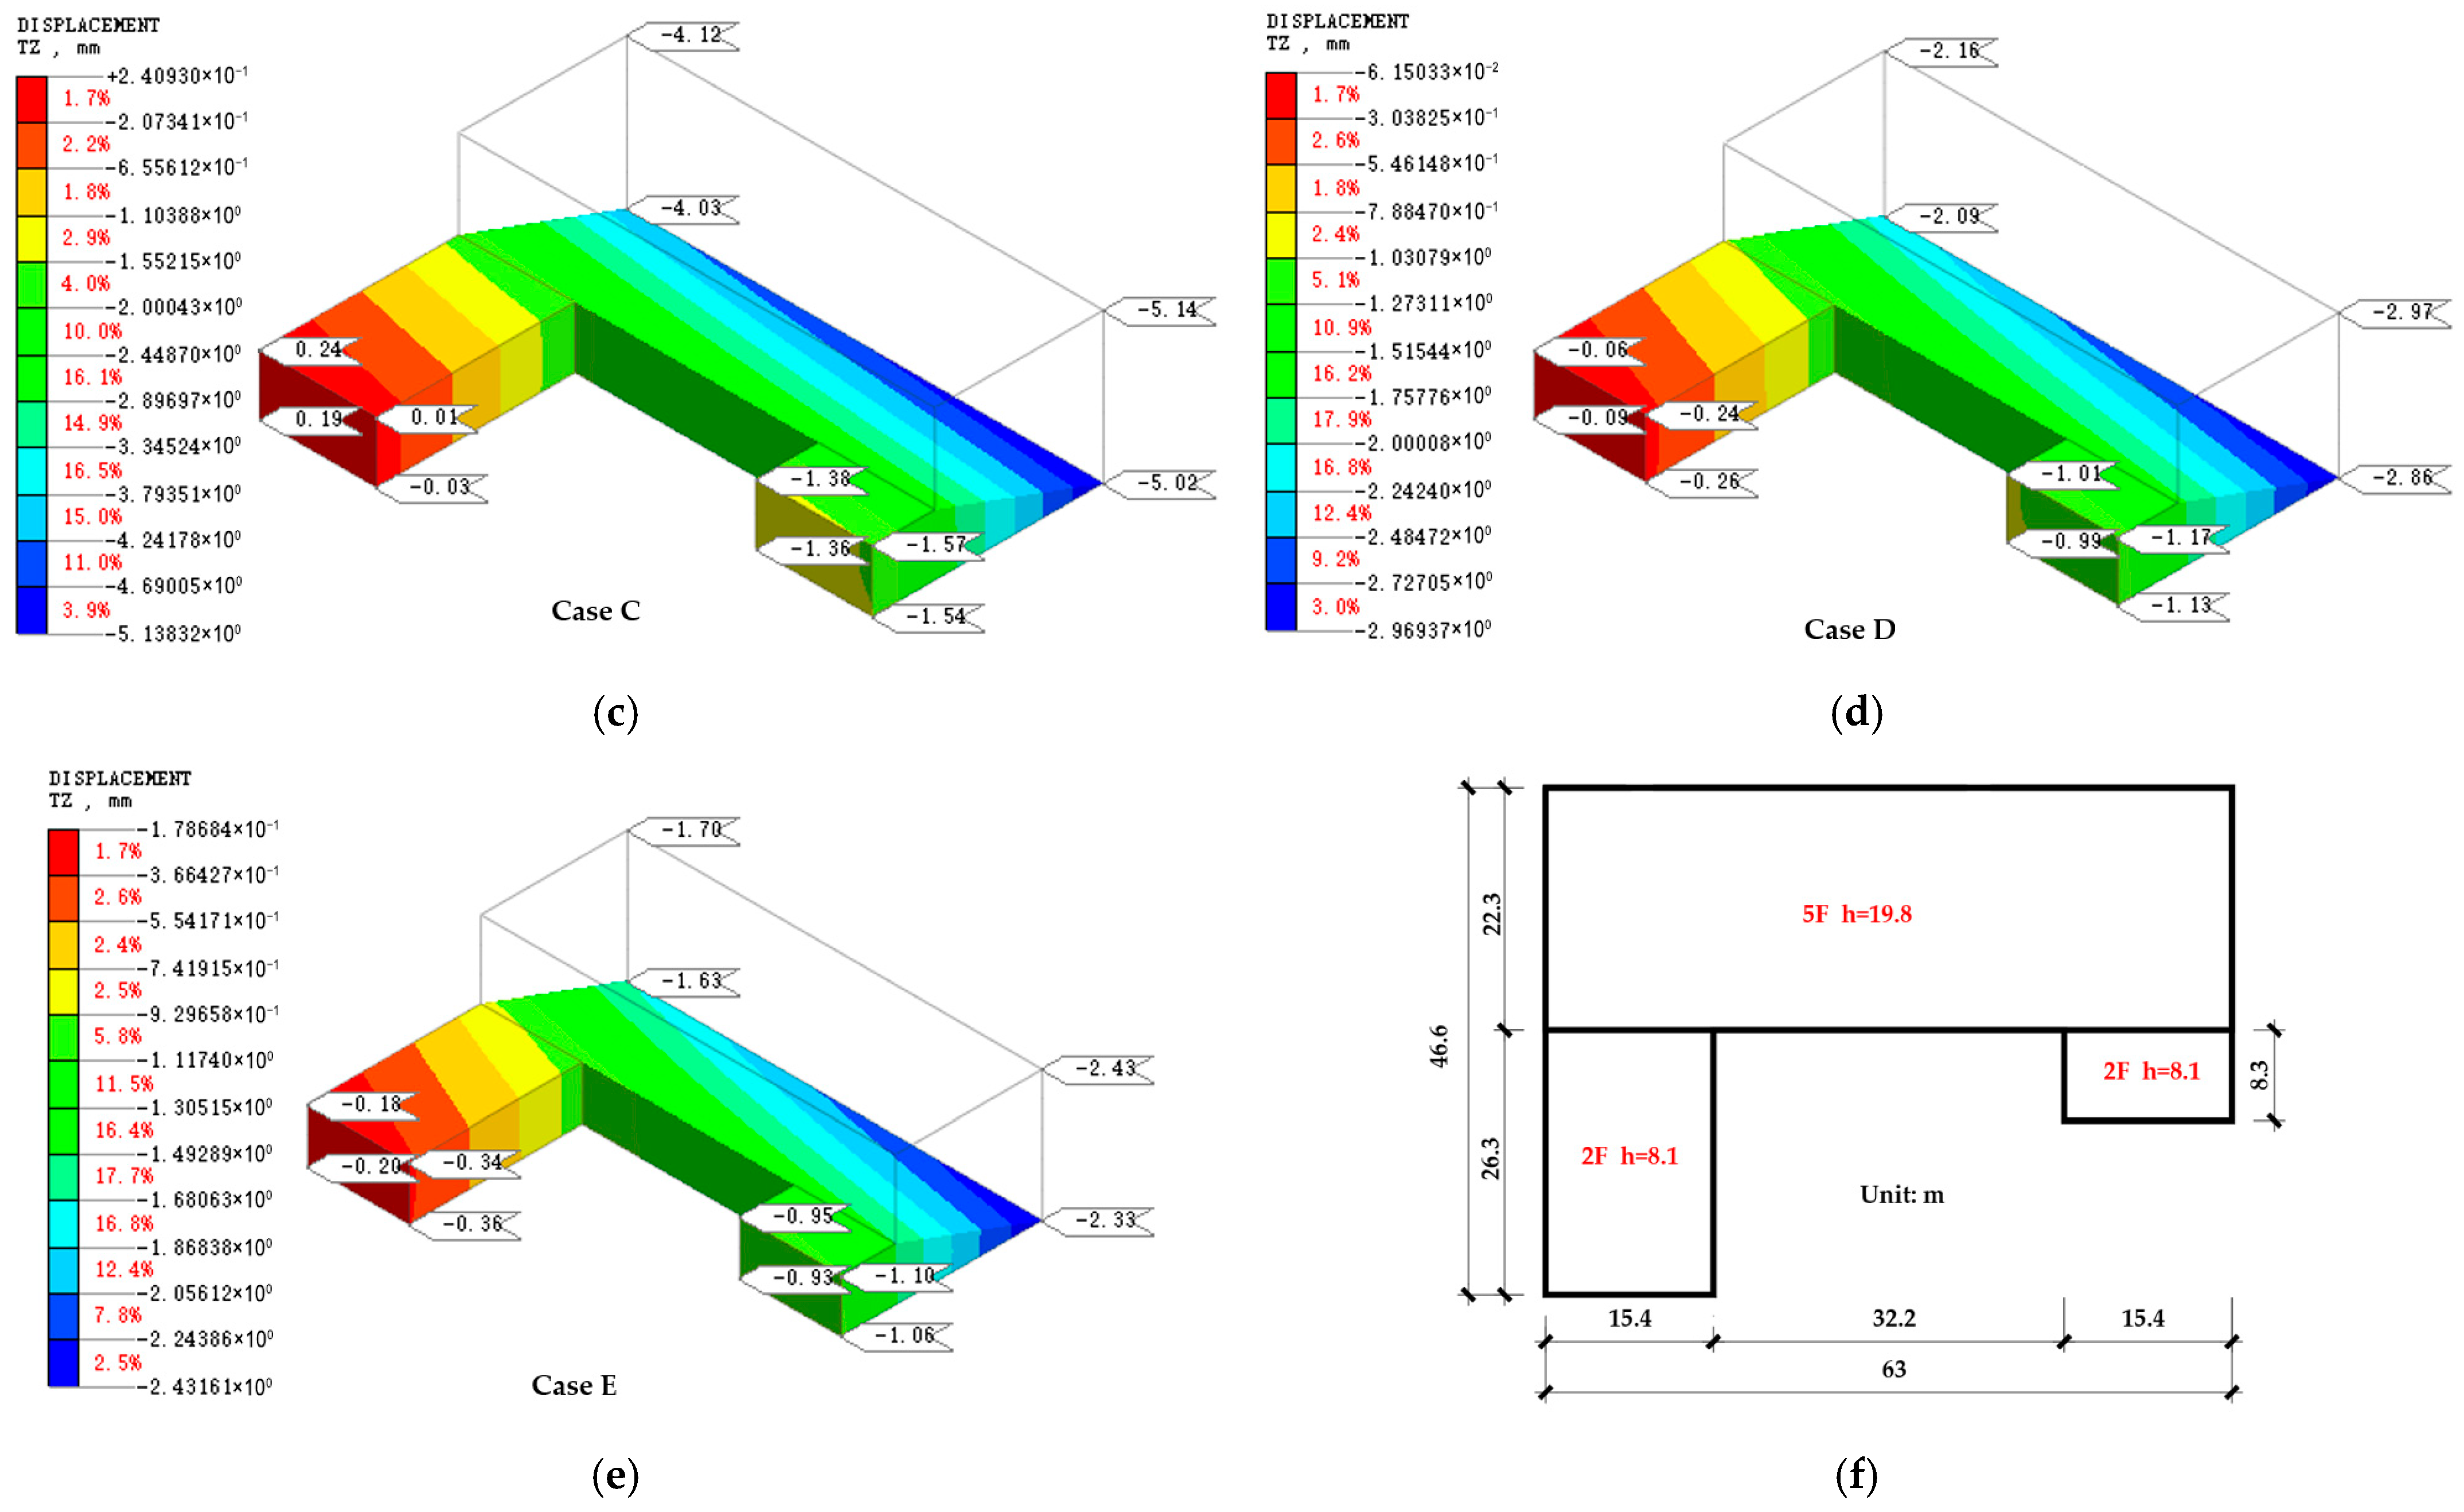
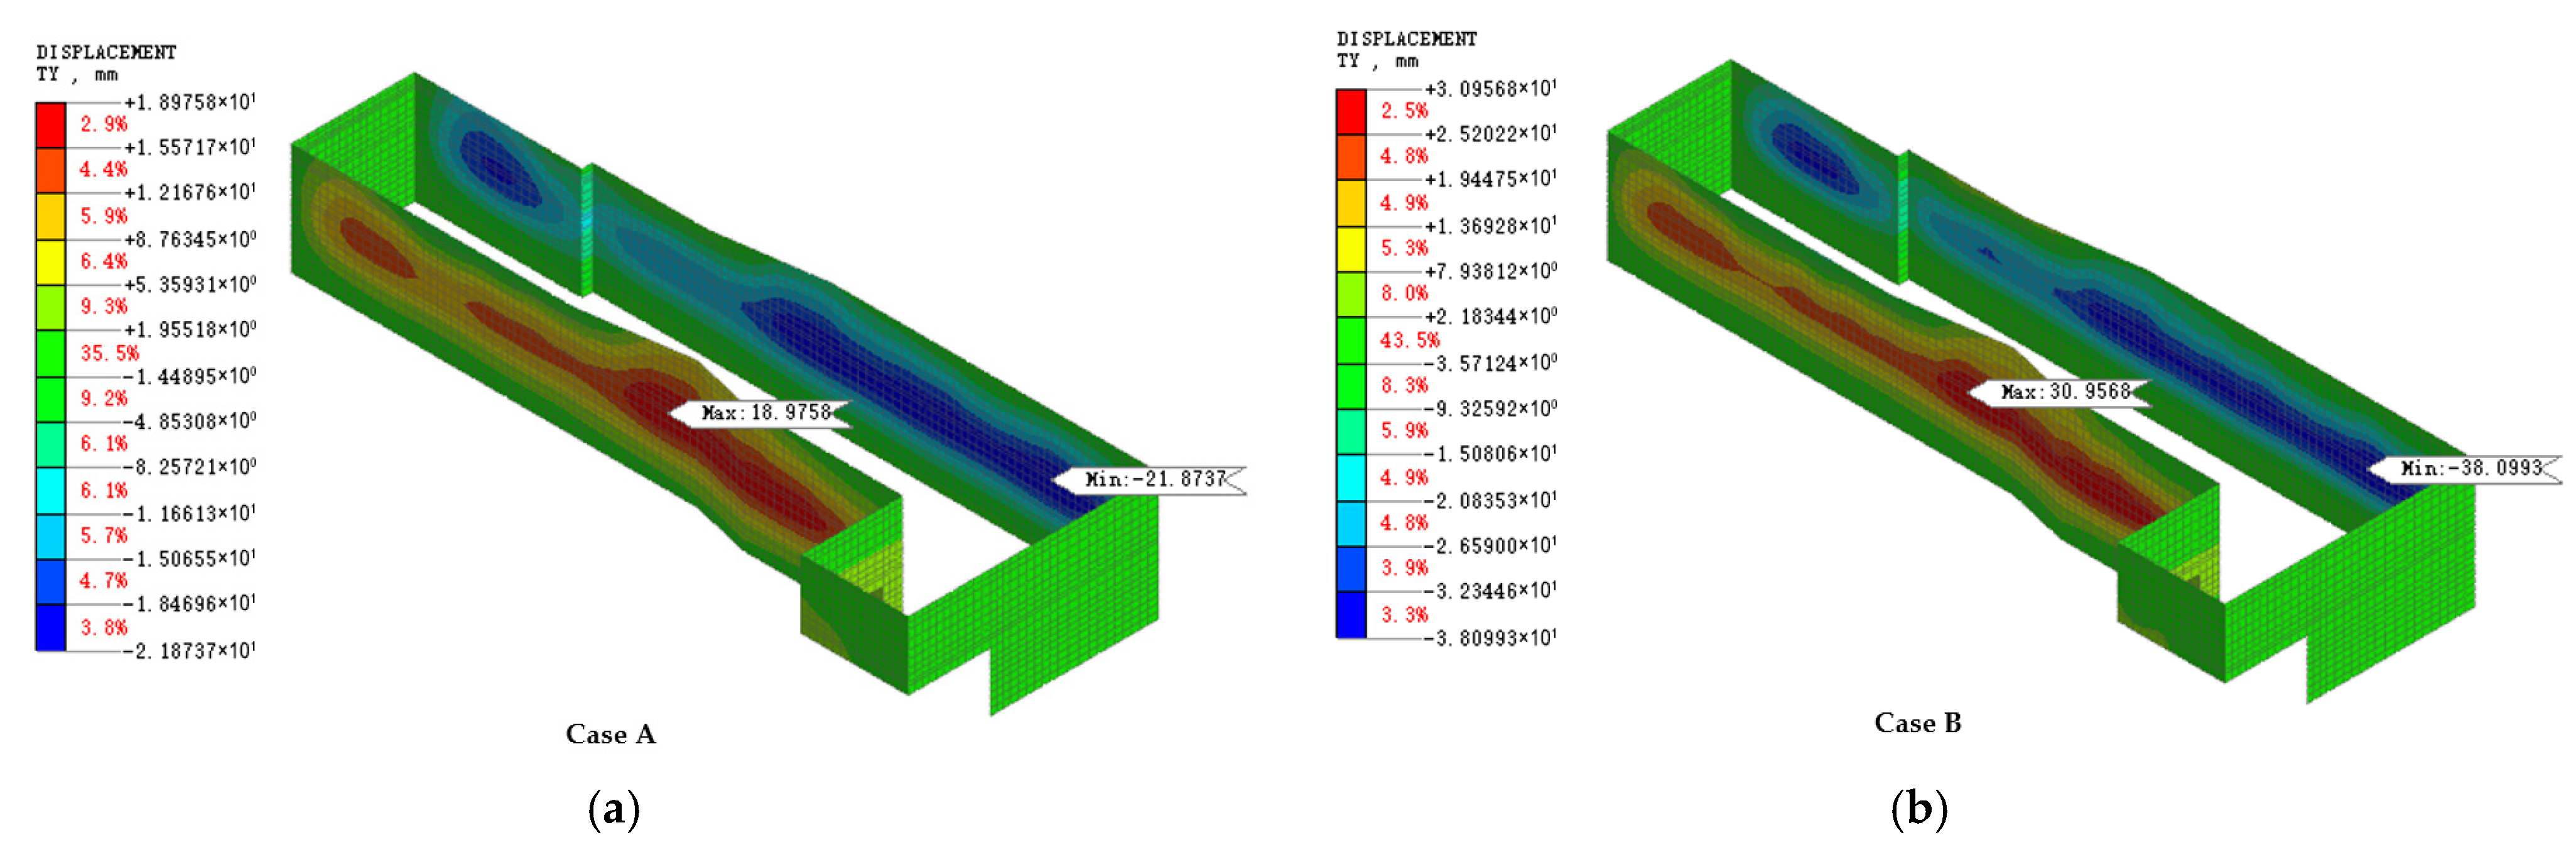
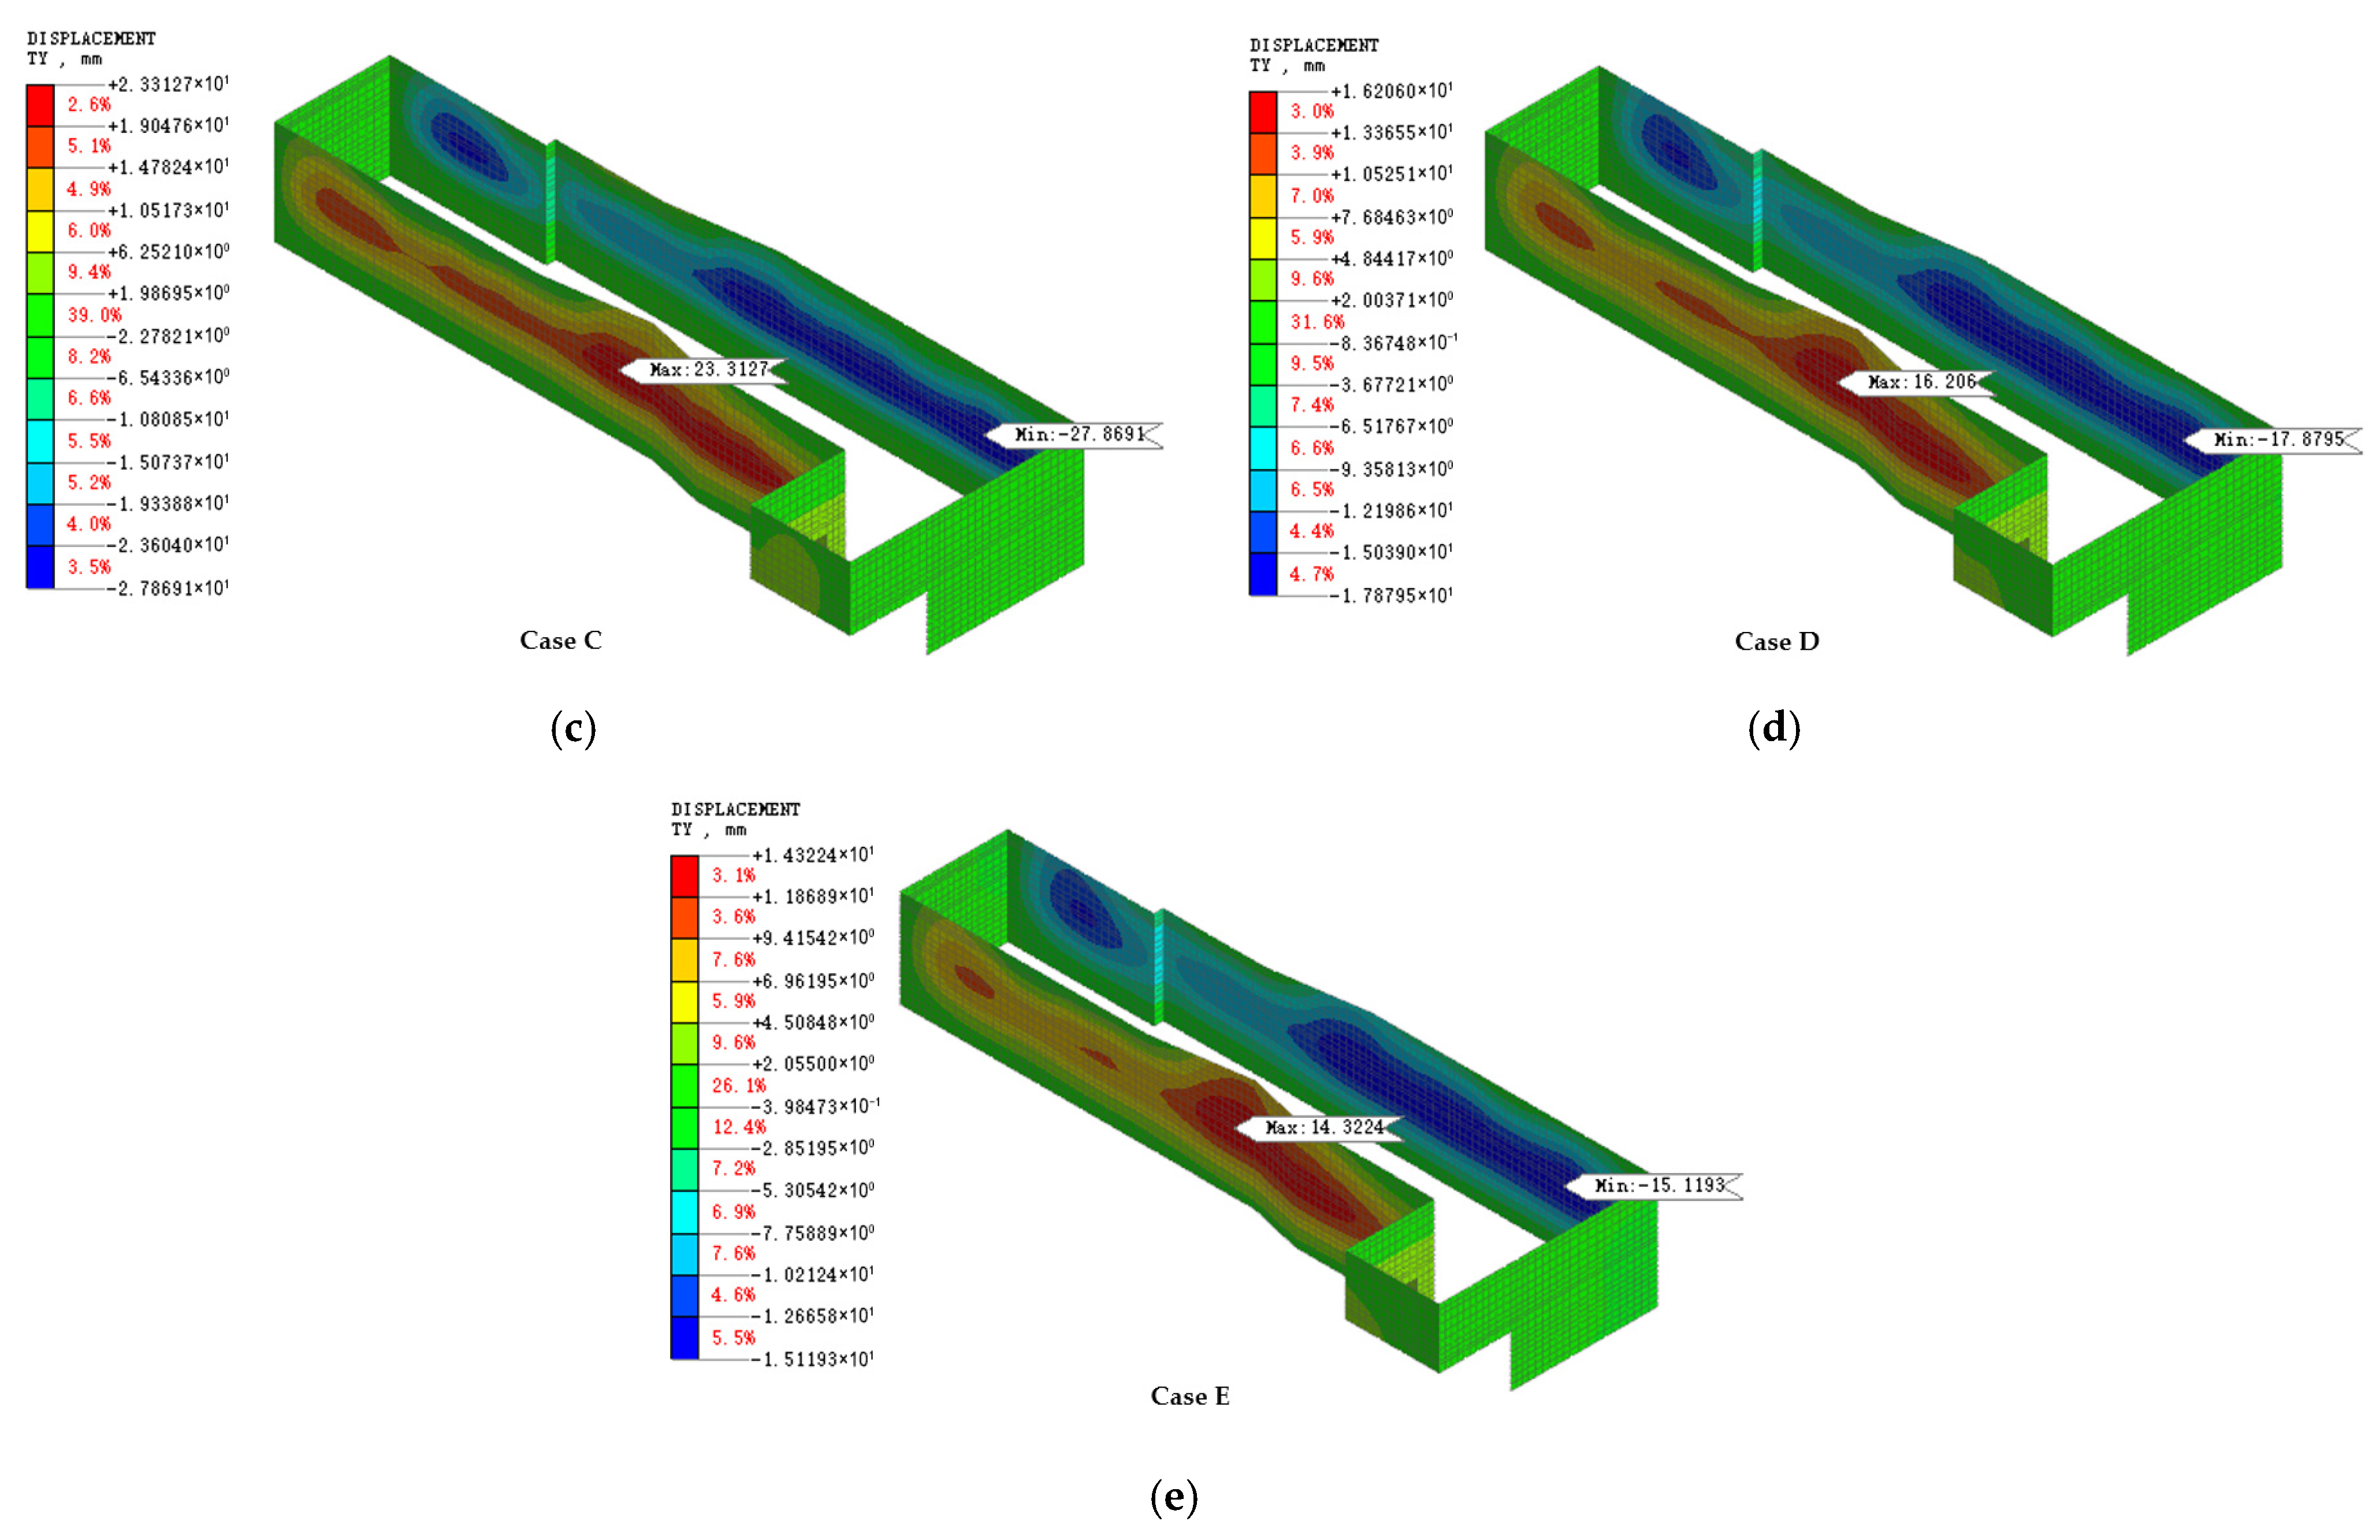
Figure 10 illustrates the deformation response of the adjacent civil defense structure. Panel (f) shows the structural layout and dimensions, while panels (a–e) present the numerical results for each case. In the baseline configuration (Case A, Figure 10a), the maximum cumulative settlement is −3.80 mm, and the maximum inclination ratio is 0.0079%, computed using the differential settlement method (applied consistently hereafter). When stiffness is reduced, deformation increases: Case B (Figure 10b) yields −7.23 mm and 0.0169%, and Case C (Figure 10c) yields −5.14 mm and 0.0114%. Conversely, increased stiffness improves deformation control, with Case D (Figure 10d) producing −2.97 mm and 0.0057%, and Case E (Figure 10e) further reducing the responses to −2.33 mm and 0.0042%. All settlement and inclination values remain below the project limits (14 mm settlement warning threshold and 4% allowable inclination). However, the stiffness variation exerts a more pronounced influence on the retaining piles, as shown in Figure 11. The maximum deep lateral displacement is 21.87 mm in Case A (Figure 11a). With reduced stiffness, deformation increases sharply to 38.10 mm in Case B (Figure 11b), exceeding the alarm limit (35 mm), and to 27.87 mm in Case C (Figure 11c), which falls between the warning (24.5 mm) and alarm thresholds. In contrast, stiffness enhancement effectively restrains pile deformation, reducing the displacement to 17.88 mm in Case D (Figure 11d) and 15.12 mm in Case E (Figure 11e). For clarity, the quantitative responses of the adjacent civil defense structure and the retaining piles under different stiffness configurations are summarized in Table 7.
The results demonstrate that reducing stiffness (Cases B and C) substantially amplifies contiguous pile wall deformation, and the extreme low-stiffness condition (Case B) becomes unacceptable due to exceeding the alarm criterion. Increasing stiffness (Cases D and E) improves deformation control for both the adjacent structure and the retaining piles, with Case E providing the strongest mitigation. Notably, although the civil defense structure remains within allowable settlement and inclination limits in all cases, the contiguous pile wall lateral displacement governs the feasibility of stiffness reduction and therefore constitutes the primary constraint for optimization. From an engineering perspective, the parametric results suggest that stiffness reduction may be feasible in terms of adjacent-structure settlement but could lead to unacceptable retaining-wall deformation. Therefore, stiffness optimization should be implemented with contiguous pile wall displacement thresholds as the primary control criterion, particularly in urban excavations where lateral deformation directly affects construction safety and serviceability. In practice, a moderate stiffness enhancement (e.g., Case D) can significantly improve stability without the cost escalation associated with overly conservative designs. These findings provide a rational basis for selecting an efficient retaining stiffness configuration under similar excavation conditions involving sensitive surrounding structures.

5.2. Optimization of the Internal Bracing System

While stiffness regulation effectively improves deformation control, excavation projects in dense urban areas also require support systems that are practical to construct and economical to implement. In real-world construction, the internal bracing system often includes a large variety of member types and cross-sectional dimensions, which increases fabrication complexity, reduces standardization efficiency, and may cause scheduling and cost burdens. To enhance constructability and simplify bracing design, this study proposes two standardized internal bracing schemes while retaining the baseline arrangement adopted in Section 5.1. Case F: Level 1 unified as CC1, Level 2 unified as CC2, and Level 3 unified as CC3. Case G: Level 1 unified as ZC1, Level 2 unified as ZC2, and Level 3 unified as ZC3.
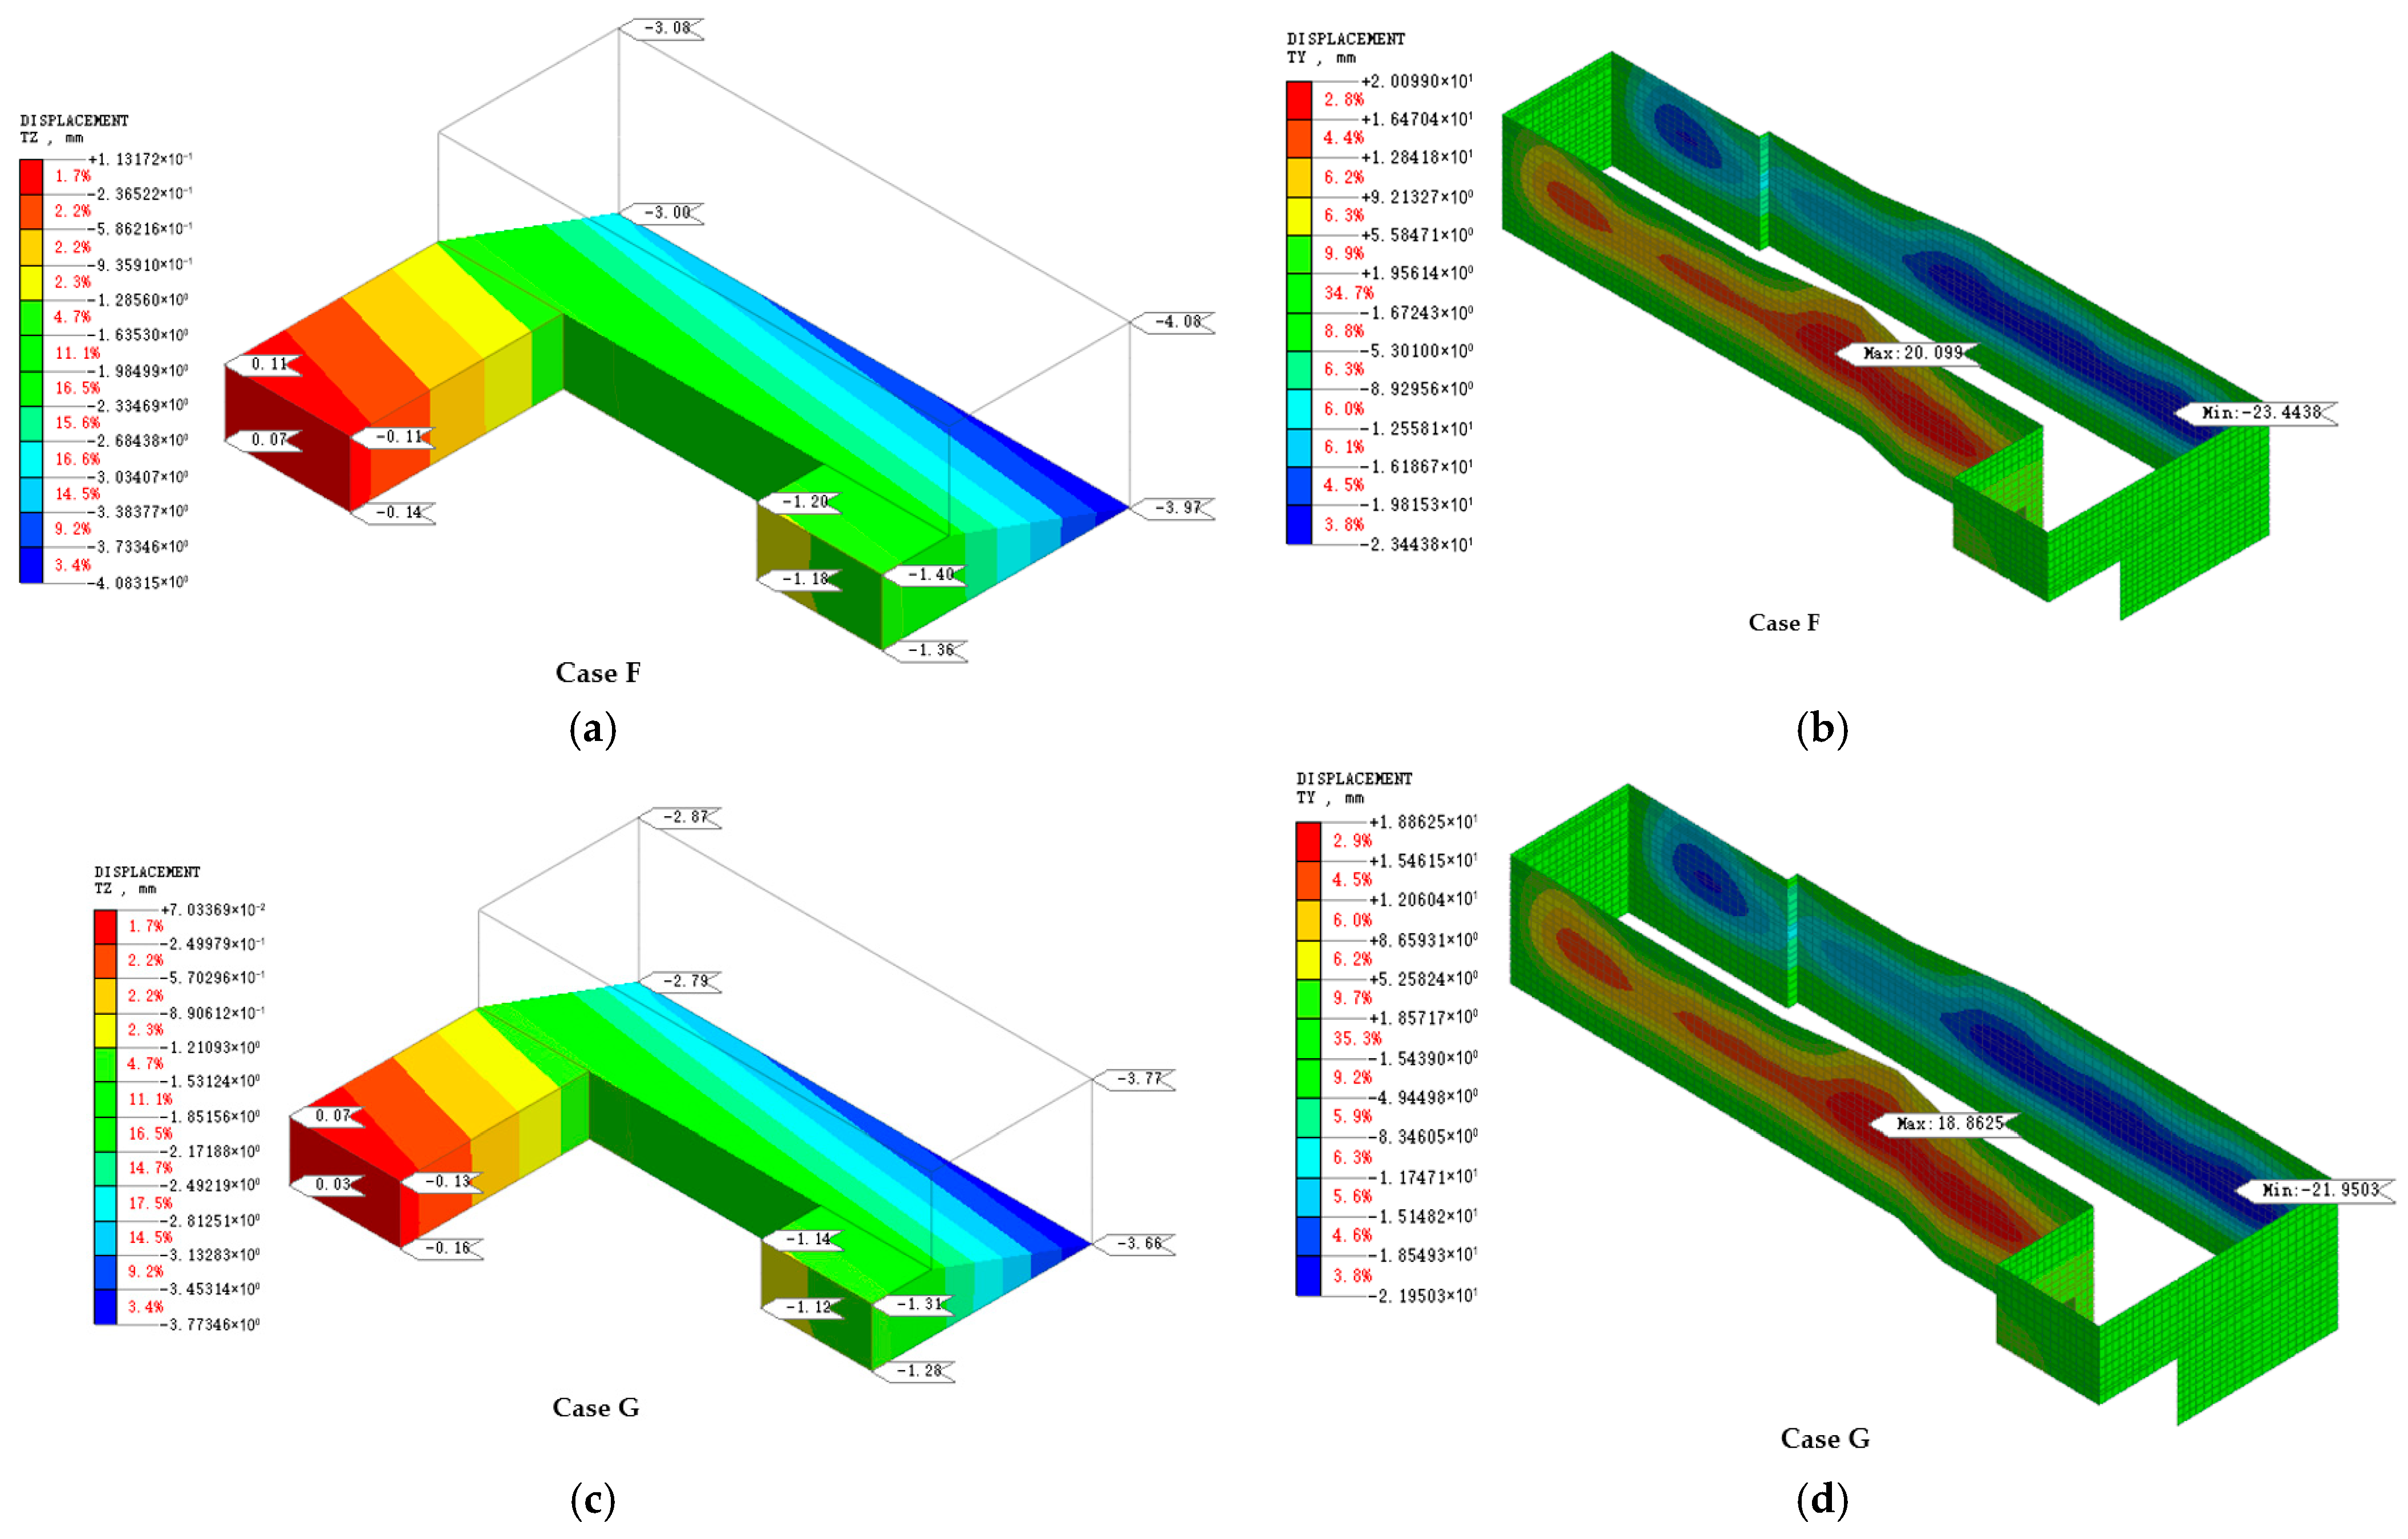
Figure 12a–d presents the numerical simulation results for the standardized schemes. Panels (a) and (c) show the deformation response of the adjacent civil defense structure, while panels (b) and (d) illustrate the contiguous pile wall displacement contours. In Case F (Figure 12a), the maximum cumulative settlement of the civil defense structure was −4.08 mm, with a maximum inclination ratio of 0.0085%. In Case G (Figure 12c), the maximum settlement was −3.77 mm, and the maximum inclination ratio was 0.0078%. Both cases remained far below the settlement warning threshold (14 mm) and allowable inclination limit (4%), indicating that internal bracing standardization did not compromise the serviceability of the adjacent structure. However, the retaining pile response again provided a more sensitive measure of system performance. In Case F (Figure 12b), the maximum deep lateral displacement reached 23.44 mm, approaching the project warning limit (24.5 mm) and leaving a relatively small safety margin. In contrast, Case G (Figure 12d) limited the maximum displacement to 21.95 mm, providing more stable deformation control while still meeting performance criteria. To further compare the standardized internal bracing schemes, the key deformation indicators for Cases F and G are summarized in Table 8.
Overall, both standardized schemes are feasible from the perspective of adjacent-structure settlement and inclination. Nevertheless, Case F produces a pile displacement closer to the warning threshold, indicating reduced deformation reserve and potentially stricter monitoring requirements. Case G achieves improved contiguous pile wall deformation control while substantially reducing the diversity of strut types, thereby improving constructability and quality assurance. Accordingly, Case G is recommended as the preferred internal bracing optimization solution, whereas Case F may be adopted only when deformation requirements are less stringent or additional mitigation measures are implemented.

6. Conclusions

This study clarifies the deformation characteristics and optimization strategy of a deep excavation supported by a contiguous pile wall–internal bracing system in sandy cobble strata, based on a representative project in Pujiang County, Chengdu. The identified deformation mechanisms and optimization strategies are primarily applicable to the specific geological conditions and support system configuration of the presented case study, and should not be regarded as universally generalizable without appropriate site-specific verification. By integrating field monitoring with a validated 3D FE model (MIDAS/GTS) and parametric optimization, the key deformation drivers and design-controlling indicators are identified. The main conclusions are as follows.
(1)
Stage-controlled deformation governed by excavation depth and bracing mobilization. Road settlement, pile-head vertical displacement, and adjacent building settlement increase progressively during excavation, with a distinct acceleration after the excavation reaches the second bracing level. This acceleration is closely related to the specific excavation depth and internal bracing configuration adopted in this project. This staged response is primarily caused by intensified unloading and stress redistribution with increasing excavation depth, while the installation of internal bracing controls the timing and effectiveness of stiffness mobilization and load transfer within the excavation system. Despite the acceleration, all monitored responses remain far below the alarm limits (e.g., 20 mm for road/building settlement and 30 mm for pile-head displacement), indicating effective serviceability control of the excavation.
(2)
Bulging lateral deflection as the dominant response of the contiguous pile wall. Inclinometer measurements reveal a typical bulging-shaped lateral displacement profile, with peak deflection concentrated at the middle-to-lower portion of the excavation, approximately at 0.7–0.85 times the excavation depth. This behavior reflects bending demand developing between bracing levels, as pile movements are restrained near strut elevations while deformation accumulates in the spans between restraints. The maximum measured lateral displacements reach 8.3 mm (ZX6) and 13.5 mm (ZX7), which are substantially lower than the warning/alarm thresholds (24.5/35 mm), confirming robust lateral stability under the baseline support scheme.
(3)
Reliability of the 3D FE model for mechanism interpretation and design evaluation. The MIDAS/GTS model reproduces the measured contiguous pile wall lateral displacement profiles with a maximum deviation of 3.7%, demonstrating its capability to capture the load–deformation transfer mechanism of the contiguous pile wall–internal bracing system and to support comparative assessment of alternative design parameters.
(4)
Design implication and recommended optimization route. Parametric analyses indicate that variations in contiguous pile wall stiffness exert a disproportionately strong influence on maximum lateral pile displacement, whereas settlement responses of adjacent sensitive structures are comparatively less sensitive. Accordingly, maximum lateral displacement of the contiguous pile wall should be treated as the governing optimization criterion, with surface and building settlements serving as secondary checks. A moderate stiffness enhancement (approximately 1.2t) achieves an effective balance between deformation control and economy, and the standardized internal bracing configuration (Case G) improves constructability while limiting the maximum lateral displacement to 21.95 mm, remaining below the warning threshold.
Future studies should incorporate dynamic disturbances and long-term post-excavation deformation to further refine deformation-control-oriented design for deep excavations in sandy cobble strata.

Author Contributions

Conceptualization, Y.Z. and C.Z.; methodology, C.Z.; software, C.Z. and S.Y.; validation, Y.Z., C.Z., and R.L.; formal analysis, C.Z.; investigation, Y.Z., C.Z., Q.Z., and J.S.; resources, X.C., H.Y., and S.Y.; data curation, Q.Z.; writing—original draft preparation, Y.Z. and C.Z.; writing—review and editing, Y.Z., C.Z., Q.Z., R.L., X.C., H.Y., and S.Y. All authors have read and agreed to the published version of the manuscript.

Funding

This investigation was supported by Sichuan Science and Technology Program (2024NSFSC0926) and Chengdu Science and Technology Program (Grant No. 2025-YF05-00392-SN).

Data Availability Statement

The original contributions presented in this study are included in the article. Further inquiries can be directed to the corresponding author.

Acknowledgments

The authors would like to express their gratitude to all those who contributed to this work and sincerely appreciate the valuable suggestions provided by the peer reviewers.

Conflicts of Interest

Author Rui Liu was employed by the Geotechnical Engineering Institute, Sichuan Institute of Building Research and Sichuan Provincial Construction Engineering Quality Inspection Center Co., Ltd. The remaining authors declare that the research was conducted in the absence of any commercial or financial relationships that could be construed as a potential conflict of interest.

References

  1. Hu, J.Y.; Xie, J.B.; Li, W.; Li, C.H. Research on the united supporting structure of piled anchor and reinforced concrete internal bracing for city deep foundation pits under complex surroundings. Adv. Mater. Res. 2011, 261–263, 1270–1276. [Google Scholar] [CrossRef]
  2. He, Z.; Yang, X.; Ye, C.; Li, Z.; Liang, R.; Cai, B.; Xiao, M.; Wu, W. Optimization analysis of internal bracing structures for subway deep foundation pits. Saf. Environ. Eng. 2021, 28, 68–78. [Google Scholar]
  3. Mei, Y.; Zhou, D.; Wang, X.; Zhao, L.; Shen, J.; Zhang, S.; Liu, Y. Deformation law of diaphragm walls during deep foundation pit construction on lake and sea soft soil in the Yangtze River Delta. Adv. Civ. Eng. 2021, 2021, 6682921. [Google Scholar] [CrossRef]
  4. Guo, Y.; Liu, S. Characteristics of deformation and stability of an ultra-deep pit in plateau alluvial–lacustrine gravel strata. Processes 2024, 12, 941. [Google Scholar] [CrossRef]
  5. Blackburn, J.T.; Finno, R.J. Three-dimensional responses observed in an internally braced excavation in soft clay. J. Geotech. Geoenviron. Eng. 2007, 133, 1364–1373. [Google Scholar] [CrossRef]
  6. Li, G.; Qin, F.; Yan, N.; Qiao, X.; Si, L.; Zhao, S. Surface deformation characteristics and influencing factors in deep foundation pit excavations for subway projects in Ningbo’s soft soil area. Buildings 2025, 15, 1229. [Google Scholar] [CrossRef]
  7. Nguyen, B.-P.; Ngo, C.P.; Tran, T.D.; Bui, X.C.; Doan, N.-P. Finite element analysis of deformation behavior of deep excavation retained by diaphragm walls in Ho Chi Minh City. Indian Geotech. 2022, 52, 989–999. [Google Scholar] [CrossRef]
  8. Hsiung, B.-C.B. Observations of the ground and structural behaviours induced by a deep excavation in loose sands. Acta Geotech. 2019, 15, 1577–1593. [Google Scholar] [CrossRef]
  9. Moormann, C. Analysis of wall and ground movements due to deep excavations in soft soil based on a new worldwide database. Soils Found. 2004, 44, 87–98. [Google Scholar] [CrossRef]
  10. Yang, T.; Liu, S.; Wang, X.; Zhao, H.; Liu, Y.; Li, Y. Analysis of the deformation law of deep and large foundation pits in soft soil areas. Front. Earth Sci. 2022, 10, 828354. [Google Scholar] [CrossRef]
  11. Xu, W.; Lin, L.; Zhu, N.; Zhao, Y.; Yang, H.; Mei, Y.; Zhou, D. Three-dimensional numerical analyses of a monitored deep excavation pit: A case study in the Guangzhou Metro. Buildings 2025, 15, 4018. [Google Scholar] [CrossRef]
  12. Xia, R.; Zhao, Z.; Wang, R.; Xu, M.; Ye, S.; Xu, M. Research on the deformation law of foundation excavation and support based on fluid–solid coupling theory. Sensors 2024, 24, 426. [Google Scholar] [CrossRef]
  13. Gao, X.; Bi, Y.; Dong, Y.; Wang, J.; Liu, X.; Li, J. Response characteristics of excavation and support in circular sand soil foundation pits based on parameter verification. J. Mar. Sci. Eng. 2025, 13, 349. [Google Scholar] [CrossRef]
  14. Tian, Z.; Zhou, S.; Lee, A.; Zhao, Y.; Gong, Q. A Bayesian-Based Approach for Inversion of Earth Pressures on in-Service Underground Structures. Acta Geotech. 2024, 19, 1911–1928. [Google Scholar] [CrossRef]
  15. Tian, Z.; Lee, A.; Zhou, S. Adaptive Tempered Reversible Jump Algorithm for Bayesian Curve Fitting. Inverse Probl. 2024, 40, 45024. [Google Scholar] [CrossRef]
  16. Chen, L.; Tian, Z.; Zhou, S.; Gong, Q.; Di, H. Attitude deviation prediction of shield tunneling machine using Time-Aware LSTM networks. Transp. Geotech. 2024, 45, 101195. [Google Scholar] [CrossRef]
  17. Shi, J.; Fu, Z.; Guo, W. Investigation of geometric effects on three-dimensional tunnel deformation mechanisms due to basement excavation. Comput. Geotech. 2019, 109, 36–48. [Google Scholar] [CrossRef]
  18. Chen, R.; Meng, F.; Li, Z.; Ye, Y.; Ye, J. Investigation of response of metro tunnels due to adjacent large excavation and protective measures in soft soils. Tunn. Undergr. Space Technol. 2016, 58, 224–235. [Google Scholar] [CrossRef]
  19. Liu, J.; Xue, B.; Wang, H.; Zhang, X.; Zhang, Y. Numerical study on the behavior of an existing tunnel during excavation of an adjacent deep foundation pit. Sustainability 2023, 15, 9740. [Google Scholar] [CrossRef]
  20. Ponte, M.; Catanzariti, F.; Campilongo, G. Application of the Finite Element Method (FEM) through GFAS Software to the Study of a Tunnel. Green World J. 2021, 4, 006. [Google Scholar] [CrossRef]
  21. Mu, L.; Chen, W.; Huang, M.; Lu, Q. Hybrid method for predicting the response of a pile-raft foundation to adjacent braced excavation. Int. J. Geomech. 2020, 20, 04020106. [Google Scholar] [CrossRef]
  22. Jiang, S.; Chen, W.; Ma, R.; Lv, X.; Sun, F.; Ren, Z. Dynamic response of adjacent tunnels to deep foundation pit excavation: A numerical and monitoring data-driven case study. Appl. Sci. 2025, 15, 10570. [Google Scholar] [CrossRef]
  23. Li, S.; Wang, F.; Le, Y.; Que, Q.; Su, Y.; Lin, H. Design and deformation pattern simulation of deep excavation support structures. Front. Earth Sci. 2024, 12, 1416957. [Google Scholar] [CrossRef]
  24. Liu, J. Application of prestressed fish-belly steel struts in the optimization design of deep foundation pit support schemes. Build. Struct. 2018, 48, 103–107, 154. [Google Scholar]
  25. Wang, C.; Lin, G.; Yao, H.; Ding, H.; Tang, X.; Lin, Z.; Wang, X. Observation and analysis of deformation control performance of hydraulic servo steel supports for a soft soil pit: A case study in Hangzhou. Buildings 2025, 15, 1002. [Google Scholar] [CrossRef]
  26. Miao, Y.; Zhang, T.; Hu, H.; Li, H.; Xu, Z. Optimization design of internal bracing for the foundation pit of Kunming comprehensive transportation hub. Build. Sci. 2023, 39, 162–170. [Google Scholar]
  27. Zang, M.; Peng, Q.; Wang, C. Analysis of foundation pit support selection and design problems in deep soft soil areas. Adv. Civ. Eng. 2024, 2024, 2779898. [Google Scholar] [CrossRef]
  28. Lu, S.; Zheng, W.; Yin, S.; Chen, F. Optimization of deep foundation pit support schemes based on game theory combined weighting and cloud model. Eng. Res. Express 2025, 7, 035121. [Google Scholar] [CrossRef]
  29. GB 55018—2021; General Code for Engineering Surveying. Ministry of Housing and Urban-Rural Development of the People’s Republic of China: Beijing, China, 2021.
  30. GB 50026—2020; Standard for Engineering Surveying. Ministry of Housing and Urban-Rural Development of the People’s Republic of China: Beijing, China, 2020.
  31. Zhao, M. Deformation Monitoring and Numerical Simulation of Pile–Anchor Support for a Deep Foundation Pit of a High-Speed Railway Station. Master’s Thesis, Shijiazhuang Tiedao University, Shijiazhuang, China, 2024. [Google Scholar]
  32. Shi, Z. Deformation Behavior and Optimization Design of Internally Braced Support Structures for Deep Foundation Pits. Master’s Thesis, China University of Geosciences (Beijing), Beijing, China, 2018. [Google Scholar]
  33. Campilongo, G.; Ponte, M.; Muto, F.; Critelli, S.; Catanzariti, F.; Milone, D. Geomechanics and Geology of Marine Terraces of the Crotone Basin, Calabria (Italy). Geosciences 2024, 14, 215. [Google Scholar] [CrossRef]
  34. Poulos, H.G.; Davis, E.H. Pile Foundation Analysis and Design; John Wiley & Sons: New York, NY, USA, 1980; ISBN 978-0-471-02084-4. [Google Scholar]
  35. Huang, J.; Liu, J.; Guo, K.; Wu, C.; Yang, S.; Luo, M.; Lu, Y. Numerical simulation study on the impact of deep foundation pit excavation on adjacent rail transit structures: A case study. Buildings 2024, 14, 1853. [Google Scholar] [CrossRef]
  36. Teng, J. Deformation of Shallow-Foundation Buildings Adjacent to Deep Excavations. Master’s Thesis, Jiangsu University, Zhenjiang, China, 2025. [Google Scholar]
Figure 1. Project Location Map: (a) Site Photo, (b) Layout Plan.
Buildings 16 00541 g001
Figure 2. Typical cross-section of the retaining system.
Buildings 16 00541 g002
Figure 3. Plan layout of the three-level internal bracing system.
Buildings 16 00541 g003
Figure 4. On-site layout of monitoring points: (a) deep lateral displacement of the contiguous pile wall; (b) displacement monitoring at the pile heads.
Buildings 16 00541 g004
Figure 5. Plan layout of the monitoring points relevant to this study.
Buildings 16 00541 g005
Figure 6. Time histories of monitored deformations during excavation: (a) road settlement (DL1–DL5); (b) pile-head vertical displacement of retaining piles (PJ-1-4.4–PJ-1-23.23); (c) settlement of adjacent buildings (ZB1–ZB5).
Buildings 16 00541 g006
Figure 7. Evolution of deep lateral displacement profiles of retaining piles measured by inclinometers: (a) ZX7; (b) ZX6.
Buildings 16 00541 g007
Figure 8. A 3D Finite Element Mesh of the Foundation Pit Model.
Buildings 16 00541 g008
Figure 9. Comparison of Measured and Simulated Deep Lateral Displacement Profiles of the Retaining Piles at Different Excavation Stages: (a) ZX7; (b) ZX6.
Buildings 16 00541 g009
Figure 10. Numerical simulation results: (ae) settlement responses of the adjacent civil defense structure under different retaining stiffness configurations; (f) structural layout and dimensions of the civil defense facility.
Buildings 16 00541 g010aBuildings 16 00541 g010b
Figure 11. Numerical simulation results: (ae) contours of deep lateral displacement of the retaining pile wall under different equivalent stiffness configurations.
Buildings 16 00541 g011aBuildings 16 00541 g011b
Figure 12. Numerical simulation results: (a,c) settlement response of the adjacent civil defense structure; (b,d) deep lateral displacement of the retaining piles.
Buildings 16 00541 g012
Table 1. Pile Design Parameters for Each Construction Section.
Construction SectionPile Diameter and Spacing (mm)Pile Length (m)Main Longitudinal Reinforcement
AB ϕ 1400@200034.536Buildings 16 00541 i00128
BB1 ϕ 1200@200016.028Buildings 16 00541 i00128
B1B2 ϕ 900@120013.020Buildings 16 00541 i00122
B2C ϕ 900@120012.020Buildings 16 00541 i00122
BC ϕ 900@120025.020Buildings 16 00541 i00125
CD ϕ 1400@200032.232Buildings 16 00541 i00132
DE ϕ 1400@200032.036Buildings 16 00541 i00132
EF ϕ 1400@200028.032Buildings 16 00541 i00132
FG1 ϕ 1400@200027.036Buildings 16 00541 i00132
G1G ϕ 900@120026.024Buildings 16 00541 i00132
G1H ϕ 1200@200026.032Buildings 16 00541 i00128
HK ϕ 1200@200025.028Buildings 16 00541 i00128
KL ϕ 1200@200026.028Buildings 16 00541 i00128
LM ϕ 1400@200027.030Buildings 16 00541 i00132
MN ϕ 1200@200028.028Buildings 16 00541 i00132
NP ϕ 1200@200031.028Buildings 16 00541 i00132
PQ ϕ 1400@200030.036Buildings 16 00541 i00132
QA ϕ 1400@200032.032Buildings 16 00541 i00132
Table 2. Monitoring Indices and Alarm Thresholds.
Monitoring ItemsCumulative Value (mm)Deformation Rate (mm/day)
Alarm LimitAlert LimitAlarm LimitAlert Limit
Vertical displacement at the top of the contiguous pile wall302132.1
Deep horizontal deformation of the piles (along pile depth)3524.532.1
Settlement of adjacent buildings201432.1
Road surface settlement201432.1
Table 3. Physical and Mechanical Parameters and Properties of Soil Layers.
Soil TypeDensityPoisson’s RatioCohesionFriction Angle E 50 ref E o e d ref E u r ref ThicknessElement Type
γ / k N · m 3 ν c / k P a φ / ° M P a M P a M P a m
Miscellaneous fill17.50.325555153.03D solid
Slightly dense cobble layer20.50.2403025252505.3~8.63D solid
Medium sand19.50.343299.59.547.56.03D solid
Silt18.00.301211.555155.03D solid
Silty clay19.50.3850167.57.522.53.03D solid
Moderately dense cobble layer21.00.2303535353507.03D solid
Dense cobble layer22.00.22045424242047.43D solid
Note: E 50 ref represents secant stiffness; E o e d ref represents tangent stiffness; E u r ref represents unloading elastic.
Table 4. Assigned Mechanical Parameters for the Retaining Structures and Adjacent Buildings.
NameElastic Modulus E/GPaPoisson’s RatioUnit Weight kN·m3Properties
Capping Beam30.00.224.51D Beam Element
Waist Beam-130.00.224.51D Beam Element
Waist Beam-232.60.224.51D Beam Element
ZC130.00.224.51D Beam Element
ZC230.00.224.51D Beam Element
ZC332.60.224.51D Beam Element
ZC432.60.224.51D Beam Element
CC130.00.224.51D Beam Element
CC230.00.224.51D Beam Element
CC332.60.224.51D Beam Element
Retaining Piles30.00.224.52D Plate Element
Steel Columns2060.378.51D Beam Element
Column Foundation30.00.224.51D Beam Element
Civil Defense Foundation30.00.224.5Embedded Beam Element
Civil Defense Slab30.00.224.52D Plate Element
Table 5. Equivalent Thickness of Bored Cast-in-Place Piles.
NameEquivalent Thickness (m)
Retaining Pile 9000.77
Retaining Pile 12000.93
Retaining Pile 1200 + High-Pressure Jet Grouting Pile1.14
Retaining Pile 14001.12
Retaining Pile 1400 + High-Pressure Jet Grouting Pile1.28
Table 6. Excavation Construction Phases.
StageDescription
Initial StageActivation of all in situ soil, surrounding building loads, and rigid connection elements.
Retaining StructureActivation of the retaining structure and interface elements.
Excavation-1Excavation to a depth of 2.3–3.0 m below the design elevation, construction of the first internal bracing and related column piles.
Excavation-2Partial excavation to a depth of 2.9–5.3 m below the design elevation.
Excavation-3Excavation to a depth of 3.6–7.6 m below the design elevation.
Excavation-4Excavation to a depth of 9.6 m below the design elevation, construction of the second internal bracing and related column piles.
Excavation-5Excavation to a depth of 11.6 m below the design elevation.
Excavation-6Excavation to a depth of 13.1 m below the design elevation.
Excavation-7Excavation to a depth of 14.6 m below the design elevation, construction of the third internal bracing.
Excavation-8Excavation to a depth of 15.5 m below the design elevation.
Excavation-9Excavation to a depth of 17.5 m below the design elevation.
Excavation-10Excavation to the bottom of the pit.
Table 7. Quantitative comparison of deformation responses under different retaining stiffness configurations.
CaseEquivalent StiffnessMax. Settlement (mm)Inclination Ratio (%)Max. Lateral Pile Displacement (mm)
A1.0t (Baseline)−3.800.007921.87
B0.6t−7.230.016938.10
C0.8t−5.140.011427.87
D1.2t−2.970.005717.88
E1.4t−2.330.004215.12
Table 8. Comparison of deformation responses for standardized internal bracing schemes.
CaseBracing SchemeMax. Settlement (mm)Inclination Ratio (%)Max. Lateral Pile Displacement (mm)
FCC-type unified−4.080.008523.44
GZC-type unified−3.770.007821.95
Disclaimer/Publisher’s Note: The statements, opinions and data contained in all publications are solely those of the individual author(s) and contributor(s) and not of MDPI and/or the editor(s). MDPI and/or the editor(s) disclaim responsibility for any injury to people or property resulting from any ideas, methods, instructions or products referred to in the content.