Article

Influence of the Amount of Mineral Additive on the Rheological Properties and the Carbon Footprint of 3D-Printed Concrete Mixtures


by
Modestas Kligys
1,*,
Giedrius Girskas
1 and
Daiva Baltuškienė
2
1
Faculty of Civil Engineering, Vilnius Gediminas Technical University (VILNIUS TECH), LT-10223 Vilnius, Lithuania
2
Joint Stock Company “Baltic Innovation Group”, LT-33112 Molėtai, Lithuania
*
Author to whom correspondence should be addressed.
Buildings 2026, 16(3), 490; https://doi.org/10.3390/buildings16030490
Submission received: 28 December 2025 / Revised: 21 January 2026 / Accepted: 23 January 2026 / Published: 25 January 2026
(This article belongs to the Special Issue Advances and Applications of Recycled Concrete in Green Building)

Abstract

Rheology plays an important role in the 3D concrete printing technology, because it directly governs the flowability and shape retention of the material, impacting both the printing process and the final quality of the obtained structure. Local raw materials such as Portland cement, washed sand, and tap water were used for the preparation of 3D-printed concrete mixtures. The solid-state polycarboxylate ether with an anti-foaming agent was used as superplasticizer. The Portland cement was partially replaced (by volume) with a natural zeolite additive in amounts ranging from 0% to 9% in 3D-printed concrete mixtures. A rotational rheometer with coaxial cylinders was used in this research for the determination of rheological characteristics of prepared 3D-printed concrete mixtures. The Herschel–Buckley model was used to approximate experimental flow curves and assess rheological parameters such as yield stress, plastic viscosity, and shear-thinning/thickening index. The additional experiments and calculations, such as water bleeding test and evaluation of the carbon footprint of 3D-printed concrete mixtures, were performed in this work. The replacement of Portland cement with natural zeolite additive positively influenced rheological and stability-related properties of 3D-printed concrete mixtures. Natural zeolite additive consistently reduced water bleeding, enhanced yield stress under increasing shear rates, and lowered plastic viscosity, thereby improving flowability and mixture transportation during the 3D printing process. As the shear-thinning/thickening index remained stable (indicating non-thixotropic behavior in most cases), higher amounts of natural zeolite additive introduced slight thixotropy (especially under decreased shear rates). These changes contributed to better shape retention, layer stability, and the ability to print taller and narrower structures without collapse, making natural zeolite additive suitable for use in the optimized processes of 3D concrete printing. A significant decrease in total carbon footprint (from 3% to 19%) was observed in 3D-printed concrete mixtures with an increase in the mentioned amounts of natural zeolite additive, compared to the mixture without this additive.

1. Introduction

The literature analysis which was conducted has shown that 3D-printed concrete has become one of the faster-growing research domains within construction materials, evidenced by a continuously increasing number of publications, expanding international collaboration networks, and broad interdisciplinary interest since the year 2015. Its relevance is reinforced by the construction industry’s need for automation, digital workflows, and sustainable practices, with 3D-printed concrete widely viewed as a key enabler of Construction 4.0 due to its compatibility with robotics, BIM/CAM integration, and advanced material design frameworks [1,2,3,4,5,6,7]. This rising popularity reflects both technological progress and the sector’s recognition that traditional concrete construction faces limitations in labor availability, cost control, and geometric flexibility [8].
Industrially, 3D-printed concrete is valued for automating formwork-free fabrication, reducing labor intensity, and enabling rapid production of complex geometries. Reviews note that 3D-printed concrete improves material efficiency and supports more sustainable construction through waste reduction and optimized digital manufacturing processes, helping address long-standing productivity stagnation in the construction sector. Reported benefits include significant reductions in construction time and, in many cases, lower costs, though these outcomes vary depending on system maturity and project conditions [1,9,10,11,12,13].
Despite its momentum, several gaps hinder widespread adoption. Persistent challenges include achieving consistent interlayer bonding, addressing anisotropic mechanical performance, and developing reliable reinforcement strategies that meet structural design codes. Long-term durability data of 3D-printed concrete remain limited, especially regarding environmental exposure, permeability, and interface behavior. Reviews consistently emphasize the lack of unified standards for printability, quality control, and structural design, as well as the need for fully integrated digital workflows and validated low-carbon printable binders [1,8,11,12,14].

1.1. Fresh State Properties of 3D-Printed Concrete

Rheology is a characteristic of the material, which depends on time and provides a relationship between flow or deformation of the material and shear rate and stresses, which are critical for understanding the behavior of fresh state concrete during 3D printing processes [15,16,17,18,19,20,21]. The rheology of 3D-printed concretes primary depends on shear rate, density, temperature, time and equipment of mixing, particle size distribution, supplementary cementitious materials, mineral additives, and chemical admixtures [22,23,24].
The use of different rheological models helps scientists and engineers to predict 3D printability, to ensure structural stability, to optimize different processes, to design materials (including their quality control), and to make integration with digital fabrication. The most common models used for the description of 3D-printed concrete rheology are presented in Table 1.
The 3D concrete printing relies on highly thixotropic, shear-dependent and structurally evolving mixtures, which exhibit a finite yield stress, shear-thinning behavior, time-dependent structuration (thixotropy and flocculation), and non-linear flow (at moderate and high shear rates). The Herschel–Bulkley rheological model is one of the most accurate and the most popular models, used for the evaluation of 3D-printed concrete mixtures. It naturally incorporates all these mentioned characteristics of freshly prepared mixtures in a way that other rheological models cannot. The flexibility and simplicity of the Herschel–Bulkley rheological model ensure computational efficiency, making it practical for real-time simulations and design optimization of 3D printing systems.
The worldwide popularity of 3D-printed concretes is still limited because of the problems in understanding, characterizing, and predicting their fresh state properties [25,26,27]. During the printing processes, concrete in a fresh state must be capable of being efficiently transported to the head of the printer (pumpability) [28,29], being extruded smoothly and continuously through the nozzle (extrudability) [29,30], and keeping shape and stability against different forces after extrusion (buildability) [29,31,32]. Pumpability, extrudability, and buildability are the main key performance indicators that define the printability of 3D concrete [29]. Poor pumpability leads to interruptions, material waste, and equipment wear [33,34]. Poor extrudability leads to the formation of uneven layers and the appearance of quality defects [35,36] as well as poor buildability, leading to deformations or even collapse of 3D-printed structures due to their own weight [37,38].
The correctly selected rheological properties, such as yield stress, viscosity, thixotropy, and shear-thinning/thickening behavior are crucial for the successful 3D concrete printing processes [17].

1.1.1. Pumpability

Too-low yield stress or plastic viscosity can lead to segregation or bleeding during the pumping processes, while a too-high yield stress or plastic viscosity makes this procedure more difficult to perform [39,40,41].
The developed theoretical model [42] has shown that increased thixotropy leads to higher pumping pressure losses, larger plug radius, and reduced wall shear rates. It confirms that rapid structural rebuilding during low flow rates increases resistance. Simulations [43] have shown that thixotropic effects can cause pumping arrest and pressure peaks after rest periods due to structural rebuilding.
Simulation of computational fluid dynamics [44] showed that shear-thinning behavior reduced flow resistance, making materials easier to pump through narrow nozzles. Another study [45] has shown that materials with shear-thinning behavior are easier to pump and extrude, especially under varying nozzle sizes and speeds.
The formation of the lubrication layer is the ability of the mix to form a lubricating layer (often due to cement paste migration), which can reduce the friction between the bulk material and pipe walls, by improving the pumpability. It is not a rheological property, but authors [46] have established that it is critical for accurate modeling of pressure drop and velocity profiles.

1.1.2. Extrudability

Yield stress of 3D-printed concrete should be high enough to help the extruded filament retain its shape after deposition. Authors [38] emphasized that controlled yield stress is essential for balancing flowability and shape retention during extrusion in 3D concrete printing. If yield stress is too high, the material is resistant to flowing, requiring excessive pressure and risking nozzle blockage; if it is too low, the filament may deform or collapse after extrusion.
Plastic viscosity governs the resistance to flow once yield stress is overcome and must be optimized to ensure the material flows easily through the nozzle, but does not slump after deposition. Authors [46] have developed a numerical framework, which showed how plastic viscosity can affect extrusion pressure and flow rate (especially in Herschel–Bulkley fluids). Lower viscosity allowed smoother extrusion and reduced energy consumption, and higher viscosity may stabilize the filament, but could hinder continuous flow.
Thixotropy describes the time-dependent recovery of structure after shear and helps the material regain stiffness after extrusion, aiding in layer stability. Thixotropy must be balanced enough to support buildability, but not so much that it impedes extrusion. Excessive thixotropy may be resistant to flowing during the extrusion if the structure rebuilds too quickly. Authors [16] proposed a model for the calculation of initial yield stress and hardening coefficient, which can show how thixotropy affects extrusion and buildability. This algorithm makes it possible to determine the rheological characteristics, required to prevent the freshly prepared mixture from collapsing during the 3D printing process quite rapidly. In the proposed model, the fresh mixture was treated as a Herschel–Bulkley fluid. Consequently, it is assumed that no deformation occurs until the maximum shear stress within the deposited layers exceeds the material’s yield stress. The maximum shear stress in the layered fresh mixture was obtained from the force-equilibrium condition, while the yield stress at any point of the 3D printing process was estimated as a function of elapsed time, which in turn depends on the specific printing path.
Shear-thinning behavior can support both pumpability and shape retention. Materials with low shear-thinning behavior can be extruded more easily, and this behavior allows the material to flow smoothly through the nozzle and stiffen afterward. Research results [47] have shown that low cohesion and higher water content improved extrudability due to enhanced shear-thinning, though they may compromise buildability.
Authors [46] showed that accounting for wall slip is essential to match experimental observations in extrusion process modeling. A thin lubrication layer near the nozzle wall can reduce friction and improve flow. Wall slip conditions can significantly affect velocity profiles and extrusion pressure. Ignoring wall slip can lead to inaccurate predictions of extrusion behavior.

1.1.3. Buildability

Yield stress of 3D-printed concrete depends on printing speed and composition of the mixture, but typically ranges from 500 Pa to 1500 Pa. A high-enough yield stress of 3D-printed concrete allows the layers to maintain a shape and to resist deformations created by self-weight and even by additional layers. It also leads to a better vertical stability of the whole structure, ensuring its higher buildability [33,48]. A too-low yield stress leads to a slump or a collapse of 3D-printed concrete layers, which can be described as poor dimensional accuracy. It also limits the maximal height of the structure from 3D-printed concrete [49,50].
Optimal plastic viscosity of 3D-printed concrete also depends on printing speed, layer height, the behavior of used mineral additives, and chemical admixtures, but typically ranges from 20 Pa·s to 100 Pa·s. A high-enough plastic viscosity of 3D-printed concrete also improves the vertical stability of the structure and ensures its better shape retention [33,51]. It means that the layers of 3D-printed concrete stay in place after deposition. A too-low plastic viscosity, or a too-low yield stress, leads to a poor dimensional accuracy or even a slump in the 3D-printed concrete layers, as they continue to flow under their own weight [50,52]. A correct combination of moderate yield stress with moderate or high plastic viscosity can usually give the best results for the buildability of 3D-printed concrete.
The thixotropy of 3D-printed concrete depends on the environment temperature and hydration kinetics of the prepared mixture, as well as on the behavior of mineral additives and chemical admixtures [48,52]. Thixotropy is often characterized by a structural build-up rate or a thixotropic index. The build-up rate of 3D-printed concrete typically ranges from 50 Pa/min to 150 Pa/min [53]. A high-enough thixotropy of 3D-printed concrete also improves the vertical stability of the printed structures. It also ensures a quick restoration of internal microstructures, leading to the increased resistance of printed layers to the different impacts of deformations [54]. A too-high thixotropy may cause poor bonding strength between the layers because of the fast surface stiffening in 3D-printed concrete. Low thixotropy also leads to a slump or a collapse of 3D-printed concrete layers, which can be described as poor dimensional accuracy. On the other hand, low thixotropy ensures better adhesion strength between the layers of 3D-printed concrete, as their surfaces remain workable for a longer period of time [55]. Moderate thixotropy leads to enough structural build-up for the stability of structures, but not so fast to harm the bonding behavior between the layers.
A shorter setting time of 3D-printed concrete mixture ensures rapid stiffening, which leads to the improvement of layer stability, allowing for the creation of taller structures [41,56]. On the other hand, a shorter setting time can increase the risk of poor bonding between the layers or the creation of cold joints, especially when the printing process is slow [34,57]. A longer setting time of the 3D-printed concrete mixture leads to better bonding between the layers and eliminates rushing when printing the large structures. A longer setting time directly influences the growth of early-age strength and also a poor dimensional accuracy, leading to the increased risk of structure collapse due to the weight impact of upper layers [58,59]

1.2. Carbon Footprint

These days, many construction projects aim for net-zero or low-carbon certifications (e.g., LEED, BREEAM). Even small reductions in the amount of Portland cement (its carbon intensity is about 0.9 kg CO2/kg), due to the addition of supplementary cementitious materials which have lower carbon intensities (0.02–0.15 kg CO2/kg) [60,61,62,63], or the development of cement-free materials (geopolymers) [64,65], can significantly lower the CO2 emissions of the whole construction project. By tracking CO2 emissions, civil engineers can compare designs of the mixtures and choose the most sustainable options [66,67,68]. CO2 data is also essential for the full lifecycle assessments, as it impacts the decisions on reuse, recycling, and end-of-life strategies [69,70,71].
Construction based on 3D-printed concrete due to material efficiency and design optimization allows one to eliminate formwork and to minimize generated waste, leading to a significant reduction in the impact on the environment (it can lower CO2 emissions by up to 30–60%) [11,72,73]. The ability to create the optimized geometries, such as hollow or lattice structures, reduces the total volume of 3D-printed concrete, which is required for the structural performance and also helps to reduce CO2 emissions [74,75,76].
On the other hand, in the applications of 3D-printed concrete, the amount of Portland cement is usually 2–3 times higher than in traditional concrete, due to the need to ensure its adequate rheological and early-age properties [31,77,78]. This increase can significantly raise the carbon footprint of 3D-printed concretes. Essentially, the overall sustainability benefit of 3D-printed concretes depends on balancing this higher Portland cement demand with strategies such as the partial replacement of binder with supplementary cementitious materials (which can reduce CO2 emissions by 20–45%) [79], and structural optimization that can lower the usage of the whole material [80].
The current study focuses on the investigation of rheological properties and the stability of freshly prepared and maintained 3D-printed concrete mixtures that have been modified by different amounts of natural zeolite. Evaluation of the carbon footprint of all analyzed 3D-printed concrete mixtures was also performed in this work. This research could successfully help to reduce the impact on the environment, as 3D-printed concrete based on supplementary cementitious materials is a key path to sustainable construction.

2. Materials and Methods

Locally produced raw materials such as Portland cement (SC “Akmenes cementas”, Naujoji Akmenė, Lithuania) as a binder, or washed sand (JSC “Rizgonys”, Rizgonys, Lithuania) as fine aggregate, were used in the preparation of 3D-printed concrete mixtures.
The main properties of Portland cement (CEM I 42.5R) were determined according to the requirements of the standard EN 197-1 (https://standards.iteh.ai/catalog/standards/cen/64d327b1-d5ac-45e3-8b04-fafec9e0698e/en-197-1-2011, accessed on 16 January 2026): the beginning of setting—140 min; the end of setting—170 min; density of the particles—3120 kg/m3; bulk density—1240 kg/m3; specific surface—4198 cm2/g; volume constancy (expansion)—1.0 mm. Blaine fineness was 440 m2/kg and median particle size was 17.6 µm. The mineral composition of Portland cement: C3S—53.6%; C2S—17.2%; C3A—1.4%; C4AF—10.4%.
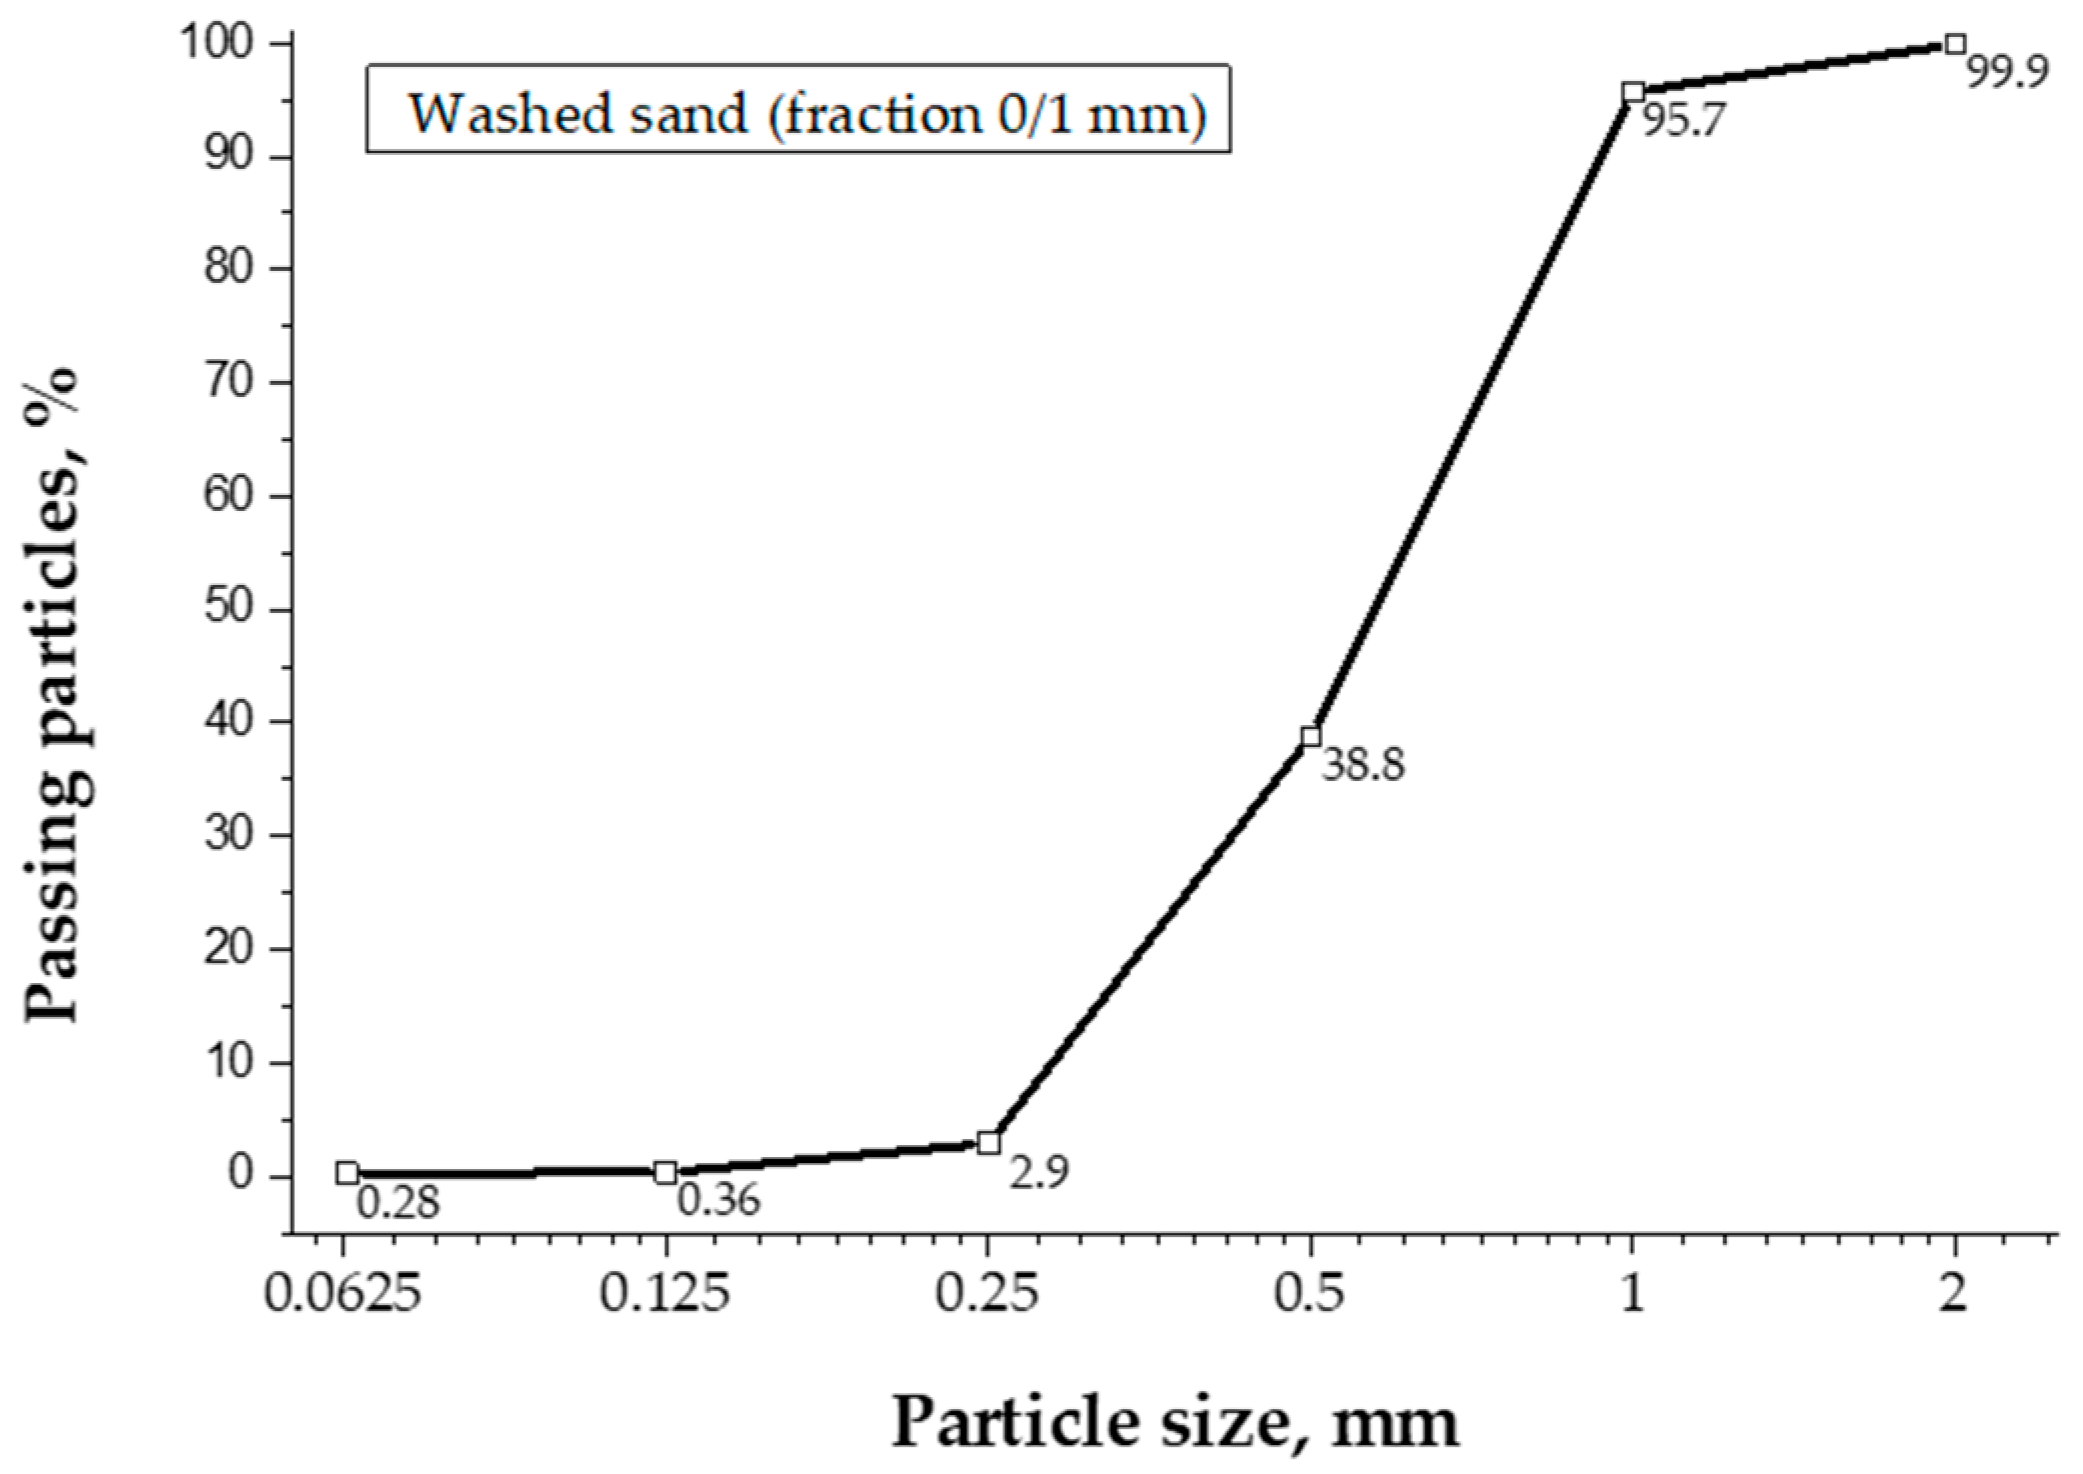
Washed sand (fraction 0/1 mm) with density of the particles—2655 kg/m3; bulk density—1551 kg/m3 and fineness module 3.0 was used as fine aggregate and met the requirements of the standard EN 12620. Particle size distribution of washed sand is presented in Figure 1.
The solid-state polycarboxylate ether with an anti-foaming agent was used as superplasticizer (HPEG 2400) in all 3D-printed concrete mixtures. The main properties of superplasticizer were as follows: appearance—white solid; pH values—5.5–7.5; molecular weight—2400; unsaturation—>95%.
Natural zeolite (distributor “Elega”, Vilnius, Lithuania) produced in the Transcarpathian deposit (Ukrainian region) with density of the particles—2570 kg/m3; Blaine fineness—320 m2/kg and median particle size—29.0 µm was used as a mineral additive for the modification of the 3D-printed concrete mixtures.
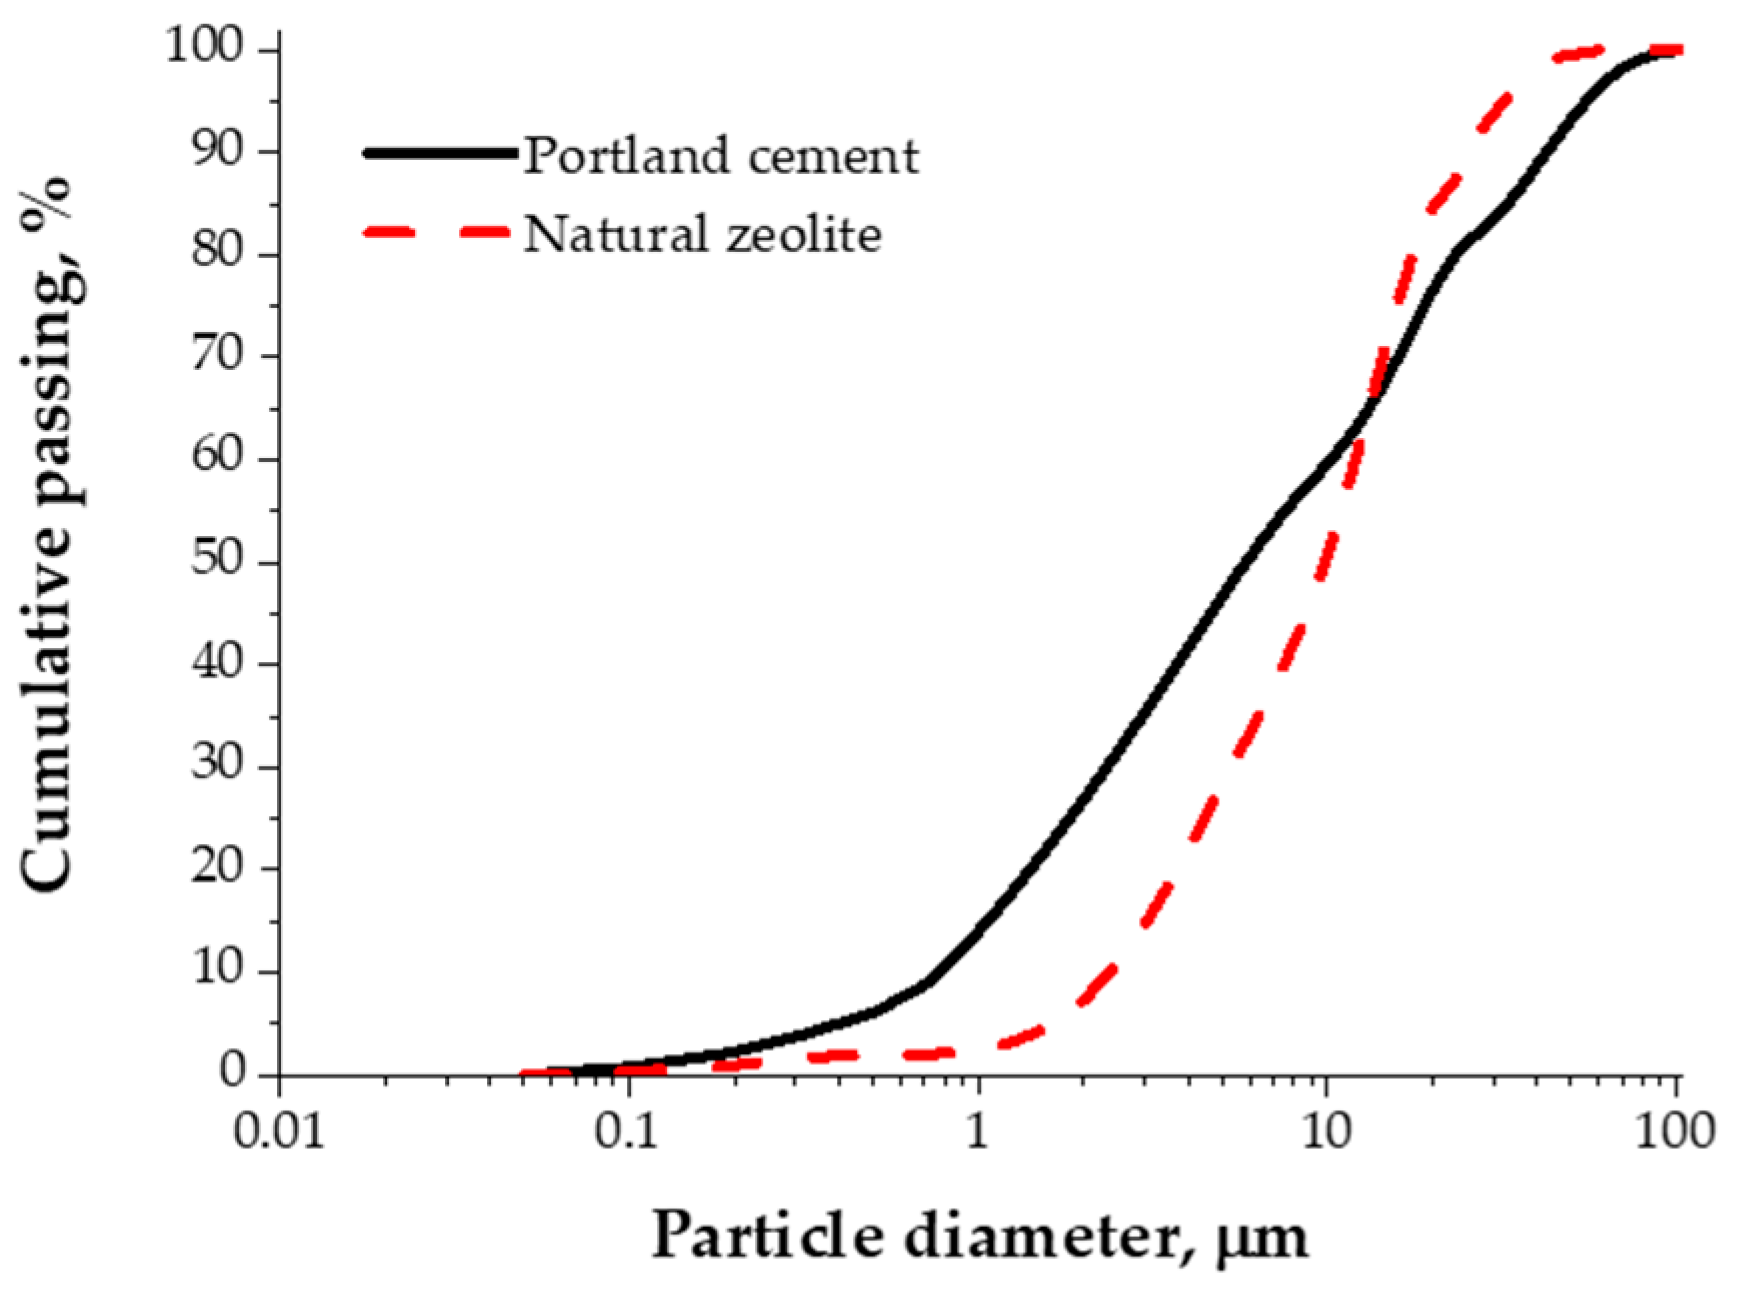
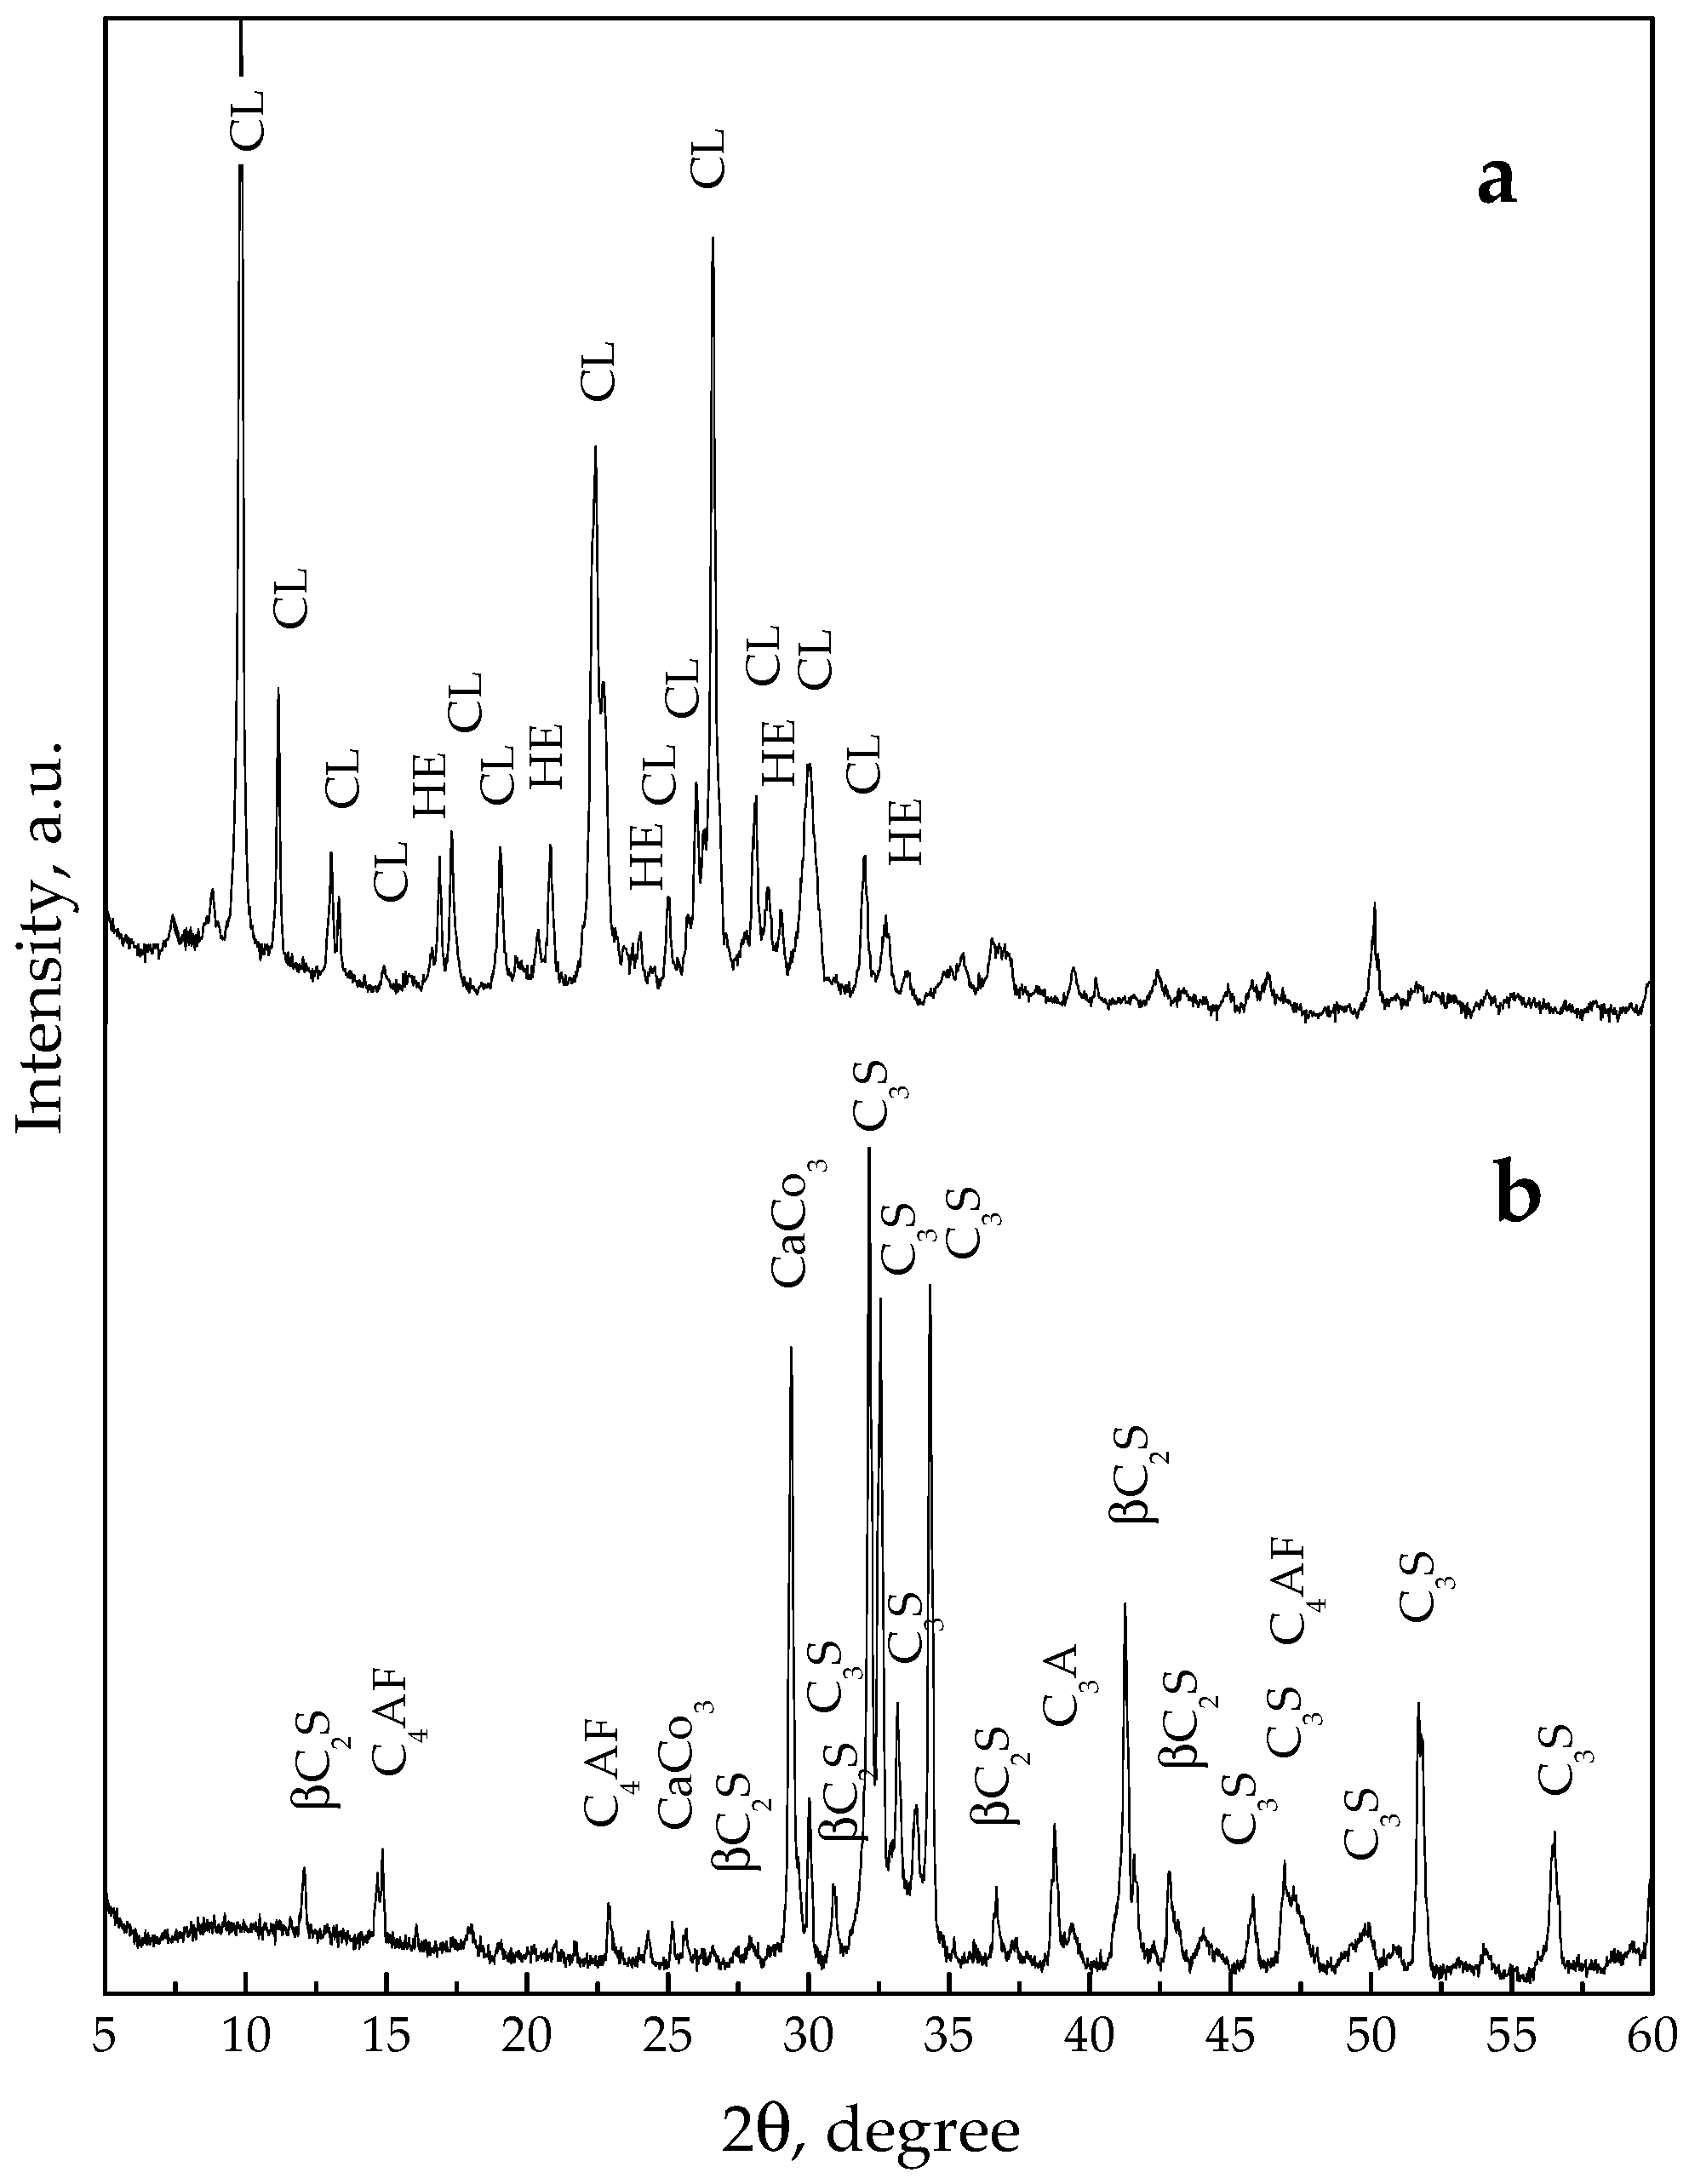
The cumulative particle size distribution of Portland cement and natural zeolite is presented in Figure 2, the XRD patterns of these materials are presented in Figure 3, and the chemical composition of all raw materials are presented in Table 2.
The Portland cement was partially replaced (by volume) with a natural zeolite additive in the following amounts: 0%, 3%, 6%, and 9% in 3D-printed concrete mixtures.
Such amounts of natural zeolite additive were chosen due to its high specific surface area and porous structure, which lead to increased water demand in the 3D-printed concrete mixtures [81,82]. A higher amount of water could have a negative impact on the strength properties and the quality of printing in 3D-printed concretes. Particles of natural zeolite additive also have an irregular shape and have a lower density (compared to cement particles), so higher amounts can disrupt particle packing [83], leading to the reduction in the lubrication effect in 3D-printed concrete mixtures. Pozzolanic reactions of natural zeolite additive are slower compared to the cement particles, so at higher amounts, the 3D-printed concrete pastes can lose the early hydration products, which help the structure to build up [82,83]. Higher amounts of natural zeolite additive (more than 9%) can push 3D-printed concrete mixture outside the rheology window, by making it too viscous or too weak in structural build-up [84].
Tap water (temperature 20 °C) was used for the preparation of the 3D-printed concrete mixtures. Water-to-cement ratio in the 3D-printed concrete mixtures varied from 0.38 to 0.51. Compositions of 3D-printed concrete mixtures, used for the rheological tests, are presented in Table 3.
The mixing of the 3D-printed concrete mixtures for rheological tests began with the mixing of dry raw materials (Portland cement, washed sand, and natural zeolite) for 1 min. After that, tap water with a required amount of superplasticizer was added in the mixture. The mixing of all components was prolonged by an additional 2 min. The selected volume of prepared 3D-printed concrete mixture for the rheological tests was 100 mL.
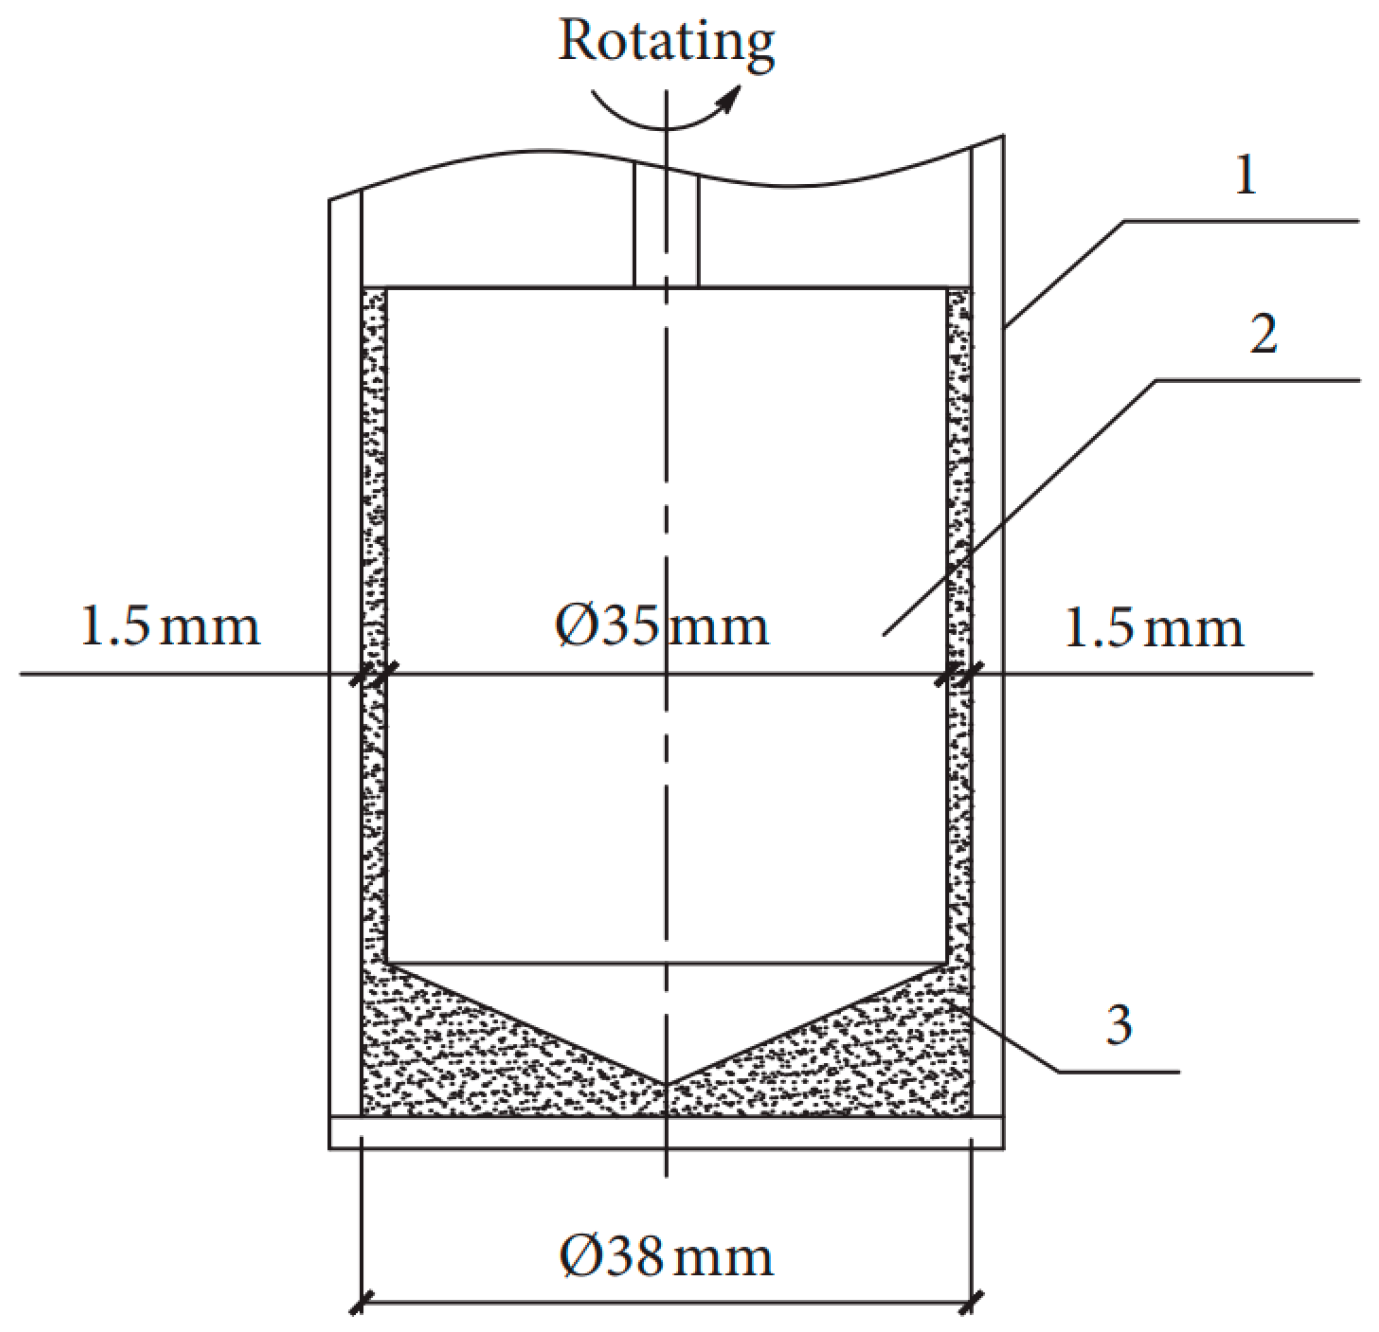
The rotational rheometer RN 4.1 (Rheotest Medingen GmbH, Ottendorf-Okrilla, Germany) with coaxial cylinders was used for rheological tests. The scheme of the cylinder-measuring system of the rheometer is presented in Figure 4.
The assembled measuring cup (1) with coupling is poured by 3D-printed concrete mixture (3) and fixed in the equipment stand. The rotating cylinder rotor (2) is placed inside the measuring cup (1) with a gap between them of about 1.5 mm and rotated during the test. The intrinsic friction of prepared 3D-printed concrete mixture layers takes place between the measuring cup (1) and cylinder rotor (2). The testing data is written when the rotating cylinder rotor makes a turn due to its connection with the measuring scale. The applied equipment enables one to test prepared 3D-printed concrete mixtures in different modes.
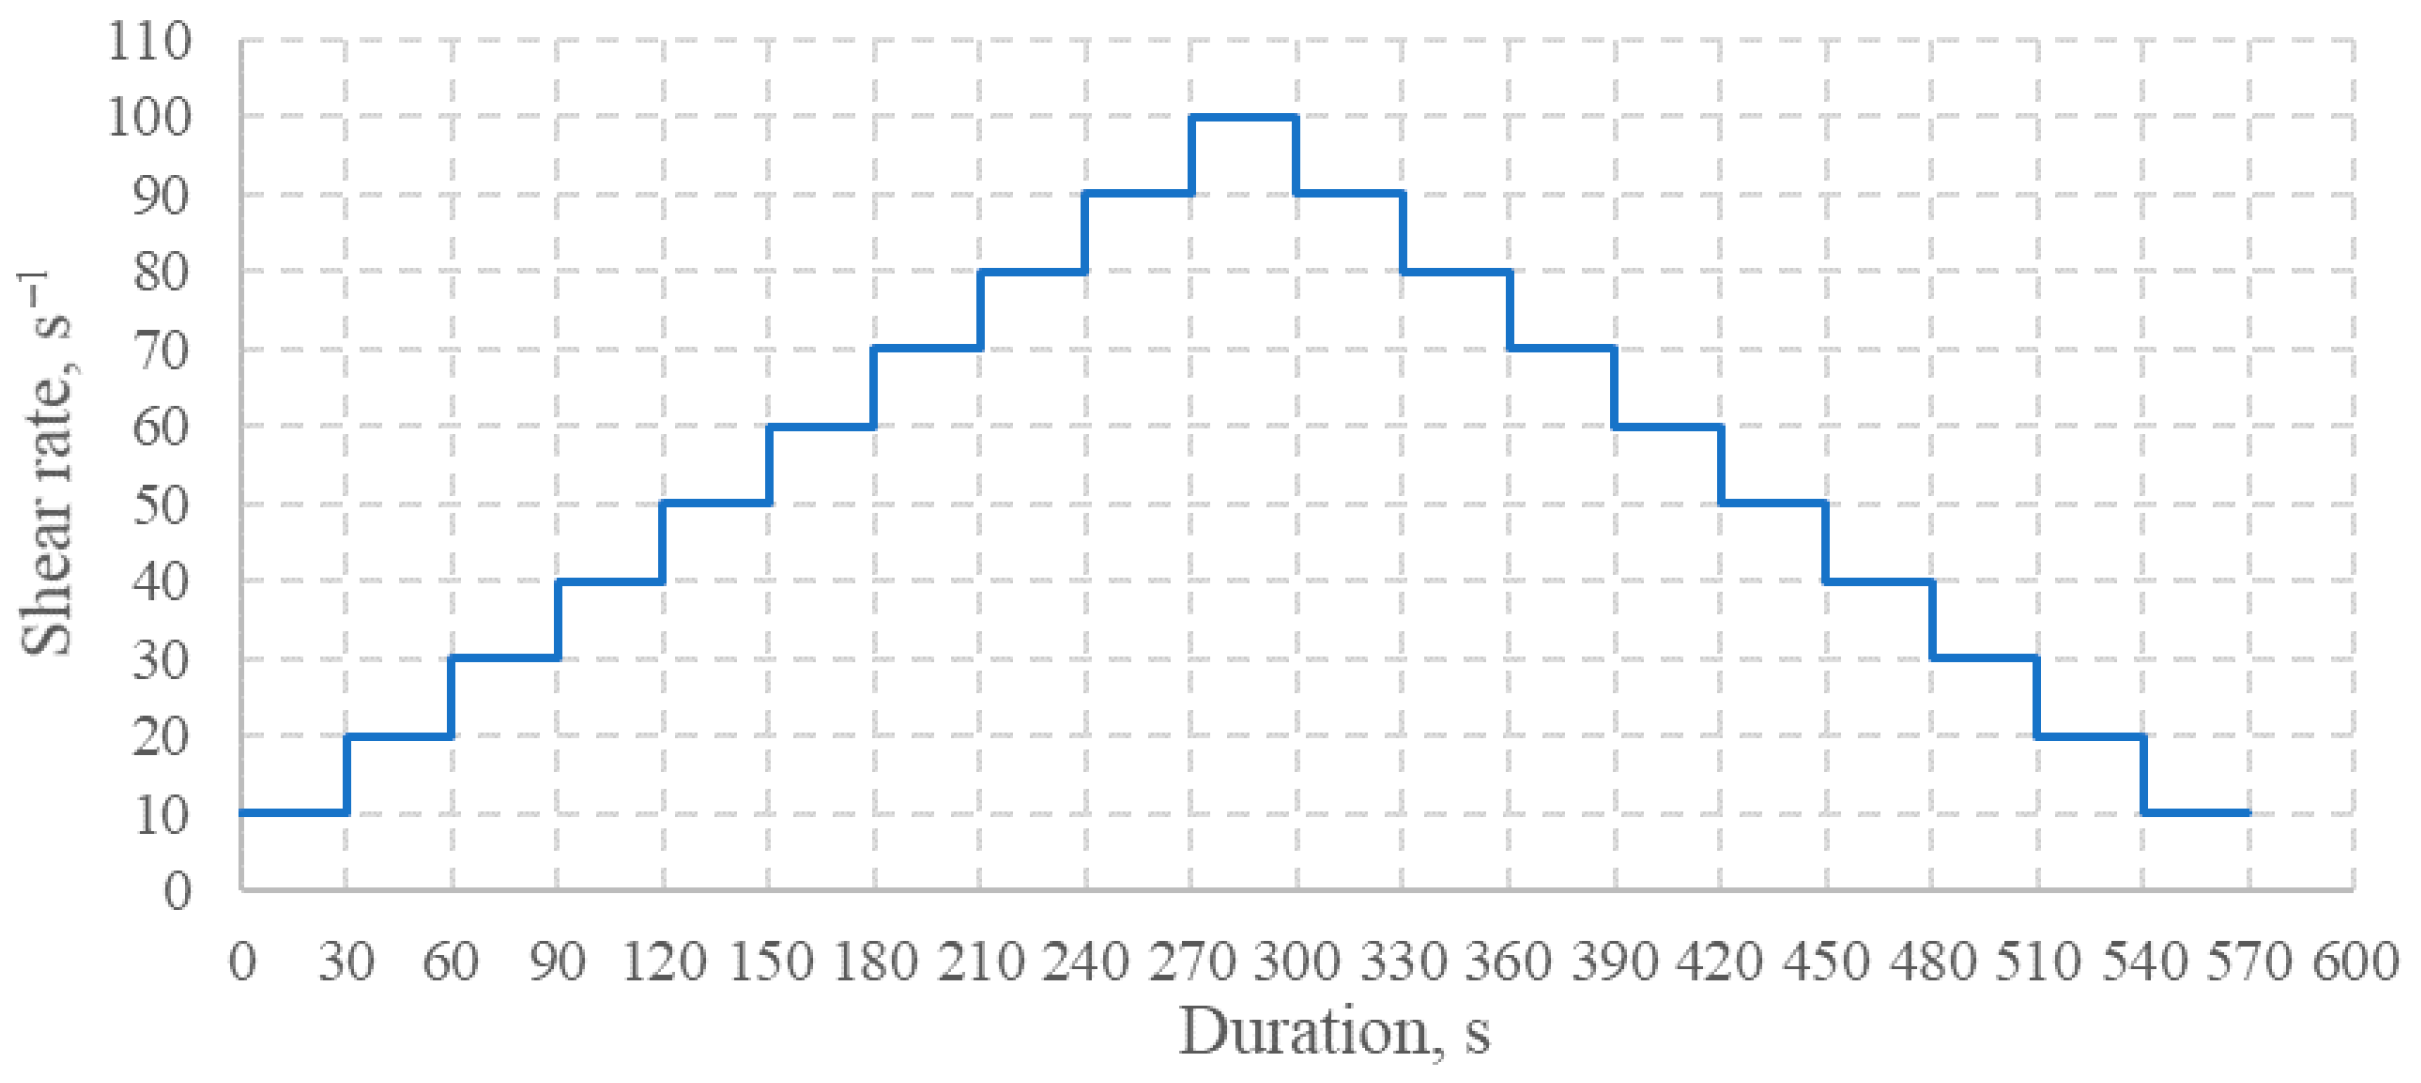
The rheological tests were performed at a temperature of 20 ± 2 °C according to the shear rate mode shown in Figure 5, exactly 5 min and 60 min after the preparation of 3D-printed concrete mixtures. The upward and downward branches were included in each flow curve obtained by 10 linear steps, in which the strain rate was varied from 10 s−1 to 100 s−1. In each linear step, the shear stress was measured over 30 s.
As was mentioned earlier, the Herschel–Bulkley rheological model is one of the most accurate and popular models, used for the evaluation of 3D-printed concrete mixtures. Flow curves of the freshly prepared 3D-printed concrete mixtures (shear stress and shear rate) were obtained from the testing equipment and were approximated using the Herschel–Bulkley rheological model according to the following equation:
τ = τ 0 + k · γ ˙ n ,
where
τ—shear stress, Pa;
τ0—yield stress, Pa;
k—the consistency factor, Pa·sn;
γ ˙ —the shear rate, s−1;
n—the pseudoplastic (thixotropy) index (n < 1) and dilatancy index (n > 1).
The following equation was used to determine the plastic viscosity of the 3D-printed concrete mixture:
η i = τ i τ 0 γ ˙ i
where
ηi—viscosity, Pa∙s;
τ0—yield stress, found out of γ-τ curve—the point, in which curve crosses τ axis, Pa;
γ ˙ i—the shear rate, s−1.
The shear-thinning/thickening index was calculated from hysteresis in up-flow and down-flow curves by reducing the yield stress after an increase in the shear rate up to 100 s−1 by the following equation:
H τ = τ f τ 0 γ ˙ f γ ˙ 0 ,
where
Hτ—shear-thinning/thickening index by yield stress;
τ0—yield stress before the shear flow;
τf—yield stress after the shear flow;
γ ˙ 0—shear rate before the shear flow;
γ ˙ f—shear rate after the shear flow.
The water release of the tested 3D-printed concrete mixtures was determined according to the following methodology. After preparation, the 3D-printed concrete mixture was placed in a plastic container, covered with a waterproof film, and kept still without any movement for 2 h. The volume of all tested samples was the same (500 mL). Two h later, the released water was collected from the surfaces of the samples and weighed. The water release of the 3D-printed concrete mixture was calculated according to the following equation:
K b = a b a · 100 % ,
where
Kb—is the volumetric coefficient of water bleeding;
a—is the initial volume of sample;
b—is the volume of settled sample.
Carbon footprint analysis was made by lifecycle assessment methodology, defined by ISO 14040 (https://www.zerocarbon.net.cn/index.php?m=home&c=View&a=index&aid=262, accessed on 16 January 2026) and ISO 14044 (https://www.bsigroup.com/en-GB/products-and-services/standards/iso-14044-life-cycle-assessment-requirements-and-guidelines/, accessed on 16 January 2026), and expressed as kg CO2-equivalent (CO2-eq). CO2 emissions were calculated using a cradle-to-gate approach (A1–A3 stages), including raw material extraction, material production, and manufacturing.
CO2 emissions of the raw material production of each 3D-printed concrete mixture were calculated according to the following equation:
P c f = m · E f r ,
where
Pcf—CO2 emission of the production 3D-printed concrete mixture, kg CO2-eq;
m—amount of raw material in the composition per 1 m3, kg;
Efr—emission factor of raw material, kg CO2-eq/kg (see Table 4).
Electricity consumption for the production of 1 m3 of each 3D-printed concrete mixture was calculated according to the following equation:
E c f = m · E f e ,
where
Ecf—CO2 emission of the electricity consumption, kg CO2-eq;
m—total amount of used electricity per 1 m3, kWh;
Efe—emission factor of electricity consumption, kg CO2-eq/kg (see Table 4).
Transportation of raw materials for 1 m3 production of each 3D-printed concrete mixture was calculated according to the following equation:
T c f = m · d · E f t ,
where
Tcf—CO2 emission of transportation, kg CO2-eq;
m—mass of raw material in the composition per m3, kg;
d—distance to production site, km;
Eft—emission factor of transportation, kg CO2-eq/kg (see Table 4).
The total cradle-to-gate carbon footprint for 1 m3 of each 3D-printed concrete mixture was calculated according to the following equation:
A c f = P c f + E c f + T c f ,
where
Pcf—CO2 emission of the production, kg CO2-eq;
Ecf—CO2 emission of the electricity consumption, kg CO2-eq;
Tcf—CO2 emission of the transportation, kg CO2-eq;

3. Results

3.1. Rheological Properties of 3D-Printed Concrete Mixtures

3.1.1. Flow Curves

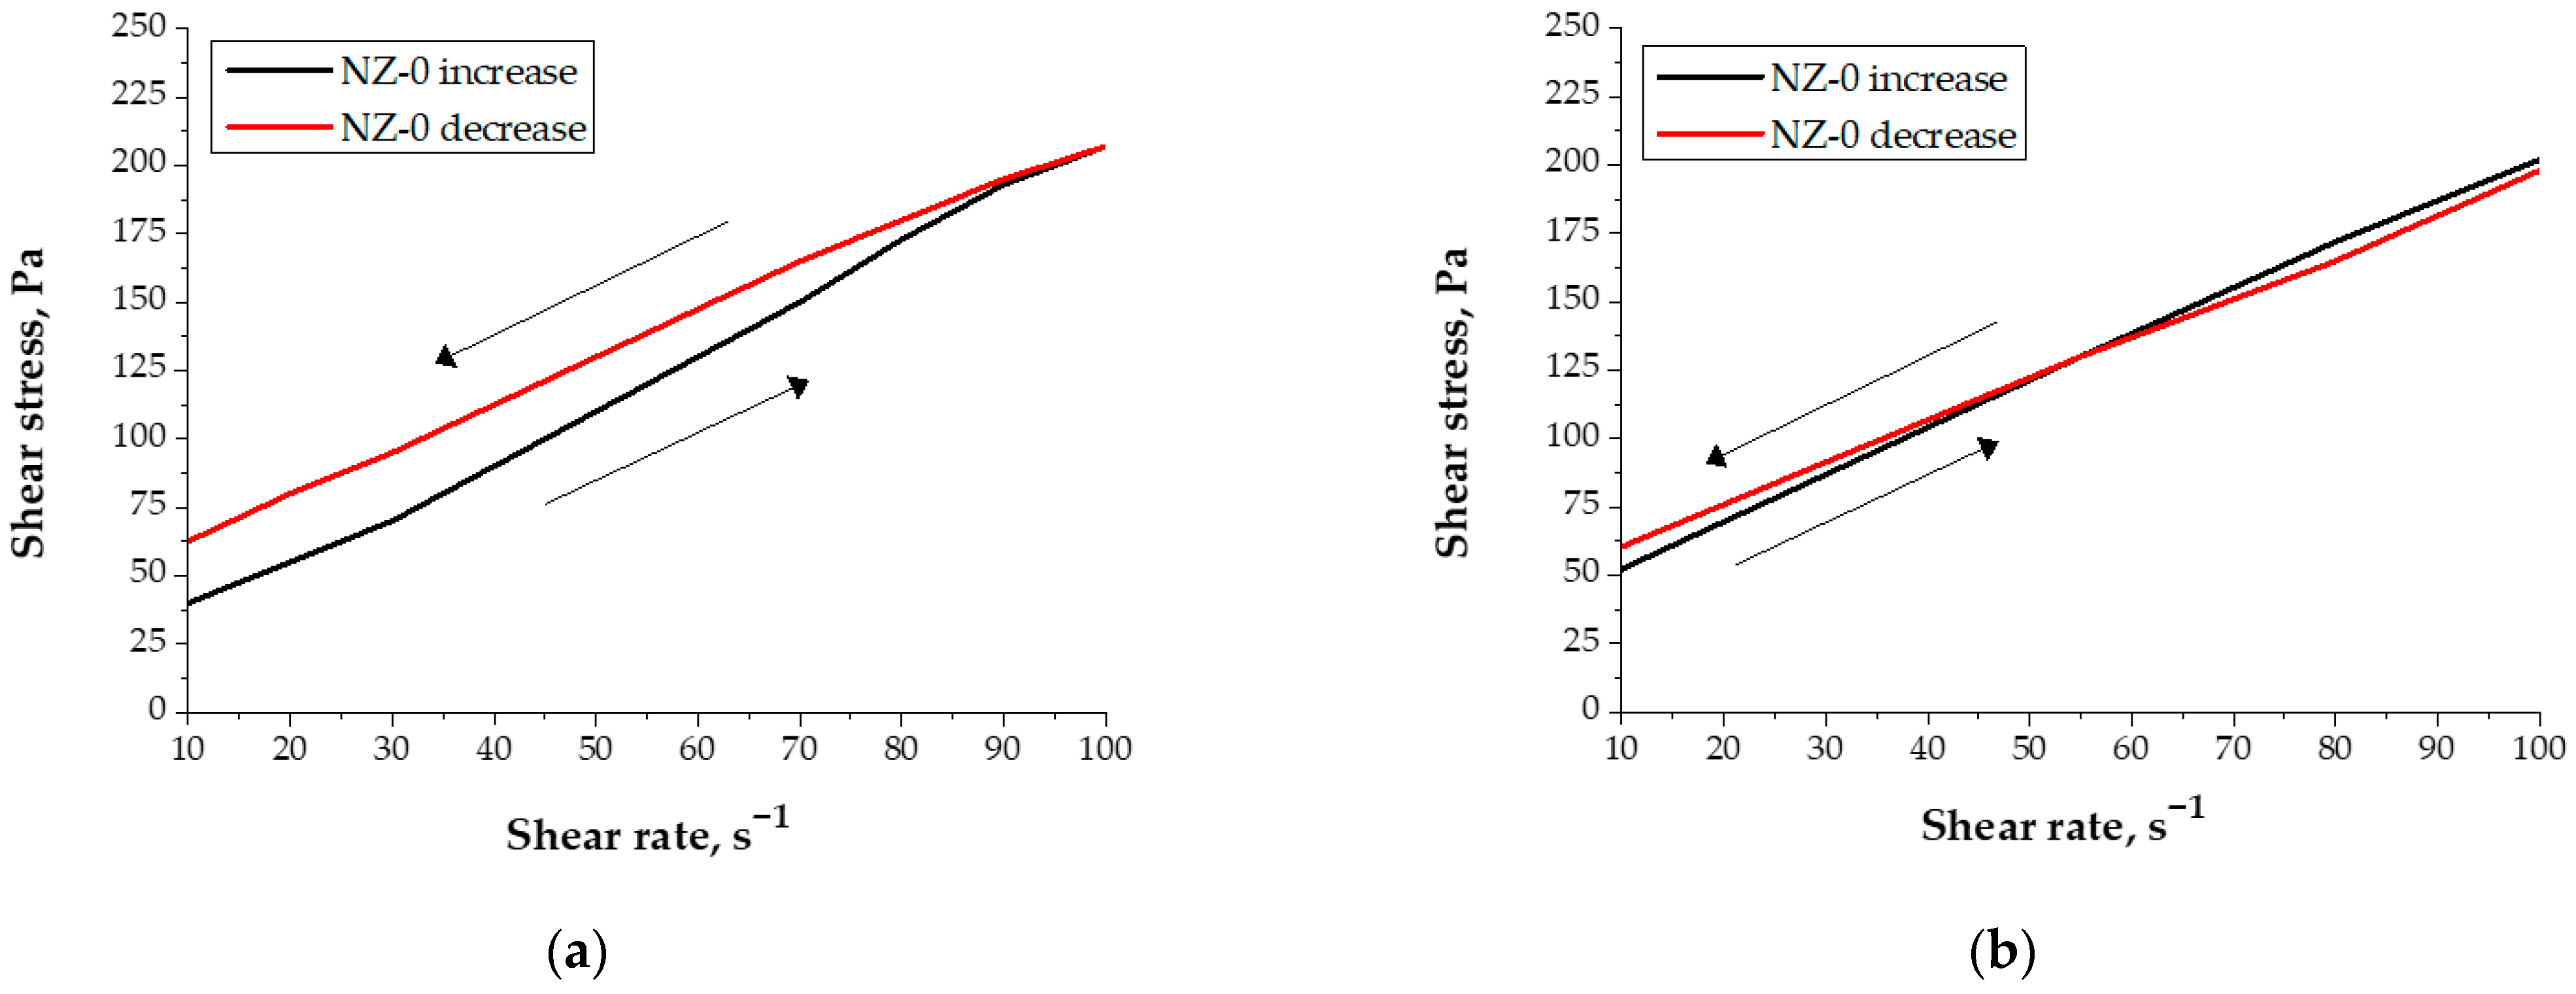
The flow curves of 3D-printed concrete mixtures without natural zeolite additive, measured 5 min after their preparation, almost match each other, after the increase and the decrease in shear rates (Figure 6a). These 3D-printed concrete mixtures can be considered non-thixotropic, and their viscosity almost does not depend on the shear rate. The ultimate shear stresses of 3D-printed concrete mixtures were from 39 Pa to 62 Pa, which were the suitable values for 3D printing technologies.
An even more precise tendency was observed in the 3D-printed concrete mixtures, measured 60 min after their preparation (Figure 6b). The ultimate shear stresses of 3D-printed concrete mixtures were from 52 Pa to 61 Pa.
Fundamentally, it can be stated that such 3D-printed concrete mixtures can partially support their shape and should not flow by themselves. Therefore, the new layer of the 3D-printed concrete mixture laid during the printing process should remain stable and could be only slightly deformed due to its own weight.
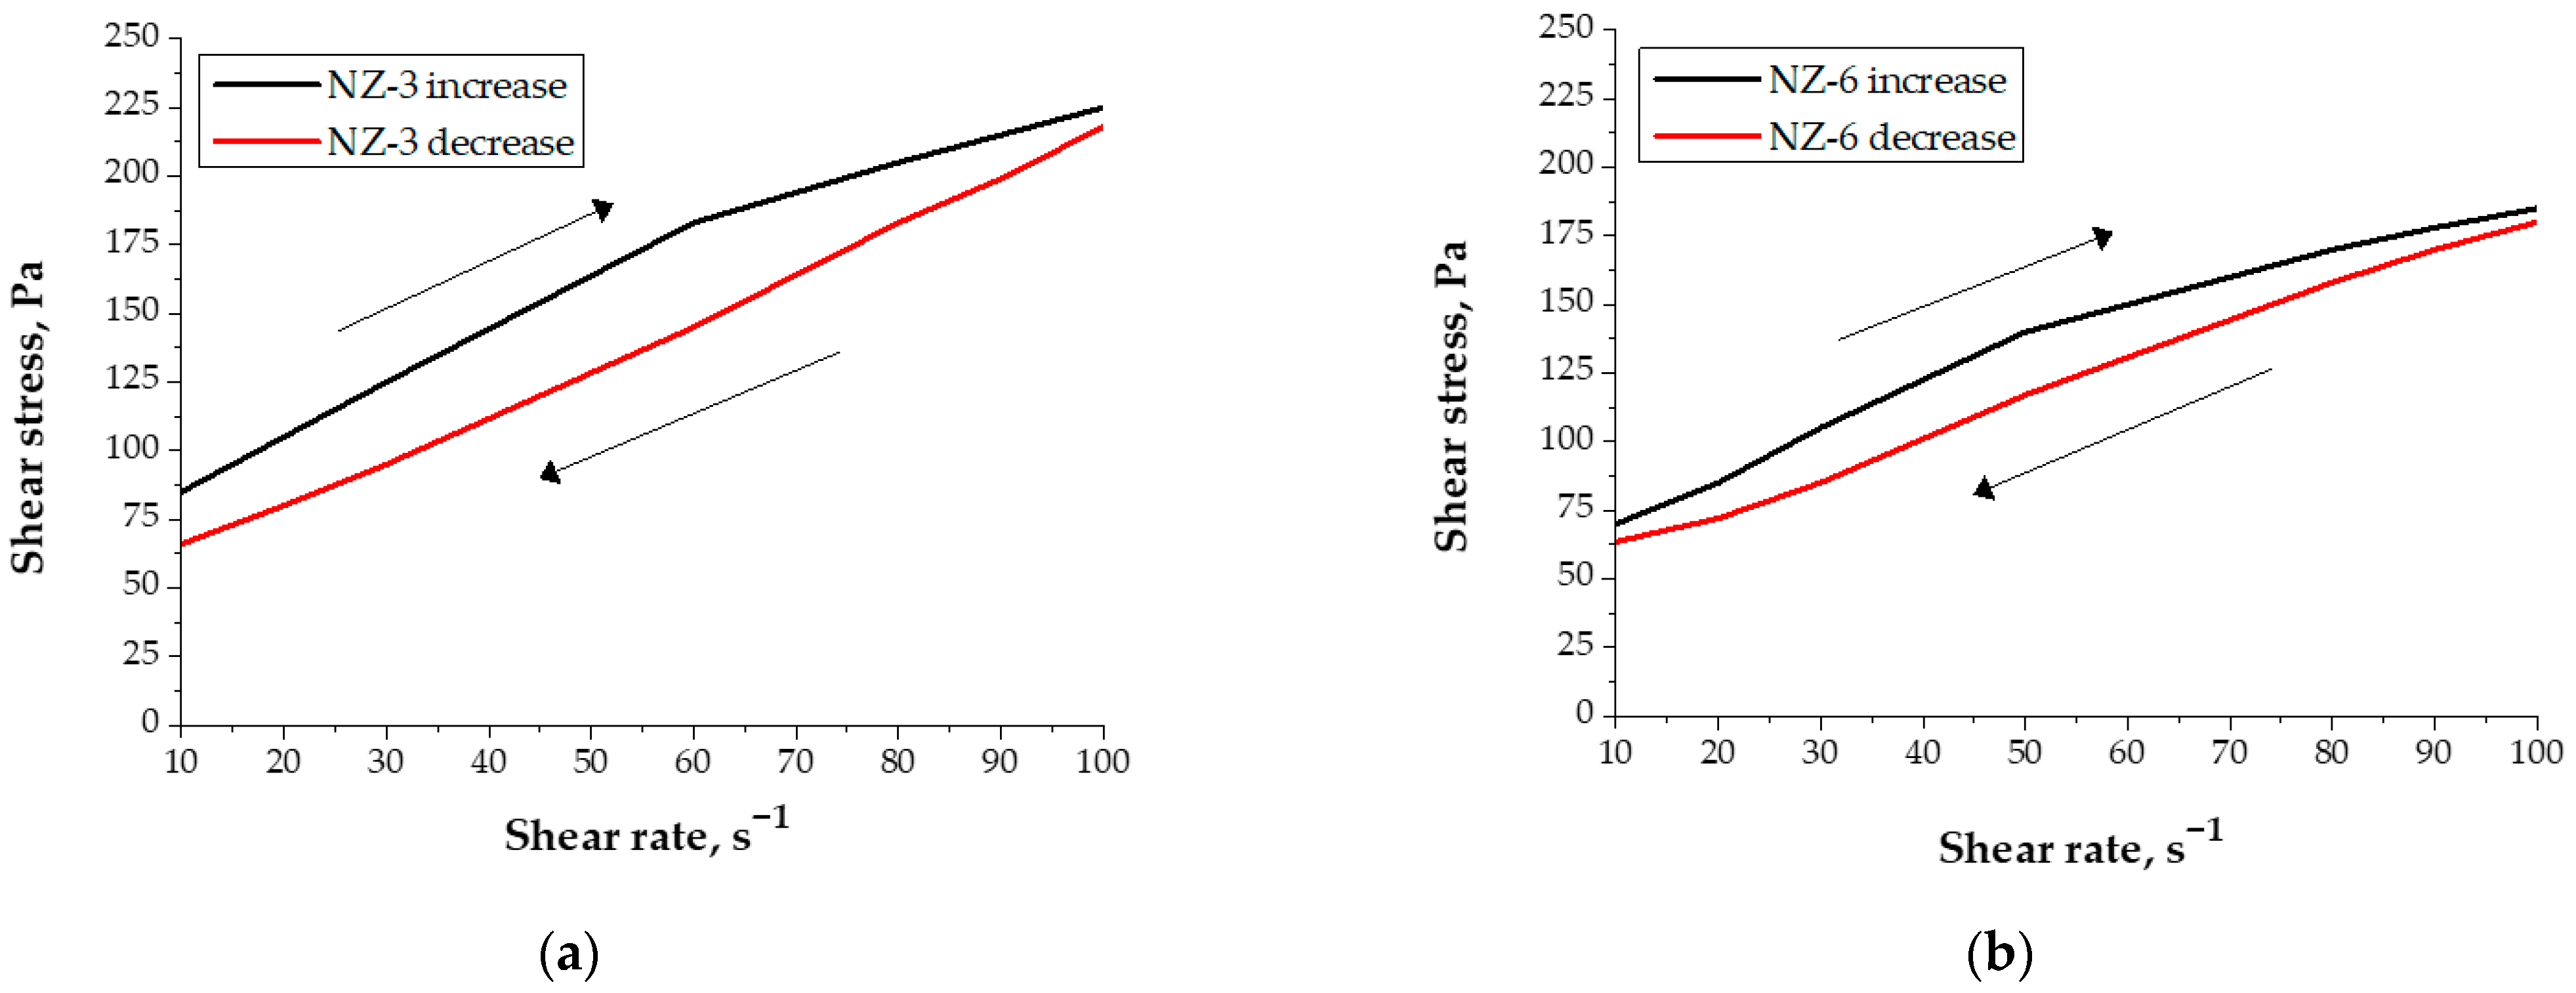
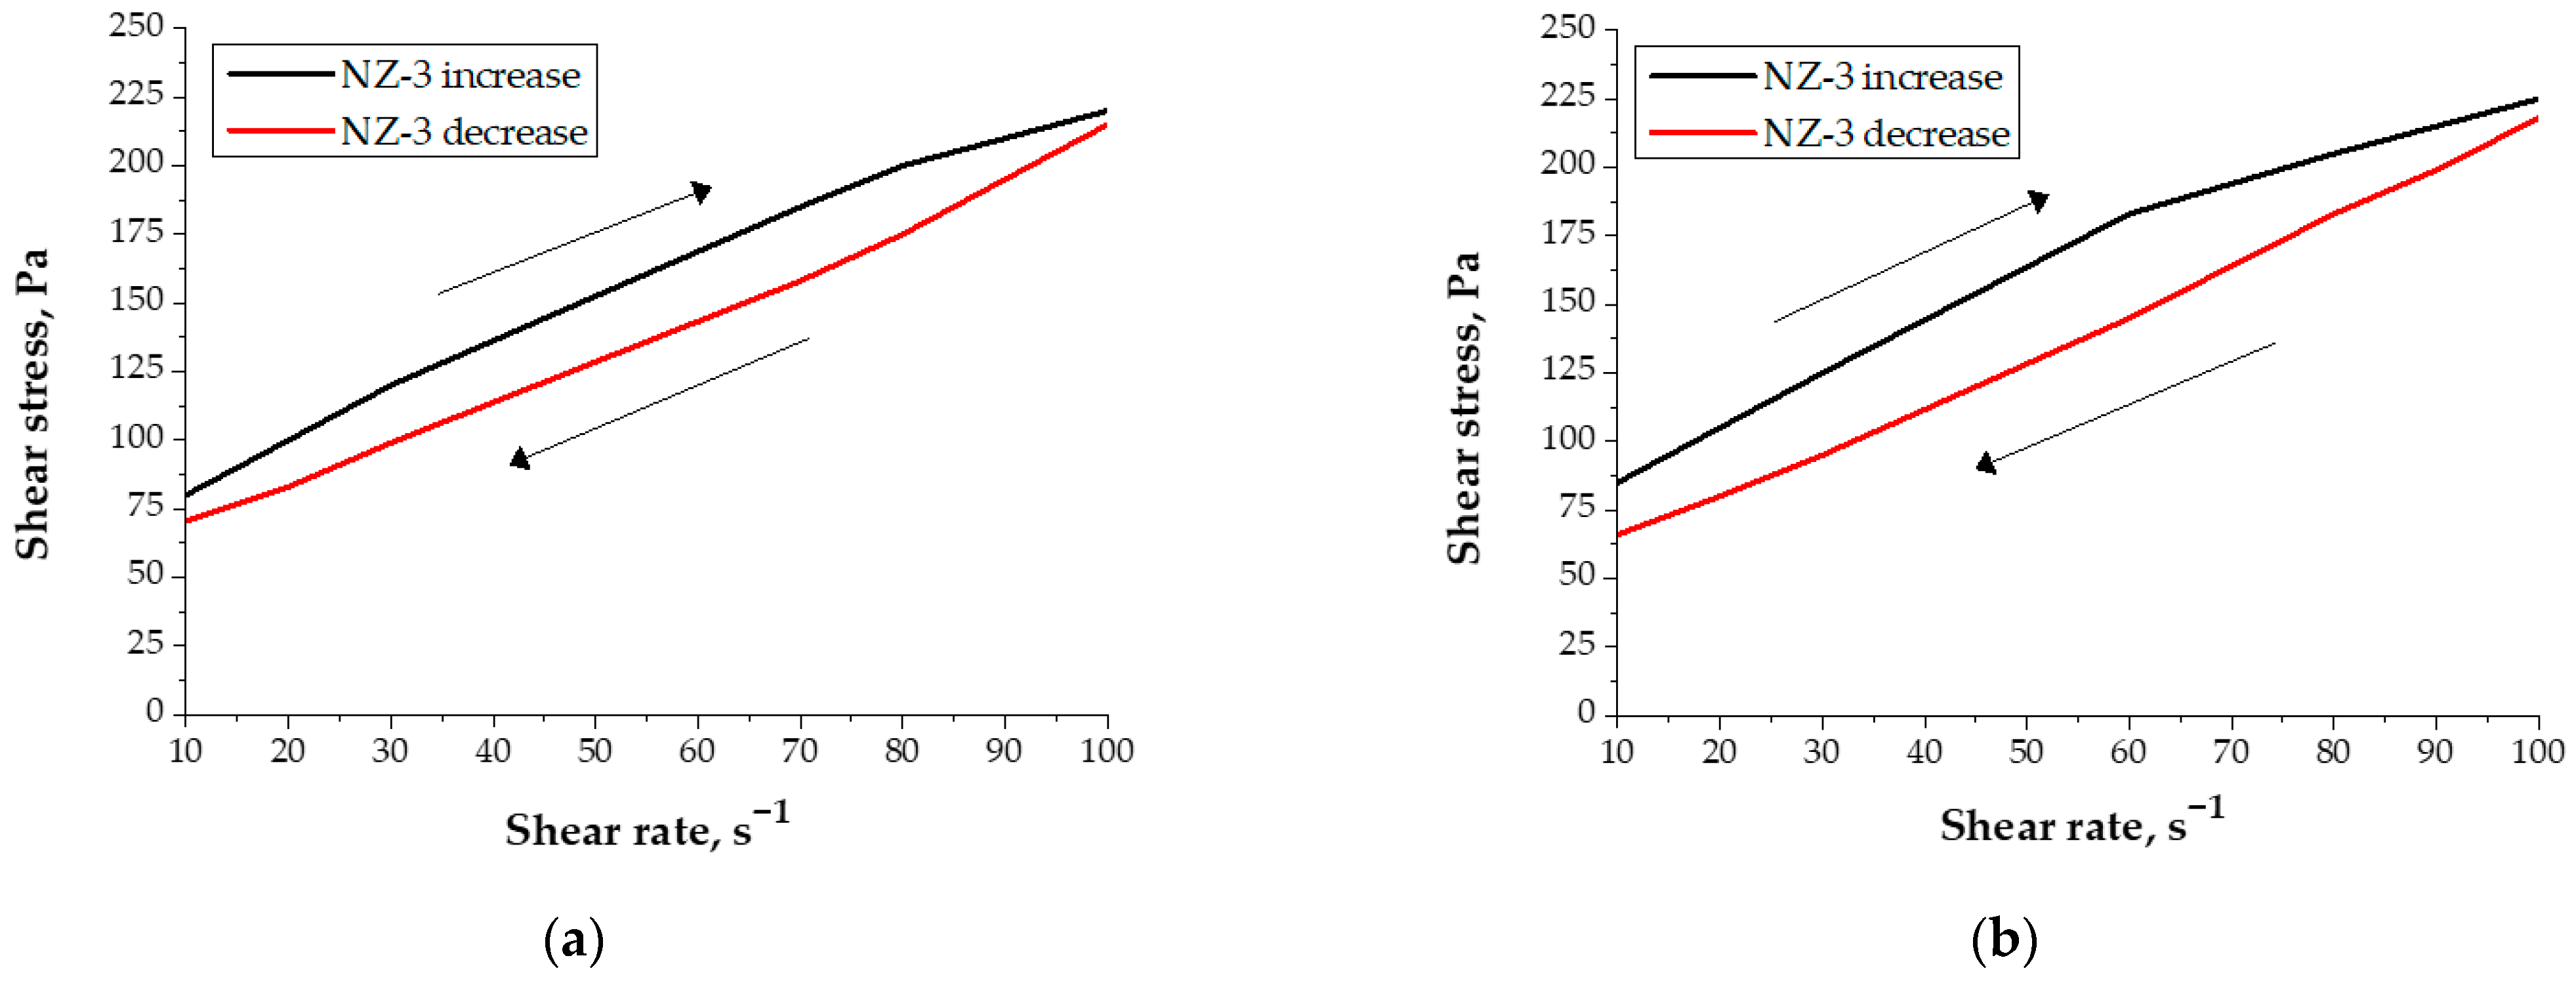
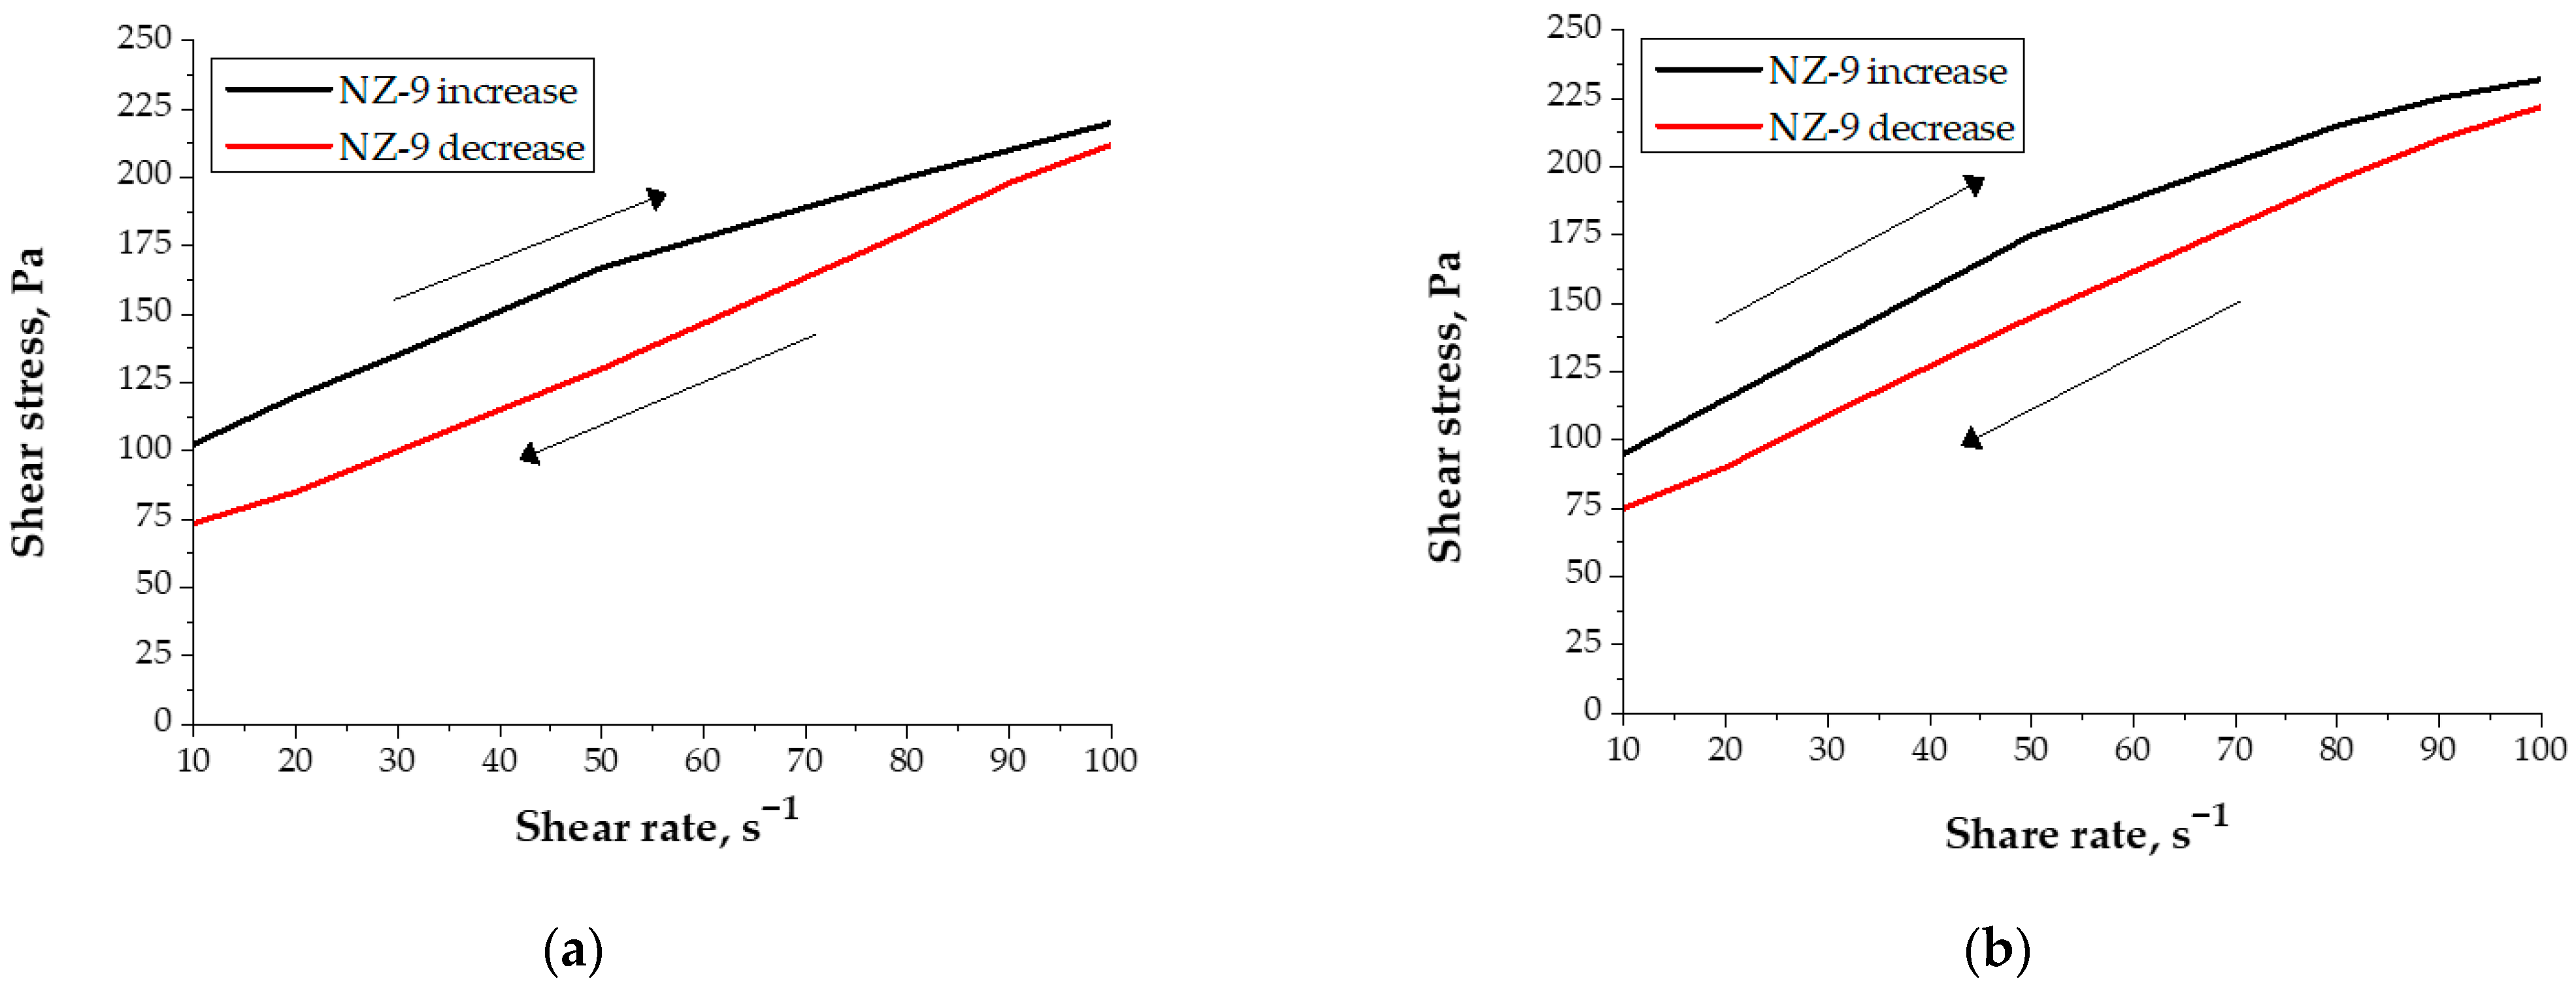
The flow curves of 3D-printed concrete mixtures with different amounts of natural zeolite additive, measured 5 min and 60 min after their preparation, are presented in Figure 7, Figure 8 and Figure 9. The flow curves of 3D-printed concrete mixture remain of the same nature, as water content was increased with the increase in the amount of natural zeolite additive (see Table 3) in order to ensure its constant consistency. The natural zeolite additives in the smaller amounts (3% or 6%) slightly increased the thixotropy of 3D-printed concrete mixtures, compared to the 3D-printed concrete mixtures without this additive.
The natural zeolite additive (3%) decreased the ultimate shear stresses of the 3D-printed concrete mixtures (measured 5 min after their preparation) from 81 Pa to 71 Pa, after the decrease in shear rate (Figure 7a). The same tendency was observed in the 3D-printed concrete mixtures, measured 60 min after their preparation (Figure 7b). The ultimate shear stresses of 3D-printed concrete mixtures reduced from 87 Pa to 66 Pa, after the decrease in shear rate.
The same tendency was observed in the 3D-printed concrete mixtures with 6% of natural zeolite additive (measured 5 min after their preparation). The ultimate shear stresses decreased from 76 Pa to 62 Pa, after the decrease in shear rate (Figure 8a). The ultimate shear stresses of the 3D-printed concrete mixtures with 6% natural zeolite additive, measured 60 min after their preparation, reduced from 70 Pa to 64 Pa, after the decrease in the shear rate (Figure 8b).
The natural zeolite additives in the highest amount (9%) could increase the thixotropy of 3D-printed concrete mixtures more drastically, compared to the 3D-printed concrete mixtures with smaller amounts (3% or 6%) of this additive. The ultimate shear stresses decreased from 103 Pa to 74 Pa, after the decrease in shear rate (Figure 9a) in the 3D-printed concrete mixtures with natural zeolite additive (9%), measured 5 min after their preparation. The changes described above also occur in the 3D-printed concrete mixtures with natural zeolite additive (9%), measured 60 min after their preparation. The ultimate shear stresses decreased from 95 Pa to 75 Pa, after the decrease in shear rate (Figure 9b).

3.1.2. Yield Stress

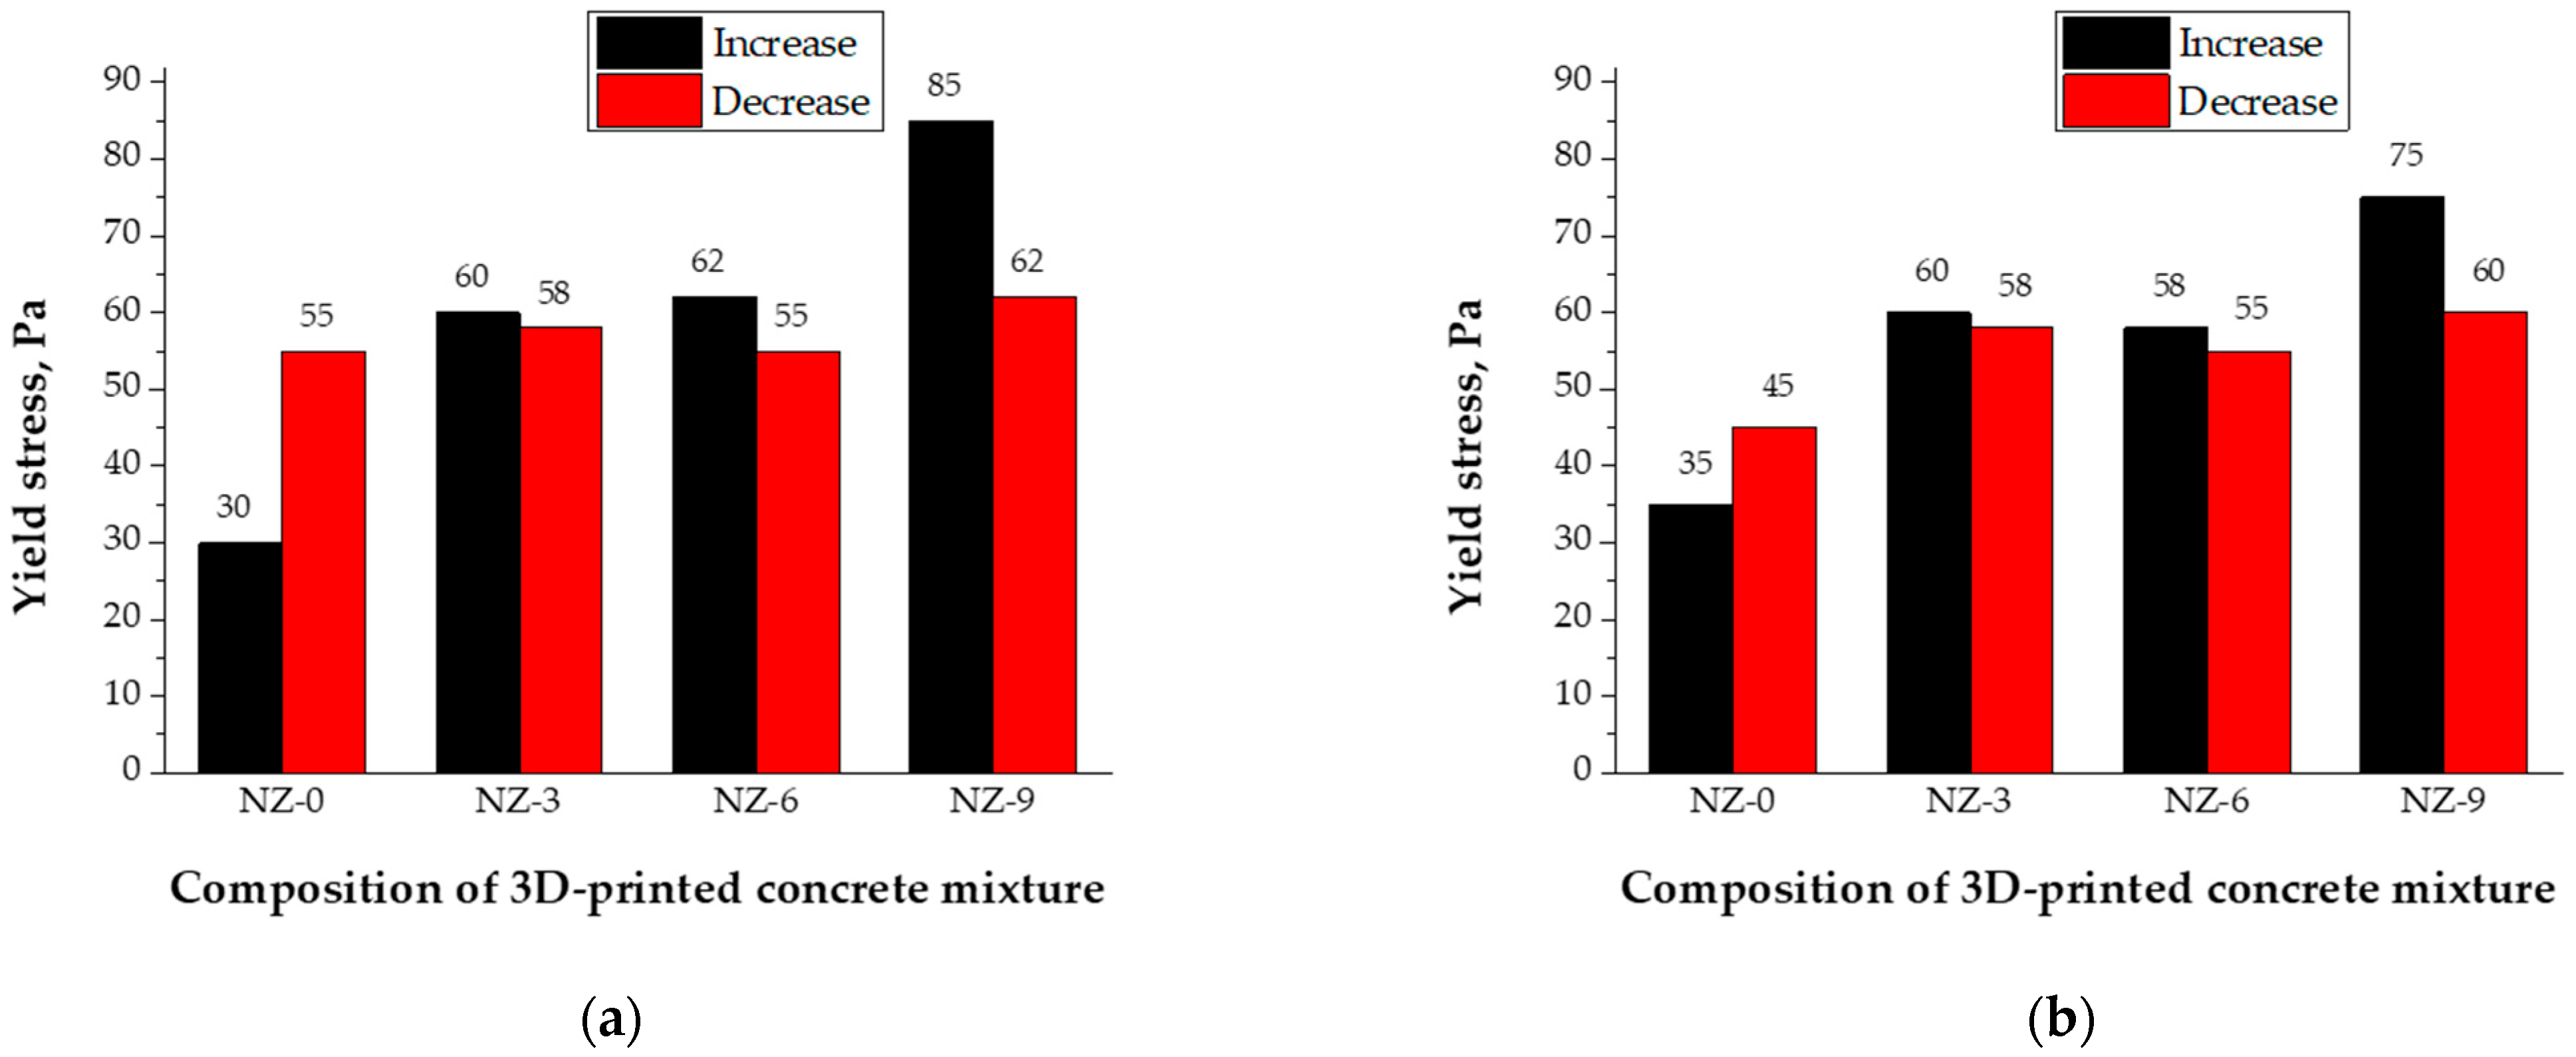
The yield stress of 3D-printed concrete mixtures with lower amounts of natural zeolite additive (from 3% to 6%), measured 5 min after preparation, increased two-fold (100–107%)—from 30 Pa to 60 Pa or 62 Pa (black bars), when the shear rate was increased (Figure 10a). The yield stress of 3D-printed concrete mixtures, measured 5 min after preparation, increased by almost three times (183%)—from 30 Pa to 85 Pa (also black bars), with the highest amount of natural zeolite additive (9%), when the shear rate was increased (Figure 10a).
The yield stress of 3D-printed concrete mixtures, measured 5 min after preparation, remained unchanged (increased only from 5% to 0%), with an increase in the amount of natural zeolite additive (from 3% to 6%), and varied from 55 Pa to 58 Pa (red bars), when the shear rate was decreased (Figure 10a). The yield stress of 3D-printed concrete mixture, measured 5 min after preparation, increased (13%)—from 55 Pa to 62 Pa (also red bars), with the highest amount of natural zeolite additive (9%), when the shear rate was decreased (Figure 10a).
The results of the yield stress of 3D-printed concrete mixtures, measured 60 min after preparation, had the same tendency as the results 5 min after preparation. The yield stress of 3D-printed concrete mixtures with lower amounts of natural zeolite additive (from 3% to 6%), measured 60 min after preparation, increased (71–66%)—from 35 Pa to 60 Pa or 58 Pa (black bars), when the shear rate was increased (Figure 10b).
The yield stress of 3D-printed concrete mixtures, measured 60 min after preparation, increased more than two-fold (114%)—from 35 Pa to 75 Pa (also black bars), with the highest amount of natural zeolite additive (9%), when the shear rate was increased (Figure 10b).
The yield stress of 3D-printed concrete mixtures, measured 60 min after preparation, increased (from 29% to 22%), with an increase in the amount of natural zeolite additive (from 3% to 6%), and varied from 45 Pa to 58 Pa or 55 Pa (red bars), respectively, when the shear rate was decreased (Figure 10b). The yield stress of the 3D-printed concrete mixture, measured 60 min after preparation, increased (33%)—from 45 Pa to 60 Pa (also red bars), with the highest amount of natural zeolite additive (9%), when the shear rate was decreased (Figure 10b).
Higher yield stresses of 3D-printed concrete mixtures allow an increase in their stability. In practical applications, it means that taller and thinner 3D structures could be printed without a collapse.

3.1.3. Plastic Viscosity

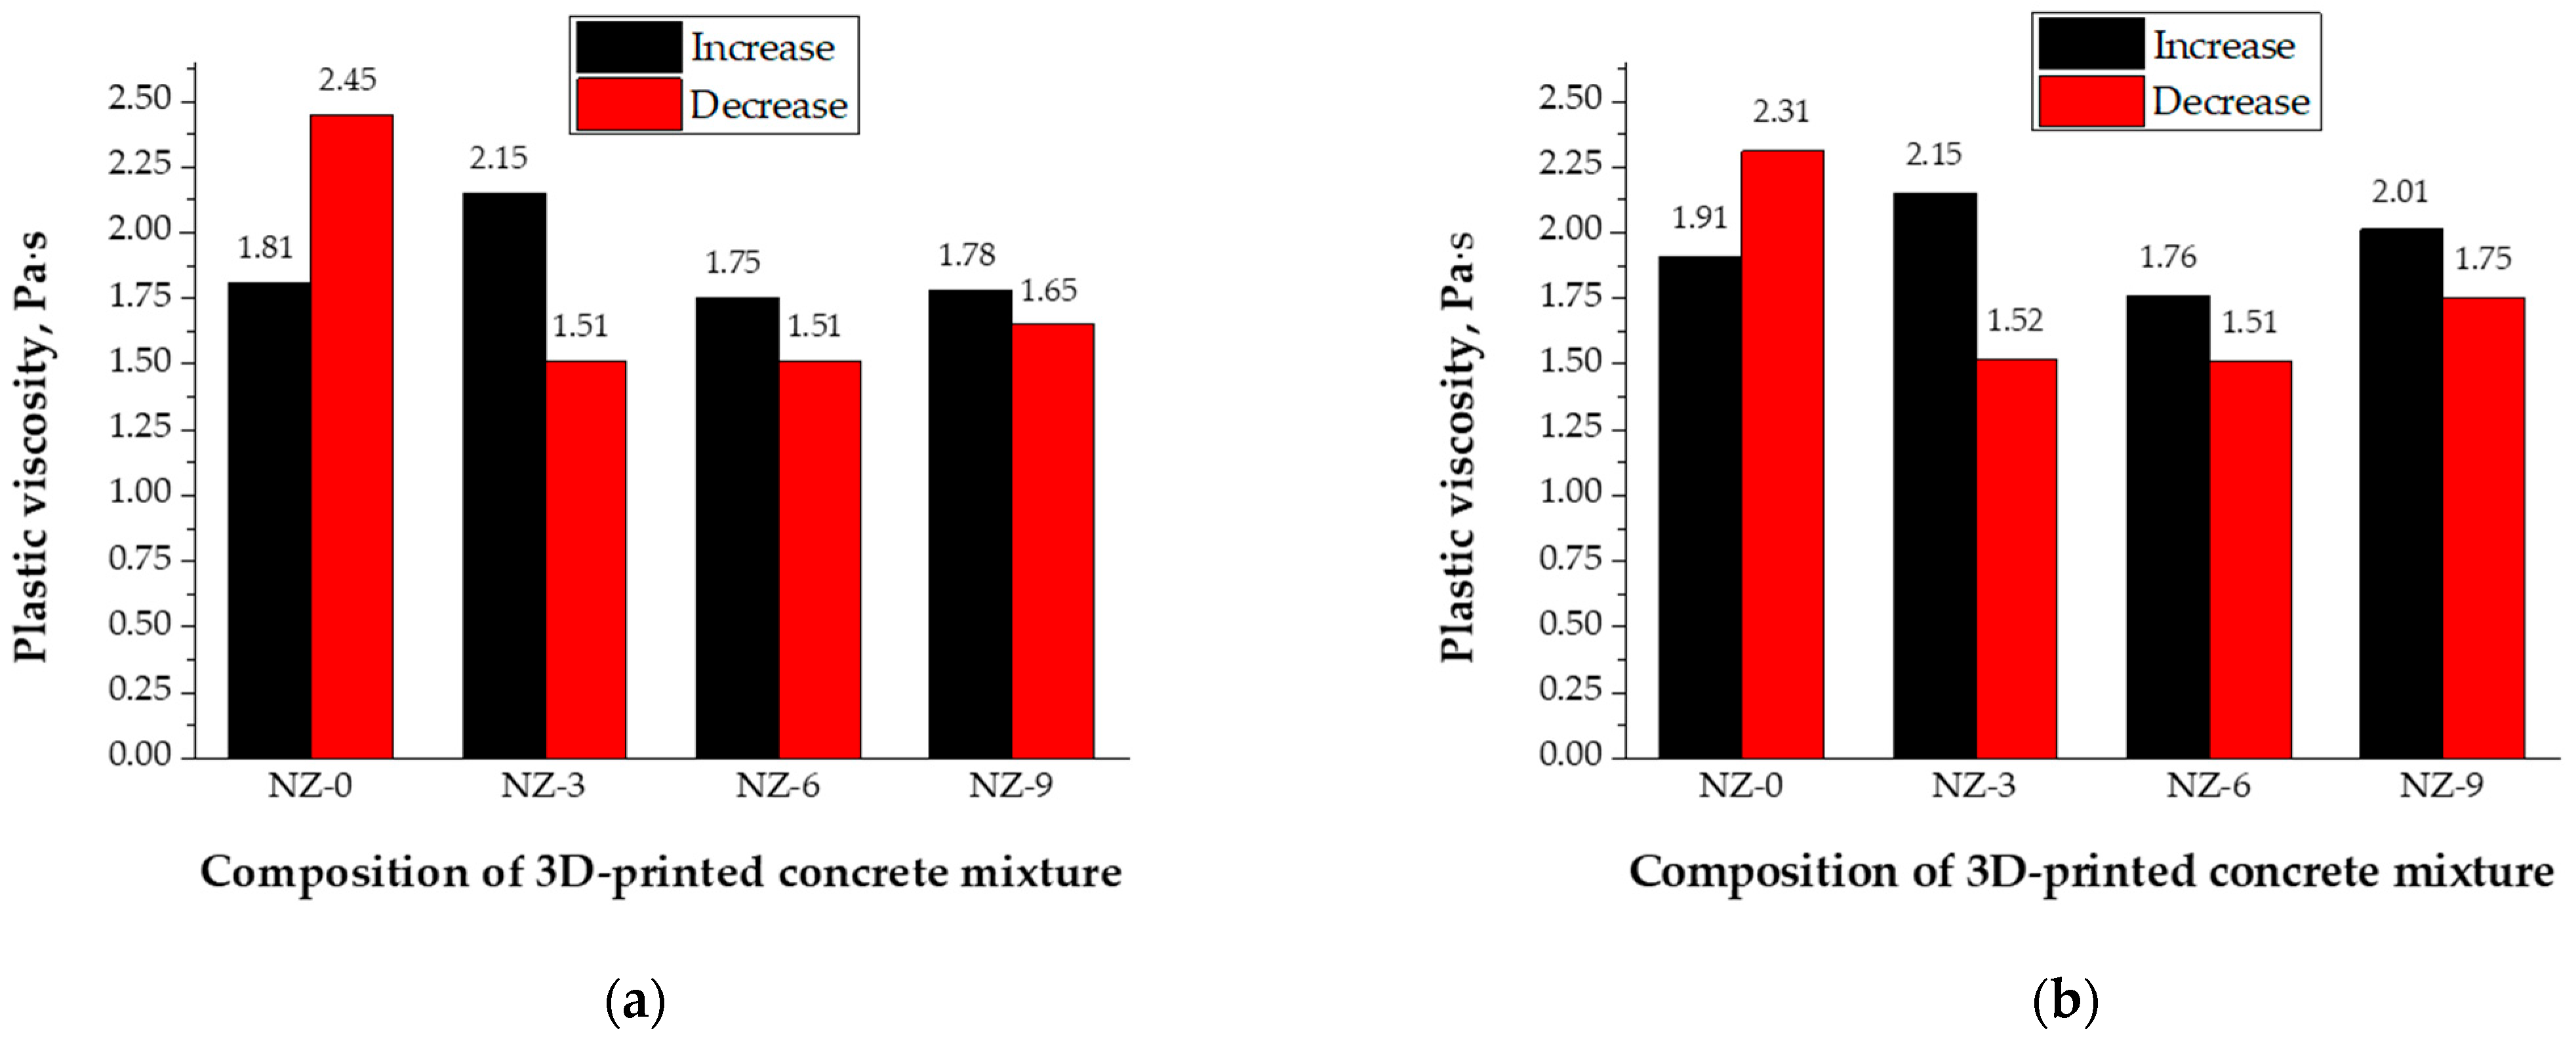
The plastic viscosity of 3D-printed concrete mixtures with the lowest amount of natural zeolite additive (3%), measured 5 min after preparation, increased about 19%—from 1.81 Pa∙s to 2.15 Pa∙s (black bars), when the shear rate was increased (Figure 10a). The plastic viscosity of 3D-printed concrete mixtures, measured 5 min after preparation, slightly decreased (from 3% to 2%) with an increase in the amount of natural zeolite additive (from 6% to 9%), and varied from 1.75 Pa∙s to 1.78 Pa∙s (black bars), when the shear rate was increased (Figure 11a).
The plastic viscosity of 3D-printed concrete mixtures, measured 5 min after preparation, decreased significantly (from 62% to 48%) with an increase in the amount of natural zeolite additive (from 3% to 9%), and varied from 1.51 Pa∙s to 1.65 Pa∙s (red bars) when the shear rate was decreased (Figure 11a)).
The plastic viscosity of 3D-printed concrete mixtures with the lowest amount of natural zeolite additive (3%), measured 60 min after preparation, also increased about 13%—from 1.91 Pa∙s to 2.15 Pa∙s (black bars), when the shear rate was increased (Figure 10b). The plastic viscosity of 3D-printed concrete mixtures, measured 60 min after preparation, decreased (9%) or increased (5%) with an increase in the amount of natural zeolite additive (from 6% to 9%), and varied from 1.76 Pa∙s to 2.01 Pa∙s (black bars), when the shear rate was increased (Figure 11b).
The plastic viscosity of 3D-printed concrete mixtures, measured 60 min after preparation, also decreased significantly (from 53% to 32%) with an increase in the amount of natural zeolite additive (from 3% to 9%), and varied from 1.51 Pa∙s to 1.75 Pa∙s (also red bars) when the shear rate was decreased (Figure 11b).
The lower plastic viscosity of 3D-printed concrete mixture in practical applications can help to improve its flowability, when (with the help of a pump) it is transported to the printing head of a 3D printer. The natural zeolite additive can improve the placement of concrete mixture during the 3D concrete printing process. It should be mentioned that the plastic viscosity of the 3D-printed concrete mixtures was almost constant (did not increase), even 60 min after their preparation. This ability ensures better placement during the 3D printing processes.

3.1.4. Shear-Thinning/Thickening Index

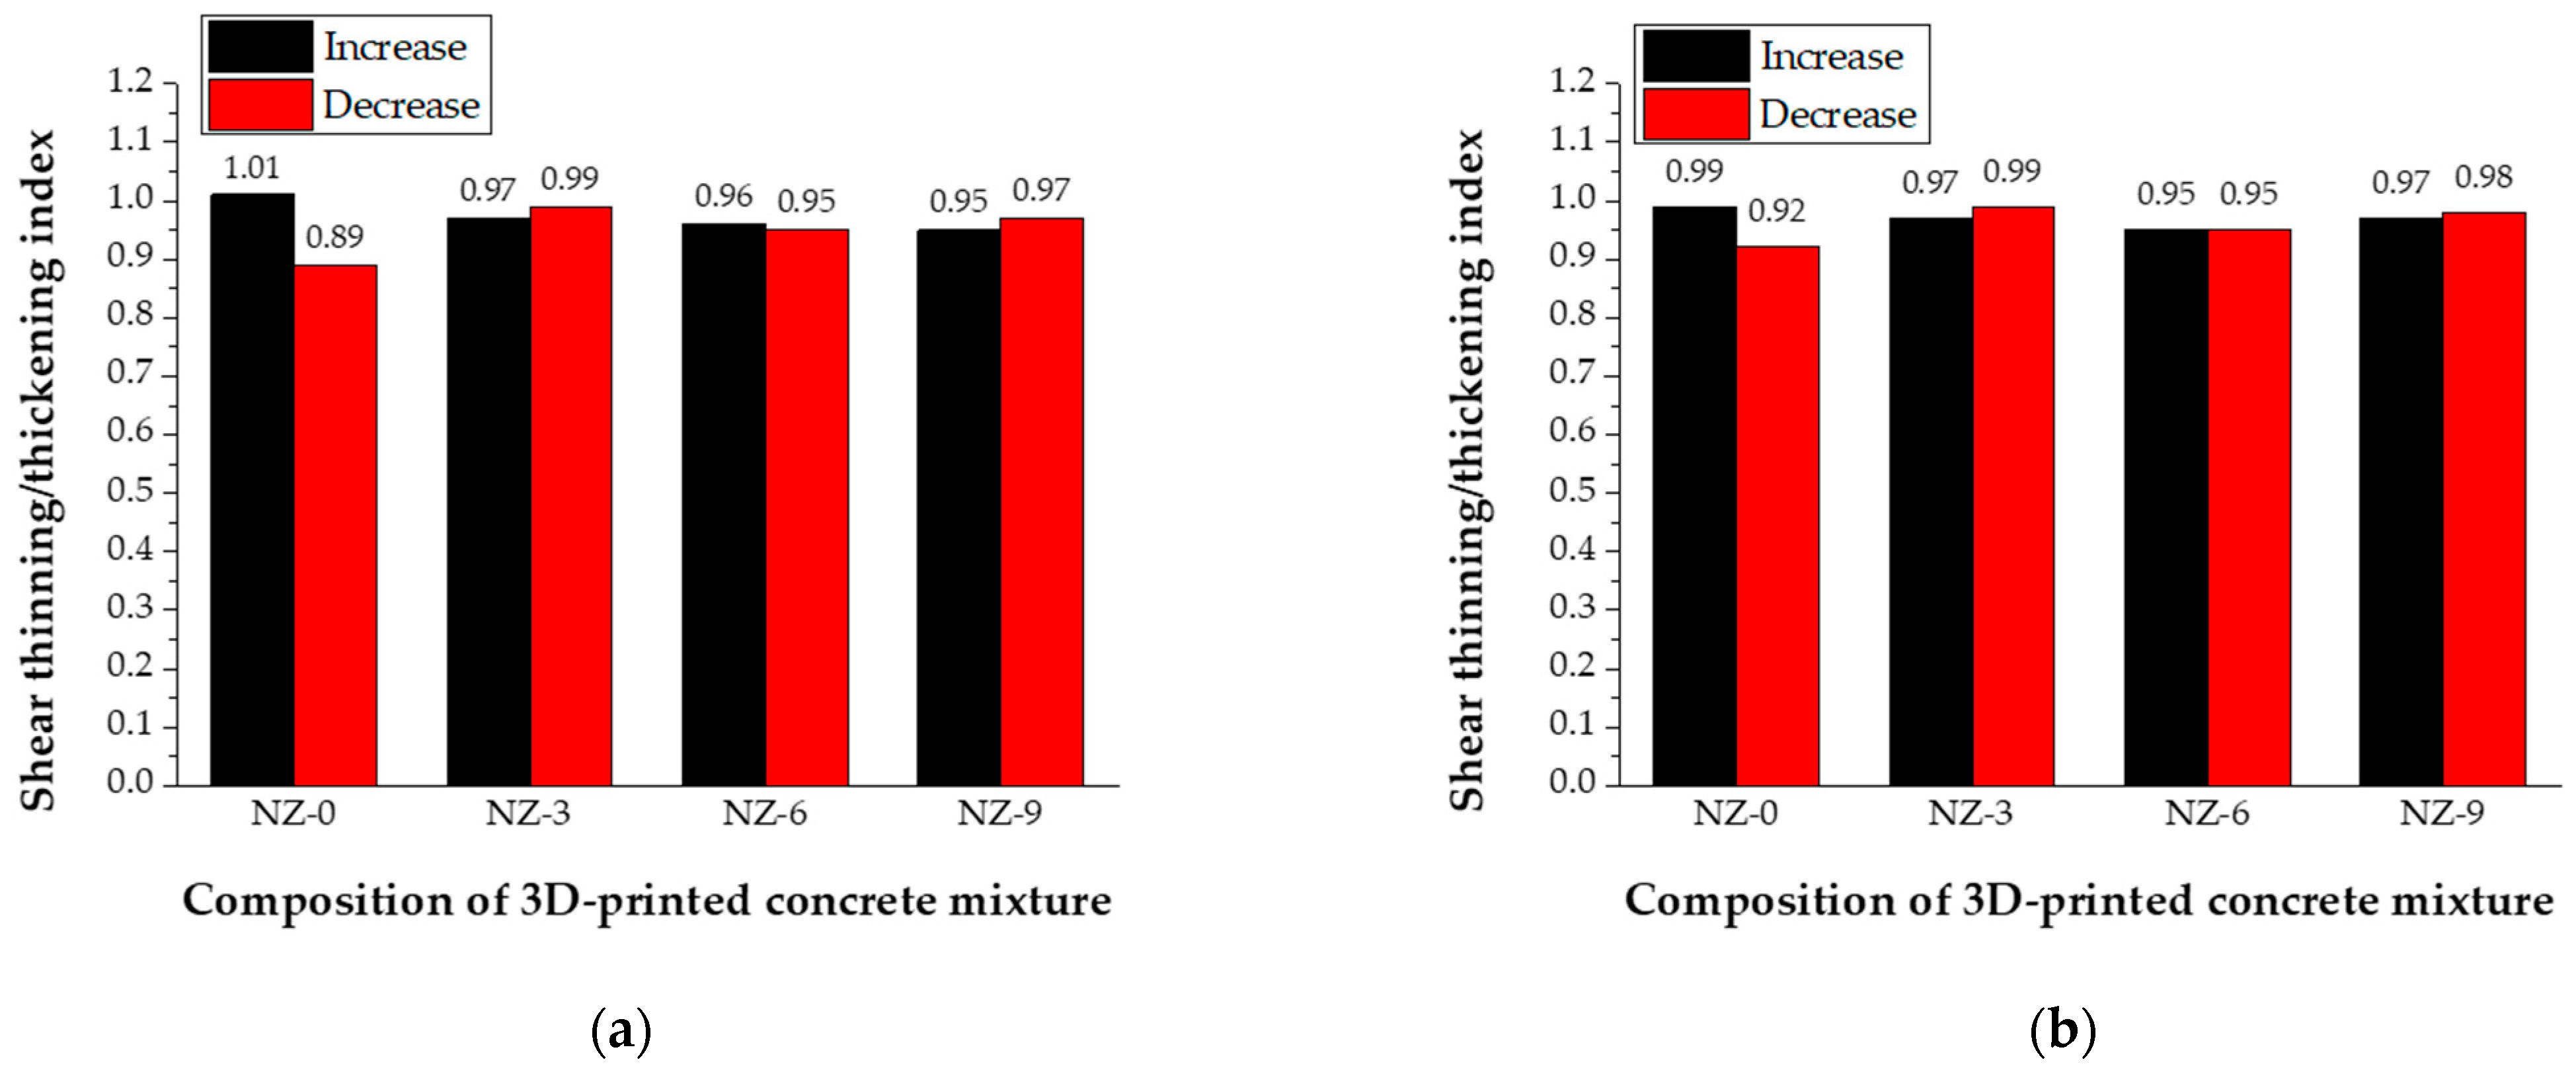
The increased amount of natural zeolite additive practically did not change the shear-thinning/thickening index of the 3D-printed concrete mixtures, both 5 min and 60 min after preparation, when the shear rate was increased or decreased (Figure 12).
The shear-thinning/thickening index of 3D-printed concrete mixtures, measured 5 min after preparation, decreased insignificantly (from 4% to 6%) with an increase in the amount of natural zeolite additive (from 3% to 9%), and varied from 0.97 to 0.95 (black bars), when the shear rate was increased (Figure 12a).
The shear-thinning/thickening index of 3D-printed concrete mixtures, measured 5 min after preparation, increased insignificantly (from 11% to 7%) with an increase in the amount of natural zeolite additive (from 3% to 9%), and varied from 0.95 to 0.99 (red bars), when the shear rate was decreased (Figure 12a). The shear-thinning/thickening index of 3D-printed concrete mixtures, measured 60 min after preparation, also decreased insignificantly (from 2% to 4%) with an increase in the amount of natural zeolite additive (from 3% to 9%), and varied from 0.95 to 0.97 (also black bars), when the shear rate was increased (Figure 12b).
The shear-thinning/thickening index of 3D-printed concrete mixtures, measured 60 min after preparation, also increased insignificantly (from 8% to 3%) with an increase in the amount of natural zeolite additive (from 3% to 9%), and varied from 0.99 to 0.95 (also red bars), when the shear rate was decreased (Figure 12b).
The measurements which were performed indicate the stability of the shear-thinning/thickening index of 3D-printed concrete mixtures as it remains close to 1. These mixtures exhibit nearly Newtonian behavior with insignificant shear-thinning/thickening effects, regardless of the amount of natural zeolite additive or time of preparation. These mixtures exhibit non-thixotropic behavior and the results corelate well with the previously mentioned changes in the yield stress and plastic viscosity of the 3D-printed concrete mixtures with different amounts of natural zeolite additive.

3.2. Water Bleeding of 3D-Printed Concrete Mixtures

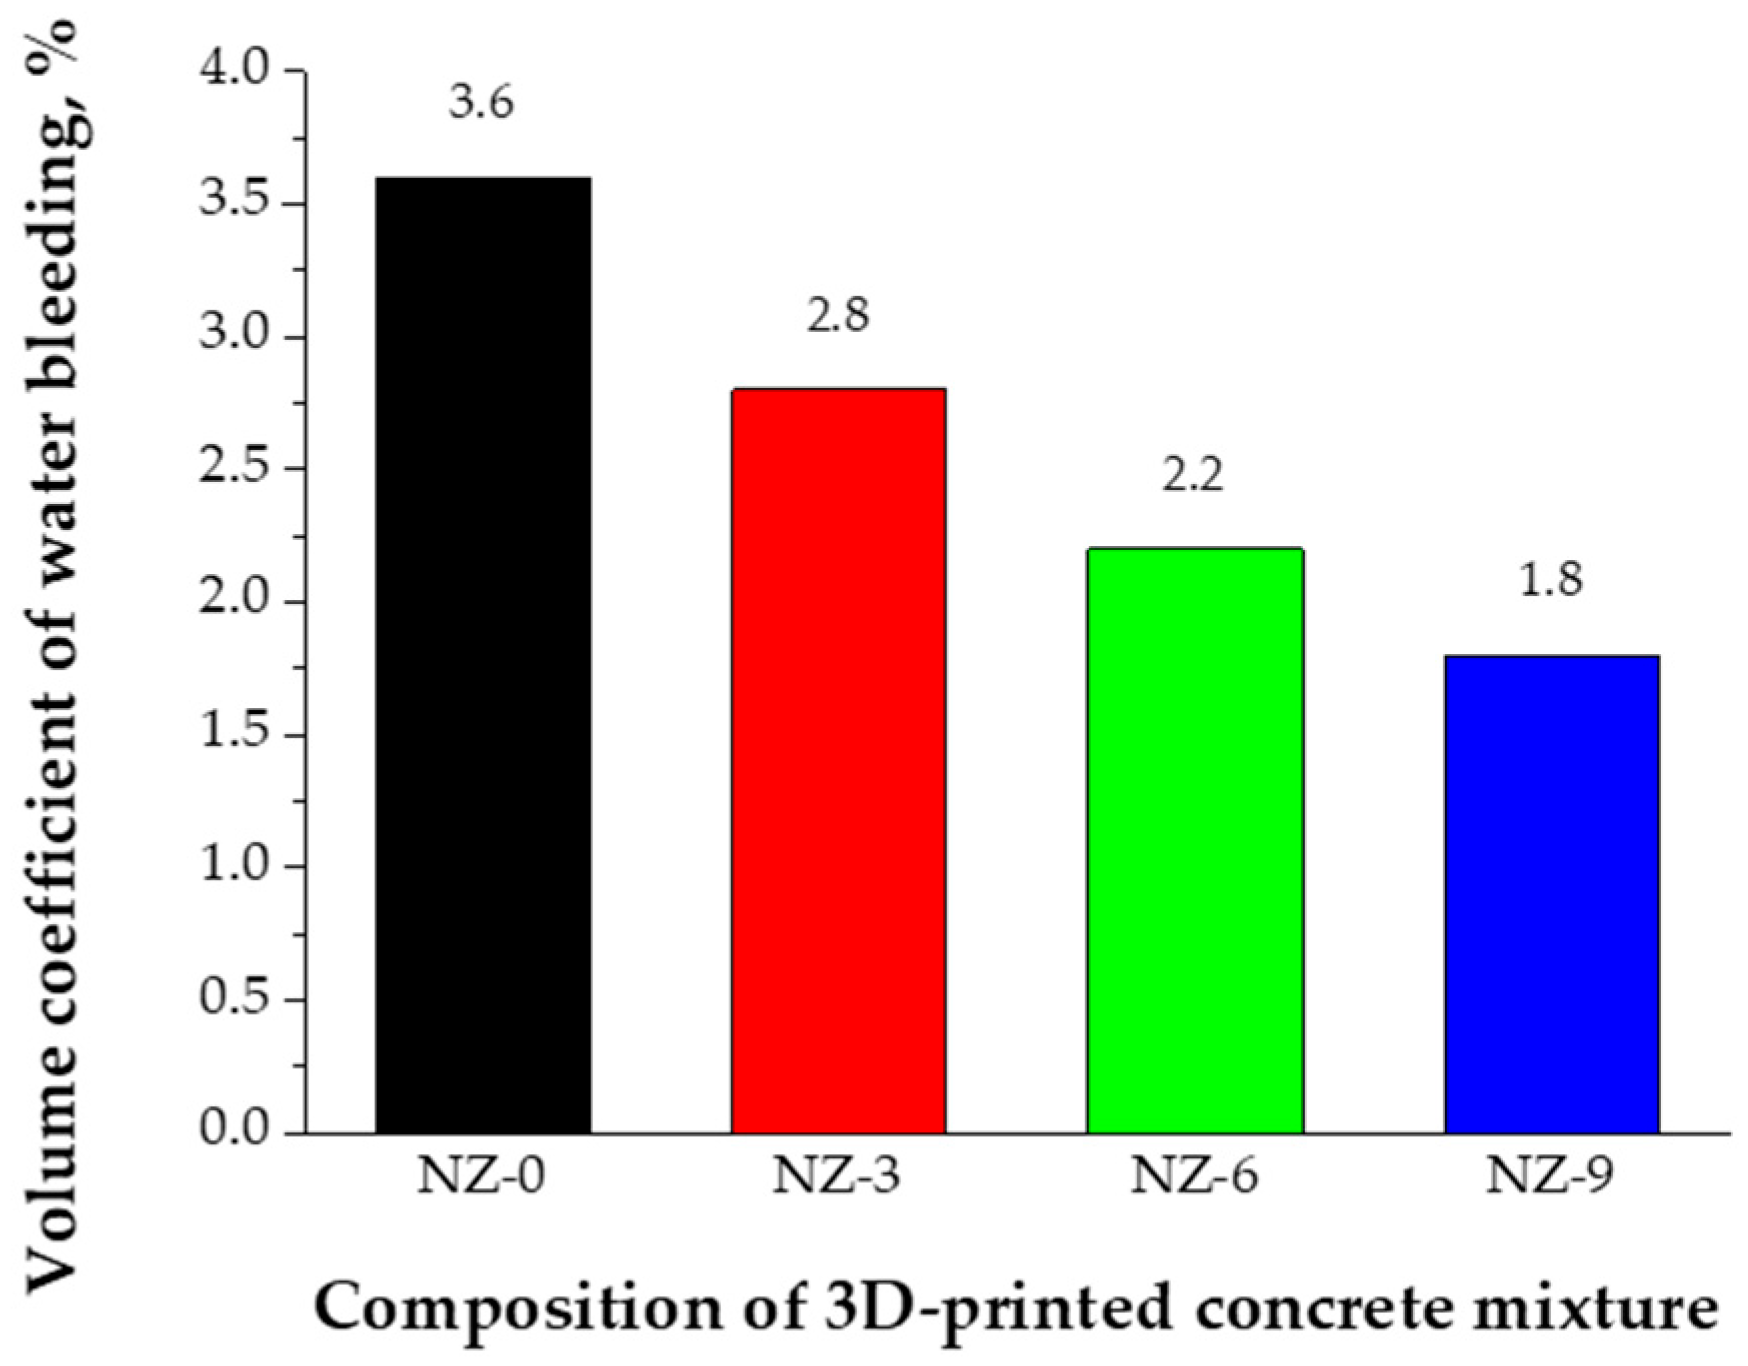
The research results have shown that natural zeolite additive in all cases reduced the water separation from the 3D-printed concrete mixtures (Figure 13). The maximum volume coefficient of water bleeding (3.6%) was obtained for 3D-printed concrete mixtures without natural zeolite additive. A decrease in the volume coefficient of water bleeding from 2.8% to 1.8% was observed with an increase in the amount of natural zeolite additive in 3D-printed concrete mixtures from 3% to 9%. It was from 0.8% to 1.8% lower, compared to the results of 3D-printed concrete mixture without natural zeolite additive. In principle, it can be stated that the natural zeolite additive can improve the stability of the mixtures during the 3D printing processes.

3.3. Carbon Footprint of 3D-Printed Concrete Mixtures

The CO2 emission factors of the used raw materials were obtained from ICE Database (v3) [85] and are presented in Table 4. The emission factors of electricity and transportation are presented in Table 5.
Table 4. CO2 emission factors of used raw materials.
Raw Materials Used in 3D-Printed Concrete Mixtures
Portland CementWashed SandNatural ZeoliteSuperplasticizerWater
Emission factor, kg CO2-eq/kg [85]0.93000.00500.02002.50000.0003
Table 5. Emission factors for electricity and transportation.
ElectricityTransportation
Emission factor, kg CO2-eq/kWh [86]0.2500-
Emission factor, kg CO2-eq/ton-km [87]-0.1000
Electricity consumption for 1 m3 was as follows: mixing (7 kWh), pump operation (5 kWh), robotic gantry (4 kWh), and control systems (2 kWh).
The distances for the raw material transportation to the construction site located in Vilnius (Lithuania) were as follows: Portland cement (236 km), washed sand (100 km), natural zeolite additive (550 km), superplasticizer (1350 km), and tap water (0 km).
Calculations have shown that the total amount of CO2 emissions, generated only from the production of raw materials, decreased with the increase in natural zeolite additive (see Table 6). It decreased from 726 kg CO2-eq (mixture without natural zeolite additive) to 700 kg CO2-eq, 642 kg CO2-eq, or even 602 kg CO2-eq, with the increase in the amount of natural zeolite additive from 3% to 9%. It was from 4% to 20% lower, compared to the CO2 emissions of the mixture without natural zeolite additive.
The electricity consumption for the production of 1 m3 of each 3D-printed concrete mixture was the same—18 kWh, leading to the total amount of CO2 emissions 4.5 kg CO2-eq.
Calculations have shown that partial replacement of natural zeolite additive has practically no influence on the total amount of CO2 emissions related to the transportation of the raw materials (see Table 7).
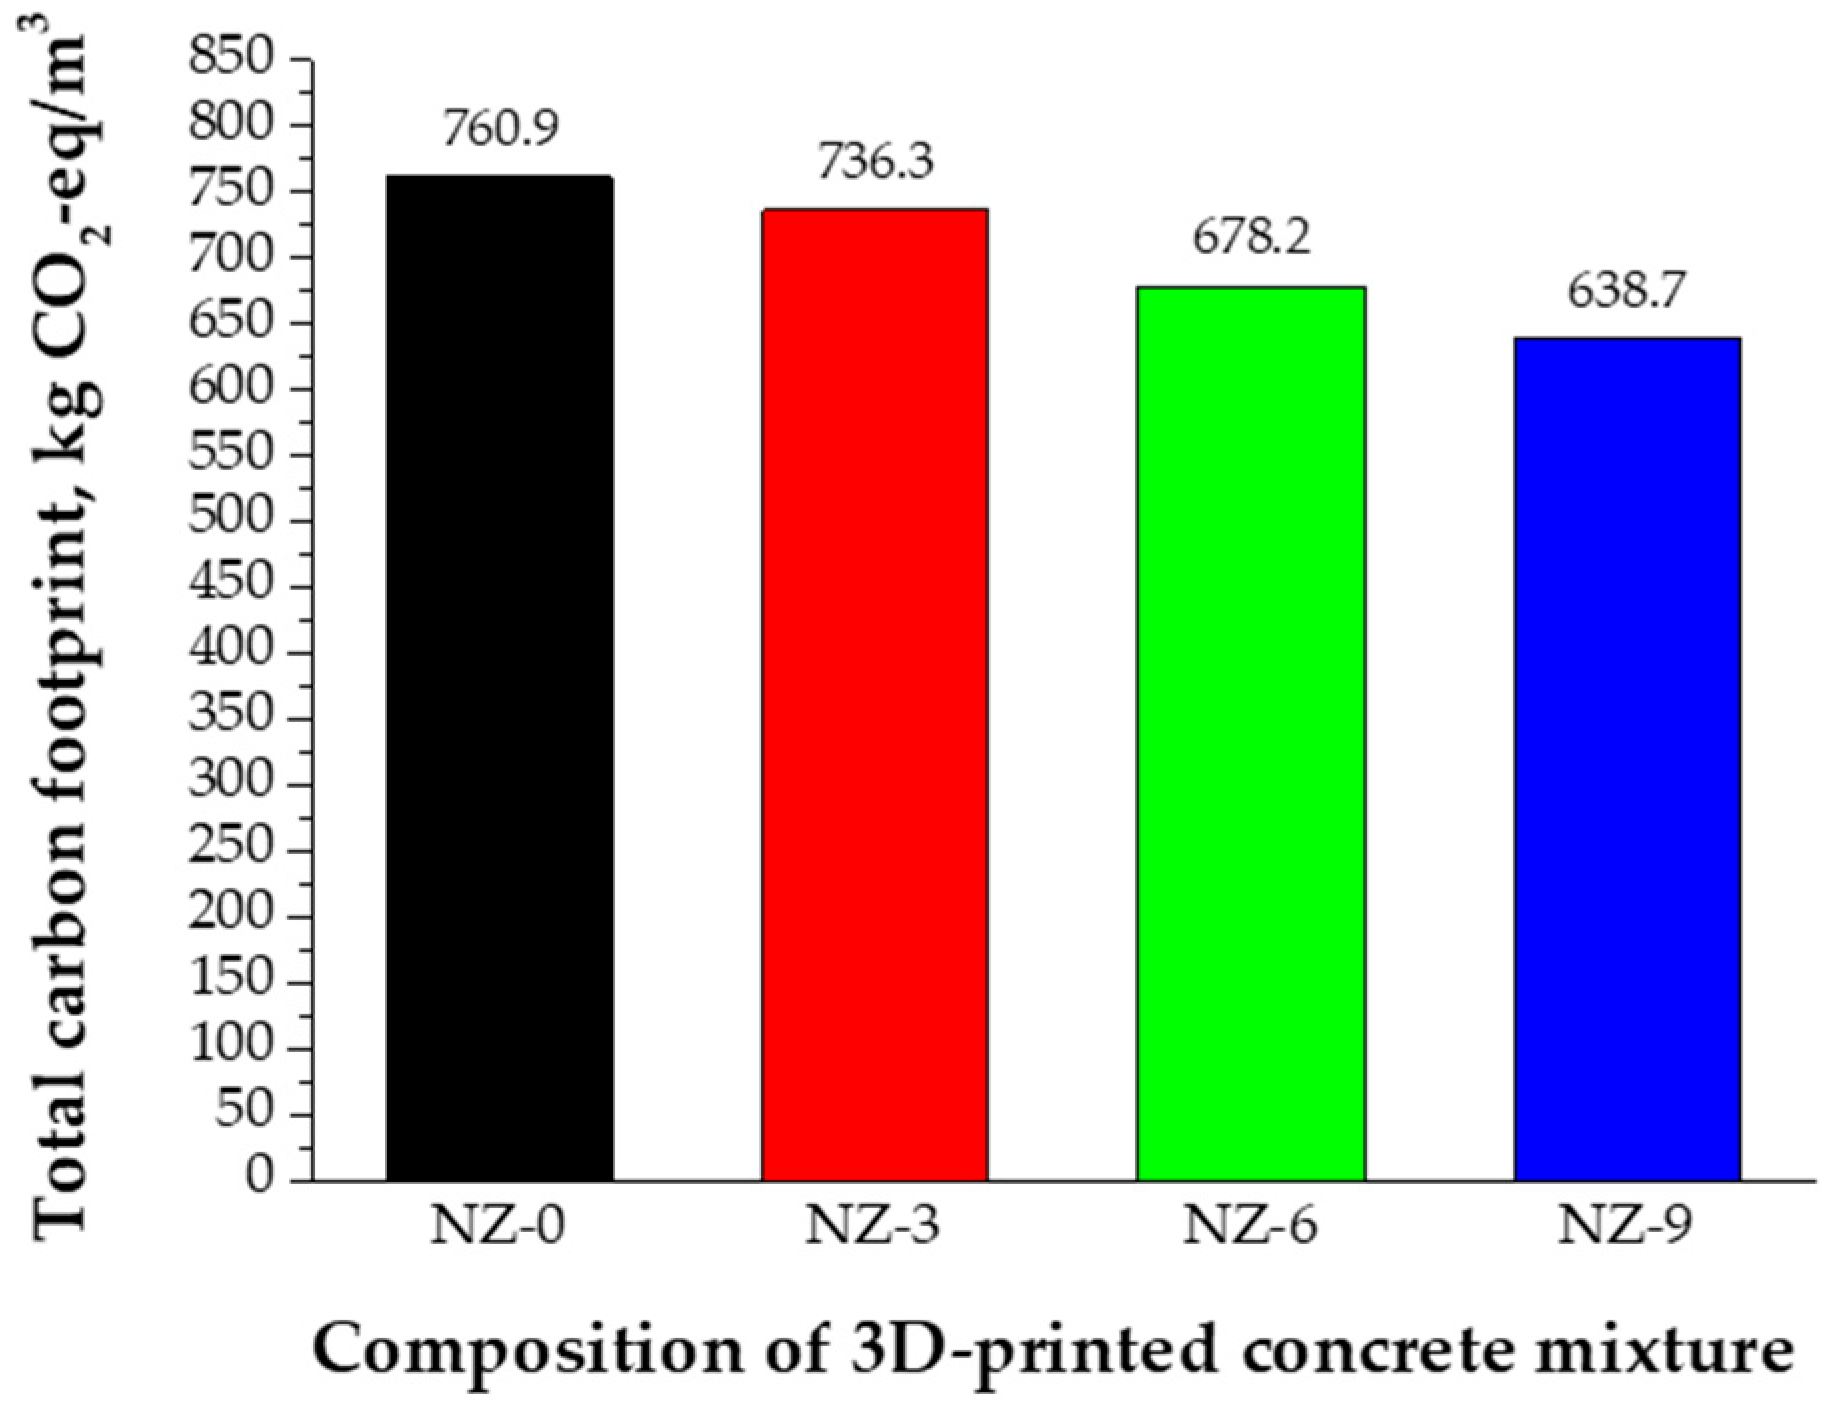
The maximum amount of total carbon footprint (cradle-to-gate boundary) was obtained for 3D-printed concrete mixtures without natural zeolite additive, and reached 760.9 kg CO2-eq (see Figure 14). A decrease of about (3%) was calculated, evaluating the 3D-printed concrete mixture with the lowest amount (3%) of natural zeolite additive, which showed 736.3 kg CO2-eq. A significant decrease of about (19%) was calculated, evaluating the 3D-printed concrete mixture with the highest amount (9%) of natural zeolite additive, which showed 638.7 kg CO2-eq.
Calculations demonstrate that the usage of natural zeolite additive is an effective way to reduce CO2 emissions in the production of 3D-printed concretes. This reduction in CO2 emissions was strongly influenced by the partial replacement of Portland cement, which was the primary factor of high carbon emissions in 3D-printed concrete. Natural zeolite additive not only increases the sustainability of 3D-printed concrete, but also aligns with the global efforts to minimize the environmental impact of the materials used in the construction.

4. Discussion

The summary of all determined properties of 3D-printed concrete mixtures is presented in Table 8.
There are several factors affecting the increase in yield stress of 3D-printed concrete in its fresh state. The main factors are the floculation of cement particles [88], as well as nucleation and the formation of calcium hydrosilicates within the contact points of cement particles [89], which lead to the creation of internal microstructures and can be described by a theoretical model, sugessted by authors [90].
In our study, the yield stress of 3D-printed concrete mixtures increased drastically (5 min and 60 min after preparation) with the increase in the amount of natural zeolite additive, when shear rates were increased. This can be explained by the structural build-up, influenced by the particles of natural zeolite. It aligns with the results of [91], which indicate that synthetic zeolites can also accelerate the setting and the stiffness of high-performance 3D-printed concrete mixtures, leading to a higher buildability. Authors [38] also declare time-dependent network formation, which reinforces the static structure in 3D-printed concrete mixtures due to pozzolanic reactions and their thixotropic behavior.
The yield stress of 3D-printed concrete mixtures was more stable 5 min and 60 min after preparation, when shear rates were reduced. As declared by authors [92], thixotropy and reversible structuration were the main factors affecting the resistance to breakdown, due to the reformation of the internal microstructure of the 3D-printed concrete mixture during its rest period.
The increase in yield stress with the increase in shear rates and time indicates a more robust 3D-printed concrete mixture, which ensures layer support that leads to a better buildability. The Literature [38,40,91] also emphasized the importance of controlling the yield stress when managing the extrudability and buildability of 3D-printed concrete mixtures, as the pozzolanic and filler effects of the zeolite additive have a direct impact on their structure evolution [93]. On the other hand, higher yield stress can reduce the open time and extrudability of the 3D-printed concrete mixture [94]. Strategies such as the amount corrections of chemical admixtures or zeolite additives may help to preserve the extrudability of 3D-printed concrete mixtures [38,91].
The effects of natural zeolite on the rheological properties of the grout mixtures were studied in work [95]. The results showed that, with a constant superplasticizer content, an increase in the natural zeolite amount significantly increased yield stress, plastic viscosity, and shear-thinning behavior. Authors have declared that it was possible to obtain grouts with satisfactory rheological properties, especially when natural zeolite was used together with superplasticizer. The direction of the change in plastic viscosity observed in this work was different compared to our research, because of the differences in the particle size distribution of zeolite additives and the amounts of chemical admixtures.
The non-linear tendency of our results of plastic viscosity corresponds well with results of the other authors. In highly flowable cement systems, the enhanced packing density and modified thickness of cement paste films, provided by the particles of natural zeolite additive, were the main factors affecting the decrease in plastic viscosity [96]. On the other hand, higher-than-optimal amounts of natural zeolite additive led to the increased plastic viscosity due to the increased water demand and interparticle friction [84].
Our observation that the plastic viscosity remains nearly constant 60 min after the preparation of the 3D-printed concrete mixture confirmed its technological robustness. The reduced risk of pressure spikes and nozzle clogging during the extended 3D printing are the main quality factors mentioned in similar rheological tests and reviews [40,91].
The stability of the shear-thinning/thickening index indicates that the natural zeolite additive does not significantly influence the structural breakdown or rebuilding of 3D-printed concrete mixtures under the shear. These are the critical parameters which allow one to predict the flow during the processes of pumping and extrusion. Authors [91] observed that the rheology of 3D-printed concrete mixtures was influenced mostly by yield stress and plastic viscosity, but not by thixotropy, confirming our conclusion that the Bingham model was appropriate for the description of the flow behavior of these systems.
A stable shear-thinning/thickening index, which is close to 1, indicates that the 3D-printed concrete mixture exhibits nearly Newtonian behavior, meaning its viscosity changes very little under shear [97]. This stability has critical implications for a structural build-up, as the 3D-printed concrete mixture does not substantially restructure after shear. Its thixotropic recovery is limited and can delay stiffness gain between the layers and compromise early structural build-up [98]. From the point of the microstructure, this behavior suggests a uniform particle network with limited flocculation under shear, resulting in consistent layer interfaces, but weaker interlayer bonding if resting times are short [99].
The incorporation of natural zeolite as a partial cement replacement in 3D-printed concrete is primarily motivated by sustainability objectives, yet its economic implications remain a critical barrier to widespread adoption. The partial replacement of cement with natural zeolite additive can proportionally reduce CO2 emissions, offering potential benefits under carbon pricing schemes and green building certifications. However, the direct financial savings from carbon credits are small enough (typically EUR 1–3) per cubic meter at current EU ETS prices (EUR 80/tCO2) [100].
In Europe, average cement prices are about EUR 160–170 per ton, and are suitable for industry; natural zeolite prices often exceed EUR 500 per ton (Ukrainian-sourced may cost about EUR 200 per ton) [101]. Material handling and storage costs also increase due to the lower density (about 1/3) of natural zeolite additive, so the total price of 3D-printed concrete can rise about 10–15% per cubic meter.
The efficiency of the 3D printer introduces another cost dimension. Natural zeolite additive increases water demand and alters rheology, often slows down extrusion, and requires longer interlayer times. It is suggested that the partial replacement (3–95%) of cement by natural zeolite additive leads to a drop in productivity of about 5–10% (or EUR 30–50 per cubic meter) and a need for additional equipment and labor costs. These operational costs can exceed carbon credit benefits and eliminate any economic savings [38,41].

5. Conclusions

The measurements show that the ultimate shear stress of 3D-printed concrete mixtures strongly depends on the amount of natural zeolite additive and the time that passed after the preparation of mixture.
  • When shear rate was increased:
    -
    the ultimate shear stress of 3D-printed concrete mixtures with different amounts of natural zeolite additive increased significantly at both measured times—from 95% to 164% after 5 min, and from 35% to 83% after 60 min.
  • When shear rate was decreased:
    -
    the ultimate shear stress of 3D-printed concrete mixtures with different amounts of natural zeolite additive increased insignificantly at both measured times—from 0% to 19% after 5 min, and from 8% to 23% after 60 min.
The results of performed measurements show that the yield stress of 3D-printed concrete mixtures strongly depends on the amount of natural zeolite additive and the character of applied shear rates, but was stable over time limits between 5 min and 60 min after the preparation of the mixture.
  • When shear rate was increased:
    -
    the yield stress of 3D-printed concrete mixtures with different amounts of natural zeolite additive increased significantly at both measured times—from 100% to 183% after 5 min, and from 66% to 114% after 60 min.
  • When shear rate was decreased:
    -
    the yield stress of 3D-printed concrete mixtures with different amounts of natural zeolite additive increased insignificantly or moderately at both measured times—from 5% to 13% after 5 min, and from 22% to 33% after 60 min.
The results demonstrate that the plastic viscosity of 3D-printed concrete mixtures is sensitive to both the amount of natural zeolite additive and the time that passed after the preparation of the mixture.
  • When shear rate was increased:
    -
    the plastic viscosity of 3D-printed concrete mixtures with the lowest amounts (3%) of natural zeolite additive increased at both measured times—about 19% after 5 min, and about 13% after 60 min.
    -
    the plastic viscosity of 3D-printed concrete mixtures with higher amounts (6–9%) of natural zeolite additive decreased from 3% to 2% after 5 min, and either decreased by about 9% or increased by about 5% after 60 min.
  • When shear rate was decreased:
    -
    the plastic viscosity of all 3D-printed concrete mixtures significantly decreased with the increase in the amount of natural zeolite additive at both measured times—from 62% to 48% after 5 min, and from 53% to 32% after 60 min.
The shear-thinning/thickening index of 3D-printed concrete mixtures shows only insignificant variations with the changes in the amount of natural zeolite additive and the character of applied shear rates, both 5 min and 60 min after the preparation of the mixture.
  • When shear rate was increased:
    -
    the shear-thinning/thickening index of all 3D-printed concrete mixtures slightly decreased with the increase in the amount of natural zeolite additive at both measured times—from 4% to 6% after 5 min, and from 2% to 4% after 60 min.
  • When shear rate was decreased:
    -
    the shear-thinning/thickening index of all 3D-printed concrete mixtures slightly increased with the increase in the amount of natural zeolite additive, also at both measured times—from 11% to 7% after 5 min, and from 8% to 3% after 60 min.
The addition of natural zeolite to 3D-printed concrete mixtures effectively reduces water bleeding, thereby enhancing mixture stability during the 3D printing process. It was reduced from 3.6% to 2.8% or 1.8%.
A significant decrease (from 3% to 19%) of carbon footprint in 3D-printed concrete mixtures was observed with an increase in the amount of natural zeolite additive, compared to the calculations of the mixture without natural zeolite additive. Calculations demonstrate that quite a long traffic distance (550 km) of natural zeolite had a small influence on the CO2 emissions, which were related to the transportation of such raw material (increased only from 30.4 kg CO2-eq to 31.7 kg CO2-eq or 32.2 kg CO2-eq). The usage of natural zeolite additive is a promising way to reduce CO2 emissions in the production of 3D-printed concretes.
Our future research will focus on the optimization of amounts of natural zeolite additive to achieve the balanced mechanical/structural performance and environmental benefits of 3D-printed concrete mixtures, as well as the evaluation of their long-term durability under various service conditions. The authors have a plan to test the hardened concrete mixtures (extruded from the head of a 3D printer) to confirm obtained rheological results in a much more practical scenario.

Author Contributions

Conceptualization, M.K. and G.G.; methodology, G.G. and D.B.; software, M.K.; validation, M.K., G.G. and D.B.; formal analysis, D.B.; investigation, G.G.; resources, M.K.; data curation, D.B.; writing—original draft preparation, M.K. and G.G.; writing—review and editing, M.K. and G.G.; visualization, D.B.; supervision, M.K.; project administration, G.G.; funding acquisition, D.B. All authors have read and agreed to the published version of the manuscript.

Funding

This research received no external funding.

Data Availability Statement

The original contributions presented in the study are included in the article. Further inquiries can be directed to the corresponding author.

Acknowledgments

The authors thank the JSC “Baltic Innovation Group” for the kind donation of raw materials, which were used in this research.

Conflicts of Interest

Author Daiva Baltuškienė was employed by the company Joint Stock Company “Baltic Innovation Group”. The remaining authors declare that the research was conducted in the absence of any commercial or financial relationships that could be construed as potential conflicts of interest.

References

  1. Wang, J.; Liu, Z.; Hou, J.; Ge, M. Research progress and trend analysis of concrete 3D printing technology based on citespace. Buildings 2024, 14, 989. [Google Scholar] [CrossRef]
  2. Dey, D.; Srinivas, D.; Panda, B.; Suraneni, P.; Sitharam, T.G. Use of industrial waste materials for 3D printing of sustainable concrete: A review. J. Clean. Prod. 2022, 340, 130749. [Google Scholar] [CrossRef]
  3. Tabassum, T.; Ahmad Mir, A. A review of 3D printing technology-the future of sustainable construction. Mater. Today Proc. 2023, 93, 408–414. [Google Scholar] [CrossRef]
  4. Hossain, M.A.; Zhumabekova, A.; Paul, S.C.; Kim, J.R. A review of 3D printing in construction and its impact on the labor market. Sustainability 2020, 12, 8492. [Google Scholar] [CrossRef]
  5. Zhang, C.; Du, Q.; Ding, Y.; Zhang, M.; Guo, S.; Guo, M.; Zhao, Y. Effect of double substitution of recycled coarse and fine aggregates on the workability and mechanical properties of 3D printed concrete. Ceram.-Silikáty 2025, 69, 75–92. [Google Scholar]
  6. Zhang, J.; Wang, J.; Dong, S.; Yu, X.; Han, B. A review of the current progress and application of 3D printed concrete. Compos. Part A 2019, 125, 105533. [Google Scholar] [CrossRef]
  7. Garcés, G.; García-Alvarado, R.; Bunster, V.; Muñoz-Sanguinetti, C. Additive construction 4.0: A systematic review of 3D concrete printing for Construction 4.0. Eng. Constr. Archit. Manag. 2025. ahead-of-print. [Google Scholar] [CrossRef]
  8. Agegn, A.A.; Regassa, Y.; Angassa, K.; Mekonnen, K.N. Systematic review on 3D concrete printing technology: Breakthroughs and challenges. Discov. Civ. Eng. 2026, 3, 9. [Google Scholar] [CrossRef]
  9. Adaloudis, M.; Roca, J.B. Sustainability tradeoffs in the adoption of 3D concrete printing in the construction industry. J. Clean. Prod. 2021, 307, 127201. [Google Scholar] [CrossRef]
  10. Hager, I.; Golonka, A.; Putanowicz, R. 3D printing of buildings and building components as the future of sustainable construction? Procedia Eng. 2016, 151, 292–299. [Google Scholar] [CrossRef]
  11. Girskas, G.; Kligys, M. 3D concrete printing review: Equipment, materials, mix design, and properties. Buildings 2025, 15, 2049. [Google Scholar] [CrossRef]
  12. Tu, H.; Wei, Z.; Bahrami, A.; Kahla, N.B.; Ahmad, A.; Özkılıç, Y.O. Recent advancements and future trends in 3D concrete printing using waste materials. Dev. Built Environ. 2023, 16, 100187. [Google Scholar] [CrossRef]
  13. Placzek, G.; Dahlberg, M.; Thormählen, J.; Schwerdtner, P. How productive is 3D concrete printing? A systematic review. In Proceedings of the Creative Construction Conference, Prague, Czechia, 29 June–2 July 2024; Skibniewski, M.J., Hajdu, M., Turk, Ž., Eds.; Technische Universität Braunschweig: Braunschweig, Germany, 2025. [Google Scholar]
  14. Yadav, A.R.; Petkar, P.N. 3D Printed Concrete: A comprehensive review (2004–2025). World J. Adv. Eng. Technol. Sci. 2025, 16, 154–160. [Google Scholar] [CrossRef]
  15. Giridhar, G.; Prem, P.R.; Jiao, D. Effect of varying shear rates at different resting times on the rheology of 3D printable concrete. Mater. Today Proc. 2023, in press. [Google Scholar] [CrossRef]
  16. Jeong, H.; Han, S.-J.; Choi, S.-H.; Lee, Y.J.; Yi, S.T.; Kim, K.S. Rheological Property Criteria for Buildable 3D Printing Concrete. Materials 2019, 12, 657. [Google Scholar] [CrossRef] [PubMed]
  17. Arunothayan, A.R.; Nematollahi, B.; Khayat, K.H.; Ramesh, A.; Sanjayan, J.G. Rheological characterization of ultra-high performance concrete for 3D printing. Cem. Concr. Compos. 2023, 136, 104854. [Google Scholar] [CrossRef]
  18. Li, Q.; Fan, Y.; Shah, S.P. Rheological properties and structural build-up of cement based materials with addition of nanoparticles: A review. Buildings 2022, 12, 2219. [Google Scholar] [CrossRef]
  19. El Bitouri, Y. Rheological behavior of cement paste: A phenomenological state of the art. Eng 2023, 4, 1891–1904. [Google Scholar] [CrossRef]
  20. Sharma, A.; Gupta, S.; Noman Husain, M.; Chaudhary, S. Factors affecting the rheology of cement-based composites: A review. J. Am. Ceram. Soc. 2025, 108, e20429. [Google Scholar] [CrossRef]
  21. Yahia, A.; Khayat, K.H. Applicability of rheological models to high-performance grouts containing supplementary cementitious materials and viscosity enhancing admixture. Mater. Struct. 2003, 36, 402–412. [Google Scholar] [CrossRef]
  22. Nazar, S.; Yang, J.; Thomas, B.S.; Azim, I.; Rehman, S.K.U. Rheological properties of cementitious composites with and without nano-materials: A comprehensive review. J. Clean. Prod. 2020, 272, 122701. [Google Scholar] [CrossRef]
  23. Prem, P.R.; Ravichandran, D.; Kaliyavaradhan, S.K.; Ambily, P. Comparative evaluation of rheological models for 3D printable concrete. Mater. Today Proc. 2022, 65, 1594–1598. [Google Scholar] [CrossRef]
  24. Jacquet, Y.; Perrot, A.; Picandet, V. Assessment of asymmetrical rheological behavior of cementitious material for 3D printing application. Cem. Concr. Res. 2021, 140, 106305. [Google Scholar] [CrossRef]
  25. Roussel, N. Rheological requirements for printable concretes. Cem. Concr. Res. 2018, 112, 76–85. [Google Scholar] [CrossRef]
  26. Jayathilakage, R.; Rajeev, P.; Sanjayan, J. Rheometry for concrete 3D printing: A review and an experimental comparison. Buildings 2022, 12, 1190. [Google Scholar] [CrossRef]
  27. Rasel, R.I.; Hossain, M.M.; Zubayer, M.H.; Zhang, C. Exploring the fresh and rheology properties of 3D printed concrete with fiber reinforced composites (3DP-FRC): A novel approach using machine learning techniques. Mater. Res. Express 2024, 11, 125502. [Google Scholar] [CrossRef]
  28. Paritala, S.; Singaram, K.K.; Bathina, I.; Khan, M.A.; Jyosyula, S.K.R. Rheology and pumpability of mix suitable for extrusion-based concrete 3D printing—A review. Constr. Build. Mater. 2023, 402, 132962. [Google Scholar] [CrossRef]
  29. Fasihi, A.; Libre, N.A. From pumping to deposition: A Comprehensive review of test methods for characterizing concrete printability. Constr. Build. Mater. 2024, 414, 134968. [Google Scholar] [CrossRef]
  30. Sun, Y.; Zhang, X.; Zhou, J.; Wang, Y.; Zhang, B.; Zhang, Y.; Cui, W.; Tao, Y. Extrudability analysis of 3D printable concrete as a two-phase discrete flow. J. Build. Eng. 2024, 98, 111252. [Google Scholar] [CrossRef]
  31. Khan, S.A.; Koç, M. Buildability Analysis of 3D Concrete Printing Process: A Parametric Study Using Design of Experiment Approach. Processes 2023, 11, 782. [Google Scholar] [CrossRef]
  32. da Silveira Júnior, J.G.; de Moura Cerqueira, K.; de Araújo Moura, R.C.; de Matos, P.R.; Rodriguez, E.D.; de Castro Pessôa, J.R.; Tramontin Souza, M. Influence of Time Gap on the Buildability of Cement Mixtures Designed for 3D Printing. Buildings 2024, 14, 1070. [Google Scholar] [CrossRef]
  33. Sonebi, M.; Kaushik, S.; Amziane, S.; Hamill, G. Optimization of Rheological and Hardened Properties of 3D Concrete Printing. In Bio-Based Building Materials—Proceedings of ICBBM 2025; Amziane, S., Toledo Filho, R.D., da Gloria, M.Y.R., Page, J., Eds.; RILEM Bookseries; Springer: Cham, Switzerland, 2025; Volume 60. [Google Scholar]
  34. Rahman, M.; Rawat, S.; Yang, R.; Mahil, A.; Zhang, Y.X. A comprehensive review on fresh and rheological properties of 3D printable cementitious composites. J. Build. Eng. 2024, 91, 109719. [Google Scholar] [CrossRef]
  35. Jayathilakage, R.; Sanjayan, J.; Rajeev, P. Characterizing Extrudability for 3D Concrete Printing Using Discrete Element Simulations. In Second RILEM International Conference on Concrete and Digital Fabrication, DC 2020; Bos, F., Lucas, S., Wolfs, R., Salet, T., Eds.; RILEM Bookseries; Springer: Cham, Switzerland, 2020; Volume 28. [Google Scholar]
  36. Vallurupalli, K.; Libre, N.A.; Khayat, K.H. Characterization of Extrudability Using Rheology and Desorptivity. ACI Mater. J. 2024, 121, 5–16. [Google Scholar] [CrossRef]
  37. Lee, K.W.; Lee, H.J.; Choi, M.S. Evaluation of 3D concrete printing performance from a rheological perspective. Adv. Concr. Constr. 2019, 8, 155–163. [Google Scholar]
  38. Rehman, A.U.; Kim, J.-H. 3D Concrete Printing: A Systematic Review of Rheology, Mix Designs, Mechanical, Microstructural, and Durability Characteristics. Materials 2021, 14, 3800. [Google Scholar] [CrossRef] [PubMed]
  39. Mohan, M.K.; Rahul, A.V.; Van Tittelboom, K.; De Schutter, G. Evaluating the Influence of Aggregate Content on Pumpability of 3D Printable Concrete. In Second RILEM International Conference on Concrete and Digital Fabrication, DC 2020; Bos, F., Lucas, S., Wolfs, R., Salet, T., Eds.; RILEM Bookseries; Springer: Cham, Switzerland, 2020; Volume 28. [Google Scholar]
  40. Si, W.; Khan, M.; McNally, C. A Comprehensive Review of Rheological Dynamics and Process Parameters in 3D Concrete Printing. J. Compos. Sci. 2025, 9, 299. [Google Scholar] [CrossRef]
  41. Gao, H.; Jin, L.; Chen, Y.; Chen, Q.; Liu, X.; Yu, Q. Rheological behavior of 3D printed concrete: Influential factors and printability prediction scheme. J. Build. Eng. 2024, 91, 109626. [Google Scholar] [CrossRef]
  42. De Schryver, R.; El Cheikh, K.; Yardimci, M.Y.; Lesage, K.; De Schutter, G. Fresh Concrete Pumping Arrest Investigation for Thixotropy by a CFD Modelling Approach. RILEM Bookseries 2020, 23, 580–587. [Google Scholar]
  43. De Schryver, R.; De Schutter, G. Insights in thixotropic concrete pumping by a Poiseuille flow extension. Appl. Rheol. 2020, 30, 77–101. [Google Scholar] [CrossRef]
  44. Ardaneh, F.; Immonen, E.; Chaudhari, A.; Pelkonen, J.; Knuutinen, S. Analysis of viscosity behaviour of shear-thinning hydrogels in 3D-printing nozzles. Commun. ECMS 2024, 38, 2024-0359. [Google Scholar]
  45. Luo, Y.; Sun, W.; Bao, M.; Zhu, X.; Ning, C.; Zhang, W.; Li, Y.; Zhang, X. Process fundamentals and quality investigation in extrusion 3D printing of shear thinning materials: Extrusion process based on Nishihara model. Int. J. Adv. Manuf. Technol. 2023, 124, 245–264. [Google Scholar] [CrossRef]
  46. Foulki, R.; El Mesoudy, M.; Cherkaoui, K. Numerical and theoretical analysis of pumping and extrusion in 3D concrete printing. Int. J. Adv. Manuf. Technol. 2025, 141, 1653–1675. [Google Scholar] [CrossRef]
  47. Zhi, P.; Wu, Y.C.; Rabczuk, T. Effects of time-varying liquid bridge forces on rheological properties, and resulting extrudability and constructability of three-dimensional printing mortar. Front. Struct. Civ. Eng. 2023, 17, 1295–1309. [Google Scholar] [CrossRef]
  48. Prem, P.R.; Ambily, P.S.; Kumar, S.; Ghodke, S.B. A theoretical model to predict the structural buildability of 3D printable concrete. Mech. Time-Depend. Mater. 2024, 28, 2661–2679. [Google Scholar] [CrossRef]
  49. Prem, P.R.; Ambily, P.S.; Kumar, S.; Jiao, D. Structural build-up model for three-dimensional concrete printing based on kinetics theory. Front. Struct. Civ. Eng. 2024, 18, 998–1014. [Google Scholar] [CrossRef]
  50. Kruger, J.; Zeranka, S.; van Zijl, G. Quantifying Constructability Performance of 3D Concrete Printing via Rheology-Based Analytical Models. In Rheology and Processing of Construction Materials, RheoCon SCC 2019; Mechtcherine, V., Khayat, K., Secrieru, E., Eds.; RILEM Bookseries; Springer: Cham, Switzerland, 2020; Volume 23. [Google Scholar]
  51. Jayathilakage, R.; Sanjayan, J.; Rajeev, P. Comparison of Rheology Measurement Techniques Used in 3D Concrete Printing Applications. In ICSECM 2019; Dissanayake, R., Mendis, P., Weerasekera, K., De Silva, S., Fernando, S., Eds.; Lecture Notes in Civil Engineering; Springer: Singapore, 2021; Volume 94. [Google Scholar]
  52. Kamakshi, T.A.; Subramaniam, K.V.L. Rheology control and 3D concrete printing with fly ash-based aqueous nano-silica enhanced alkali-activated binders. Mater. Struct. 2024, 57, 106. [Google Scholar] [CrossRef]
  53. Miranda, L.R.M.; Lesage, K.; De Schutter, G. Understanding the Structural Build-Up Rate of Cementitious Materials for 3D-Printing. In 75th RILEM Annual Week 2021, RW 2021; Escalante-Garcia, J.I., Castro Borges, P., Duran-Herrera, A., Eds.; RILEM Bookseries; Springer: Cham, Switzerland, 2023; Volume 40. [Google Scholar]
  54. Sakka, F.E.; Assaad, J.J.; Hamzeh, F.R.; Nakhoul, C. Thixotropy and interfacial bond strengths of polymer-modified printed mortars. Mater. Struct. 2019, 52, 79. [Google Scholar] [CrossRef]
  55. Leal da Silva, W.R.; Fryda, H.; Bousseau, J.N.; Andreani, P.A.; Andersen, T.J. Evaluation of Early-Age Concrete Structural Build-Up for 3D Concrete Printing by Oscillatory Rheometry. In Advances in Additive Manufacturing, Modeling Systems and 3D Prototyping, AHFE 2019; Di Nicolantonio, M., Rossi, E., Alexander, T., Eds.; Advances in Intelligent Systems and Computing; Springer: Cham, Switzerland, 2020; Volume 975. [Google Scholar]
  56. Barve, P.; Bahrami, A.; Shah, S. Geopolymer 3D printing: A comprehensive review on rheological and structural performance assessment, printing process parameters, and microstructure. Front. Mater. 2023, 10, 1241869. [Google Scholar] [CrossRef]
  57. Günzel, F.S.; Moelich, G.M.; Kanyenze, S.S.; Kruger, P.J.; Combrinck, R. Investigating inherent cement setting mechanisms to improve the constructability performance of extrusion-based 3D concrete printing. Innov. Infrastruct. Solut. 2024, 9, 480. [Google Scholar] [CrossRef]
  58. Panda, B.; Noor Mohamed, N.A.; Paul, S.C.; Bhagath Singh, G.; Tan, M.J.; Šavija, B. The Effect of Material Fresh Properties and Process Parameters on Buildability and Interlayer Adhesion of 3D Printed Concrete. Materials 2019, 12, 2149. [Google Scholar] [CrossRef]
  59. Nishijo, K.; Ohno, M.; Ishida, T. Quantitative Evaluation of Buildability in 3D Concrete Printing Based on Shear Vane Test. In Proceedings of the 16th East Asia-Pacific Conference on Structural Engineering & Construction (EASEC16), Brisbane, Australia, 3–6 December 2019. [Google Scholar]
  60. Andrade Neto, J.S.; Carvalho, I.C.; Monteiro, P.J.M.; de Matos, P.R.; Kirchheim, A.P. Unveiling the key factors for clinker reactivity and cement performance: A physic-chemical and performance investigation of 40 industrial clinkers. Cem. Concr. Res. 2025, 187, 107717. [Google Scholar] [CrossRef]
  61. Generowicz-Caba, N.; Kulczycka, J. LCA of Cement with Alternative Additives: Pathways to Sustainable Production. Materials 2025, 18, 3057. [Google Scholar] [CrossRef]
  62. Kampai, C.; Chindasiriphan, P.; Jongvivatsakul, P.; Miao, P.; Tangchirapat, W. Durability properties of high-strength concrete with high-volume bottom ash as a substitute for cement and fine aggregate. Constr. Build. Mater. 2024, 457, 139401. [Google Scholar] [CrossRef]
  63. Liu, Z.; Qi, X.; Ke, J.; Shui, Z. Enhancing the toughness of ultra-high performance concrete through improved fiber-matrix interface bonding. Constr. Build. Mater. 2025, 491, 142616. [Google Scholar] [CrossRef]
  64. Cui, Y.; Chen, S.; Li, L.; Wang, X.; Liu, J. Atomistic insights into the hydration behavior of N-A-S-H Gel via Ca2+ substitution: A molecular dynamics simulation study. J. Non-Cryst. Solids 2026, 673, 123892. [Google Scholar] [CrossRef]
  65. Luo, B.; Su, Y.; Hu, X.; Chen, Z.; Chen, Y.; Ding, X. Strength behavior and microscopic mechanisms of geopolymer-stabilized waste clays considering clay mineralogy. J. Clean. Prod. 2025, 530, 146877. [Google Scholar] [CrossRef]
  66. Luo, B.; Su, Y.; Ding, X.; Chen, Y.; Liu, C. Modulation of initial CaO/Al2O3 and SiO2/Al2O3 ratios on the properties of slag/fly ash-based geopolymer stabilized clay: Synergistic effects and stabilization mechanism. Mater. Today Commun. 2025, 47, 113295. [Google Scholar] [CrossRef]
  67. Li, Z. Toward low-carbon construction: A review of red mud utilization in cementitious materials and geopolymers for sustainability and cost benefits. Buildings 2026, 16, 362. [Google Scholar] [CrossRef]
  68. Liu, H.; Chen, J.; Zhang, P.; Li, W.; Su, W.; Su, T.; Gong, S.; Li, B. Freeze-thaw behavior and damage prediction of mixed recycled coarse aggregate concrete. Buildings 2026, 16, 368. [Google Scholar] [CrossRef]
  69. Akintayo, B.D.; Babatunde, O.M.; Akintayo, D.C.; Olanrewaju, O.A. Transforming Industrial Waste into Low-Carbon Cement: A Multi-Criteria Assessment of SCMs for Sustainable Concrete Design. Recycling 2025, 10, 211. [Google Scholar] [CrossRef]
  70. Ahmed, A. Assessing the effects of supplementary cementitious materials on concrete properties: A review. Discov. Civ. Eng. 2024, 1, 145. [Google Scholar] [CrossRef]
  71. Akintayo, B.D.; Olanrewaju, O.A.; Olanrewaju, O.I. Life Cycle Assessment of Ordinary Portland Cement Production in South Africa: Mid-Point and End-Point Approaches. Sustainability 2024, 16, 3001. [Google Scholar] [CrossRef]
  72. Salari, M.; Akhoundi, B. Environmental Assessment of 3D Printed Concrete: Potentials and Challenges, Perspectives, and Opportunities (2013–2023). J. Rehabil. Civ. Eng. 2026, 14, 2239. [Google Scholar]
  73. Jin, W.; Caron, J.-F.; Ouellet-Plamondon, C.M. Minimizing the carbon footprint of 3D printing concrete: Leveraging parametric LCA and neural networks through multiobjective optimization. Cem. Concr. Compos. 2025, 157, 105853. [Google Scholar] [CrossRef]
  74. Wang, L.; Jiang, H.; Li, Z.; Ma, G. Mechanical behaviors of 3D printed lightweight concrete structure with hollow section. Archiv. Civ. Mech. Eng. 2020, 20, 16. [Google Scholar] [CrossRef]
  75. Hernández Vargas, J.; Sjölander, A.; Westerlind, H.; Silfwerbrand, J. Internal topology optimisation of 3D printed concrete structures: A method for enhanced performance and material efficiency. Virtual Phys. Prototyp. 2024, 19, e2346290. [Google Scholar] [CrossRef]
  76. Mohammad, M.; Masad, E.; Al-Ghamdi, S.G. 3D Concrete Printing Sustainability: A Comparative Life Cycle Assessment of Four Construction Method Scenarios. Buildings 2020, 10, 245. [Google Scholar] [CrossRef]
  77. Zhang, Y.; Zhu, X.; Li, M.; Zhang, C.; Zhang, Y.; Du, X.; Banthia, N.; Mechtcherine, V.; Carstensen, J.V.; Monteiro, P.J.M.; et al. 3D printing technology in concrete construction. Nat. Rev. Clean Technol. 2025, 1, 288–303. [Google Scholar] [CrossRef]
  78. Roux, C.; Kuzmenko, K.; Roussel, N.; Mesnil, R.; Feraille, A. Life cycle assessment of a concrete 3D printing process. Int. J. Life Cycle Assess. 2023, 28, 1–15. [Google Scholar] [CrossRef]
  79. Chen, Y.; Veer, F.; Copuroglu, O.; Schlangen, E. Feasibility of using low CO2 concrete alternatives in extrusion-based 3D concrete printing. In Proceedings of the First RILEM International Conference on Concrete and Digital Fabrication—Digital Concrete 2018 (DC 2018); Wangler, T., Flatt, R., Eds.; Springer: Cham, Switzerland, 2019; Volume 19, pp. 269–276. [Google Scholar]
  80. Zhuang, Z.; Xu, F.; Ye, J.; Hu, N.; Jiang, L.; Weng, Y. A comprehensive review of sustainable materials and toolpath optimization in 3D concrete printing. npj Mater. Sustain. 2024, 2, 12. [Google Scholar] [CrossRef]
  81. Lilkov, V.; Petrov, O.; Tzvetanova, Y. Rheological, porosimetric, and SEM studies of cements with additions of natural zeolites. Clay Miner. 2011, 46, 225–232. [Google Scholar] [CrossRef]
  82. Girskas, G.; Pundienė, I.; Pranckevičienė, J. The effect of natural and synthesised zeolites on cement-based materials hydration and hardened state properties. Materials 2023, 16, 5608. [Google Scholar] [CrossRef] [PubMed]
  83. Nagrockiene, D.; Girskas, G. Research into the properties of concrete modified with natural zeolite addition. Constr. Build. Mater. 2016, 113, 964–969. [Google Scholar] [CrossRef]
  84. Chinwala, N.; Solanki, C.H.; Gandhi, S.R.; Joshi, N.H.; Shroff, A.V. Study on time—Viscosity characteristics of cement—Zeolite grouts. In Sustainable Building Materials and Construction. Lecture Notes in Civil Engineering; Kondraivendhan, B., Modhera, C.D., Matsagar, V., Eds.; Springer: Singapore, 2022; Volume 222, pp. 173–178. [Google Scholar]
  85. Circular Ecology—ICE Database v3. Available online: https://circularecology.com/embodied-carbon-footprint-database.html (accessed on 8 December 2025).
  86. GHG Emission Factors for Electricity Consumption. Available online: https://data.europa.eu/data/datasets/919df040-0252-4e4e-ad82-c054896e1641?locale=en (accessed on 16 January 2026).
  87. Guidelines for Measuring and Managing CO2 Emission from Freight Transport Operations. Available online: https://www.ecta.com/wp-content/uploads/2021/03/ECTA-CEFIC-GUIDELINE-FOR-MEASURING-AND-MANAGING-CO2-ISSUE-1.pdf (accessed on 16 January 2026).
  88. Jayathilakage, R.; Rajeev, P.; Sanjayan, J.G. Yield stress criteria to assess the buildability of 3D concrete printing. Constr. Build. Mater. 2020, 240, 117989. [Google Scholar] [CrossRef]
  89. Roussel, N.; Ovarlez, G.; Garrault, S.; Brumaud, C. The origins of thixotropy of fresh cement pastes. Cem. Concr. Res. 2012, 42, 148–157. [Google Scholar] [CrossRef]
  90. Perrot, A.; Rangeard, D.; Pierre, A. Structural built-up of cement-based materials used for 3D printing extrusion techniques. Mater. Struct. 2016, 49, 1213–1220. [Google Scholar] [CrossRef]
  91. Lu, B.; Li, M.; Qian, S.; Li, K.H.H.; Wong, T.N. High-performance 3D concrete printing with zeolite. In Construction 3D Printing. (3DcP 2023); Tan, M.J., Li, M., Tay, Y.W.D., Wong, T.N., Bartolo, P., Eds.; Springer: Cham, Switzerland, 2024; pp. 149–155. [Google Scholar]
  92. El Bitouri, Y.; Azéma, N. On the “Thixotropic” Behavior of Fresh Cement Pastes. Eng 2022, 3, 677–692. [Google Scholar] [CrossRef]
  93. Alexa-Stratulat, S.-M.; Olteanu, I.; Toma, A.-M.; Pastia, C.; Banu, O.-M.; Corbu, O.-C.; Toma, I.-O. The use of natural zeolites in cement-based construction materials—A state of the art review. Coatings 2024, 14, 18. [Google Scholar] [CrossRef]
  94. Zhang, C.; Deng, Z.; Chen, C.; Zhang, Y.; Mechtcherine, V.; Sun, Z. Predicting the static yield stress of 3D printable concrete based on flowability of paste and thickness of excess paste layer. Cem. Concr. Compos. 2022, 129, 104494. [Google Scholar] [CrossRef]
  95. Şahmaran, M.; Özkan, N.; Keskin, S.B.; Uzal, B.; Yaman, İ.Ö.; Erdem, T.K. Evaluation of natural zeolite as a viscosity-modifying agent for cement-based grouts. Cem. Concr. Res. 2008, 38, 930–937. [Google Scholar] [CrossRef]
  96. Chen, J.J.; Guan, G.X. Addition of superfine natural zeolite to improve rheological properties of self-consolidating concrete. Powder Technol. 2025, 456, 120868. [Google Scholar] [CrossRef]
  97. Babafemi, A.J.; Kolawole, J.T.; Miah, M.J.; Paul, S.C.; Panda, B. A concise review on interlayer bond strength in 3D concrete printing. Sustainability 2021, 13, 7137. [Google Scholar] [CrossRef]
  98. Link, J.; Sowoidnich, T.; Pfitzner, C.; Gil-Diaz, T.; Heberling, F.; Lützenkirchen, J.; Schäfer, T.; Ludwig, H.-M.; Haist, M. The influences of cement hydration and temperature on the thixotropy of cement paste. Materials 2020, 13, 1853. [Google Scholar] [CrossRef] [PubMed]
  99. Li, M.; Han, J.; Zhou, Y.; Yan, P. A rheological model for evaluating the behavior of shear thickening of highly flowable mortar. Molecules 2021, 26, 1011. [Google Scholar] [CrossRef]
  100. Zeolites Prices, Trend, Chart, Demand, Market Analysis, News, Historical and Forecast Data Report 2025 Edition. Available online: https://www.imarcgroup.com/zeolites-pricing-report (accessed on 16 January 2026).
  101. Cement price index. Available online: https://businessanalytiq.com/procurementanalytics/index/cement-price-index/ (accessed on 16 January 2026).
Figure 1. Particle size distribution of washed sand (fraction 0/1 mm).
Buildings 16 00490 g001
Figure 2. The cumulative particle size distribution of Portland cement and natural zeolite.
Buildings 16 00490 g002
Figure 3. XRD patterns: (a) natural zeolite; (b) Portland cement. CL—clinoptilolite; HE—heulandite; βC2S—belite; C3S—alite; C4AF—tetracalcium aluminoferrite; CaCO3—calcium carbonate; C3A—tricalcium aluminate.
Buildings 16 00490 g003
Figure 4. The scheme of measuring system of the rotational rheometer RN 4.1.
Buildings 16 00490 g004
Figure 5. The shear rate mode of the rheological test.
Buildings 16 00490 g005
Figure 6. Flow curves of 3D-printed concrete mixtures without natural zeolite additive: (a) 5 min after preparation; (b) 60 min after preparation.
Buildings 16 00490 g006
Figure 7. Flow curves of 3D-printed concrete mixtures with 3% of natural zeolite additive: (a) 5 min after preparation; (b) 60 min after preparation.
Buildings 16 00490 g007
Figure 8. Flow curves of 3D-printed concrete mixtures with 6% of natural zeolite additive: (a) 5 min after preparation; (b) 60 min after preparation.
Buildings 16 00490 g008
Figure 9. Flow curves of 3D-printed concrete mixtures with 9% of natural zeolite additive: (a) 5 min after preparation; (b) 60 min after preparation.
Buildings 16 00490 g009
Figure 10. Yield stress of 3D-printed concrete mixtures with different amounts of natural zeolite additive: (a) 5 min after preparation; (b) 60 min after preparation.
Buildings 16 00490 g010
Figure 11. Plastic viscosity of 3D-printed concrete mixtures with different amounts of natural zeolite additive: (a) 5 min after preparation; (b) 60 min after preparation.
Buildings 16 00490 g011
Figure 12. Shear-thinning/thickening index of 3D-printed concrete mixtures with different amounts of natural zeolite additive: (a) 5 min after preparation; (b) 60 min after preparation.
Buildings 16 00490 g012
Figure 13. Volume coefficient of water bleeding of 3D-printed concrete mixtures with different amounts of natural zeolite additive.
Buildings 16 00490 g013
Figure 14. Total carbon footprint of 3D-printed concrete mixtures with different amounts of natural zeolite additive.
Buildings 16 00490 g014
Table 1. The most common rheological models used to describe 3D-printed concrete mixtures.
Rheological ModelEquation
Bingham [17,23] τ = τ 0 + μ p · γ ˙
Modified Bingham [17,18] τ = τ 0 + μ p · γ ˙ + c · γ ˙ 2
Hershel–Bulkley [17,23] τ = τ 0 + K · γ ˙ n
Power low [18,23] τ = K · γ ˙ n
Casson [19,20] τ = τ 0 + μ p · γ ˙
De Kee [20,21] τ = τ 0 + μ · γ ˙ · e A · γ ˙
Yahia and Khayat [20,21] τ = τ 0 + 2 · τ 0 · μ · γ ˙ · e A · γ ˙
Bingham thixotropy [20] τ = τ 0 + μ p · γ ˙ + θ ( t )
Table 2. Chemical composition of the main raw materials.
Raw MaterialChemical Composition, %
SiO2CaOMgONa2OAl2O3SO3K2OFe2O3TiO2LOI
Portland cement18.962.63.940.104.883.471.133.531.46
washed sand84.91.903.460.353.061.073.052.03
natural zeolite71.35.201.201.3013.23.401.900.302.20
Table 3. Compositions of 3D-printed concrete mixtures.
Sample SeriesThe Amounts of Raw Materials, kg/m3
Portland CementWashed SandNatural ZeoliteSuperplasticizerWater
NZ-077212050.0000.585292
NZ-3744119838.400.582301
NZ-6681114973.700.558312
NZ-96381114107.10.541325
Table 6. Amount of CO2 emissions generated only from the production of raw materials.
Compositions of 3D-Printed
Concrete
Mixtures
Emissions, Related to the Production of Raw Materials, kg CO2-eq
Portland
Cement
Washed
Sand
Natural
Zeolite
SuperplasticizerWaterTotal
NZ-07186.030.001.460.09726
NZ-36926.000.771.460.09700
NZ-66335.751.471.400.09642
NZ-95935.572.141.350.10602
Table 7. Amount of CO2 emissions, generated during the transportation of raw materials.
Compositions of 3D-Printed
Concrete
Mixtures
Emissions, Related to the Transportation of Raw Materials, kg CO2-eq
Portland
Cement
Washed
Sand
Natural
Zeolite
SuperplasticizerWaterTotal
NZ-018.212.10.000.080.030.4
NZ-317.612.02.110.080.031.8
NZ-616.111.54.050.080.031.7
NZ-915.111.15.890.070.032.2
Table 8. Summary of determined properties of 3D-printed concrete mixtures.
Properties of 3D-Printed Concrete MixturesComposition of Mixtures
NZ-0NZ-3NZ-6NZ-9
Ultimate shear stress,
Pa
Shear rate increasedAfter5 min398176103
60 min52877095
Shear rate decreasedAfter5 min62716274
60 min61666475
Yield
stress,
Pa
Shear rate increasedAfter5 min30606285
60 min35605875
Shear rate decreasedAfter5 min55585562
60 min45585560
Plastic
viscosity,
Pa∙s
Shear rate increasedAfter5 min1.812.151.751.78
60 min1.912.151.762.01
Shear rate decreasedAfter5 min2.451.511.511.65
60 min2.311.521.511.75
Shear-
thinning/thickening index
Shear rate increasedAfter5 min1.010.970.960.95
60 min0.990.970.950.97
Shear rate decreasedAfter5 min0.890.990.950.97
60 min0.920.990.950.98
Volume coefficient of water bleeding, %3.62.82.21.8
Cradle-to-gate carbon footprint, CO2-eq/m3760.9736.3678.2638.7
Disclaimer/Publisher’s Note: The statements, opinions and data contained in all publications are solely those of the individual author(s) and contributor(s) and not of MDPI and/or the editor(s). MDPI and/or the editor(s) disclaim responsibility for any injury to people or property resulting from any ideas, methods, instructions or products referred to in the content.