Article

Study on Compressive Strength Prediction of Steel Fiber Recycled Aggregate Concrete Based on GA–PSO–BP Neural Network

1
School of Civil Engineering, Shenyang University, Shenyang 110044, China
2
Northeast Geological Science and Technology Innovation Center, Shenyang 110031, China
*
Author to whom correspondence should be addressed.
Buildings 2026, 16(12), 2316; https://doi.org/10.3390/buildings16122316 (registering DOI)
Submission received: 16 May 2026 / Revised: 3 June 2026 / Accepted: 4 June 2026 / Published: 10 June 2026

Abstract

With the advancement of China’s carbon peaking and carbon neutrality targets and the low-carbon upgrading of the construction industry, steel fiber recycled aggregate concrete (SFRAC) has attracted increasing attention as a sustainable construction material due to its advantages in resource recycling and enhanced mechanical performance. However, its compressive strength is influenced by multiple interacting factors, making accurate prediction challenging when using conventional empirical or regression-based methods. To enhance predictive performance, a compressive strength database was established based on published experimental data. The input layer included seven mixture parameters: water content, cement content, fine aggregate content, natural coarse aggregate content, recycled coarse aggregate content, steel fiber content, and superplasticizer dosage, with the 28-day compressive strength serving as the output variable. Using this database, four prediction models were developed, including a back-propagation (BP) neural network and three optimized variants—GA–BP, PSO–BP, and GA–PSO–BP, optimized by genetic algorithm (GA) and particle swarm optimization (PSO)—were developed. Their performance was evaluated using the coefficient of determination (R2), root mean square error (RMSE), and mean absolute error (MAE). Among the four models, GA–PSO–BP produced the best predictive performance, with a best-run R2 of 0.9308 on the validation set, exceeding the BP, GA–BP, and PSO–BP neural networks by 0.0642, 0.0326, and 0.0512, respectively. Over 10 independent runs, it attained an average R2 of 0.8822 and consistently delivered the lowest RMSE and MAE with small standard deviations, confirming its superior predictive accuracy and stability. These findings suggest that integrating GA and PSO can effectively enhance the predictive accuracy and stability of the BP neural network, thereby providing a dependable reference for compressive strength prediction and mix proportion optimization of steel fiber recycled aggregate concrete.

1. Introduction

Against the backdrop of advancing “dual-carbon” goals and green low-carbon development, the recycling and utilization of construction waste have become an important research topic in civil engineering [1]. Replacing natural aggregate with recycled aggregate helps decrease construction waste accumulation and reduce the demand for natural aggregate, thereby contributing to resource reuse and environmental protection. However, recycled aggregate surfaces are covered with old mortar, and there are many pores and microcracks within the aggregates, which can increase water absorption and crushing value, weaken the aggregate–paste interfacial transition zone (ITZ), and ultimately reduce the mechanical performance and durability of the resulting concrete [2]. According to Kong et al. [3], steel fiber addition contributes to better mechanical behavior and stronger impact resistance in concrete containing recycled aggregates. Ghalehnovi et al. [4] reported that steel fibers improve the mechanical performance of recycled aggregate concrete by inhibiting crack propagation and enhancing toughness. Recent structural studies have confirmed the effectiveness of this material system in various members, including eccentrically loaded columns [5] and steel-fiber-reinforced concrete (SFRC) beams with composite-recycled aggregates [6]. These results highlight the engineering potential of steel fiber recycled aggregate concrete. However, its compressive strength remains influenced by multiple interacting factors, resulting in nonlinear behavior.
Multiple interacting factors govern the compressive strength of steel fiber recycled aggregate concrete (SFRAC), resulting in highly nonlinear behavior. Although traditional empirical formulas and regression-based methods can capture general trends, differences in raw material properties, mix proportion design, and testing conditions across studies often lead to significant variability in the data. This variability limits the prediction accuracy and generalizability of conventional methods, making it difficult to meet the engineering demand for efficient and accurate prediction of compressive strength.
The compressive strength of concrete containing recycled aggregates is difficult to predict due to nonlinear relationships between mix parameters and performance. Zhang et al. [7] demonstrated that machine learning methods can improve prediction accuracy, and Singh et al. [8] confirmed the effectiveness of six mainstream ML models for self-compacting recycled aggregate concrete. The BP neural network [9] can model these nonlinear relationships, but its performance is sensitive to initial parameters and prone to local minima. To enhance accuracy and stability, genetic algorithm (GA) and particle swarm optimization (PSO) were applied to optimize BP parameters, yielding GA–BP and PSO–BP networks. Huang et al. [10] further demonstrated the applicability of these optimization algorithms for concrete with recycled brick aggregate. GA offers robust global search, while PSO converges faster but may become trapped in local optima. Therefore, this study develops a GA–PSO–BP network combining the advantages of GA and PSO to achieve both global exploration and rapid convergence.
Therefore, this study develops a GA–PSO–BP neural network by combining GA and PSO to achieve a balance between global search capability and rapid convergence, further improving the accuracy of prediction and stability of the BP neural network. The predictive performance of the four models was compared using R2, RMSE, and MAE, thereby providing quantitative support for strength prediction of this type of concrete.

2. Experimental Data and Influencing Factor Analysis

2.1. Selection of Influencing Factors and Data Sources

The input variables were selected from mix proportion parameters that significantly influence the compressive strength of steel fiber recycled aggregate concrete. Studies by Duan, Wu, Naciri, and Sadegh-Zadeh [11,12,13,14] show that key factors such as cement content, water-to-binder ratio, aggregate composition, replacement ratio of recycled aggregate, fiber content, and admixture dosage have significant effects on the compressive strength of recycled aggregate concrete and fiber-reinforced recycled aggregate concrete. Together, these factors govern the strength development of steel fiber recycled aggregate concrete through their influences on the cement paste, aggregate skeleton, interfacial transition zones, and crack-bridging mechanisms. Specifically, cement and water contents determine the water-to-binder ratio and paste properties; aggregate proportions control the skeleton structure and interfacial properties; steel fiber content reflects the crack-bridging effect; and superplasticizer dosage affects workability and the compactness of hardened concrete. Based on these considerations, seven factors—water content (X1, kg/m3), cement content (X2, kg/m3), fine aggregate content (X3, kg/m3), natural coarse aggregate content (X4, kg/m3), recycled coarse aggregate content (X5, kg/m3), steel fiber content (X6, kg/m3), and superplasticizer dosage (X7, kg/m3)—were selected as input variables, while the 28-day cube compressive strength (fcu, MPa) was taken as the output variable.
The research data were collected from published studies on steel fiber recycled aggregate concrete [12,15,16,17,18,19,20,21,22,23,24,25,26,27,28]. To reduce the influence of hidden variables, samples were excluded when mineral admixture dosages, aggregate modification treatments, or steel fiber type/morphology introduced additional effects that could not be reliably represented by the selected input variables. Therefore, only samples with traceable mix proportions, confirmed 28-day cube compressive strength, and input variables consistent with the model structure were retained in the main database. To ensure consistency, compressive strengths were normalized to a 150 mm cube [29], all mix proportions were converted to kg/m3 [28], and units, parameter names, and strength measurement methods were standardized across different studies [28]. Based on these procedures, a comprehensive database was established to support subsequent model training and prediction analyses.

2.2. Data Preprocessing

Table 1 presents the statistical summary of the input and output variables used to describe the dataset distribution.
Table 1 shows that the variables differ considerably in terms of units and numerical ranges. The maximum values of natural coarse aggregate content and recycled coarse aggregate content reach 1283.00 kg/m3 and 1283.00 kg/m3, respectively, with standard deviations of 425.78 and 409.35, showing relatively high variability among the aggregate-related parameters. In contrast, the steel fiber content ranges only from 0 to 156.00 kg/m3, and the superplasticizer dosage ranges from 0 to 7.56 kg/m3. Superplasticizer dosage was set to 0 kg/m3 only when non-use was confirmed; samples with unverified superplasticizer dosage, unreported mineral-admixture dosages, or aggregate modification treatments were excluded to avoid hidden variables. Both values are much smaller than the mass-based parameters of cement and aggregates. Feeding the raw data directly into the model may cause variables with larger numerical values to dominate the weight updates, hindering stable convergence.
Safieh et al. [30] demonstrated in their machine learning study of concrete strength prediction that normalization can transform input features with different scales into a unified range, facilitating model training and comparison. Therefore, in this study, all variables were normalized to a common scale before modeling to mitigate the impact of scale discrepancies on model training. Following normalization, the samples were allocated to training and validation subsets for subsequent model development and performance assessment. Specifically, 70% of the samples served as the training set for model training and parameter optimization, while the remaining 30% were used as the validation set to evaluate the models’ predictive ability on unknown samples.

3. GA–PSO–BP Neural Network

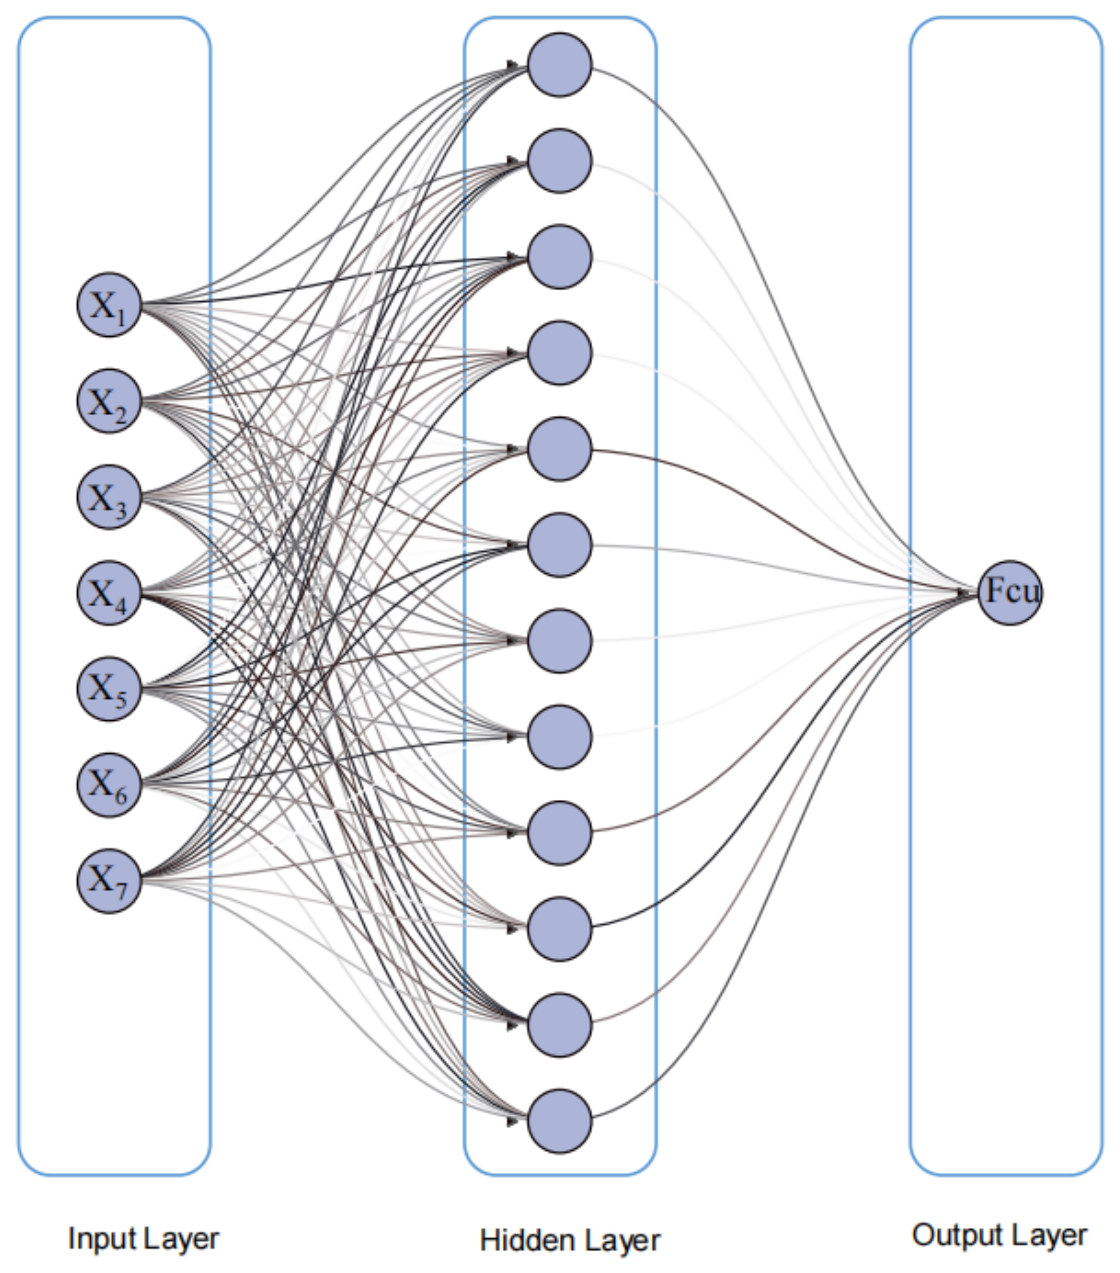
3.1. Principle of BP Neural Network

The BP neural network is a typical feedforward artificial neural network that continuously adjusts network weights and biases through error backpropagation, thereby establishing a nonlinear mapping between input and output variables [31]. Since the compressive strength of concrete is influenced by multiple mix proportion parameters and exhibits complex nonlinear relationships among these factors, the BP neural network is well-suited for predicting concrete compressive strength.
In this study, a single-hidden-layer BP neural network was employed as the base prediction model. The network input layer was composed of seven nodes corresponding to the selected variables X1–X7, including water, cement, fine aggregate, natural coarse aggregate, recycled coarse aggregate, steel fiber, and superplasticizer dosages. The output layer contained one node, which represented the predicted 28-day compressive strength of SFRAC. In the constructed network, tansig was selected for the hidden layer to describe nonlinear mapping from the inputs to strength, while purelin was adopted at the output layer to generate continuous values. During forward propagation, the normalized data moved sequentially across the input, hidden, and output layers to obtain the final prediction.
The forward propagation of the BP neural network is expressed as follows:
H j   =   f i = 1 m w ij x i + b j
Y ^ = j = 1 h v j H j + c
where xi represents the input variables; m is the number of input variables; wij and vj are connection weights; bj and c are biases; Hj is the hidden layer output; h is the number of hidden layer nodes; and Y ^ is the predicted 28-day cube compressive strength. During training, the network updates the weights and biases via backpropagation to minimize the prediction error.

3.2. Particle Swarm Optimization (PSO)

PSO [32] is a swarm-based optimization method. It optimizes parameters by repeatedly updating the positions and velocities of particles within the search space. Each particle represents a candidate solution, with its position corresponding to a specific set of parameters. During the optimization process, particle movement is guided by both the individual best position (pbest) and the global best position (gbest), enabling the swarm to progressively converge toward the optimal solution.
The position and velocity updates in PSO are expressed as follows:
v i t + 1 = ω v i t   +   c 1 r 1 p i t x i t   +   c 2 r 2 g t x i t
x i t + 1 = x i t + v i t + 1
where v i t and x i t denote the velocity and position of the i-th particle at the t-th iteration, respectively; ω is the inertia weight; c1 and c2 are learning factors; r1 and r2 are random numbers within the interval [0, 1]; p i t represents the personal best position of the i-th particle; and gt is the global historical best position of the swarm. Through this updating mechanism, particles iteratively adjust their positions in the search space under the combined guidance of the personal best and global best solutions, thereby enhancing the optimization performance of the algorithm. This process reduces the dependence on random initialization and improves the stability of model training. However, PSO may still suffer from premature convergence to local optima during the optimization process.

3.3. Genetic Algorithm (GA)

GA is an evolutionary search method based on natural selection and genetic evolution mechanisms. It searches for optimal solutions through selection, crossover, and mutation operations [33]. Compared with traditional gradient-based optimization methods, GA does not require derivative information of the objective function and is capable of exploring a broad search space to identify high-quality solutions. This characteristic makes GA particularly suitable for parameter optimization in complex nonlinear problems.
The basic procedure of GA includes encoding, population initialization, fitness evaluation, selection, crossover, mutation, and termination criteria. First, the variables to be optimized are encoded into chromosomes, and an initial population is randomly generated. Next, the fitness of each individual is evaluated, with higher fitness indicating a closer correspondence to the optimization objective and a higher probability of being selected for the next generation.
During the evolutionary process, selection retains high-quality individuals; crossover generates new individuals by exchanging genetic information between parents; and mutation introduces stochastic perturbations to explore new search directions, thereby enhancing population diversity and mitigating premature convergence. Over successive generations, the overall fitness of the population progressively improves, ultimately converging to a satisfactory solution that either meets the desired accuracy or reaches the predefined maximum number of generations.
Overall, GA offers strong global search capability, good adaptability, and minimal requirements on the form of the objective function. However, its performance is sensitive to parameters such as population size, crossover probability, and mutation probability, and in later iterations it may exhibit slow convergence and insufficient local fine-search capability.

3.4. GA–PSO–BP Collaborative Optimization Mechanism

The proposed GA–PSO–BP neural network was constructed to jointly determine suitable initial values for the BP weights and biases. In this hybrid approach, GA was first employed to perform a global search, yielding a set of near-optimal initial parameters. Subsequently, PSO was introduced to further refine the search from these GA-optimized parameters, thereby alleviating the sensitivity of conventional BP networks to initial weight and bias settings.
Four types of parameters were optimized in the GA–PSO–BP model: input-layer weights, hidden-layer biases, output-layer weights, and output-layer biases. The collaborative optimization mechanism is illustrated in Figure 1. First, these parameters were encoded into a complete parameter vector, and a fitness function based on prediction error was used to evaluate different parameter combinations. The fitness function was defined as the RMSE between the predicted and measured compressive strengths on the training set. During the GA stage, the population was iteratively updated through selection, crossover, and mutation operations, allowing the identification of high-quality parameter configurations across a broad search space. Once the GA-optimized solution was obtained, it was used as the initial search point for PSO, which further performed iterative optimization. The PSO search process was conducted in two phases: in the first phase, the search focused on identifying improved parameter solutions in the vicinity of the GA result, while in the second phase, the search range was further reduced to refine the parameter values. Finally, the optimized weights and biases were assigned to the BP neural network, which was then trained to predict the compressive strength.
This collaborative strategy integrates the complementary advantages of the two algorithms, using GA for global exploration and PSO for faster convergence. Specifically, GA is employed to explore a broader parameter space, thereby mitigating premature convergence to local optima, while PSO further refines the parameter search process, enhancing optimization efficiency and providing the BP network with more appropriate initial weights and biases. Compared with standalone GA or PSO, GA–PSO collaborative optimization leads to higher predictive accuracy and more stable model performance.

3.5. Model Workflow

A compressive strength database with 185 samples was compiled from published studies [12,15,16,17,18,19,20,21,22,23,24,25,26,27,28]. The dataset was then partitioned by the SPXY method (Sample set Partitioning based on joint X–Y distances) [34] into training and validation subsets at a 7:3 ratio, with 130 samples used for training and 55 samples used for validation. This method ensures that both the input and output distributions are uniformly represented in the two subsets.
Before training, the network structure was determined according to the numbers of input and output variables. The input layer consisted of seven nodes corresponding to the previously defined variables X1–X7, while the output layer contained one node representing the predicted 28-day compressive strength of steel fiber recycled aggregate concrete. Based on preliminary experiments, the number of hidden layer nodes was set to 12, as illustrated in Figure 2. After defining the network structure, the normalized training data were used to train the model, and the validation set was employed for performance evaluation.
During model development, four prediction models—BP, GA–BP, PSO–BP, and GA–PSO–BP—were established, with BP used as the baseline model. For GA–BP and PSO–BP, GA and PSO were applied separately to optimize the initial parameters of BP. The GA–PSO–BP neural network obtained more appropriate initial weights and biases through the collaborative optimization of GA and PSO. After defining the network structure and optimizing the parameters, the normalized training data were used to train each model, while the validation set was employed for performance evaluation. By comparing the prediction results of the four models, the effects of different optimization strategies on the prediction accuracy and stability of the BP neural network were analyzed.
Table 2 presents the hyperparameter settings adopted for model construction. For the BP model, the hidden layer was set to 12 neurons, with a learning rate of 0.01 and a maximum of 1000 training epochs. For GA optimization, population size was set to 50 and generations to 100. For PSO, swarm size was 50, with a maximum of 100 iterations. These parameters were determined based on preliminary experiments and repeated training to achieve stable convergence and satisfactory prediction performance.

4. Model Training and Validation Results Analysis

4.1. Evaluation Metrics for Model Workflow

To quantify model performance in SFRAC compressive strength prediction, R2, RMSE, and MAE were used as the main evaluation metrics [30,31]. R2 reflects the degree of agreement between predicted and actual values; a value closer to 1 indicates better model fitting. RMSE quantifies overall differences between predicted and measured values; lower RMSE indicates smaller prediction errors. MAE describes mean absolute prediction error, and lower MAE suggests more stable and accurate results.
In practice, these three metrics are used together to comprehensively assess the prediction accuracy and stability of different models for steel fiber recycled aggregate concrete.
The formulas for these evaluation metrics are as follows:
R 2   =   1 i = 1 n ( y i y ^ i ) 2 i = 1 n ( y i y ¯ ) 2
R M S E = 1 n i = 1 n ( y i y ^ i ) 2
M A E = 1 n i = 1 n | y i y ^ i |
where yi is the measured compressive strength value of the i-th sample; y ^ i is the predicted value of the i-th sample obtained by the model; y ¯ is the mean value of the measured compressive strength; and n is the number of samples.

4.2. Comparison of Training Set Prediction Results

The fitting results of the four neural networks (BP, PSO–BP, GA–BP, and GA–PSO–BP) on the training set were compared, as shown in Figure 3, Figure 4, Figure 5 and Figure 6. In these figures, the horizontal axis represents the experimental values, the vertical axis represents the predicted values, the dashed line denotes the ideal prediction line (y = x), and the solid line represents the linear fit. The marginal histograms and density curves characterize the distribution features of the samples. Overall, the prediction points of the four models are mainly distributed near the ideal line, indicating that all models can effectively learn the nonlinear relationship between compressive strength and the input variables. However, noticeable differences still exist among the models in terms of fitting accuracy and error control capability.
The BP neural network achieved R2, RMSE, and MAE values of 0.9124, 2.7811, and 2.0000 on the training set, respectively, indicating a reasonable level of predictive capability; however, the scatter points exhibited noticeable dispersion, suggesting that the standalone BP model was sensitive to the random initialization of weights and biases, resulting in limited prediction stability. After PSO, the R2 of the PSO–BP neural network increased to 0.9341, while the RMSE and MAE decreased to 2.4123 and 1.6862, respectively, indicating a reduction in prediction errors and demonstrating that PSO effectively enhances the parameter optimization performance of the BP network. For the GA–BP model, the R2 further increased to 0.9550, and the RMSE and MAE decreased to 1.9934 and 1.4132, respectively, with the scatter points more closely aligned with the ideal line, indicating that GA exhibits strong global search capability and performs effectively in initial parameter optimization.
Among the four models, the GA–PSO–BP neural network exhibited the best performance, with the training set R2 reaching 0.9732 and the RMSE and MAE decreasing to 1.5387 and 1.0718, respectively. As shown in Figure 6, the prediction points of this model were most densely distributed near the ideal line (y = x), and the fitted line closely approached the ideal line. This indicates that the GA–PSO–BP neural network outperformed the other models in terms of both prediction accuracy and stability for compressive strength.
These results demonstrated that the integration of GA and PSO effectively leveraged the global search capability of the genetic algorithm and the local optimization ability of particle swarm optimization, thereby mitigating the BP neural network’s sensitivity to initial parameters and susceptibility to local optima. As a result, the reliability of compressive strength prediction for steel fiber recycled aggregate concrete was improved.

4.3. Comparison of Prediction Results on the Validation Set

The training set results primarily reflect the model’s ability to fit existing samples and cannot serve as the sole criterion for performance evaluation, as overfitting may lead to degraded prediction accuracy on unseen data. Therefore, the generalization ability of the models was further assessed using the validation set. The fitting results of the four models on the validation set are presented in Figure 7, Figure 8, Figure 9 and Figure 10. Compared with the training set, the validation results provide a more direct evaluation of model generalization performance. Overall, the predicted scatter points of all four models are predominantly distributed around the ideal prediction line (y = x), indicating that each model retains a certain level of external predictive capability. However, noticeable differences in generalization performance are observed, as evidenced by variations in scatter dispersion, the proximity of the fitted line to the ideal line, and the associated error metrics.
The R2, RMSE, and MAE values of the BP neural network on the validation set were 0.8666, 2.7109, and 2.1506, respectively, indicating that the model can capture the general variation trend of compressive strength. However, the prediction points are relatively scattered, and some samples deviate from the ideal line. The fitting equation is y = 0.84185x + 7.54652, with a slope significantly lower than 1, indicating a tendency toward prediction compression on the validation set and insufficient predictive capability for high-strength samples. For the PSO–BP neural network, the validation set R2 increased to 0.8796, while the RMSE and MAE decreased to 2.5753 and 2.0093, respectively. However, the slope of its fitting line was 0.82146, which still deviates from the ideal line, indicating that further improvement in generalization stability is required.
In contrast, the GA–BP neural network achieved further improvements in prediction performance on the validation set, with an R2 of 0.8982 and RMSE and MAE values reduced to 2.3686 and 1.8142, respectively. As illustrated in Figure 9, the prediction points of the GA–BP neural network are more closely clustered around the ideal line than those of the BP and PSO–BP neural networks, indicating that the genetic algorithm enhances the adaptability of the BP neural network to unseen samples through optimization of initial weights and thresholds. GA–PSO–BP achieved optimal validation-set performance, with R2 = 0.9308 and RMSE and MAE reduced to 1.9525 and 1.4895. Compared with BP, GA–PSO–BP reduced RMSE and MAE by approximately 28.0% and 30.7%, indicating a significant improvement in error control capability.
As illustrated in Figure 10, the prediction scatter points of the GA–PSO–BP neural network were the most tightly clustered, and its fitted line showed the closest agreement with the ideal line(y = x). Based on the overall validation set results, this model not only achieved higher prediction accuracy but also demonstrated superior stability and generalization ability. The marginal histograms and density curves further indicated that the distribution pattern of the predicted values of the GA–PSO–BP neural network was highly consistent with that of the experimental values. These results indicate that GA–PSO–BP provides superior accuracy, stability, and generalization ability for SFRAC compressive strength prediction, making it suitable for subsequent analysis.
This result can be attributed to the synergistic optimization of GA and PSO. GA performs a global search to identify near-optimal initial parameters, thereby reducing the impact of random initialization in the BP neural network, while PSO further refines these parameters through local optimization. Through this hybrid strategy, the model’s ability to capture complex nonlinear relationships is enhanced, resulting in improved accuracy and stability in predicting the compressive strength of steel fiber-reinforced recycled aggregate concrete.
Although the proposed GA–PSO–BP neural network achieved high prediction accuracy, the limited database size and nonlinear fitting capability may still introduce potential overfitting risk. To evaluate model robustness and generalization performance, SPXY-based data splitting, repeated independent runs, and statistical stability analysis were employed. The validation results demonstrated satisfactory predictive capability on unseen samples, suggesting that severe overfitting was effectively mitigated.

4.4. Statistical Stability and Robustness Analysis

Figure 3, Figure 4, Figure 5, Figure 6, Figure 7, Figure 8, Figure 9 and Figure 10 illustrate representative fitting results for the four models under the selected training–validation split, whereas Table 3 and Table 4 provide a statistical summary of model performance across repeated runs. To further assess the robustness and stability of the proposed prediction models, each model was independently executed 10 times using different random initializations. For each run, R2, RMSE, and MAE were calculated for both the training and validation sets. The resulting mean ± standard deviation values are reported in Table 3 and Table 4, allowing the prediction accuracy and performance variability of different models to be compared more comprehensively.
As shown in the validation results, the proposed GA–PSO–BP neural network achieved the highest average R2 value (0.8822 ± 0.0246) and the lowest RMSE (2.4036 ± 0.2330) and MAE (1.8045 ± 0.1889) values among all comparative models, indicating superior prediction accuracy and robustness. Compared with the BP, PSO–BP, and GA–BP models, the GA–PSO–BP model achieved higher predictive accuracy and lower performance variation across the 10 independent runs. The relatively small standard deviations further demonstrate the satisfactory stability and generalization capability of the GA–PSO–BP neural network.
Figure 11 shows the boxplots of validation R2 values from 10 independent runs for each neural network. Compared with the BP, PSO–BP, and GA–BP neural networks, the GA–PSO–BP neural network achieved a higher median R2 and a more compact distribution, further confirming its enhanced prediction stability and reliability.

4.5. Sensitivity and Feature Importance Analysis

To further investigate the influence of different input variables on the predicted compressive strength of steel fiber recycled aggregate concrete, permutation feature importance analysis and perturbation-based sensitivity analysis were conducted for the proposed GA–PSO–BP neural network.
As shown in Figure 12, recycled coarse aggregate (RCA), natural aggregate, and water content were identified as the most influential variables, whereas steel fiber, superplasticizer (SP), and cement exhibited relatively smaller contributions.
As shown in Figure 13, water content showed the highest sensitivity, followed by RCA, cement, and SP, suggesting that variations in water dosage and recycled aggregate replacement have a substantial influence on the predicted compressive strength.
To further examine the response behavior of key variables, sensitivity curves were generated, as shown in Figure 14. The predicted compressive strength gradually decreased with increasing water content and RCA dosage, which agrees well with the increased porosity and weakened interfacial transition zone commonly observed in recycled aggregate concrete. In contrast, increasing cement content led to higher predicted compressive strength due to the densification of the cement matrix. Steel fiber showed a moderate strengthening effect at lower dosage levels; however, excessive fiber content slightly reduced the predicted strength, possibly because of fiber agglomeration and reduced workability.
Overall, the sensitivity analysis demonstrates that the proposed GA–PSO–BP neural network not only achieved satisfactory predictive performance but also captured physically meaningful relationships between key material parameters and compressive strength.

5. Conclusions

In this study, the 28-day compressive strength of steel fiber recycled aggregate concrete was taken as the prediction target. Seven factors that have significant effects on its compressive strength were selected as input variables, and four prediction models, namely BP, PSO–BP, GA–BP, and GA–PSO–BP, were established. Their prediction performances were then compared and analyzed. The main conclusions are as follows:
Based on the training set results, the PSO–BP, GA–BP, and GA–PSO–BP models all outperformed the standalone BP network, confirming that intelligent optimization algorithms can effectively reduce the sensitivity to random initial weights and biases. Among them, the GA–PSO–BP model, which integrates GA’s global search with PSO’s local refinement, achieved the highest average R2 (0.9290) and the lowest RMSE and MAE across 10 independent runs.
On the validation set, this model likewise delivered the best overall prediction performance, attaining an average R2 of 0.8822 and a best-run R2 of 0.9308—exceeding the BP, GA–BP, and PSO–BP models by 0.0642, 0.0326, and 0.0512, respectively. Moreover, the consistently low RMSE and MAE, together with small standard deviations, demonstrate strong predictive accuracy, stability, and effective error control.
The GA–PSO–BP neural network provides a reference for compressive strength prediction, mix proportion design, and engineering application of steel fiber recycled aggregate concrete. Future studies could further expand the experimental dataset and incorporate additional parameters—such as the water absorption and crushing index of recycled aggregates, the aspect ratio of steel fibers, and curing conditions—to enhance the applicability and interpretability of the model.

Author Contributions

Conceptualization, S.Z.; methodology, S.Z.; software, S.Z.; validation, S.Z. and D.Z.; formal analysis, S.Z. and D.Z.; investigation, S.Z.; resources, S.Z.; data curation, S.Z. and D.Z.; writing—original draft preparation, S.Z.; writing—review and editing, S.Z. and D.Z.; visualization, S.Z.; supervision, C.Y.; project administration, C.Y. All authors have read and agreed to the published version of the manuscript.

Funding

This research was supported by the Northeast Geological S&T Innovation Center of China Geological Survey under grant QCJJ2023-56 and the Scientific Research Project of the Liaoning Provincial Department of Education under grant LJKMZ20221823.

Data Availability Statement

The data have been fully presented in the manuscript, and the complete dataset is available from the corresponding author upon reasonable request.

Acknowledgments

The authors would like to express their sincere gratitude to all those who provided help and support during this study.

Conflicts of Interest

The authors declare no conflicts of interest.

References

  1. Duan, Z.; Deng, Q.; Xiao, J.; Zhuang, Y.; Li, J.; Xia, B.; Zhang, S.; Xiao, X. Building Demolition and Solid Waste Recycling Technologies: Prospects and Paths. Strateg. Study Chin. Acad. Eng. 2025, 27, 117–128. [Google Scholar] [CrossRef]
  2. Memon, S.A.; Bekzhanova, Z.; Murzakarimova, A. A review of improvement of interfacial transition zone and adherent mortar in recycled concrete aggregate. Buildings 2022, 12, 1600. [Google Scholar] [CrossRef]
  3. Kong, X.; Yao, Y.; Wu, B.; Zhang, W.; He, W.; Fu, Y. The Impact Resistance and Mechanical Properties of Recycled Aggregate Concrete with Hooked-End and Crimped Steel Fiber. Materials 2022, 15, 7029. [Google Scholar] [CrossRef]
  4. Ghalehnovi, M.; Karimipour, A.; de Brito, J.; Chaboki, H.R. Crack width and propagation in recycled coarse aggregate concrete beams reinforced with steel fibres. Appl. Sci. 2020, 10, 7587. [Google Scholar] [CrossRef]
  5. Li, C.; Geng, H.; Deng, C.; Li, B.; Zhao, S. Experimental Investigation on Columns of Steel Fiber Reinforced Concrete with Recycled Aggregates under Large Eccentric Compression Load. Materials 2019, 12, 445. [Google Scholar] [CrossRef] [PubMed]
  6. Zhao, M.; Wang, K.; Zhao, M.; Li, C.; Ding, X.; Zhao, S. A Study on Shear Performance of Longitudinally Reinforced SFRC Beams with Satisfactory Composite-Recycled Aggregates. Buildings 2026, 16, 788. [Google Scholar] [CrossRef]
  7. Zhang, X.; Dai, C.; Li, W.; Chen, Y. Prediction of Compressive Strength of Recycled Aggregate Concrete Using Machine Learning and Bayesian Optimization Methods. Front. Earth Sci. 2023, 11, 1112105. [Google Scholar] [CrossRef]
  8. Singh, T.; Kapoor, K.; Singh, S.P. Predictive modelling on the compressive strength and fresh properties of self-compacting recycled aggregate concrete using machine learning approaches. Mater. Constr. 2025, 75, e375. [Google Scholar] [CrossRef]
  9. Zhang, K.; Li, X.; Zhang, S.; Zhang, S. A Bio-Inspired Adaptive Probability IVYPSO Algorithm with Adaptive Strategy for Backpropagation Neural Network Optimization in Predicting High-Performance Concrete Strength. Biomimetics 2025, 10, 515. [Google Scholar] [CrossRef]
  10. Huang, W.; Zhou, L.; Ge, P.; Yang, T. A Comparative Study on Compressive Strength Model of Recycled Brick Aggregate Concrete Based on PSO–BP and GA–BP Neural Networks. Mater. Rep. 2021, 35, 15026–15030. [Google Scholar] [CrossRef]
  11. Duan, S. Compressive Strength Prediction of Fiber-Reinforced Recycled Aggregate Concrete Based on Optimization Algorithms. Front. Built Environ. 2024, 10, 1509714. [Google Scholar] [CrossRef]
  12. Wu, C.; Shi, Y.; Xu, J.; Luo, M.; Lu, Y.; Zhu, D. Experimental Study of Mechanical Properties and Theoretical Models for Recycled Fine and Coarse Aggregate Concrete with Steel Fibers. Materials 2024, 17, 2933. [Google Scholar] [CrossRef]
  13. Naciri, H.; Alaoui, O.; Zaouri, H.; Xu, J. Interpretable Machine Learning and PSO-Based Optimization for Predicting the Mechanical Performance of Steel Fiber-Reinforced Recycled Aggregate Concrete: A Dual Focus on Compressive and Splitting Tensile Strengths. Am. J. Civ. Eng. Constr. 2025, 1, 34–43. [Google Scholar] [CrossRef]
  14. Sadegh-Zadeh, S.A.; Dastmard, A.; Montazeri Kafshgarkolaei, L.; Movahedi, S.; Shiry Ghidary, S.; Najafi, A.; Saadat, M. Machine Learning Modelling for Compressive Strength Prediction of Superplasticizer-Based Concrete. Infrastructures 2023, 8, 21. [Google Scholar] [CrossRef]
  15. Song, Y.T.; Jiang, H.; Cai, X.; Liao, B. Study on the Influence of Different Steel Fiber Contents on the Compressive Strength of Recycled Concrete. Sichuan Build. Mater. 2013, 39, 34–36. [Google Scholar]
  16. Luo, F.F. Experimental Study on Flexural Properties and Damage Process of Steel Fiber Recycled Coarse Aggregate Concrete. Master’s Thesis, Zhengzhou University, Zhengzhou, China, 2023. [Google Scholar]
  17. Zhou, C.; He, W.C.; Kong, X.Q.; Zheng, Z.Y.; Wang, X.Z. Study on Impact Behavior of Steel Fiber Recycled Concrete. Concrete 2021, 5, 36–41. [Google Scholar] [CrossRef]
  18. Chen, Y.H. Experimental Study on Shear Behavior of Steel Fiber Recycled Concrete Beams. Master’s Thesis, Zhengzhou University of Aeronautics, Zhengzhou, China, 2025. [Google Scholar]
  19. Lu, J.Y. Mix Proportion and Basic Mechanical Properties of Steel Fiber Recycled Concrete. Master’s Thesis, Zhengzhou University, Zhengzhou, China, 2014. [Google Scholar]
  20. Jing, M.W. Orthogonal Analysis of Mechanical Properties of Recycled Coarse Aggregate Concrete. Hunan Commun. Sci. Technol. 2017, 43, 98–100. [Google Scholar]
  21. Dai, Y.F. Study on Size Effect of Compression Performance of Steel Fiber Reinforced Recycled Concrete. Master’s Thesis, Hunan University, Changsha, China, 2020. [Google Scholar]
  22. Yu, F.; Li, L.B.; Yao, D.L. Mechanical Properties of Steel Fiber Reinforced Self-Compacting Recycled Concrete. Bull. Chin. Ceram. Soc. 2025, 44, 264–273. [Google Scholar] [CrossRef]
  23. Peng, W.C. Experimental Study on Impact Resistance of Steel Fiber Self-Compacting Recycled Concrete. Master’s Thesis, Shenyang University of Technology, Shenyang, China, 2025. [Google Scholar]
  24. Yang, M.Y. Study on Flexural Behavior of Hybrid-Reinforced Steel Fiber Recycled Concrete Beams. Master’s Thesis, Zhengzhou University of Aeronautics, Zhengzhou, China, 2024. [Google Scholar]
  25. Zhu, T. Study on Fracture Properties of Concrete After Modification of Recycled Coarse Aggregate and Addition of Steel Fibers. Master’s Thesis, Hebei University of Engineering, Handan, China, 2022. [Google Scholar]
  26. You, P.; Ma, Z.; Zhang, L.; Wang, Y.; Feng, Q.; Li, L. Impact of Steel Fiber Volume Fraction and Morphology on the Strength of Recycled Aggregate Concrete. Buildings 2023, 13, 2341. [Google Scholar] [CrossRef]
  27. Chen, G.M.; He, Y.H.; Yang, H.; Chen, J.F.; Guo, Y.C. Compressive Behavior of Steel Fiber Reinforced Recycled Aggregate Concrete after Exposure to Elevated Temperatures. Constr. Build. Mater. 2014, 71, 1–15. [Google Scholar] [CrossRef]
  28. Gao, D.; Zhang, L.; Nokken, M.; Zhao, J. Mixture Proportion Design Method of Steel Fiber Reinforced Recycled Coarse Aggregate Concrete. Materials 2019, 12, 375. [Google Scholar] [CrossRef] [PubMed]
  29. del Viso, J.R.; Carmona, J.R.; Ruiz, G. Shape and Size Effects on the Compressive Strength of High-Strength Concrete. Cem. Concr. Res. 2008, 38, 386–395. [Google Scholar] [CrossRef]
  30. Safieh, H.; Hawileh, R.A.; Assad, M.; Hajjar, R.; Shaw, S.K.; Abdalla, J. Using Multiple Machine Learning Models to Predict the Strength of UHPC Mixes with Various FA Percentages. Infrastructures 2024, 9, 92. [Google Scholar] [CrossRef]
  31. Xu, Y.; Mao, J.; Zhuge, W.; Yu, X.; Wu, P. Prediction and Evaluation of Hardened Concrete Strength: Based on Machine Learning and Mixture Composition; Springer: Singapore, 2026. [Google Scholar] [CrossRef]
  32. Freitas, D.; Lopes, L.G.; Morgado-Dias, F. Particle Swarm Optimisation: A Historical Review Up to the Current Developments. Entropy 2020, 22, 362. [Google Scholar] [CrossRef]
  33. Papazoglou, G.; Biskas, P. Review and Comparison of Genetic Algorithm and Particle Swarm Optimization in the Optimal Power Flow Problem. Energies 2023, 16, 1152. [Google Scholar] [CrossRef]
  34. Galvão, R.K.H.; Araujo, M.C.U.; José, G.E.; Pontes, M.J.C.; Silva, E.C.; Saldanha, T.C.B. A Method for Calibration and Validation Subset Partitioning. Talanta 2005, 67, 736–740. [Google Scholar] [CrossRef] [PubMed]
Figure 1. Working principle of the GA–PSO–BP neural network.
Buildings 16 02316 g001
Figure 2. Structure diagram of GA–PSO–BP neural network.
Buildings 16 02316 g002
Figure 3. Training-set fitting results of the BP neural network.
Buildings 16 02316 g003
Figure 4. Training-set fitting results of the PSO–BP neural network.
Buildings 16 02316 g004
Figure 5. Training-set fitting results of the GA–BP neural network.
Buildings 16 02316 g005
Figure 6. Training-set fitting results of the GA–PSO–BP neural network.
Buildings 16 02316 g006
Figure 7. Validation-set fitting results of the BP neural network.
Buildings 16 02316 g007
Figure 8. Validation-set fitting results of the PSO–BP neural network.
Buildings 16 02316 g008
Figure 9. Validation-set fitting results of the GA–BP neural network.
Buildings 16 02316 g009
Figure 10. Validation-set fitting results of the GA–PSO–BP neural network.
Buildings 16 02316 g010
Figure 11. Validation R2 boxplots of different prediction neural networks.
Buildings 16 02316 g011
Figure 12. Permutation feature importance analysis of input variables for compressive strength prediction.
Buildings 16 02316 g012
Figure 13. Perturbation-based sensitivity analysis results of different input variables.
Buildings 16 02316 g013
Figure 14. Sensitivity curves of key input variables for predicted compressive strength.
Buildings 16 02316 g014
Table 1. Descriptive statistics of the input and output variables.
ParameterUnitMinimumMaximumMeanStandard
Deviation
X1kg/m3158255.71190.6222.94
X2kg/m3260663419.8867.30
X3kg/m35571255734.23109.45
X4kg/m301283488.92425.78
X5kg/m301283.00526.00409.35
X6kg/m30156.0050.5846.87
X7kg/m307.562.192.49
fcuMPa24.2065.4044.618.88
Table 2. Main hyperparameter settings used in the prediction models.
ModelParameterValue
BPHidden neurons12
BPLearning rate0.01
BPEpochs1000
GAPopulation size50
GAGenerations100
PSOSwarm size50
PSOIterations100
Table 3. Statistical performance results of the training set obtained from 10 independent runs.
MODELR2RMSEMAE
BP0.8953 ± 0.0356 3.0157 ± 0.54052.1695 ± 0.4083
PSO–BP0.9006 ± 0.01812.9700 ± 0.25512.1616 ± 0.1666
GA–BP0.9134 ± 0.04142.5968 ± 0.32941.8866 ± 0.2528
GA–PSO–BP0.9290 ± 0.02422.4501 ± 0.4308 1.8290 ± 0.2814
Table 4. Statistical performance results of the validation set obtained from 10 independent runs.
MODELR2RMSEMAE
BP0.8053 ± 0.06073.0764 ± 0.44162.3000 ± 0.2708
PSO–BP0.8417 ± 0.03132.7909 ± 0.25052.0663 ± 0.3492
GA–BP0.8445 ± 0.02792.7657 ± 0.22722.1183 ± 0.2302
GA–PSO–BP0.8822 ± 0.02462.4036 ± 0.23301.8045 ± 0.1889
Disclaimer/Publisher’s Note: The statements, opinions and data contained in all publications are solely those of the individual author(s) and contributor(s) and not of MDPI and/or the editor(s). MDPI and/or the editor(s) disclaim responsibility for any injury to people or property resulting from any ideas, methods, instructions or products referred to in the content.

