Author Contributions
Conceptualization, Y.Y. and Q.Y.; methodology, Y.Y. and F.D.; software, Y.Y. and Q.Y.; validation, Y.Y. and J.Q.; formal analysis, Y.Y., Q.Y. and X.Z.; investigation, Y.Y., Q.Y. and J.Q.; resources, Y.Y., Q.Y. and J.Q.; data curation, X.Z.; writing—original draft preparation, Y.Y. and Q.Y.; writing—review and editing, Y.Y. and Q.Y.; visualization, Y.Y.; supervision, J.Q.; project administration, Y.Y., Q.Y. and J.Q.; funding acquisition, Q.Y. and F.D. All authors have read and agreed to the published version of the manuscript.
Figure 1.
Schematic diagram of the containment steel liner anchorage system.
Figure 1.
Schematic diagram of the containment steel liner anchorage system.
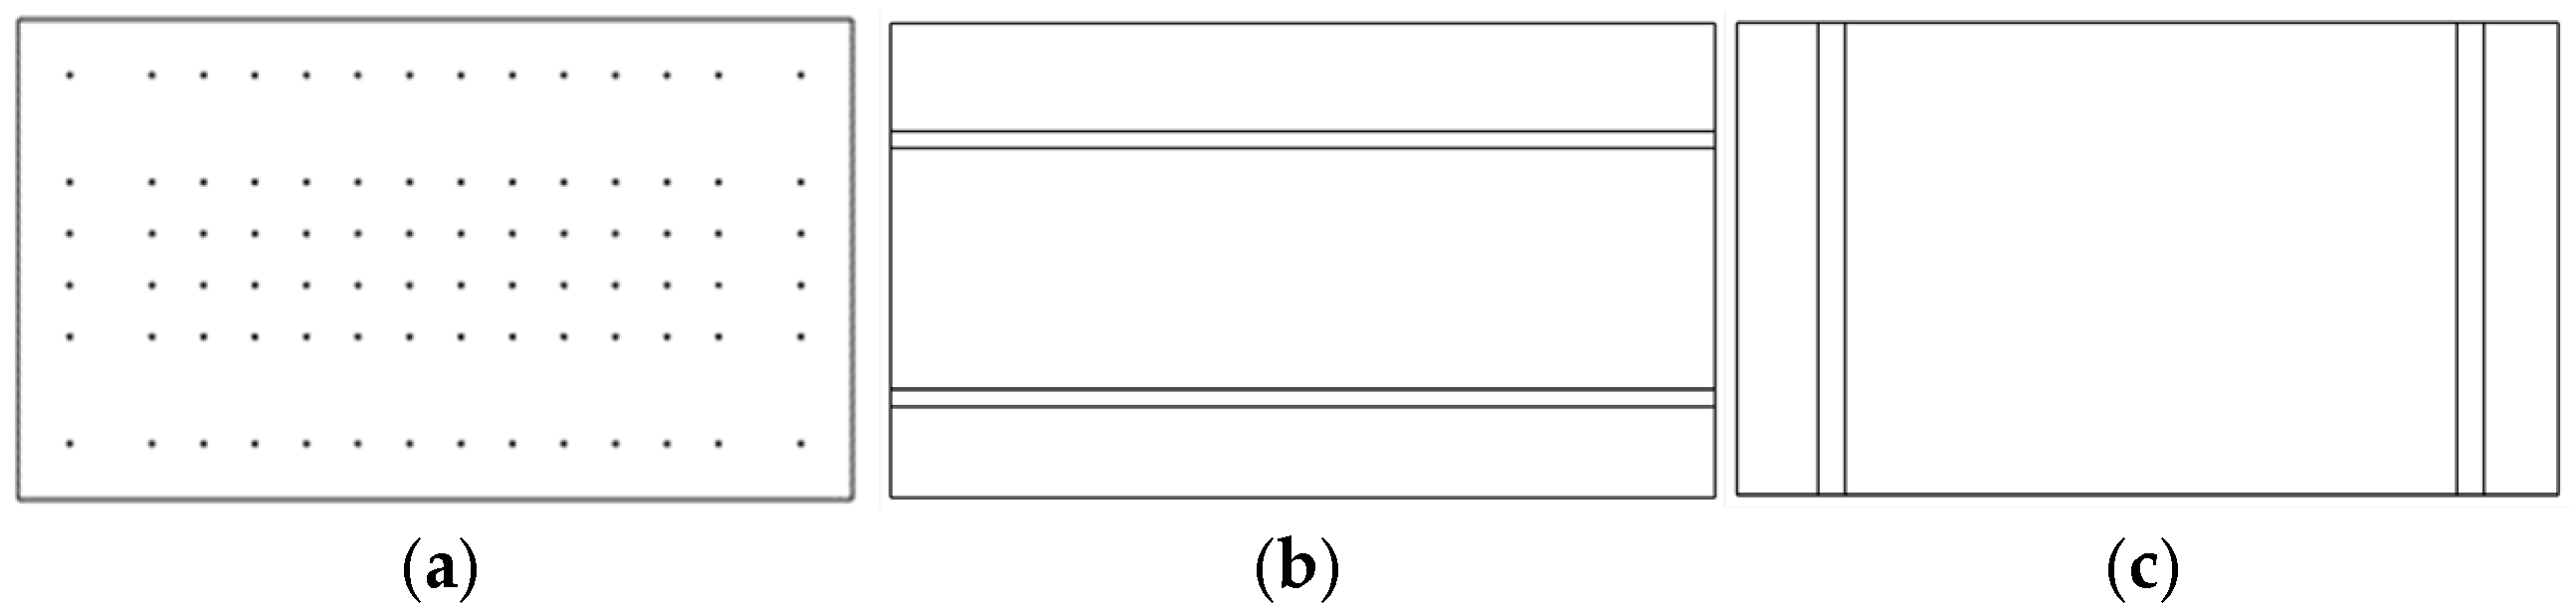
Figure 2.
Two anchorage forms of containment steel liner: (a) stud anchorage; (b) long-angle steel anchorage; (c) short-angle steel anchorage.
Figure 2.
Two anchorage forms of containment steel liner: (a) stud anchorage; (b) long-angle steel anchorage; (c) short-angle steel anchorage.
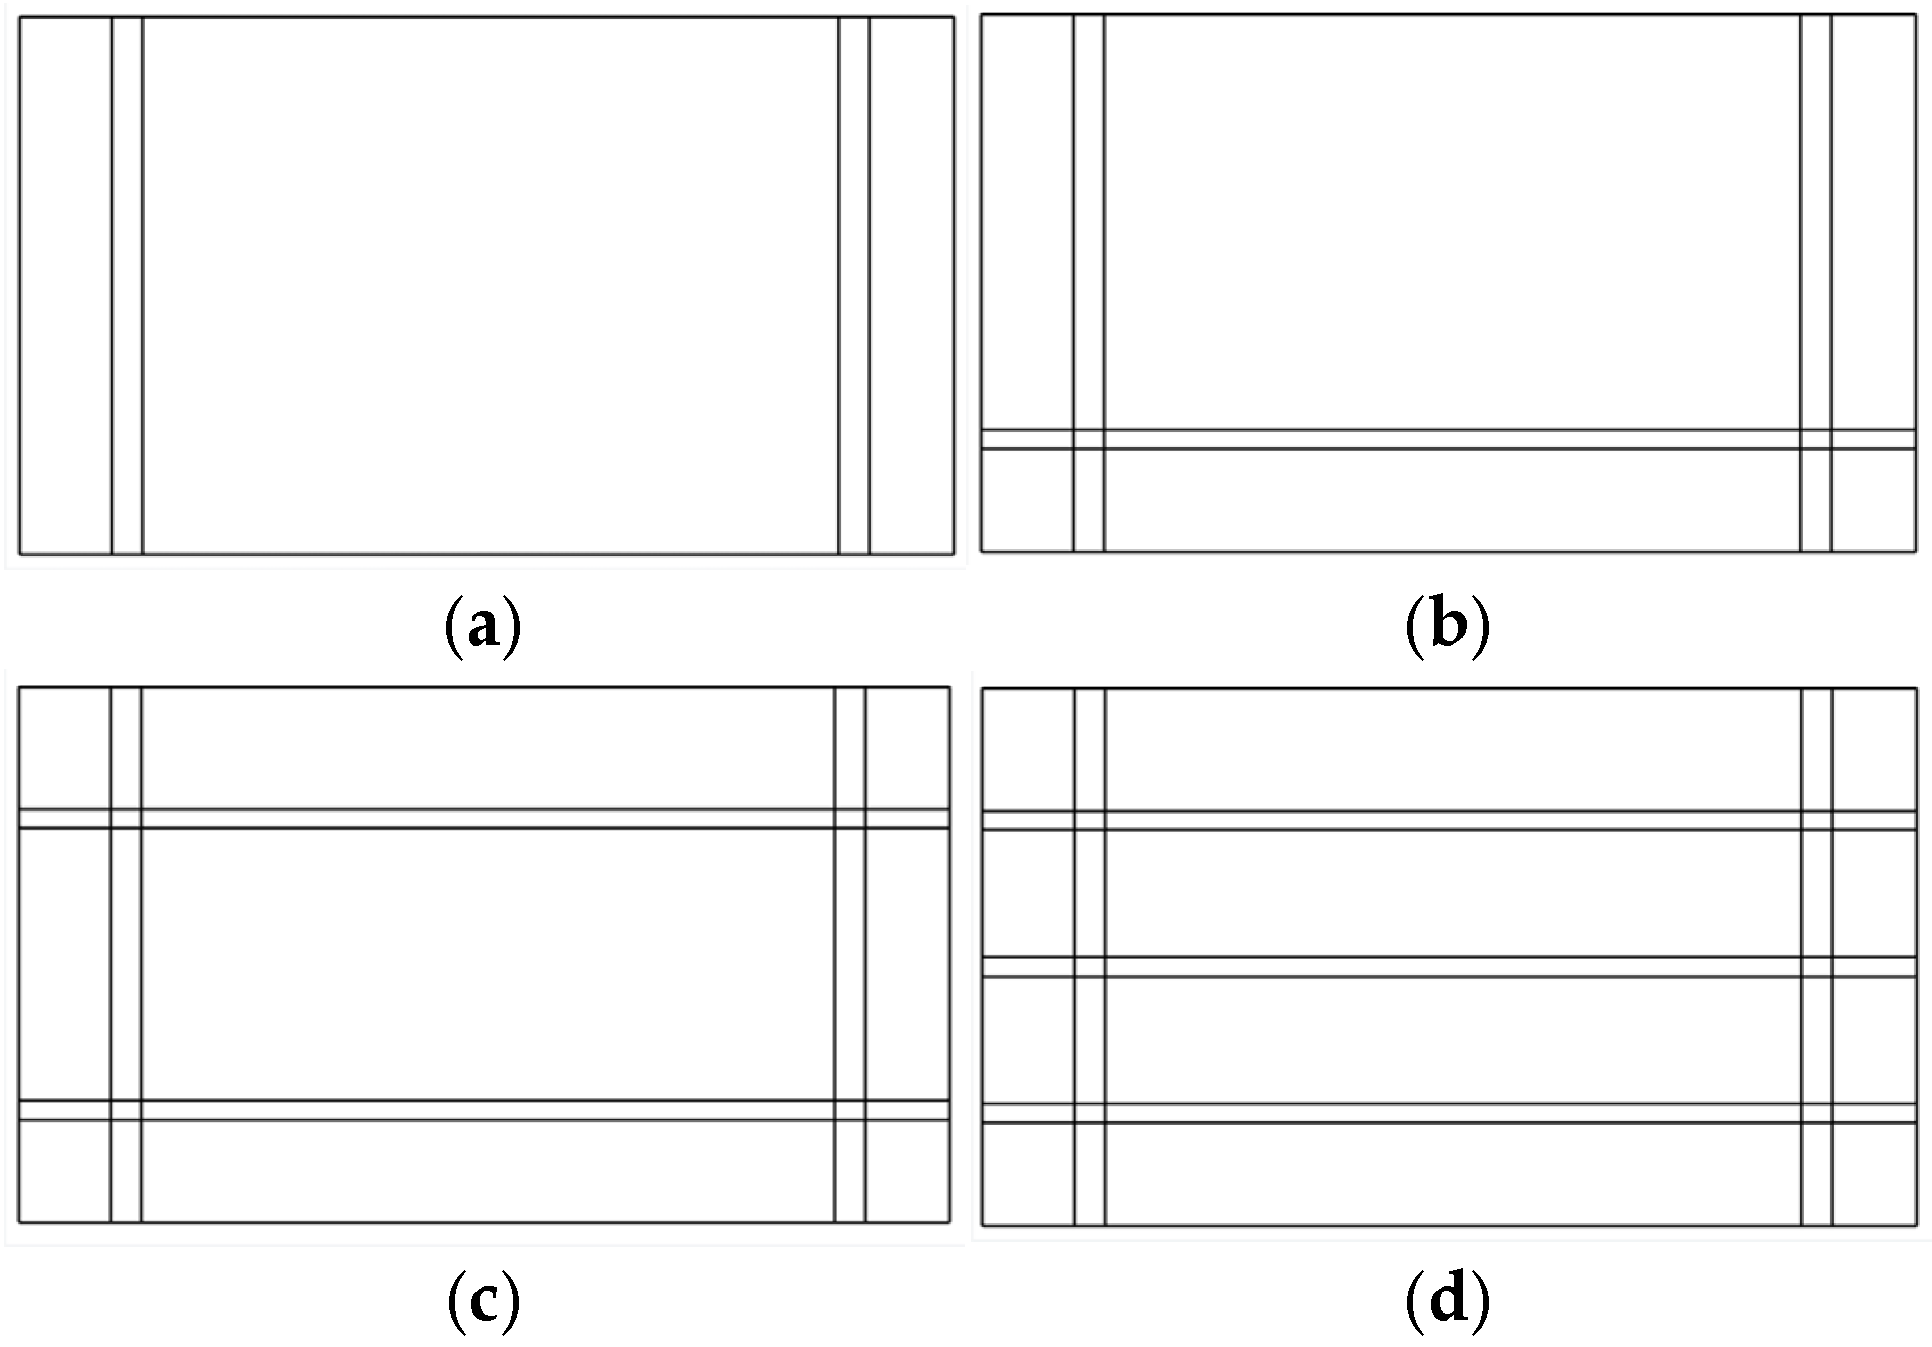
Figure 3.
Model setting of the contribution of long angle steel to the mechanical properties of steel liner anchorage system: (a) 0 pieces of long-angle steel; (b) 1 piece of long-angle steel; (c) 2 pieces of long-angle steel; (d) 3 pieces of long-angle steel.
Figure 3.
Model setting of the contribution of long angle steel to the mechanical properties of steel liner anchorage system: (a) 0 pieces of long-angle steel; (b) 1 piece of long-angle steel; (c) 2 pieces of long-angle steel; (d) 3 pieces of long-angle steel.
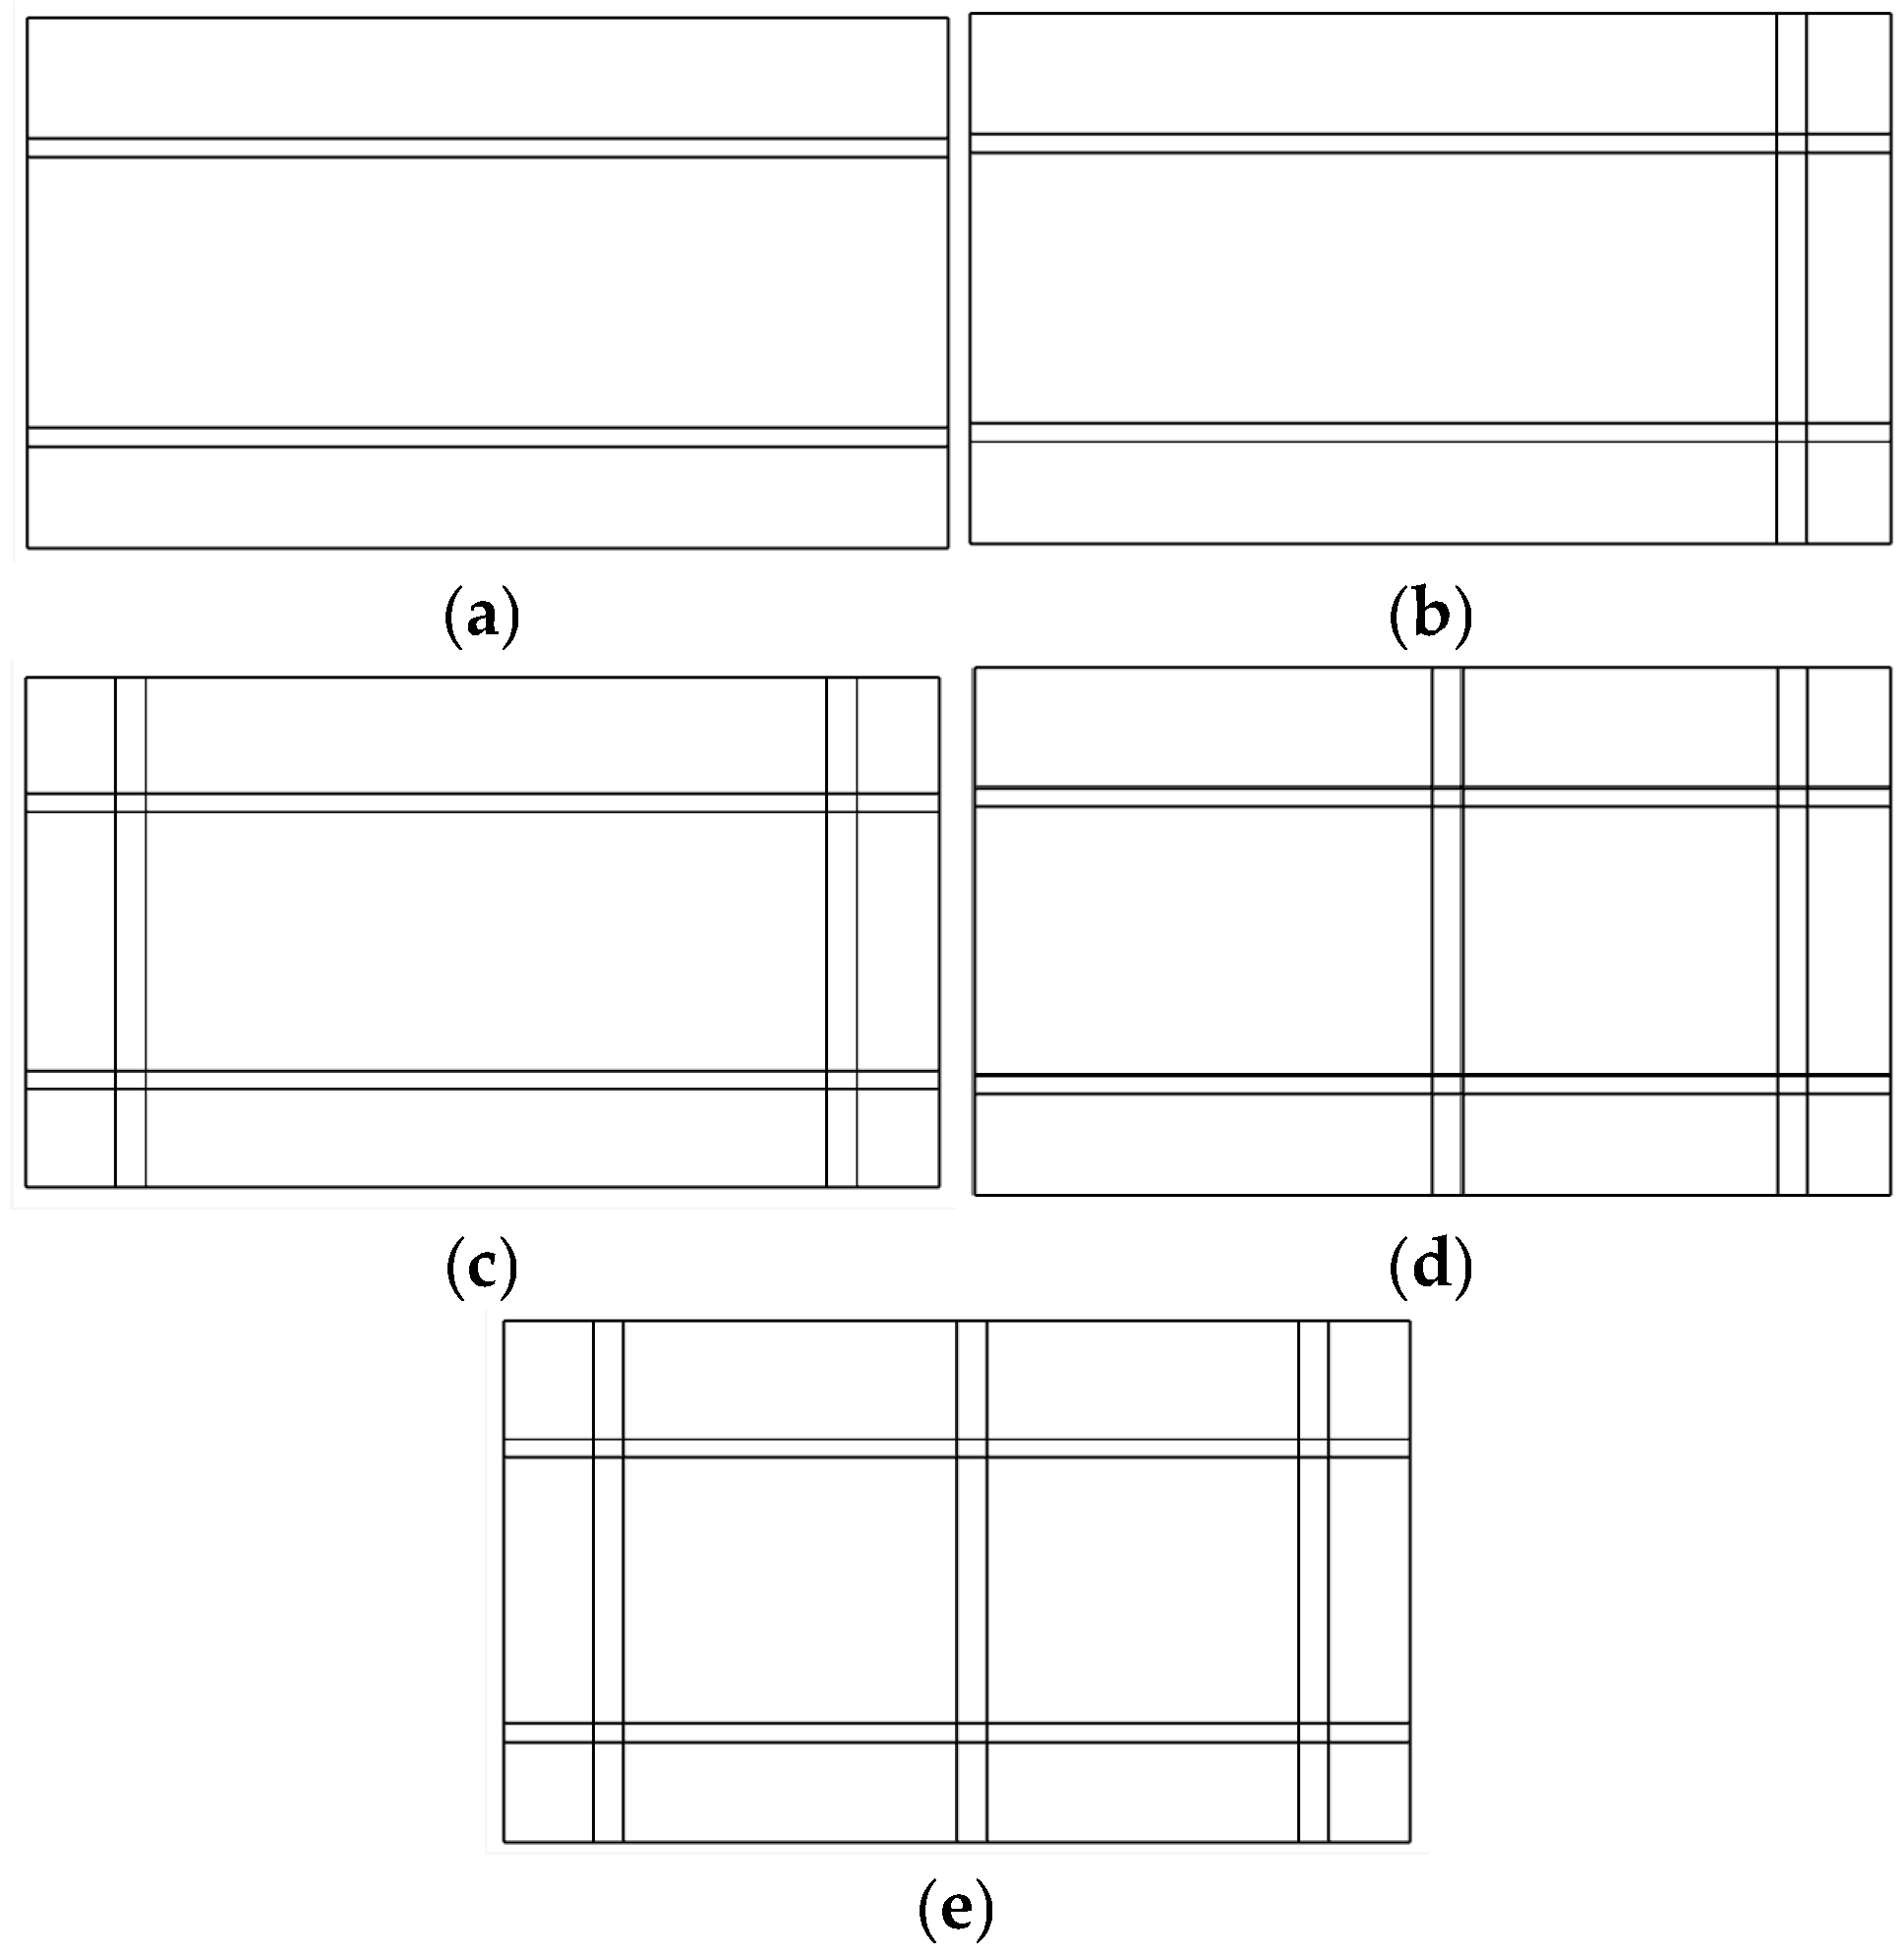
Figure 4.
Model setting of the contribution of short-angle steel to the mechanical properties of steel liner anchorage system: (a) 0 pieces of short-angle steel; (b) 1 piece of short-angle steel; (c) 2 pieces of short-angle steel with standard spacing; (d) 2 pieces of short-angle steel with half spacing; (e) 3 pieces of short-angle steel.
Figure 4.
Model setting of the contribution of short-angle steel to the mechanical properties of steel liner anchorage system: (a) 0 pieces of short-angle steel; (b) 1 piece of short-angle steel; (c) 2 pieces of short-angle steel with standard spacing; (d) 2 pieces of short-angle steel with half spacing; (e) 3 pieces of short-angle steel.
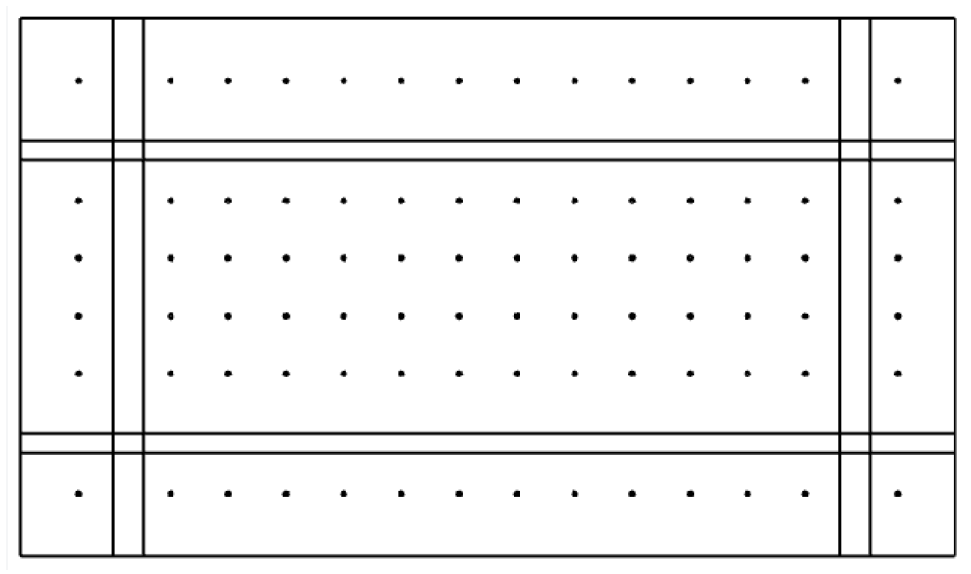
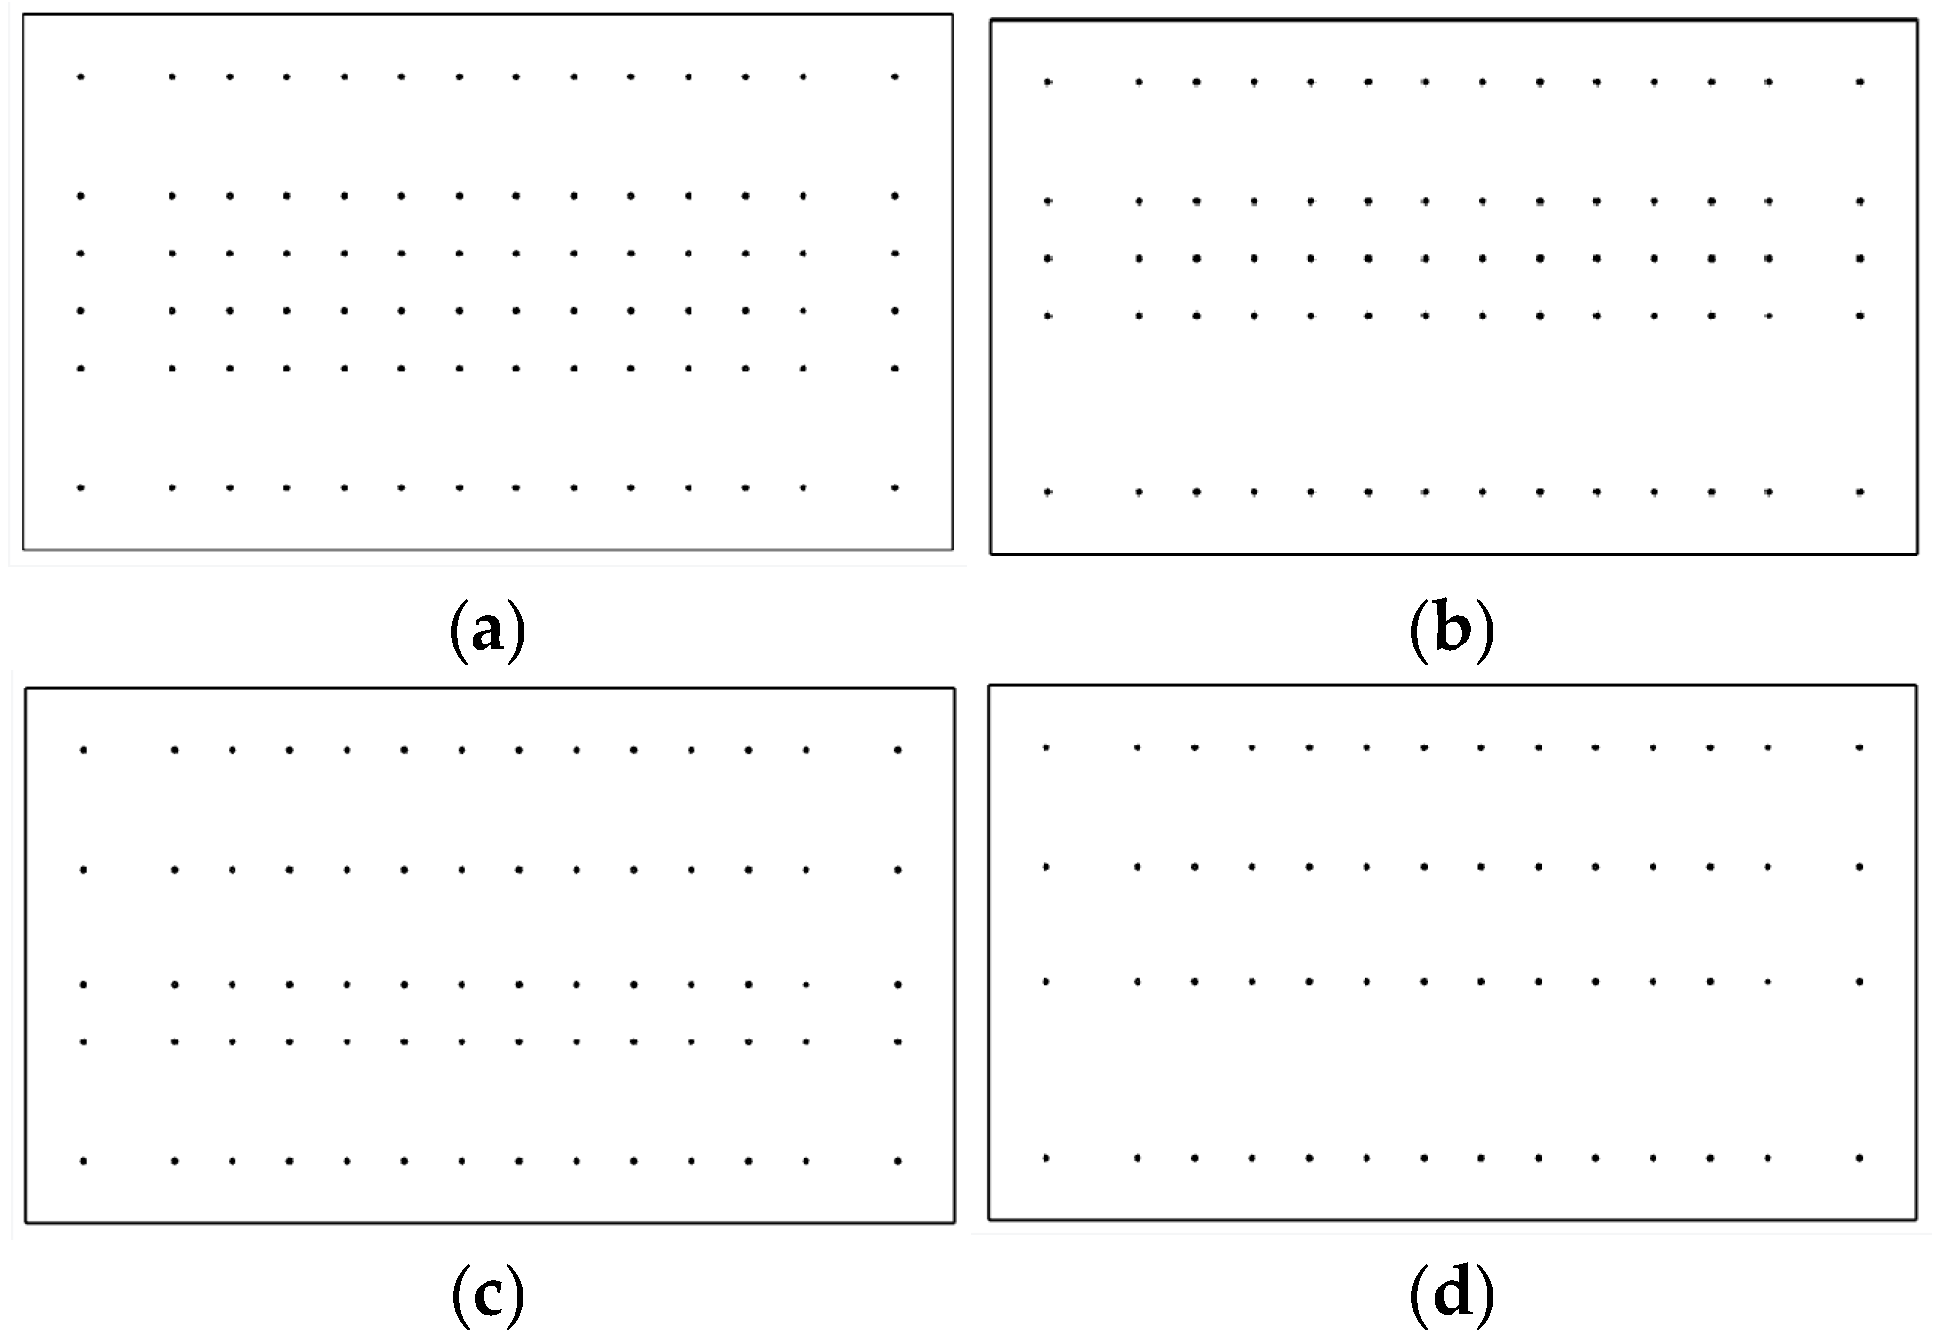
Figure 5.
Model setting of the contribution of long-angle steel to the mechanical properties of steel liner anchorage systemL (a) 4 rows of studs; (b) 3 rows of studs (1 row of studs adjacent to the tension end is removed); (c) 3 rows of studs (1 middle row removed); (d) 2 rows of studs.
Figure 5.
Model setting of the contribution of long-angle steel to the mechanical properties of steel liner anchorage systemL (a) 4 rows of studs; (b) 3 rows of studs (1 row of studs adjacent to the tension end is removed); (c) 3 rows of studs (1 middle row removed); (d) 2 rows of studs.
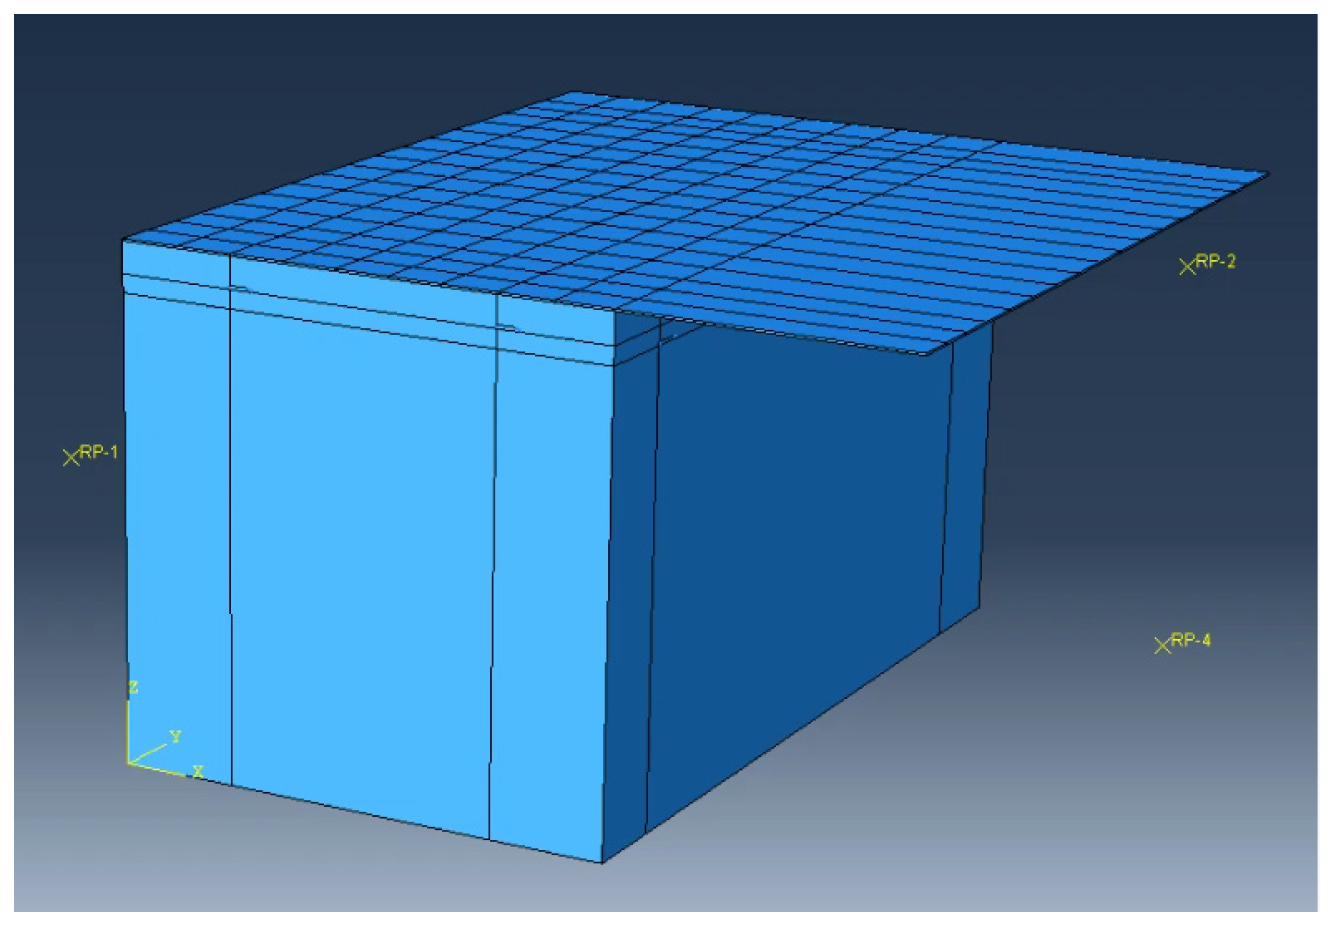
Figure 6.
Steel liner anchorage system numerical model.
Figure 6.
Steel liner anchorage system numerical model.
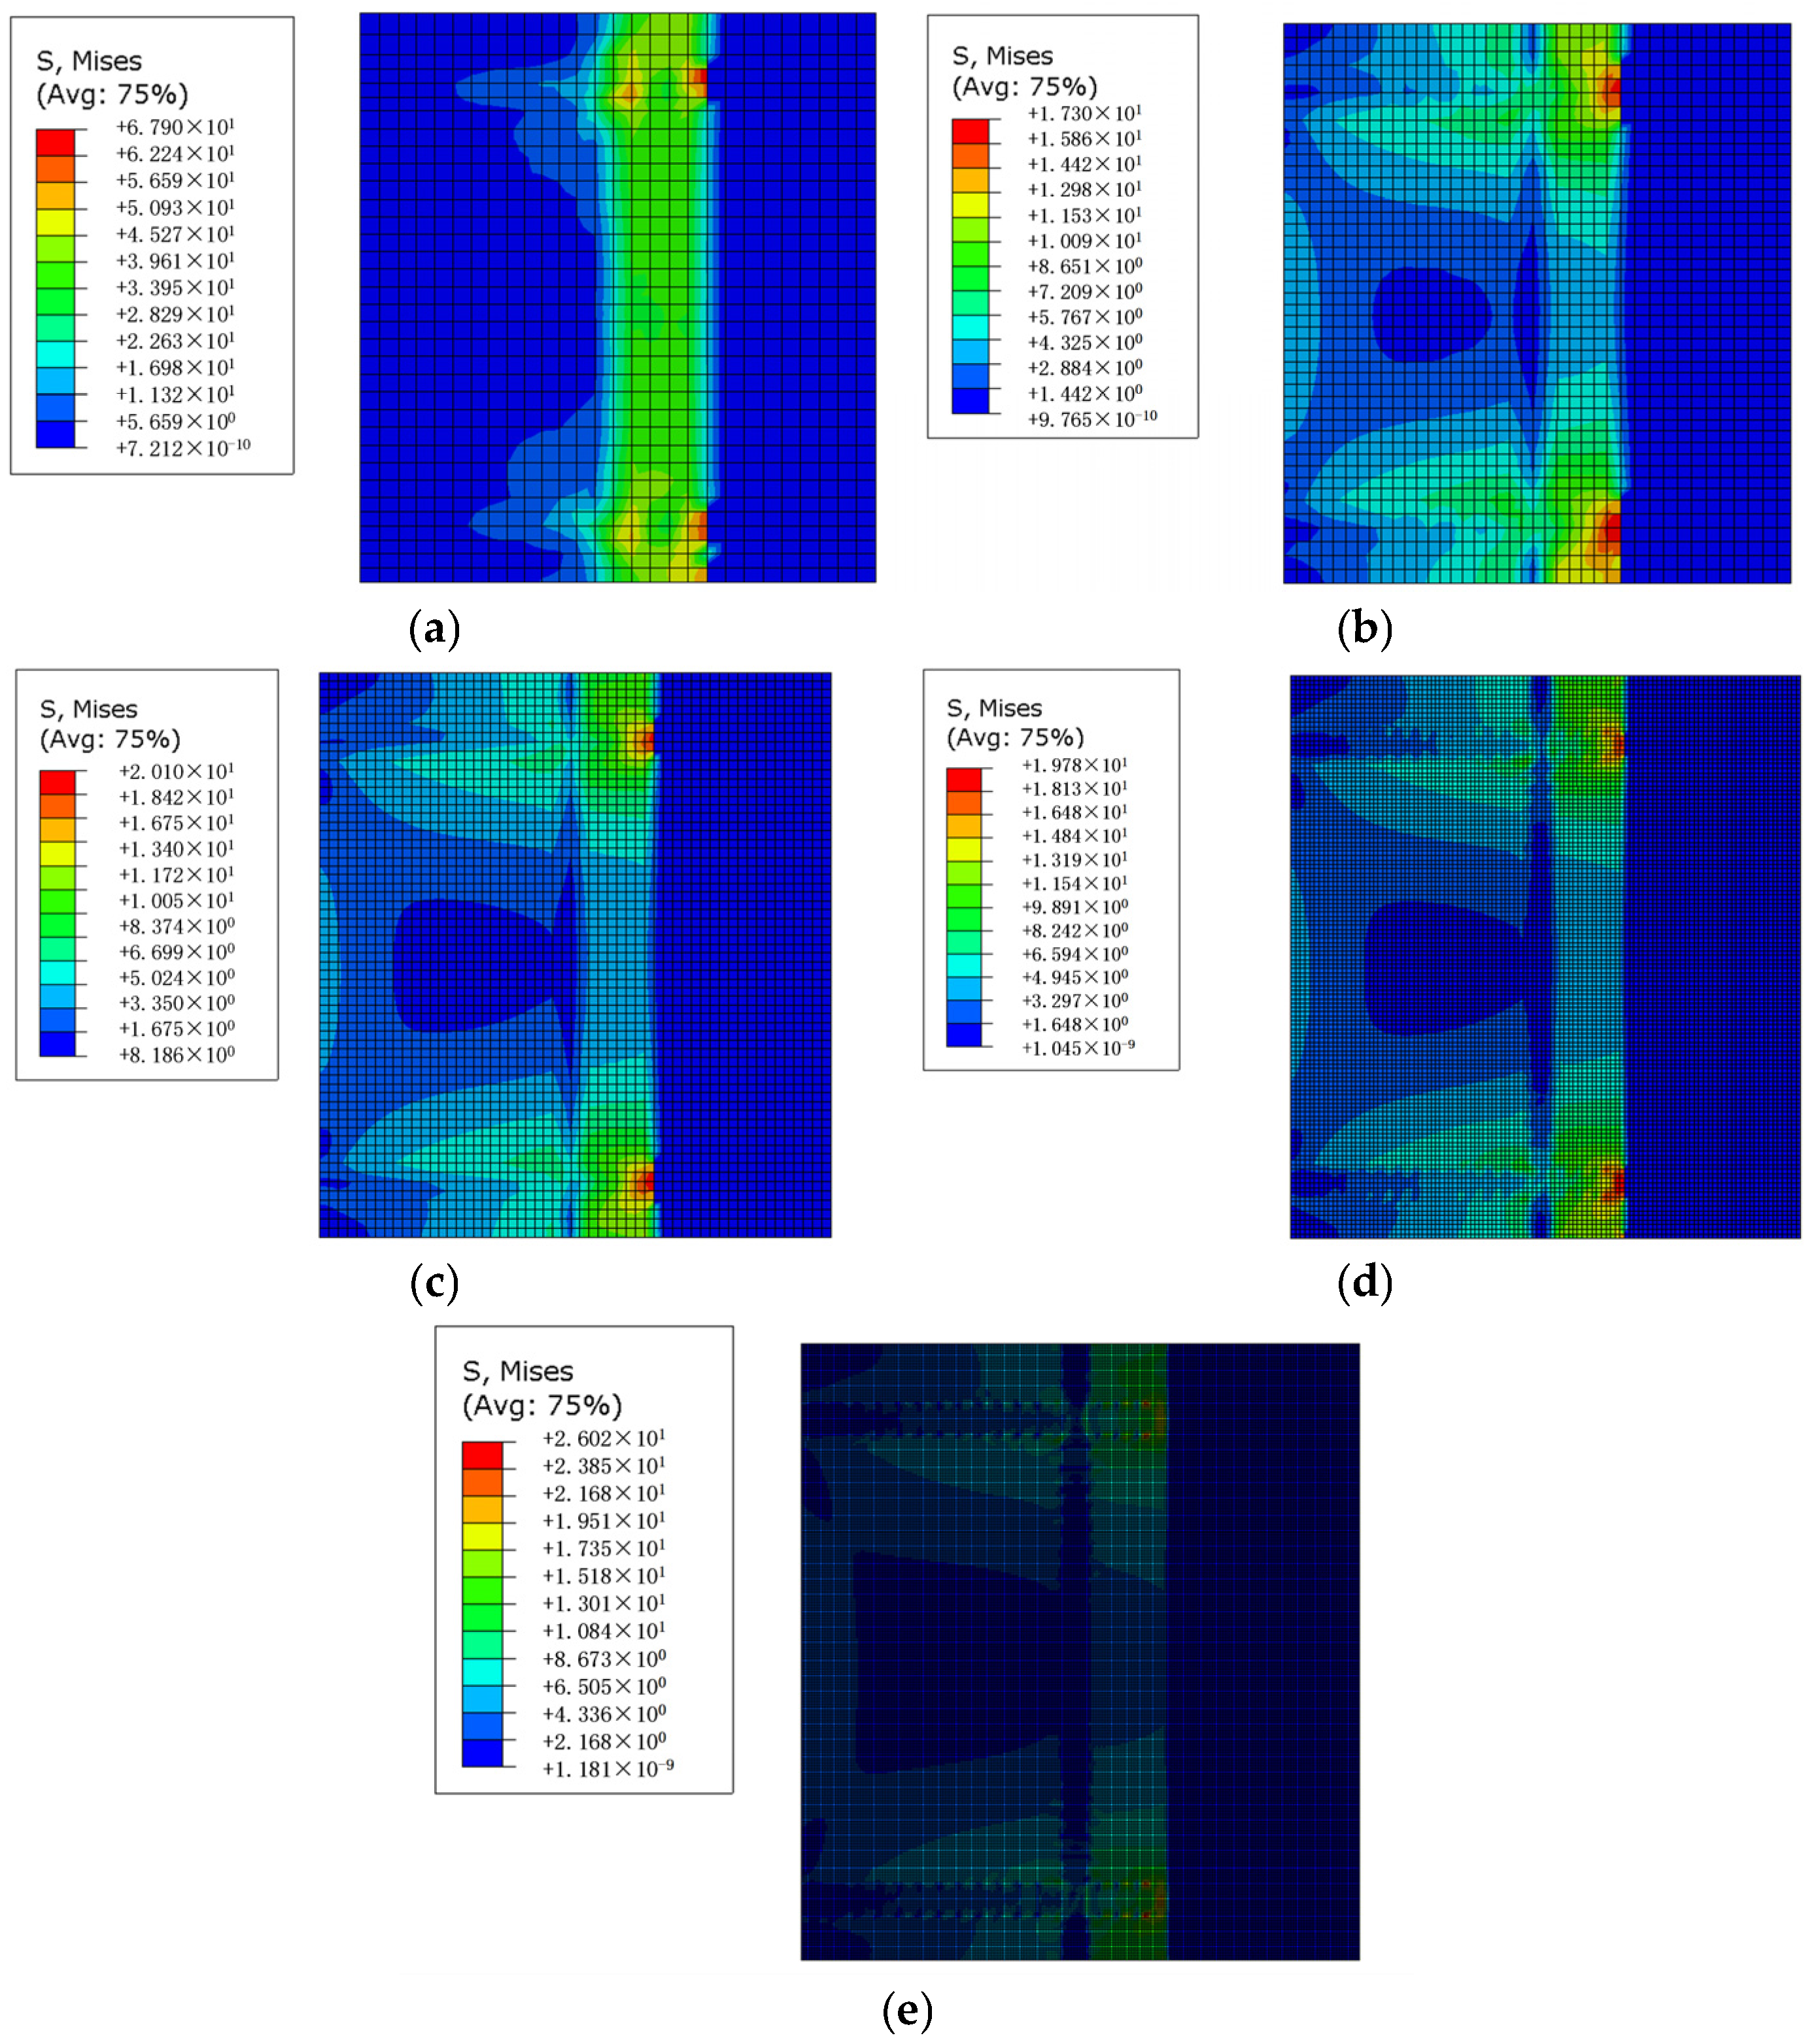
Figure 7.
Steel plate stress simulation results for different element sizes: (a) 10 mm; (b) 20 mm; (c) 40 mm; (d) 60 mm; (e) 80 mm.
Figure 7.
Steel plate stress simulation results for different element sizes: (a) 10 mm; (b) 20 mm; (c) 40 mm; (d) 60 mm; (e) 80 mm.
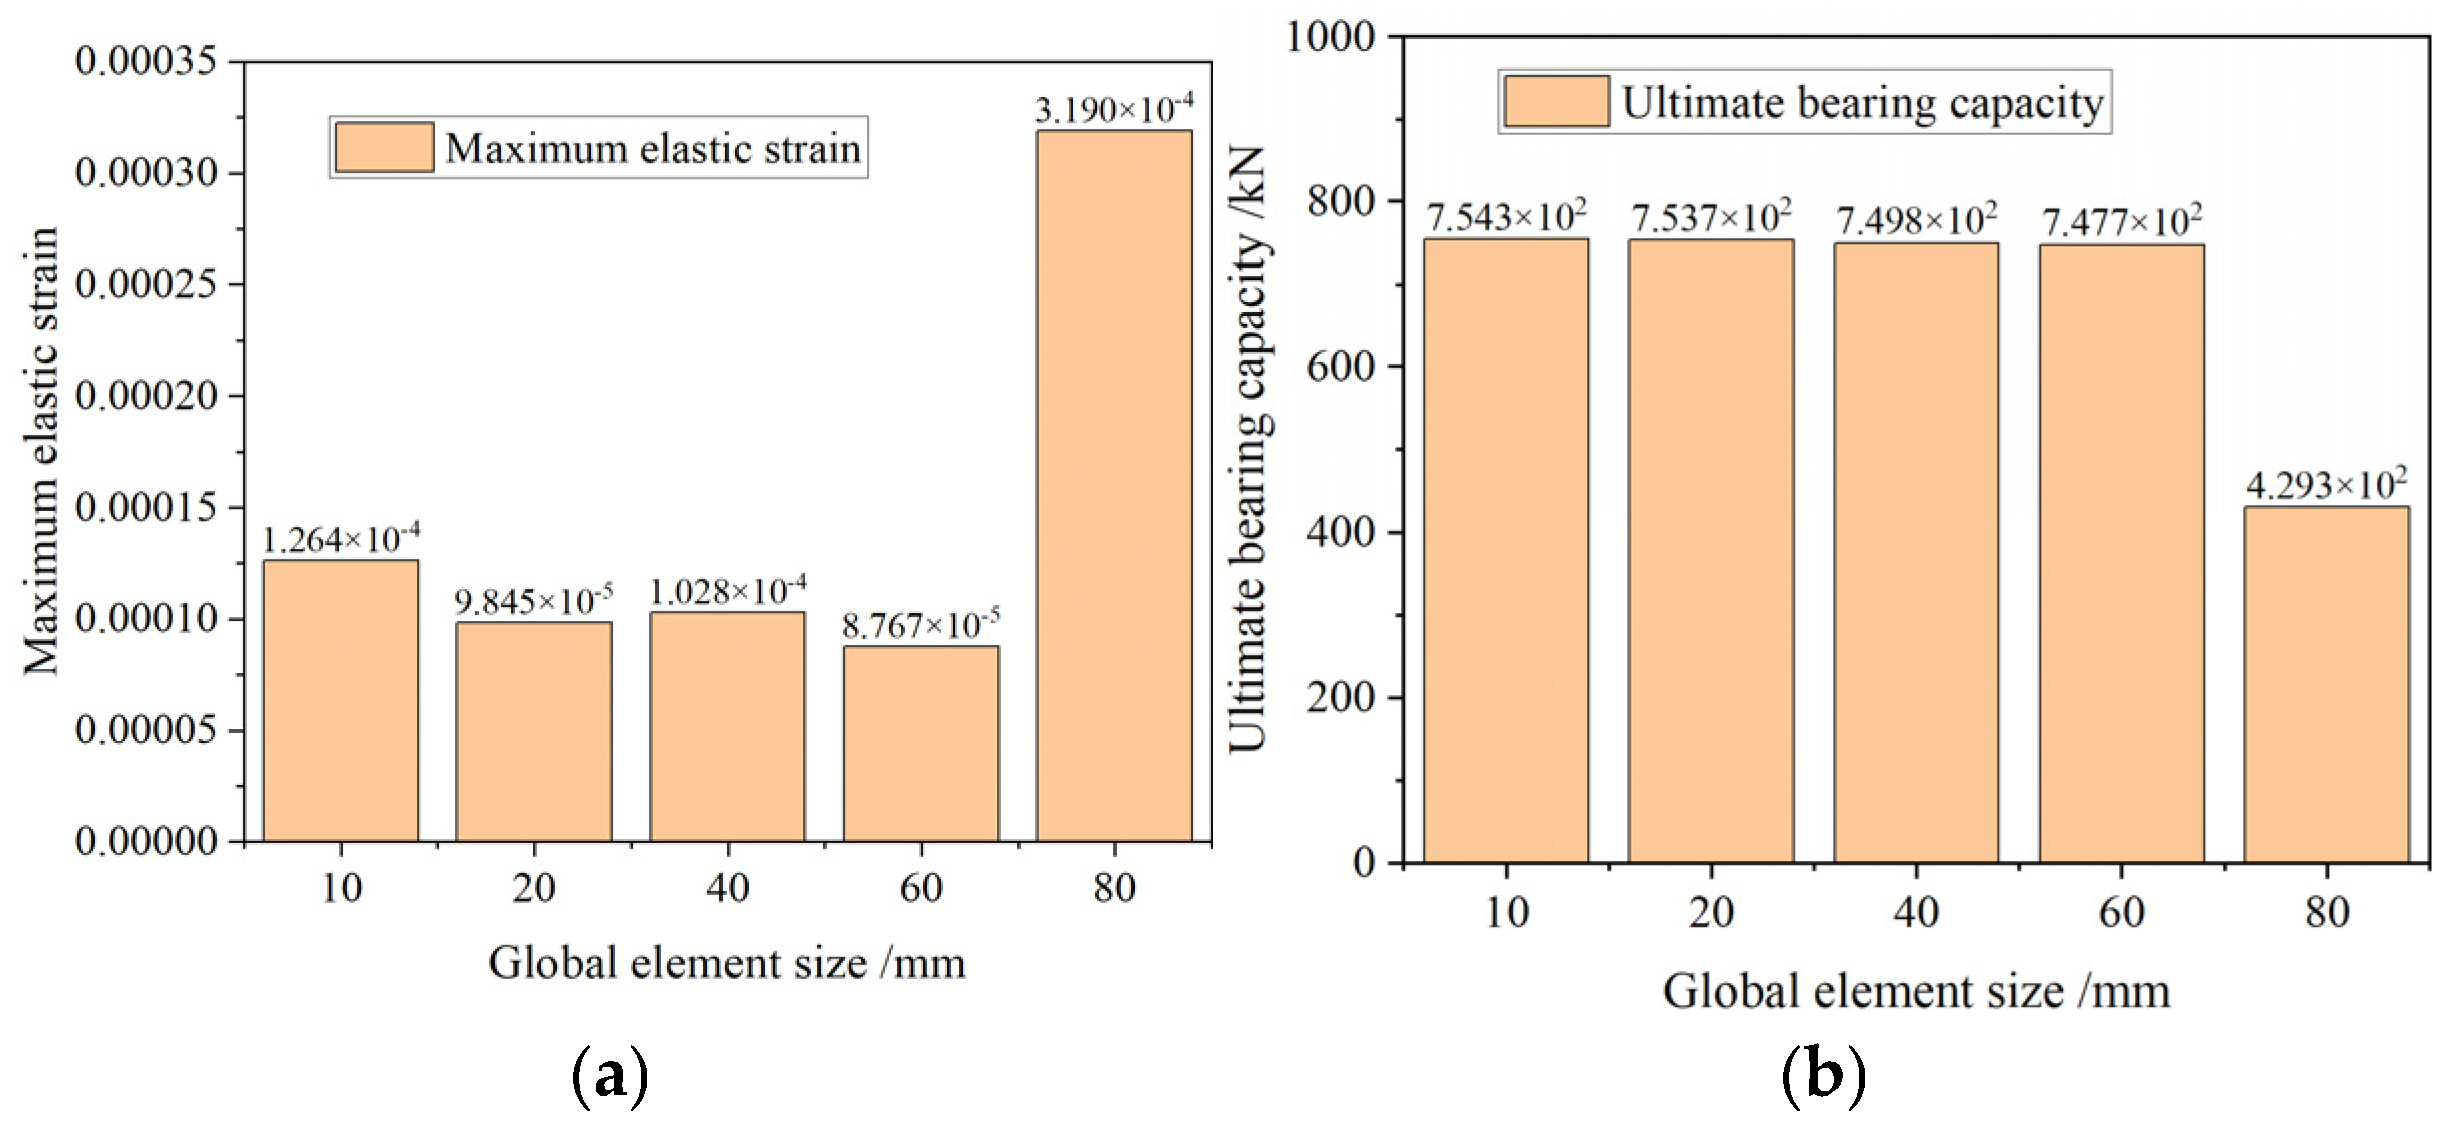
Figure 8.
Results of maximum elastic strain and ultimate bearing capacity of the steel plate with different global element sizes: (a) elastic strain; (b) ultimate bearing capacity.
Figure 8.
Results of maximum elastic strain and ultimate bearing capacity of the steel plate with different global element sizes: (a) elastic strain; (b) ultimate bearing capacity.
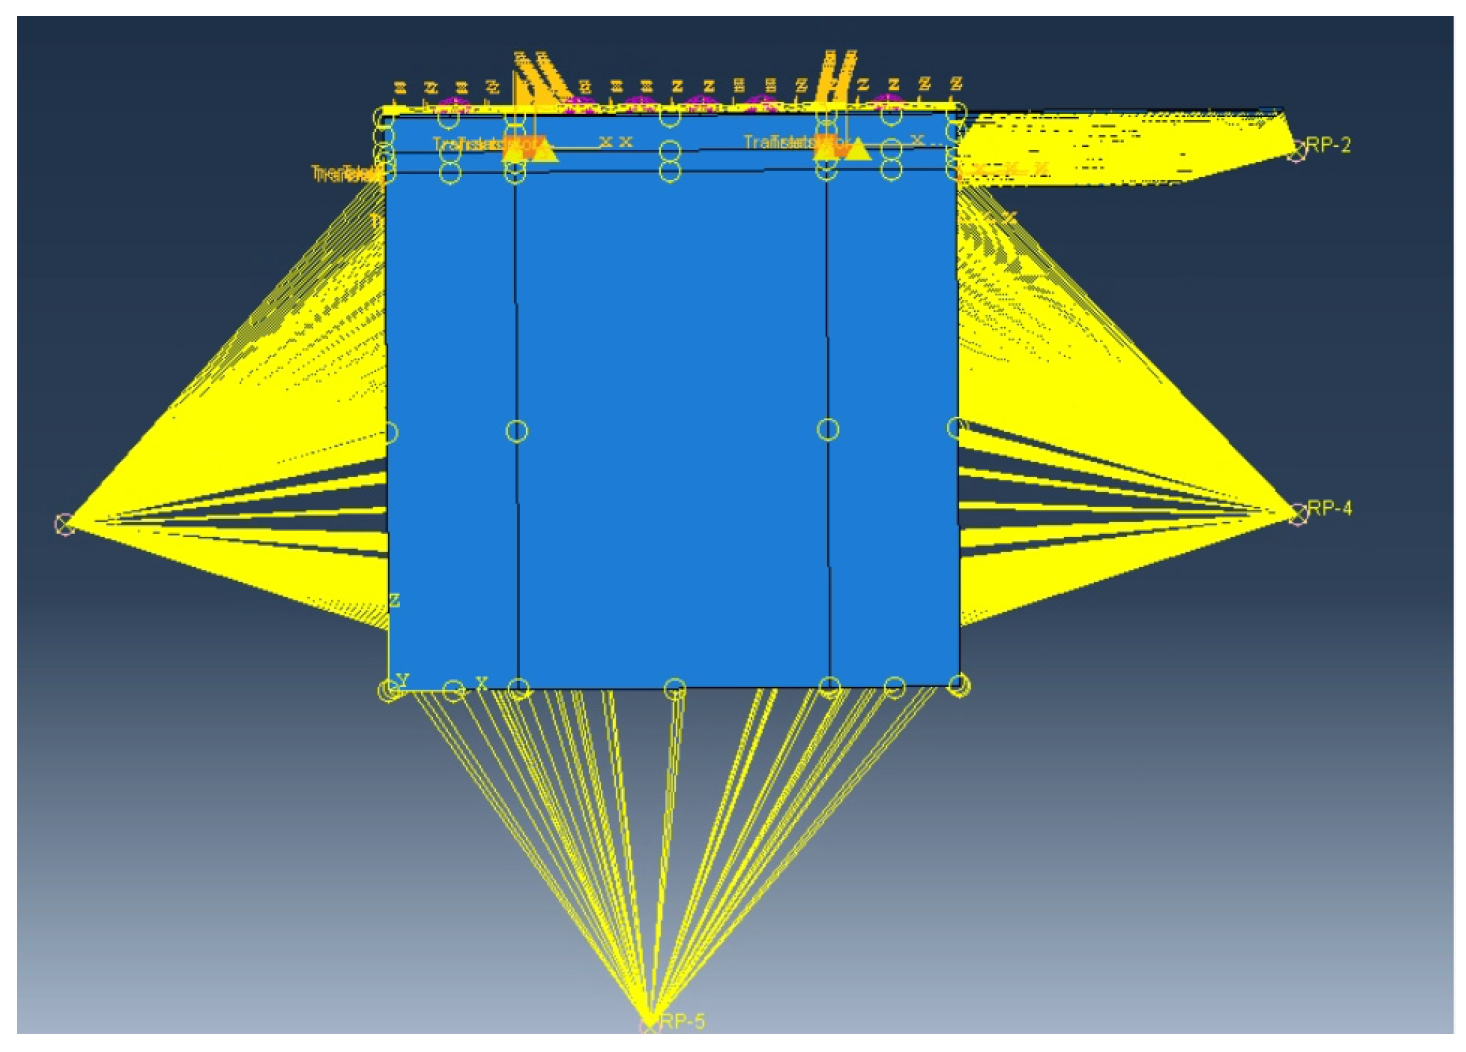
Figure 9.
Boundary conditions and loading scheme of the numerical model.
Figure 9.
Boundary conditions and loading scheme of the numerical model.
Figure 10.
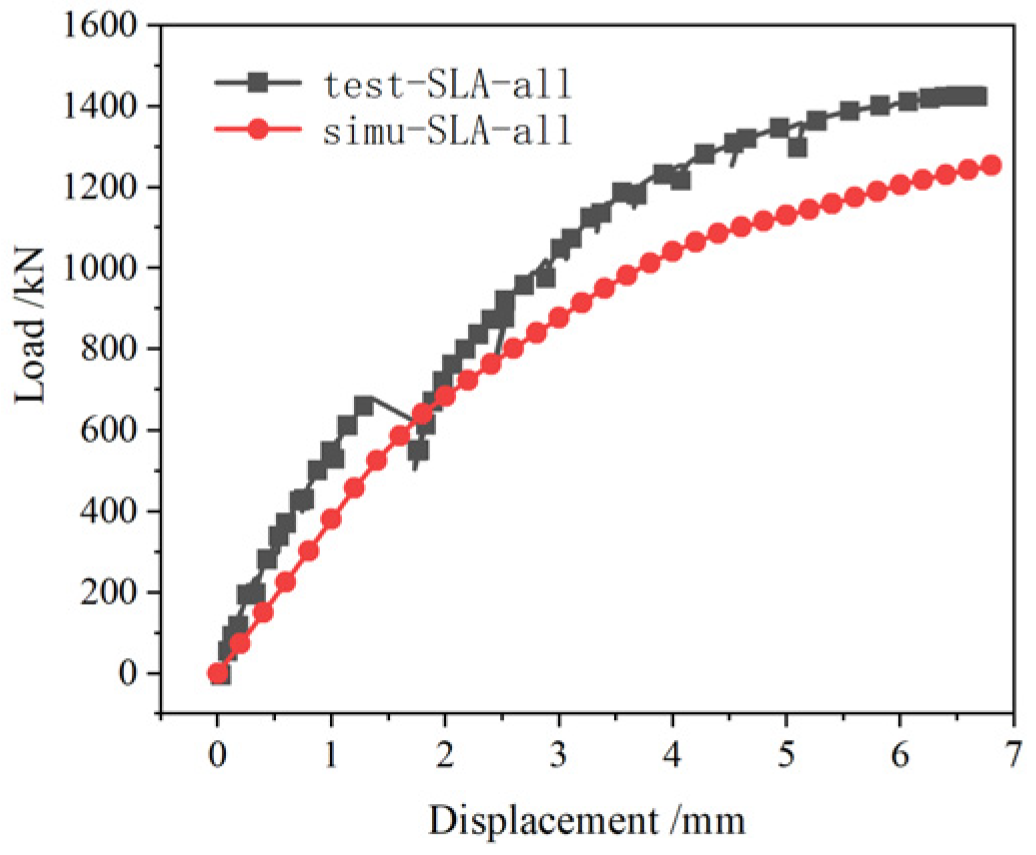
Comparison of test and simulated load-displacement results for SLA-all.
Figure 10.
Comparison of test and simulated load-displacement results for SLA-all.
Figure 11.
Test results for SLA-all.
Figure 11.
Test results for SLA-all.
Figure 12.
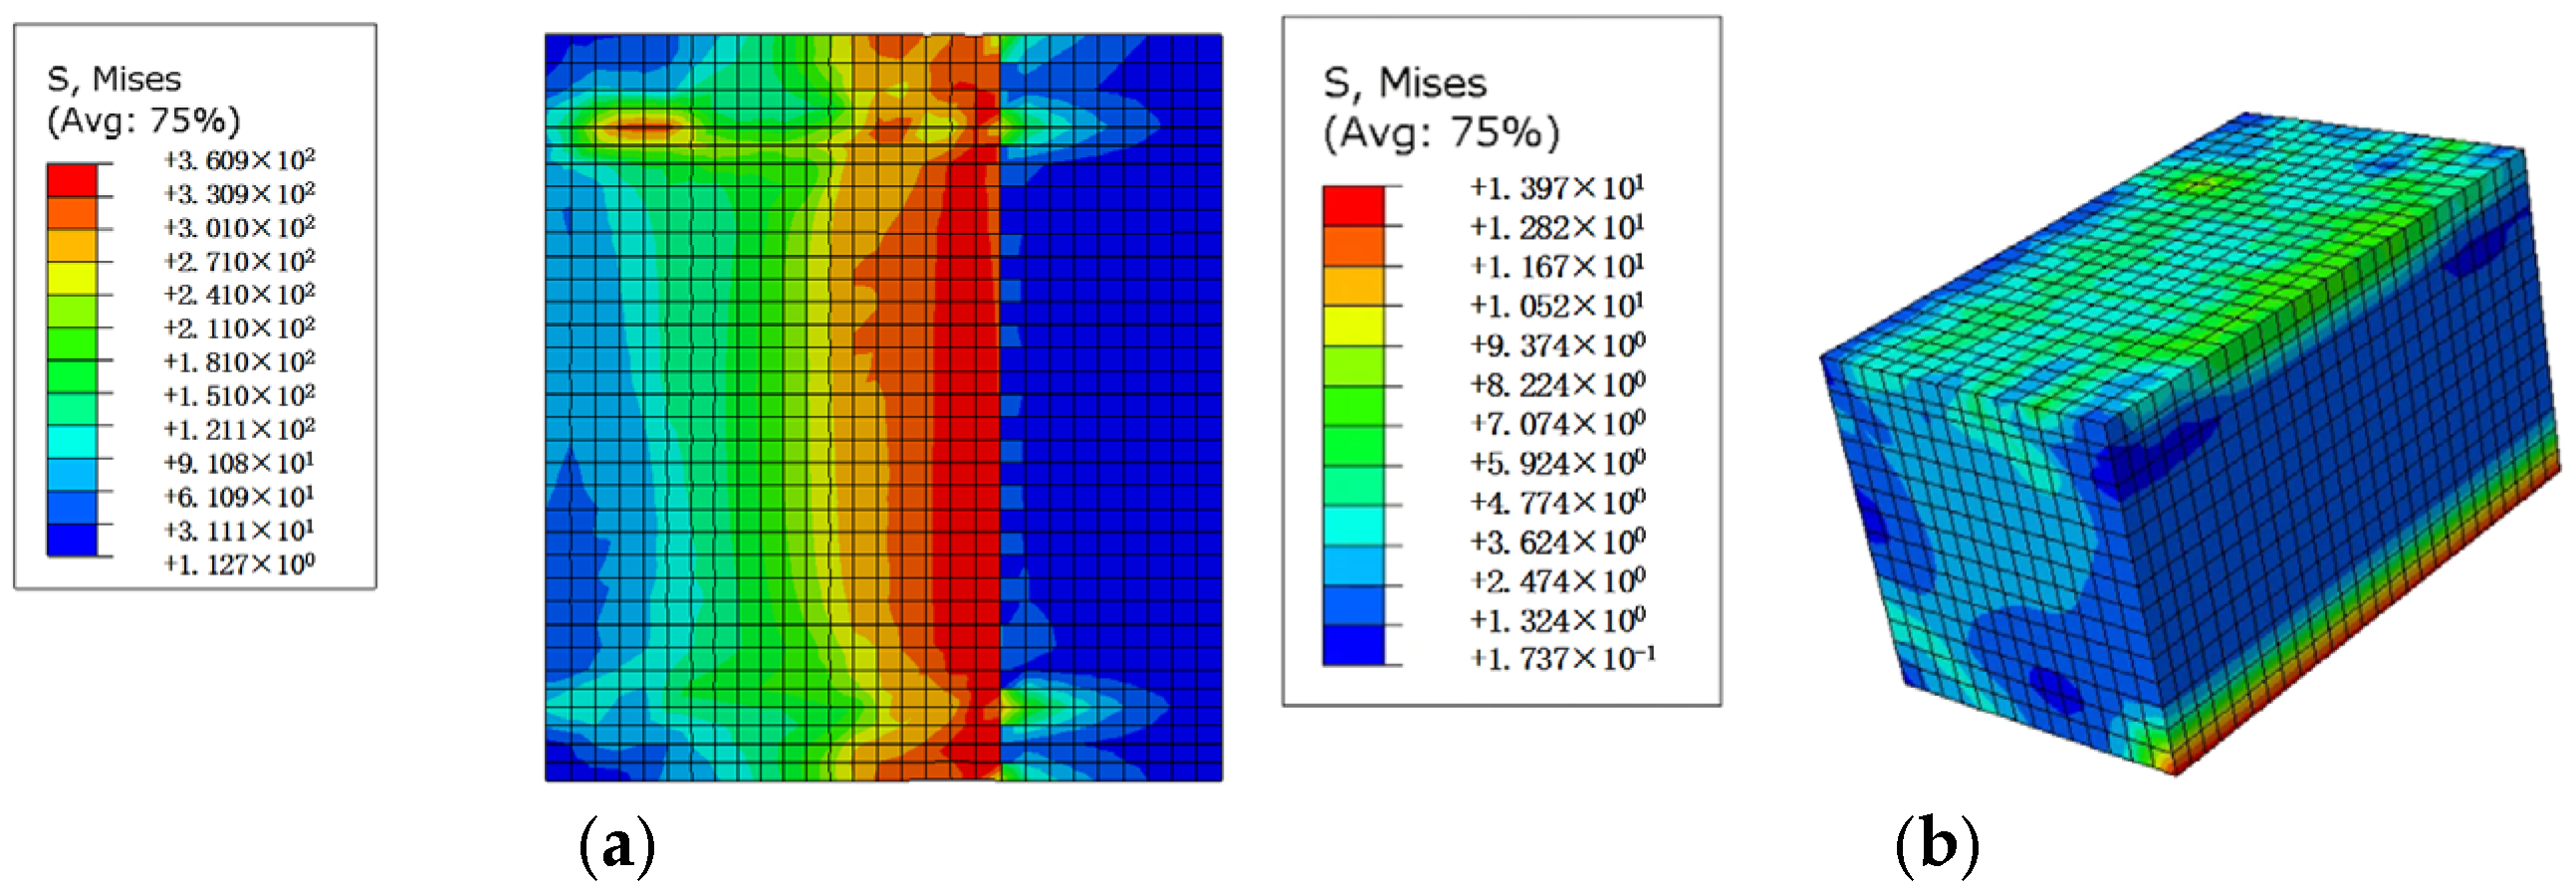
Simulated stress results of SLA-all. (a) Steel liner plate; (b) Concrete.
Figure 12.
Simulated stress results of SLA-all. (a) Steel liner plate; (b) Concrete.
Figure 13.
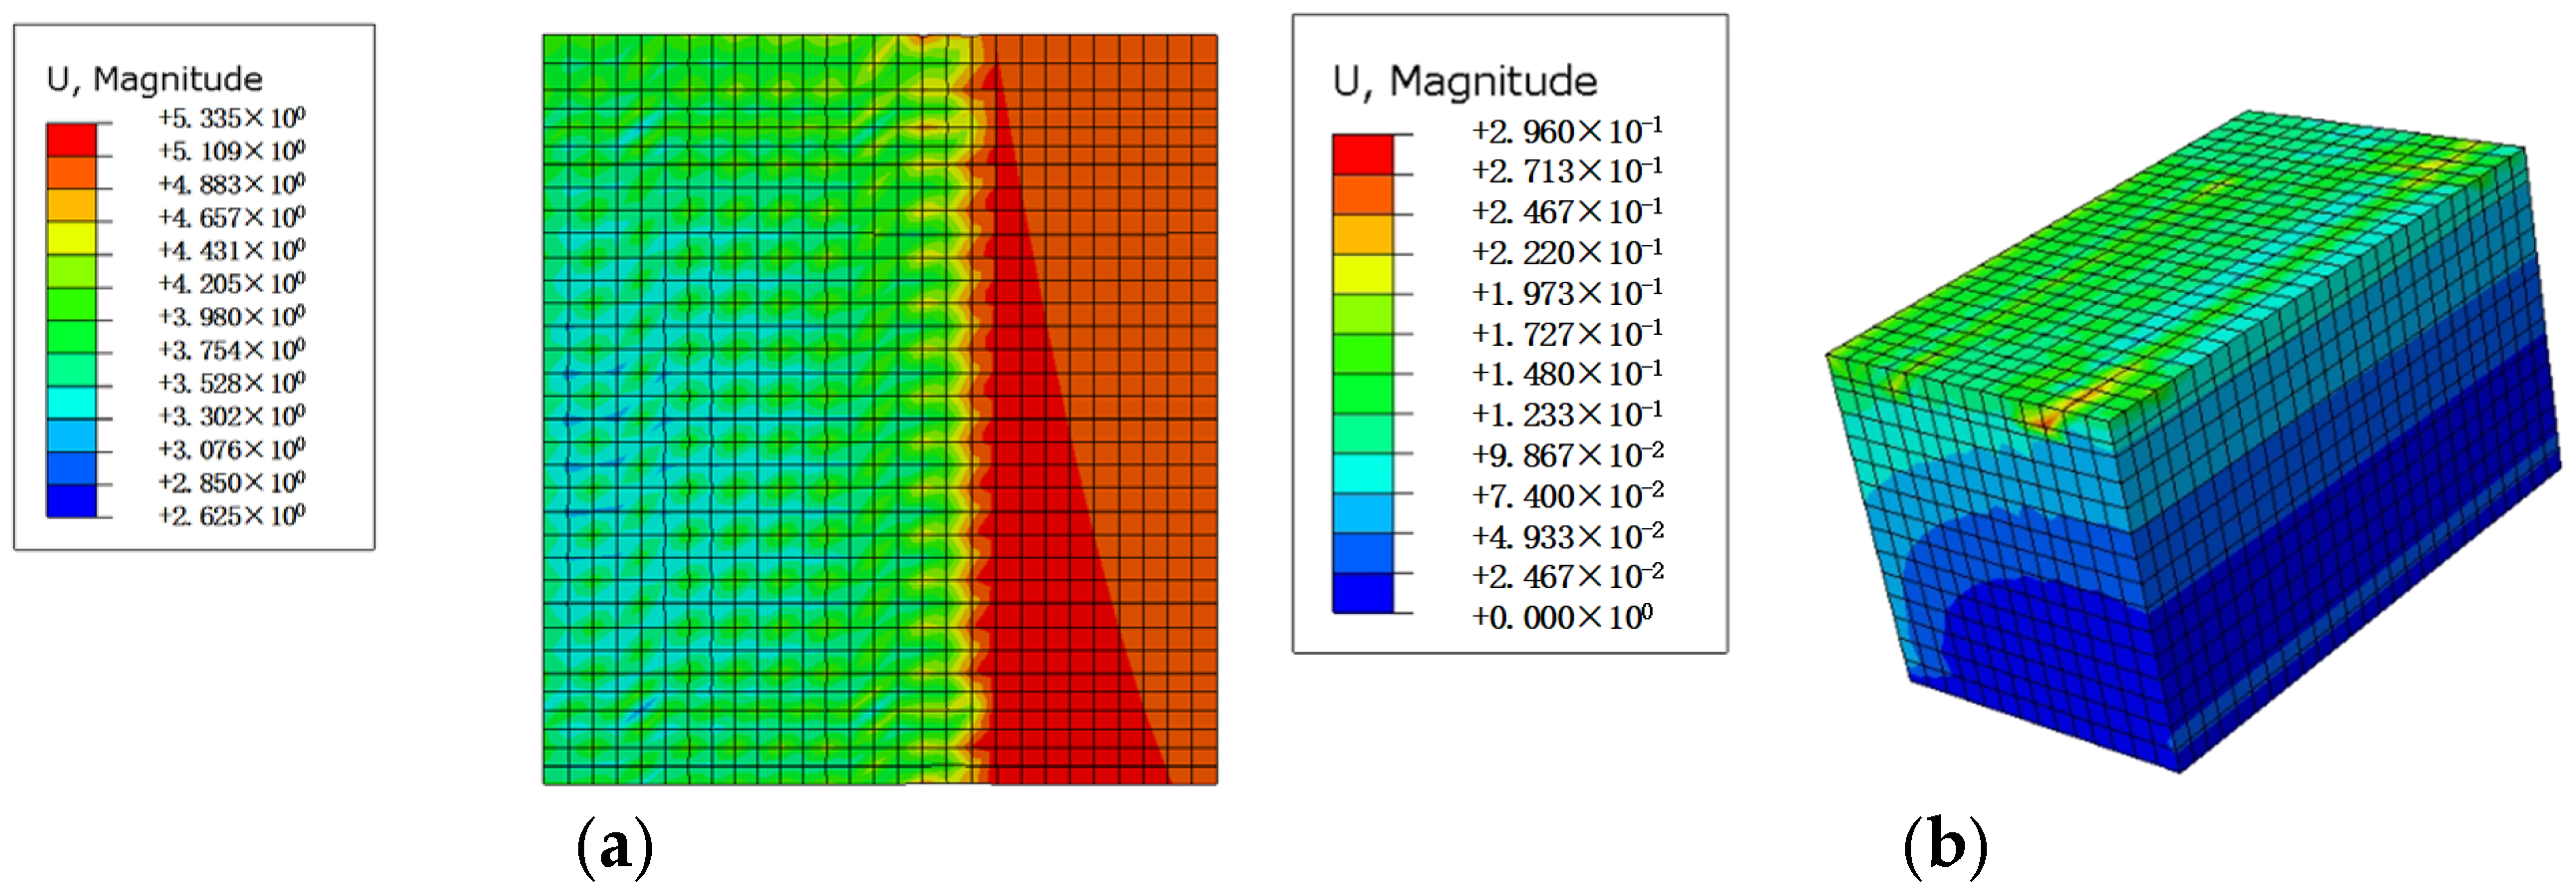
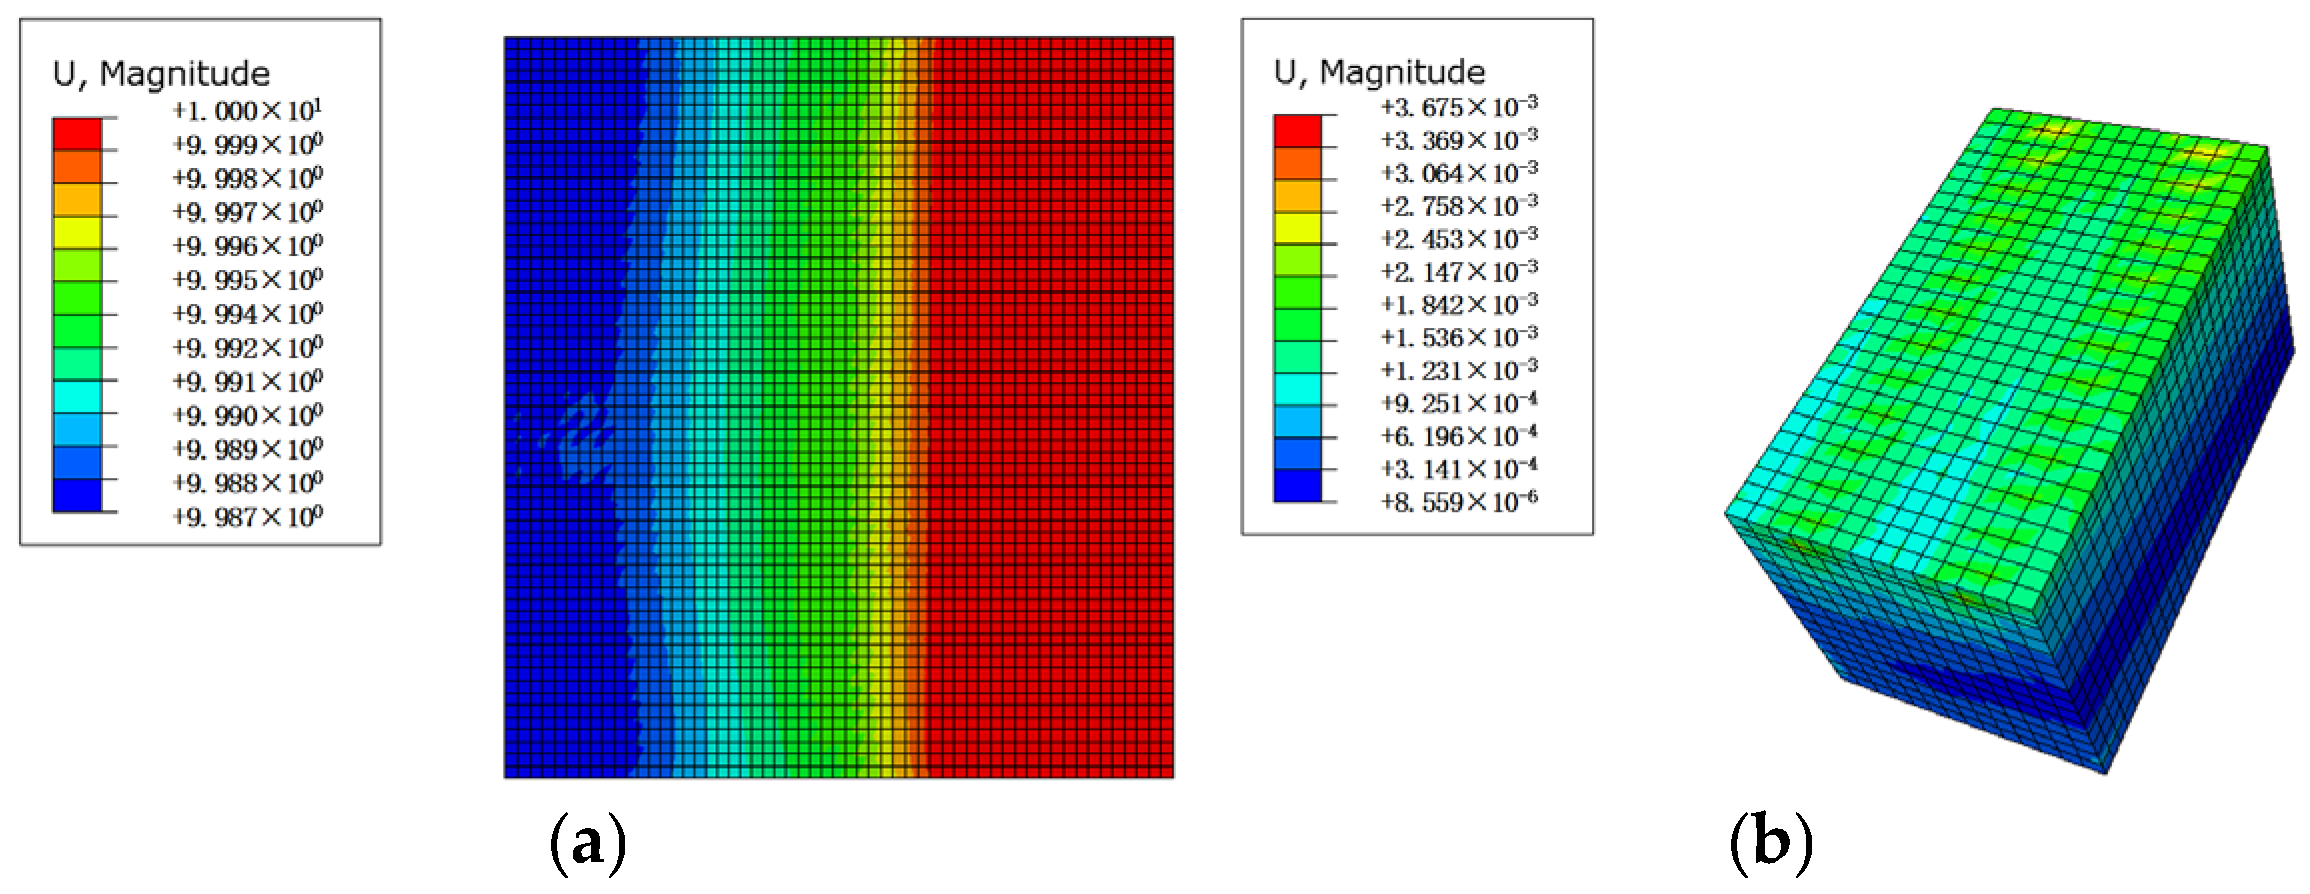
Simulated deformation results of SLA-all. (a) Steel liner plate; (b) Concrete.
Figure 13.
Simulated deformation results of SLA-all. (a) Steel liner plate; (b) Concrete.
Figure 14.
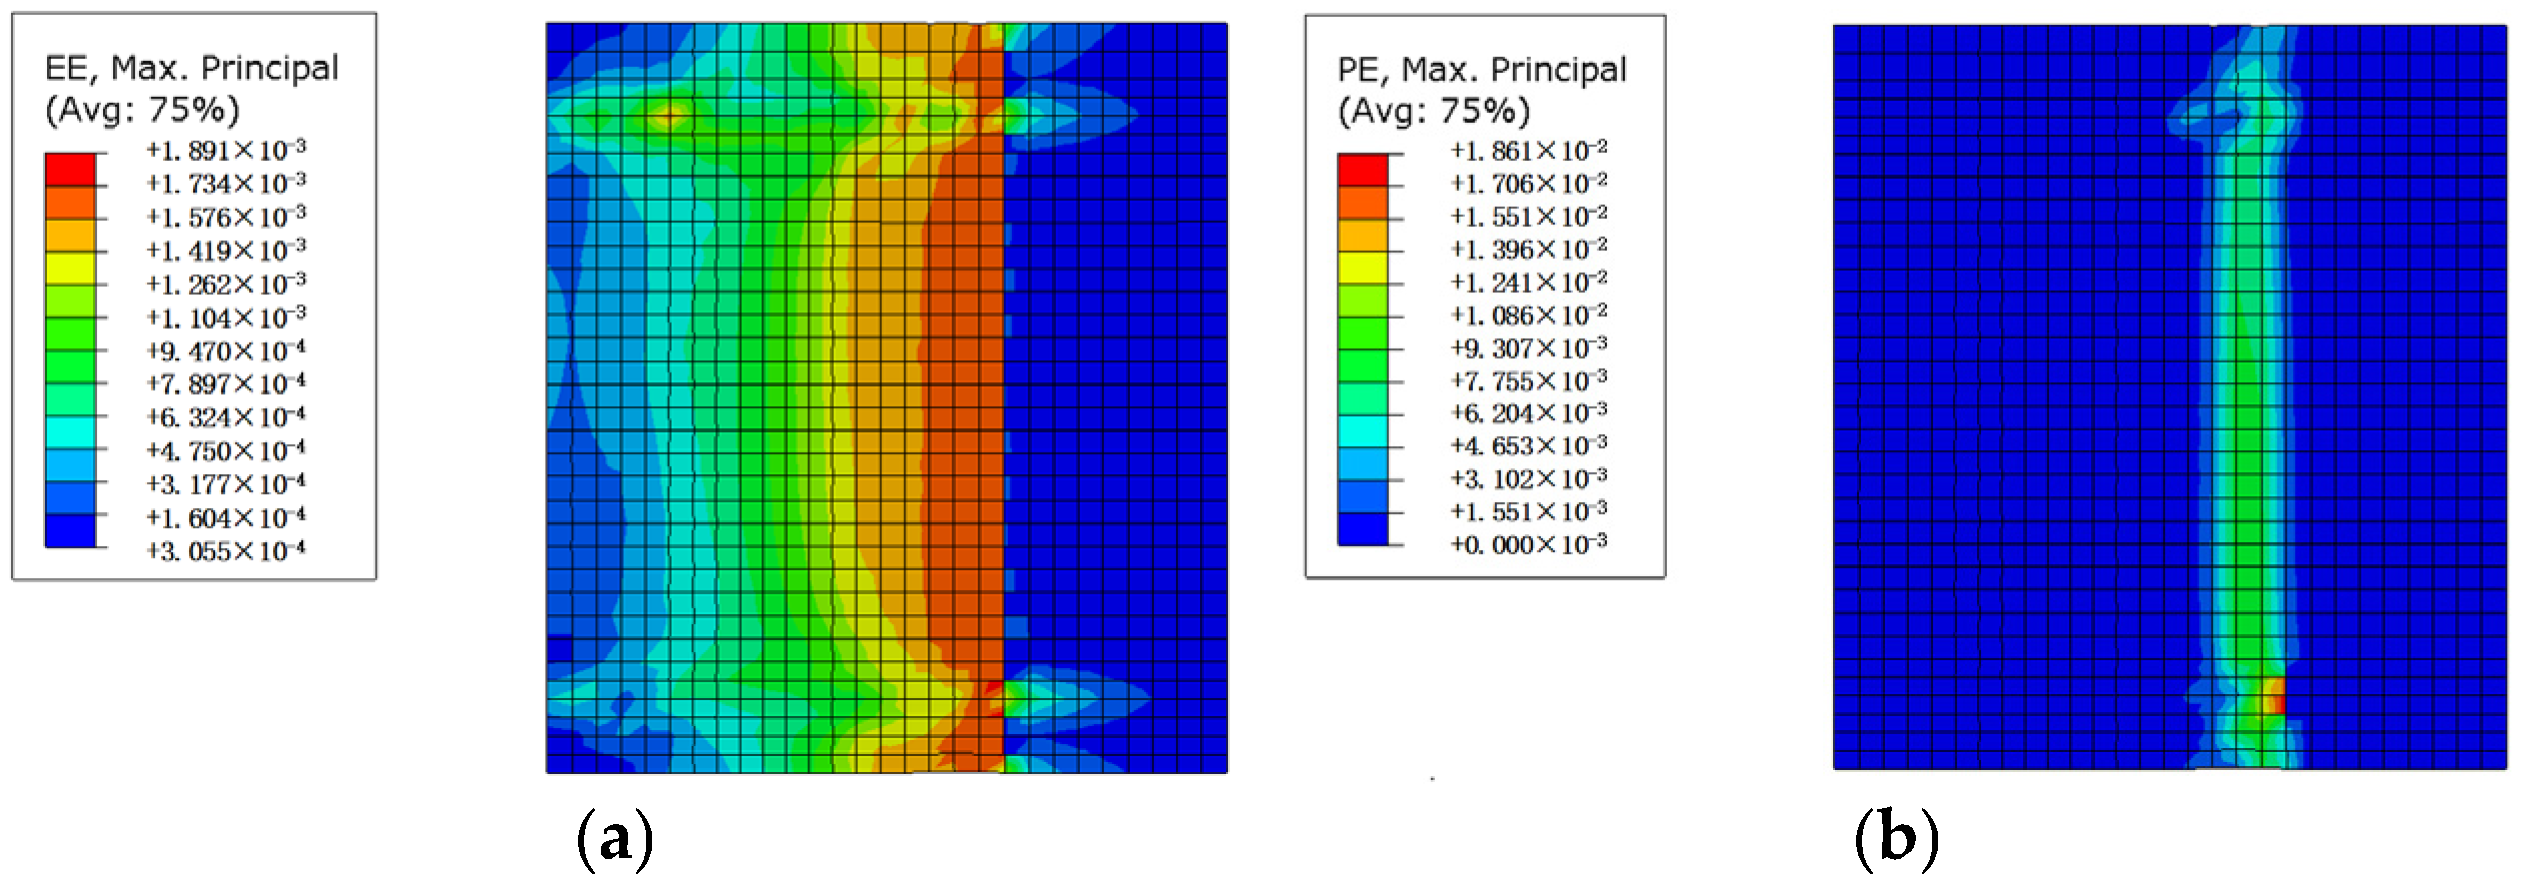
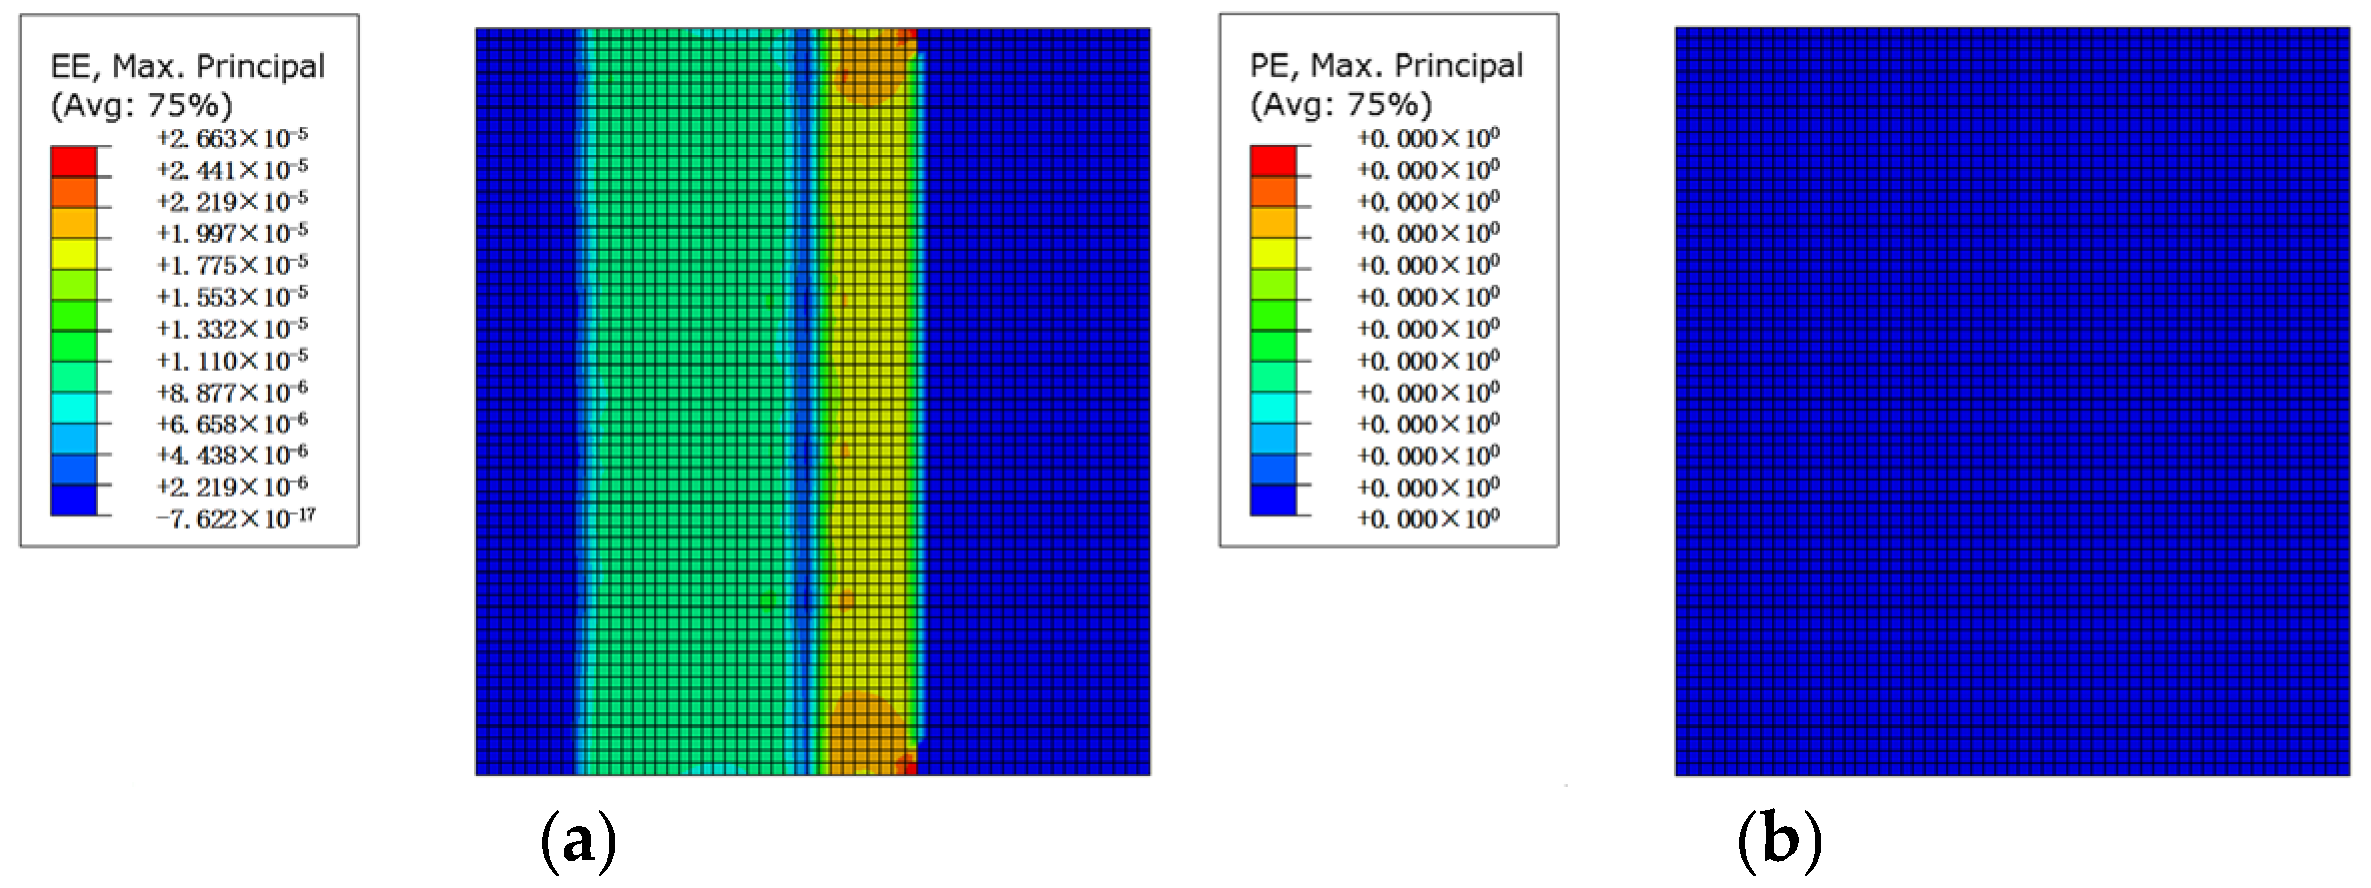
Simulated strain results of SLA-all. (a) Elastic strain; (b) Plastic strain.
Figure 14.
Simulated strain results of SLA-all. (a) Elastic strain; (b) Plastic strain.
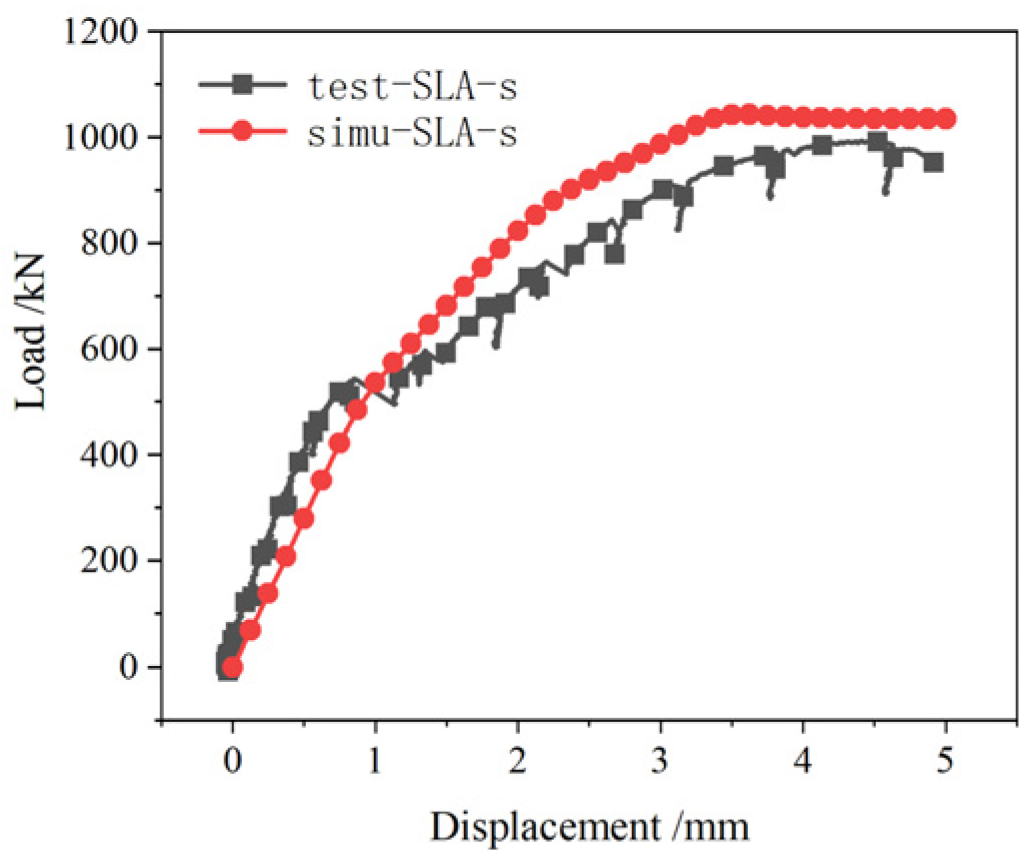
Figure 15.
Comparison of test and simulated load-displacement results for SLA-s.
Figure 15.
Comparison of test and simulated load-displacement results for SLA-s.
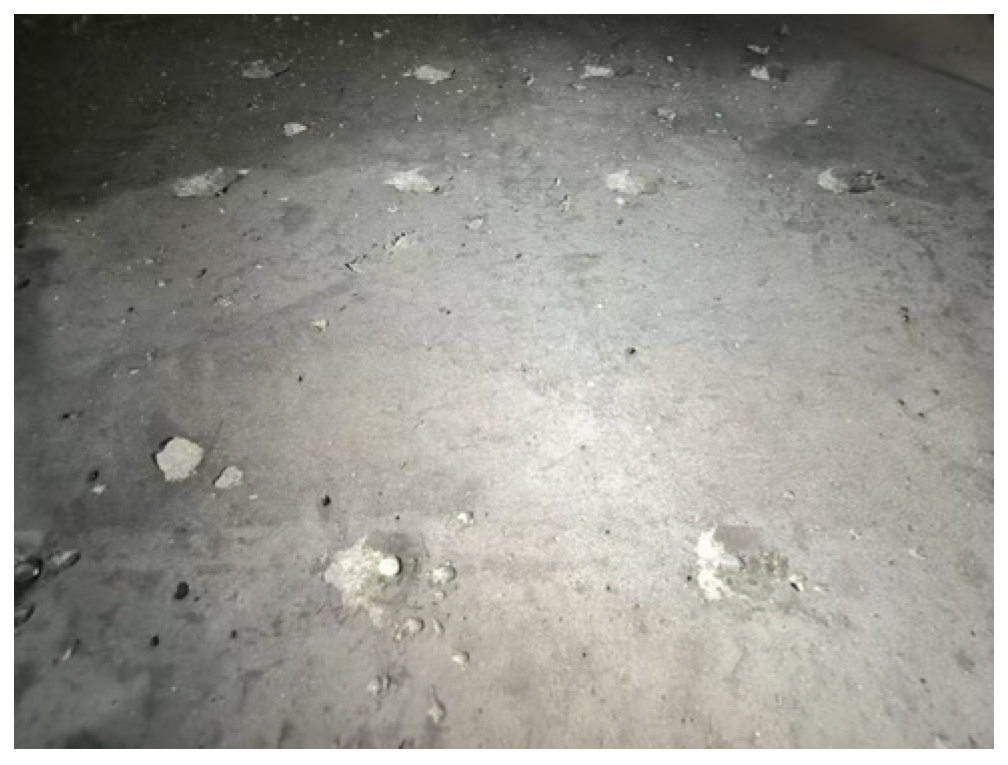
Figure 16.
Test results for SLA-s.
Figure 16.
Test results for SLA-s.
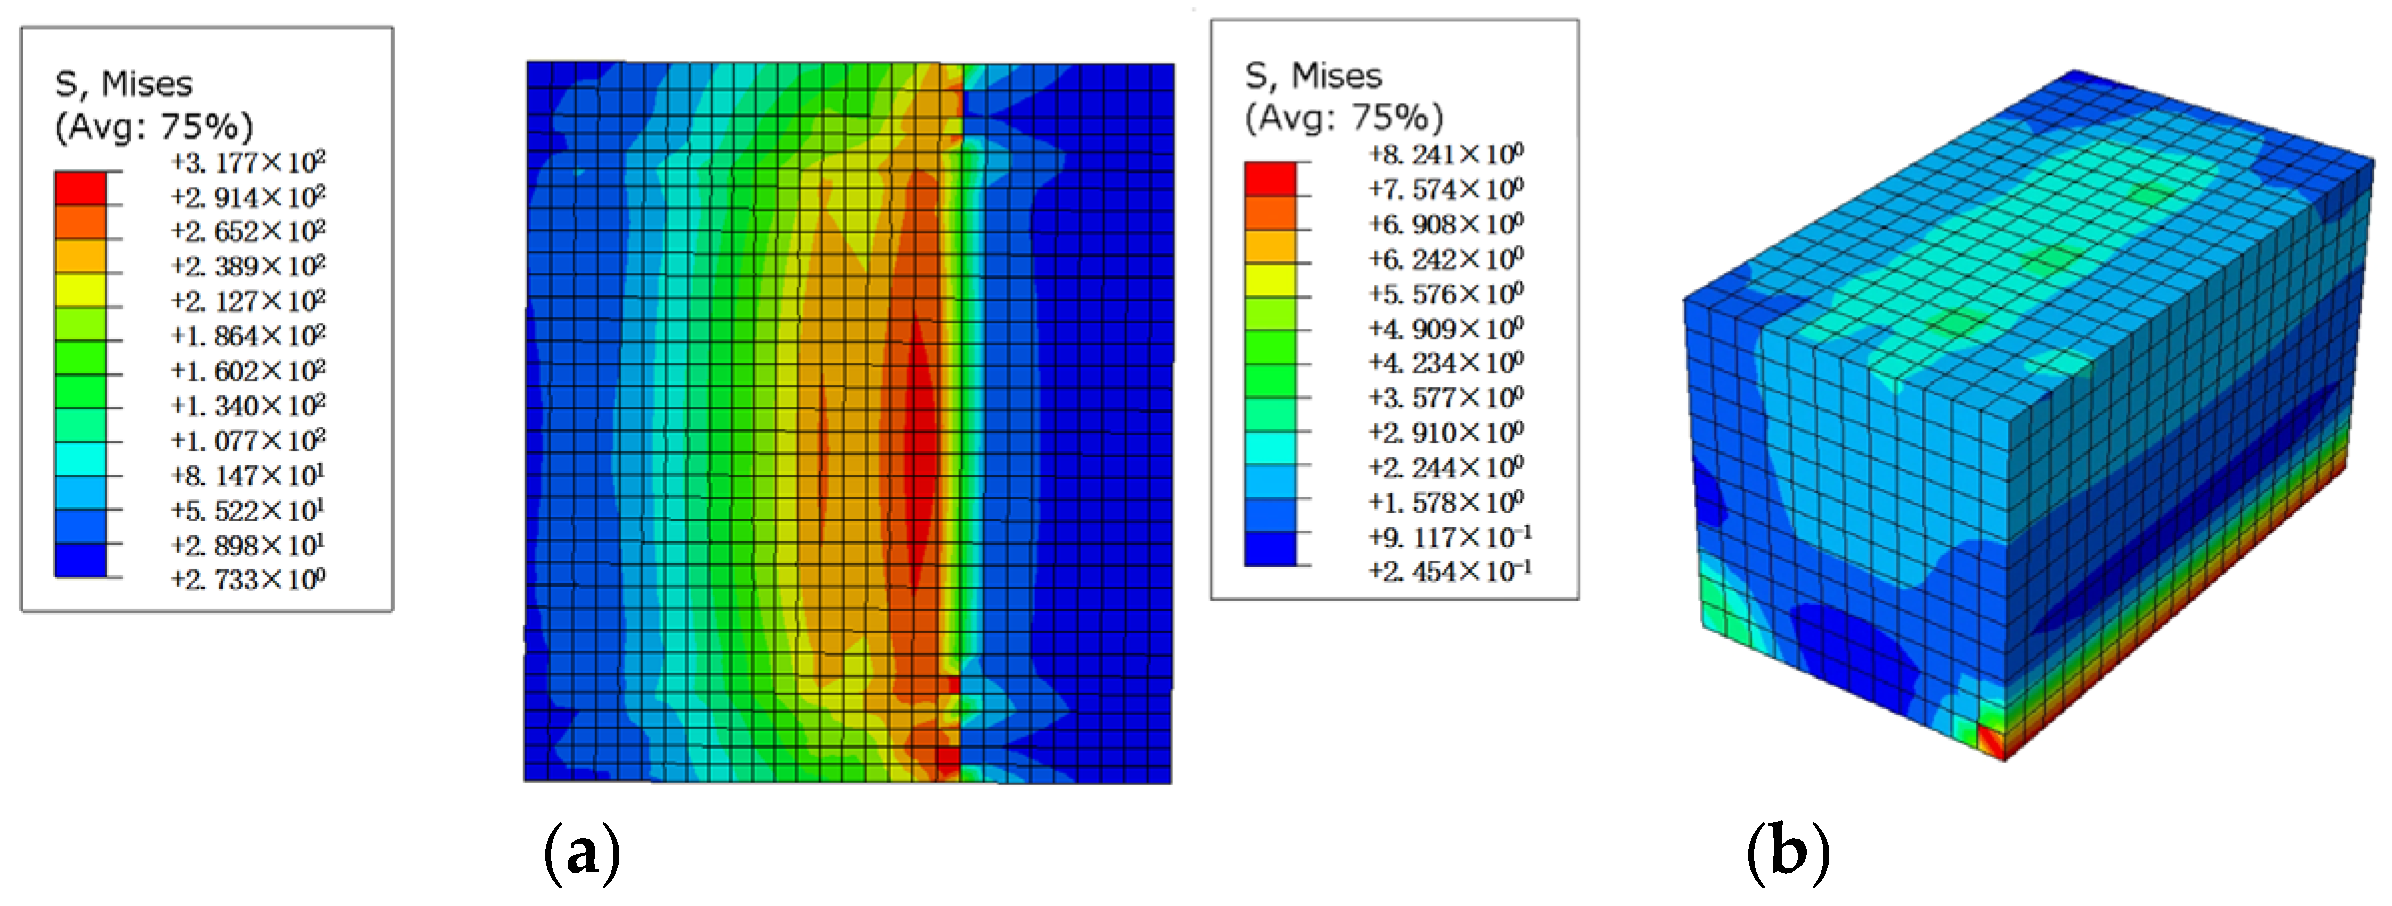
Figure 17.
Simulated stress results of SLA-s. (a) Steel liner plate. (b) Concrete.
Figure 17.
Simulated stress results of SLA-s. (a) Steel liner plate. (b) Concrete.
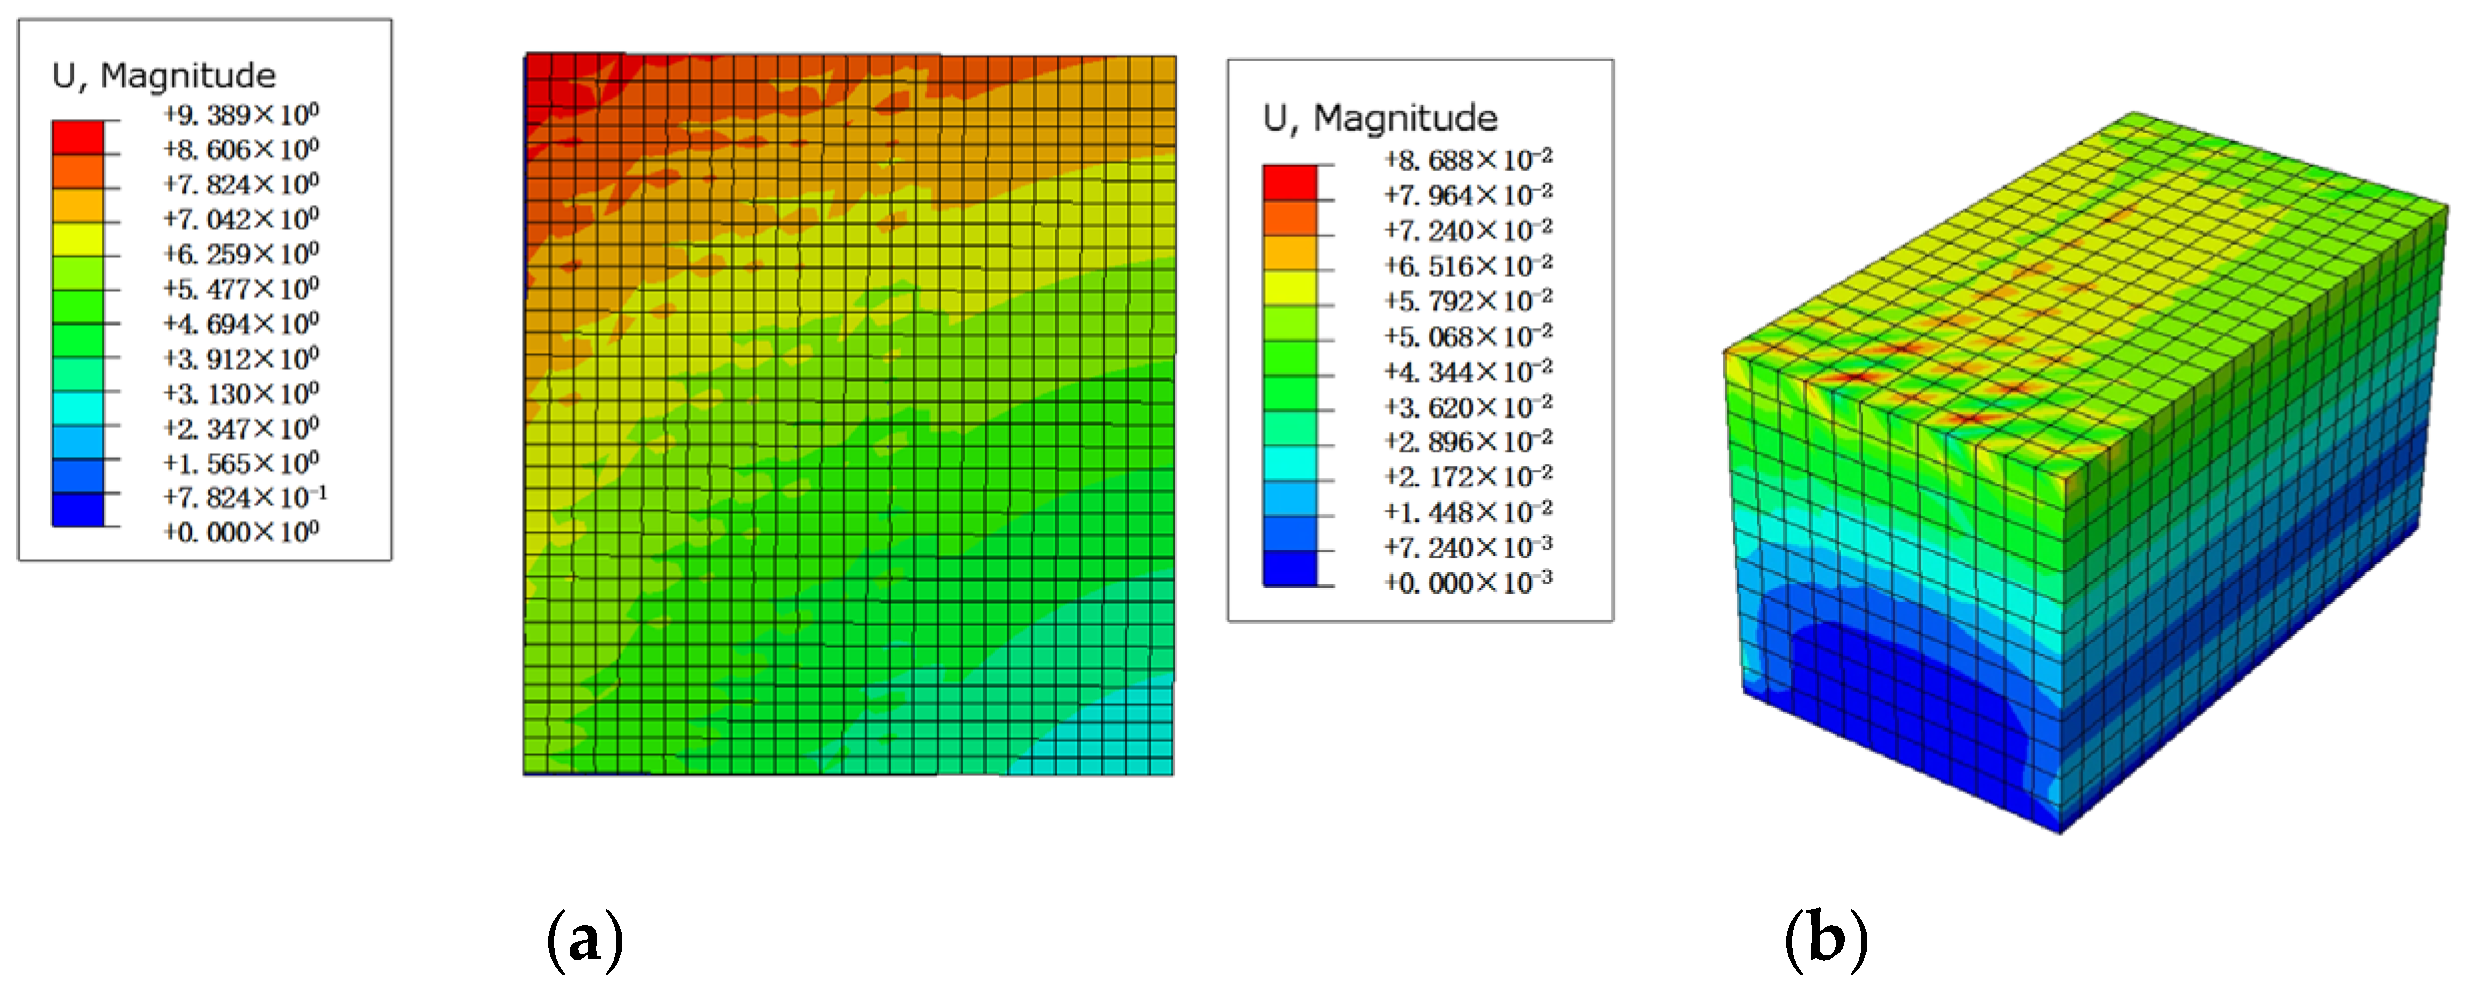
Figure 18.
Simulated deformation results of SLA-s. (a) Steel liner plate. (b) Concrete.
Figure 18.
Simulated deformation results of SLA-s. (a) Steel liner plate. (b) Concrete.
Figure 19.
Simulated strain results of SLA-s (a) Elastic strain; (b) Plastic strain.
Figure 19.
Simulated strain results of SLA-s (a) Elastic strain; (b) Plastic strain.
Figure 20.
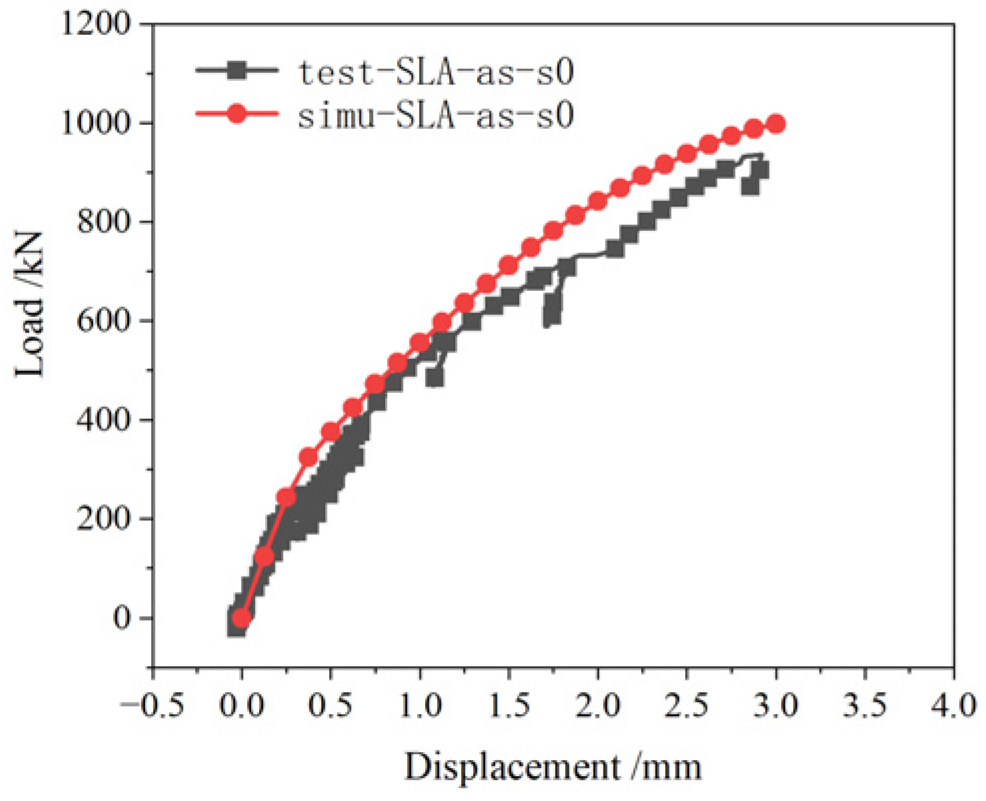
Comparison of test and simulated load–displacement results for SLA-as-s0.
Figure 20.
Comparison of test and simulated load–displacement results for SLA-as-s0.
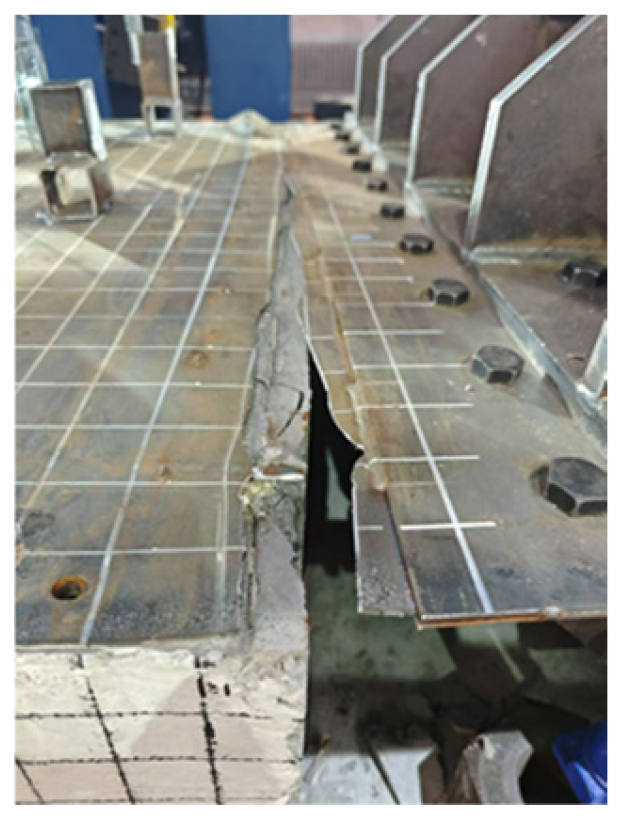
Figure 21.
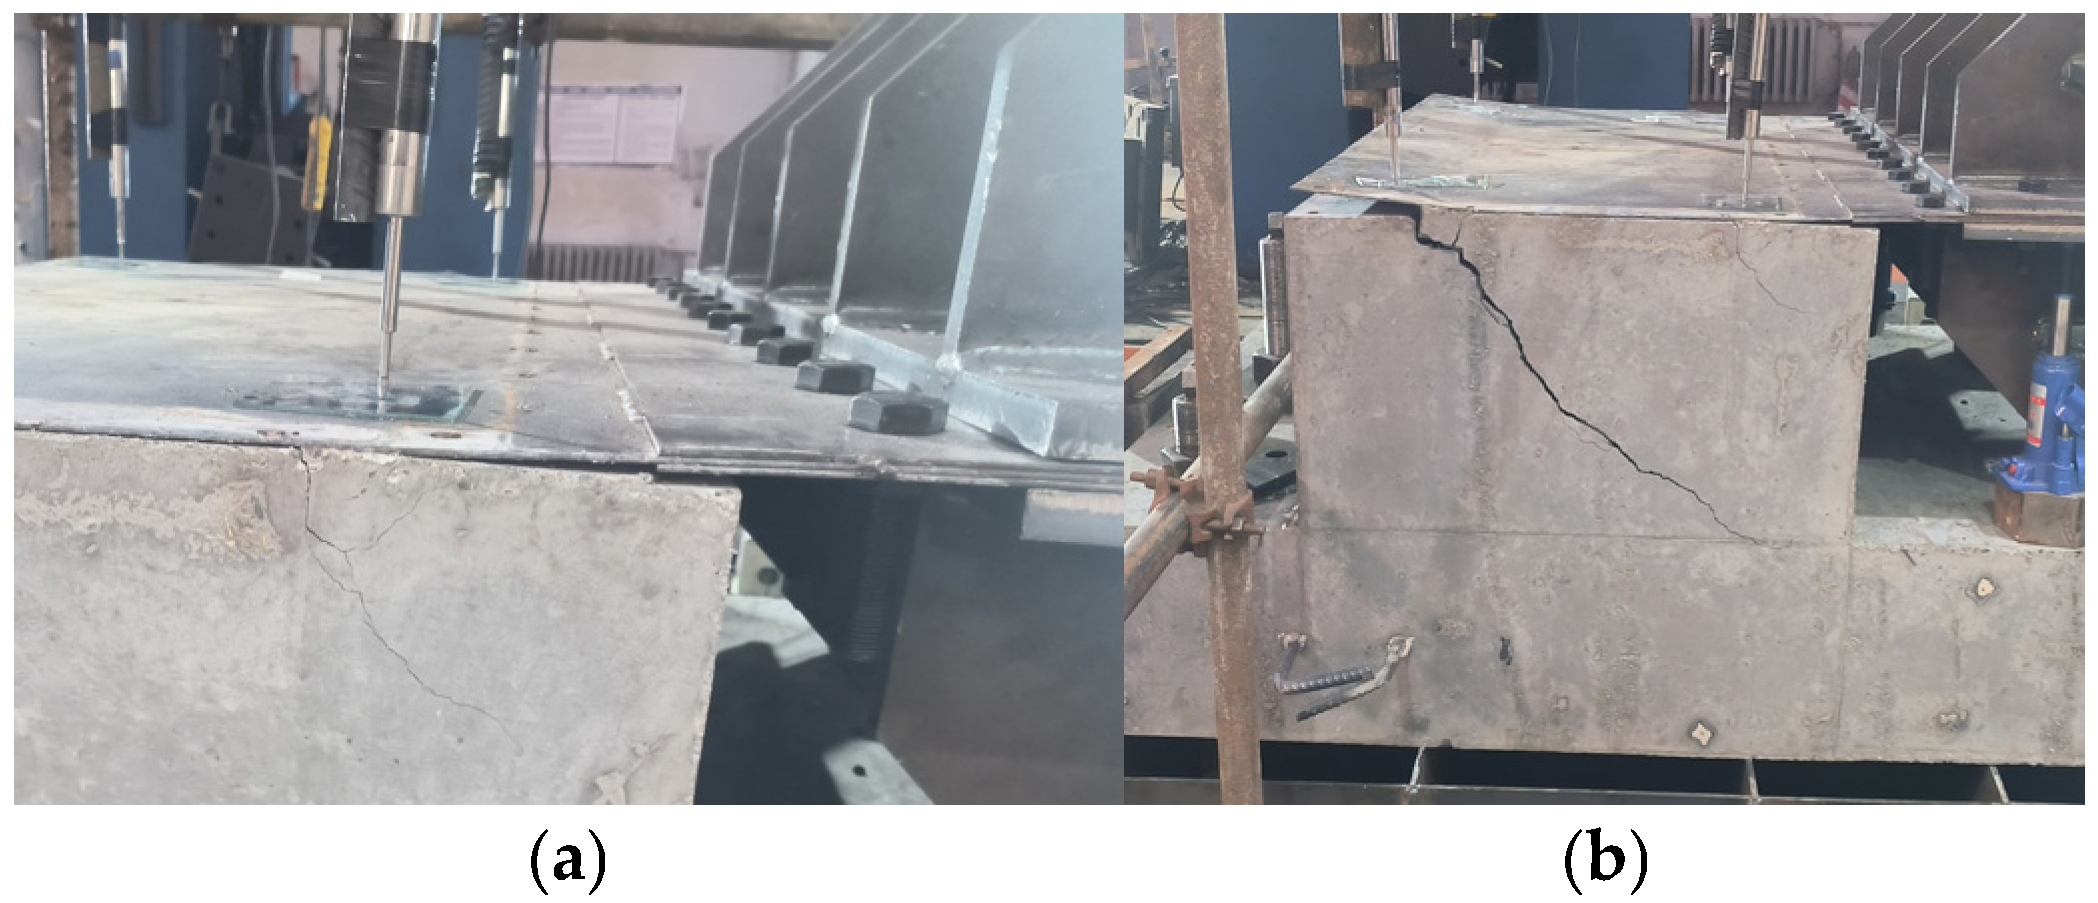
Test results for SLA-as-s0. (a) Anchorage failure occurs near the tensile end of angle steel and concrete. (b) Both long angle steels exhibit anchorage failure.
Figure 21.
Test results for SLA-as-s0. (a) Anchorage failure occurs near the tensile end of angle steel and concrete. (b) Both long angle steels exhibit anchorage failure.
Figure 22.
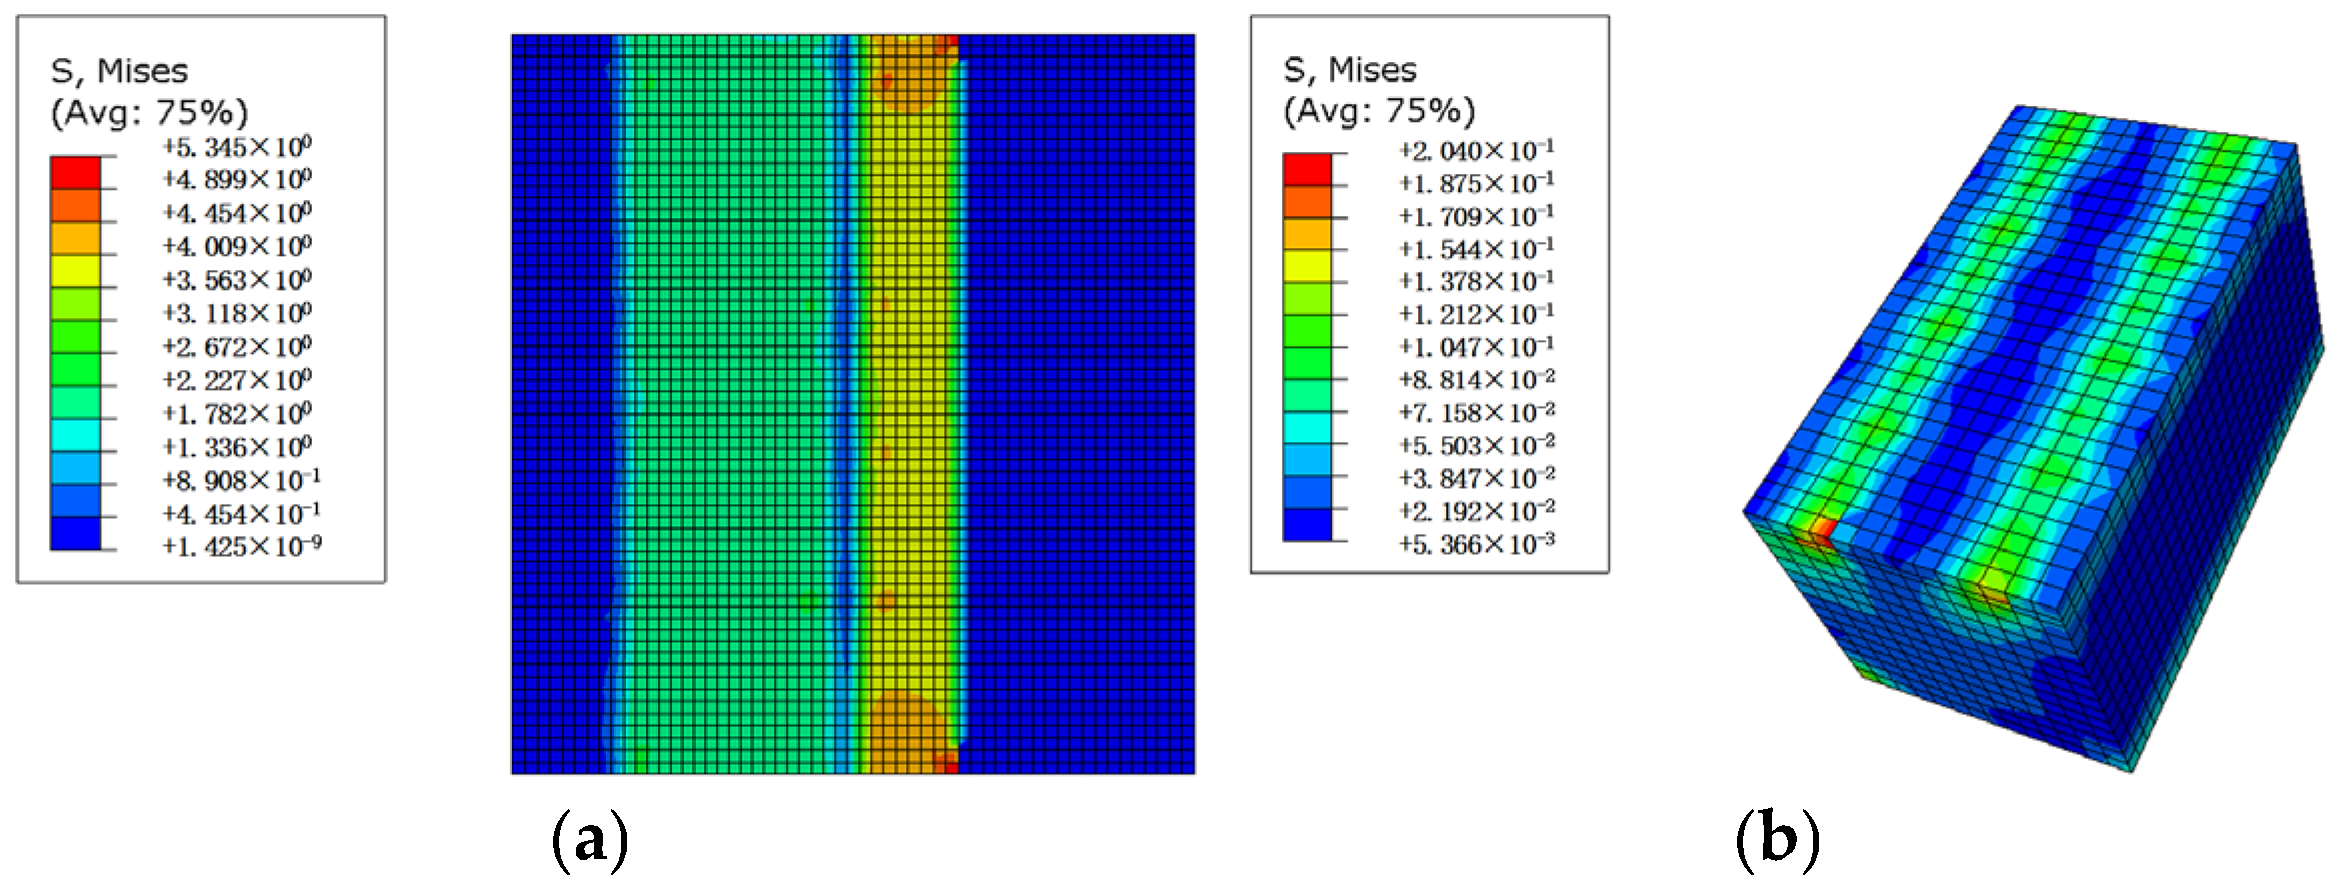
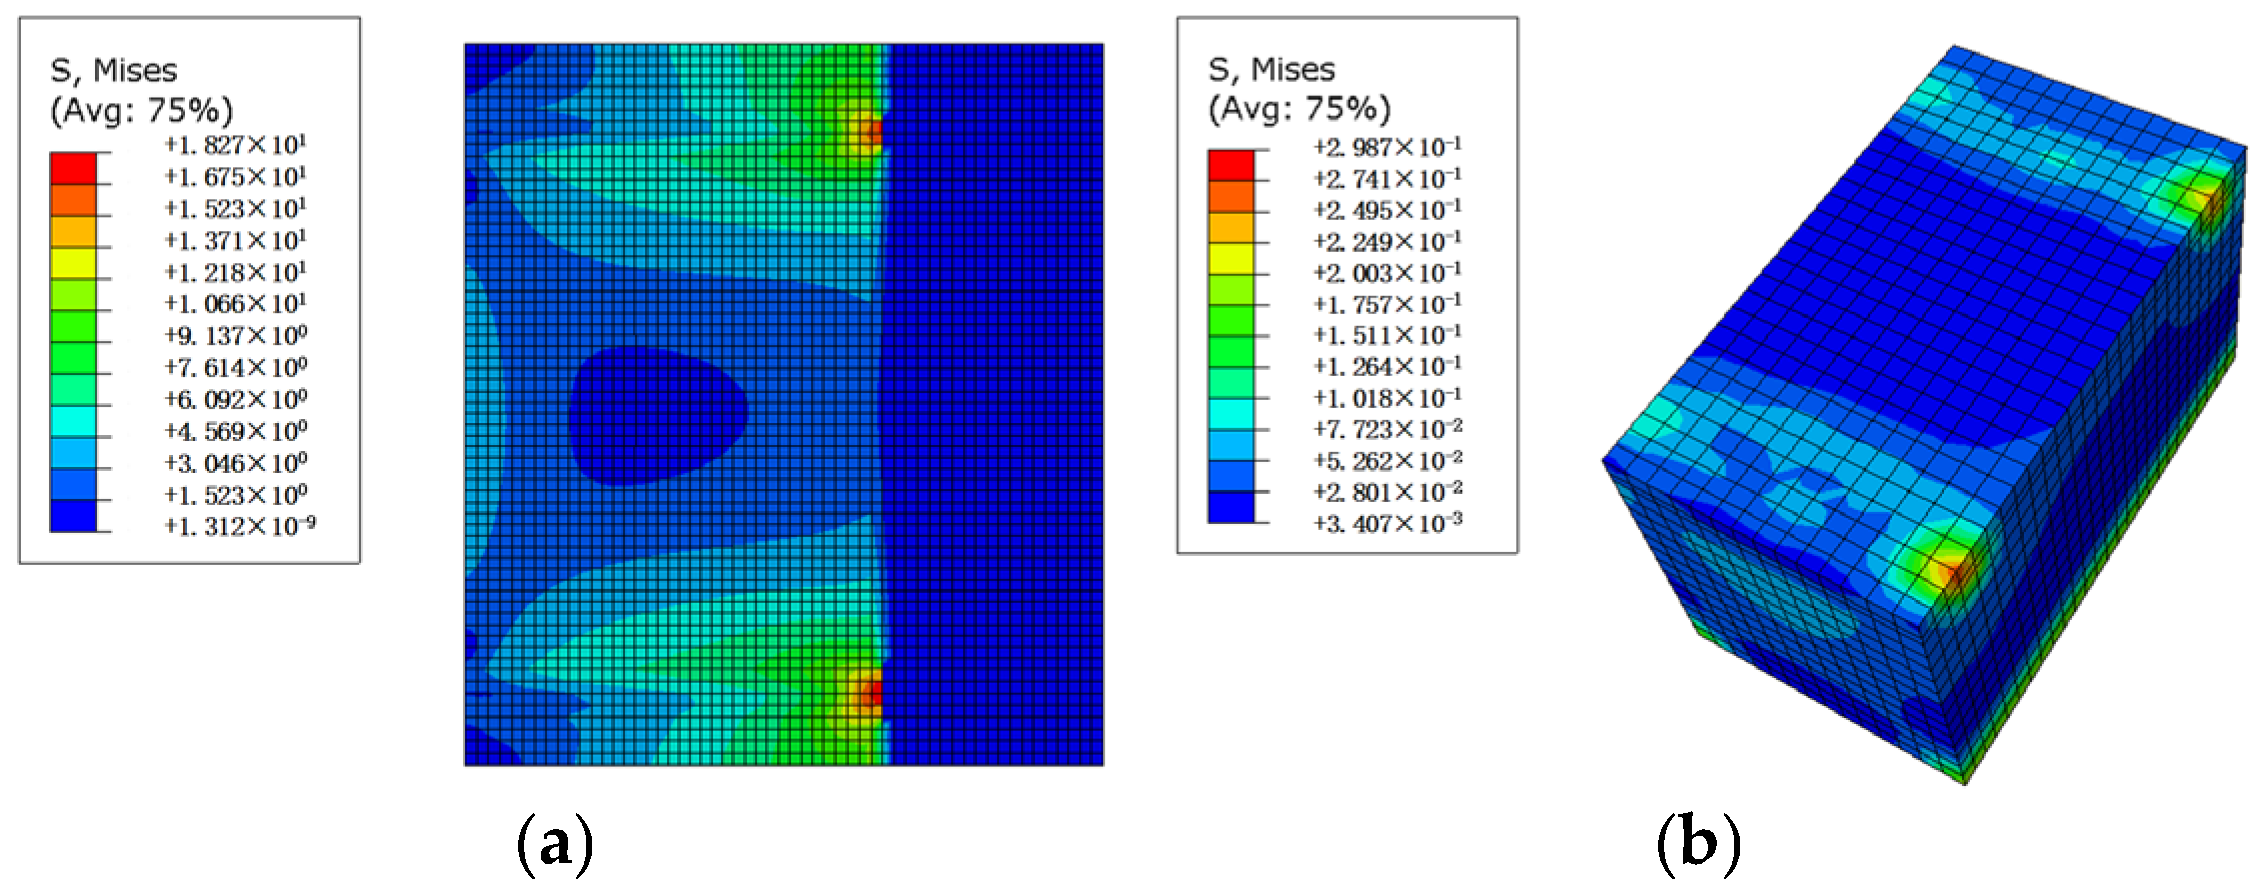
Simulated stress results of SLA-as-s0. (a) Steel liner plate. (b) Concrete.
Figure 22.
Simulated stress results of SLA-as-s0. (a) Steel liner plate. (b) Concrete.
Figure 23.
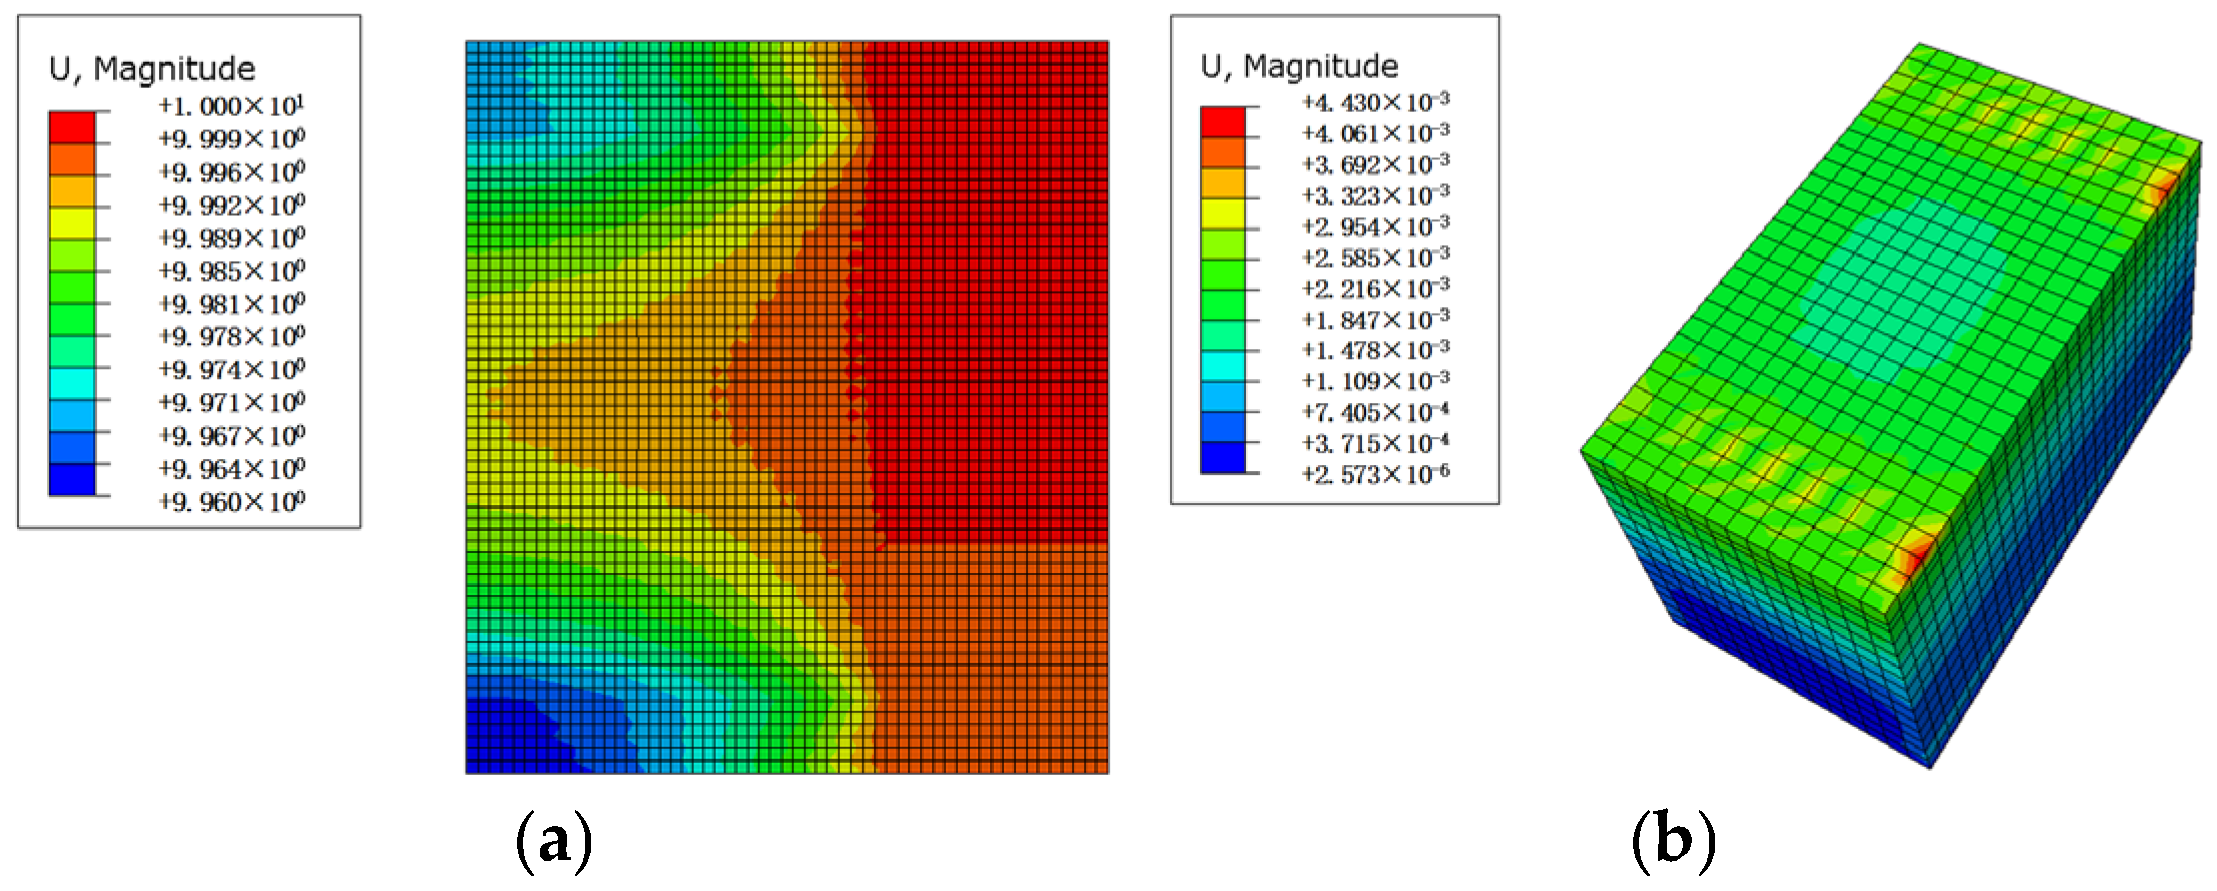
Simulated deformation results of SLA-as-s0. (a) Steel liner plate. (b) Concrete.
Figure 23.
Simulated deformation results of SLA-as-s0. (a) Steel liner plate. (b) Concrete.
Figure 24.
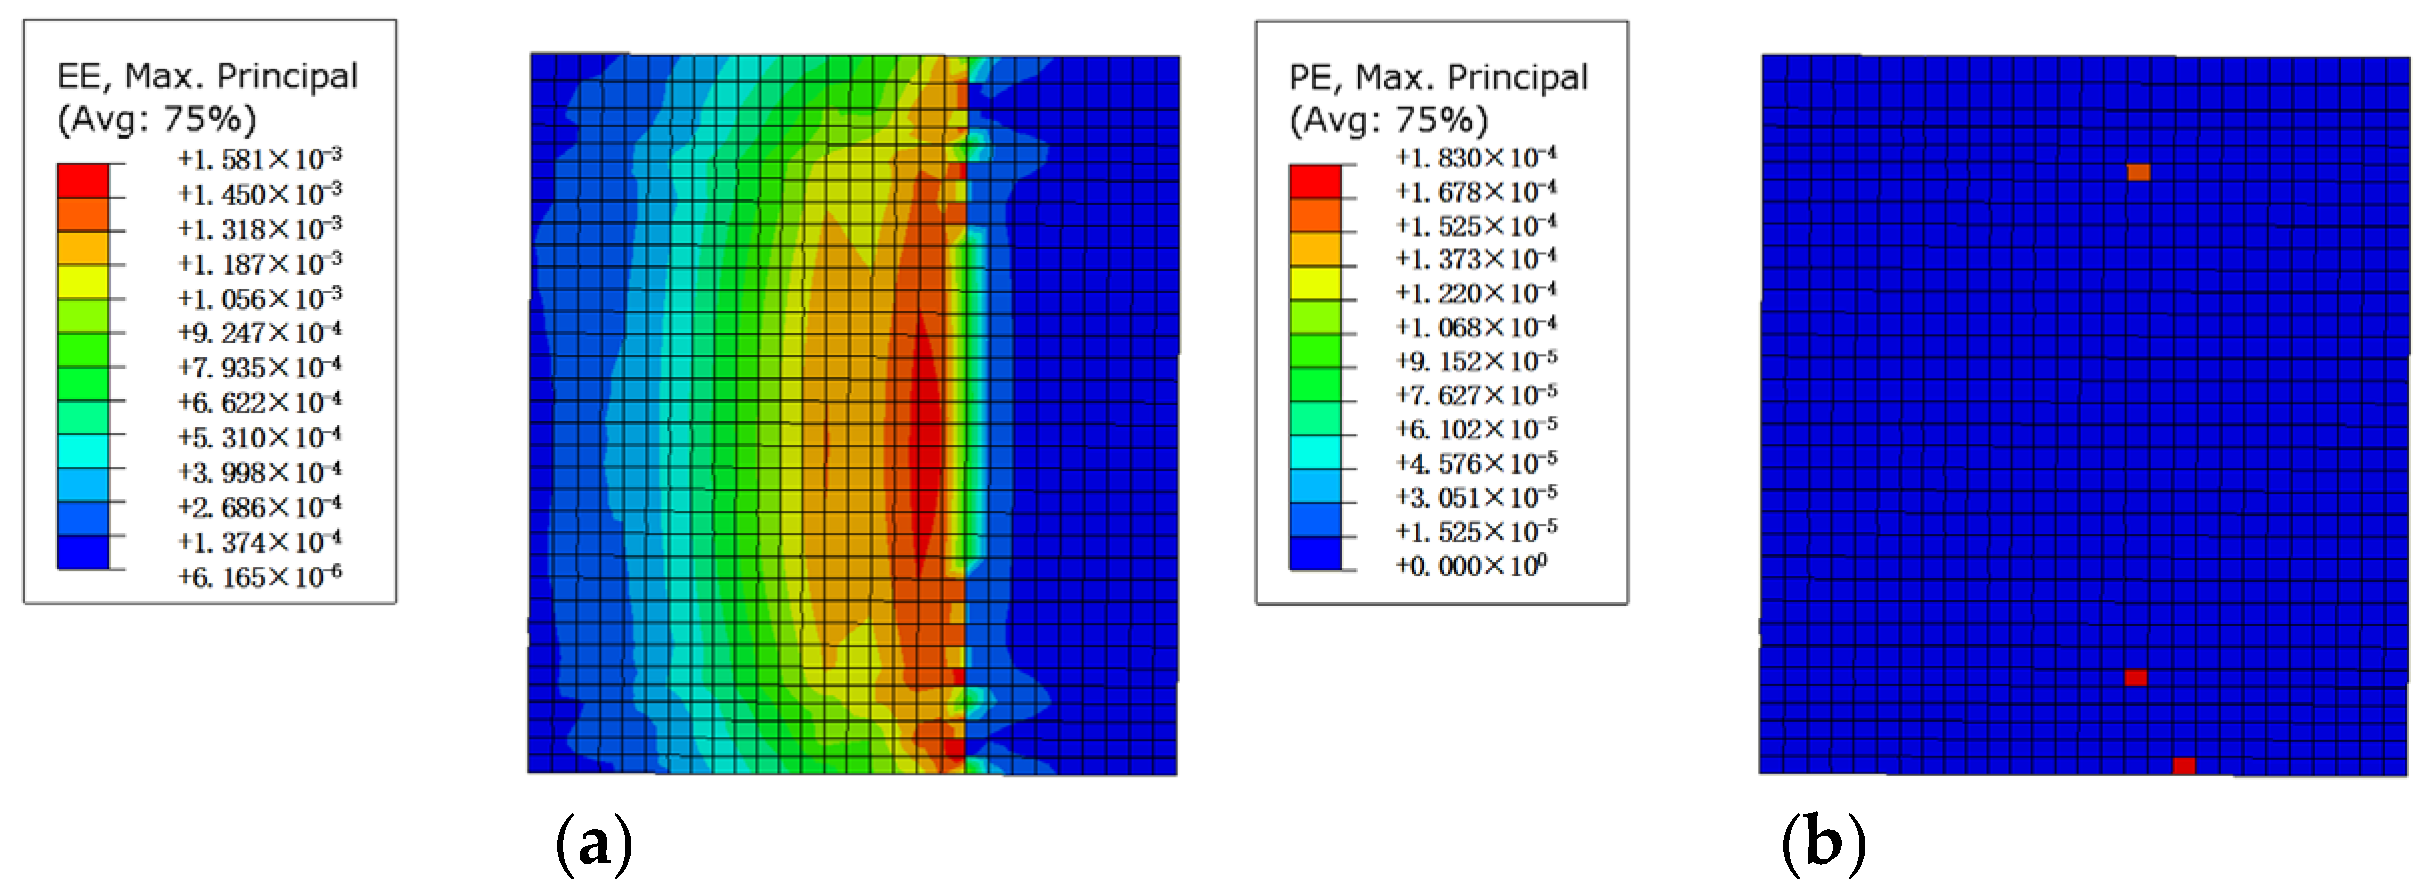
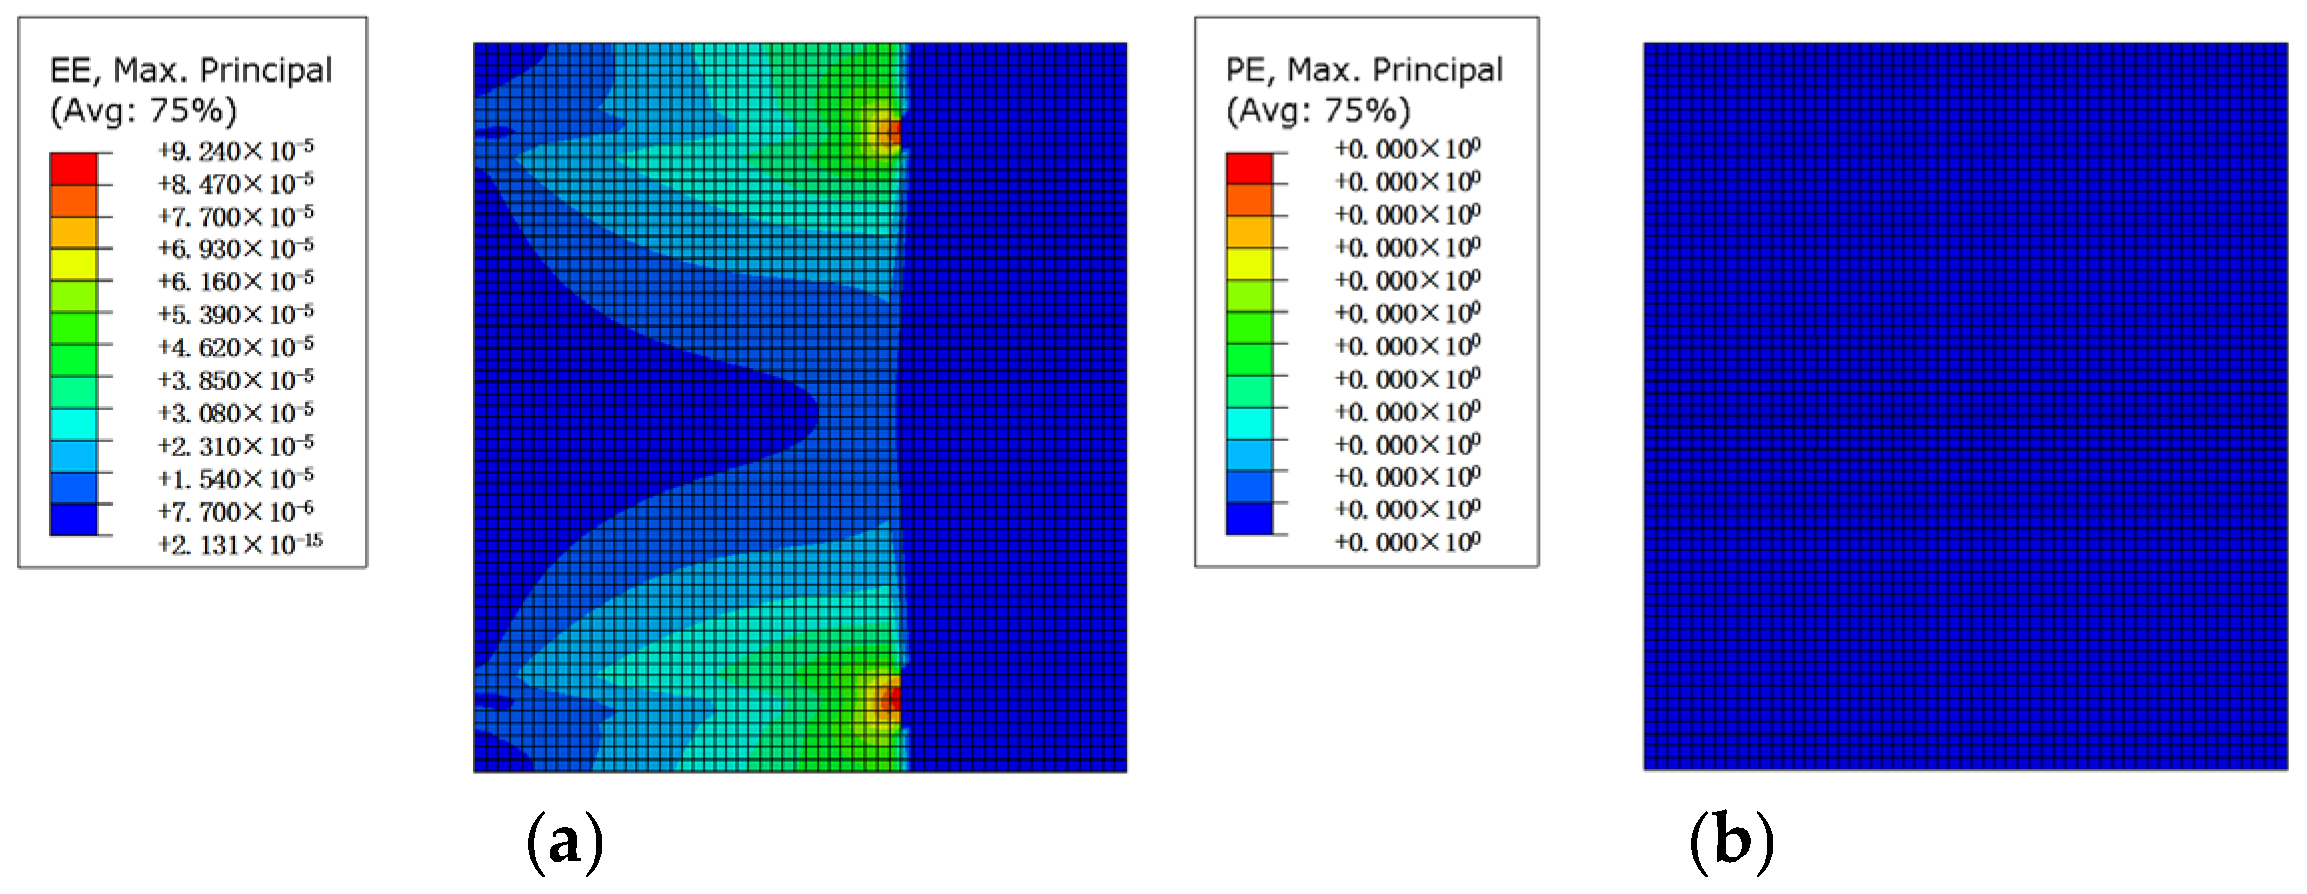
Simulated strain results of SLA-as-s0. (a) Elastic strain. (b) Plastic strain.
Figure 24.
Simulated strain results of SLA-as-s0. (a) Elastic strain. (b) Plastic strain.
Figure 25.
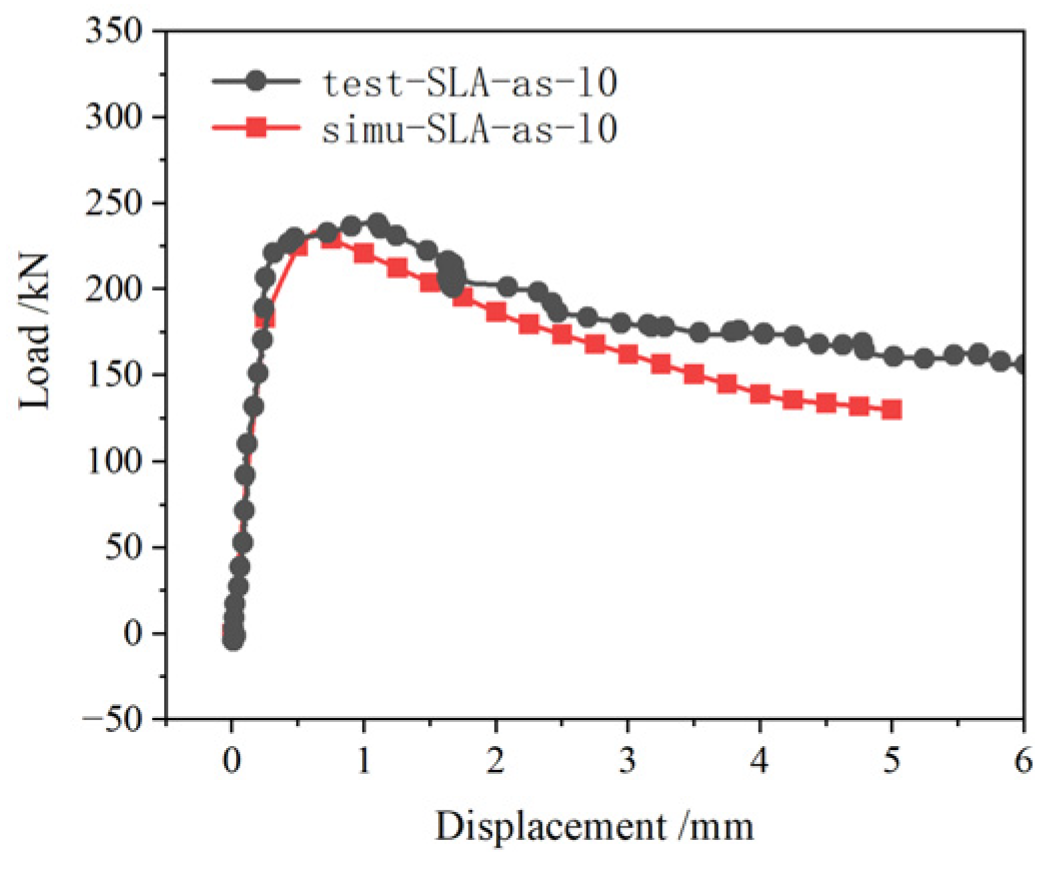
Comparison of test and simulated load–displacement results for SLA-as-l0.
Figure 25.
Comparison of test and simulated load–displacement results for SLA-as-l0.
Figure 26.
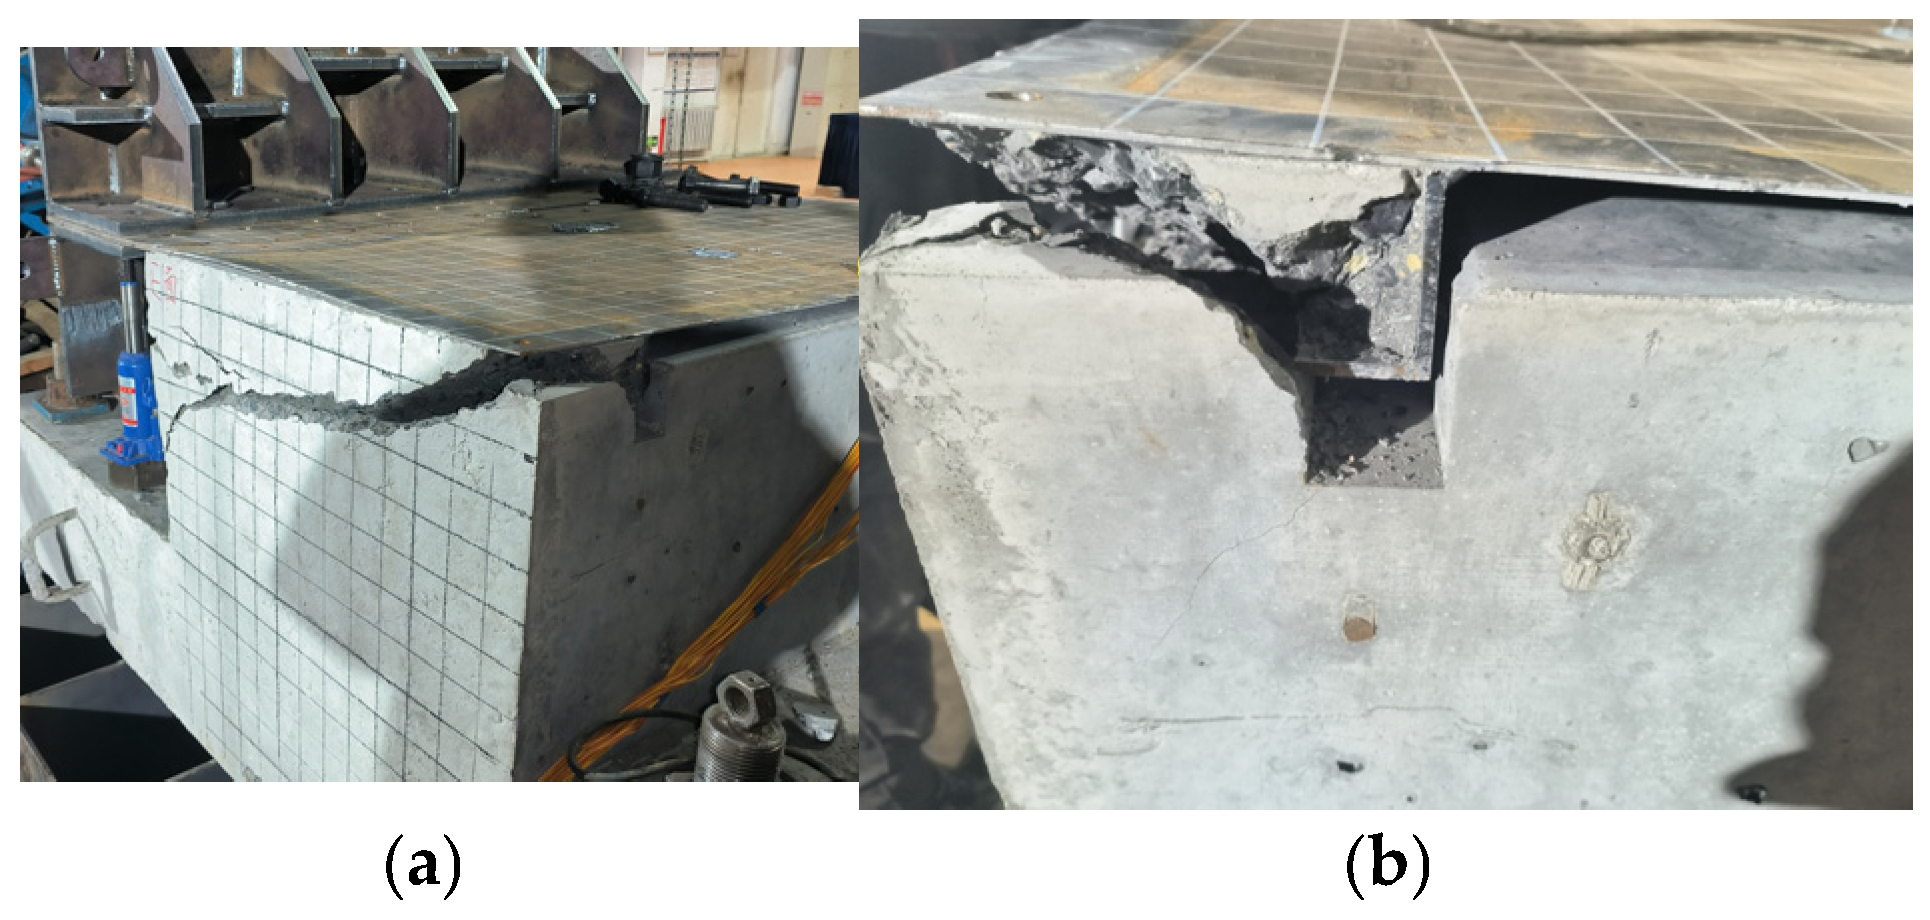
Test results for SLA-as-l0. (a) Overall view of the failed specimen; (b) Magnified partial view.
Figure 26.
Test results for SLA-as-l0. (a) Overall view of the failed specimen; (b) Magnified partial view.
Figure 27.
Simulated stress results of SLA-as-l0. (a) Steel liner plate. (b) Concrete.
Figure 27.
Simulated stress results of SLA-as-l0. (a) Steel liner plate. (b) Concrete.
Figure 28.
Simulated deformation results of SLA-as-l0. (a) Steel liner plate. (b) Concrete.
Figure 28.
Simulated deformation results of SLA-as-l0. (a) Steel liner plate. (b) Concrete.
Figure 29.
Simulated strain results of SLA-as-l0. (a) Elastic strain; (b) Plastic strain.
Figure 29.
Simulated strain results of SLA-as-l0. (a) Elastic strain; (b) Plastic strain.
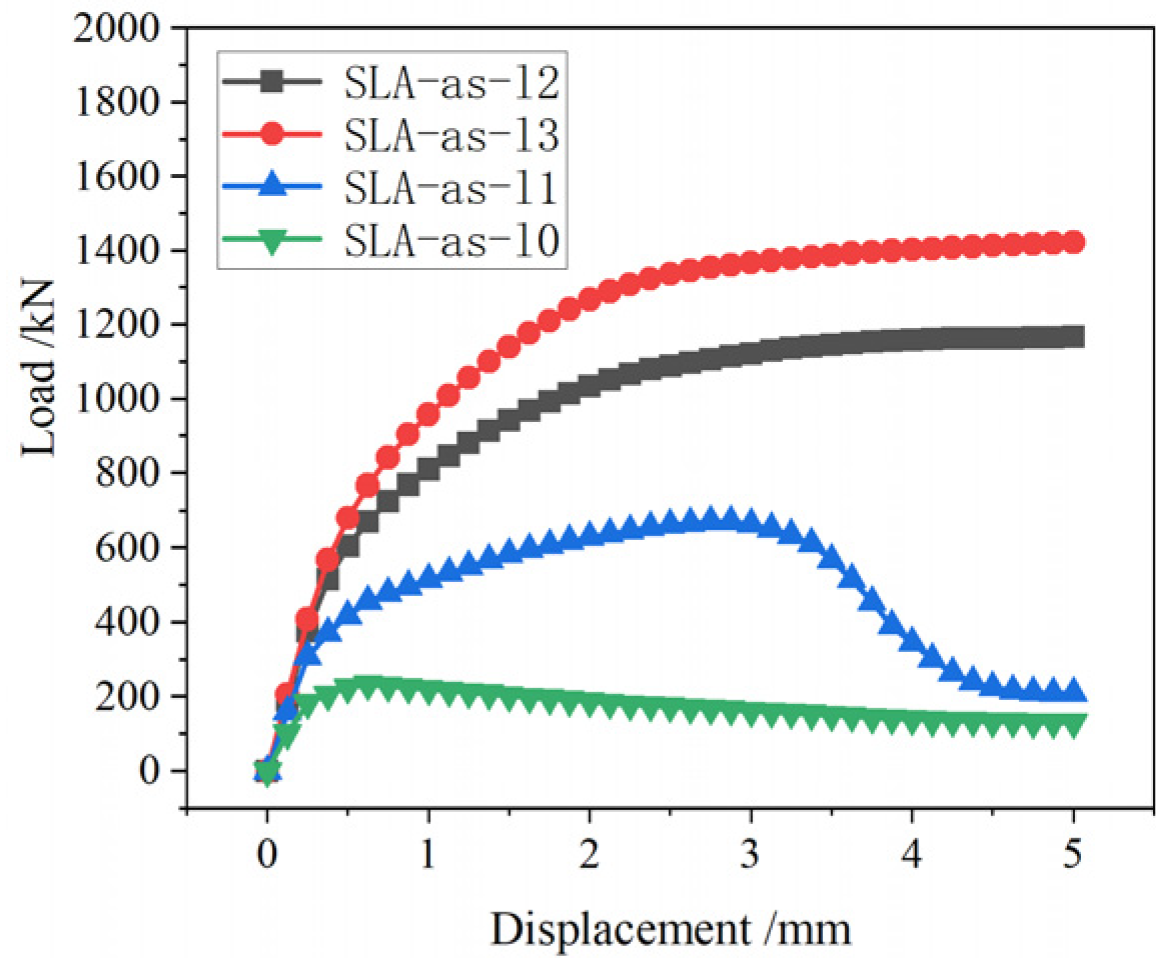
Figure 30.
Load–displacement results of long angle steels.
Figure 30.
Load–displacement results of long angle steels.
Figure 31.
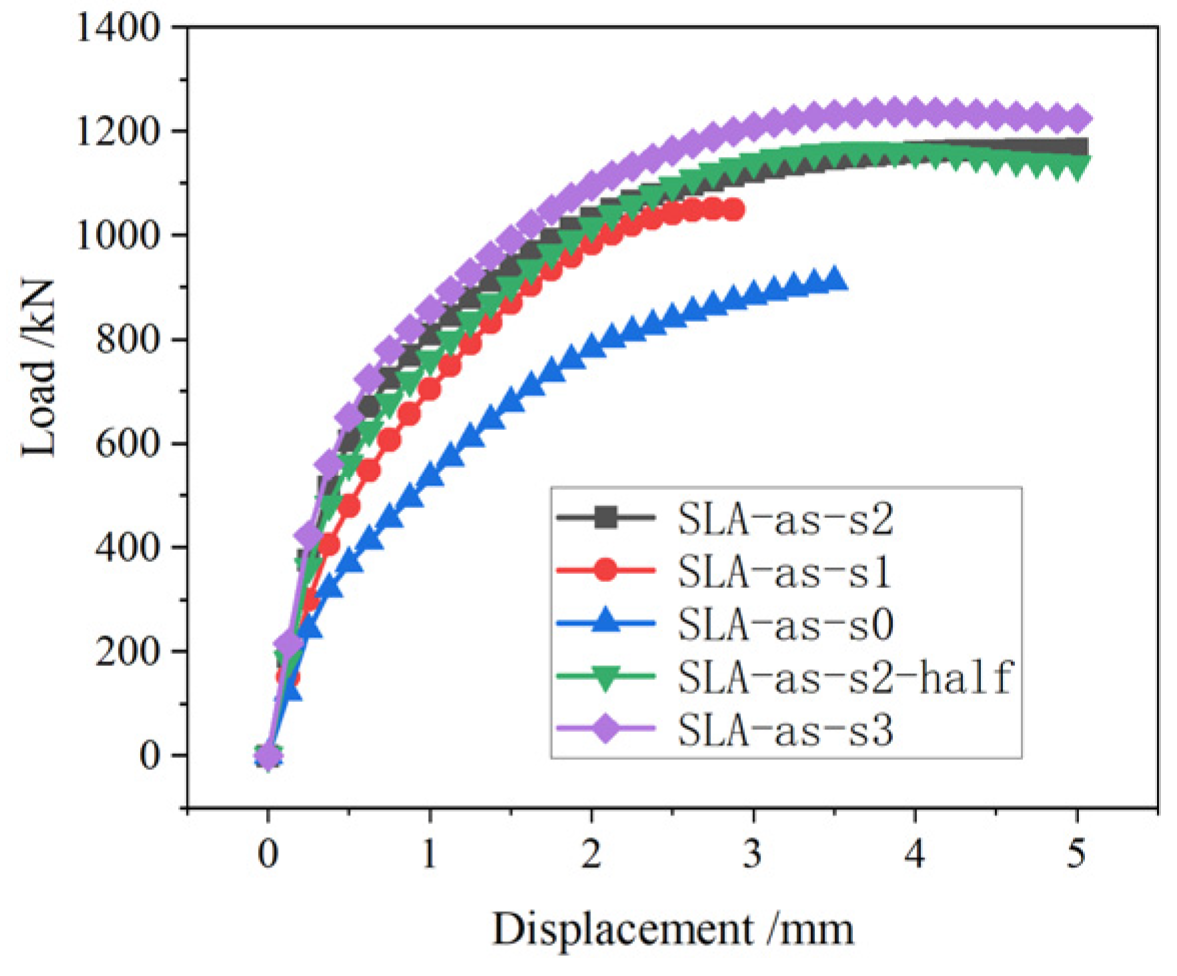
Load–displacement results of short-angle steels.
Figure 31.
Load–displacement results of short-angle steels.
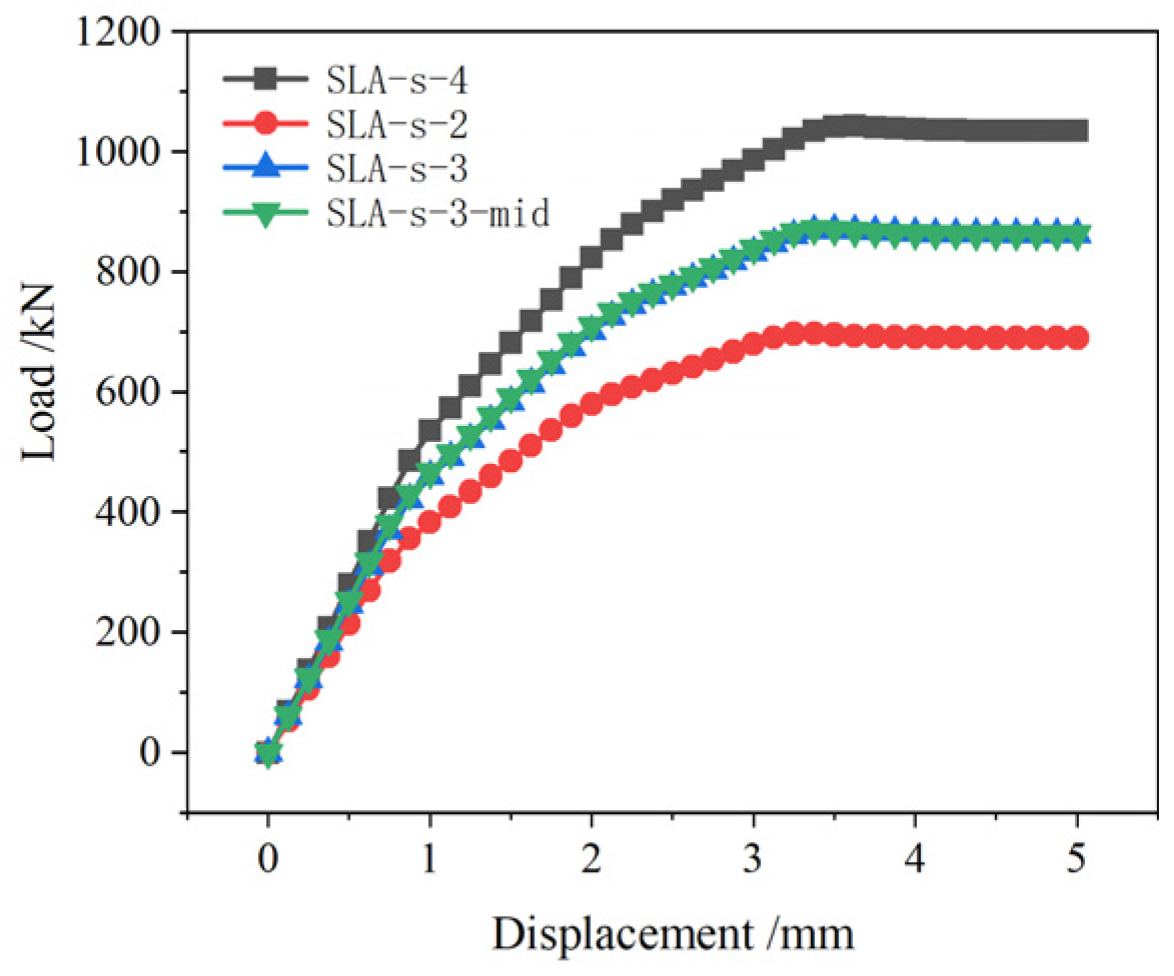
Figure 32.
Load–displacement results of studs.
Figure 32.
Load–displacement results of studs.
Table 1.
Designation and definition of all specimens.
Table 1.
Designation and definition of all specimens.
| Designation | Definition |
|---|
| SLA-all | Steel Liner Anchorage system with all angle steels and studs |
| SLA-as | Angle-Steel-Only steel liner anchorage system |
| SLA-as-l0 | Angle-Steel-Only steel liner anchorage system (No Long-Angle Steels) |
| SLA-as-l1 | Angle-Steel-Only steel liner anchorage system (1 Long-Angle Steel) |
| SLA-as-l2 | Angle-Steel-Only steel liner anchorage system (2 Long-Angle Steels) |
| SLA-as-l3 | Angle-Steel-Only steel liner anchorage system (3 Long-Angle Steels) |
| SLA-as-s0 | Angle-Steel-Only steel liner anchorage system (0 Short-Angle Steels) |
| SLA-as-s1 | Angle-Steel-Only steel liner anchorage system (1 Short-Angle Steel) |
| SLA-as-s2 | Angle-Steel-Only steel liner anchorage system (2 Short-Angle Steels) |
| SLA-as-s2-half | Angle-Steel-Only steel liner anchorage system (2 Short-Angle Steels, 1/2 standard spacing) |
| SLA-as-s3 | Angle-Steel-Only steel liner anchorage system (3 Short-Angle Steels) |
| SLA-s | Stud-Only steel liner anchorage system |
| SLA-s-4 | Stud-Only steel liner anchorage system (4 Rows of Studs) |
| SLA-s-3 | Stud-Only steel liner anchorage system (3 Rows of Studs) |
| SLA-s-3-mid | Stud-Only steel liner anchorage system (3 Rows of Studs, 1 Middle Row removed) |
| SLA-s-2 | Stud-Only steel liner anchorage system (2 Rows of Studs) |
Table 2.
Input parameters of the CDP model.
Table 2.
Input parameters of the CDP model.
| Dilation Angle | Eccentricity | fb0/fc0 | K | Viscosity Parameter |
|---|
| 34 | 0.1 | 1.16 | 0.6667 | 0.008 |
Table 3.
The tensile and compressive parameters of the nonlinear springs.
Table 3.
The tensile and compressive parameters of the nonlinear springs.
| Deformation/mm | −2.2 | −1.6 | −1.0 | −0.2 | 0 | 0.8 | 2.2 | 3.3 | 4.4 |
| Force/kN | −12.8 | −11.4 | −10.5 | −6.1 | 0 | 6.2 | 9.2 | 11.0 | 11.8 |
Table 4.
The connector parameters of short angle steels.
Table 4.
The connector parameters of short angle steels.
| Deformation/mm | −4 | −2 | −0.4 | −0.1 | 0 | 0.1 | 0.4 | 2 | 4 |
| Force/kN | −1.8 | −2.4 | −3.1 | −2.4 | 0 | 2.4 | 3.1 | 2.2 | 1.6 |
Table 5.
The connector parameters of long angle steels.
Table 5.
The connector parameters of long angle steels.
| Deformation/mm | −4.6 | −3.4 | −1.6 | −0.1 | 0 | 0.2 | 2 |
| Force/kN | −0.5 | −1.4 | −9.4 | −2.4 | 0 | 2.4 | 20.0 |
Table 6.
Bearing capacity with different long angle steel quantities.
Table 6.
Bearing capacity with different long angle steel quantities.
| Cases | Bearing Capacity | Bearing Capacity Contribution Ratio |
|---|
| kN | % |
|---|
| SLA-as-l0 | 233 | 100% |
| SLA-as-l1 | 672 | 288% |
| SLA-as-l2 | 1165 | 499% |
| SLA-as-l3 | 1421 | 608% |
Table 7.
Bearing capacity with different short-angle steel quantities.
Table 7.
Bearing capacity with different short-angle steel quantities.
| Cases | Bearing Capacity | Bearing Capacity Contribution Ratio |
|---|
| (kN) | % |
|---|
| SLA-as-s0 | 912 | 100% |
| SLA-as-s1 | 1049 | 115% |
| SLA-as-s2 | 1165 | 128% |
| SLA-as-s2-half | 1163 | 127% |
| SLA-as-s3 | 1238 | 136% |
Table 8.
Bearing capacity with different stud quantities.
Table 8.
Bearing capacity with different stud quantities.
| Cases | Bearing Capacity | Bearing Capacity Contribution Ratio |
|---|
| (kN) | % |
|---|
| SLA-s-4 | 1043 | 100% |
| SLA-s-3 | 862 | 83% |
| SLA-s-3-mid | 862 | 83% |
| SLA-s-2 | 695 | 67% |