Article

Numerical Investigation on Bearing Capacity Contribution and Failure Mechanism of Key Components in Containment Steel Liner Anchorage System

by
Qinqin Yao
1,
Jie Qi
1,
Yang Yu
2,3,*,
Fang Dong
1 and
Xinli Zhao
1
1
China Nuclear Power Engineering Co., Ltd., Beijing 100840, China
2
Key Lab of Structures Dynamic Behavior and Control of the Ministry of Education, Harbin Institute of Technology, Harbin 150090, China
3
Key Lab of Smart Prevention and Mitigation of Civil Engineering Disasters of the Ministry of Industry and Information Technology, Harbin Institute of Technology, Harbin 150090, China
*
Author to whom correspondence should be addressed.
Buildings 2026, 16(11), 2181; https://doi.org/10.3390/buildings16112181
Submission received: 16 March 2026 / Revised: 19 May 2026 / Accepted: 25 May 2026 / Published: 29 May 2026

Abstract

The containment structure serves as the final leak-tight barrier of nuclear power plants, making it critical to nuclear safety. The stable performance of the steel liner anchorage system is the fundamental prerequisite for maintaining the structural integrity of the containment. However, existing studies lack systematic quantification of the mechanical behavior and bearing capacity contributions of key components (angle steels, studs) in such anchorage system, creating significant uncertainties to the engineering design of steel liner plates. In this study, a high-fidelity three-dimensional numerical model of the steel liner composite anchorage system is established. A systematic parametric analysis is conducted to investigate the influence of angle steel quantity and stud row number on the system’s mechanical response. Three typical failure modes are identified for the steel liner anchorage system, and the individual contributions of long angle steels, short angle steels and studs to the global load-bearing capacity are quantified independently. The rationality of the angle steel spacing design employed in the prototype structure is confirmed, and the nonlinear contribution characteristics of angle steels and studs are elucidated. The findings provide a crucial theoretical foundation for the optimal design and safety assessment of the steel liner anchorage system in nuclear plants.

1. Introduction

Against the global backdrop of the energy structure transition towards clean and low-carbon development, nuclear power has emerged as a critical pillar for ensuring energy security and addressing climate change due to its high efficiency, operational stability, and low-carbon advantages. The safe operation of nuclear power plants is directly linked to public safety, ecological integrity, and sustainable socioeconomic development. Consequently, nuclear safety has always been the paramount prerequisite and overriding principle for the development of the nuclear power industry.
As the final leak-tight barrier of nuclear power plants, the containment structure represents the last line of defense against radioactive leakage. Its structural integrity and leak-tightness directly determine the safety performance of a nuclear power plant. Among various containment types, prestressed concrete containment (PCC) has gained widespread adoption in global nuclear power projects due to its superior bearing capacity, excellent long-term durability, and favorable economic efficiency. As the primary sealing component of PCC, the steel liner is bonded to the inner surface of the containment. Its function is to guarantee the leak-tightness and water-tightness of the containment, preventing the leakage of radioactive substances through concrete cracks. Hence, the reliable performance of the steel liner is a fundamental prerequisite for the containment’s protective function.
The integrity of the connection between the steel liner plate and the concrete is directly governed by the mechanical behavior of the anchorage system. In current engineering practice, a composite anchorage system comprising angle steels and studs is widely used to securely anchor the steel liner plate to the concrete surface. Angle steels mainly provide continuous restraint, while studs offer discrete point anchorage. These components work synergistically to ensure the structural stability and sealing performance of the steel liner plate under complex service conditions, including internal pressure, temperature fluctuations, and seismic loads. The rationality of the anchorage system design and the quality of its mechanical performance not only affect the service life of the steel liner plate but also determine the safety and reliability of the entire containment structure. Anchorage system failure can lead to debonding and cracking of the steel liner plate, which may trigger radioactive leakage accidents, resulting in severe safety hazards and environmental damage.
Extensive research has been conducted on the performance of steel liner plates, which can be broadly classified into the following three streams:
The first stream focuses on the buckling and failure mechanisms of steel liner plates. Young et al. [1] compared the mechanical responses of steel liner plates anchored with L-shaped angle steels versus studs, confirming that buckling precedes yielding when the anchor spacing-to-steel liner thickness ratio ranges from 18 to 38. Ostapenko et al. [2] theoretically identified cylindrical and sinusoidal buckling as the primary buckling modes of steel liner plates, and subsequent studies have further validated these two dominant buckling configurations. Yan et al. [3] analyzed the construction stability of dome steel liners, demonstrating that initial geometric imperfections exert a negligible influence on the ultimate bearing capacity of the structure.
The second stream covers research on the mechanical behavior and design methods of anchorage components. Doyle et al. [4] combined theoretical analysis and experimental tests and proposed that cracking at the connection can be effectively prevented when the thickness ratio of the anchorage component to the steel liner does not exceed 2.7. Armentrout et al. [5] found that anchorage system failure is mostly manifested as the crushing of concrete. Burdette et al. [6] conducted pull-out tests on angle steel and steel liner plates and found that the load–displacement curves were conservative. Chan et al. [7], Kicher et al. [8], and Moon et al. [9] derived analytical solutions for steel liner buckling based on beam element buckling theory and proposed corresponding design methods for buckling prevention and anchorage systems.
The third stream relates to research on the construction process and design optimization of steel liners. Lu et al. [10] analyzed the influence of construction factors on the mechanical behavior of steel liner plates and established correlation curves between modular construction and pouring height. Their follow-up study [11] further clarified the effects of segment height and wind loads on the structural stress and radial displacement of steel liner plates. Ye et al. [12] optimized the design parameters of circular trusses for steel liner hoisting. Olowokere [13] simulated the mechanical behavior of steel liner plates during concrete pouring and investigated the effects of pouring height and stiffener arrangement on liner performance. Davies et al. [14] proposed an optimized design scheme for nuclear power plant containment steel liners from the perspectives of design optimization and cost control.
However, there are still notable gaps in the current research. There remains a lack of systematic and in-depth theoretical research and high-fidelity numerical analyses regarding the mechanical behavior of key components (angle steels, studs), their synergistic working mechanism and the components’ concrete interaction. In current design process, the mechanical performance evaluation of anchorage systems lacks sufficient precision: it fails to quantify the individual contributions of angle steels and studs to the bearing capacity and stiffness, and the influence of different anchorage parameters (such as stud spacing and angle steel spacing) on the mechanical performance remains unclear. This leads to a certain degree of uncertainty in design schemes, making it difficult to meet the stringent safety operation requirements of nuclear power plants and bringing potential safety hazards to engineering applications.
To fill the aforementioned research gaps, this study focuses on the steel liner anchorage system of nuclear power plant containment structures and adopts high-fidelity numerical simulation methods to carry out a systematic investigation. By establishing a three-dimensional numerical model of the angle steel–stud hybrid anchorage system, this study performs parametric analyses for different stud spacing and angle steel spacing configurations. This work quantifies the contribution of each key component to the bearing capacity and stiffness of the anchorage system, clarifies the stress characteristics and failure modes of the anchorage system, and provides theoretical support for the optimized design of steel liner anchorage systems.

2. Numerical Modeling

2.1. Simulation Case Setup

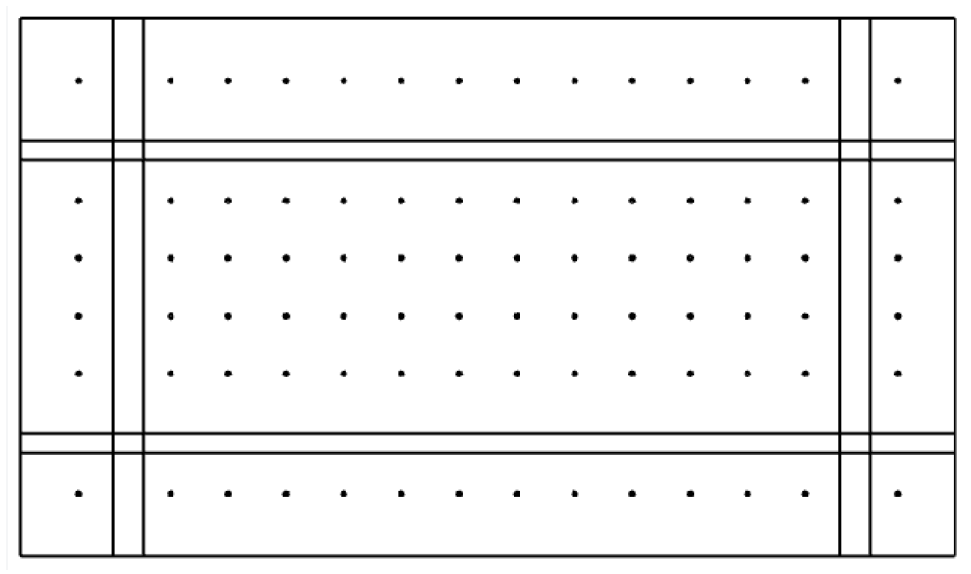
In this study, a core grid of the containment steel liner, together with a 1/4 outward extension relative to the bay size, is selected as the computational domain. The dimensions of the numerical model are 1215 mm in length and 700 mm in width, with a steel plate thickness of 3 mm. The circumferential (short) L-shaped angle steel has a cross-section of 62.5 × 40 × 5 mm, while the longitudinal (long) L-shaped angle steel has a cross-section of 37.5 × 25 × 4 mm. The studs are 4 mm in diameter and 40 mm in length, with C60 grade concrete employed. The two long angle steels are spaced 1890 mm apart, the two short angle steels are spaced 762 mm apart, and the studs are arranged in a uniform grid with a spacing of 150 mm. The steel liner plate extends beyond the tensile end section to form the loading region where tensile displacement is applied. The model is shown in Figure 1 and is named as SLA-all.
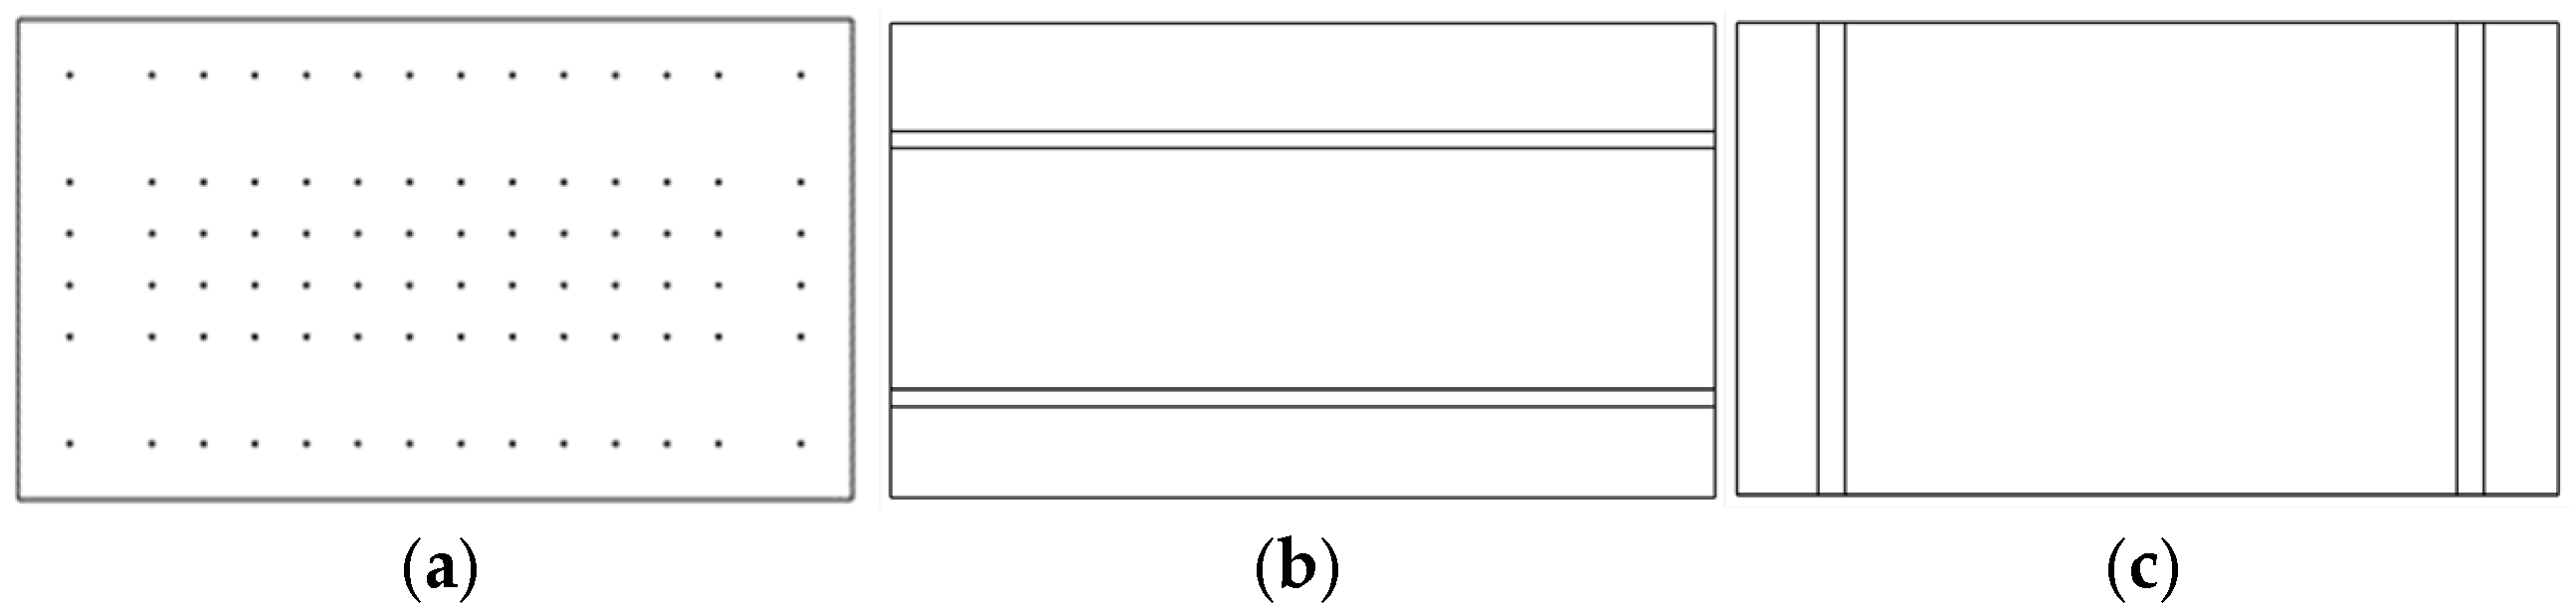
To quantitatively investigate the anchorage performance of anchorage systems with different component combinations, three numerical cases are established: the first is stud-only anchorage (named SLA-s, as shown in Figure 2a), the second is long-angle steel anchorage (named SLA-as-s0, as shown in Figure 2b), and the third is short-angle steel anchorage (named SLA-as-l0, as shown in Figure 2c).
According to the standard configuration of the containment steel liner, the angle steels for anchorage are categorized into two specifications: long-angle steels (cross-sectional dimensions: 62.5 × 40 × 5 mm) and short-angle steels (cross-sectional dimensions: 37.5 × 25 × 4 mm). To quantitatively characterize the contribution of angle steels with different specifications to the bearing capacity of the steel liner, two series of parametric studies are conducted in this study, with the detailed settings as follows.
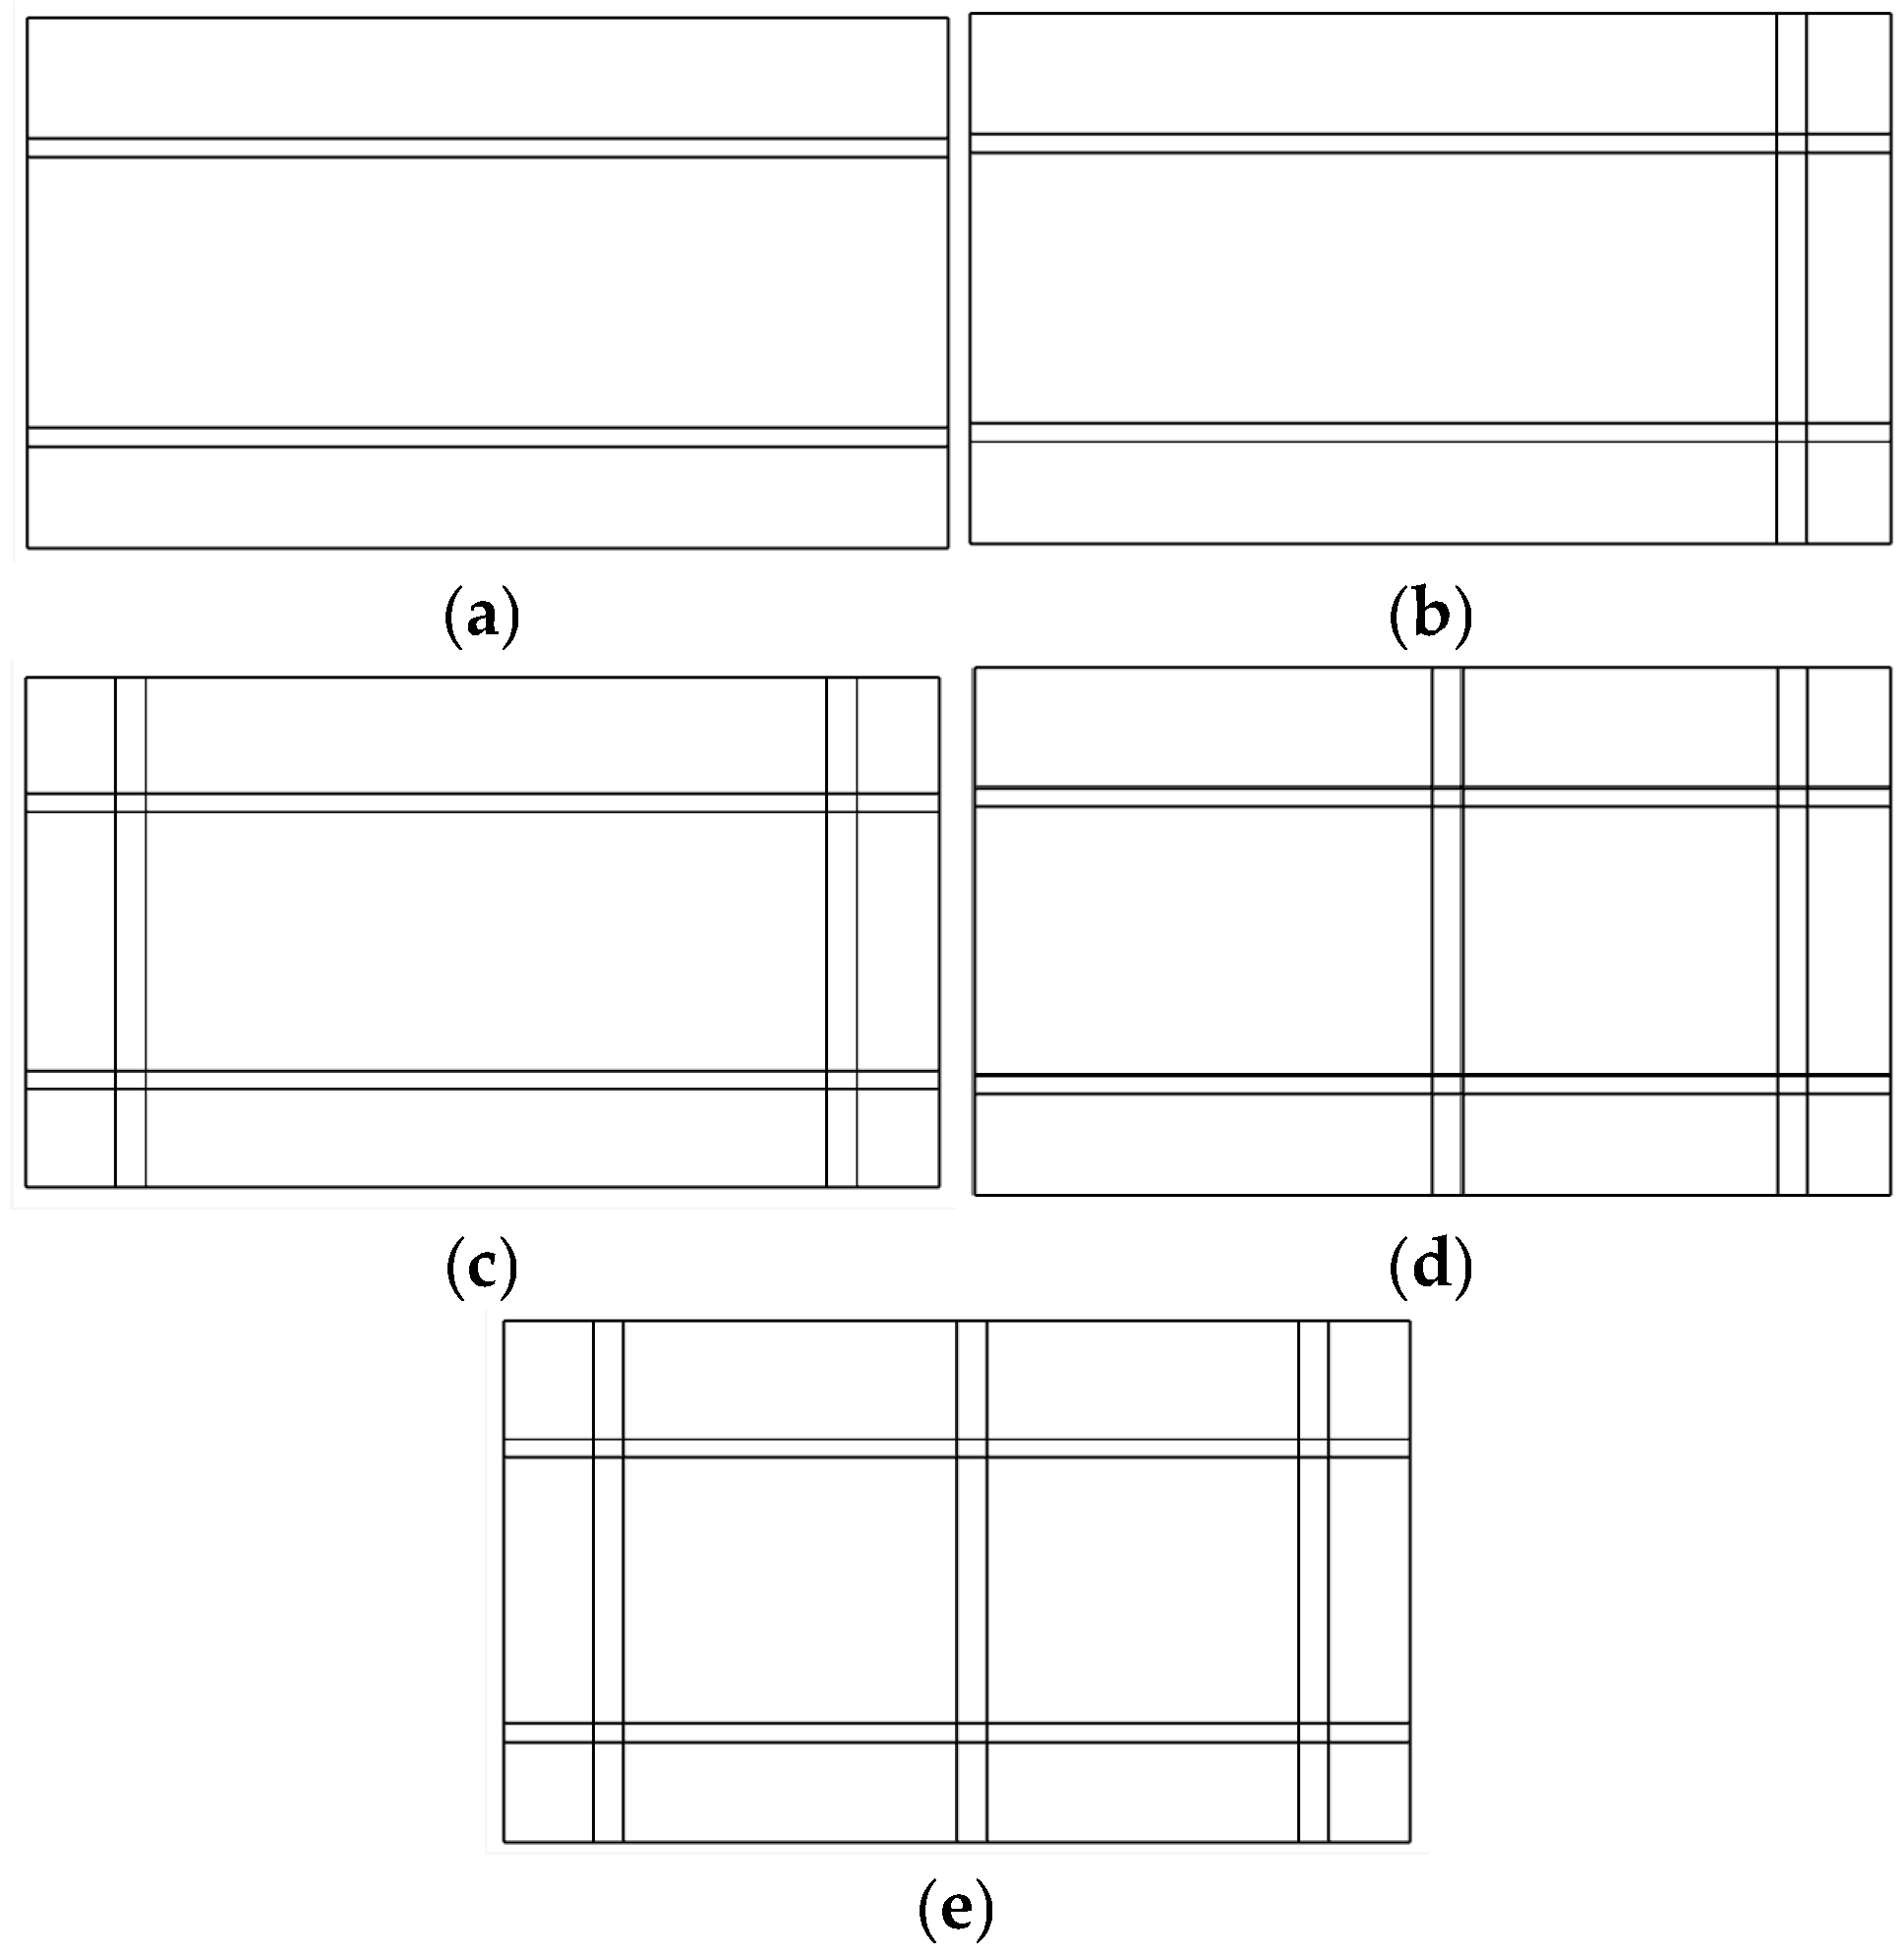
The first series of cases is designed to investigate the contribution of long angle steels to the mechanical properties of the steel liner anchorage system. Taking the configuration with two short-angle steels as the reference baseline, four analytical models are developed with the number of long-angle steels set to 0, 1, 2 and 3, respectively. The detailed configurations of all models and cases are shown in Figure 3. The models are named as SLA-as-l0, SLA-as-l1, SLA-as-l2, and SLA-as-l3, respectively.
The second series of cases is designed to investigate the contribution of short-angle steels to the mechanical properties of the steel liner anchorage system. Taking the configuration with two long-angle steels as the reference baseline, five analytical models are developed, with the number of short-angle steels set to 0, 1, 2 (standard spacing), 2 (halved spacing) and 3. The detailed configurations of all models and cases are shown in Figure 4. The models are named as SLA-as-s0, SLA-as-s1, SLA-as-s2, SLA-as-s2-half, and SLA-as-s3, respectively.
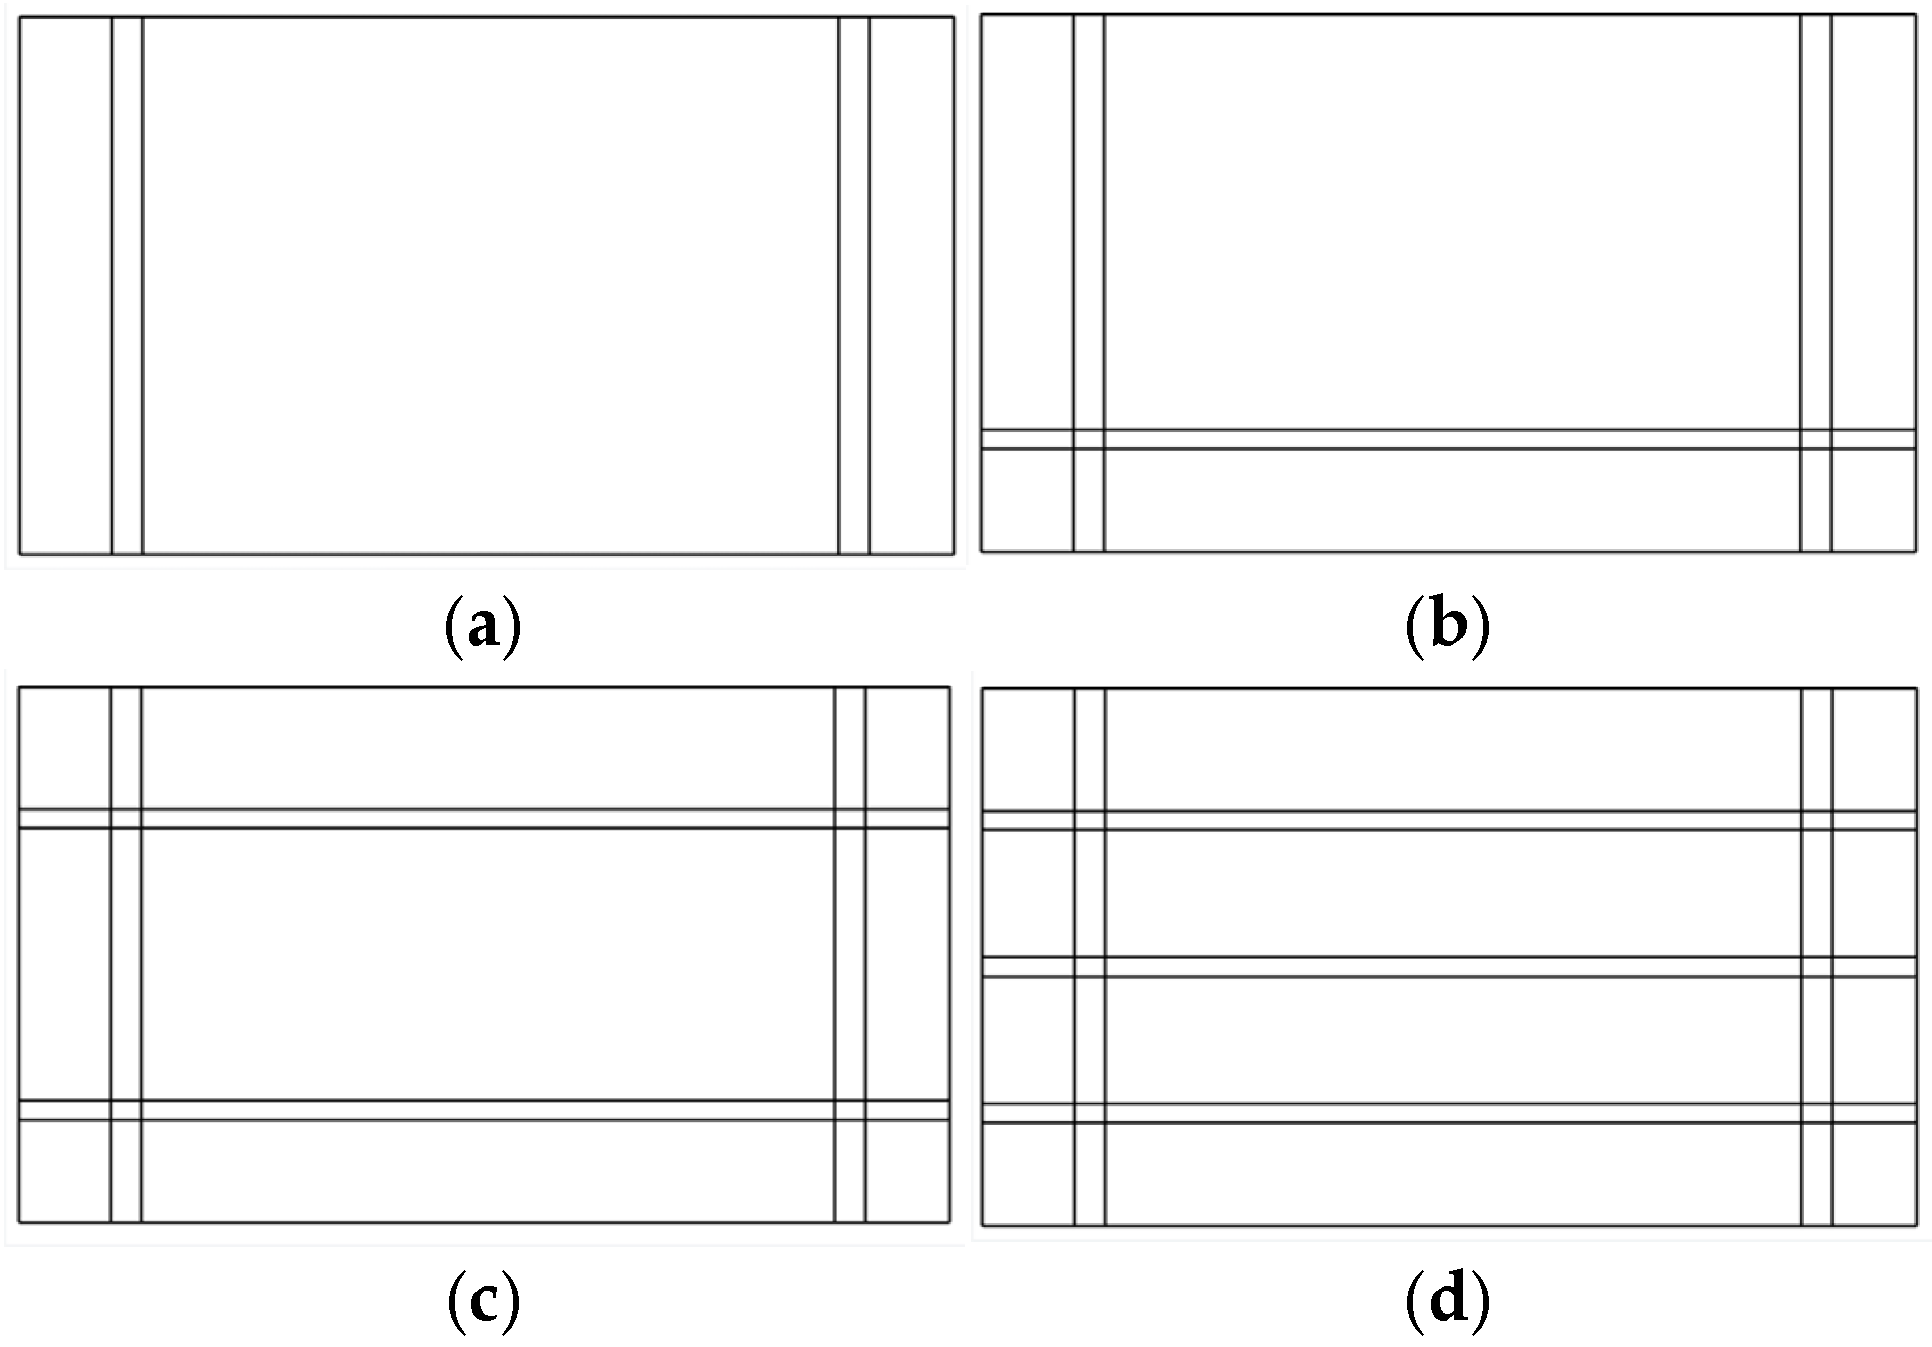
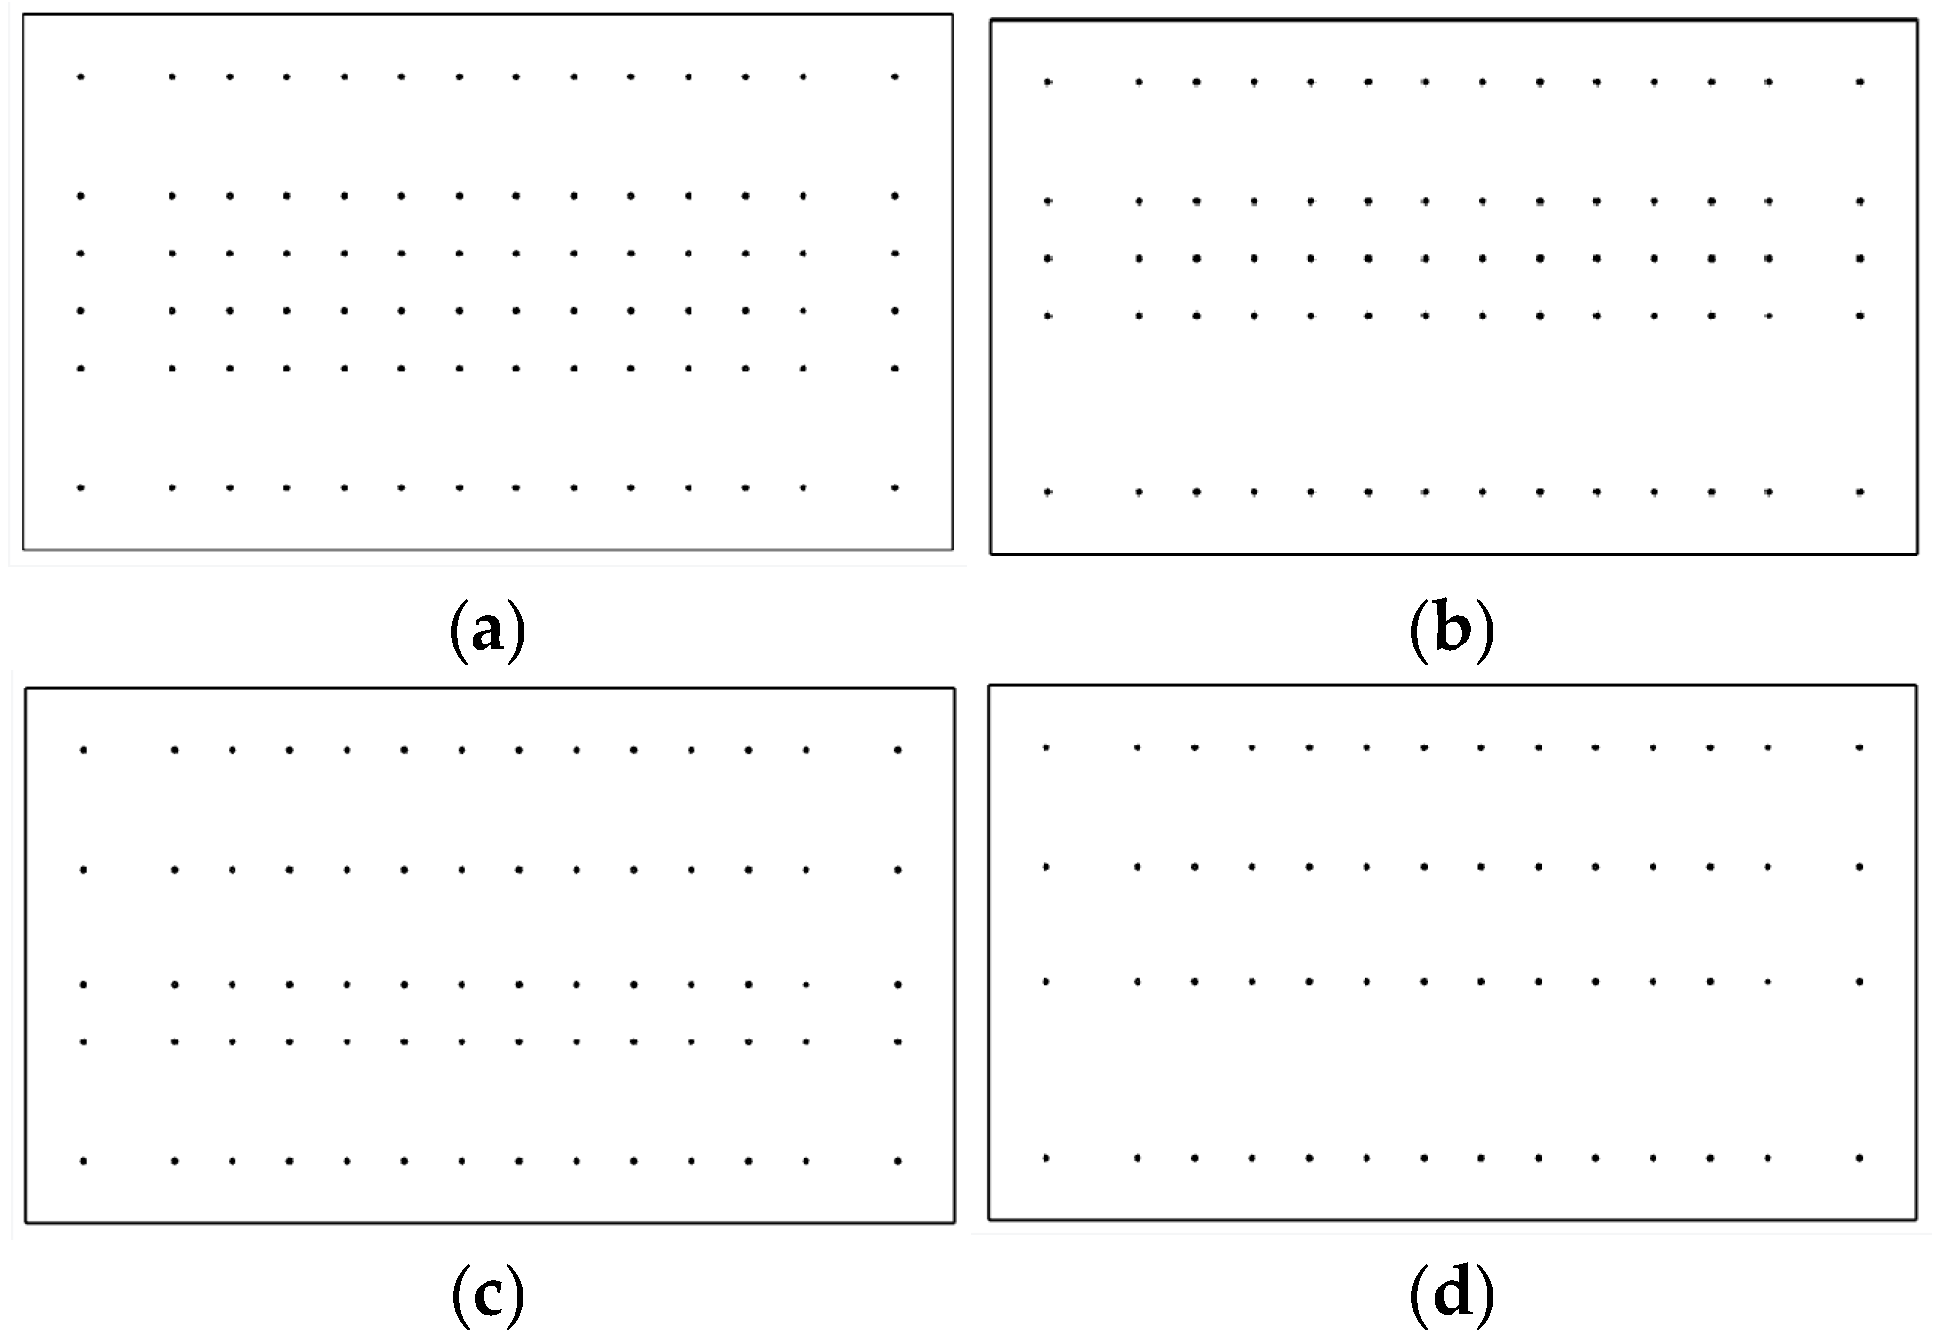
According to the standard configuration of the containment steel liner, the anchorage studs within a single core bay are arranged in four rows with a uniform spacing of 150 mm. To quantitatively characterize the contribution of different stud row counts to the bearing capacity of the steel liner, four parametric analysis cases with different stud row configurations are set up in this study as follow: four rows of studs (reference baseline, no studs removed); three rows of studs (one row of studs adjacent to the tension end is removed); three rows of studs (one row of studs in the middle area is removed); two rows of studs (both one row of studs adjacent to the tension end and one row of studs in the middle area are removed). The model is shown in Figure 5. The models are named as SLA-s-4, SLA-s-3, SLA-s-3-mid, and SLA-s-2, respectively.
To clarify the nomenclature rules, structural configuration of the steel liner anchorage system and core design parameters of each case, and to standardize the case nomenclature system and improve paper readability, the key details of all cases are summarized in Table 1.

2.2. Numerical Model Setup

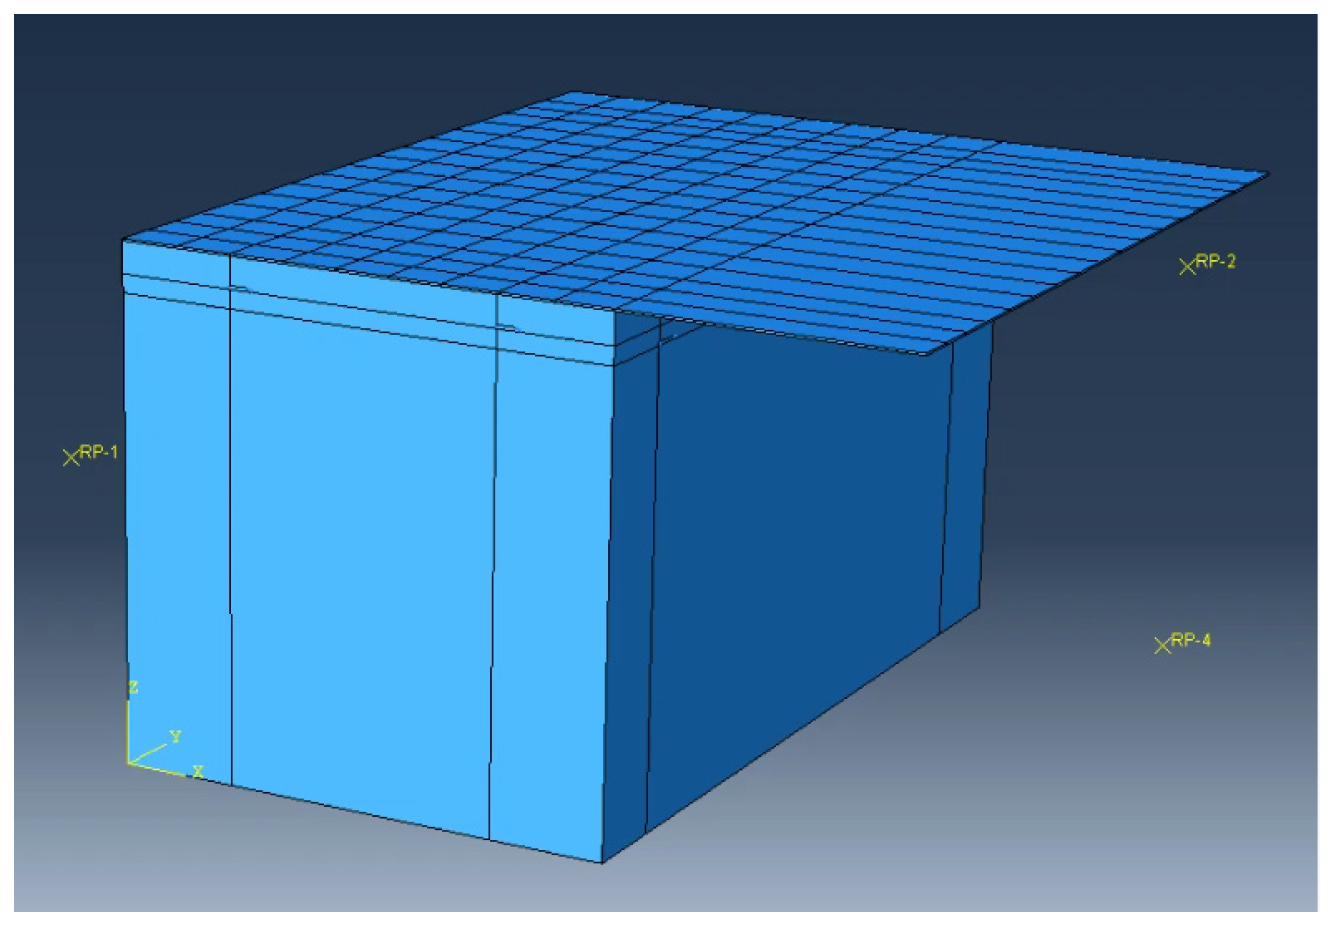
All numerical simulations presented in this study were completed based on the finite element software Abaqus (version 2022). And the setup of the numerical model refers to the actual conditions of the pull-out tests completed by our research group. The model measures 1215 mm in length and 700 mm in width, with a 3 mm thick steel plate. The circumferential (short) L-shaped angle steels have a cross-sectional dimension of 62.5 × 40 × 5 mm, while the longitudinal (long) L-shaped angle steels have a cross-sectional dimension of 37.5 × 25 × 4 mm. The studs are 4 mm in diameter and 40 mm in length, with C60 concrete employed. The steel liner plate extends beyond the tensile end section, serving as the loading region. The model is shown in Figure 6.

2.2.1. Material Properties

The constitutive relationship of concrete was defined by the Concrete Damaged Plasticity (CDP) model. Based on the continuum damage mechanics framework, this model treats concrete as a continuous medium, assumes isotropic damage evolution of the material, and adopts tensile cracking and compressive crushing as the core failure modes of concrete. It can accurately simulate the plastic deformation development and stiffness degradation of concrete under monotonic static load, which is suitable for the interface stress analysis and concrete damage failure analysis of the steel liner anchorage system in this study.
The core stiffness degradation behavior of the model is based on the isotropic damage assumption, and the effective elastic modulus of concrete after damage is calculated by Equation (1):
E = ( 1 d ) E 0
where E 0 is the initial undamaged elastic modulus of concrete taken as 36,000 MPa, and d is the damage factor of concrete, including tensile damage factor d t and compressive damage factor d c . Both damage factors fall within the value range of [0, 1], where d = 0 corresponds to the undamaged state of the material, and d = 1 indicates the complete failure of the material.
All input parameters of the CDP model are summarized in Table 2. The plastic parameters adopt the recognized classic values in the field of concrete numerical simulation. A sufficiently small value is adopted for the viscoplastic regularization parameter solely to improve numerical convergence, ensuring that it has no impact on the static calculation results. The full uniaxial tensile and compressive stress–strain curves of concrete are calculated according to the constitutive equations given in Design Code for Concrete Structures (GB/T50010-2010 [15]). Both tensile and compressive damage factors are calibrated by the widely recognized energy equivalence method, and the damage evolution curves are input into the model in one-to-one correspondence with constitutive curves to ensure the reproducibility of the calculation results.
The steel liner plate, angle steel anchorage components and studs were simulated with a bilinear isotropic hardening elastoplastic constitutive model based on the Von Mises yield criterion. The key properties of the steel are set as follows: Young’s modulus is 206,000 MPa, Poisson’s ratio is 0.3, initial yield strength is 320 MPa and the ultimate tensile strength is 360 MPa.

2.2.2. Mesh Definitions

The mesh elements settings for the numerical model are detailed below. The angle steels were discretized with 4-node quadrilateral reduced-integration shell elements (S4R). The studs were discretized with 2-node 3D beam elements (B31). The concrete was discretized with 8-node hexahedral elements (C3D8R).
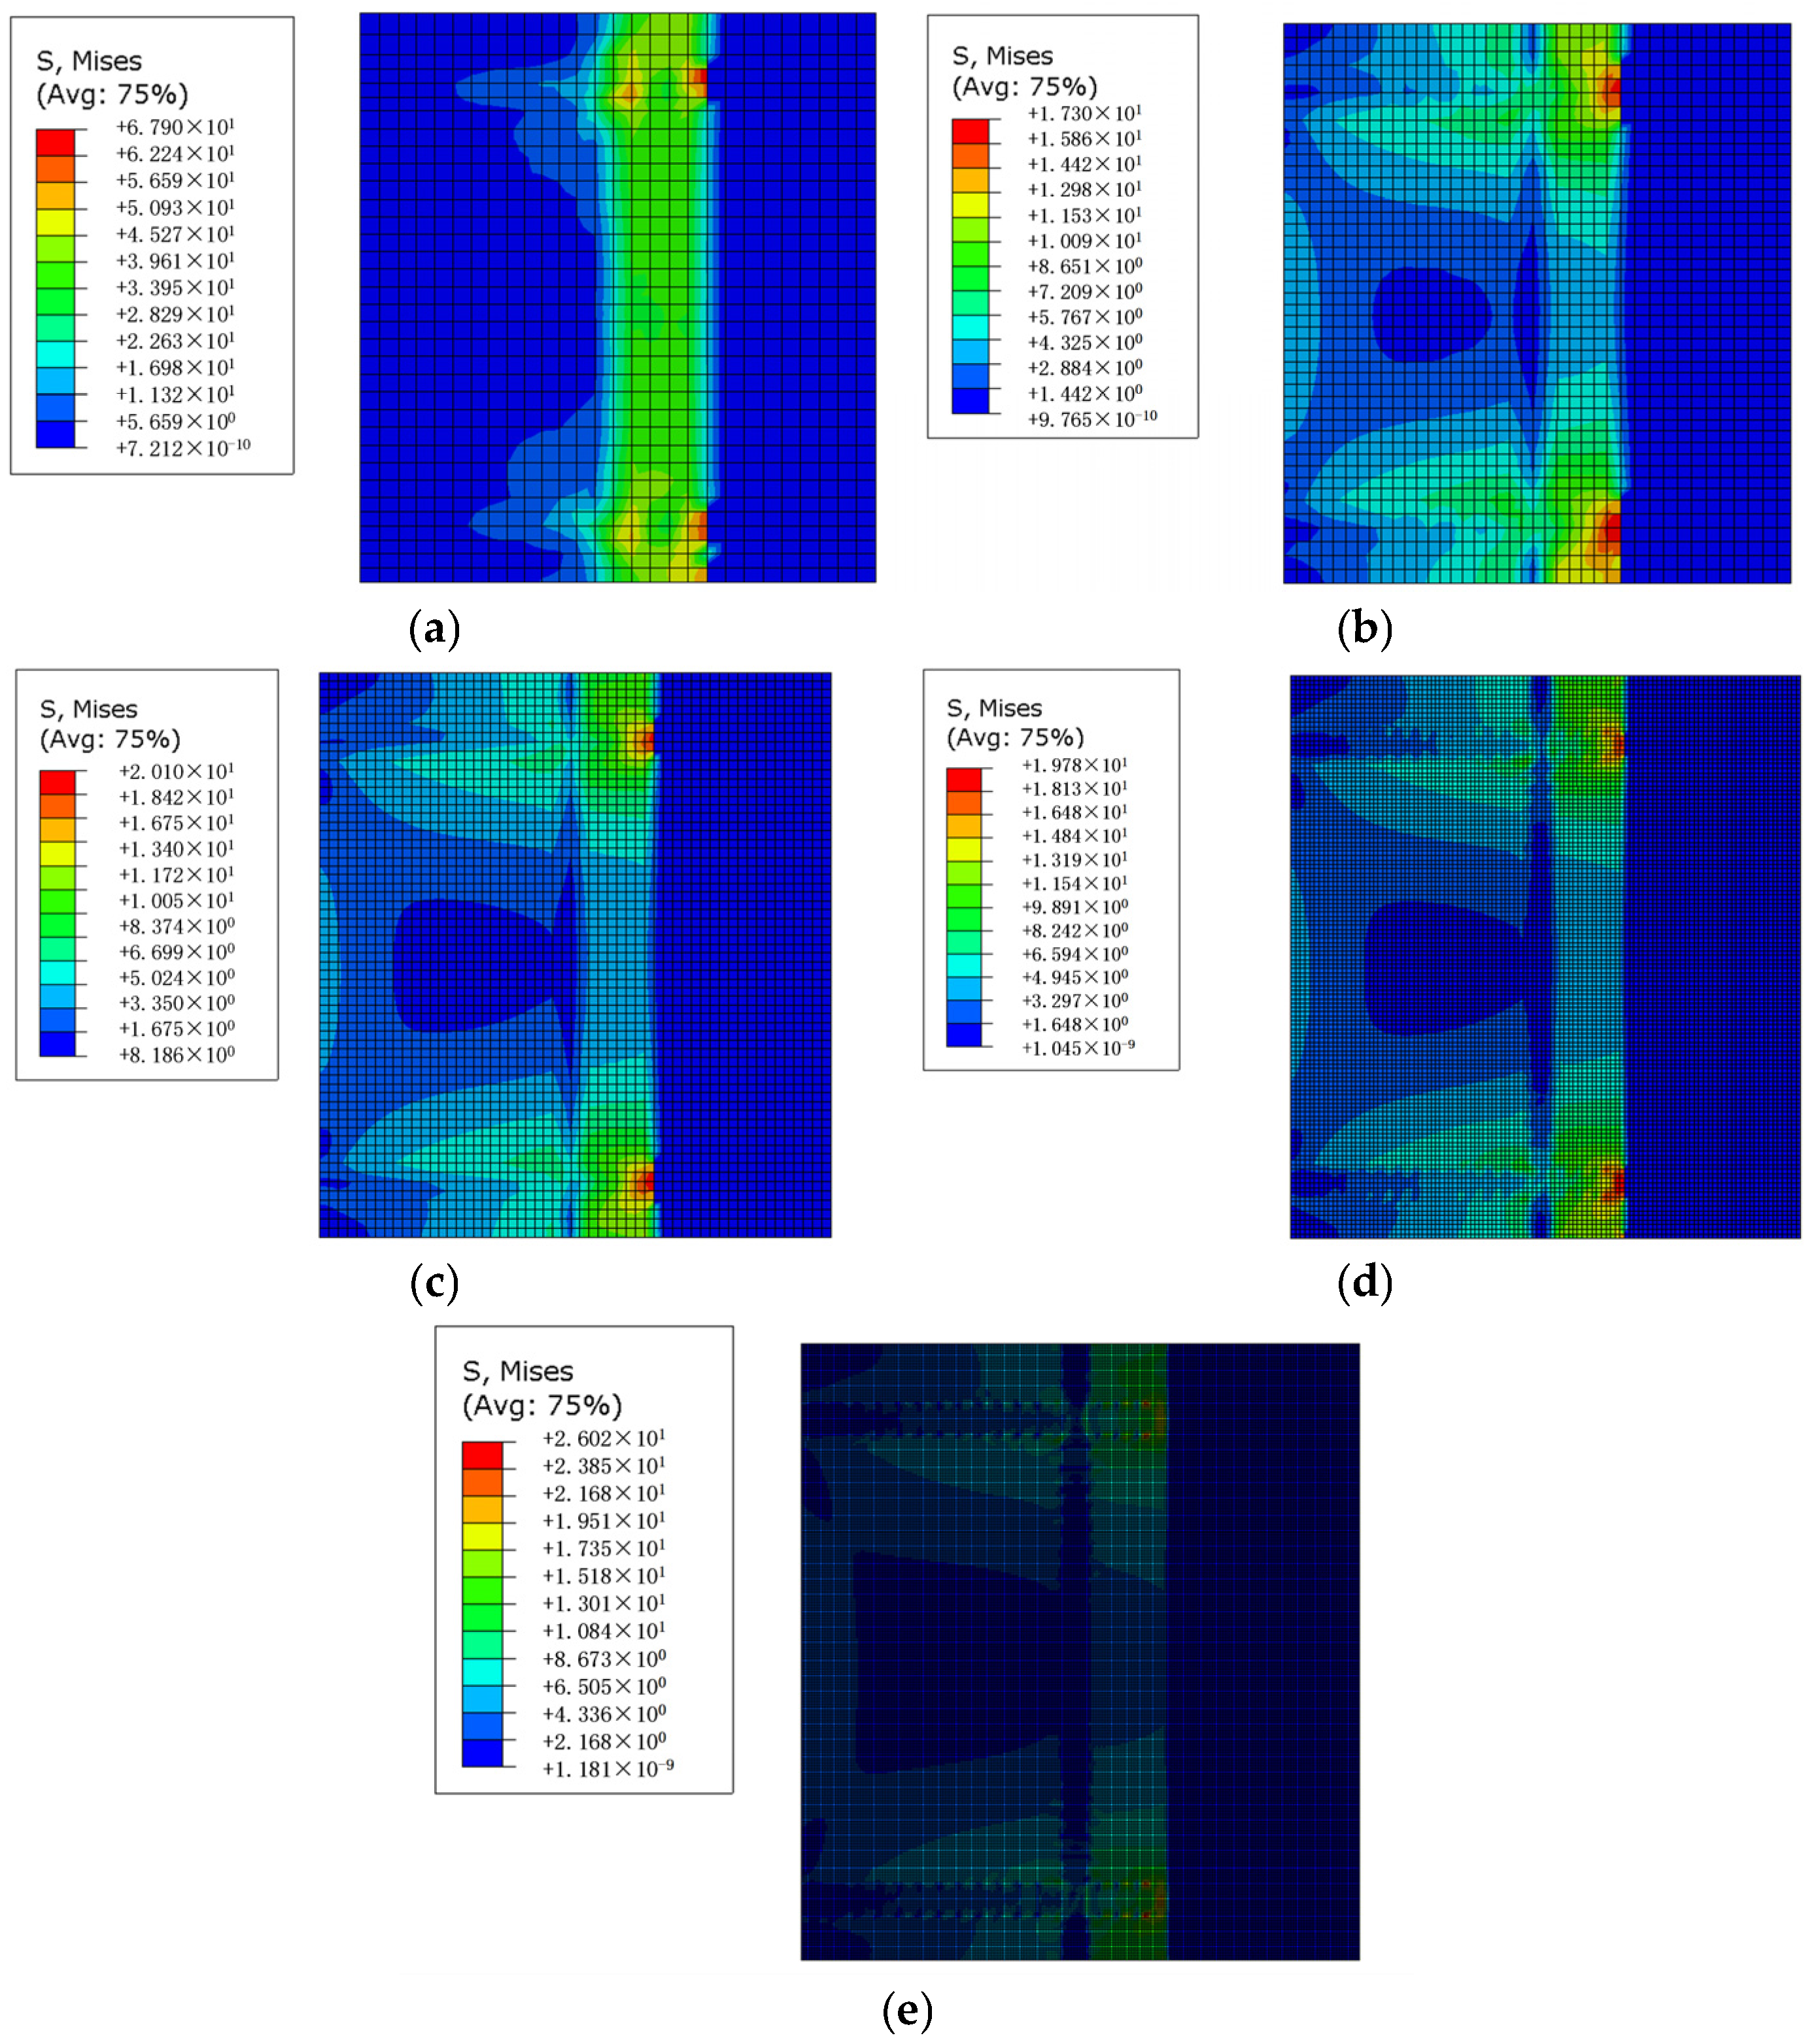
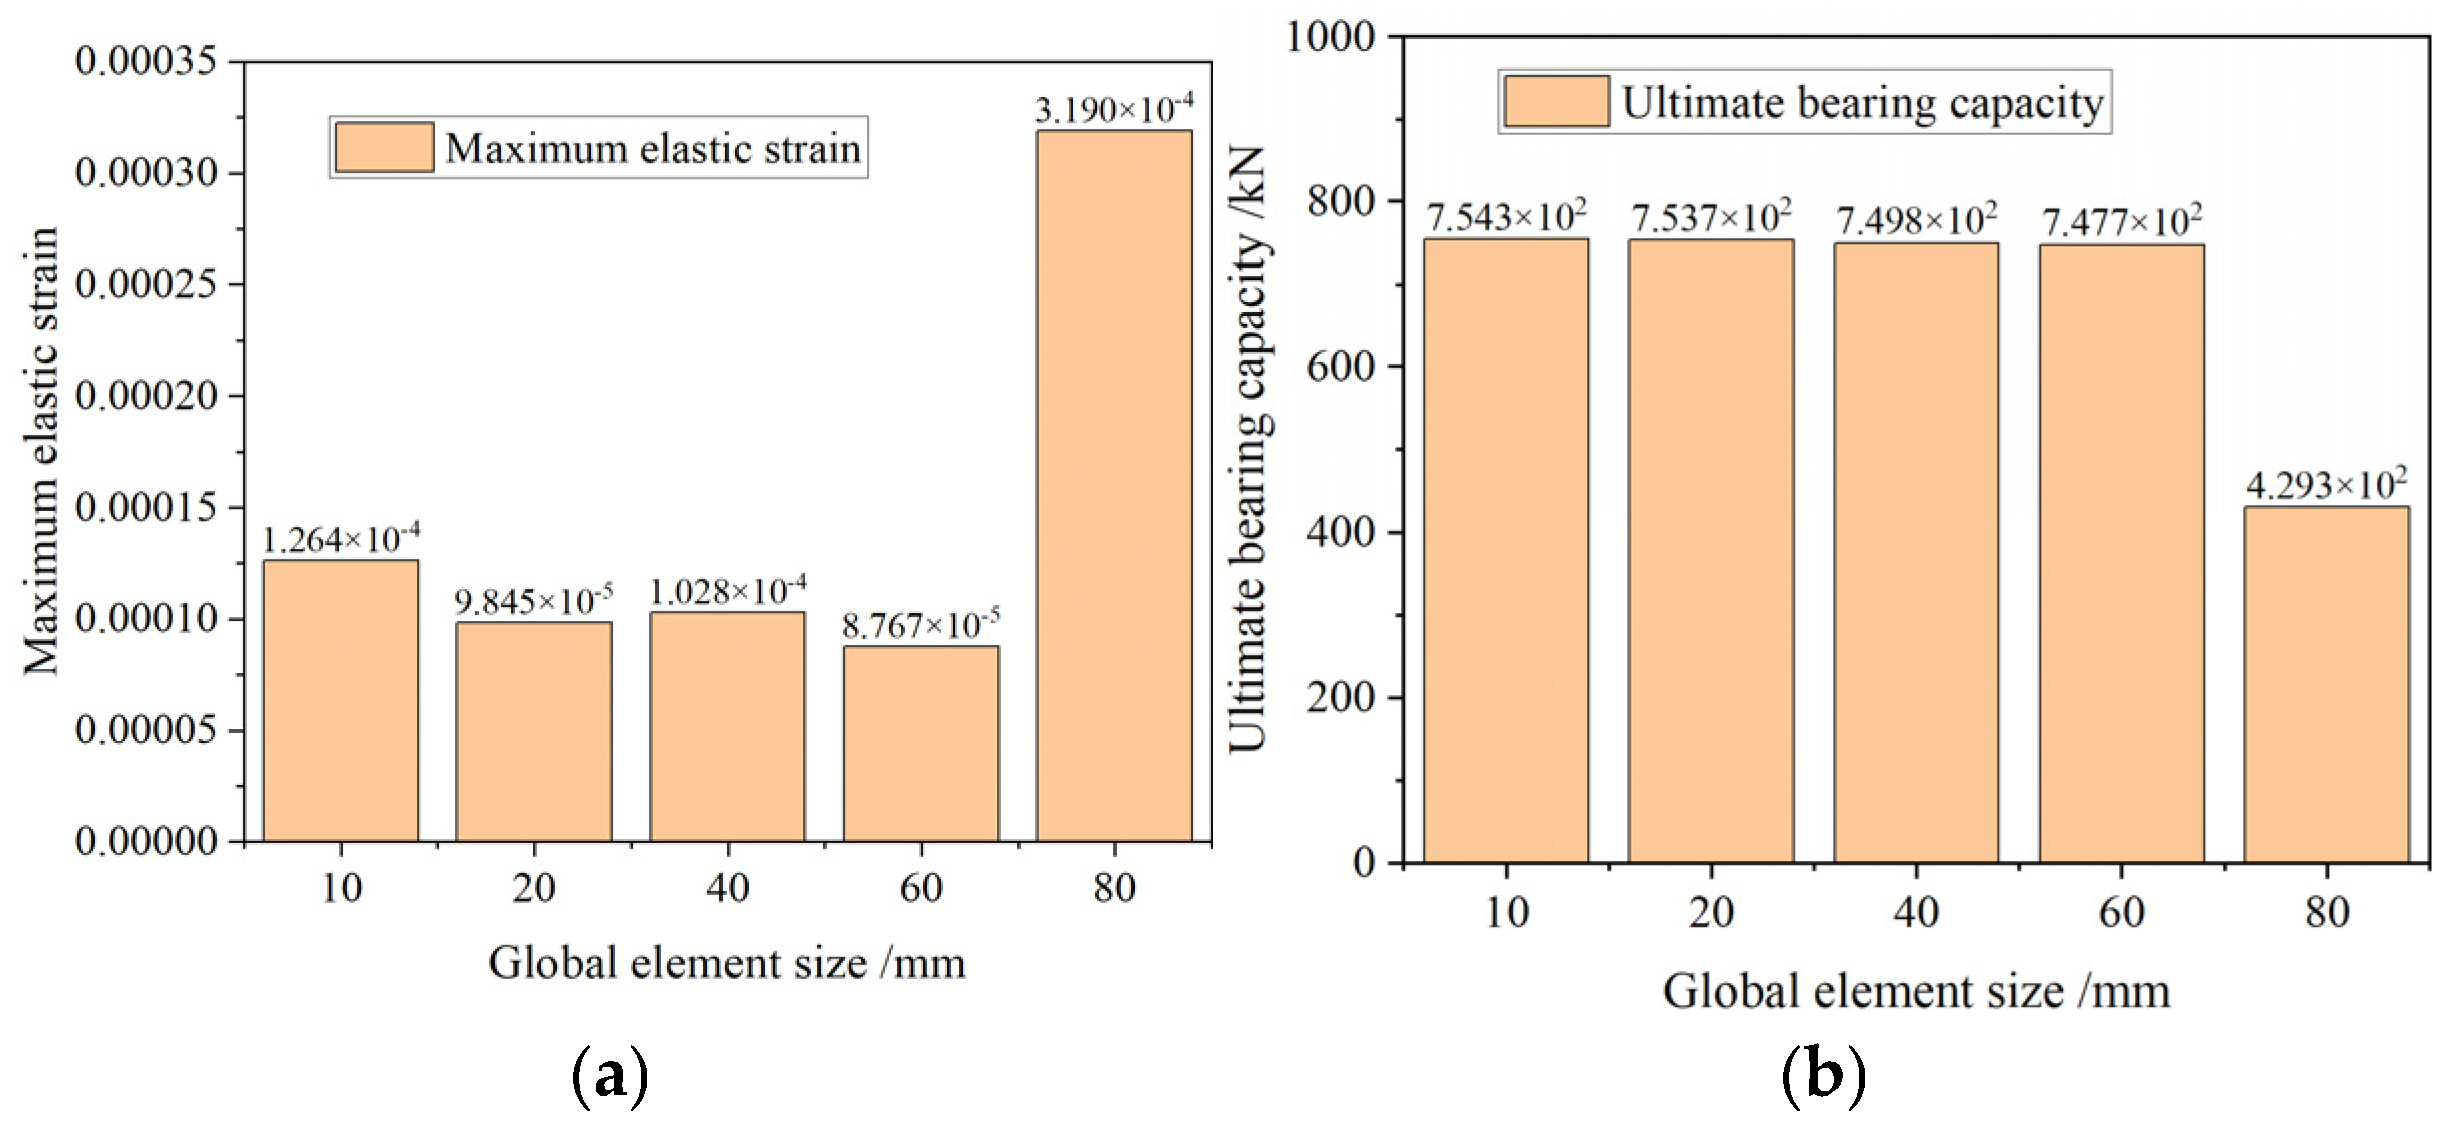
To ensure the convergence and reliability of numerical results while balancing computational accuracy and efficiency, a mesh convergence study was carried out. Five cases with global element sizes of 10 mm, 20 mm, 40 mm, 60 mm and 80 mm were established. And the calculation results were compared and analyzed with steel liner plate stress distribution, maximum elastic strain and ultimate bearing capacity as evaluation indicators, as shown in Figure 7 and Figure 8. The mesh convergence analysis results indicated that the 80 mm mesh was too coarse to accurately obtain the ultimate bearing capacity and capture the stress concentration characteristics. Conversely, the 10 mm mesh was too dense, leading to calculation results inconsistent with the actual mechanical behavior of the structure. The calculation results of the 20 mm, 40 mm and 60 mm meshes showed good consistency. Comprehensively considering accuracy and efficiency, 40 mm was selected as the global reference element size in this study.

2.2.3. Contact Settings

Surface-to-surface contact was adopted between the concrete and the steel liner plate, considering only normal contact and neglecting tangential friction. This simplification is justified by the following three considerations: (1) The steel liner plate has a smooth surface, resulting in weak natural interfacial bonding between concrete and the steel liner plate, as well as limited tangential shear bearing capacity. (2) In the numerical model, the steel liner plate is placed on the top surface of concrete, and the normal interfacial pressure generated by the self-weight of the steel liner plate is small. The tangential frictional resistance has a negligible effect on the overall anchorage performance of the anchorage system. (3) The core objective of this study is to systematically analyze the influence characteristics of long angle steels, short angle steels and studs on the anchorage performance of the steel liner plate–concrete interface. Introducing interfacial tangential friction would add additional force transmission paths and interference variables to different cases, violating the single-variable control principle. This would make it impossible to clearly separate, quantify and compare the individual contributions and synergistic effects of various anchorage components, hindering the accurate derivation of core research conclusions. Accordingly, a contact relationship without tangential friction was adopted for the interface between the steel liner plate and concrete in this study.
Tied contact was applied between the angle steel and the steel liner plate. Nonlinear two-node spring elements were assigned to the connection between the stud and the steel liner plate. All springs were set along the length direction of the studs. The tensile and compressive parameters of the nonlinear springs are shown in Table 3.
The anchorage interface between the angle steel and the concrete was simulated using point-to-point Translator-type connector elements. Each connector was established between a mesh node on the anchorage section of the angle steel and the nearest corresponding concrete mesh node, forming a point-to-point coupling relationship. Differentiated connector properties were set for the long- and short-angle steels, respectively, with the specific parameters detailed in Table 4 and Table 5. The Translator-type connector allows coupled nodes to move only along the anchorage axis. Different connector orientations can accurately simulate the axial pull-out anchorage behavior between angle steel and concrete when the steel liner plate was subjected to tensile forces.

2.2.4. Boundary Conditions and Loading Method

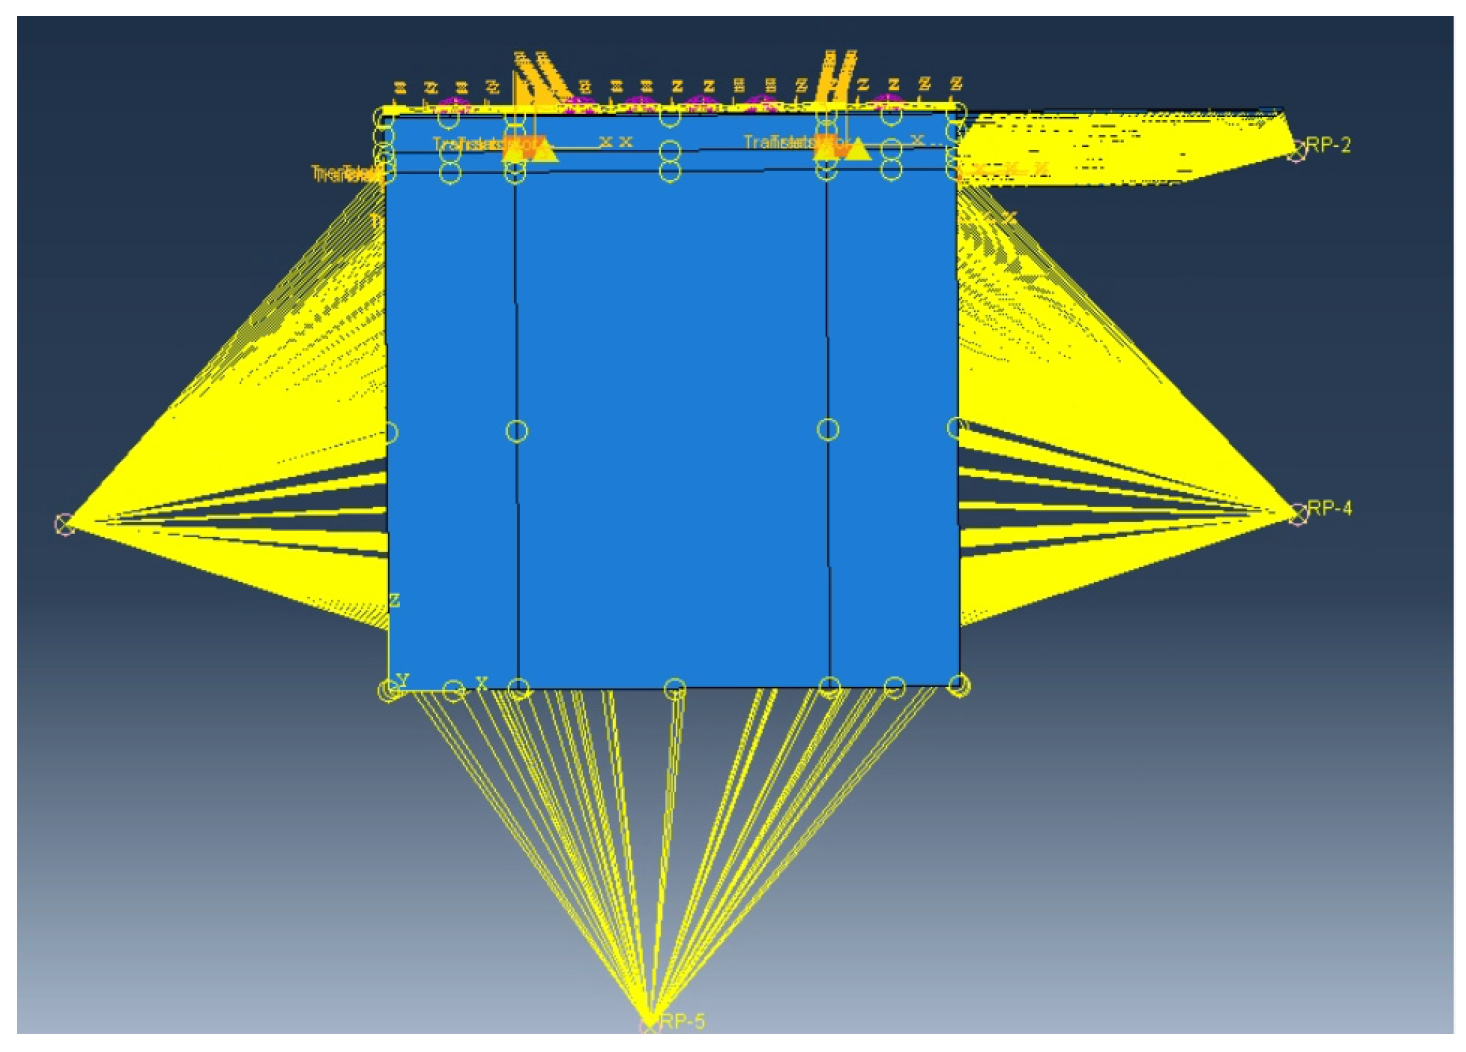
In terms of boundary conditions, full degree-of-freedom constraints were applied to the two end faces (proximal and distal to the loading end), and a z-direction displacement constraint was imposed on the bottom of concrete, as shown in Figure 9. The full constraints on both end faces of the concrete are an equivalent simulation of the continuous panel boundary in the actual containment structure, which can restore the real engineering constraint environment of the anchorage system. The z-direction constraint on the concrete bottom is used to simulate the fixation between the specimen and the test pedestal so as to limit the rigid body motion of the model. This boundary setting can isolate the interference from the overall deformation of the concrete, accurately extract the core mechanical response of the anchorage system, and will not produce adverse effects on the stress distribution of the anchorage interface and the overall stiffness of the system, which fully matches the evaluation objective of this study.
In terms of the loading scheme, the displacement-controlled loading method was adopted. Loading was applied via a uniform displacement along the positive x-axis on the extended steel liner plate, with the maximum displacement amplitude of 10 mm. The displacement-controlled loading was selected for two reasons. First, this approach is consistent with the loading protocol of the pull-out tests, which can faithfully reproduce the test loading process. Second, it can stably control the whole deformation process of the steel liner plate, accurately capture the complete mechanical response of the anchorage system from elastic stage to failure, and facilitate quantitative assessment of the mechanical properties of different anchorage configurations.

3. Results

3.1. Results of SLA-All, SLA-s, SLA-as-s0 and SLA-as-l0

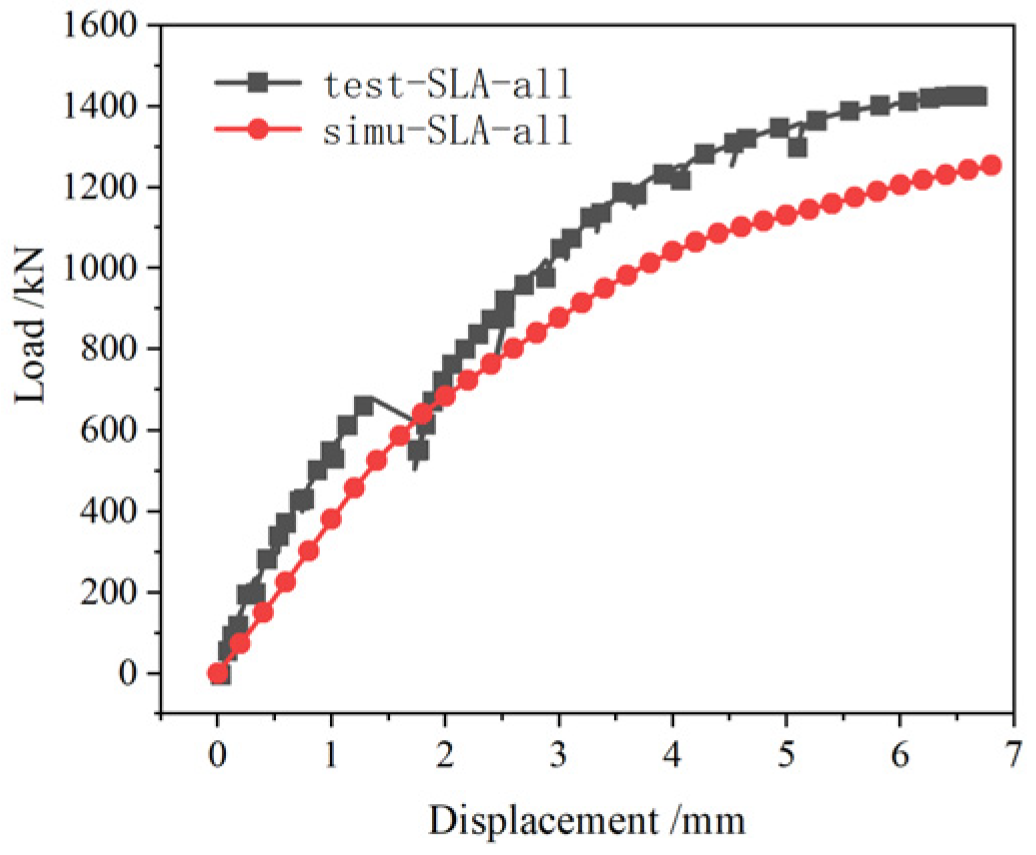
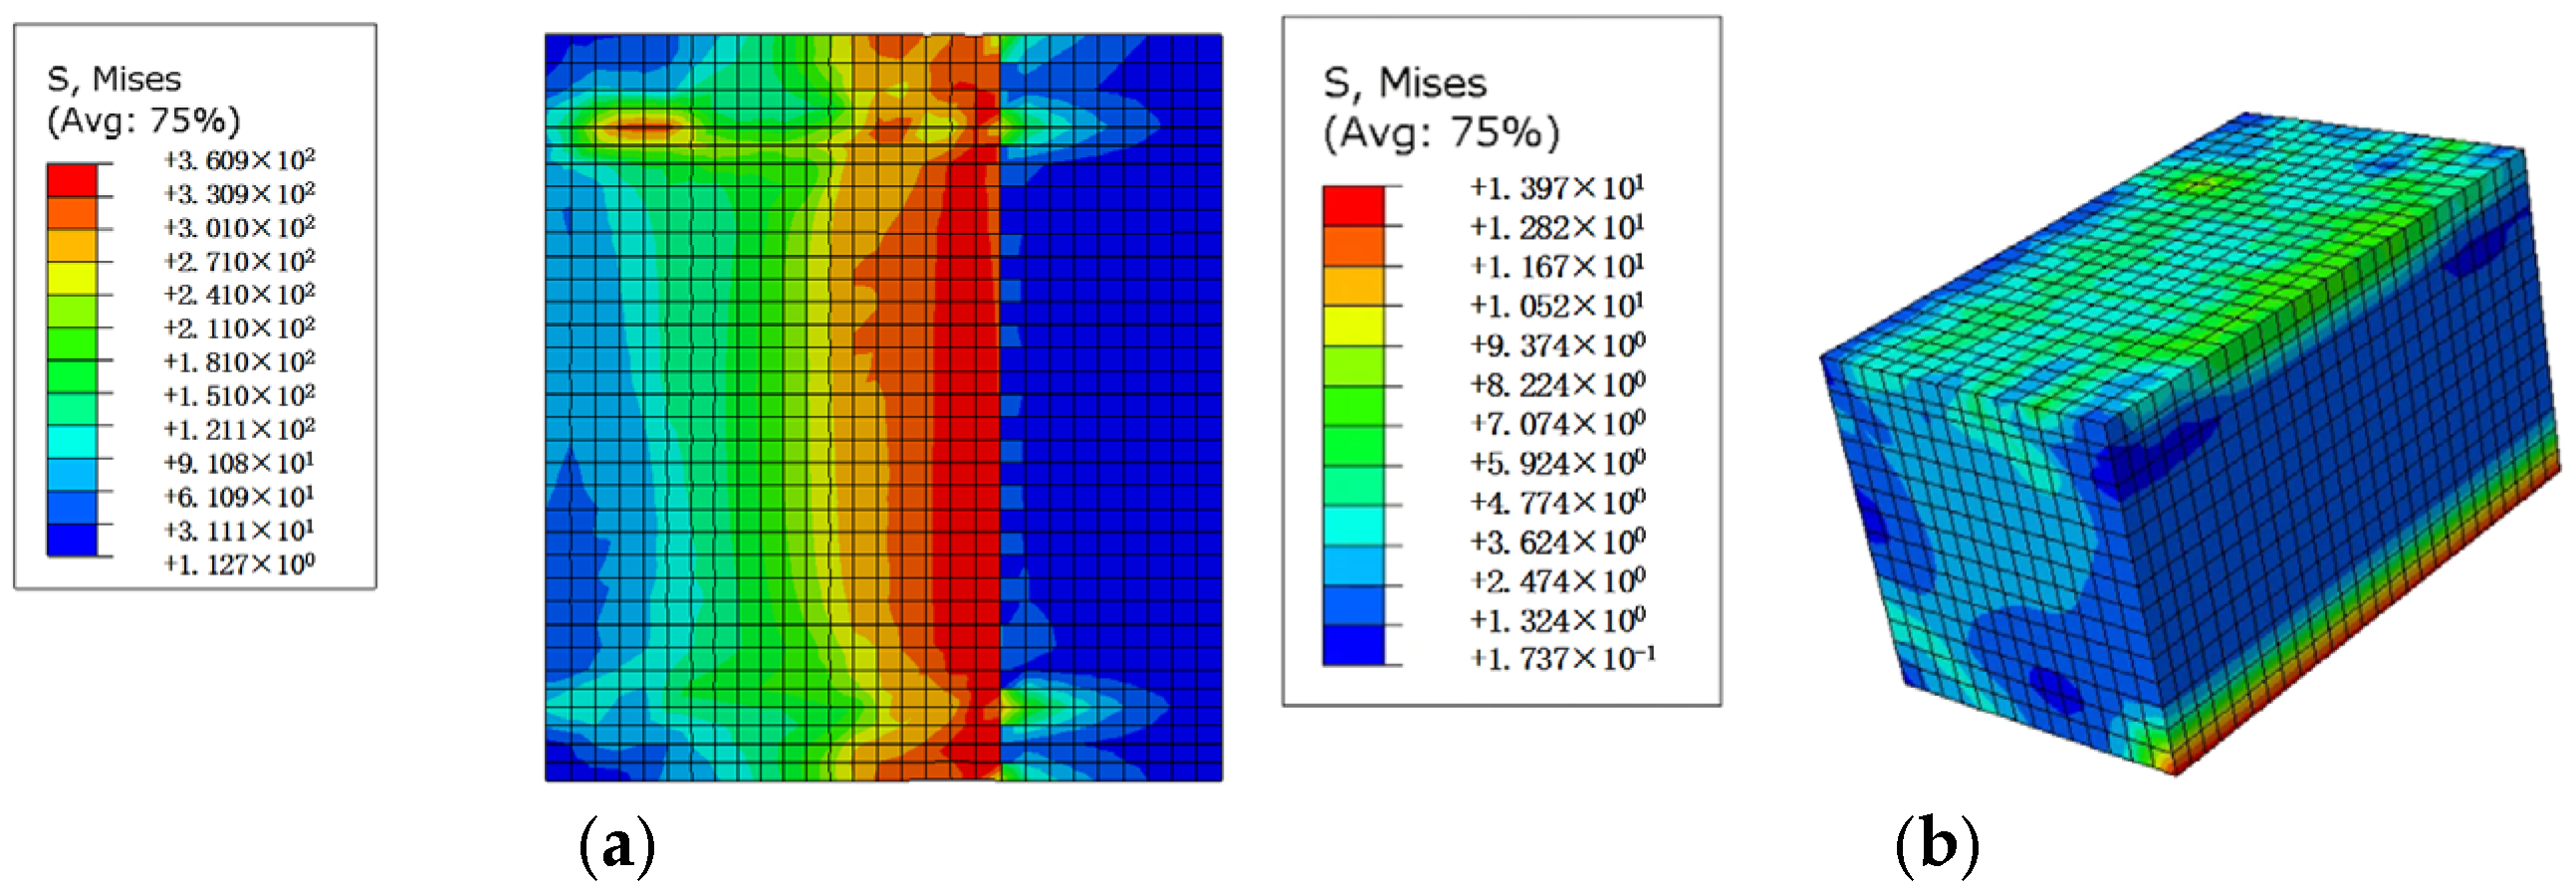
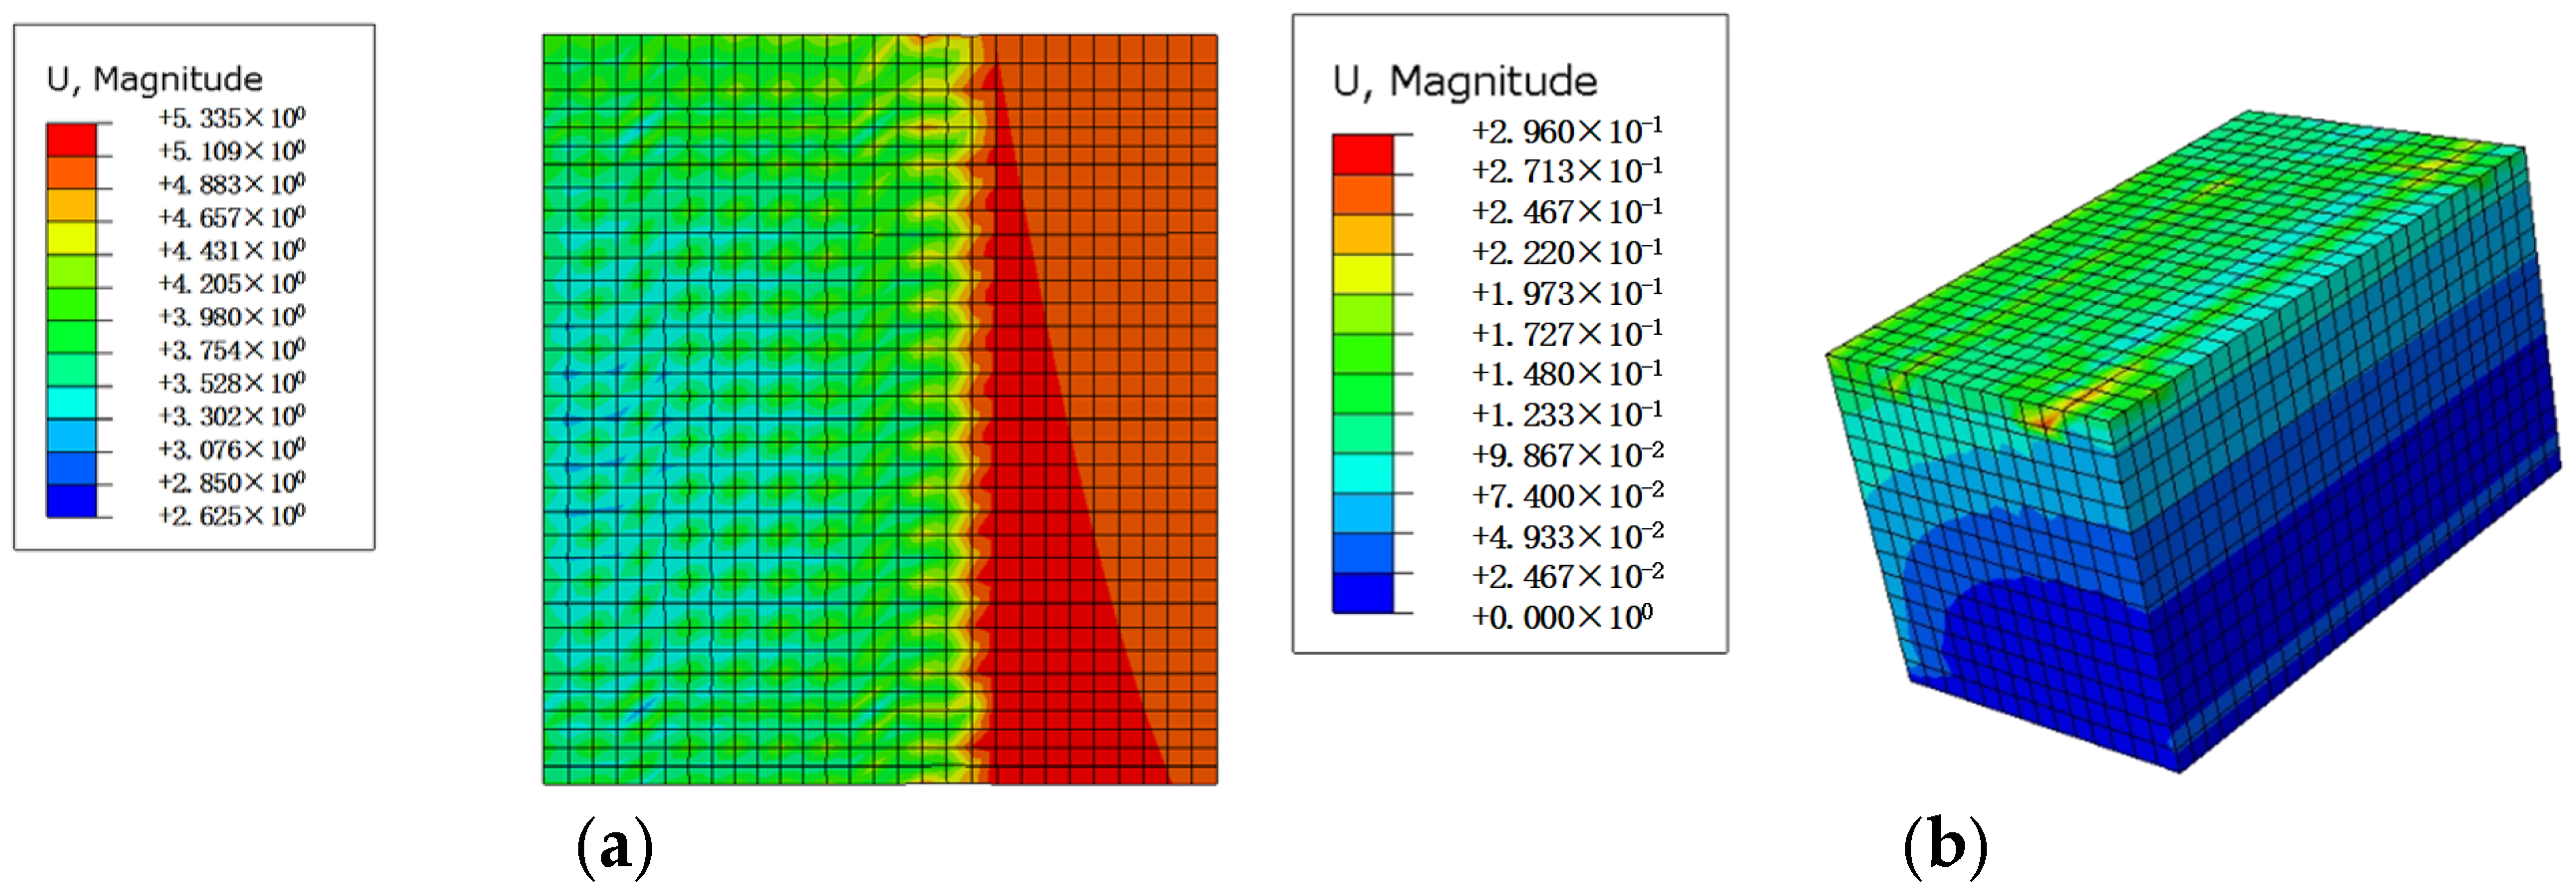
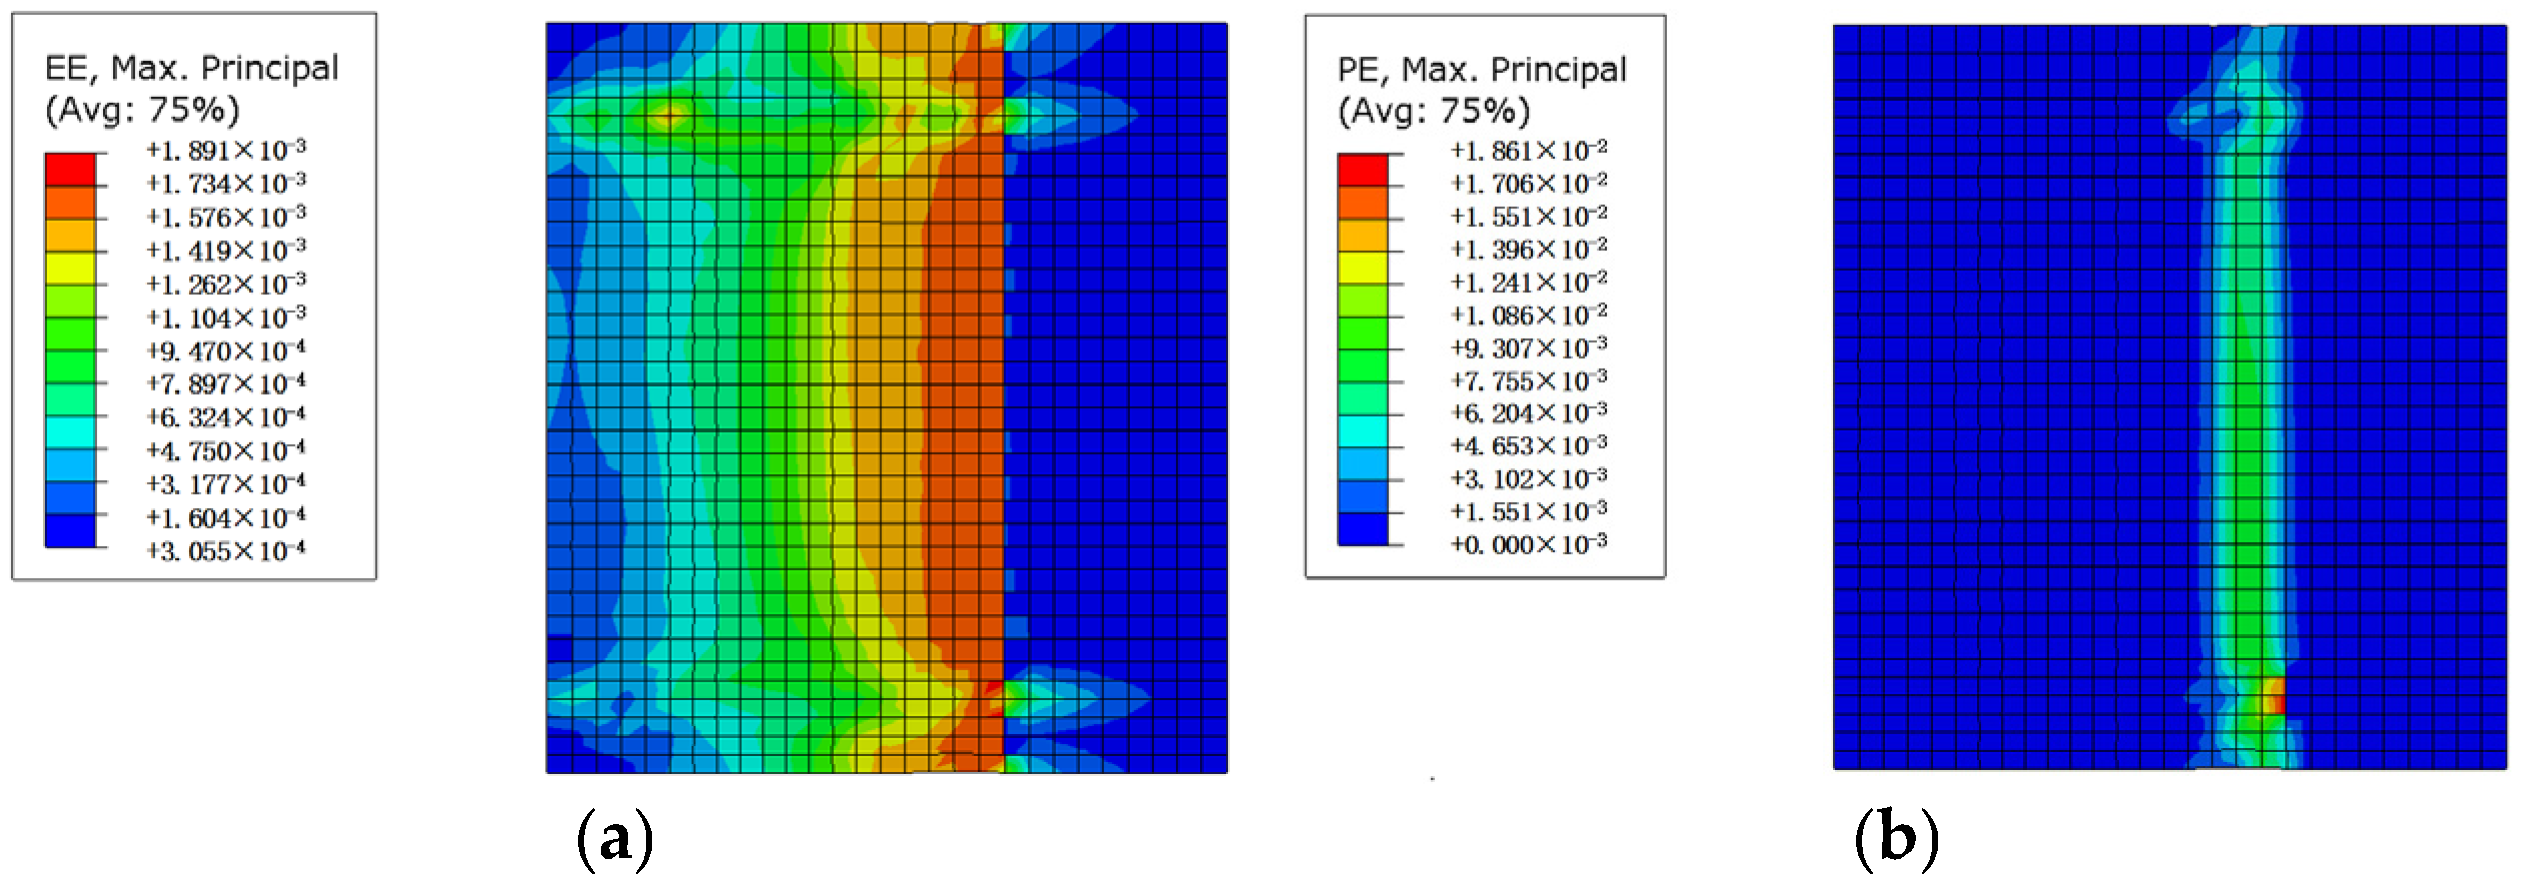
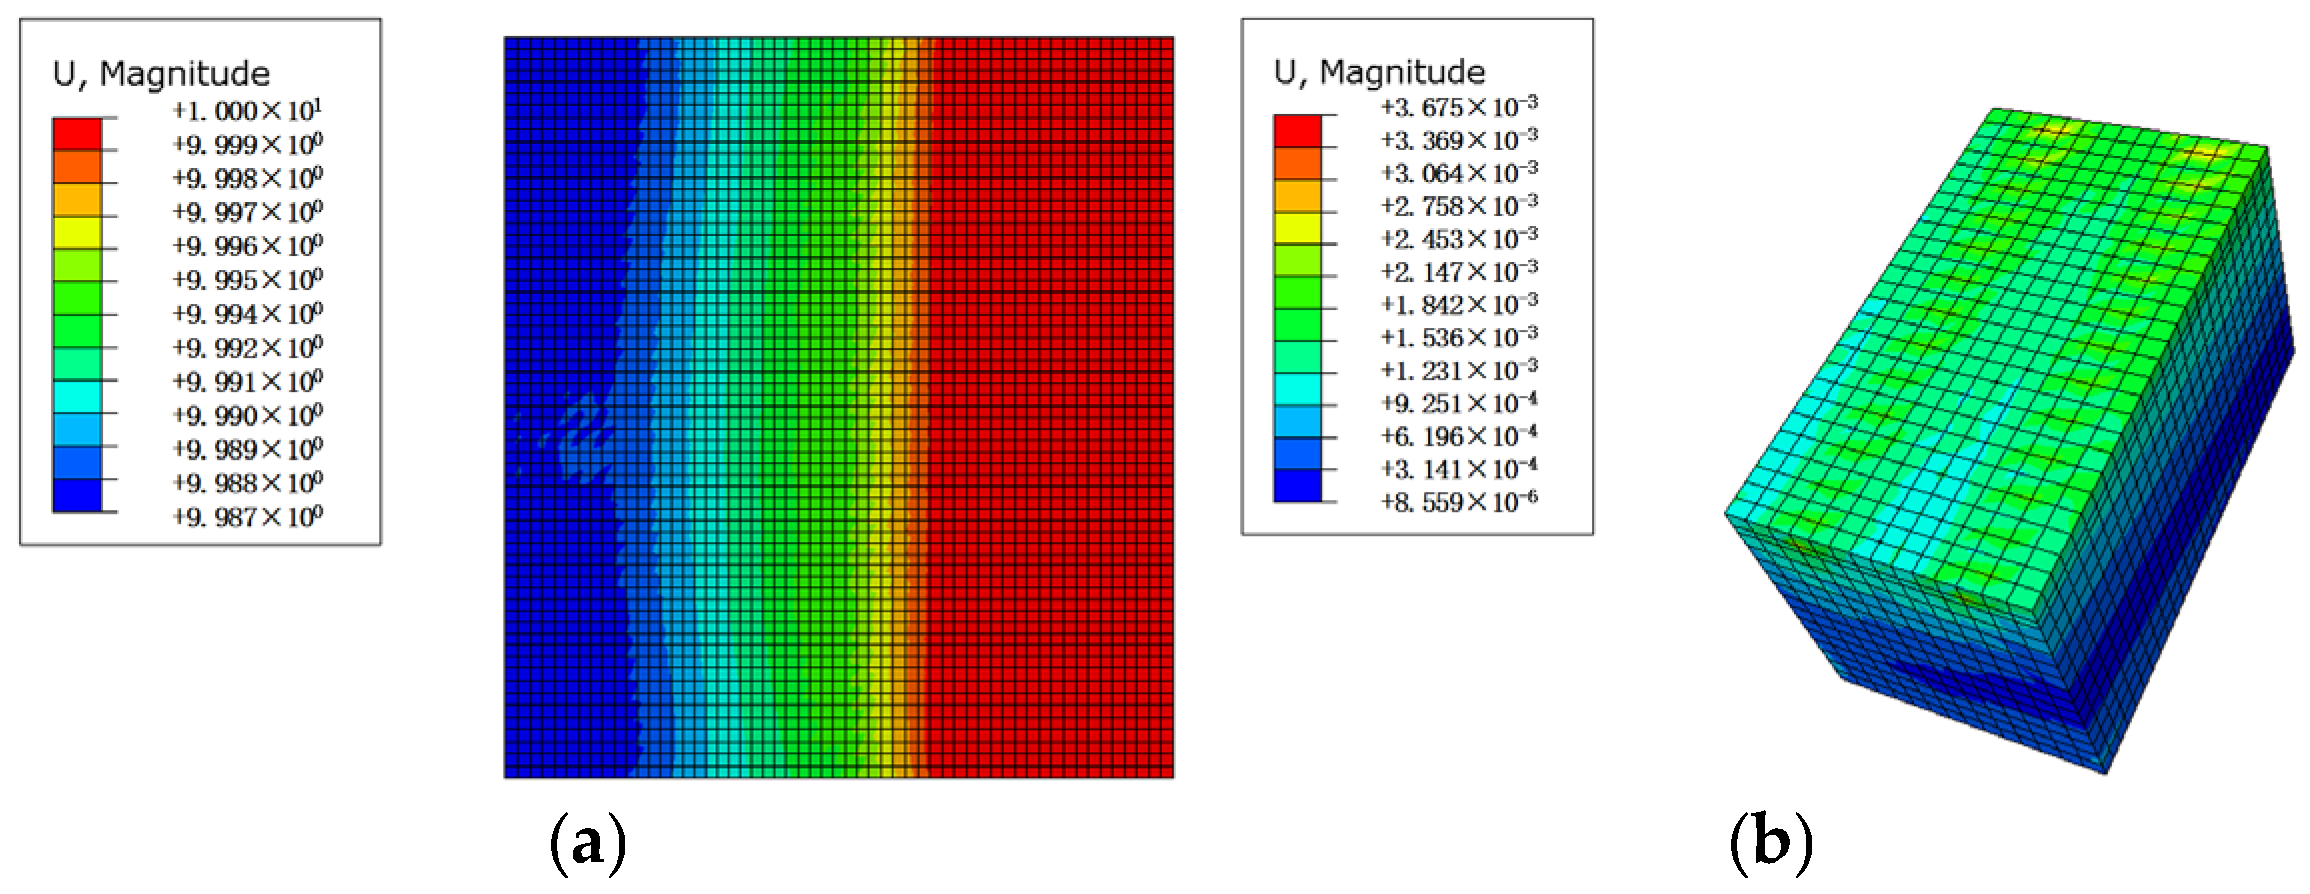
Based on the numerical simulation method described in Section 2, this section presents the load–displacement curves (Figure 10), and the corresponding test results (Figure 11) for the SLA-all case. The simulated stress distribution, the simulated displacement distribution, and the simulated strain of the steel liner plate are shown in Figure 12, Figure 13 and Figure 14. The test load–displacement curve in Figure 10 is presented to verify the accuracy of the numerical simulation results.
It can be clearly observed from Figure 10 that the numerical simulation results and test results for the SLA-all case follow an identical trend. The maximum load predicted by the numerical simulation for the SLA-all case is 1253 kN, whereas the corresponding maximum load measured in the test is 1430 kN. The peak strain is located at the junction of the short angle steel on the tension side and the tension end. The maximum simulated elastic and plastic strains are 0.0019 and 0.0186, respectively.
The numerical failure characteristics are in good agreement with the typical phenomena observed in the corresponding tests (Figure 11). As the applied displacement at the tension end increased, the steel liner plate near the loaded end first reached its ultimate tensile strength of 360 MPa, leading to local tensile failure. Meanwhile, the maximum stress in concrete remained lower than 36 MPa throughout the entire loading process. No interfacial delamination or separation was observed between the steel liner plate and the concrete. Both the numerical and test results demonstrate that failure occurs in the steel liner plate, while the concrete, angle steels and studs remained intact with reliable anchorage performance. Accordingly, the dominant failure mode of the SLA-all case can be identified as tensile fracture of the steel liner plate.
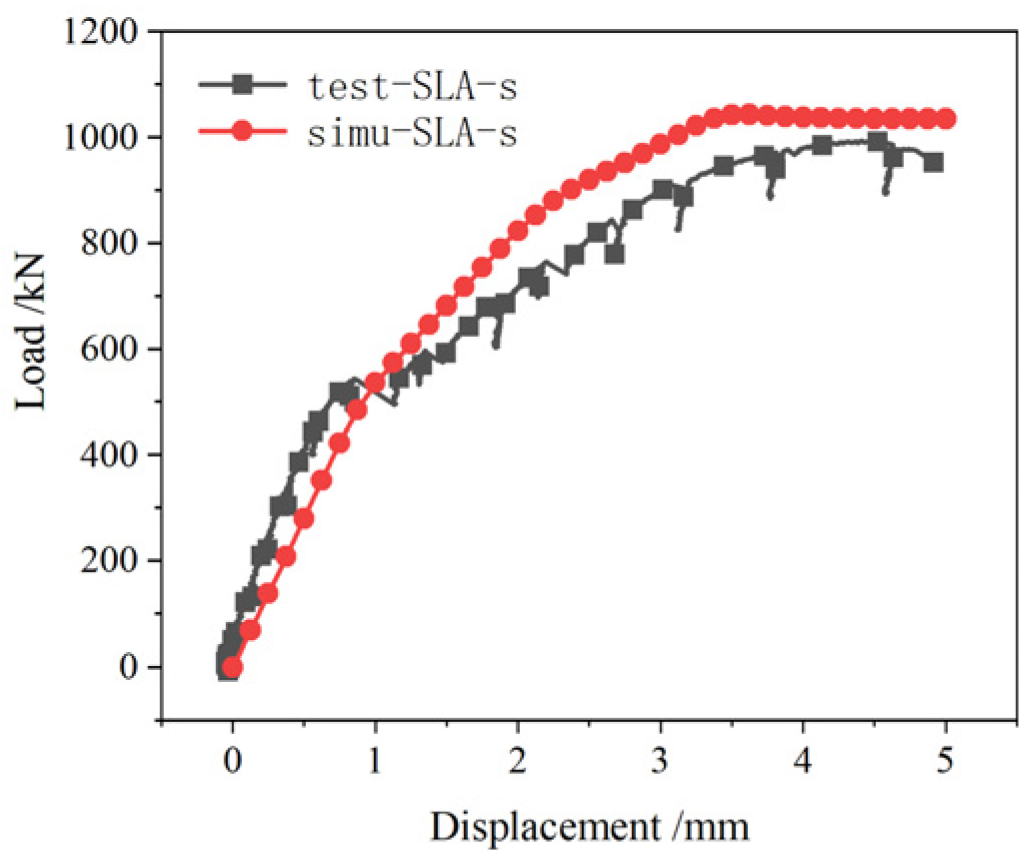
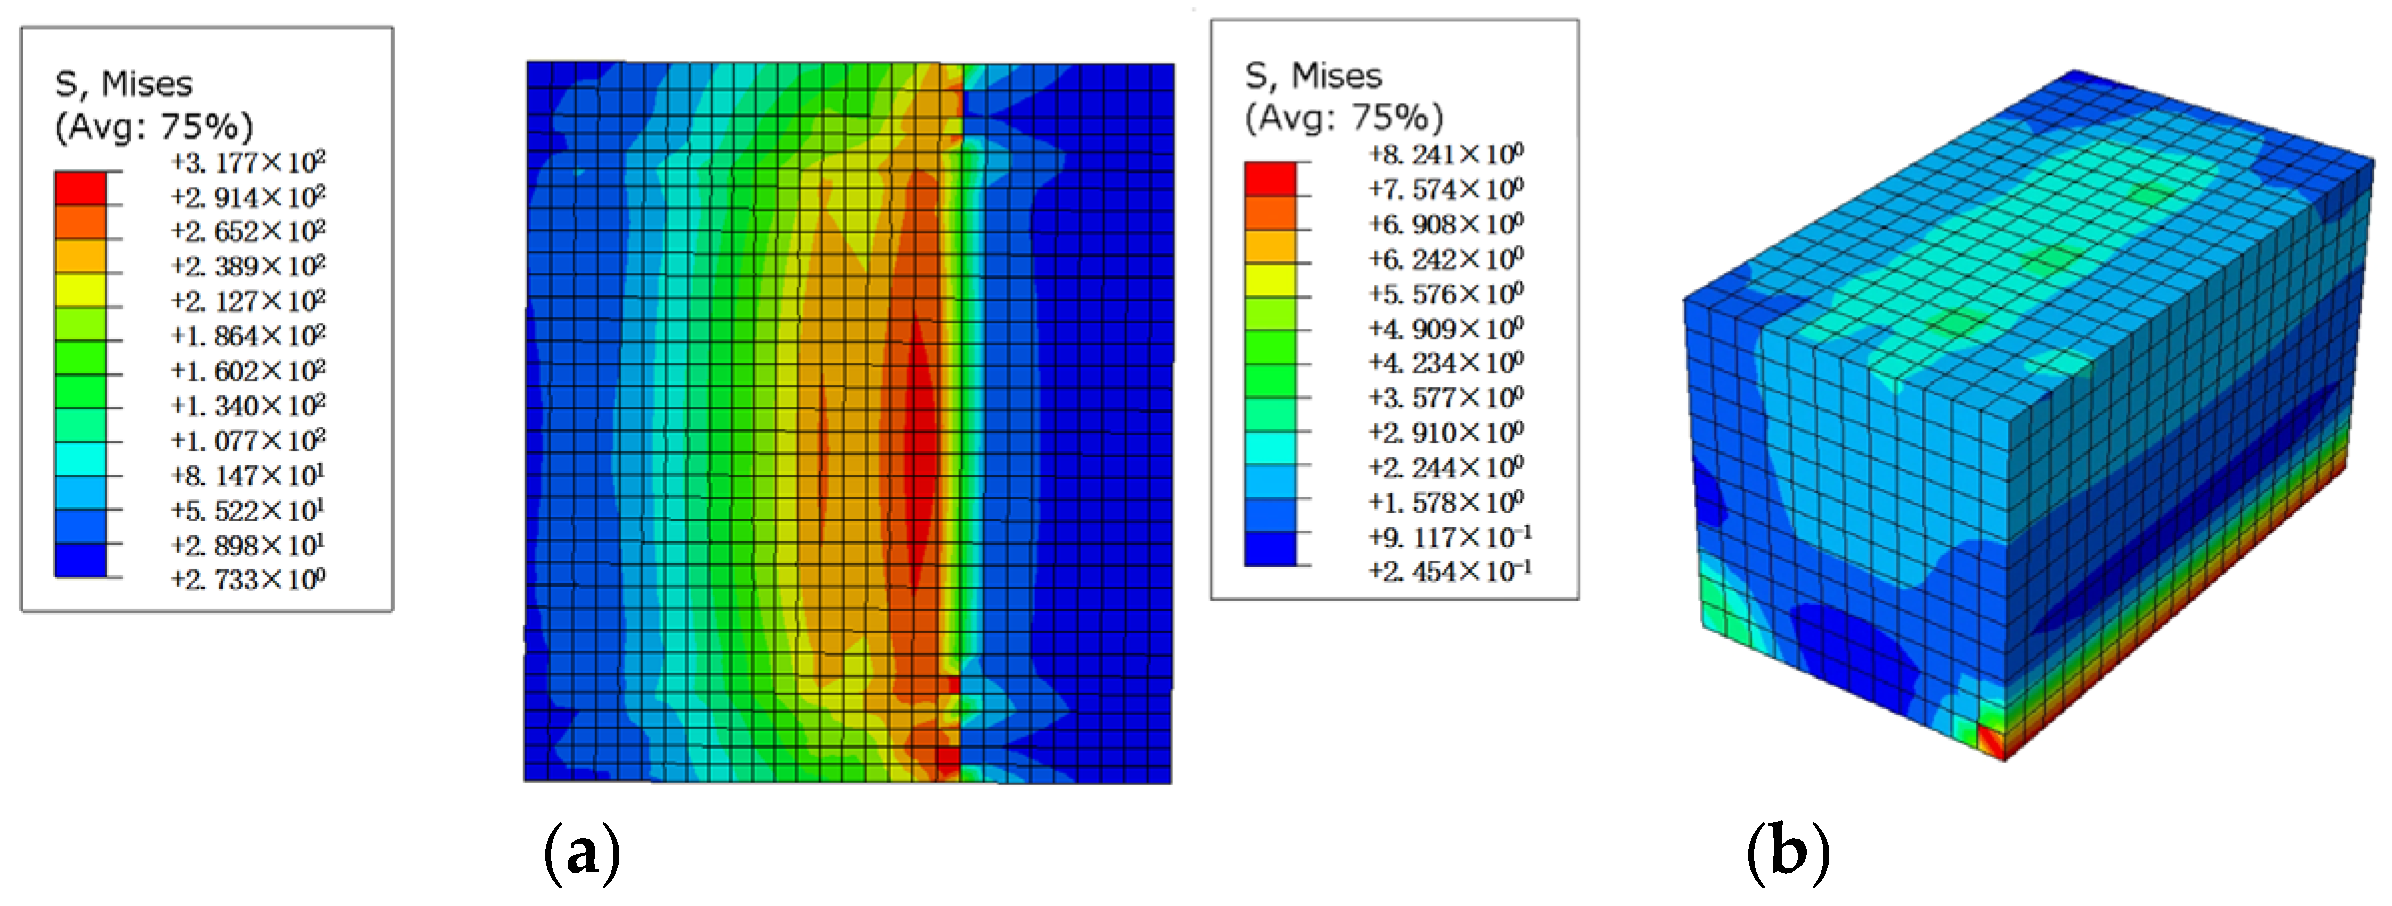
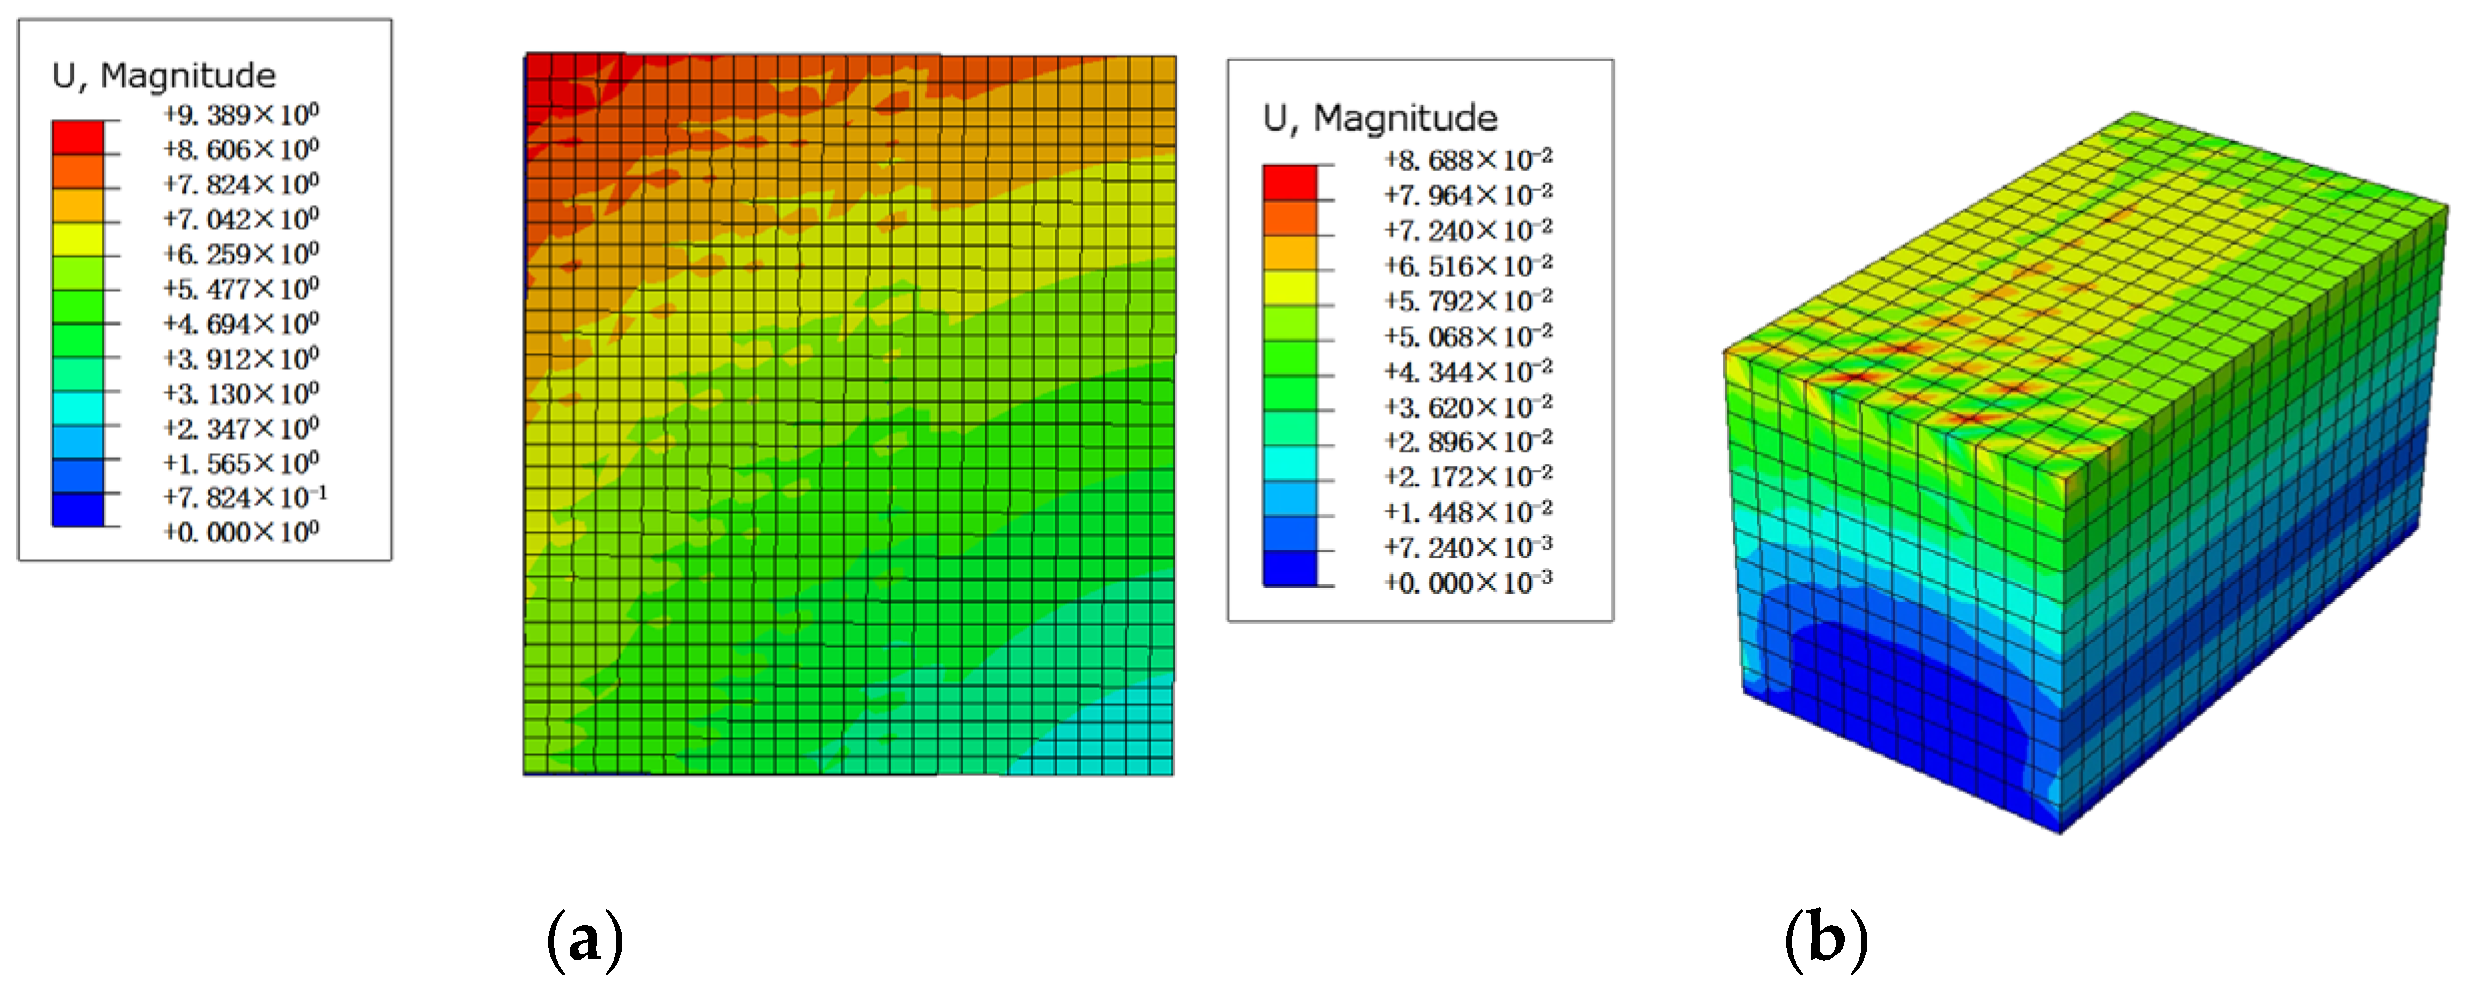
The numerical results of the SLA-s case are presented as follow. The results cover the following aspects: the simulated load–displacement curve (Figure 15) and the corresponding test results (Figure 16) for the SLA-s case. The simulated stress distribution, the simulated displacement distribution, and the simulated strain of the steel liner plate are shown in Figure 17, Figure 18 and Figure 19. The test load–displacement curve in Figure 15 is presented to verify the accuracy of the numerical simulation results.
It can be clearly observed from Figure 15 that the numerical simulation results and test results for the SLA-s case follow an identical trend. The maximum load of the numerical simulation of the SLA-s case is 1043 kN, while the maximum load of the test is 991 kN. The maximum strain occurs at the tension end of the steel liner plate near the concrete. The maximum simulated elastic strain is 0.0016, and the maximum simulated plastic strain is 0.0002.
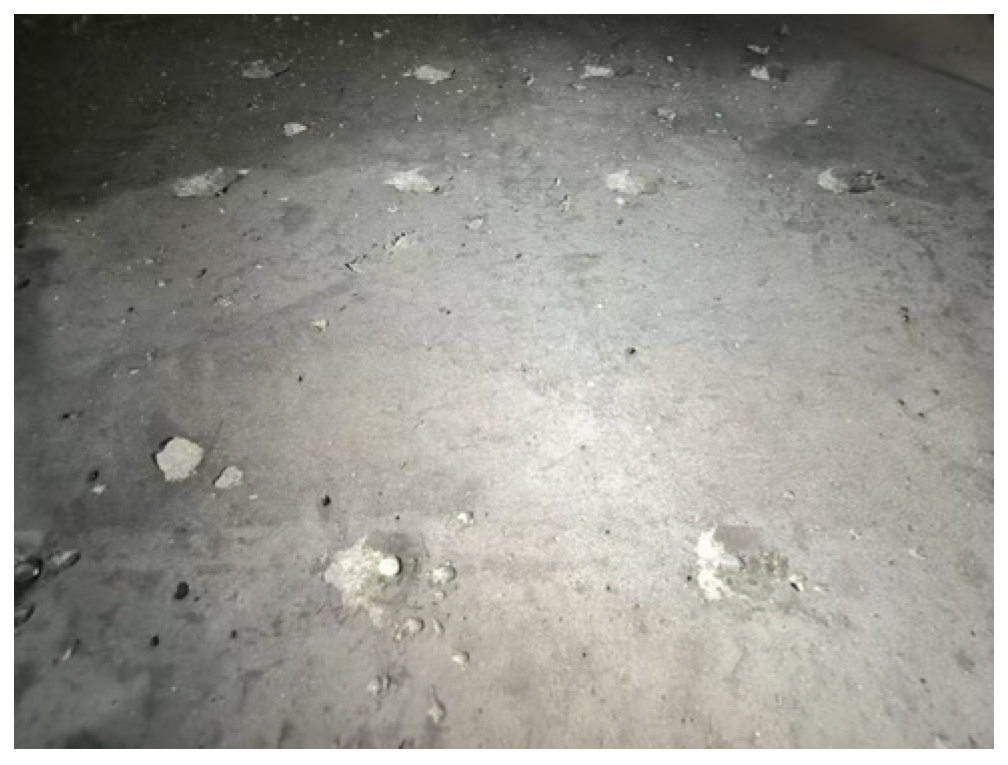
The numerical failure characteristics are in good agreement with the typical phenomena observed in the corresponding tests (Figure 16). With the continuous increase of the displacement applied at the tensile end, neither the steel liner plate nor the concrete reached its respective ultimate strength (360 MPa and 36 MPa, respectively). For the case where only studs were arranged, no damage or failure occurred in the steel liner plate and concrete. The structural damage was limited to the anchorage interface between studs and the steel liner plate, and the studs remained embedded in concrete without any pullout. Consequently, the failure mode of the SLA-s case can be defined as interface anchorage failure at the connection between the stud and the steel backing plate.
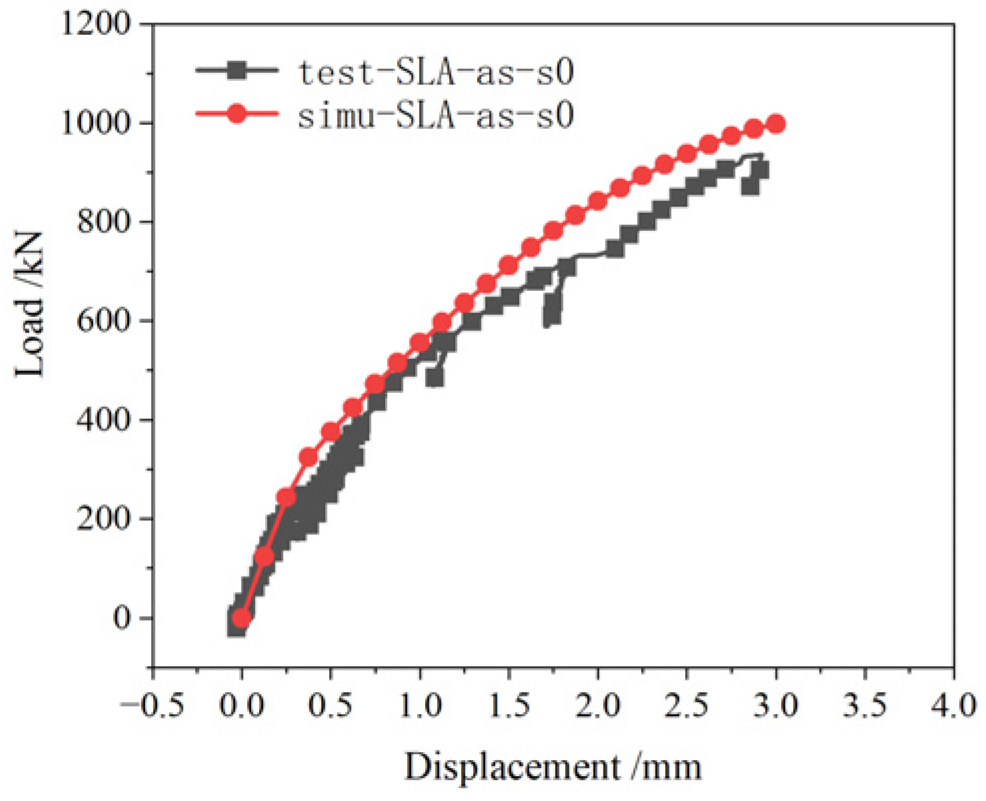
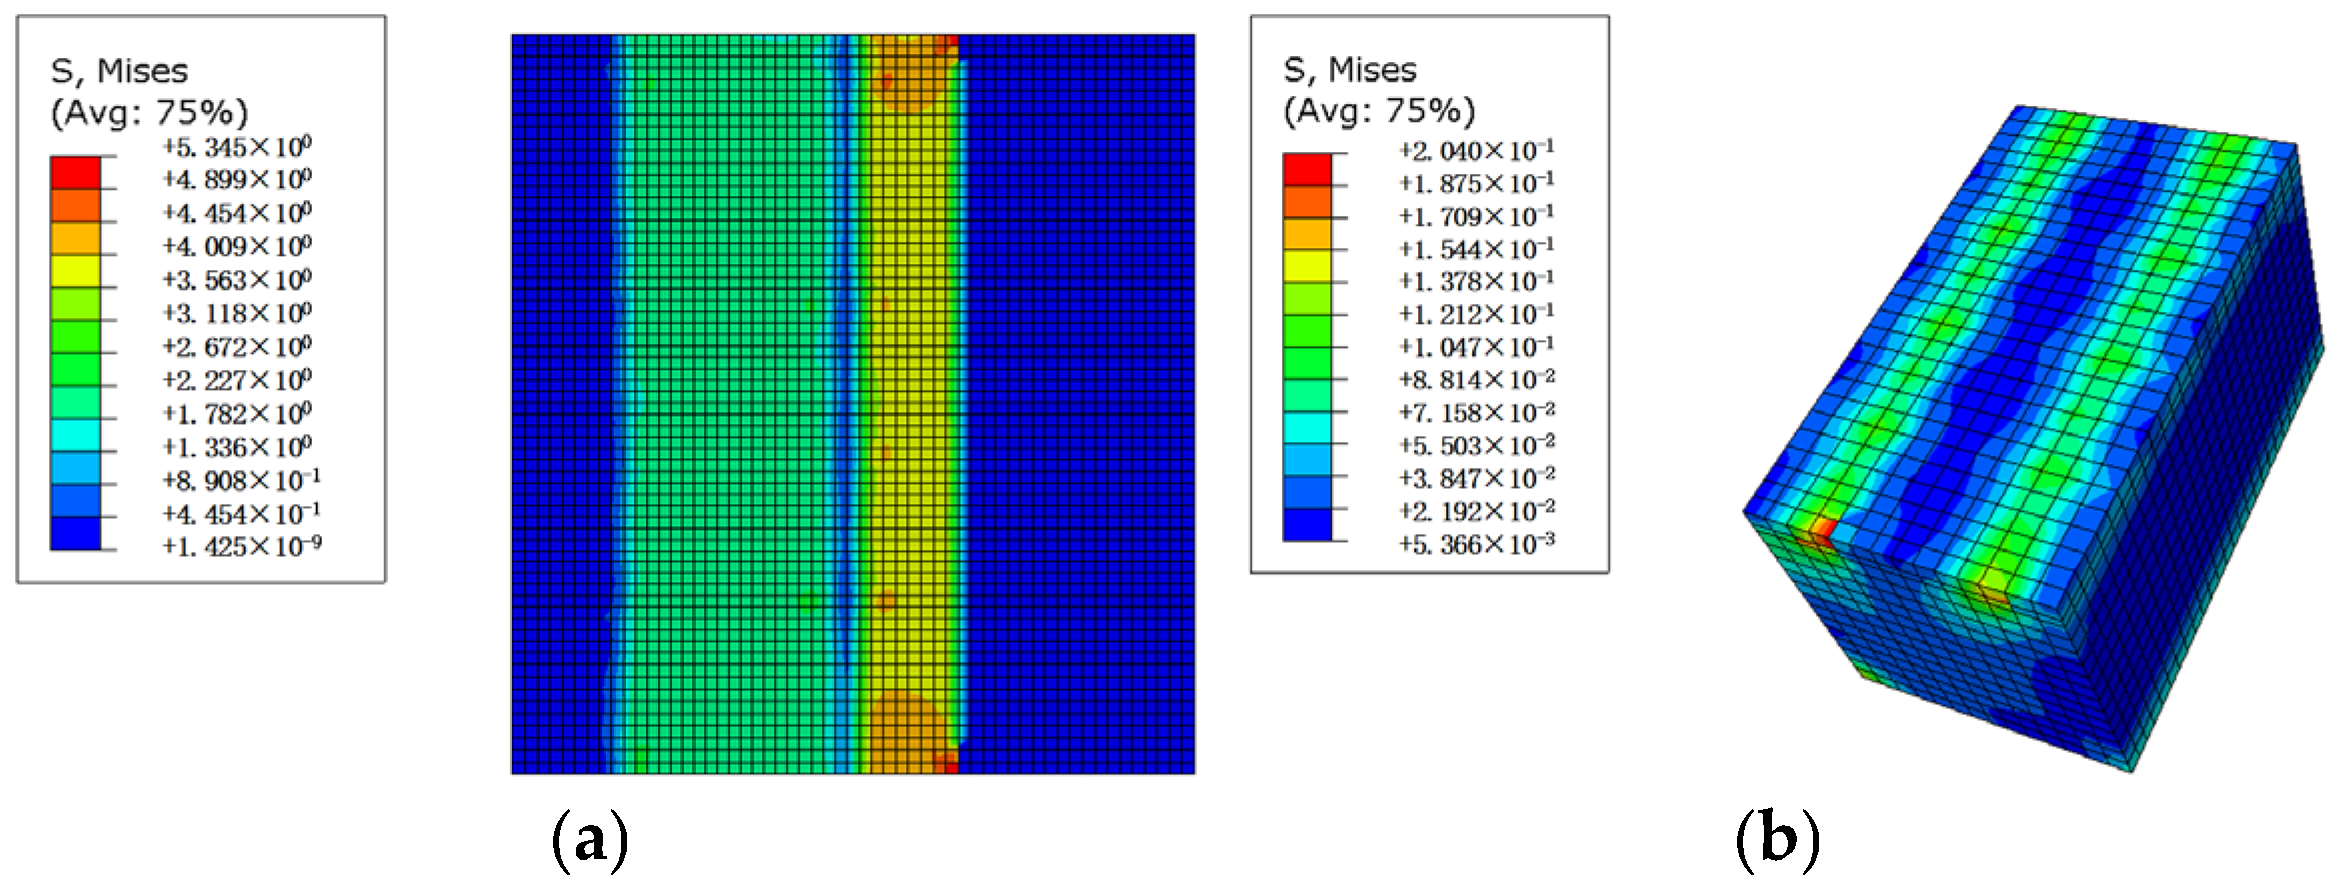
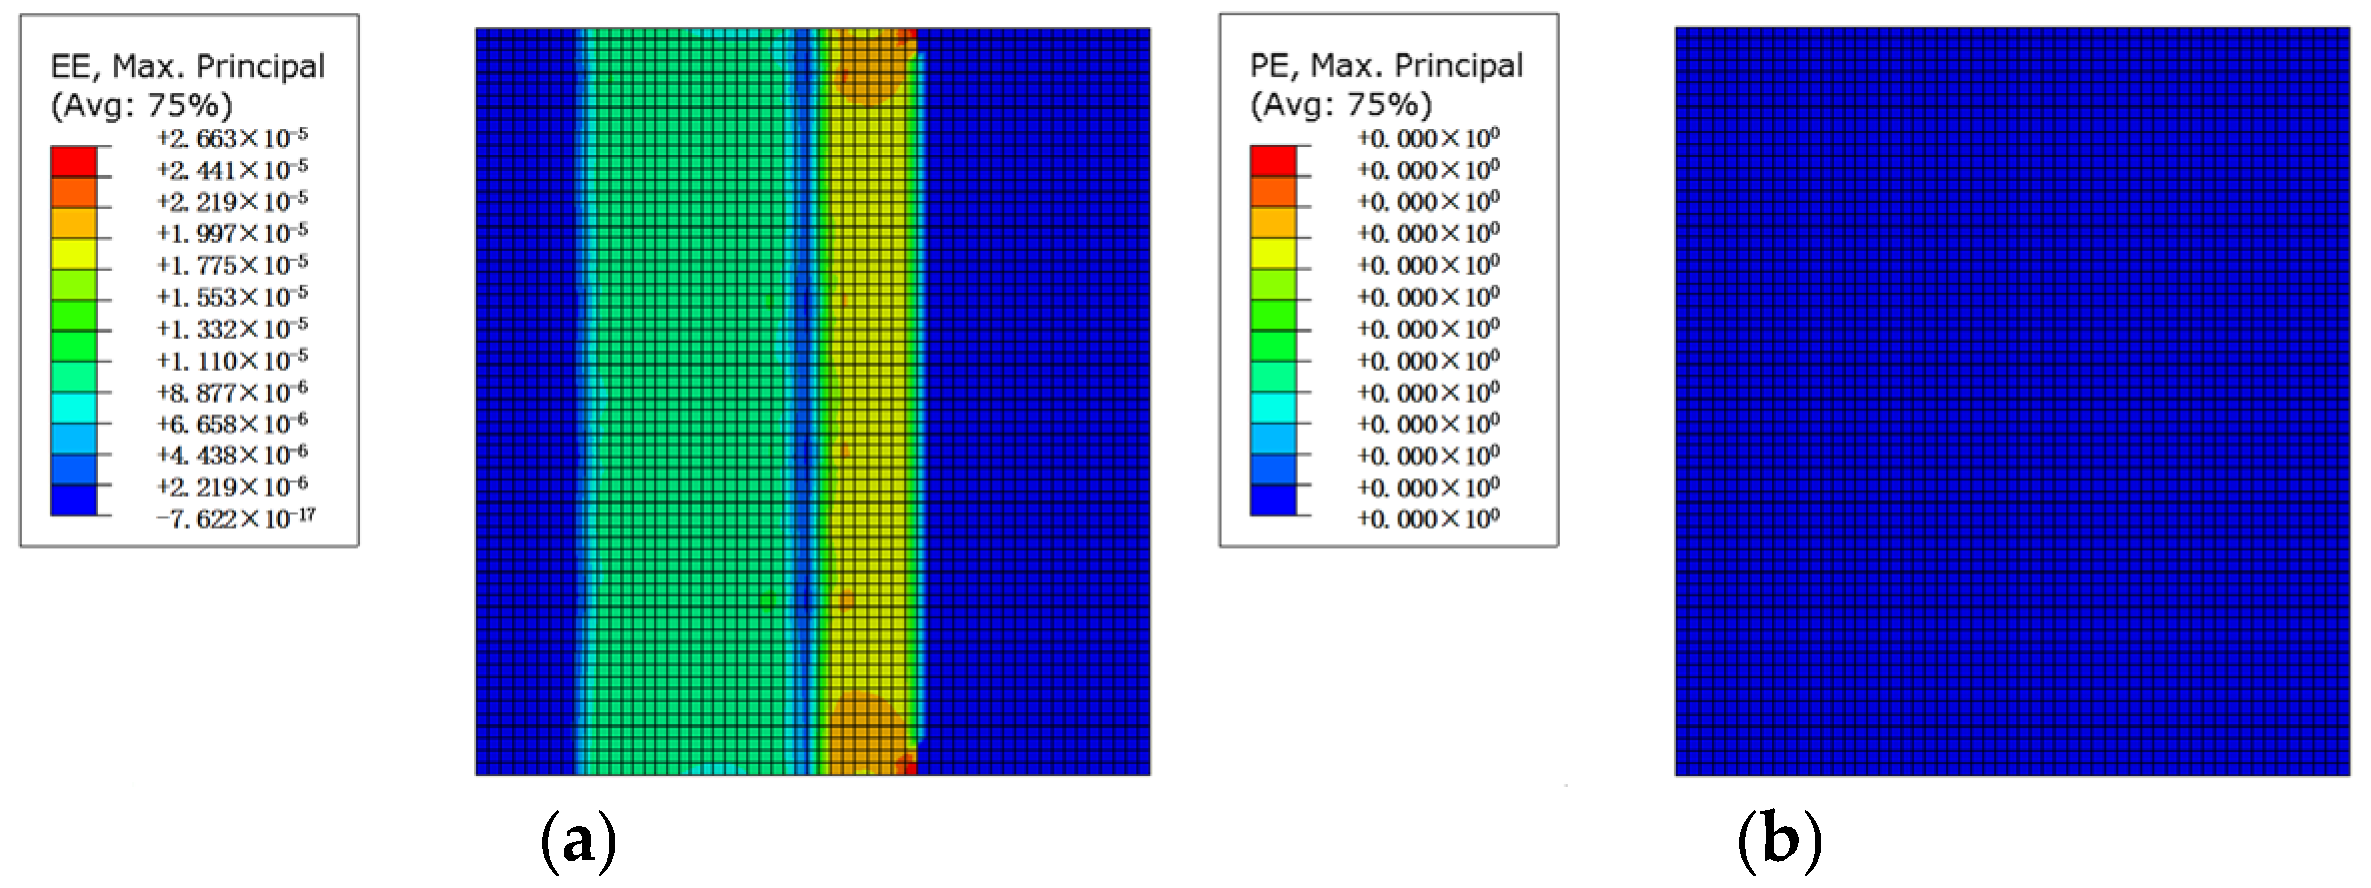
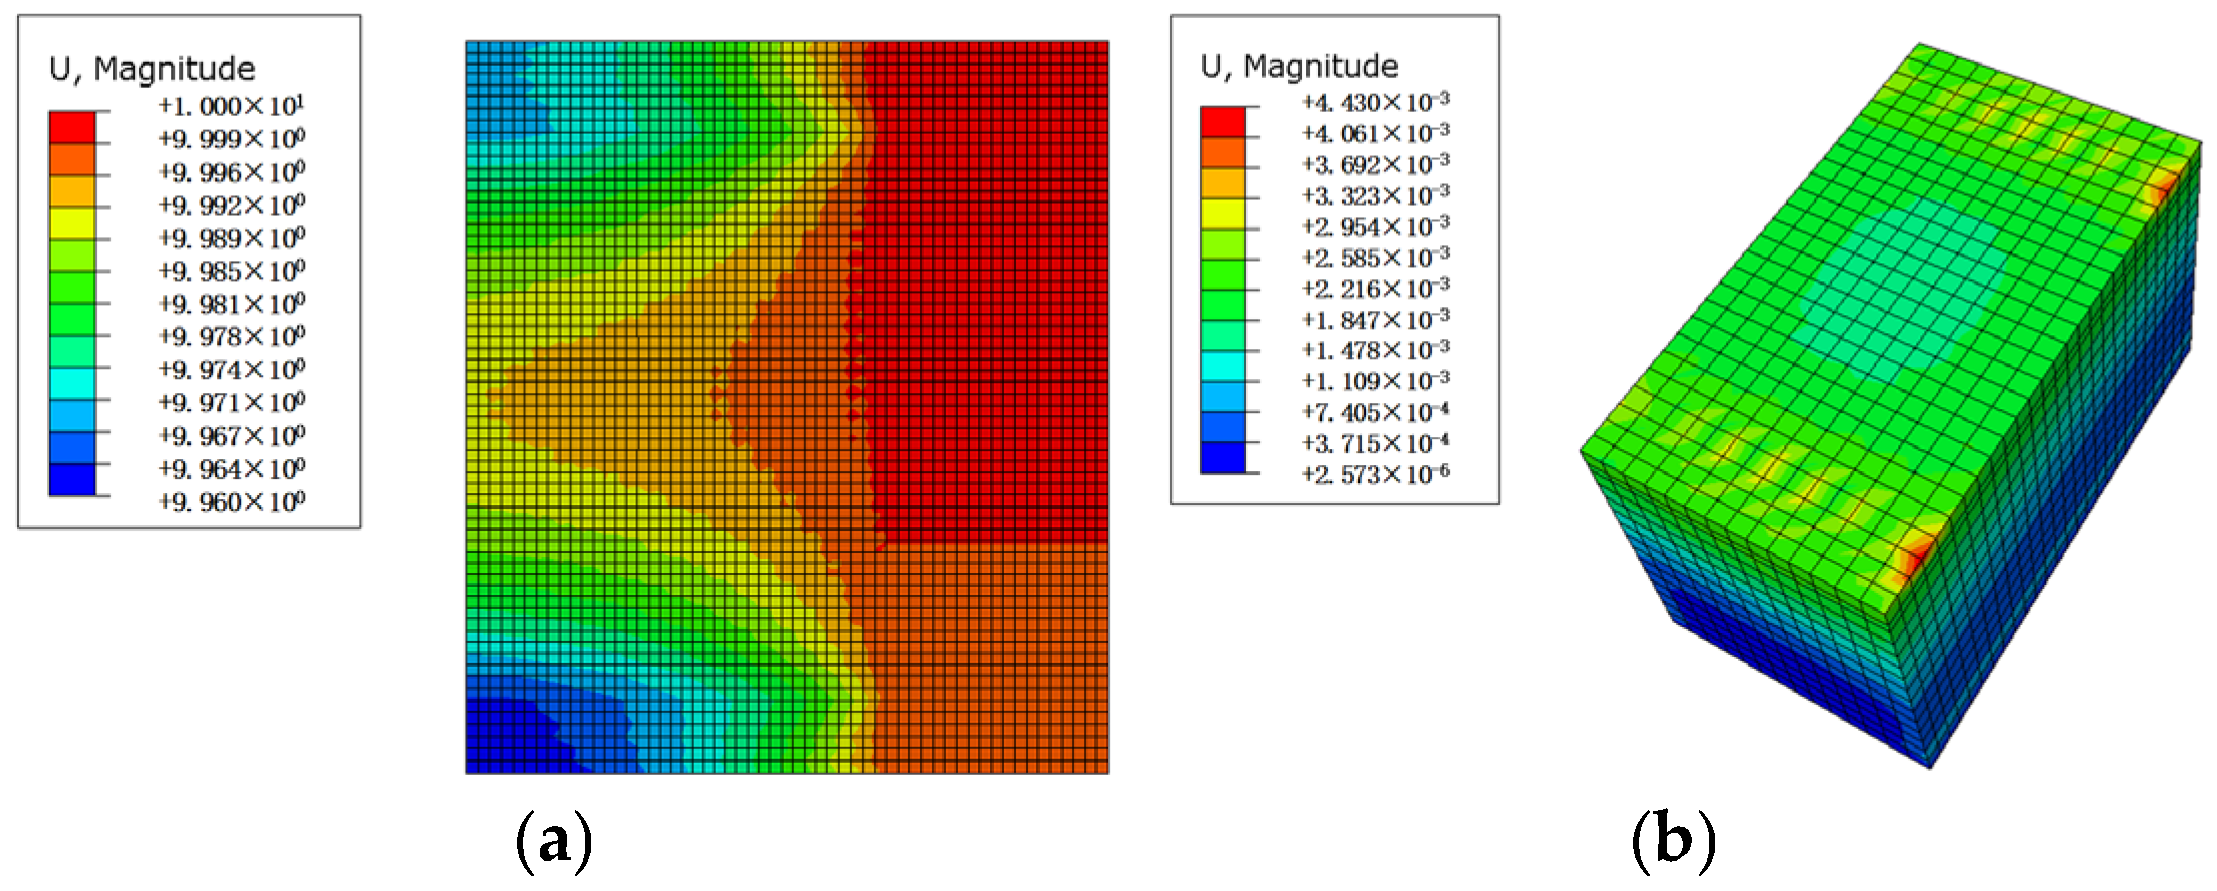
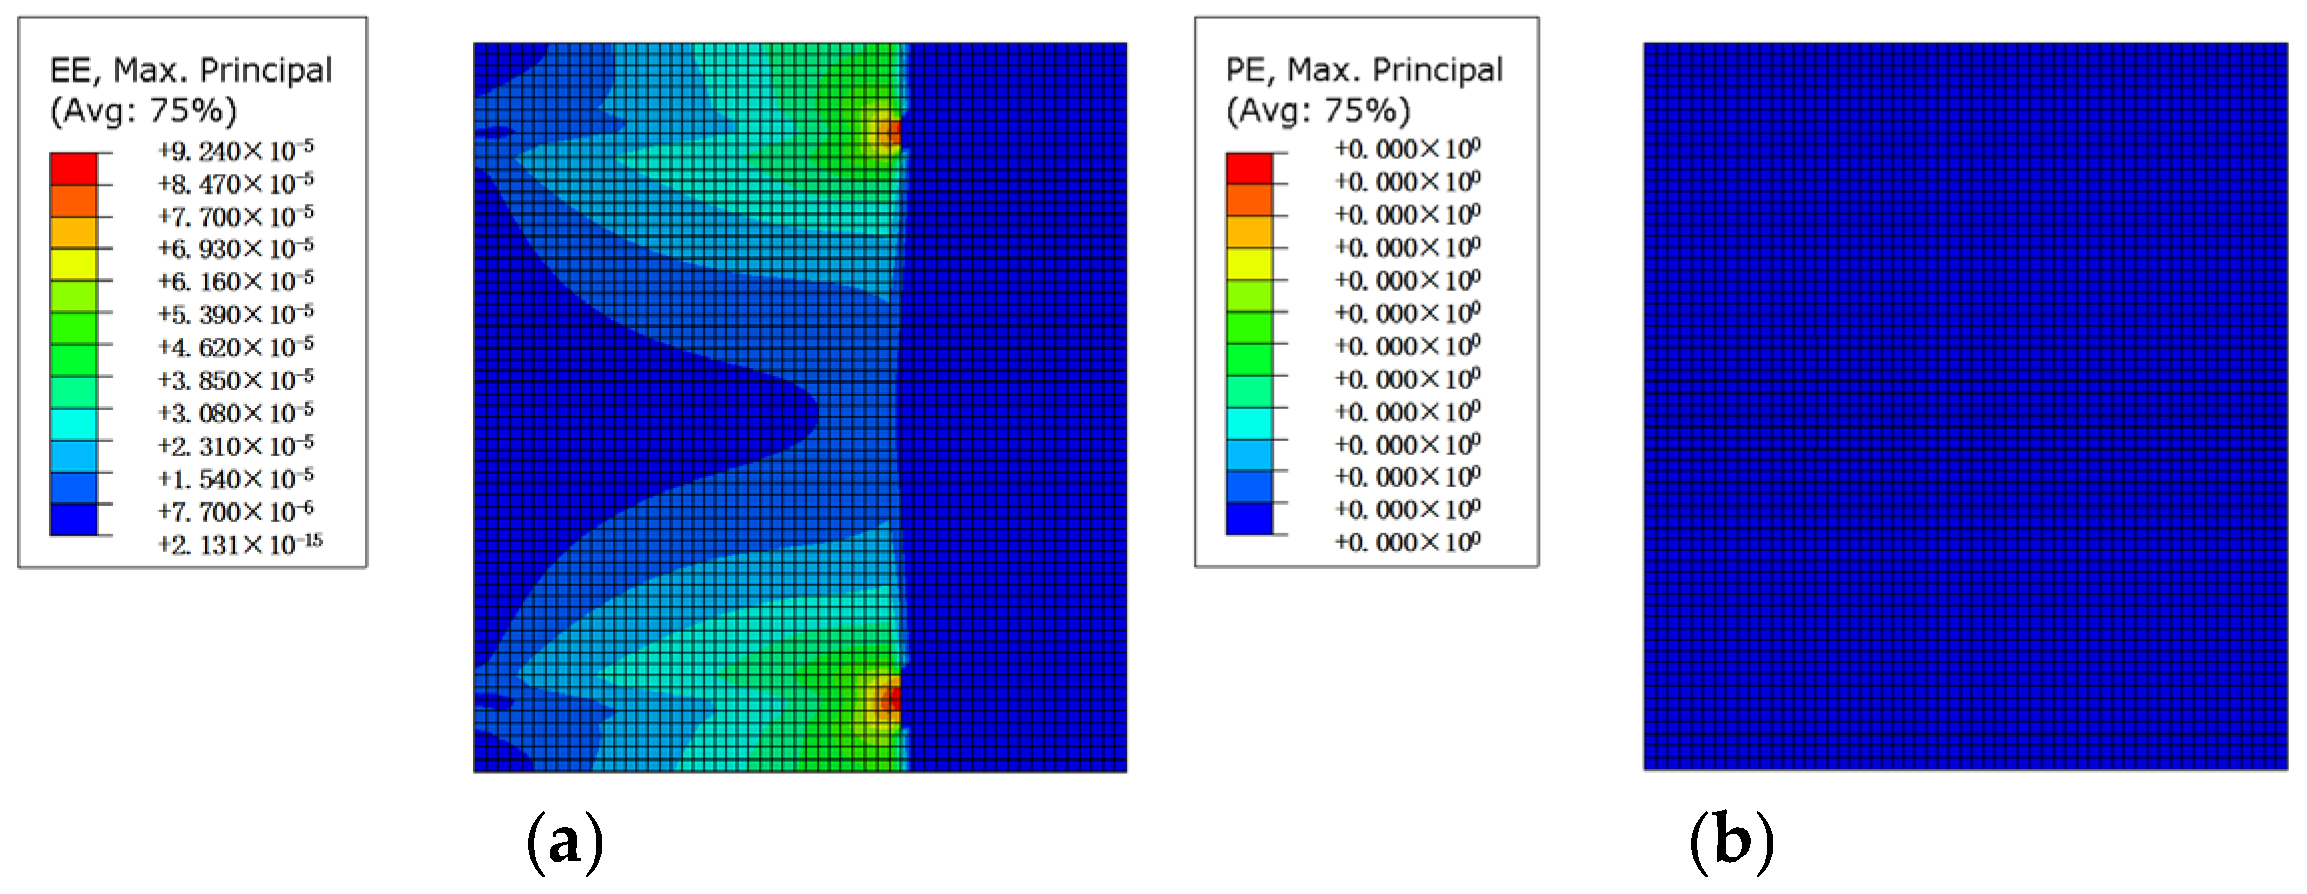
For the SLA-as-s0 case, the simulated load–displacement curve is shown in Figure 20, while the relevant test results is shown in Figure 21. Figure 22, Figure 23 and Figure 24 demonstrate the simulated stress distribution, the simulated displacement distribution and the simulated strain of the steel liner plate. The test load–displacement curve in Figure 20 serves to confirm the reliability of the numerical simulation.
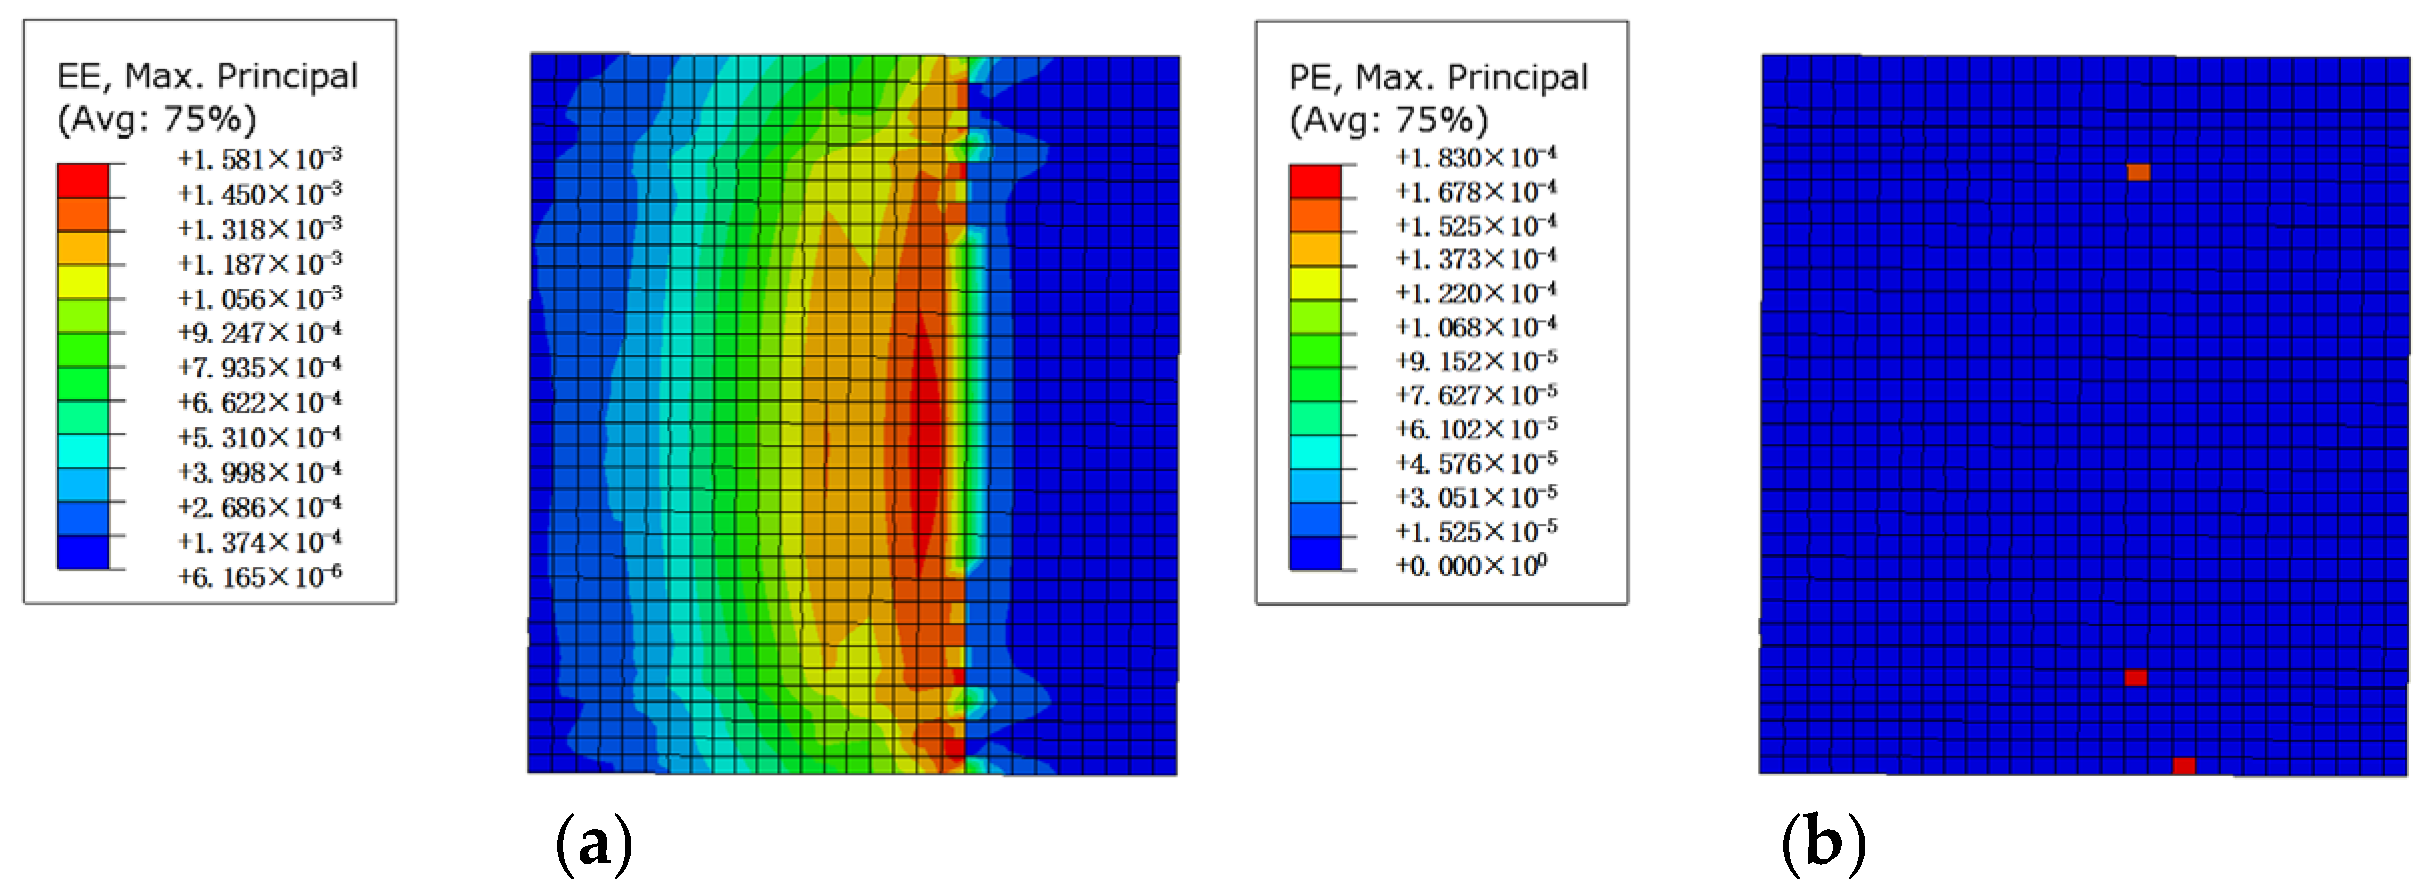
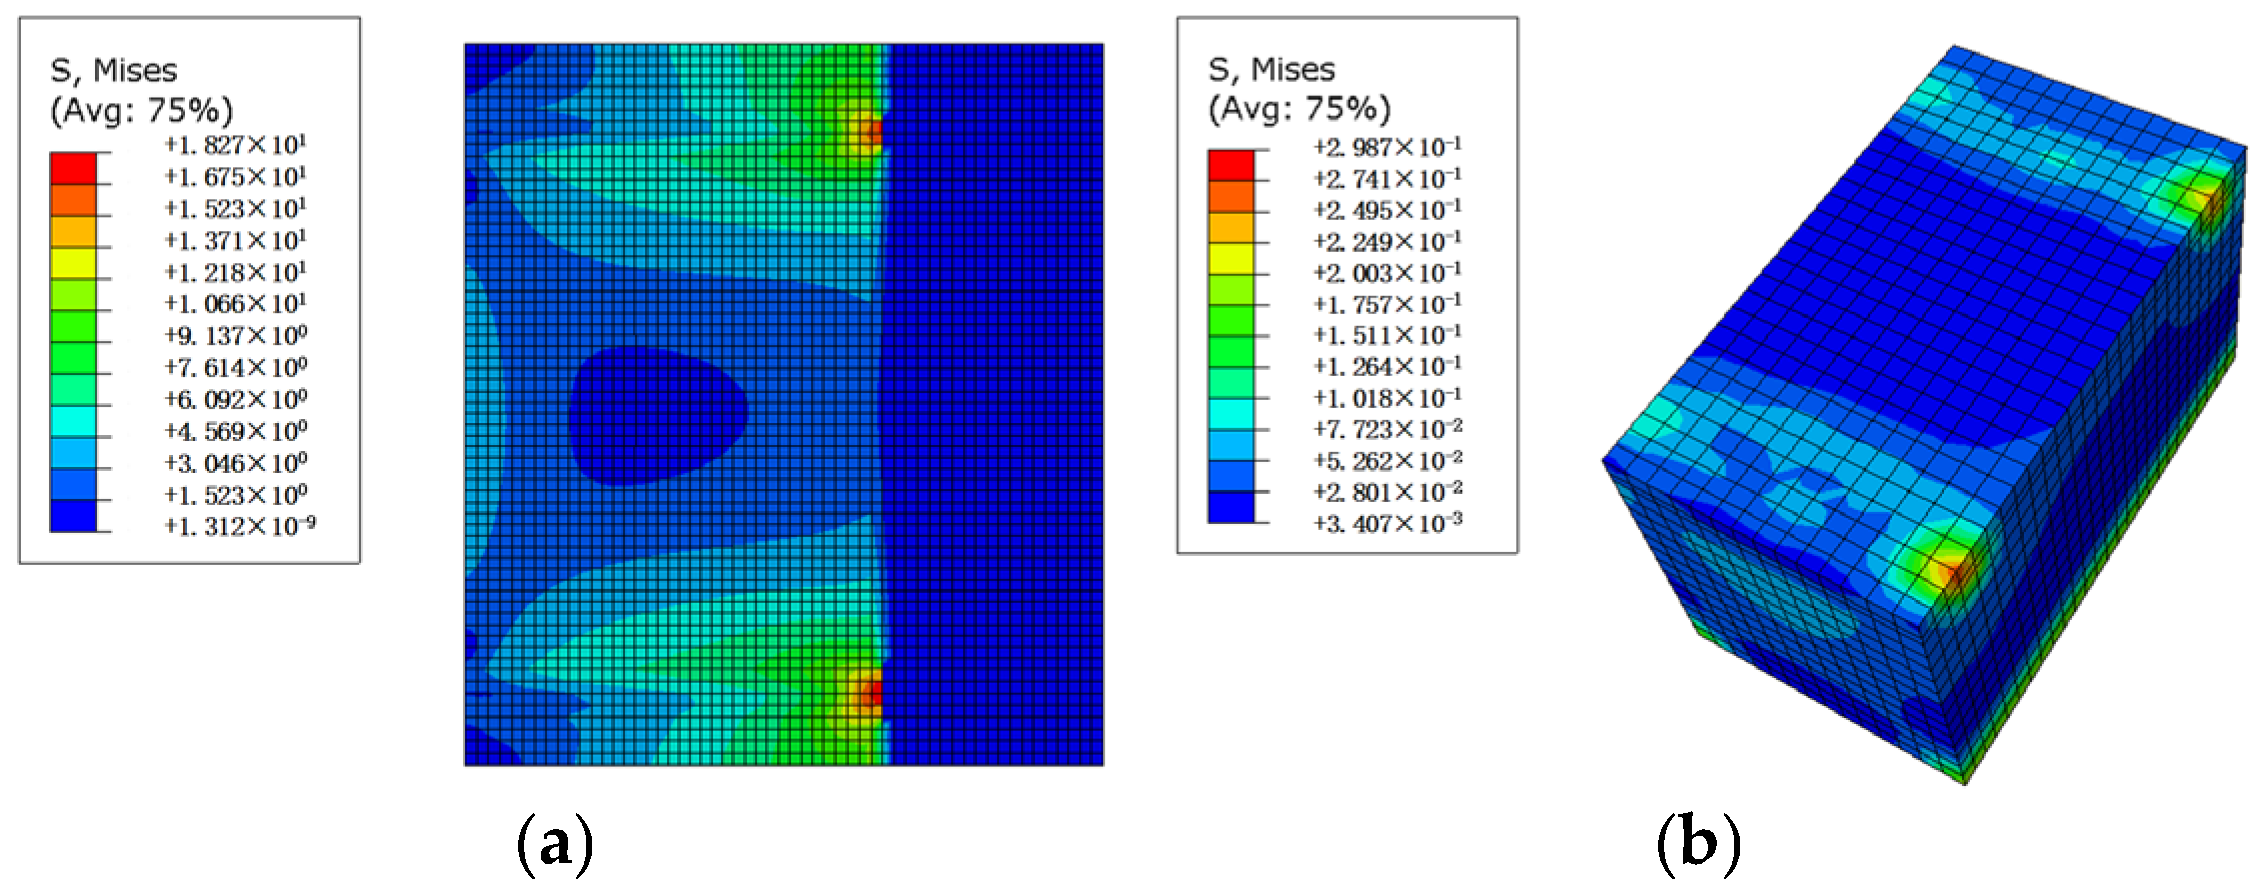
As shown in Figure 20, the numerical simulation results for the SLA-as-s0 case exhibit the same trend as the test results. The maximum load of the numerical simulation of the SLA-as-s0 case is 1006 kN, while the maximum load of the test is 941 kN. The maximum strain occurs on both sides of the tension end of the steel liner plate near the concrete. The maximum simulated elastic strain is 0.000027 with no plastic strain developed.
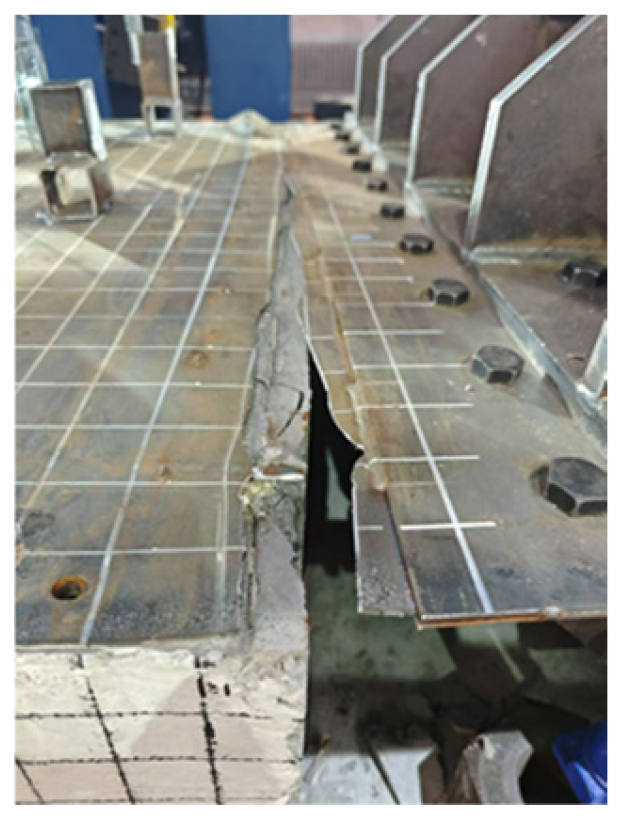
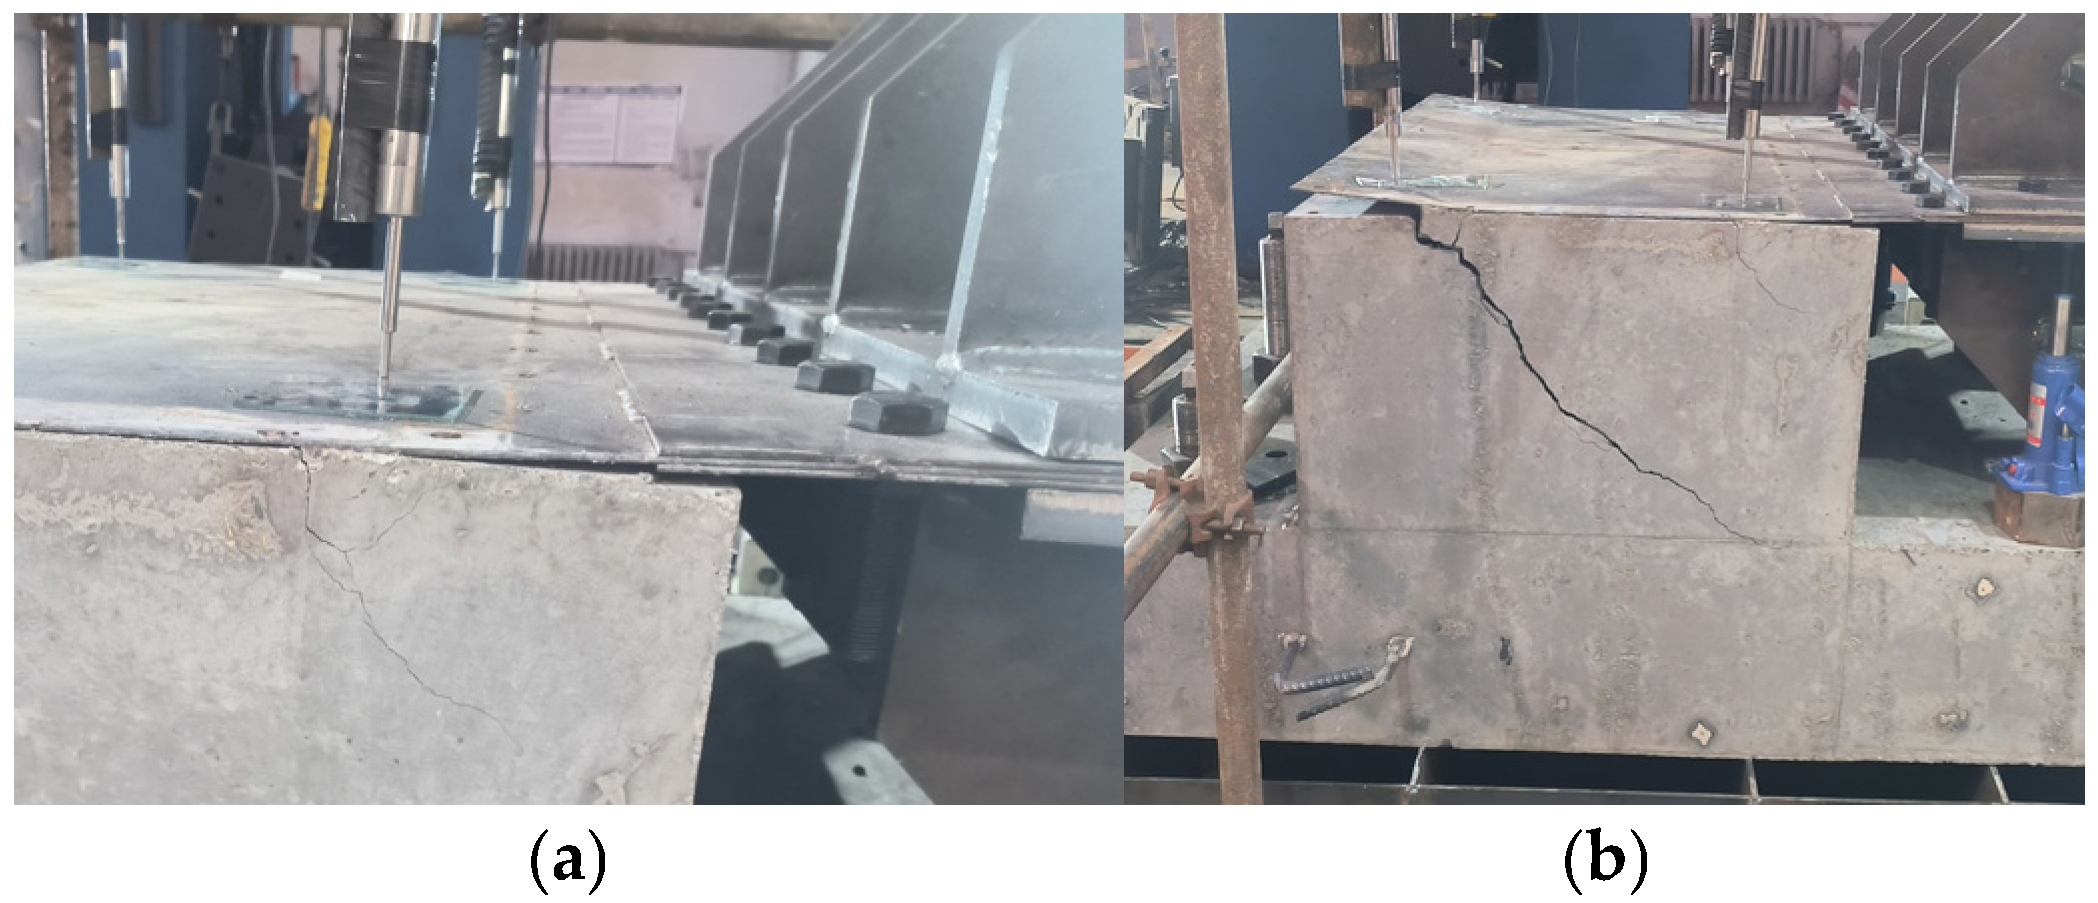
The failure characteristics observed in the numerical simulations are in close agreement with those observed in the corresponding tests (Figure 21). As the displacement increased, failure first occurred at the anchorage interface between the proximal long-angle steel and the concrete, accompanied by concrete cracking (Figure 21a). As the displacement increased further, the concrete stress rose at the anchorage interface between the distal long-angle steel and the concrete, resulting in wider concrete cracks compared to the proximal end. The steel liner plate, angle steels and studs remained undamaged. Therefore, the failure mode of the SLA-as-s0 case can be identified as anchorage failure at the angle steel-concrete interface.
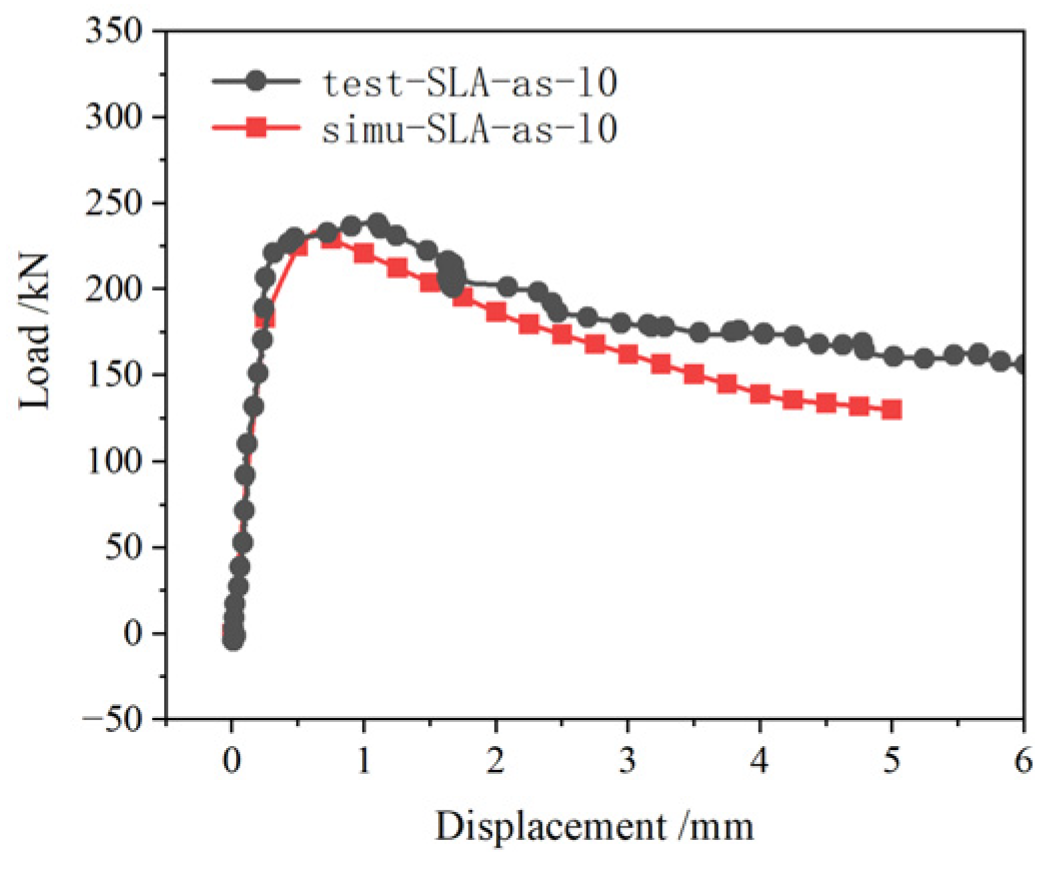
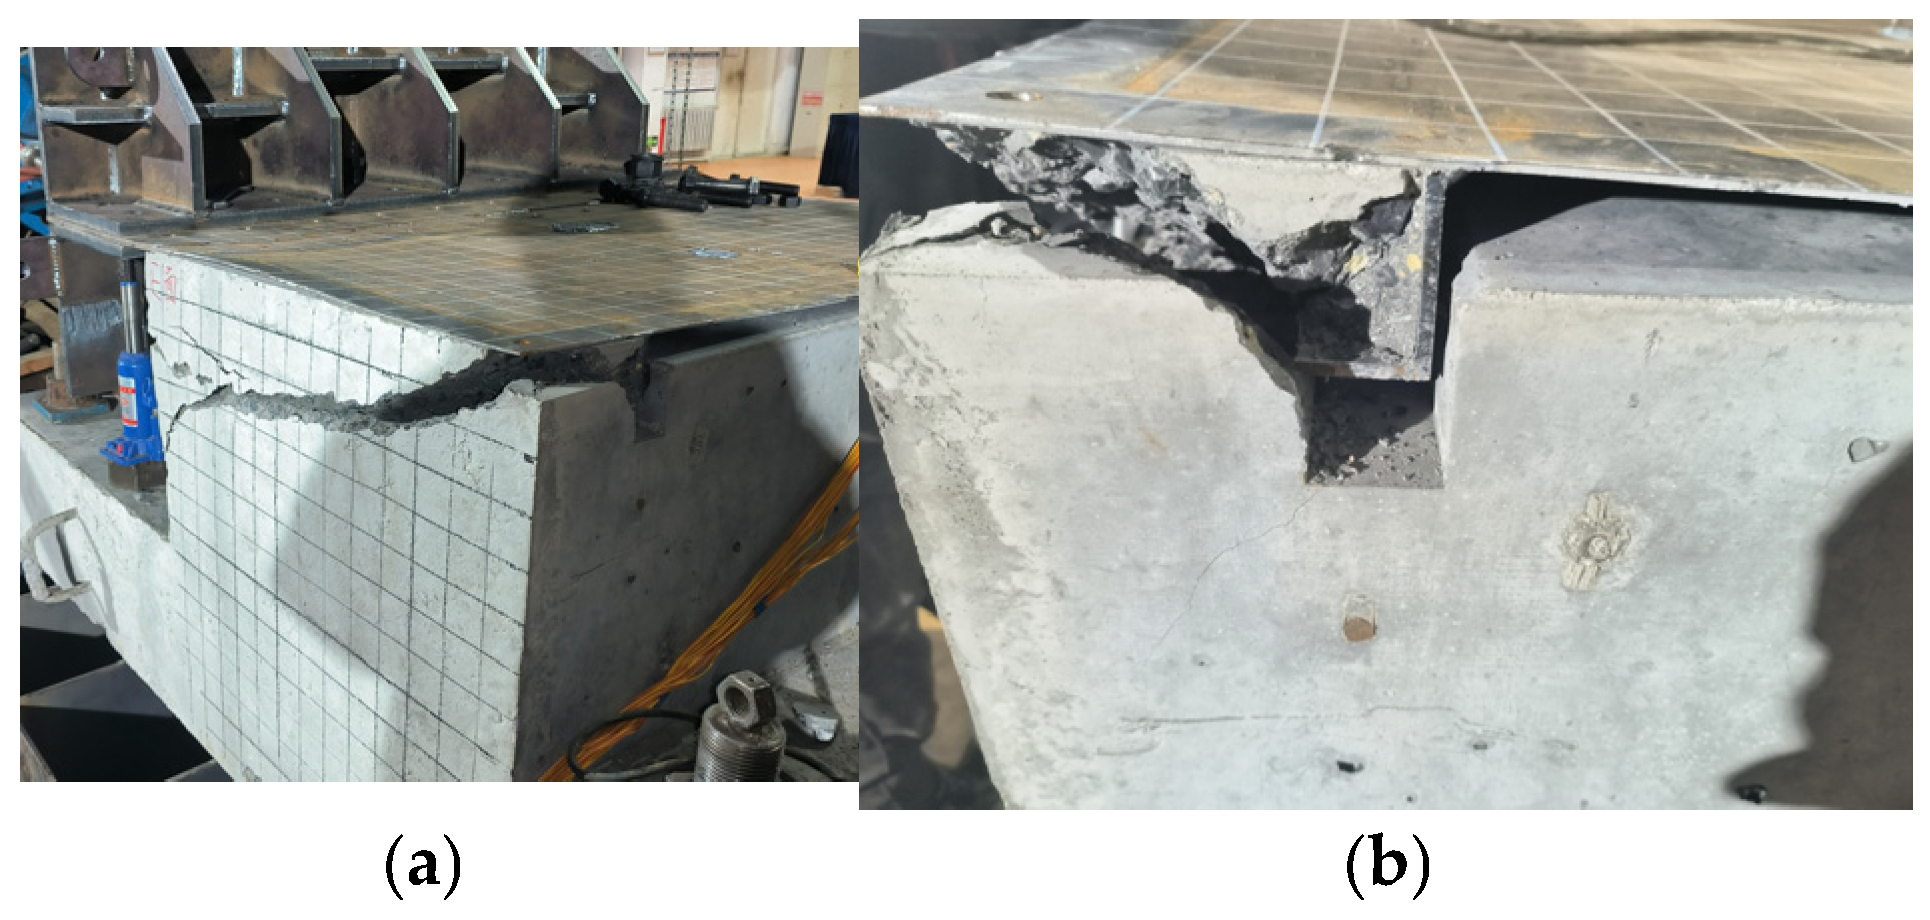
The numerical results of the SLA-as-l0 case are presented from Figure 25, Figure 26, Figure 27, Figure 28 and Figure 29. The simulated load–displacement curve is shown in Figure 25 and the test results is shown in Figure 26. Figure 27, Figure 28 and Figure 29 show the simulated stress distribution, displacement distribution and steel liner plate strain. Meanwhile, the corresponding test load–displacement curve (Figure 25) confirms the reliability of the numerical predictions.
As shown in Figure 25, the numerical simulation results for the SLA-as-l0 case exhibit the same trend as the test results. The maximum load of the numerical simulation of the SLA-as-l0 case is 229 kN, while the maximum load of the test is 241 kN. The maximum strain occurs on the tension end of the steel liner plate near the concrete. The maximum simulated elastic strain is 0.000092, with no plastic strain developed.
The failure characteristics observed in the numerical simulations are in close agreement with those observed in the corresponding tests (Figure 26). As displacement increased, the concrete stress rose at the anchorage interface between the short angle steel and the concrete. Meanwhile, the stresses in the steel liner plate, angle steels and studs remained at low levels, and no damage occurred. Eventually, the distal portion of the short-angle steel was pulled out from the concrete (Figure 26b). The failure mode of the SLA-as-l0 case can be identified as anchorage failure at the angle steel–concrete interface, which is the same as the SLA-as-s0 case.

3.2. Simulation Results of Long Angle Steels

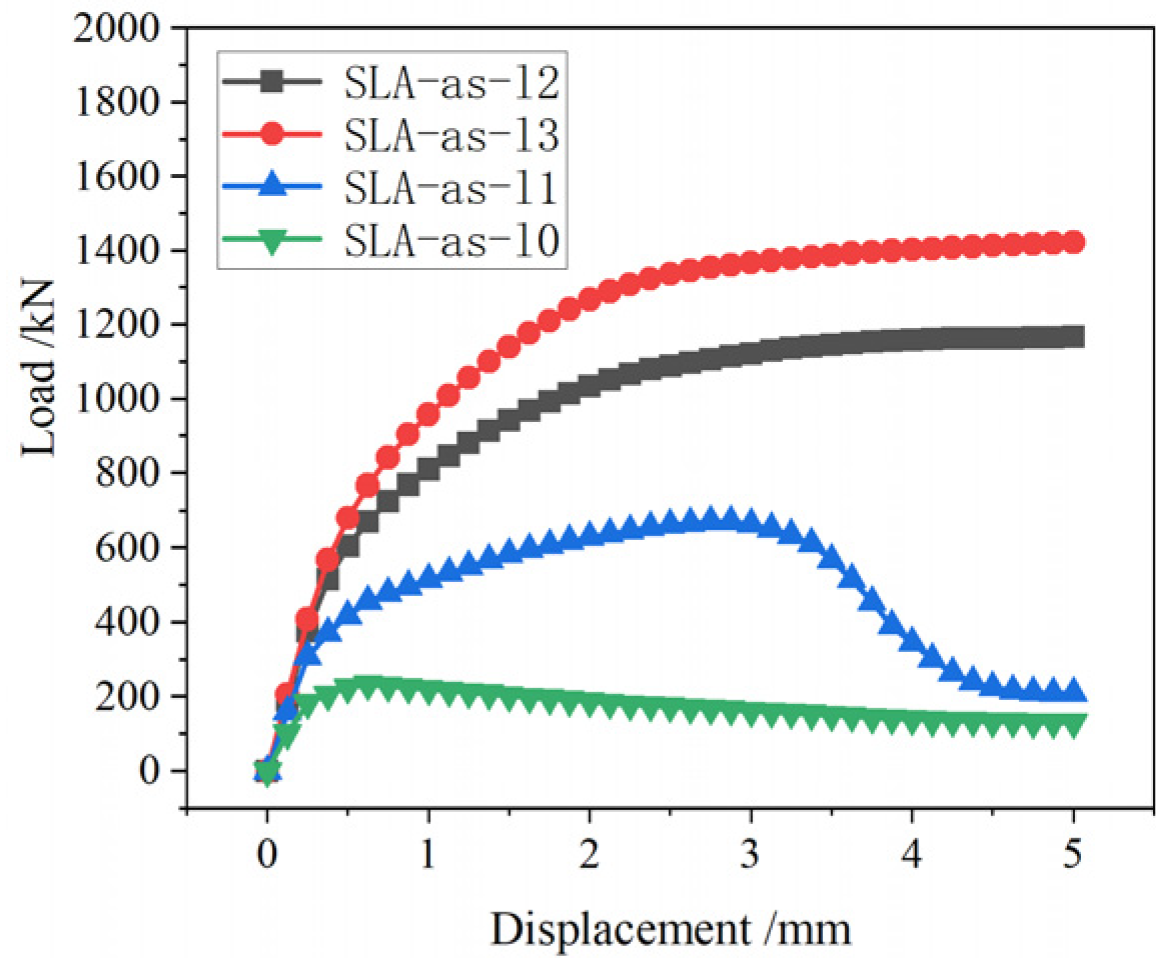
Figure 30 presents the load–displacement curves for the parametric analysis cases investigating the influence of long angle steel quantity. Table 6 shows the statistical summary of the ultimate bearing capacity of each specimen with different numbers of long angle steels.
Taking the configuration with two short-angle steels as the reference baseline, the results show that the ultimate bearing capacity of the steel liner anchorage system increases by an average of approximately 460 kN for each additional long-angle steel added. The bearing capacity contribution of two long angle steels is about twice that of a single one. When a third long angle steel is arranged between the two existing long-angle steels, its contribution to the system bearing capacity is about 260 kN, which is only 57% of the aforementioned reference value.
It can be concluded that the contribution of long-angle steels to the ultimate bearing capacity of the steel liner is not only related to the number of steels, but also closely related to their spacing.

3.3. Simulation Results of Short Angle Steels

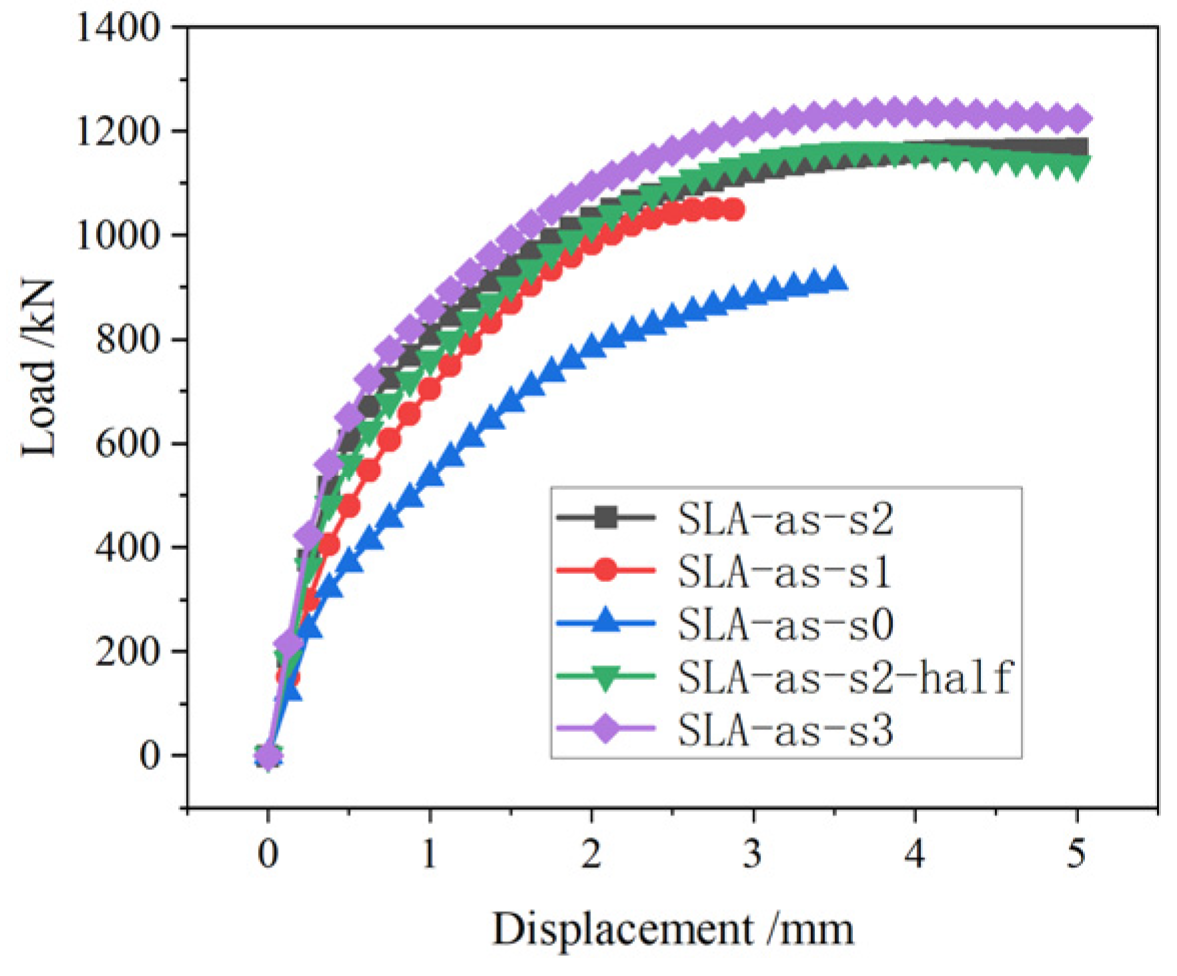
Figure 31 presents the load–displacement curves for the parametric analysis cases investigating the influence of the number of short angle steels. Table 7 shows the statistical summary of the ultimate bearing capacity of each specimen with different numbers of short-angle steels.
The results shown in Figure 31 demonstrate that, taking the configuration with teo long-angle steels as the reference baseline, the ultimate bearing capacity of the steel liner anchorage system increased by an average of approximately 127 kN per additional short angle steel. This incremental contribution represents about 15% of the reference bearing capacity. However, when a third short-angle steel was added to the configuration, the contribution decreased significantly to only 10% of the reference bearing capacity. The result indicates that the contribution of short-angle steels to the ultimate bearing capacity of the steel liner exhibits an obvious trend of a diminishing marginal returns model.

3.4. Simulation Results of Studs

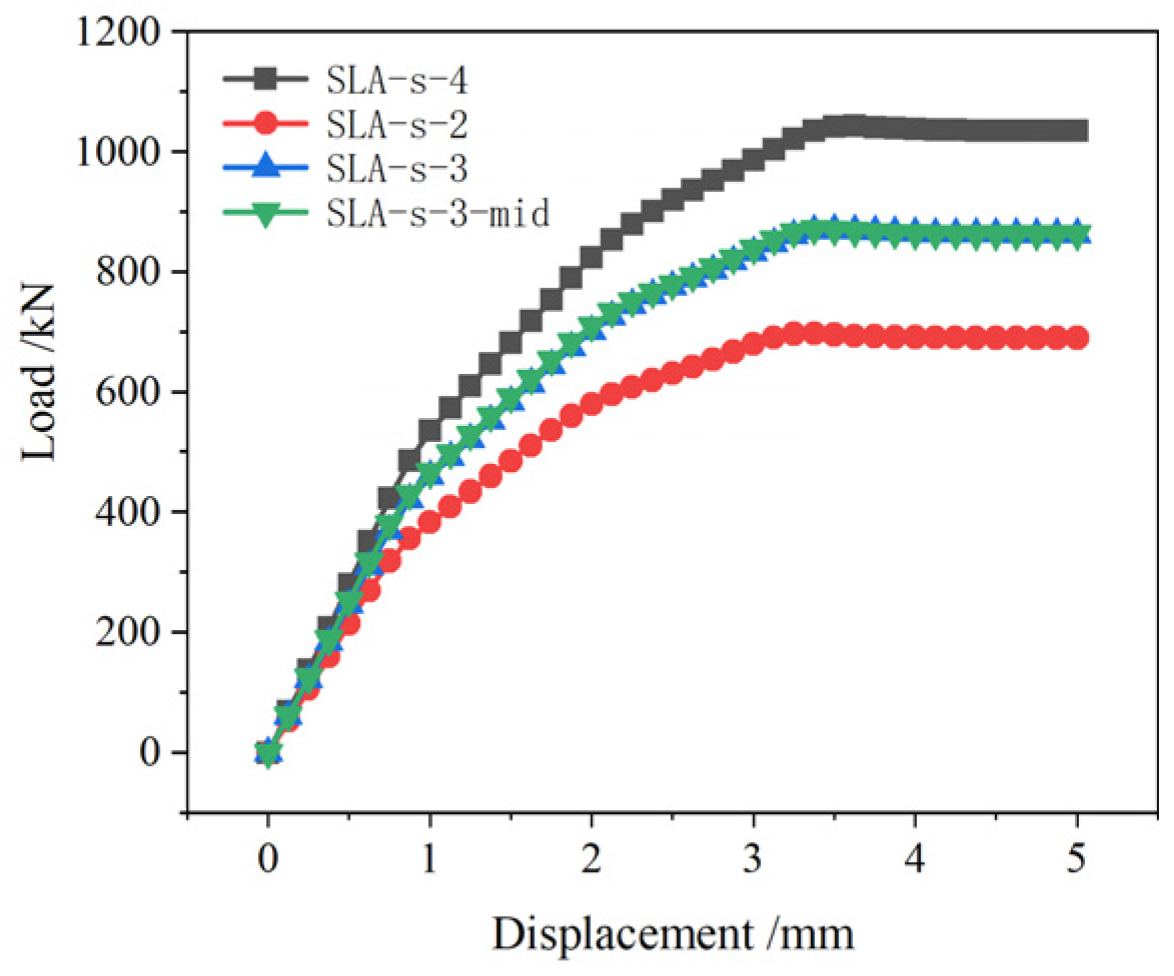
Figure 32 shows the load–displacement curves for the parametric cases investigating the influence of stud row number. Table 8 presents the statistical summary of the bearing capacity of each specimen under different stud row numbers.
The numerical results in Figure 32 show that the ultimate bearing capacity contribution of studs has an approximately linear relationship with the number of stud rows. For each row of studs removed, the bearing capacity decreased by 174 kN, corresponding to approximately 17% (1/6) of the total bearing capacity contribution of all studs. Accordingly, the ultimate bearing capacity provided by the studs exhibits a typical directly proportional relationship with the number of stud rows.

4. Conclusions

In this study, a high-fidelity three-dimensional numerical model of the angle steel-stud composite anchorage system for nuclear power plant containment steel liners was established and validated against pull-out test results, with the ultimate bearing capacity error controlled within 12%. Through the parameter analysis, the influence of the number and spacing of long angle steel and short angle steel and the number of stud rows on the mechanical properties of the anchorage system were studied. The failure mechanisms of different anchorage configurations were clarified, and the individual contributions of key components to the global load-bearing capacity were quantitatively decoupled. The main conclusions are drawn as follows:
(1)
Three typical failure modes have been identified for different anchorage configurations: tensile failure of the steel liner plate for the composite anchorage system (with anchorage components remaining intact, confirming sufficient reserve capacity of the prototype design), brittle interface debonding at the stud–steel liner connection in the stud-only system and progressive interfacial debonding between angle steels and concrete with local cracking in the angle steel-only system.
(2)
The bearing capacity contribution of angle steels exhibits nonlinearity, being highly dependent on both component quantity and spatial arrangement. Long-angle steels are the primary load-bearing components, contributing an average of 460 kN each, but the marginal contribution of a third long-angle steel drops to 57% of the reference value due to reduced spacing. Short-angle steels show a clear diminishing marginal return trend, and halving their standard spacing yields negligible bearing capacity improvement.
(3)
The contribution of studs to the system bearing capacity follows a strictly linear proportional relationship with the number of stud rows. Each row of studs contributes approximately 17% of the total stud bearing capacity, and the position of removed stud rows has no significant effect on the overall system performance.
(4)
Long-angle steels provide the dominant anchorage capacity in the standard prototype configuration, accounting for ~73% of the total anchorage capacity, while short-angle steels and studs account for ~10% and ~17%, respectively.
This study fills the research gap in the quantitative component contribution analysis for steel liner anchorage systems, clarifying the failure mechanism of different anchorage forms. The conclusions can provide essential theoretical support for the optimized design and safety assessment of steel liner anchorage systems with the same composite anchorage form and similar size parameters in nuclear containment engineering practice.

Author Contributions

Conceptualization, Y.Y. and Q.Y.; methodology, Y.Y. and F.D.; software, Y.Y. and Q.Y.; validation, Y.Y. and J.Q.; formal analysis, Y.Y., Q.Y. and X.Z.; investigation, Y.Y., Q.Y. and J.Q.; resources, Y.Y., Q.Y. and J.Q.; data curation, X.Z.; writing—original draft preparation, Y.Y. and Q.Y.; writing—review and editing, Y.Y. and Q.Y.; visualization, Y.Y.; supervision, J.Q.; project administration, Y.Y., Q.Y. and J.Q.; funding acquisition, Q.Y. and F.D. All authors have read and agreed to the published version of the manuscript.

Funding

This research was funded by China Nuclear Power Engineering Co., Ltd. (CNPHFZ25KY2N0544/00, CNPHFZ24KY2N1143/00). The APC was funded by China Nuclear Power Engineering Co., Ltd.

Data Availability Statement

The data that support the findings of this study are available from the corresponding author upon reasonable request.

Acknowledgments

The authors gratefully acknowledge the technical support from the Key Lab of Structures Dynamic Behavior and Control of the Ministry of Education, Harbin Institute of Technology, for the numerical simulation setup and analysis. We also thank the administrative staff of China Nuclear Power Engineering Co., Ltd. for their assistance in data collection and project management.

Conflicts of Interest

Authors Qinqin Yao, Jie Qi, Fang Dong, and Xinli Zhao were employed by the company China Nuclear Power Engineering Co., Ltd. The remaining author declares that the research was conducted in the absence of any commercial or financial relationships that could be construed as a potential conflict of interest. The authors declare that this study received funding from China Nuclear Power Engineering Co., Ltd. The funder was not involved in the study design, collection, analysis, interpretation of data, the writing of this article or the decision to submit it for publication.

References

  1. Young, A.G.; Tate, L.A. Design of Liners for Reactor Vessels; Univeristy of Leicester: Leicester, UK, 1969. [Google Scholar]
  2. Ostapenko, A.; Umut, U. Post-Buckling Deflection Modes of Lining in Containment Vessels; Lehigh University: Bethlehem, PA, USA, 1969. [Google Scholar]
  3. Yan, J.; Cao, Z.; Lin, Y.; Yang, Y.; Sun, L. Stability performance of steel liner domes of nuclear reactor containment during construction. Nucl. Eng. Des. 2019, 351, 60–71. [Google Scholar] [CrossRef] [Scilit]
  4. Doyle, J.M.; Chu, S.L. Some structural considerations in the design of nuclear containment liners. Nucl. Eng. Des. 1971, 16, 294–300. [Google Scholar] [CrossRef] [Scilit]
  5. Armentrout, D.R.; Burdette, E.G. Analysis of behavior of steel liner anchorages. J. Struct. Div. 1982, 108, 1451–1463. [Google Scholar] [CrossRef] [Scilit]
  6. Burdette, E.G.; Gahinic, B. Containment Liner Anchor Load Tests. J. Struct. Eng. 1984, 110, 1–9. [Google Scholar] [CrossRef] [Scilit]
  7. Chan, H.C.; McMinn, S.J. The stabilisation of the steel liner of a prestressed concrete pressure vessel. Nucl. Eng. Des. 1966, 3, 66–73. [Google Scholar] [CrossRef] [Scilit]
  8. Kicher, T.P. Buckling of a stud-supported thin cylindrical liner shell encased in concrete. Nucl. Eng. Des. 1974, 26, 250–262. [Google Scholar] [CrossRef] [Scilit]
  9. Moon, Y.I.; Kicher, T.P. The plastic buckling of a steel liner encased in a concrete cylinder. Nucl. Eng. Des. 1977, 41, 281–291. [Google Scholar] [CrossRef] [Scilit]
  10. Lu, H.L.; Jin, X.F.; Li, Z.; Sun, J.Y. Mechanical Analysis of Modular Construction of Inner Containment Cylinder for EPR Nuclear Power Plant. Constr. Technol. 2013, 42, 35–38. [Google Scholar]
  11. Lu, H.L.; Li, Z.; Tan, J.; Jin, X.F. Mechanical Behavior Analysis of the Whole Construction Process of Inner Containment Cylinder for EPR Nuclear Power Plant. Ind. Constr. 2013, 43, 24–27. [Google Scholar]
  12. Ye, Y.; Shi, P.F.; Li, Z.; Tan, J.; Jin, X.F. Optimization Analysis on Modular Hoisting of Steel Liner for EPR Nuclear Power Plant Containment. Prog. Steel Build. Struct. 2013, 15, 60–64. [Google Scholar]
  13. Olowokere, O. Failure of stiffened steel liners for nuclear reactor containment structures under construction. Comput. Struct. 1984, 19, 669–672. [Google Scholar] [CrossRef] [Scilit]
  14. Davies, D.; Roberts, A.; Ness, D. A review of the design and construction of the Sizewell B pressurized water reactor building containment structures. Nucl. Eng. Des. 1995, 156, 259–268. [Google Scholar] [CrossRef] [Scilit]
  15. GB 50010-2010; Code for Design of Concrete Structures. China Architecture and Building Press: Beijing, China, 2010.
Figure 1. Schematic diagram of the containment steel liner anchorage system.
Buildings 16 02181 g001
Figure 2. Two anchorage forms of containment steel liner: (a) stud anchorage; (b) long-angle steel anchorage; (c) short-angle steel anchorage.
Buildings 16 02181 g002
Figure 3. Model setting of the contribution of long angle steel to the mechanical properties of steel liner anchorage system: (a) 0 pieces of long-angle steel; (b) 1 piece of long-angle steel; (c) 2 pieces of long-angle steel; (d) 3 pieces of long-angle steel.
Buildings 16 02181 g003
Figure 4. Model setting of the contribution of short-angle steel to the mechanical properties of steel liner anchorage system: (a) 0 pieces of short-angle steel; (b) 1 piece of short-angle steel; (c) 2 pieces of short-angle steel with standard spacing; (d) 2 pieces of short-angle steel with half spacing; (e) 3 pieces of short-angle steel.
Buildings 16 02181 g004
Figure 5. Model setting of the contribution of long-angle steel to the mechanical properties of steel liner anchorage systemL (a) 4 rows of studs; (b) 3 rows of studs (1 row of studs adjacent to the tension end is removed); (c) 3 rows of studs (1 middle row removed); (d) 2 rows of studs.
Buildings 16 02181 g005
Figure 6. Steel liner anchorage system numerical model.
Buildings 16 02181 g006
Figure 7. Steel plate stress simulation results for different element sizes: (a) 10 mm; (b) 20 mm; (c) 40 mm; (d) 60 mm; (e) 80 mm.
Buildings 16 02181 g007
Figure 8. Results of maximum elastic strain and ultimate bearing capacity of the steel plate with different global element sizes: (a) elastic strain; (b) ultimate bearing capacity.
Buildings 16 02181 g008
Figure 9. Boundary conditions and loading scheme of the numerical model.
Buildings 16 02181 g009
Figure 10. Comparison of test and simulated load-displacement results for SLA-all.
Buildings 16 02181 g010
Figure 11. Test results for SLA-all.
Buildings 16 02181 g011
Figure 12. Simulated stress results of SLA-all. (a) Steel liner plate; (b) Concrete.
Buildings 16 02181 g012
Figure 13. Simulated deformation results of SLA-all. (a) Steel liner plate; (b) Concrete.
Buildings 16 02181 g013
Figure 14. Simulated strain results of SLA-all. (a) Elastic strain; (b) Plastic strain.
Buildings 16 02181 g014
Figure 15. Comparison of test and simulated load-displacement results for SLA-s.
Buildings 16 02181 g015
Figure 16. Test results for SLA-s.
Buildings 16 02181 g016
Figure 17. Simulated stress results of SLA-s. (a) Steel liner plate. (b) Concrete.
Buildings 16 02181 g017
Figure 18. Simulated deformation results of SLA-s. (a) Steel liner plate. (b) Concrete.
Buildings 16 02181 g018
Figure 19. Simulated strain results of SLA-s (a) Elastic strain; (b) Plastic strain.
Buildings 16 02181 g019
Figure 20. Comparison of test and simulated load–displacement results for SLA-as-s0.
Buildings 16 02181 g020
Figure 21. Test results for SLA-as-s0. (a) Anchorage failure occurs near the tensile end of angle steel and concrete. (b) Both long angle steels exhibit anchorage failure.
Buildings 16 02181 g021
Figure 22. Simulated stress results of SLA-as-s0. (a) Steel liner plate. (b) Concrete.
Buildings 16 02181 g022
Figure 23. Simulated deformation results of SLA-as-s0. (a) Steel liner plate. (b) Concrete.
Buildings 16 02181 g023
Figure 24. Simulated strain results of SLA-as-s0. (a) Elastic strain. (b) Plastic strain.
Buildings 16 02181 g024
Figure 25. Comparison of test and simulated load–displacement results for SLA-as-l0.
Buildings 16 02181 g025
Figure 26. Test results for SLA-as-l0. (a) Overall view of the failed specimen; (b) Magnified partial view.
Buildings 16 02181 g026
Figure 27. Simulated stress results of SLA-as-l0. (a) Steel liner plate. (b) Concrete.
Buildings 16 02181 g027
Figure 28. Simulated deformation results of SLA-as-l0. (a) Steel liner plate. (b) Concrete.
Buildings 16 02181 g028
Figure 29. Simulated strain results of SLA-as-l0. (a) Elastic strain; (b) Plastic strain.
Buildings 16 02181 g029
Figure 30. Load–displacement results of long angle steels.
Buildings 16 02181 g030
Figure 31. Load–displacement results of short-angle steels.
Buildings 16 02181 g031
Figure 32. Load–displacement results of studs.
Buildings 16 02181 g032
Table 1. Designation and definition of all specimens.
DesignationDefinition
SLA-allSteel Liner Anchorage system with all angle steels and studs
SLA-asAngle-Steel-Only steel liner anchorage system
SLA-as-l0Angle-Steel-Only steel liner anchorage system (No Long-Angle Steels)
SLA-as-l1Angle-Steel-Only steel liner anchorage system (1 Long-Angle Steel)
SLA-as-l2Angle-Steel-Only steel liner anchorage system (2 Long-Angle Steels)
SLA-as-l3Angle-Steel-Only steel liner anchorage system (3 Long-Angle Steels)
SLA-as-s0Angle-Steel-Only steel liner anchorage system (0 Short-Angle Steels)
SLA-as-s1Angle-Steel-Only steel liner anchorage system (1 Short-Angle Steel)
SLA-as-s2Angle-Steel-Only steel liner anchorage system (2 Short-Angle Steels)
SLA-as-s2-halfAngle-Steel-Only steel liner anchorage system (2 Short-Angle Steels, 1/2 standard spacing)
SLA-as-s3Angle-Steel-Only steel liner anchorage system (3 Short-Angle Steels)
SLA-sStud-Only steel liner anchorage system
SLA-s-4Stud-Only steel liner anchorage system (4 Rows of Studs)
SLA-s-3Stud-Only steel liner anchorage system (3 Rows of Studs)
SLA-s-3-midStud-Only steel liner anchorage system (3 Rows of Studs, 1 Middle Row removed)
SLA-s-2Stud-Only steel liner anchorage system (2 Rows of Studs)
Table 2. Input parameters of the CDP model.
Dilation AngleEccentricityfb0/fc0KViscosity Parameter
340.11.160.66670.008
Table 3. The tensile and compressive parameters of the nonlinear springs.
Deformation/mm−2.2−1.6−1.0−0.200.82.23.34.4
Force/kN−12.8−11.4−10.5−6.106.29.211.011.8
Table 4. The connector parameters of short angle steels.
Deformation/mm−4−2−0.4−0.100.10.424
Force/kN−1.8−2.4−3.1−2.402.43.12.21.6
Table 5. The connector parameters of long angle steels.
Deformation/mm−4.6−3.4−1.6−0.100.22
Force/kN−0.5−1.4−9.4−2.402.420.0
Table 6. Bearing capacity with different long angle steel quantities.
CasesBearing CapacityBearing Capacity Contribution Ratio
kN%
SLA-as-l0233100%
SLA-as-l1672288%
SLA-as-l21165499%
SLA-as-l31421608%
Table 7. Bearing capacity with different short-angle steel quantities.
CasesBearing CapacityBearing Capacity Contribution Ratio
(kN)%
SLA-as-s0912100%
SLA-as-s11049115%
SLA-as-s21165128%
SLA-as-s2-half1163127%
SLA-as-s31238136%
Table 8. Bearing capacity with different stud quantities.
CasesBearing CapacityBearing Capacity Contribution Ratio
(kN)%
SLA-s-41043100%
SLA-s-386283%
SLA-s-3-mid86283%
SLA-s-269567%
Disclaimer/Publisher’s Note: The statements, opinions and data contained in all publications are solely those of the individual author(s) and contributor(s) and not of MDPI and/or the editor(s). MDPI and/or the editor(s) disclaim responsibility for any injury to people or property resulting from any ideas, methods, instructions or products referred to in the content.