2.1. Conceptual Basis for Optical Evaluation of Initial GO Dispersion
The initial dispersion state of GO suspension is a key factor influencing its subsequent effectiveness in cementitious materials. Before GO comes into contact with cement particles and pore solution, the suspension already contains GO sheets and agglomerates with different sizes, projected morphologies, and spatial distributions. These initial features determine, to a large extent, how much GO surface and boundary structure can remain physically accessible at the beginning of hydration. Therefore, a quantitative description of the initial dispersion state is necessary for comparing different commercial GO products under the same dosage and mixing conditions.
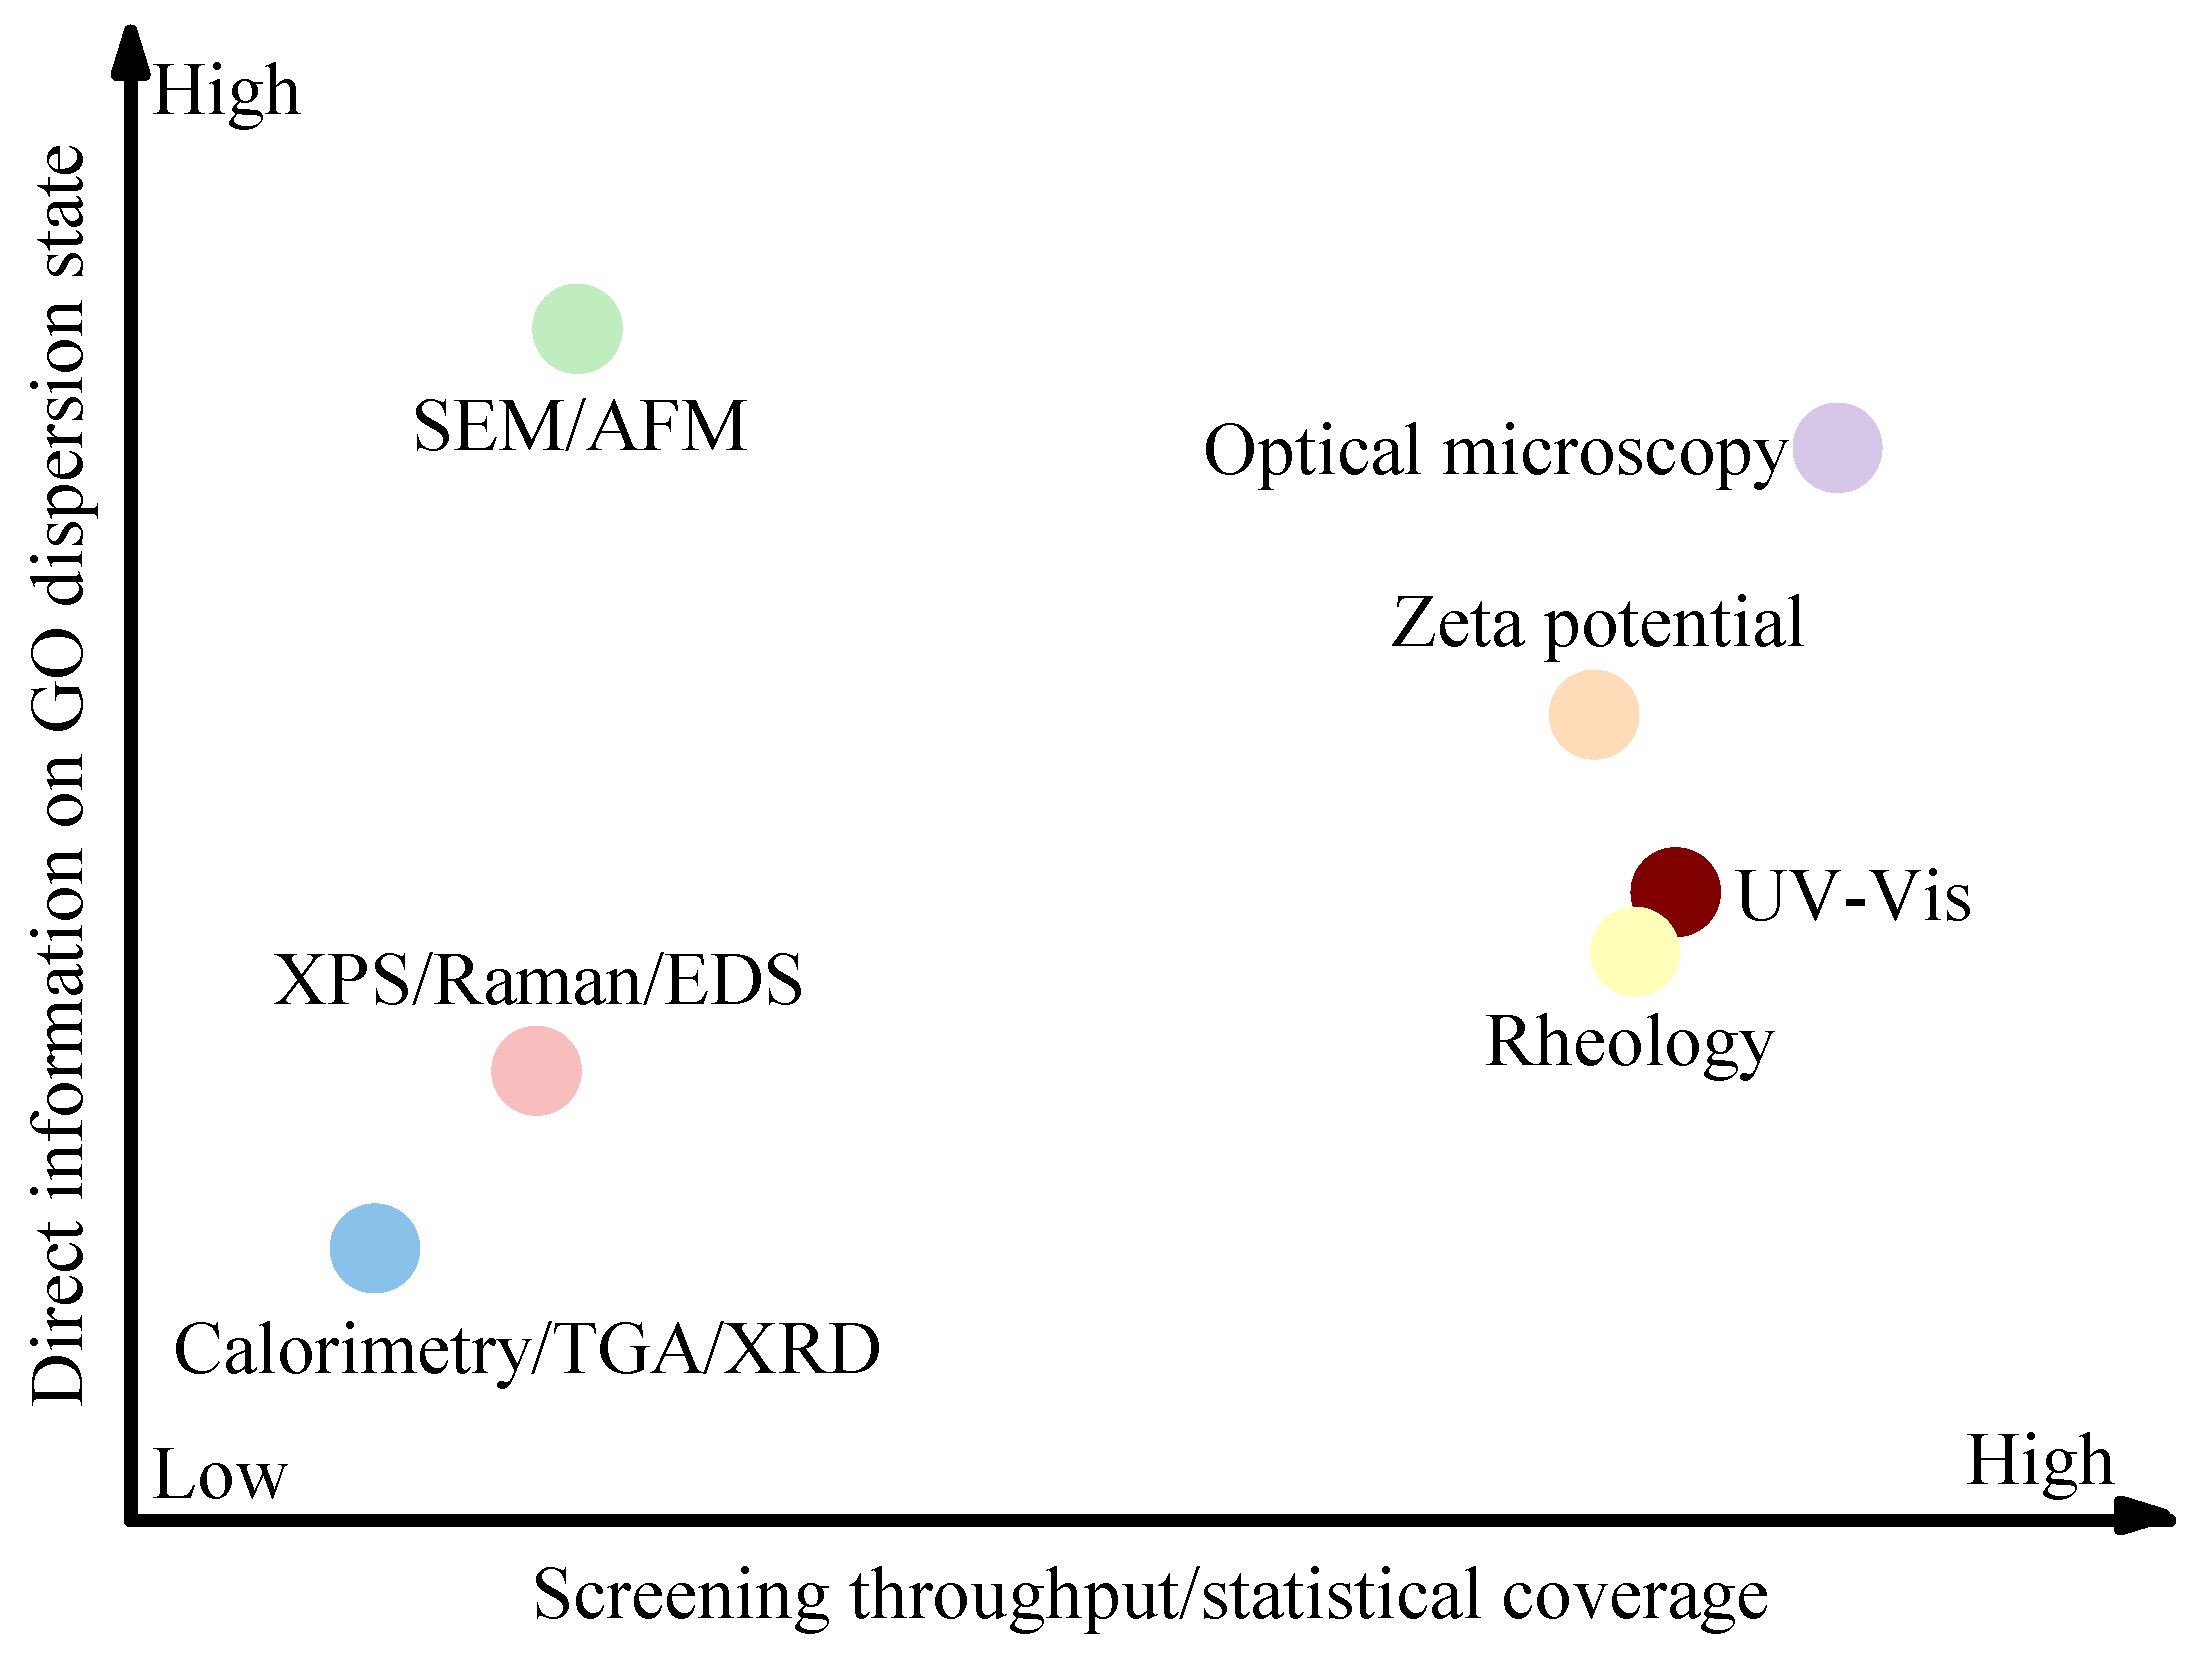
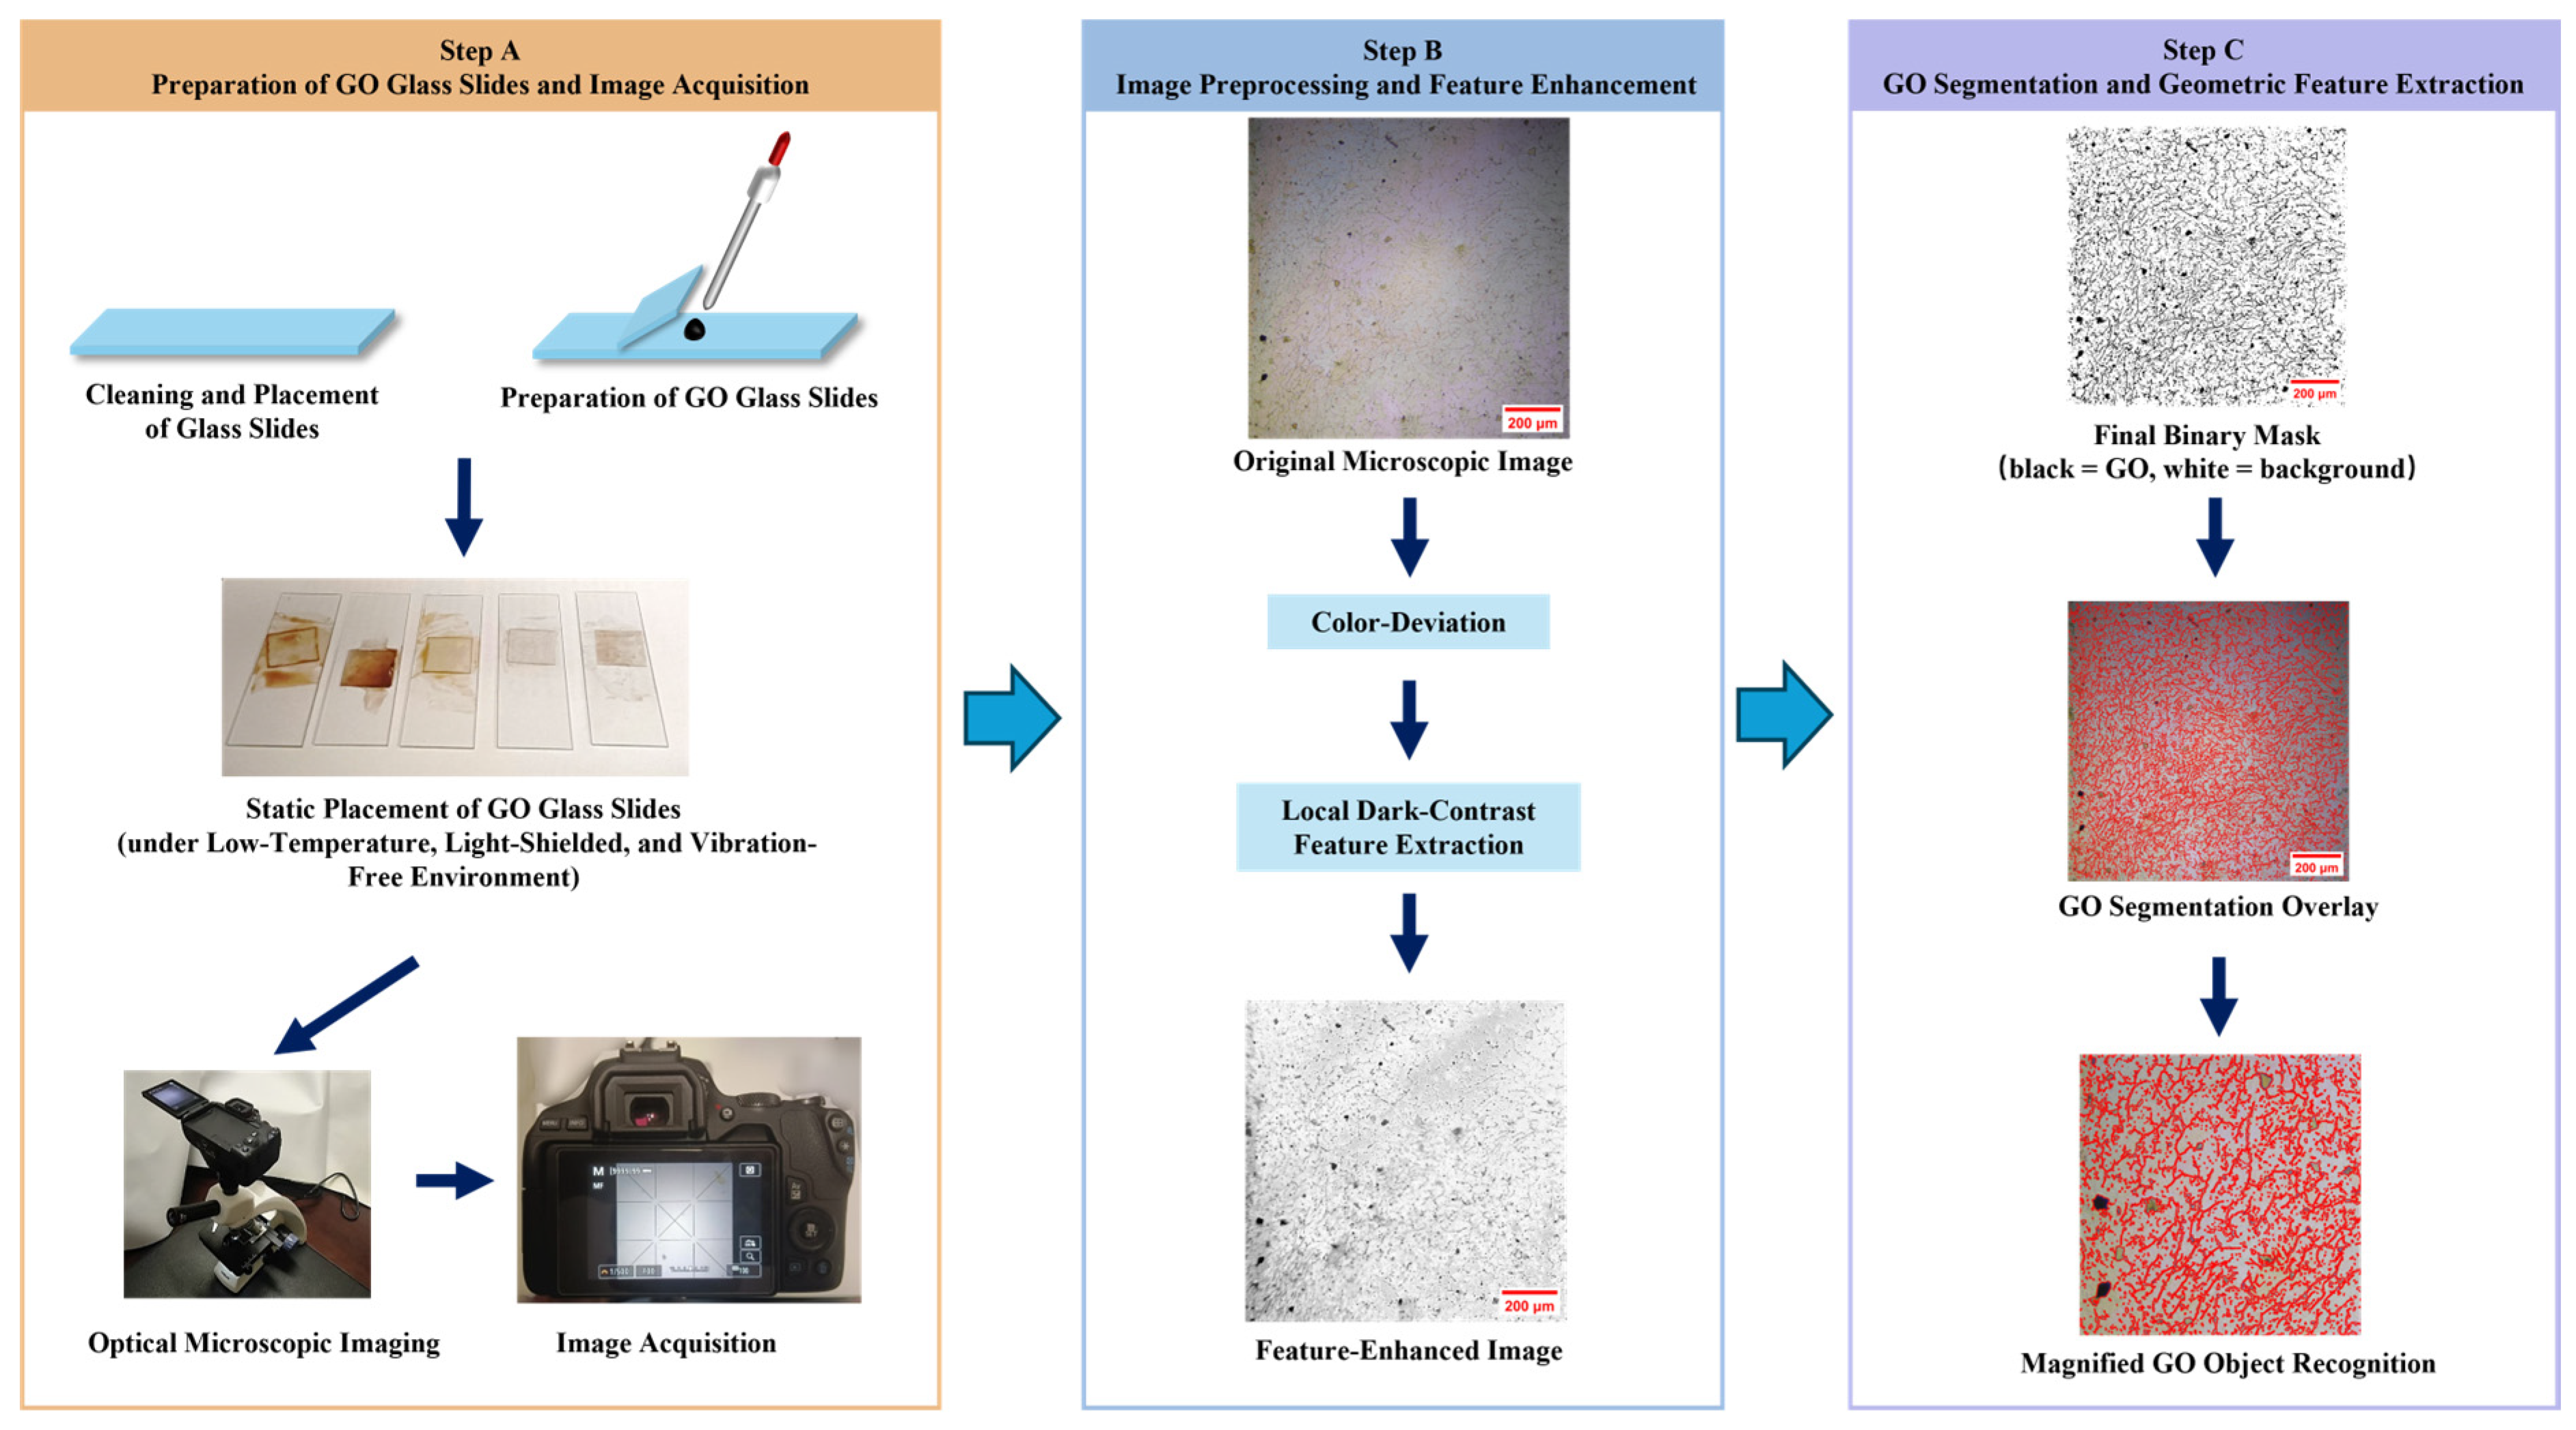
Optical microscopy provides a practical method for this purpose because it can capture a large number of fields of view and directly record the projected morphology of GO sheets or agglomerates in the suspension state. However, optical microscopy should not be interpreted as a direct chemical characterization technique. It cannot directly measure oxygen content, functional group density, surface charge, or the actual hydration activity of GO in cementitious pore solution. In this study, optical microscopy is therefore used as a geometric dispersion-evaluation tool. The information extracted from optical images is limited to the visible projected area, projected boundary, object size distribution, and spatial distribution of GO regions.
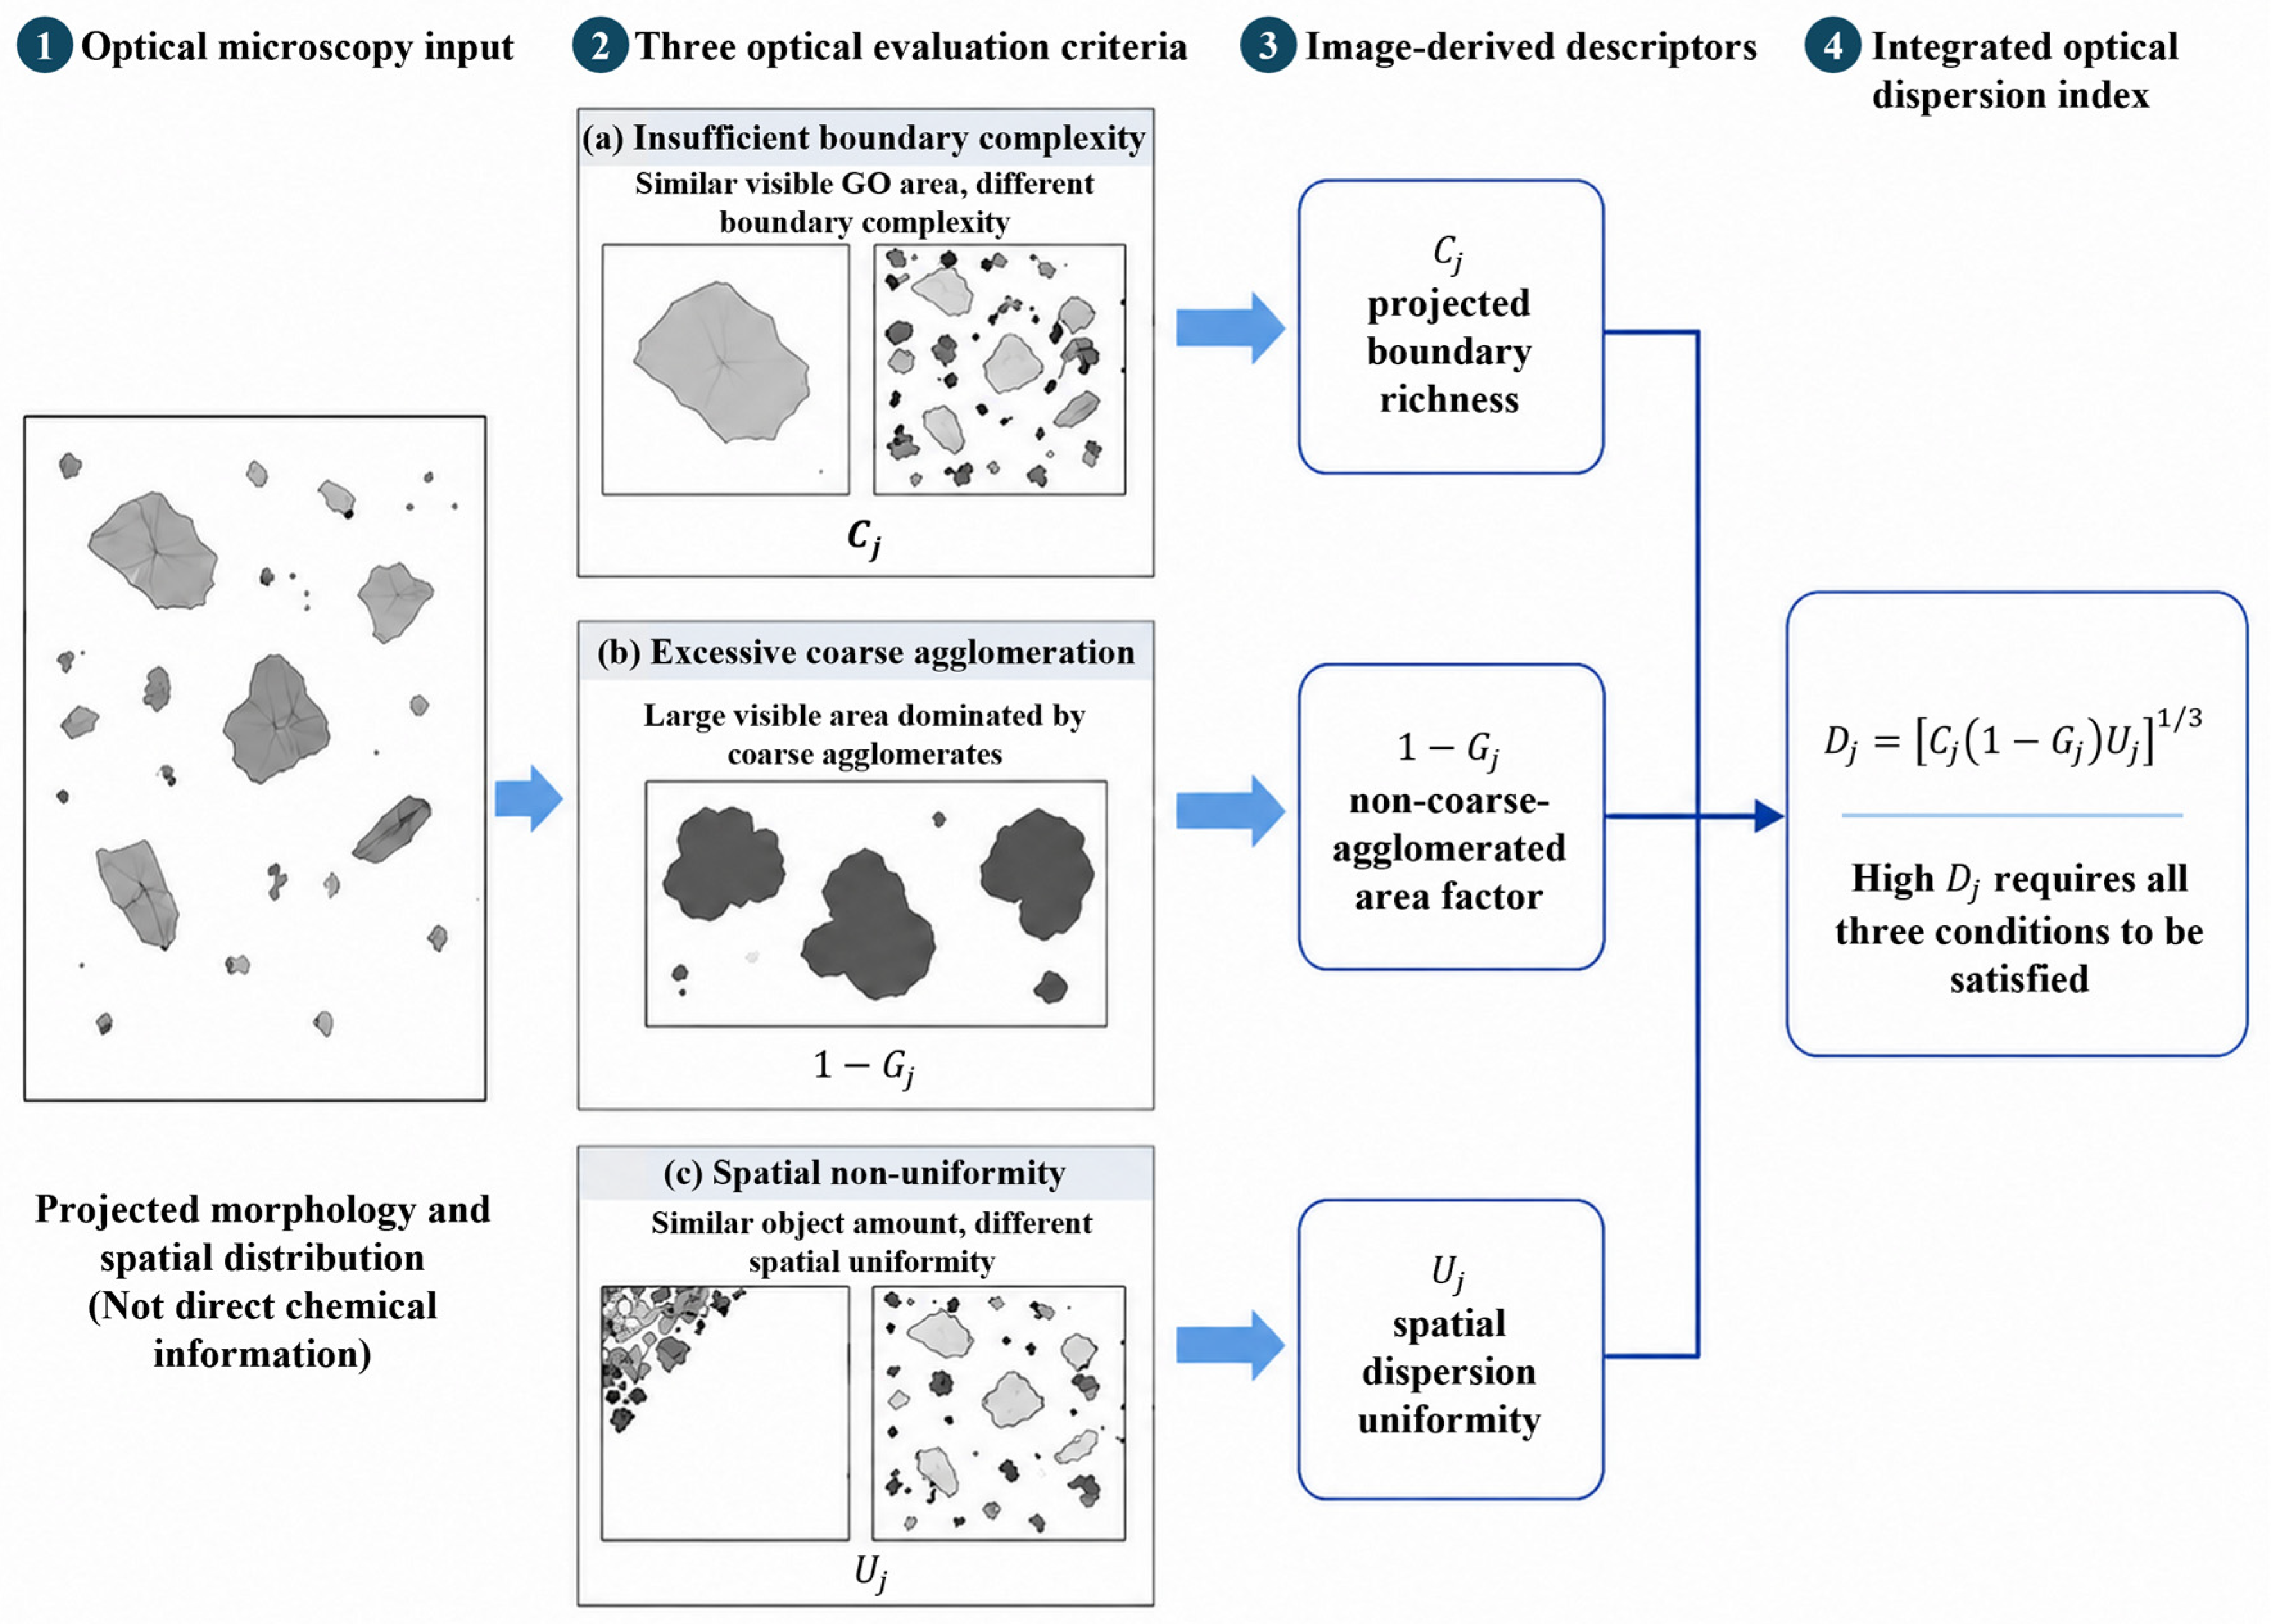
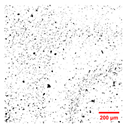
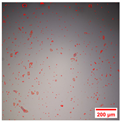
A major challenge is that the initial dispersion quality of GO cannot be reliably evaluated using a single optical quantity. For example, a larger visible GO area in an optical image does not necessarily indicate better dispersion. If most of the visible area is contributed by a few large agglomerates, the GO is still poorly dispersed. Similarly, two images may contain similar total projected GO areas, but one may consist of many small and finely distributed objects while the other may contain only a few large flakes. These two cases should not be regarded as equivalent because the former provides richer projected boundaries and a finer optically detected morphology. In addition, even when the object size distribution appears acceptable, GO regions may still be concentrated in a limited part of the observation field, indicating poor spatial uniformity. Therefore, the optical evaluation of GO initial dispersion should consider three complementary aspects, as illustrated in
Figure 1.
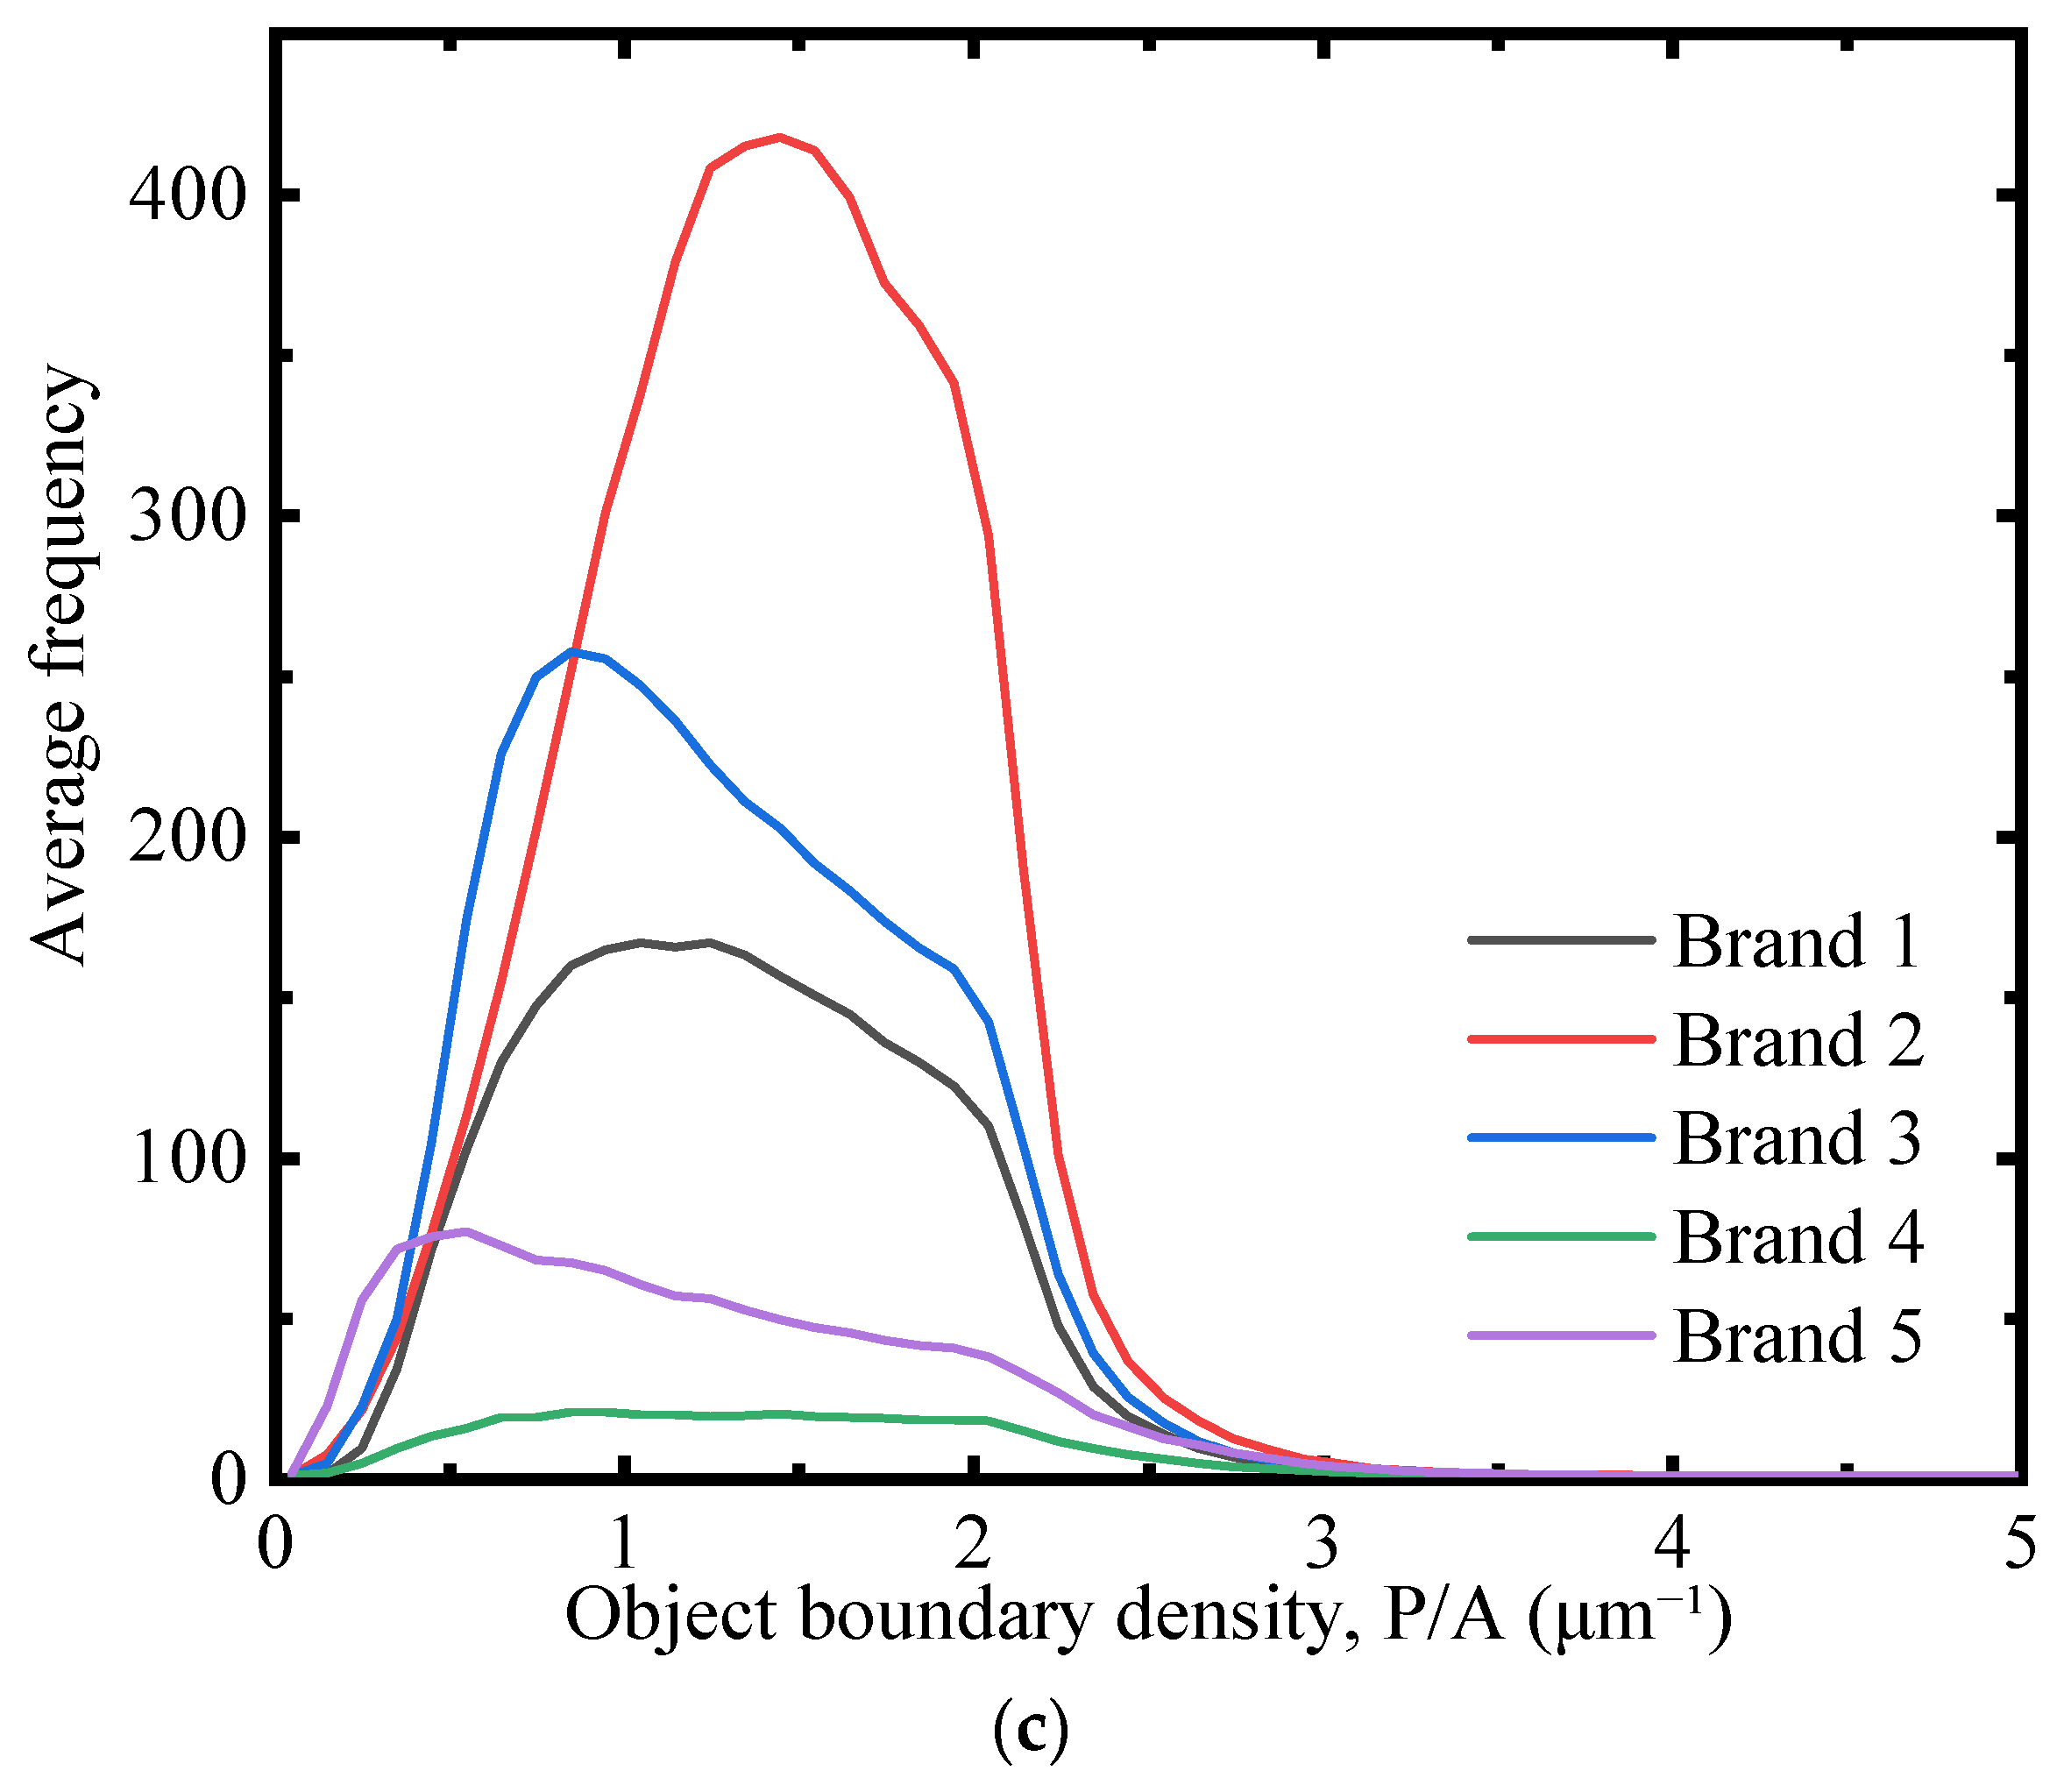
The first aspect is projected boundary richness. Under the same visible GO area, a suspension containing finer sheets or smaller agglomerates generally exhibits a larger projected boundary length per unit projected area. This feature reflects the degree to which the optically detected GO morphology is divided into finer objects rather than dominated by large projected regions. The second aspect is coarse agglomeration. A high projected GO area may be misleading if a large fraction of that area belongs to coarse agglomerates. Such agglomerates indicate insufficient separation of GO sheets and should be penalized in the dispersion evaluation. Therefore, the area fraction of large GO objects is used to represent the extent of coarse agglomeration, while its complementary value represents the fraction of GO area not dominated by coarse agglomerates. The third aspect is spatial distribution uniformity. A well-dispersed GO suspension should not only contain small or finely divided objects, but should also show these objects distributed across the observation field. If GO regions are concentrated locally, the suspension is spatially heterogeneous even when the total visible GO area or object count is high. Thus, the variation of GO area fraction among different sub-regions of the same image can be used to describe spatial non-uniformity.
These three aspects correspond to three common failure modes in optical dispersion evaluation: insufficient boundary richness, excessive coarse agglomeration, and uneven spatial distribution. Since they represent different and non-substitutable requirements for good dispersion, they should be considered together rather than separately. A GO product can be regarded as having a high initial optical dispersion quality only when it simultaneously exhibits rich projected boundaries, limited coarse agglomeration, and relatively uniform spatial distribution.
2.2. Image-Derived Descriptors for Three Dispersion Requirements
For the
j-th GO product,
optical micrographs were analyzed under the same sample preparation, imaging, and segmentation protocol. In the
k-th image, each segmented GO object is denoted as object
i, with projected area
and projected perimeter
. These object-level geometric quantities were used to construct image-level descriptors and were then averaged at the product level. This image-first calculation strategy was adopted to avoid bias caused by different numbers of images among GO products. As discussed in
Section 2.1, a reliable optical evaluation of initial GO dispersion should not depend on a single visible-area descriptor. Instead, it should simultaneously consider three necessary requirements: sufficient projected boundary richness, limited coarse agglomeration, and relatively uniform spatial distribution. Accordingly, three image-derived descriptors were constructed.
2.2.1. Projected Boundary Richness
The first requirement for a well-dispersed GO suspension is that the optically detected GO morphology should be sufficiently divided into fine sheets or small agglomerates rather than dominated by a few large projected regions. Under optical microscopy, this difference can be reflected by the projected boundary length per unit projected GO area. For example, two images may have similar total visible GO areas, but the image containing many small GO sheets will produce a larger total projected boundary length than the image containing only a few large flakes. Therefore, the ratio between the total perimeter and the total projected area of segmented GO objects was used to describe the projected boundary richness of each image:
where
is the projected boundary density of the
k-th image for the
j-th GO product. A larger
indicates that, within the same projected GO area, the detected GO morphology contains richer boundaries and is therefore optically finer. The image-level values were then averaged for each GO product:
Because the absolute value of
depends on image magnification, segmentation parameters, and pixel calibration, it was normalized within the tested GO product set:
where
is defined as the normalized projected boundary density factor.
ranges from 0 to 1 within the present product set, and a larger value indicates richer projected boundary availability. It should be noted that
is an optical morphology descriptor. It does not directly measure nanoscale edge defects, oxygen-containing groups, or chemical activity.
2.2.2. Coarse-Agglomerate Area Fraction
The second requirement is that the visible GO area should not be mainly contributed by coarse agglomerates. A large projected GO area may be misleading if most of that area belongs to a few large objects. In such a case, the suspension may appear to contain a large amount of GO in the optical field, but the GO sheets are not sufficiently separated. Therefore, coarse agglomeration must be introduced as a penalty in the dispersion evaluation.
To quantify this effect, a coarse-agglomerate area threshold
was introduced. Segmented GO objects with projected areas larger than or equal to
were regarded as coarse agglomerates under the present optical segmentation protocol. For the
k-th image of the
j-th GO product, the coarse-agglomerate area fraction was calculated as:
where
is an indicator function. It equals 1 when the projected area of object
i is larger than or equal to
, and equals 0 otherwise.
The product-level coarse-agglomerate area fraction was obtained by averaging the image-level values:
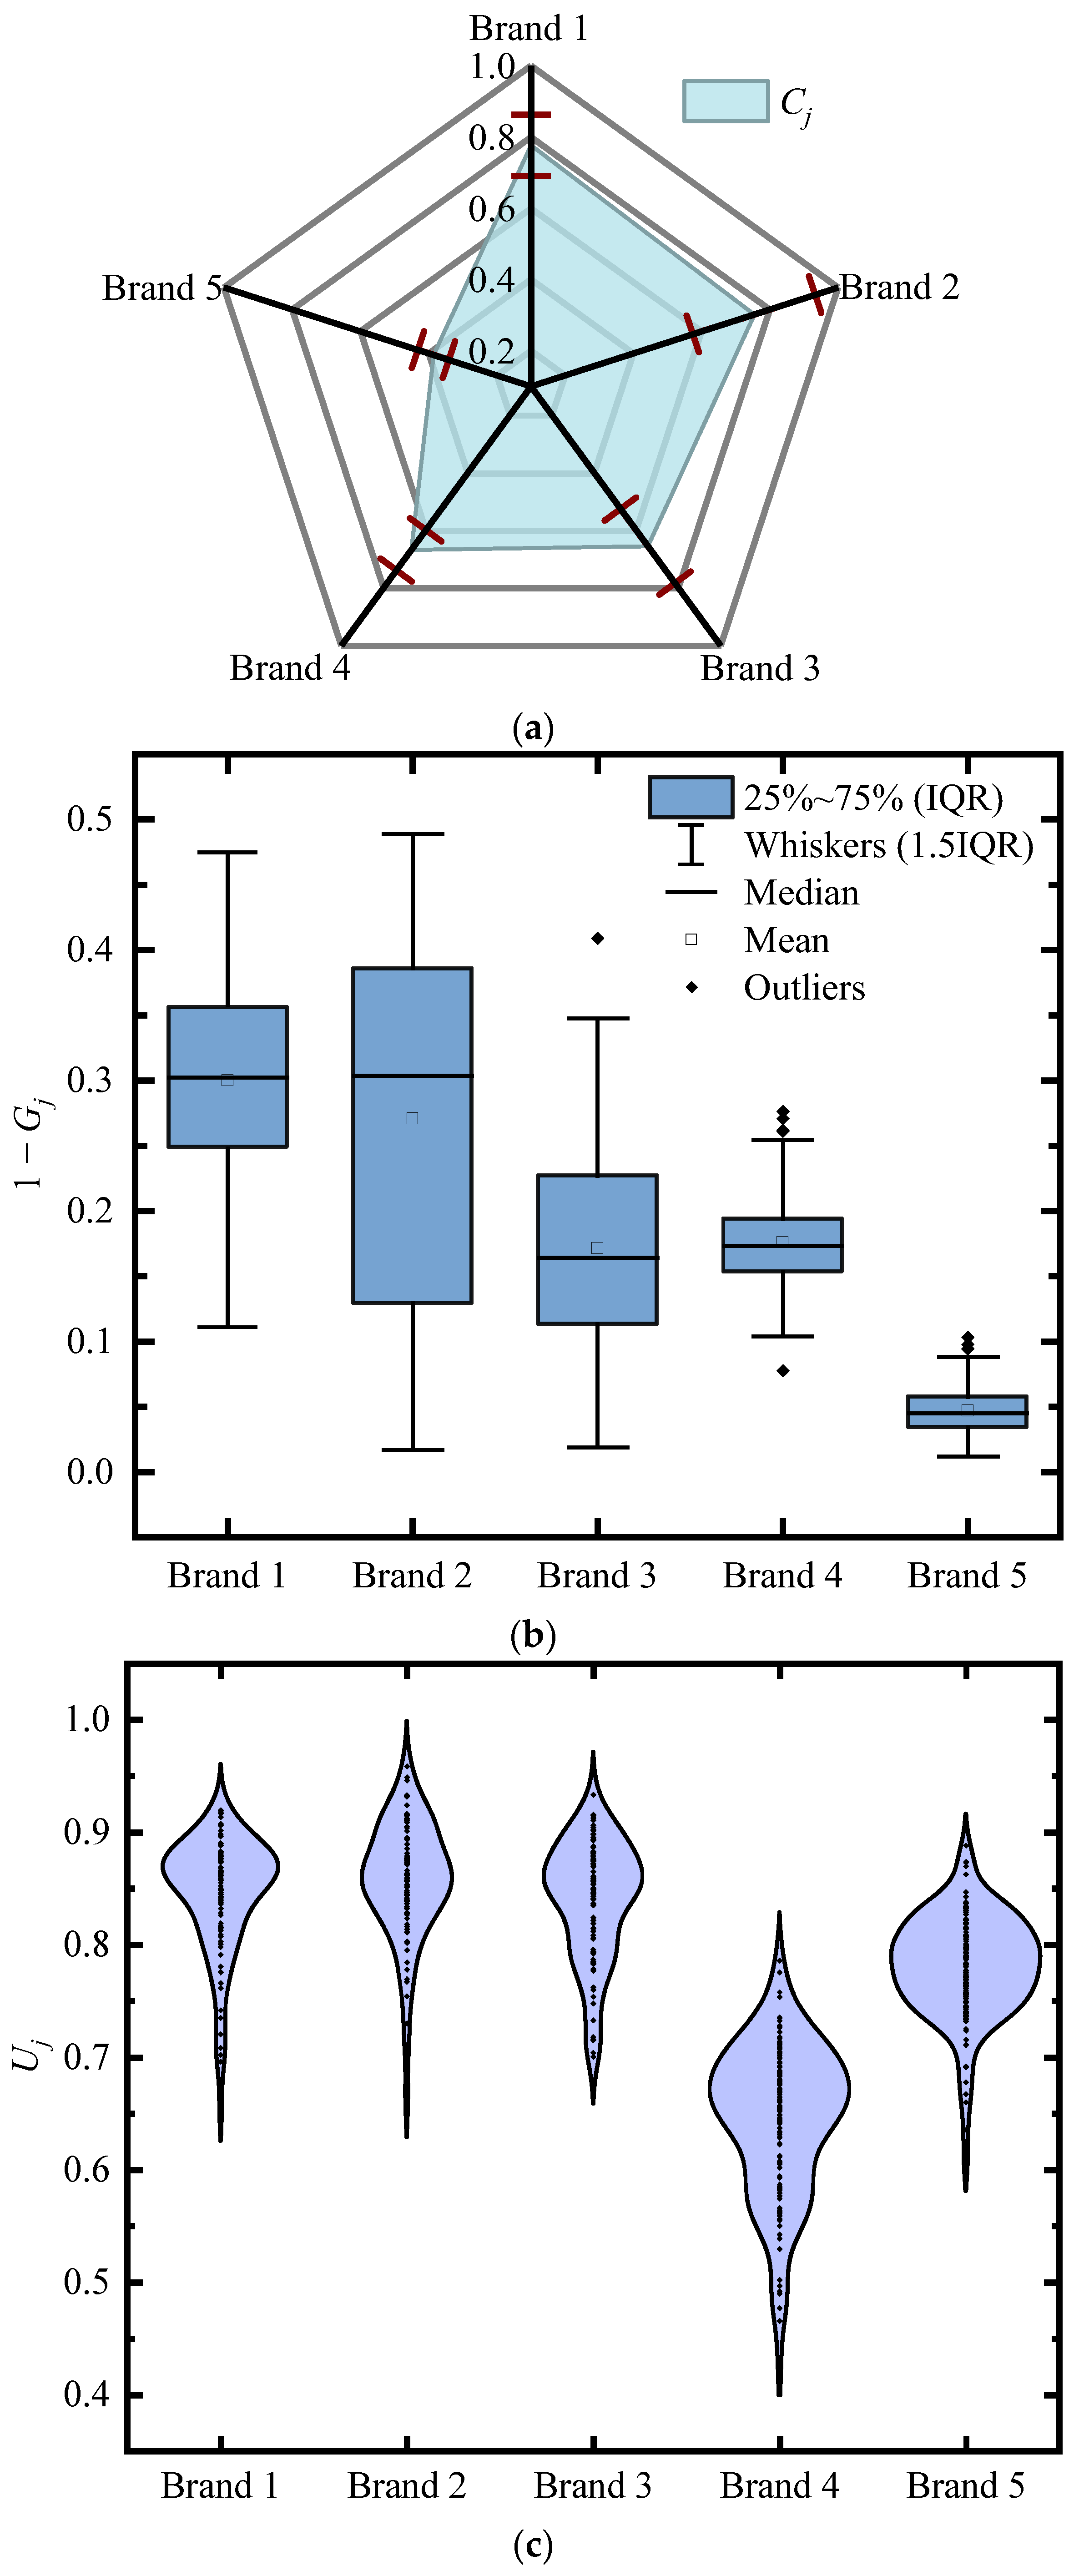
A larger indicates that a larger proportion of the detected GO area is contained in coarse agglomerates, corresponding to poorer optical dispersion. Since the final dispersion index should increase with better dispersion quality, the complementary term was used as the positive descriptor. This term is defined as the non-coarse-agglomerated area factor. A larger means that a larger fraction of the visible GO area is not dominated by coarse agglomerates.
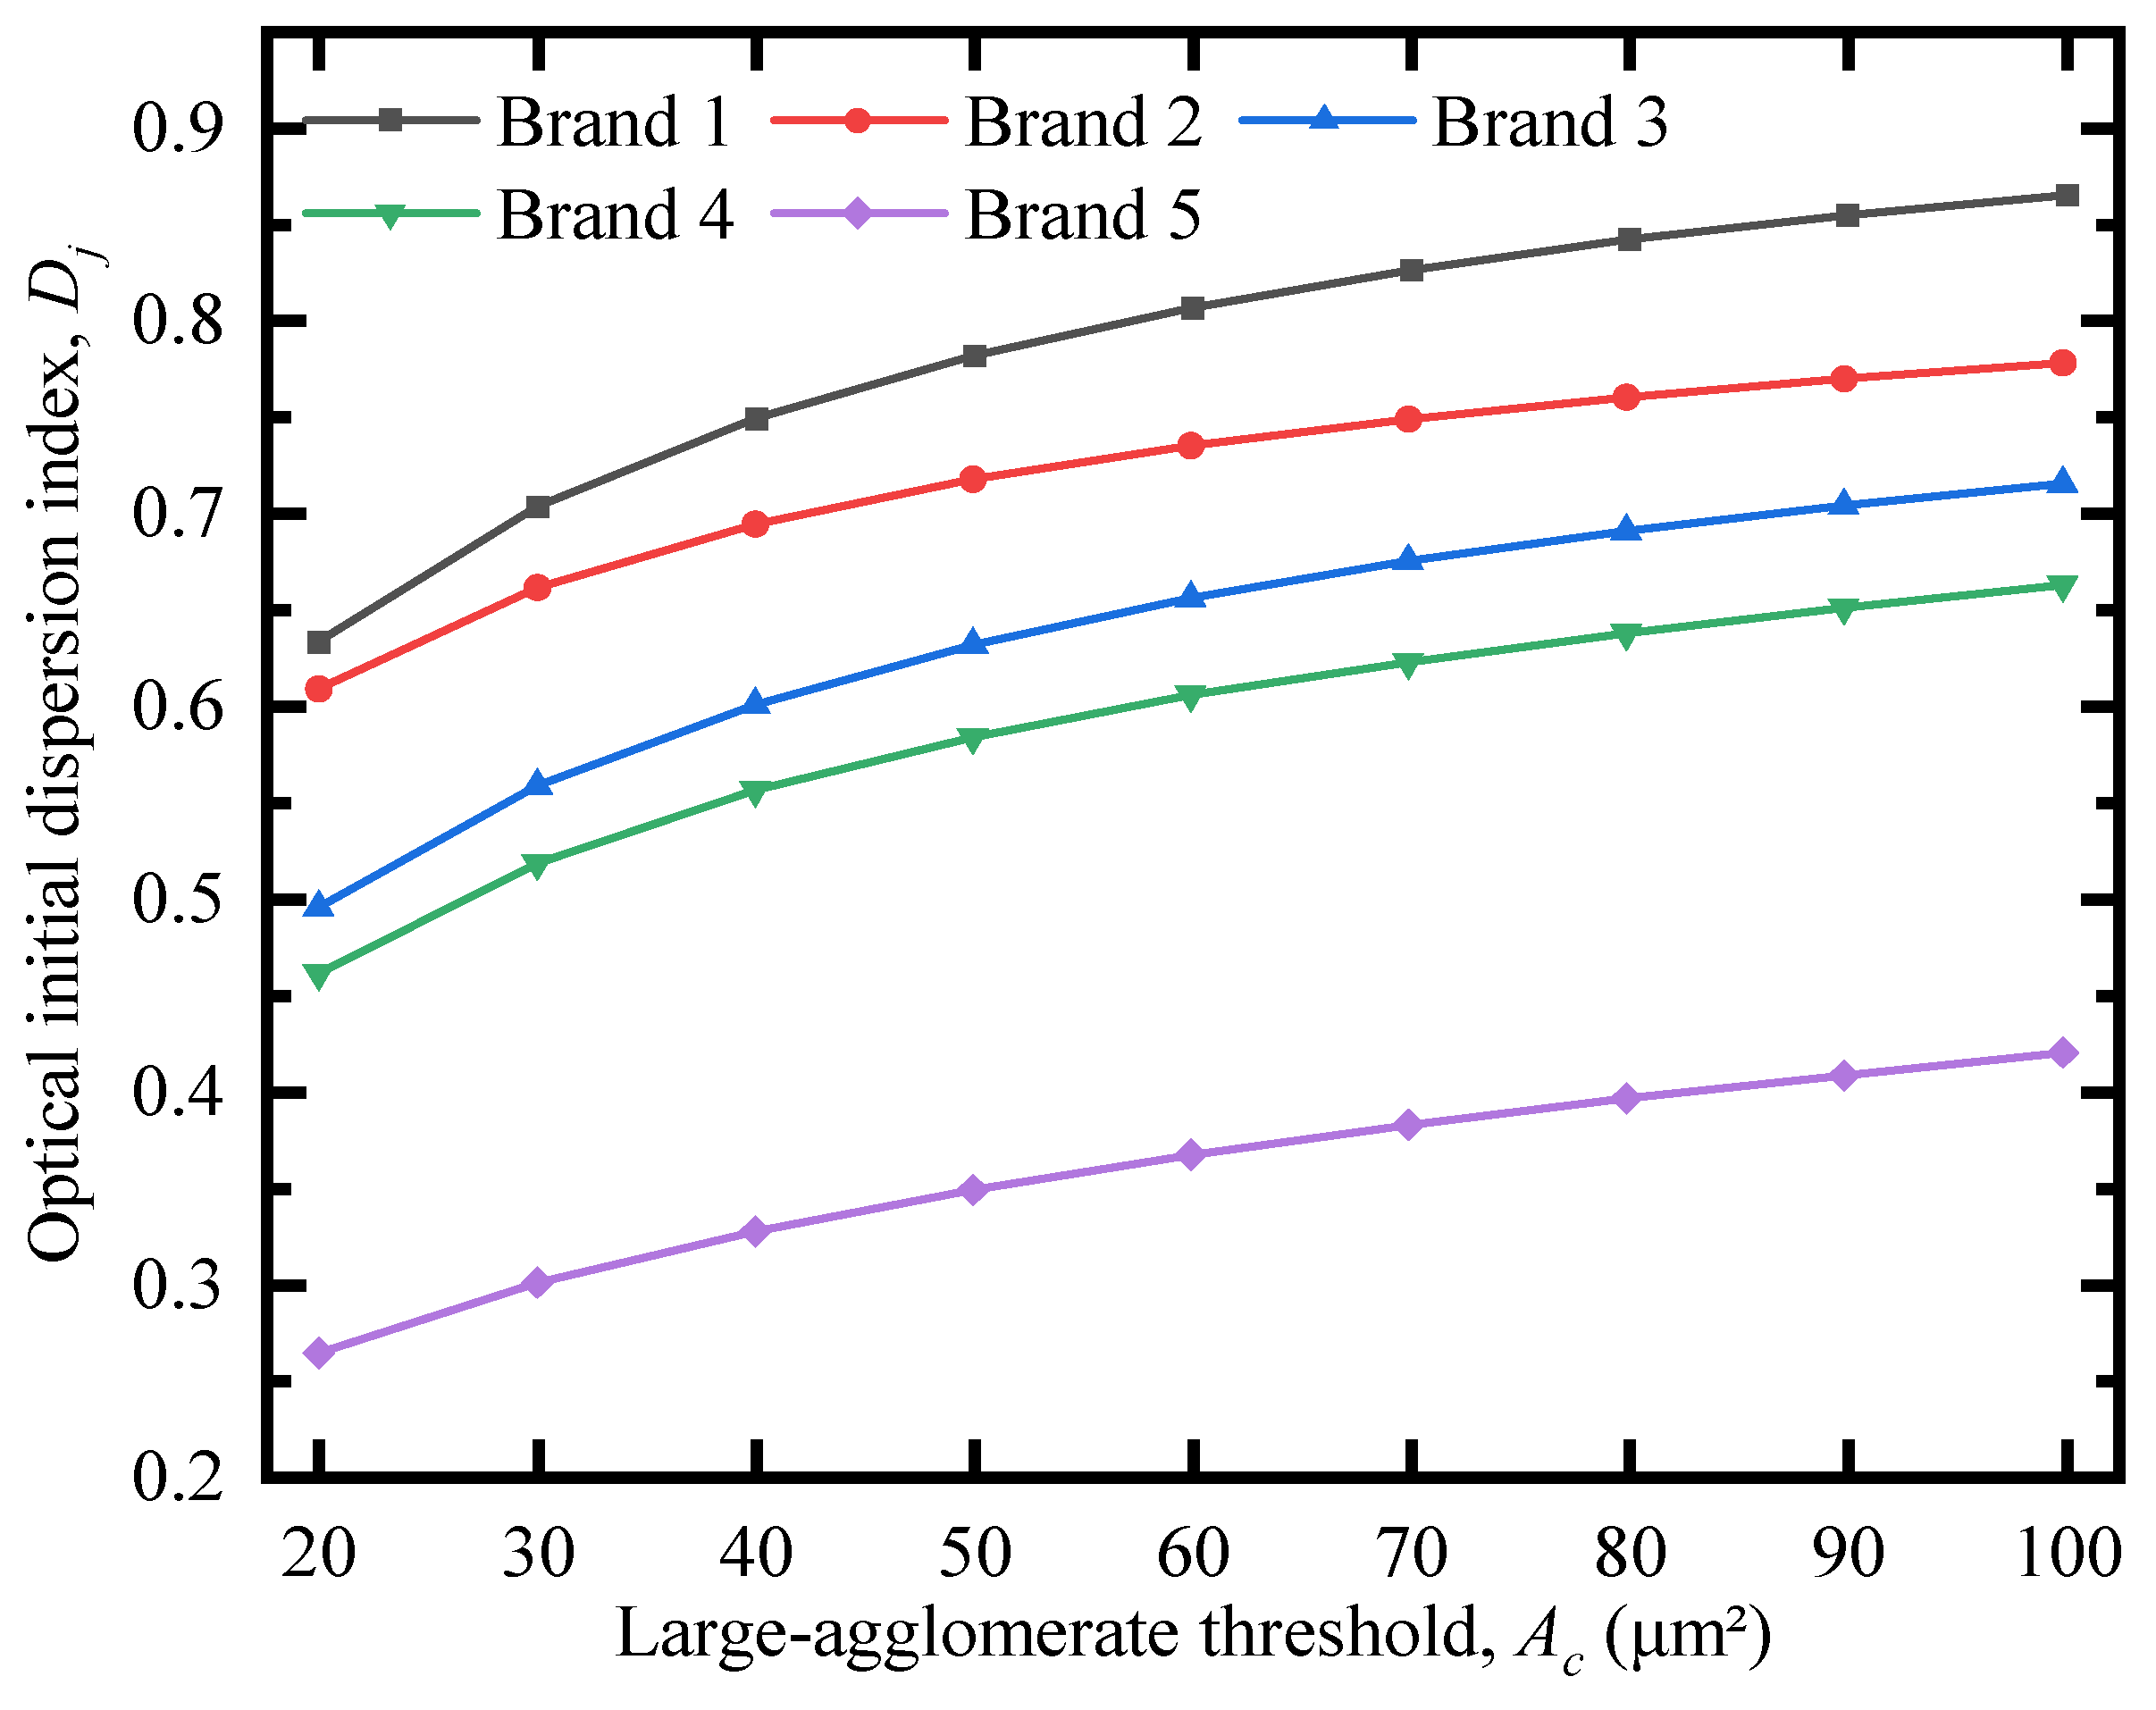
In the main calculation of this study, was used as the baseline coarse-agglomerate threshold. Because the selection of may influence the numerical value of , a threshold sensitivity analysis was further conducted in the Results section to examine whether the final dispersion ranking remained stable over a broader range of .
2.2.3. Spatial Dispersion Uniformity
The third requirement is spatial uniformity. Even if the detected GO objects are small and the coarse-agglomerate fraction is limited, the suspension may still be poorly dispersed if GO regions are concentrated in only part of the optical field. Therefore, the spatial distribution of GO objects should also be quantified.
To evaluate spatial uniformity, each optical micrograph was divided into equal sub-regions. The GO area fraction in the
q-th sub-region of the
k-th image for the
j-th product was calculated as:
where
is the total projected area of segmented GO objects within the
q-th sub-region, and
is the area of that sub-region.
The spatial heterogeneity of each image was then described using the coefficient of variation of
among all sub-regions:
A larger
indicates stronger spatial fluctuation of GO area fraction and therefore poorer spatial uniformity. To convert this heterogeneity measure into a positive uniformity factor, the following transformation was used:
Thus,
decreases as spatial heterogeneity increases. The product-level spatial dispersion uniformity factor was obtained as:
where
approaches 1 when the GO area fraction is relatively uniform among sub-regions, and decreases when GO objects are locally clustered.
2.2.4. Integration into the Optical Initial Dispersion Quality Index
The three descriptors above represent different and non-substitutable requirements for good initial dispersion. describes whether the projected GO morphology contains rich boundaries; penalizes the dominance of coarse agglomerates; and evaluates whether the detected GO regions are spatially uniform.
An additive form was not adopted because it would allow a high value in one descriptor to compensate for a poor value in another. For example, a sample with high boundary richness but severe coarse agglomeration should not be evaluated as well dispersed. Similarly, a sample with limited agglomeration but strong local clustering should also be penalized. Therefore, the final index was constructed using a multiplicative geometric-mean form:
where
is defined as the optical initial dispersion quality index of the
j-th GO product.
This formulation ensures that a high can only be obtained when the GO product simultaneously exhibits rich projected boundaries, a low coarse-agglomerate area fraction, and relatively uniform spatial distribution. If any one of the three descriptors is poor, the final value of will decrease accordingly. Therefore, reflects the short-board effect of optical dispersion quality rather than a simple accumulation of independent image features.
It should be emphasized that is a relative optical index for GO products evaluated under the same preparation, imaging, and segmentation protocol. It is not an absolute material constant. If additional GO products are introduced or if the imaging and segmentation conditions are changed, the normalization of and the resulting should be recalculated.
2.3. Strength-Relevance Hypothesis and Reduced Empirical Response Model
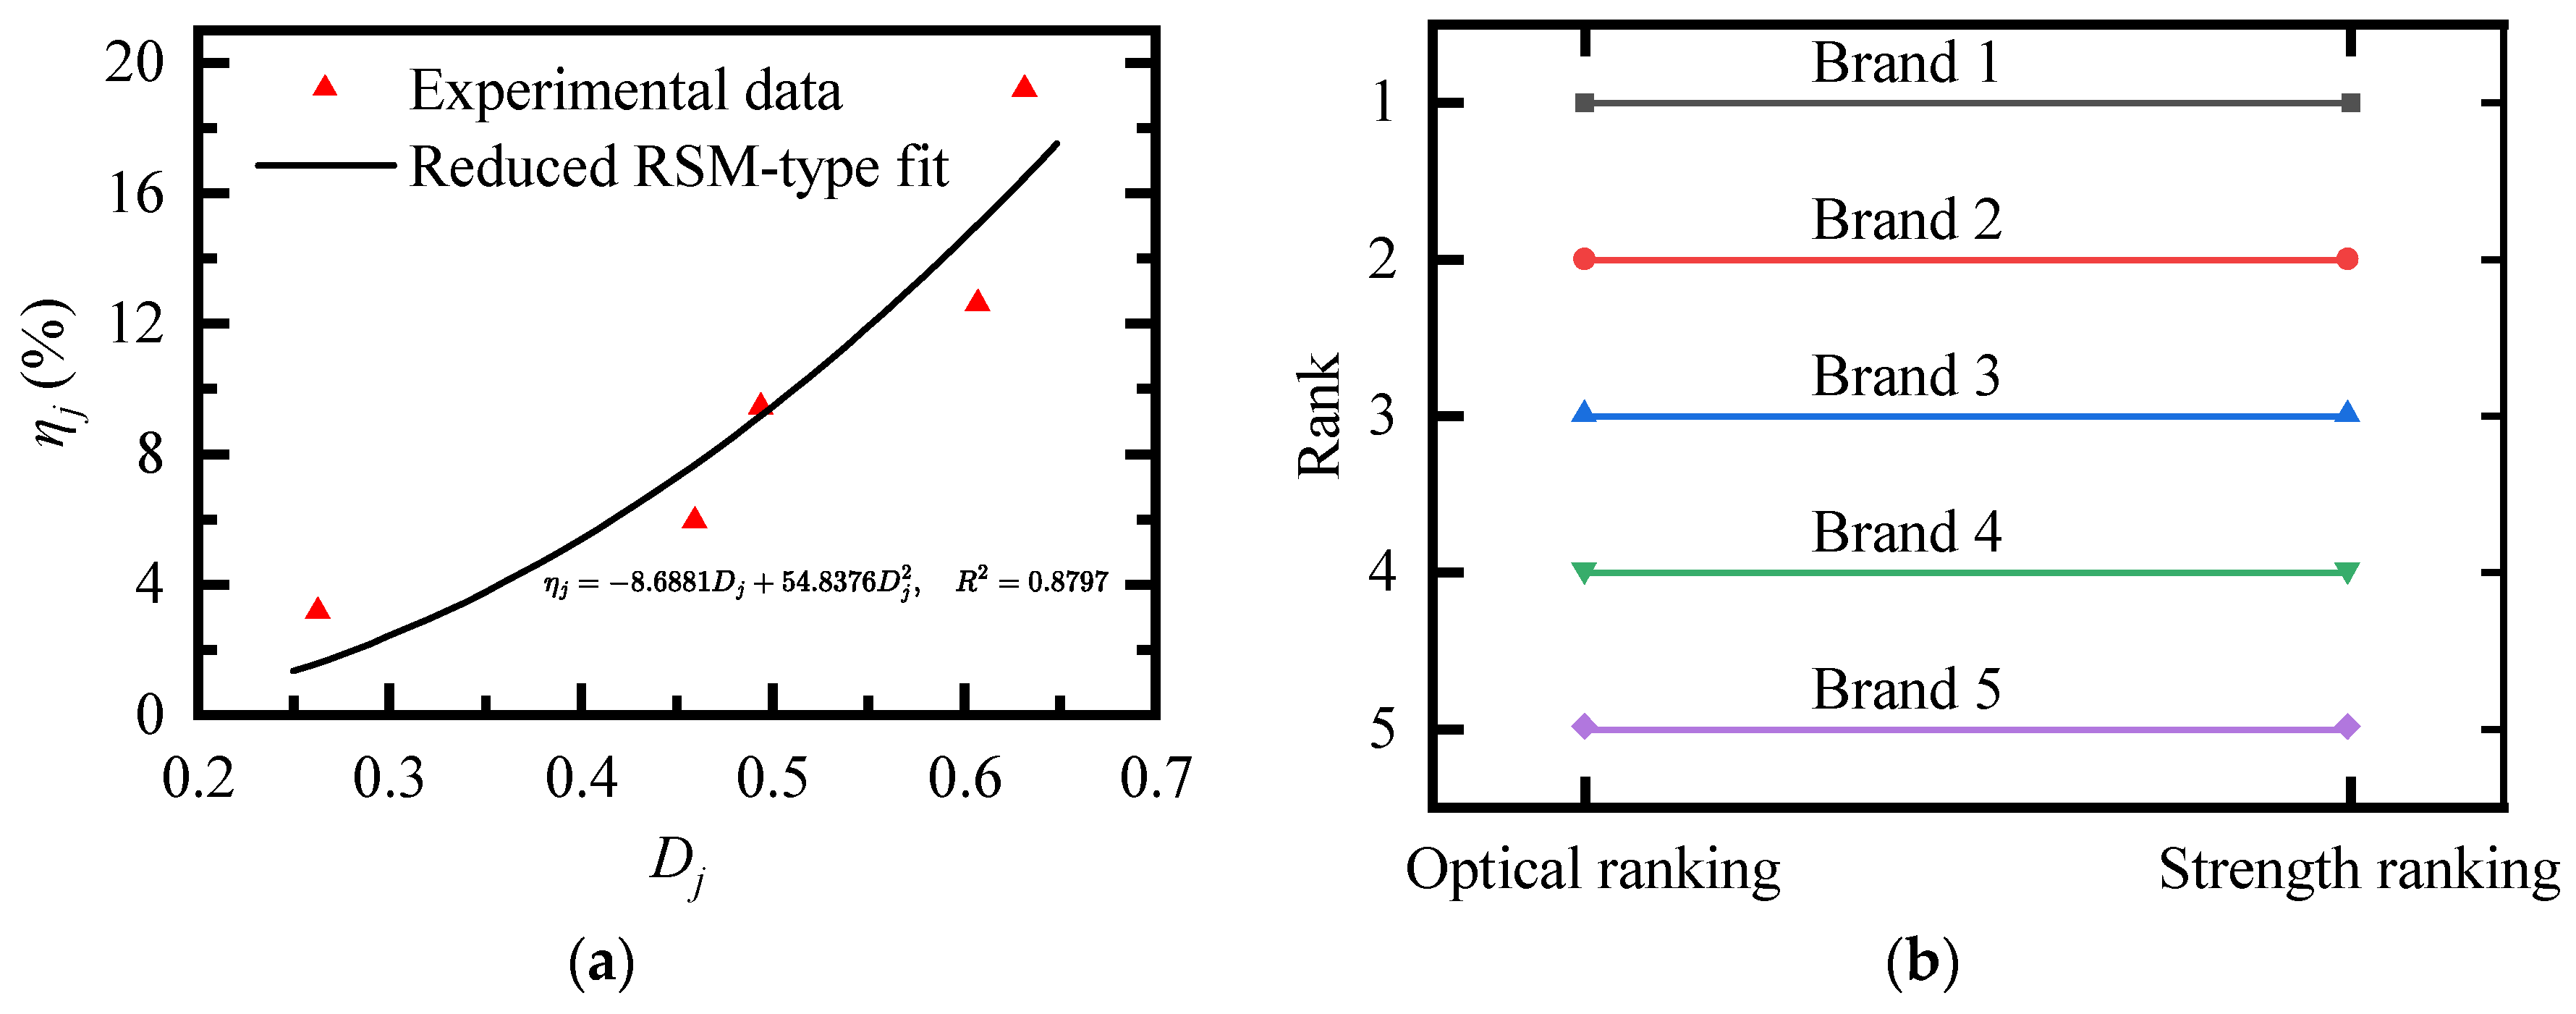
The descriptors defined above provide an optical evaluation of the initial dispersion state of GO suspensions. After establishing the image-derived dispersion ranking, the 3-day compressive strength results were further used to examine whether the optical ranking was consistent with early-age mechanical performance under the fixed experimental conditions. This analysis was intended to assess the engineering relevance of the proposed optical index, rather than to redefine the primary objective of the study as strength prediction. Accordingly, a strength-relevance hypothesis was introduced: under fixed GO dosage, mixture proportion, curing condition, and testing age, a GO product with a higher optical initial dispersion quality index is expected to show higher early-age strength enhancement.
In cementitious materials, response surface methodology (RSM) has been widely used to describe the relationship between mixture variables and performance responses, such as compressive strength. Following the general second-order polynomial form commonly used in response surface methodology [
22,
23], the response
can be expressed as:
where
is the response variable, such as compressive strength or strength enhancement ratio;
and
are independent variables, such as GO dosage, curing age, supplementary cementitious material content, water-to-binder ratio, or other mixture parameters;
,
,
, and
are the intercept, linear, quadratic, and interaction coefficients, respectively;
is the number of independent variables; and
is the residual error.
In conventional RSM-based studies on GO-modified cementitious materials, the independent variables may include nominal GO dosage, curing age, water-to-binder ratio, supplementary cementitious material content, or other mixture parameters. Such models are usually established from multi-factor and multi-level experimental designs. In the present study, however, the mixture proportion, GO dosage, curing age, and curing condition were fixed, while only the commercial GO product and its initial optical dispersion state varied. Therefore, a full response surface model was neither constructed nor claimed in this work.
Instead, the RSM expression was used only as a conceptual basis for developing a reduced empirical response model under fixed experimental conditions. Since the nominal GO dosage was constant for all GO-modified mixtures, the difference among GO products was represented by the optical initial dispersion quality index
. The dispersion-weighted GO variable was therefore defined as:
where
is the fixed nominal GO dosage and
is the optical initial dispersion index of the
j-th GO product. It should be emphasized that
is not the actual effective mass of GO in the cementitious matrix. Rather, it is an image-derived comparative variable that combines the fixed nominal dosage with the measured optical dispersion quality.
The 3-day compressive strength enhancement ratio of the
j-th GO product was calculated as:
where
is the measured 3-day compressive strength of the cementitious composite containing the
j-th GO product, and
is the measured 3-day compressive strength of the control group without GO.
Because
was constant, the reduced response relationship can be expressed directly in terms of
. Retaining the linear and quadratic terms gives:
where
and
are fitted response coefficients and
is the residual error. This equation was used only to examine whether the proposed optical index showed strength relevance under the fixed experimental conditions. The fitted coefficients are dataset-specific and should not be interpreted as transferable material parameters. Therefore, Equation (14) is not intended to predict strength for other GO dosages, mixture proportions, curing ages, or cementitious systems.
In addition to the reduced quadratic fitting, the ranking consistency between
and the measured strength enhancement ratio
was examined. Since only five GO products were tested, rank-based comparison is more appropriate than relying solely on regression fitting. The Spearman rank correlation coefficient was calculated as:
where
is the difference between the optical dispersion rank and the strength enhancement rank of the
j-th GO product, and
is the number of GO products. A higher
indicates better agreement between the image-derived dispersion ranking and the measured strength enhancement ranking.
Through this reduced empirical analysis, the proposed index was evaluated for its engineering relevance under the present fixed experimental conditions. The empirical fitting relationship was not treated as a universal strength-prediction model, and the fitted coefficients were not regarded as transferable material parameters. Rather, the analysis was used to examine whether the initial optical dispersion ranking of different GO products was consistent with their measured early-age strength enhancement under identical mixture and curing conditions.