Article

An Optical Microscopy-Based Framework for Evaluating the Initial Dispersion Quality of Graphene Oxide in Cementitious Materials

1
State Key Laboratory of Safety and Resilience of Civil Engineering in Mountain Area, Chongqing 400045, China
2
College of Civil Engineering, Chongqing University, Chongqing 400030, China
3
State Key Laboratory of Bridge Engineering Safety and Resilience, Chongqing 400067, China
4
China Merchants Chongqing Communications Technology Research & Design Institute Co., Ltd., Chongqing 400067, China
*
Author to whom correspondence should be addressed.
Buildings 2026, 16(11), 2116; https://doi.org/10.3390/buildings16112116
Submission received: 26 April 2026 / Revised: 15 May 2026 / Accepted: 18 May 2026 / Published: 25 May 2026
(This article belongs to the Section Building Materials, and Repair & Renovation)

Abstract

Graphene oxide (GO) can improve cementitious materials, but its effectiveness often differs among commercial products even at the same nominal dosage. This study proposes an optical microscopy-based framework for evaluating the initial dispersion quality of commercial GO suspensions before cement mixing. Under fixed slide preparation, imaging, and image-processing conditions, optical microscopy was used as a geometric dispersion-evaluation tool rather than a direct chemical characterization method. Three image-derived features, namely projected boundary richness, coarse-agglomerate fraction, and spatial dispersion uniformity, were integrated into an optical initial dispersion quality index, D j . The framework was applied to five commercial GO products at a fixed dosage of 0.03 wt% of binder. The D j -based ranking was Brand 1 > Brand 2 > Brand 3 > Brand 4 > Brand 5, and remained unchanged when the coarse-agglomerate threshold varied from 20 to 100 μm2. Bootstrap resampling confirmed the robustness of the ranking. The 3-day compressive strength increased from 51.1 MPa for the control mixture to 52.6~60.8 MPa for GO-modified mortars, corresponding to enhancement ratios of 3.1~19.2%. The strength-enhancement ranking was identical to the optical dispersion ranking, with a Spearman rank correlation coefficient of ρ s = 1.0 . The proposed D j index provides a practical pre-mixing screening tool for comparing commercial GO products before strength testing or detailed physicochemical characterization.

1. Introduction

Graphene oxide (GO) has been widely investigated as a nano-additive for cementitious materials because its two-dimensional morphology, oxygen-containing functional groups, and large projected surface can influence hydration, pore structure, crack development, and interfacial bonding [1,2,3]. However, reported performance is far from uniform: even at similar nominal dosages, strength response can vary with GO source, flake morphology, oxidation state, dispersion route, superplasticizer type, and mixture composition [4,5,6,7]. Thus, dosage alone cannot represent the effective GO state introduced into a cementitious system.
Dispersion quality is a central part of this effective state. Well-dispersed GO sheets can expose more accessible projected boundaries and interfaces, whereas coarse agglomerates reduce interfacial area, trap local mixing water, and create non-uniform regions in the matrix [8,9,10,11,12]. High alkalinity, Ca2+ ions, and polycarboxylate-based superplasticizers can further change GO suspension stability and promote re-agglomeration after mixing [13,14]. More broadly, alkaline cementitious environments have been shown to affect the durability and mechanical response of cement-based composite systems, confirming the importance of considering the chemical environment when evaluating functional additions in cementitious materials [15]. Evaluating the initial dispersion state before contact with cement is therefore necessary for comparing commercial GO products under controlled conditions.
Conventional characterization methods provide important but incomplete views. SEM and AFM resolve local sheet morphology but cover limited fields of view. UV-Vis spectroscopy, zeta potential, and rheological tests provide bulk optical, electrostatic, or flow information, but do not directly describe how visible GO sheets and agglomerates are distributed within an observation field. Optical microscopy has been used for GO identification, sizing, contrast analysis, and suspension-quality tracking [16,17,18,19]. Its value here is repeated image-level observation of projected GO morphology under identical acquisition conditions.
Pre-mixing dispersion information also needs a clear relationship to engineering performance. Response-surface-type studies have described the effects of GO dosage, supplementary cementitious materials, and curing age on mechanical response [20,21], but such models usually treat dosage or mixture composition as designed variables. When dosage, mixture proportion, curing age, and testing protocol are fixed, product-to-product differences in initial optical dispersion remain hidden. A directly measurable dispersion descriptor is therefore needed as an upstream variable that complements strength-based response analysis.
This study develops such a descriptor from optical microscopy images of GO suspensions before cement mixing. Three visible features are extracted: normalized projected boundary density for boundary richness, non-coarse-agglomerated area factor for the agglomeration penalty, and spatial dispersion uniformity for field-scale distribution. These descriptors are integrated into an optical initial dispersion quality index, to rank commercial GO products under identical imaging and processing conditions. The engineering relevance of the ranking is examined using 3-day compressive strength results through a reduced RSM-inspired response model, used only for strength-relevance verification.

2. Methodology and Fundamental Principles

2.1. Conceptual Basis for Optical Evaluation of Initial GO Dispersion

The initial dispersion state of GO suspension is a key factor influencing its subsequent effectiveness in cementitious materials. Before GO comes into contact with cement particles and pore solution, the suspension already contains GO sheets and agglomerates with different sizes, projected morphologies, and spatial distributions. These initial features determine, to a large extent, how much GO surface and boundary structure can remain physically accessible at the beginning of hydration. Therefore, a quantitative description of the initial dispersion state is necessary for comparing different commercial GO products under the same dosage and mixing conditions.
Optical microscopy provides a practical method for this purpose because it can capture a large number of fields of view and directly record the projected morphology of GO sheets or agglomerates in the suspension state. However, optical microscopy should not be interpreted as a direct chemical characterization technique. It cannot directly measure oxygen content, functional group density, surface charge, or the actual hydration activity of GO in cementitious pore solution. In this study, optical microscopy is therefore used as a geometric dispersion-evaluation tool. The information extracted from optical images is limited to the visible projected area, projected boundary, object size distribution, and spatial distribution of GO regions.
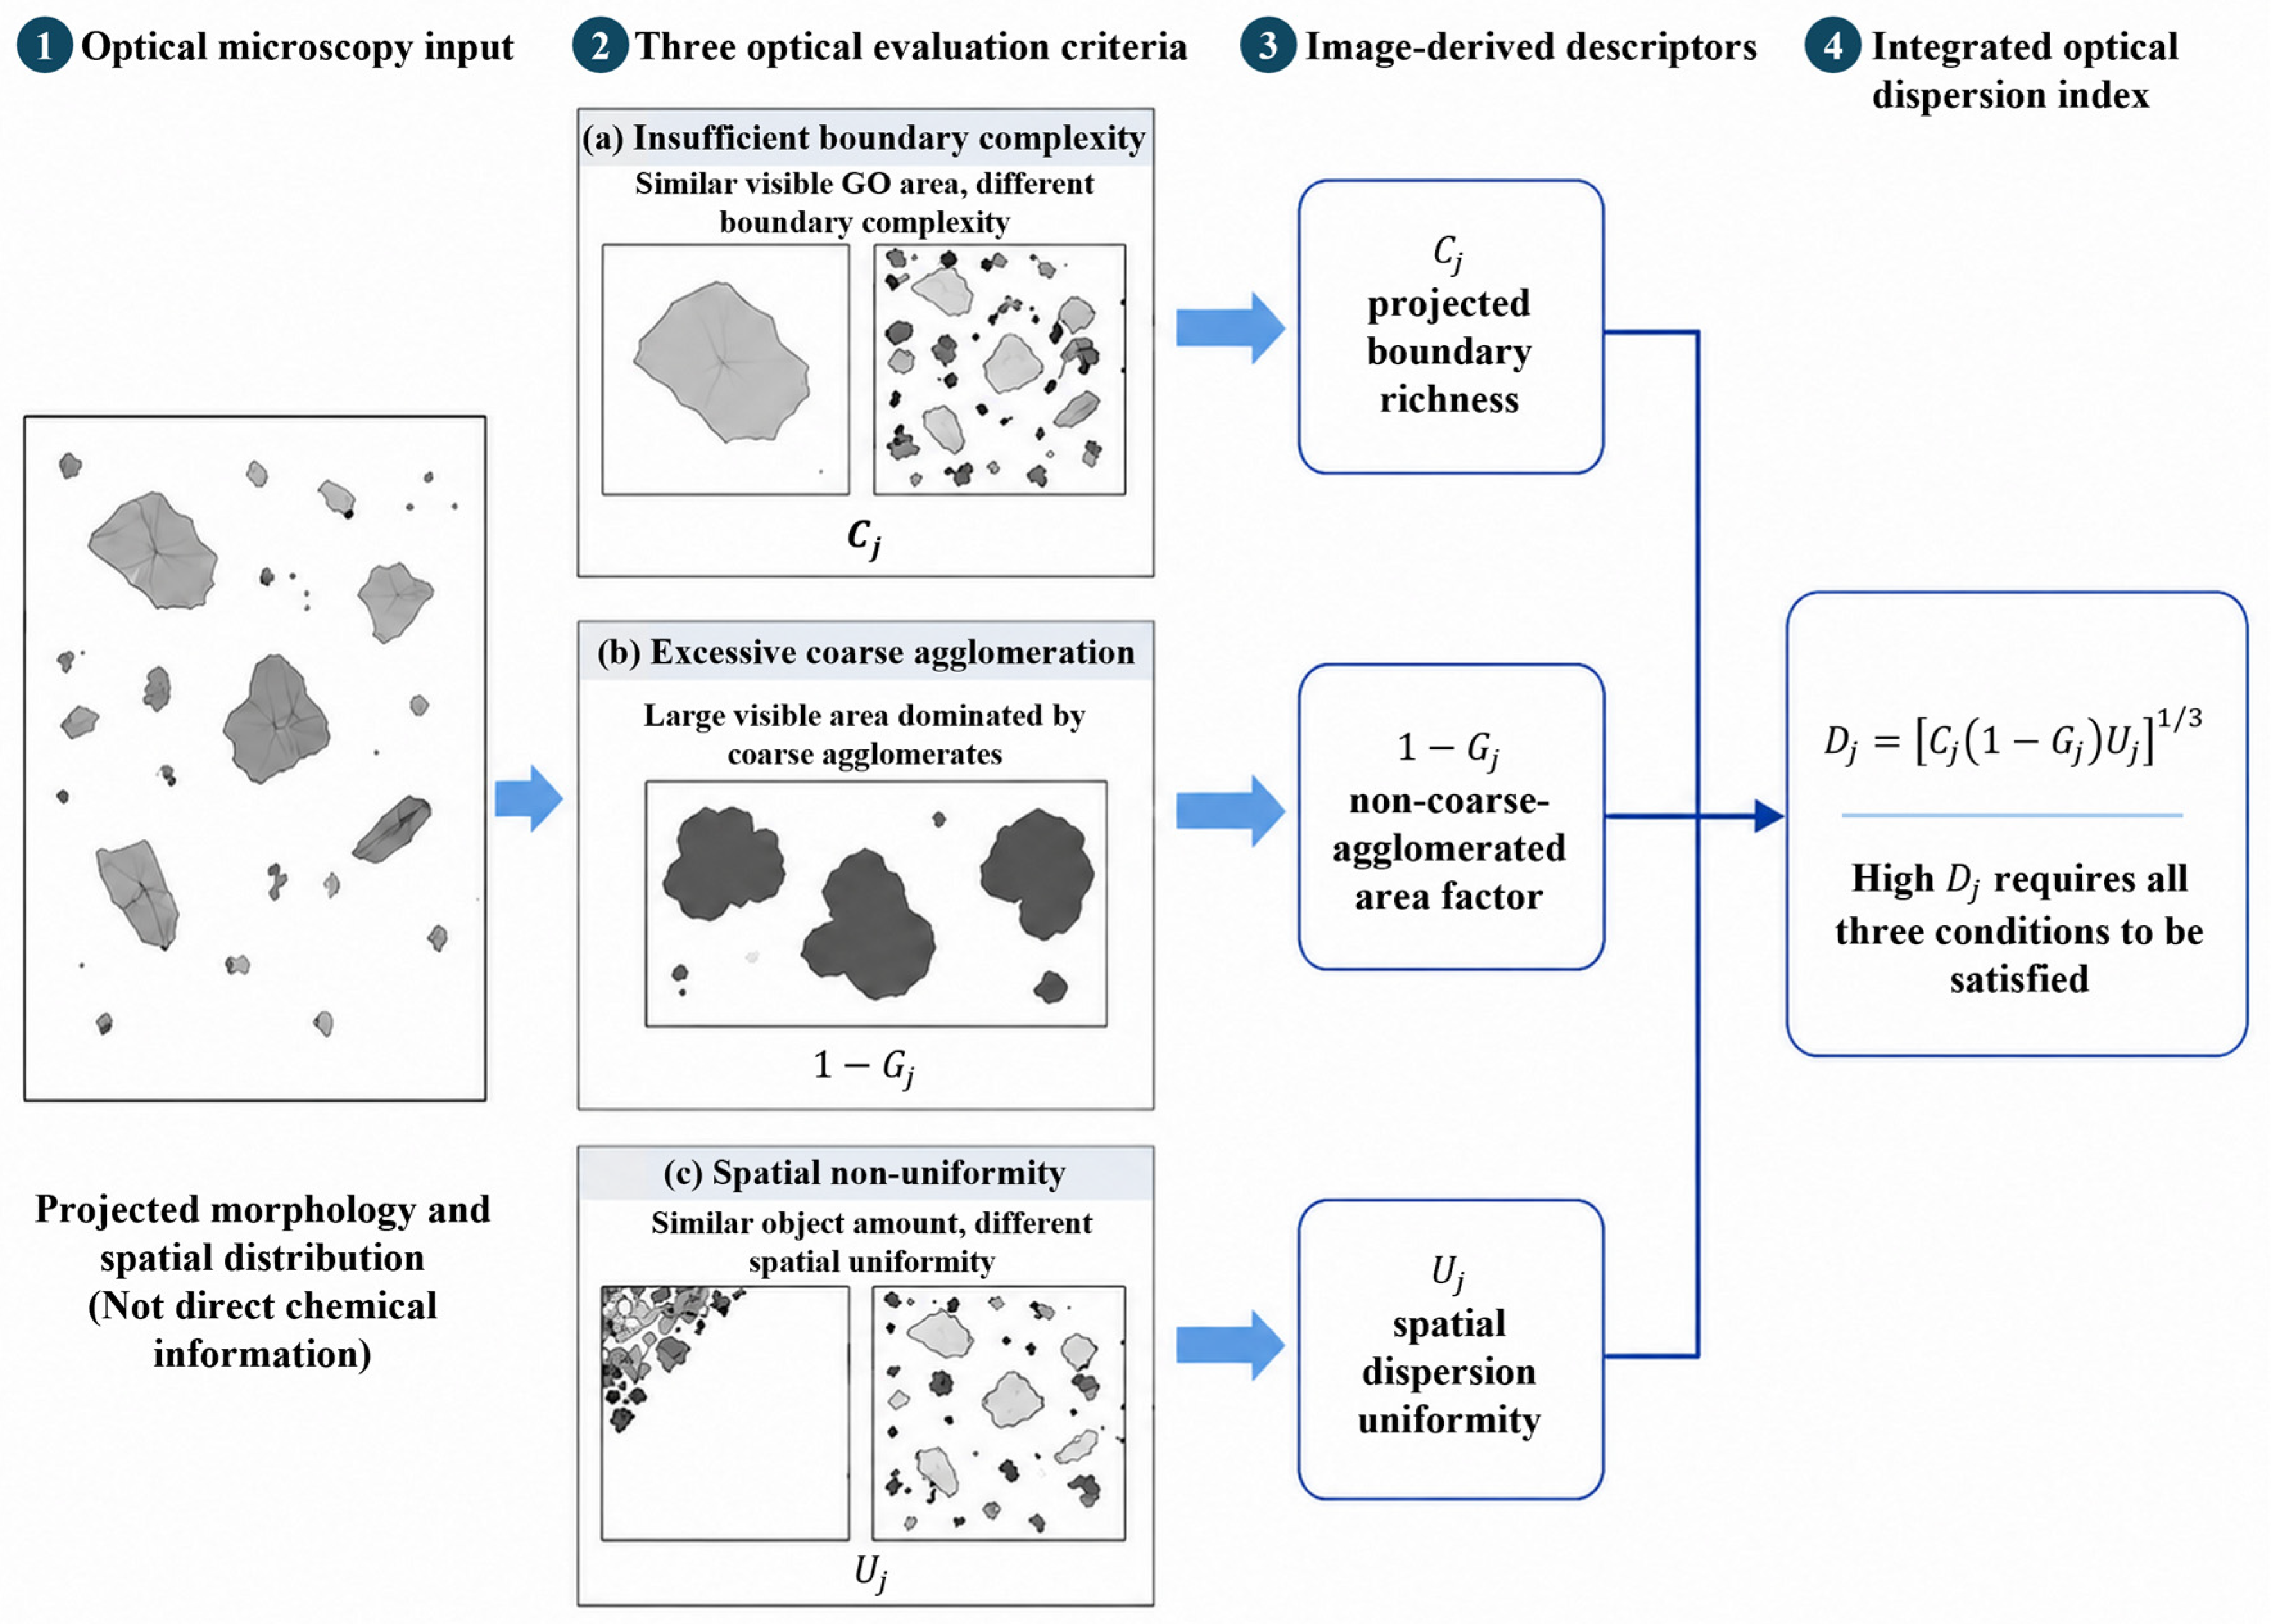
A major challenge is that the initial dispersion quality of GO cannot be reliably evaluated using a single optical quantity. For example, a larger visible GO area in an optical image does not necessarily indicate better dispersion. If most of the visible area is contributed by a few large agglomerates, the GO is still poorly dispersed. Similarly, two images may contain similar total projected GO areas, but one may consist of many small and finely distributed objects while the other may contain only a few large flakes. These two cases should not be regarded as equivalent because the former provides richer projected boundaries and a finer optically detected morphology. In addition, even when the object size distribution appears acceptable, GO regions may still be concentrated in a limited part of the observation field, indicating poor spatial uniformity. Therefore, the optical evaluation of GO initial dispersion should consider three complementary aspects, as illustrated in Figure 1.
The first aspect is projected boundary richness. Under the same visible GO area, a suspension containing finer sheets or smaller agglomerates generally exhibits a larger projected boundary length per unit projected area. This feature reflects the degree to which the optically detected GO morphology is divided into finer objects rather than dominated by large projected regions. The second aspect is coarse agglomeration. A high projected GO area may be misleading if a large fraction of that area belongs to coarse agglomerates. Such agglomerates indicate insufficient separation of GO sheets and should be penalized in the dispersion evaluation. Therefore, the area fraction of large GO objects is used to represent the extent of coarse agglomeration, while its complementary value represents the fraction of GO area not dominated by coarse agglomerates. The third aspect is spatial distribution uniformity. A well-dispersed GO suspension should not only contain small or finely divided objects, but should also show these objects distributed across the observation field. If GO regions are concentrated locally, the suspension is spatially heterogeneous even when the total visible GO area or object count is high. Thus, the variation of GO area fraction among different sub-regions of the same image can be used to describe spatial non-uniformity.
These three aspects correspond to three common failure modes in optical dispersion evaluation: insufficient boundary richness, excessive coarse agglomeration, and uneven spatial distribution. Since they represent different and non-substitutable requirements for good dispersion, they should be considered together rather than separately. A GO product can be regarded as having a high initial optical dispersion quality only when it simultaneously exhibits rich projected boundaries, limited coarse agglomeration, and relatively uniform spatial distribution.

2.2. Image-Derived Descriptors for Three Dispersion Requirements

For the j-th GO product, N j optical micrographs were analyzed under the same sample preparation, imaging, and segmentation protocol. In the k-th image, each segmented GO object is denoted as object i, with projected area A i , j , k and projected perimeter P i , j , k . These object-level geometric quantities were used to construct image-level descriptors and were then averaged at the product level. This image-first calculation strategy was adopted to avoid bias caused by different numbers of images among GO products. As discussed in Section 2.1, a reliable optical evaluation of initial GO dispersion should not depend on a single visible-area descriptor. Instead, it should simultaneously consider three necessary requirements: sufficient projected boundary richness, limited coarse agglomeration, and relatively uniform spatial distribution. Accordingly, three image-derived descriptors were constructed.

2.2.1. Projected Boundary Richness

The first requirement for a well-dispersed GO suspension is that the optically detected GO morphology should be sufficiently divided into fine sheets or small agglomerates rather than dominated by a few large projected regions. Under optical microscopy, this difference can be reflected by the projected boundary length per unit projected GO area. For example, two images may have similar total visible GO areas, but the image containing many small GO sheets will produce a larger total projected boundary length than the image containing only a few large flakes. Therefore, the ratio between the total perimeter and the total projected area of segmented GO objects was used to describe the projected boundary richness of each image:
B k , j = i P i , k , j i A i , k , j
where B k , j is the projected boundary density of the k-th image for the j-th GO product. A larger B k , j indicates that, within the same projected GO area, the detected GO morphology contains richer boundaries and is therefore optically finer. The image-level values were then averaged for each GO product:
B ¯ j = 1 N j k = 1 N j B k , j
Because the absolute value of B ¯ j depends on image magnification, segmentation parameters, and pixel calibration, it was normalized within the tested GO product set:
C j = B ¯ j max j ( B ¯ j )
where C j is defined as the normalized projected boundary density factor. C j ranges from 0 to 1 within the present product set, and a larger value indicates richer projected boundary availability. It should be noted that C j is an optical morphology descriptor. It does not directly measure nanoscale edge defects, oxygen-containing groups, or chemical activity.

2.2.2. Coarse-Agglomerate Area Fraction

The second requirement is that the visible GO area should not be mainly contributed by coarse agglomerates. A large projected GO area may be misleading if most of that area belongs to a few large objects. In such a case, the suspension may appear to contain a large amount of GO in the optical field, but the GO sheets are not sufficiently separated. Therefore, coarse agglomeration must be introduced as a penalty in the dispersion evaluation.
To quantify this effect, a coarse-agglomerate area threshold A c was introduced. Segmented GO objects with projected areas larger than or equal to A c were regarded as coarse agglomerates under the present optical segmentation protocol. For the k-th image of the j-th GO product, the coarse-agglomerate area fraction was calculated as:
G k , j = i A i , k , j Φ ( A i , k , j > A c ) i A i , k , j
where Φ ( A i , k , j > A c ) is an indicator function. It equals 1 when the projected area of object i is larger than or equal to A c , and equals 0 otherwise.
The product-level coarse-agglomerate area fraction was obtained by averaging the image-level values:
G j = 1 N j k = 1 N j G k , j
A larger G j indicates that a larger proportion of the detected GO area is contained in coarse agglomerates, corresponding to poorer optical dispersion. Since the final dispersion index should increase with better dispersion quality, the complementary term 1 G j was used as the positive descriptor. This term is defined as the non-coarse-agglomerated area factor. A larger 1 G j means that a larger fraction of the visible GO area is not dominated by coarse agglomerates.
In the main calculation of this study, A c = 20 μ m 2 was used as the baseline coarse-agglomerate threshold. Because the selection of A c may influence the numerical value of G j , a threshold sensitivity analysis was further conducted in the Results section to examine whether the final dispersion ranking remained stable over a broader range of A c .

2.2.3. Spatial Dispersion Uniformity

The third requirement is spatial uniformity. Even if the detected GO objects are small and the coarse-agglomerate fraction is limited, the suspension may still be poorly dispersed if GO regions are concentrated in only part of the optical field. Therefore, the spatial distribution of GO objects should also be quantified.
To evaluate spatial uniformity, each optical micrograph was divided into equal sub-regions. The GO area fraction in the q-th sub-region of the k-th image for the j-th product was calculated as:
ϕ q , k , j = A G O , q , k , j A q , k , j
where A G O , q , k , j is the total projected area of segmented GO objects within the q-th sub-region, and A q , k , j is the area of that sub-region.
The spatial heterogeneity of each image was then described using the coefficient of variation of ϕ q , k , j among all sub-regions:
C V k , j = SD ( ϕ q , k , j ) Mean ( ϕ q , k , j )
A larger C V k , j indicates stronger spatial fluctuation of GO area fraction and therefore poorer spatial uniformity. To convert this heterogeneity measure into a positive uniformity factor, the following transformation was used:
U k , j = 1 1 + C V k , j
Thus, U k , j decreases as spatial heterogeneity increases. The product-level spatial dispersion uniformity factor was obtained as:
U j = 1 N j k = 1 N j U k , j
where U j approaches 1 when the GO area fraction is relatively uniform among sub-regions, and decreases when GO objects are locally clustered.

2.2.4. Integration into the Optical Initial Dispersion Quality Index

The three descriptors above represent different and non-substitutable requirements for good initial dispersion. C j describes whether the projected GO morphology contains rich boundaries; 1 G j penalizes the dominance of coarse agglomerates; and U j evaluates whether the detected GO regions are spatially uniform.
An additive form was not adopted because it would allow a high value in one descriptor to compensate for a poor value in another. For example, a sample with high boundary richness but severe coarse agglomeration should not be evaluated as well dispersed. Similarly, a sample with limited agglomeration but strong local clustering should also be penalized. Therefore, the final index was constructed using a multiplicative geometric-mean form:
D j = C j ( 1 G j ) U j 1 / 3
where D j is defined as the optical initial dispersion quality index of the j-th GO product.
This formulation ensures that a high D j can only be obtained when the GO product simultaneously exhibits rich projected boundaries, a low coarse-agglomerate area fraction, and relatively uniform spatial distribution. If any one of the three descriptors is poor, the final value of D j will decrease accordingly. Therefore, D j reflects the short-board effect of optical dispersion quality rather than a simple accumulation of independent image features.
It should be emphasized that D j is a relative optical index for GO products evaluated under the same preparation, imaging, and segmentation protocol. It is not an absolute material constant. If additional GO products are introduced or if the imaging and segmentation conditions are changed, the normalization of C j and the resulting D j should be recalculated.

2.3. Strength-Relevance Hypothesis and Reduced Empirical Response Model

The descriptors defined above provide an optical evaluation of the initial dispersion state of GO suspensions. After establishing the image-derived dispersion ranking, the 3-day compressive strength results were further used to examine whether the optical ranking was consistent with early-age mechanical performance under the fixed experimental conditions. This analysis was intended to assess the engineering relevance of the proposed optical index, rather than to redefine the primary objective of the study as strength prediction. Accordingly, a strength-relevance hypothesis was introduced: under fixed GO dosage, mixture proportion, curing condition, and testing age, a GO product with a higher optical initial dispersion quality index is expected to show higher early-age strength enhancement.
In cementitious materials, response surface methodology (RSM) has been widely used to describe the relationship between mixture variables and performance responses, such as compressive strength. Following the general second-order polynomial form commonly used in response surface methodology [22,23], the response Y can be expressed as:
Y = β 0 + m = 1 p β m x m + m = 1 p β m m x m 2 + m = 1 p 1 n = m + 1 p β m n x m x n + ε
where Y is the response variable, such as compressive strength or strength enhancement ratio; x m and x n are independent variables, such as GO dosage, curing age, supplementary cementitious material content, water-to-binder ratio, or other mixture parameters; β 0 , β m , β m m , and β m n are the intercept, linear, quadratic, and interaction coefficients, respectively; p is the number of independent variables; and ε is the residual error.
In conventional RSM-based studies on GO-modified cementitious materials, the independent variables may include nominal GO dosage, curing age, water-to-binder ratio, supplementary cementitious material content, or other mixture parameters. Such models are usually established from multi-factor and multi-level experimental designs. In the present study, however, the mixture proportion, GO dosage, curing age, and curing condition were fixed, while only the commercial GO product and its initial optical dispersion state varied. Therefore, a full response surface model was neither constructed nor claimed in this work.
Instead, the RSM expression was used only as a conceptual basis for developing a reduced empirical response model under fixed experimental conditions. Since the nominal GO dosage was constant for all GO-modified mixtures, the difference among GO products was represented by the optical initial dispersion quality index D j . The dispersion-weighted GO variable was therefore defined as:
X j = G O 0 D j
where G O 0 is the fixed nominal GO dosage and D j is the optical initial dispersion index of the j-th GO product. It should be emphasized that X j is not the actual effective mass of GO in the cementitious matrix. Rather, it is an image-derived comparative variable that combines the fixed nominal dosage with the measured optical dispersion quality.
The 3-day compressive strength enhancement ratio of the j-th GO product was calculated as:
η j = f c , j f c , 0 f c , 0 × 100 %
where f c , j is the measured 3-day compressive strength of the cementitious composite containing the j-th GO product, and f c , 0 is the measured 3-day compressive strength of the control group without GO.
Because G O 0 was constant, the reduced response relationship can be expressed directly in terms of D j . Retaining the linear and quadratic terms gives:
η j = a D j + b D j 2 + e j
where a and b are fitted response coefficients and e j is the residual error. This equation was used only to examine whether the proposed optical index showed strength relevance under the fixed experimental conditions. The fitted coefficients are dataset-specific and should not be interpreted as transferable material parameters. Therefore, Equation (14) is not intended to predict strength for other GO dosages, mixture proportions, curing ages, or cementitious systems.
In addition to the reduced quadratic fitting, the ranking consistency between D j and the measured strength enhancement ratio η j was examined. Since only five GO products were tested, rank-based comparison is more appropriate than relying solely on regression fitting. The Spearman rank correlation coefficient was calculated as:
ρ s = 1 6 j d j 2 n ( n 2 1 )
where d j is the difference between the optical dispersion rank and the strength enhancement rank of the j-th GO product, and n is the number of GO products. A higher ρ s indicates better agreement between the image-derived dispersion ranking and the measured strength enhancement ranking.
Through this reduced empirical analysis, the proposed index was evaluated for its engineering relevance under the present fixed experimental conditions. The empirical fitting relationship was not treated as a universal strength-prediction model, and the fitted coefficients were not regarded as transferable material parameters. Rather, the analysis was used to examine whether the initial optical dispersion ranking of different GO products was consistent with their measured early-age strength enhancement under identical mixture and curing conditions.


3. Experimental Methods

3.1. GO Microscopic Image Processing and Parameter Extraction

3.1.1. Materials and Equipment

Five commercial GO dispersions (denoted as Brand 1~5) were selected in this study, and their main parameters are summarized in Table 1. GO dispersion was carried out using a split-type ultrasonic disperser (YT-LC-1000W, Shanghai Yetuo Technology Co., Ltd., Shanghai, China). Microscopic image acquisition was performed using an optical microscope (SAGA, Suzhou Shenying Optical Co., Ltd., Suzhou, China) coupled with a high-resolution digital camera (Canon EOS 600D, Canon Inc., Tokyo, Japan). The microscope was equipped with an adjustable light source, a variable aperture, and multiple objective lenses, enabling the stable acquisition of high-contrast optical images suitable for subsequent quantitative image analysis. Direct chemical characterization such as XPS or EDS was not performed; therefore, the image-derived parameters were interpreted only as descriptors of the initial optical dispersion state, rather than as chemical-composition indicators.
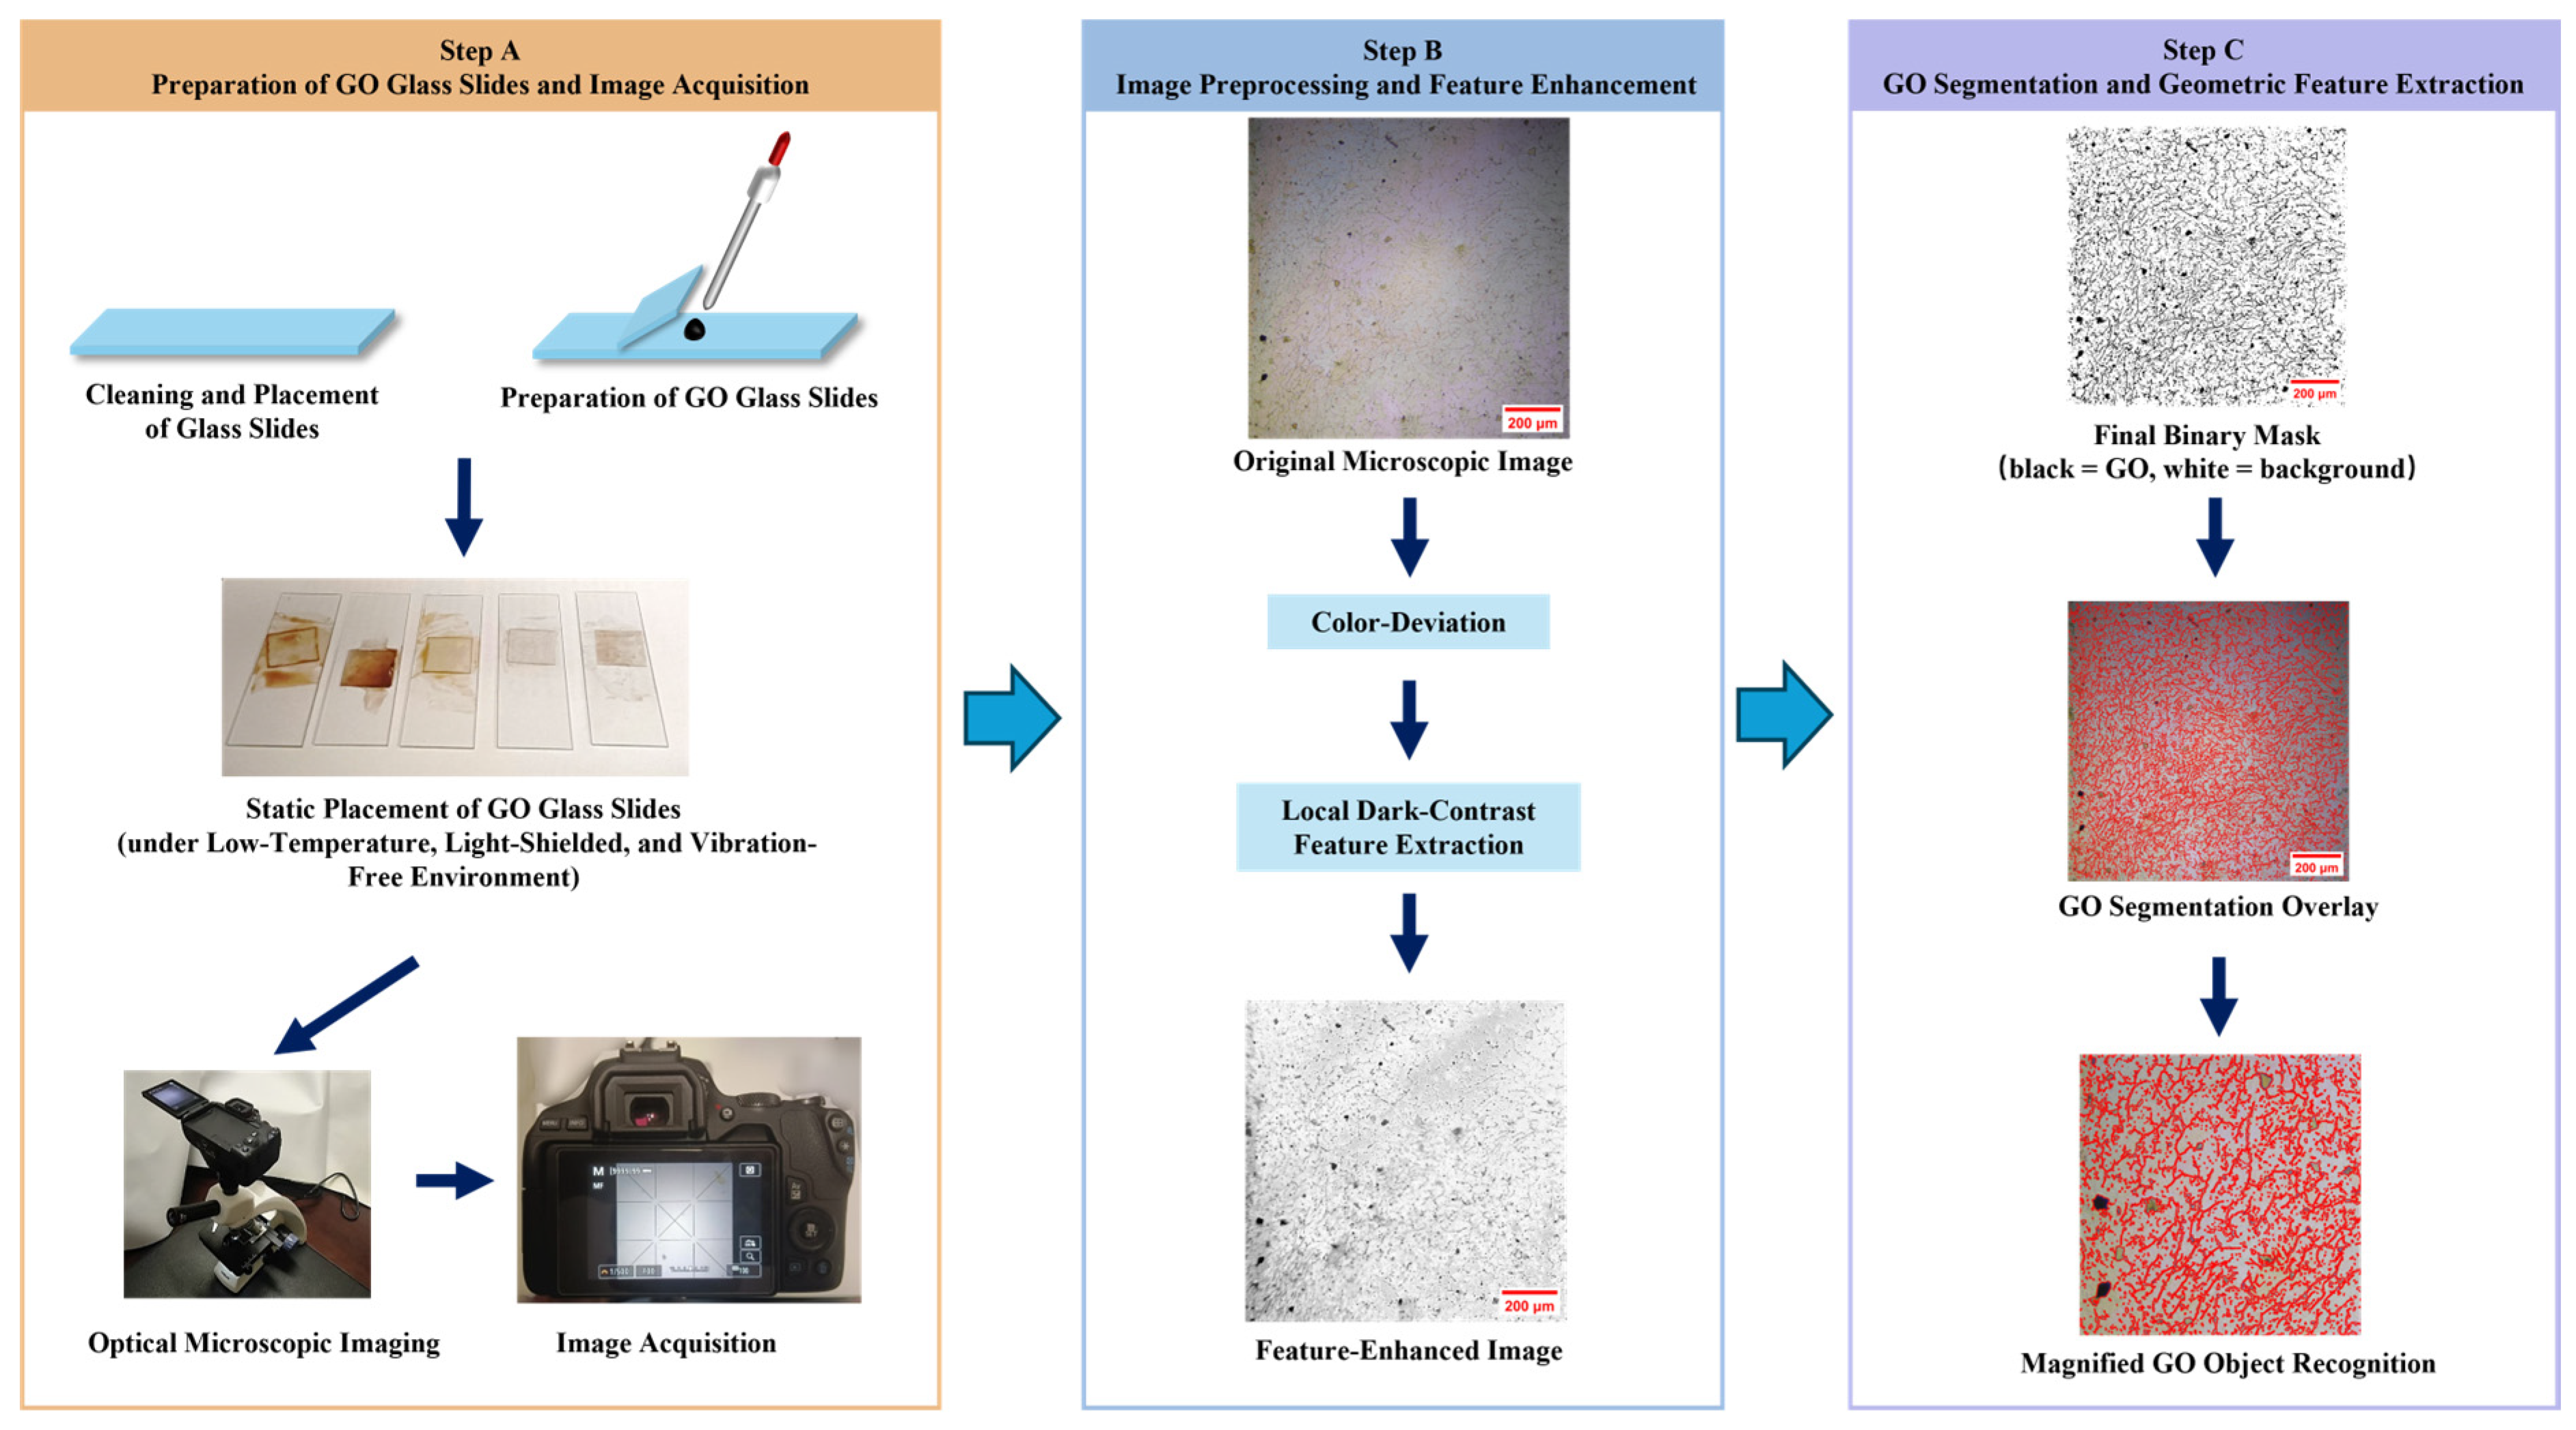
The overall workflow of GO glass-slide preparation, optical microscopic image acquisition, image preprocessing, GO object segmentation, and geometric feature extraction is illustrated in Figure 2.

3.1.2. Glass Slide Preparation and Image Acquisition (Step A)

GO samples were prepared using a biological glass-slide method. A small volume of GO dispersion was deposited onto the center of a clean glass slide, after which a coverslip was slowly placed to minimize air bubble formation, allowing the dispersion to spread uniformly while excess liquid was removed. The prepared slides were left to settle under low-temperature, light-shielded, and vibration-free conditions until air bubbles completely dissipated.
Microscopic imaging was strictly conducted using a 10× objective lens to maintain a consistent optical magnification. Image contrast was optimized by adjusting the illumination intensity, aperture, and focus. Images were captured at a 1:1 magnification with a resolution of 4000 × 4000 pixels to ensure full coverage of the observation area. To ensure statistical representativeness, 50~100 images were acquired from different fields of view for each GO sample and stored in a lossless format.

3.1.3. Image Preprocessing and Feature Enhancement (Step B)

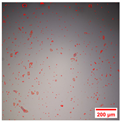
Because optical microscopic images of GO suspensions may contain uneven illumination, weak background texture, and local color variations, all images were processed using the same MATLAB (R2025b, The MathWorks, Inc., Natick, MA, USA) script and identical parameter settings before quantitative analysis. The preprocessing was used to enhance the contrast between projected GO objects and the background. Briefly, the RGB image was converted into image-derived feature maps describing color deviation and local dark contrast. These feature maps were used to suppress the slowly varying background and to strengthen the visible GO sheets or agglomerates, thereby providing improved image input for subsequent GO object segmentation and geometric measurement. Representative original microscopic images and the corresponding preprocessed feature-enhanced images of the five GO brands are shown in Table 2.

3.1.4. Geometric Feature Extraction and Statistical Analysis (Step C)

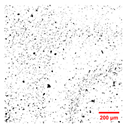
The preprocessed images were segmented in MATLAB to obtain candidate GO regions. Candidate objects were identified from pixels showing sufficient color deviation and local dark-feature response, and the candidate mask was subsequently refined by morphological filtering and object-level screening to remove isolated noise and obvious background artifacts. The same segmentation workflow was applied to all five GO products. In the final binary mask, the accepted white regions were regarded as projected GO objects, whereas the black region represented the background. Boundary overlays were generated for visual inspection of the segmentation quality. Representative final binary masks and GO boundary overlay images obtained using the same recognition procedure are shown in Table 3.
For each accepted GO object, the projected area and perimeter were extracted directly from the final binary mask using MATLAB region-based measurements. Pixel-based area and perimeter values were converted into physical dimensions using the calibrated conversion factor of 0.29 μm per pixel. After calibration, all geometric descriptors were calculated first at the individual-image level and then averaged at the product level. The projected boundary density was obtained from the ratio of the total perimeter to the total projected area of all accepted GO objects and then normalized within the tested product set to obtain C j . For the calculation of G j , objects with projected areas no smaller than A c = 20 μ m 2 were regarded as coarse agglomerates in the main analysis, and A c was further varied from 20 to 100 μ m 2 in the sensitivity analysis. The spatial dispersion uniformity factor U j was calculated from the spatial heterogeneity of segmented GO regions within each optical image. Finally, D j was calculated from C j , 1 G j , and U j according to Section 2.2.

3.2. GO-Modified Cementitious Mortar Preparation and Mechanical Testing

The raw materials used in this study included cement, fly ash, silica fume, quartz sand, water, a superplasticizer, and GO. The cement was P.O 42.5R ordinary Portland cement supplied by the Chongqing Xiaonanhai Cement Plant (Chongqing, China). Class I fly ash from the Chongqing Luohuang Power Plant (Chongqing, China) and silica fume produced in Quanzhou, China were incorporated. The aggregate was medium quartz sand with a fineness modulus of 2.7. Tap water was used for all mixtures. A polycarboxylate-based high-performance superplasticizer with a water-reducing rate of 40~50% was employed.
Five commercial GO dispersions (Brand 1~5, Table 1) were used at a fixed dosage of 0.03 wt% relative to the total binder mass. This dosage was selected because previous studies have shown that GO in the range of 0.03~0.05 wt% can significantly promote the early-age performance of cement-based materials [9,24,25]. Using a fixed dosage enables the comparison of differences among commercial GO products, particularly their initial optical dispersion states, under an identical mixture framework. The mix proportions of the GO-modified cementitious mortar are listed in Table 4. The water-to-binder ratio and superplasticizer dosage were kept constant for all mixtures to minimize the influence of mixture variation on the comparison of mechanical properties.
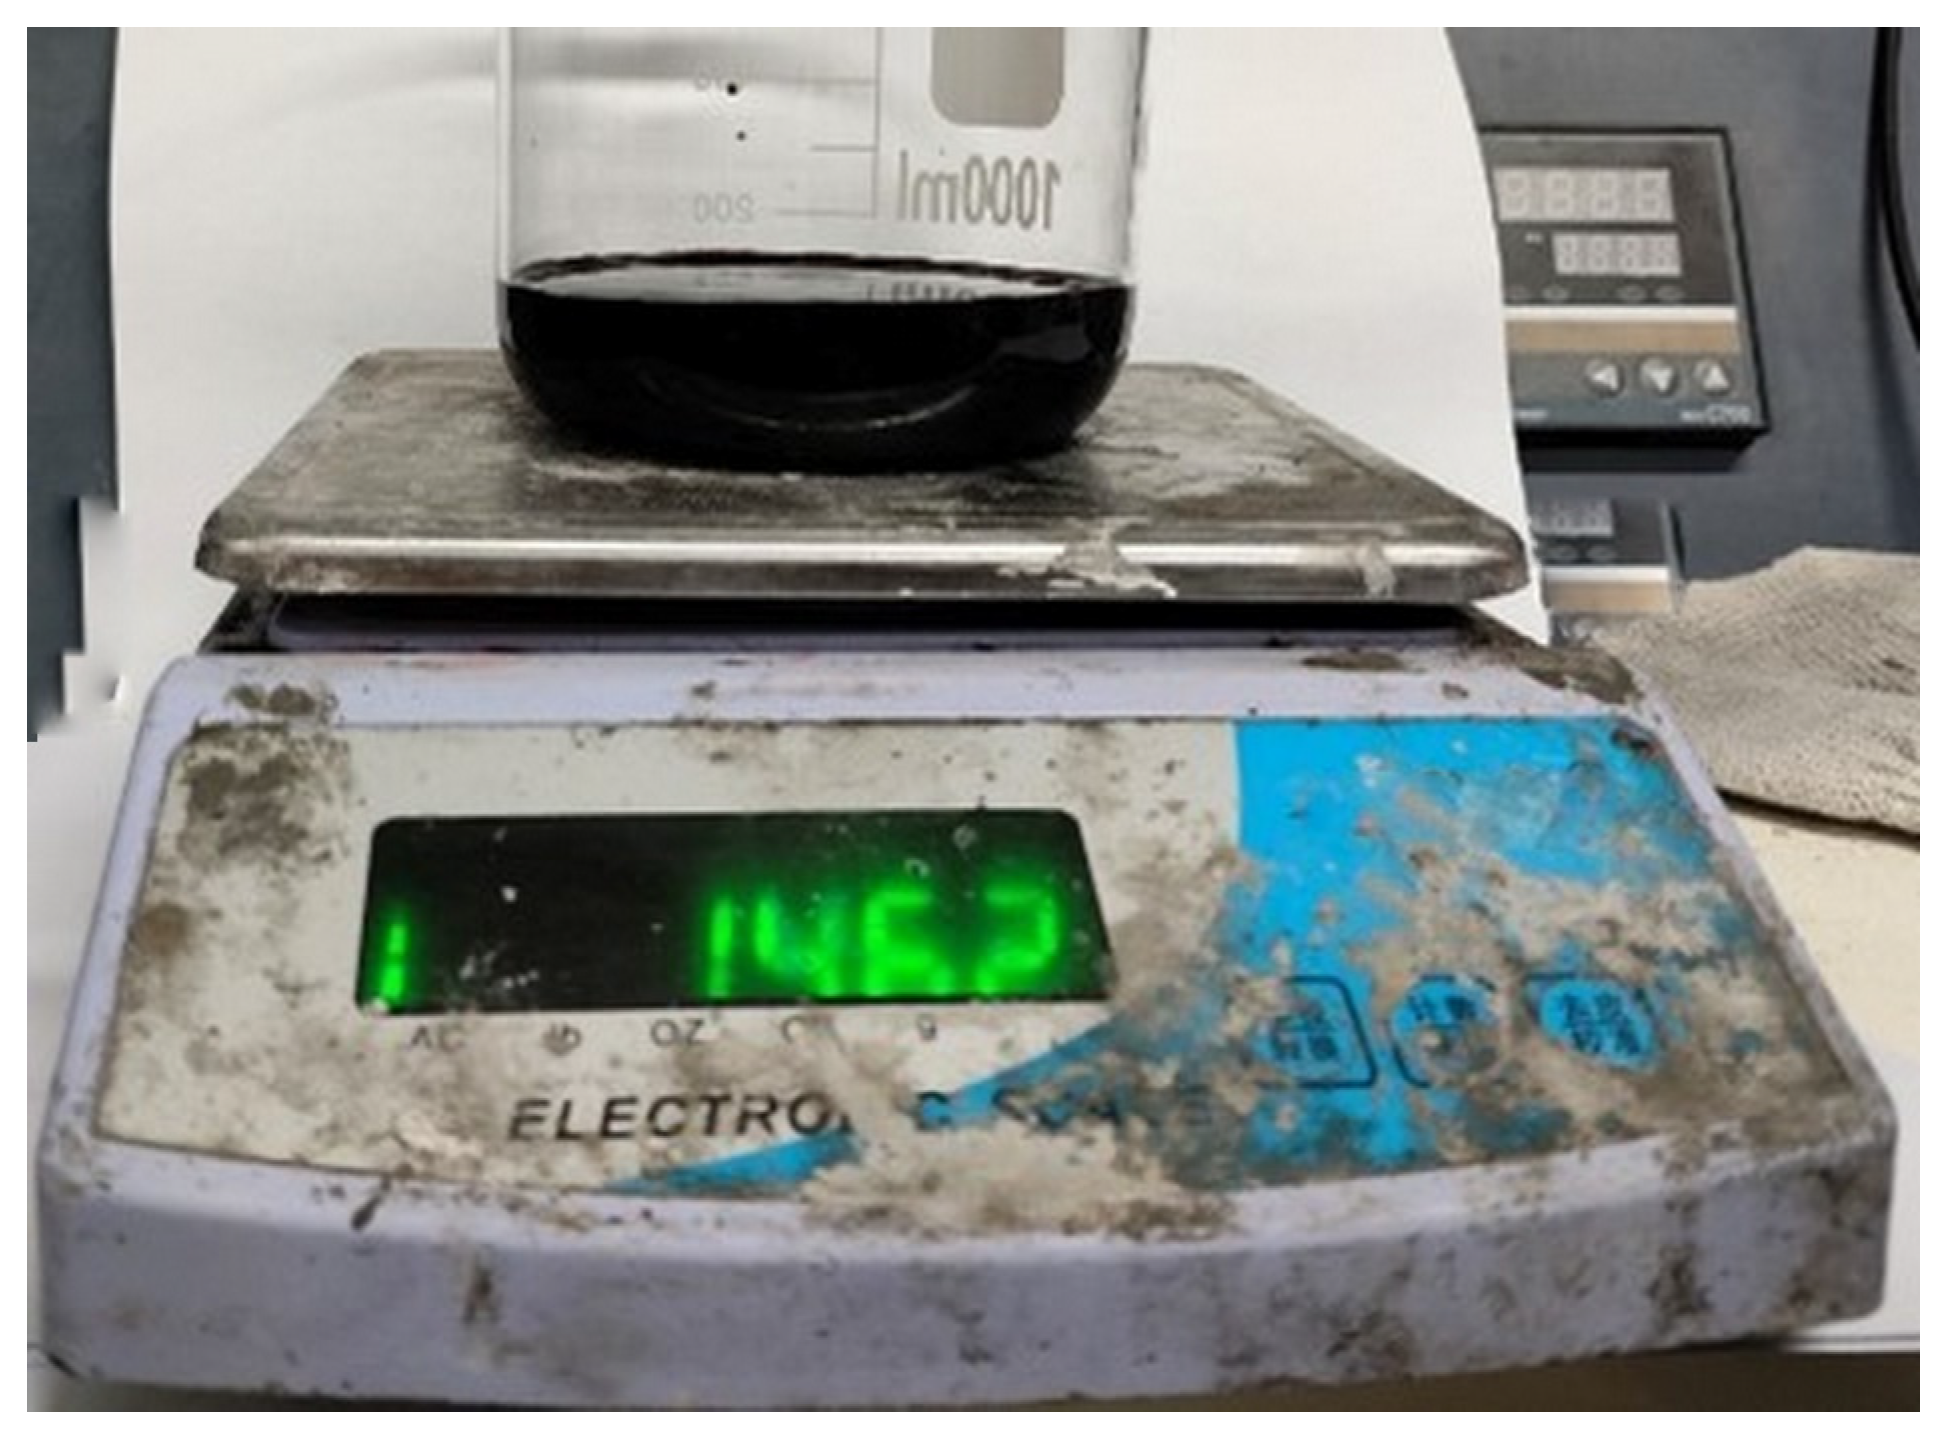
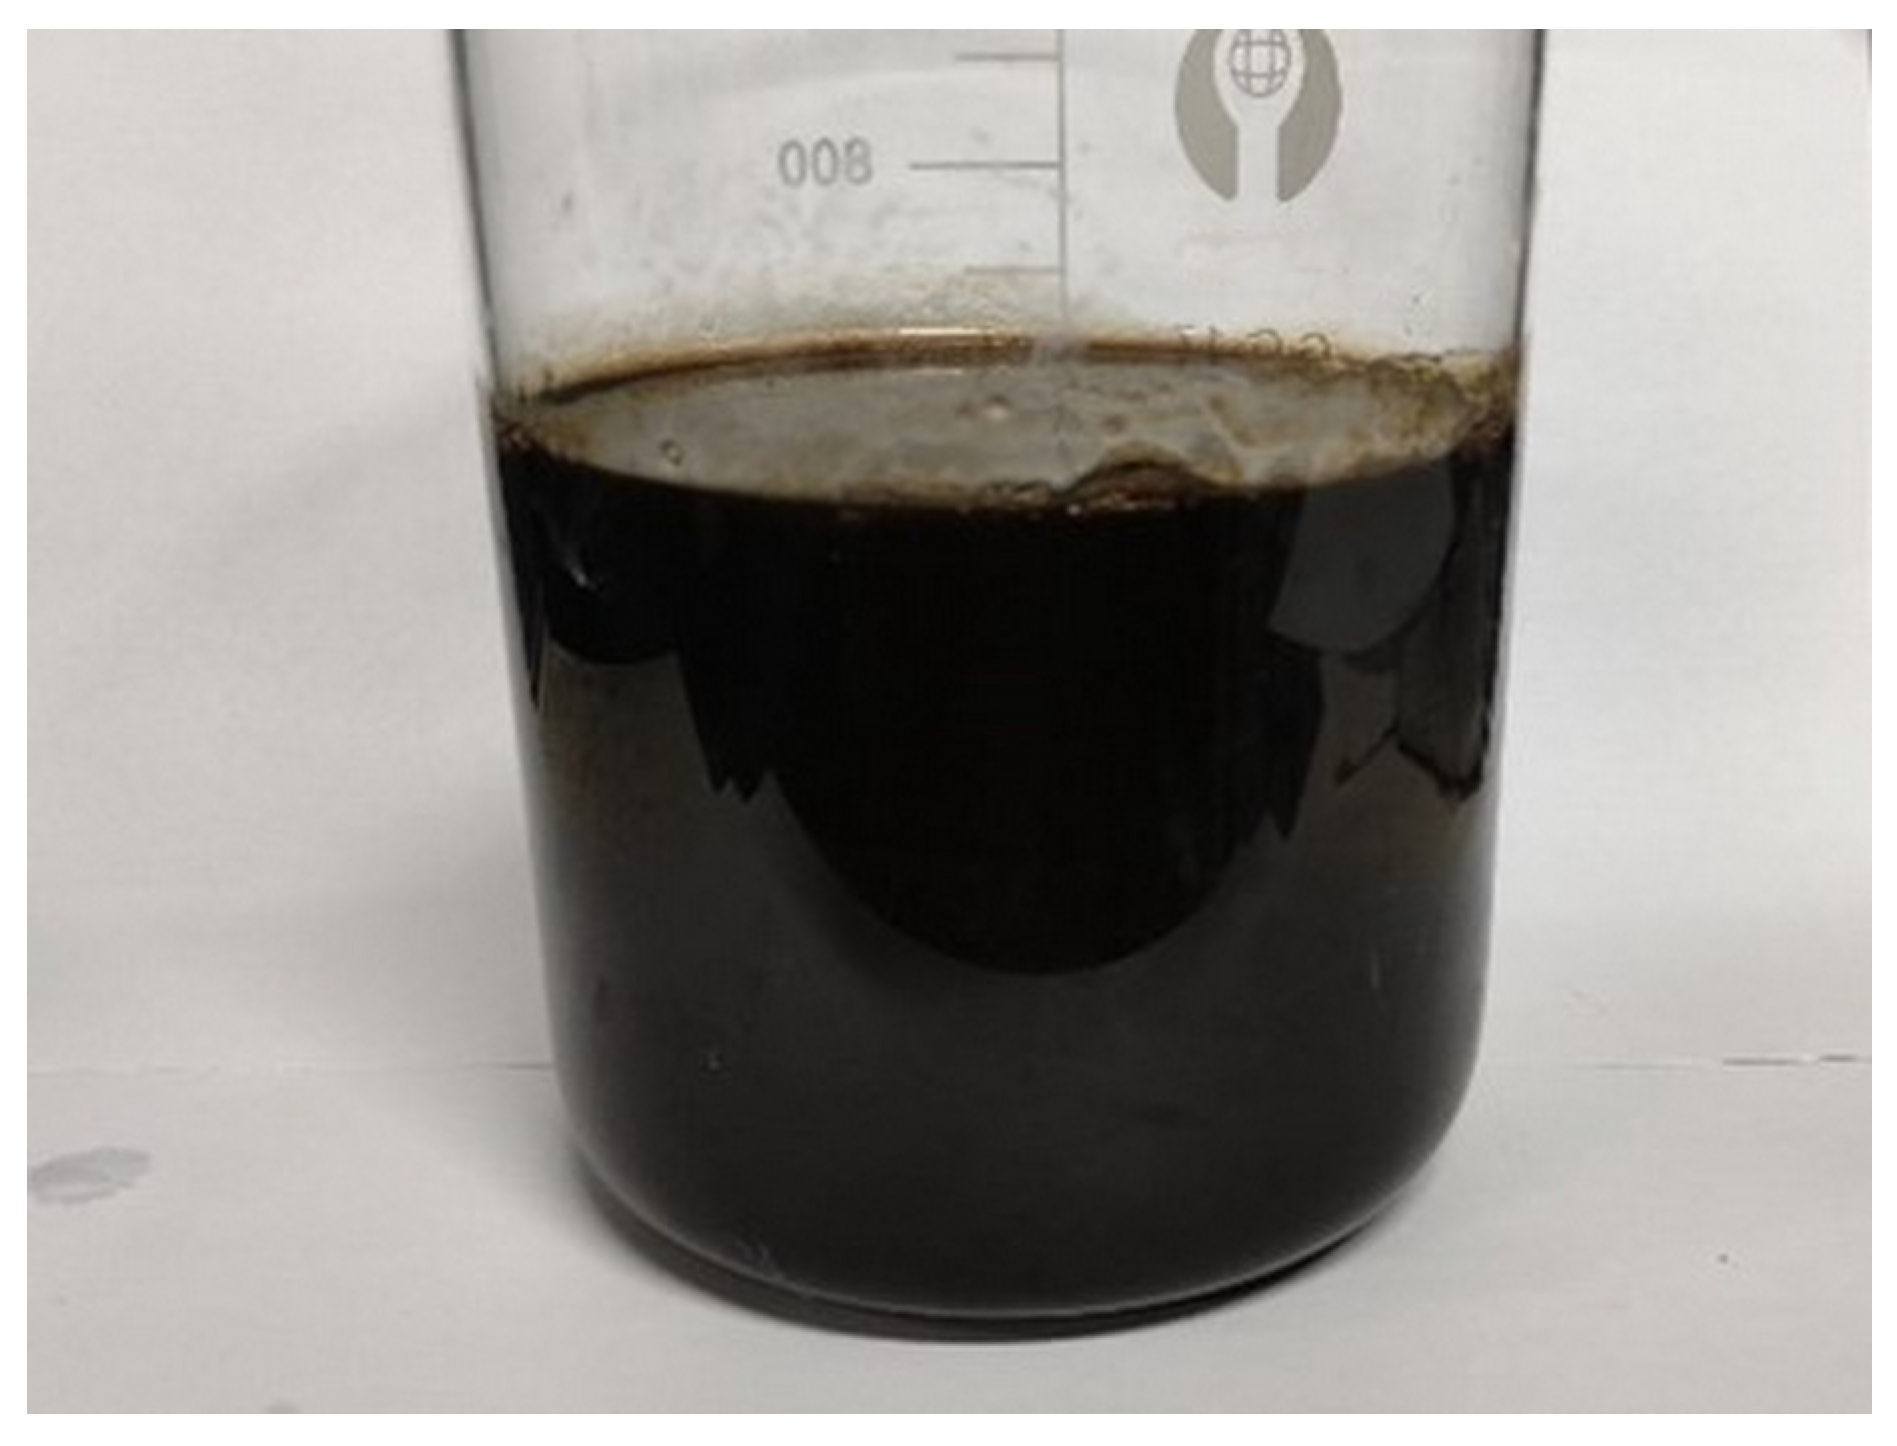
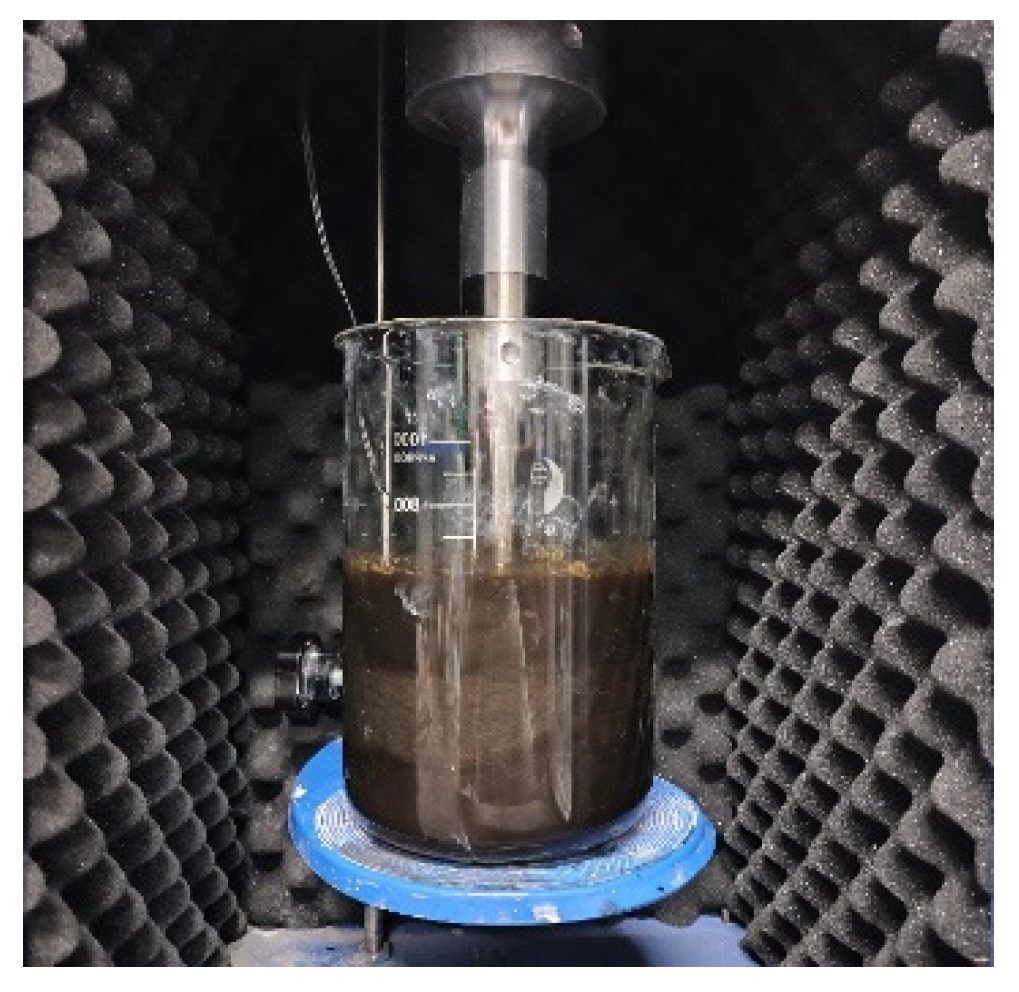
The preparation procedure of GO-modified cementitious mortar is illustrated in Figure 3, Figure 4 and Figure 5. Briefly, the GO dispersion, mixing water, and superplasticizer were first combined and subjected to ultrasonic dispersion (250~300 W) for 30~35 min to ensure uniform dispersion. Subsequently, cement, fly ash, silica fume, and sand were dry-mixed until homogeneous. The dispersed GO suspension and remaining water were then added simultaneously, followed by further mixing to obtain fresh GO-modified mortar.
Mortar specimens were cast into cubic molds and cured under natural conditions. The 3-day compressive strength was measured in accordance with the Chinese standard GB/T 50081-2019 [26]. A reference group without GO was prepared and tested under identical conditions for comparison.

4. Results

4.1. Image-Level Statistics and Object-Size Distributions of Initial GO Dispersion

Based on the GO optical image recognition and feature extraction method described in Section 3, the initial dispersion morphology of the five GO products was first analyzed at the image level. Because the number of optical micrographs differed among products, all geometric statistics were calculated for each individual image and then averaged within the same product to reduce bias caused by unequal image counts.
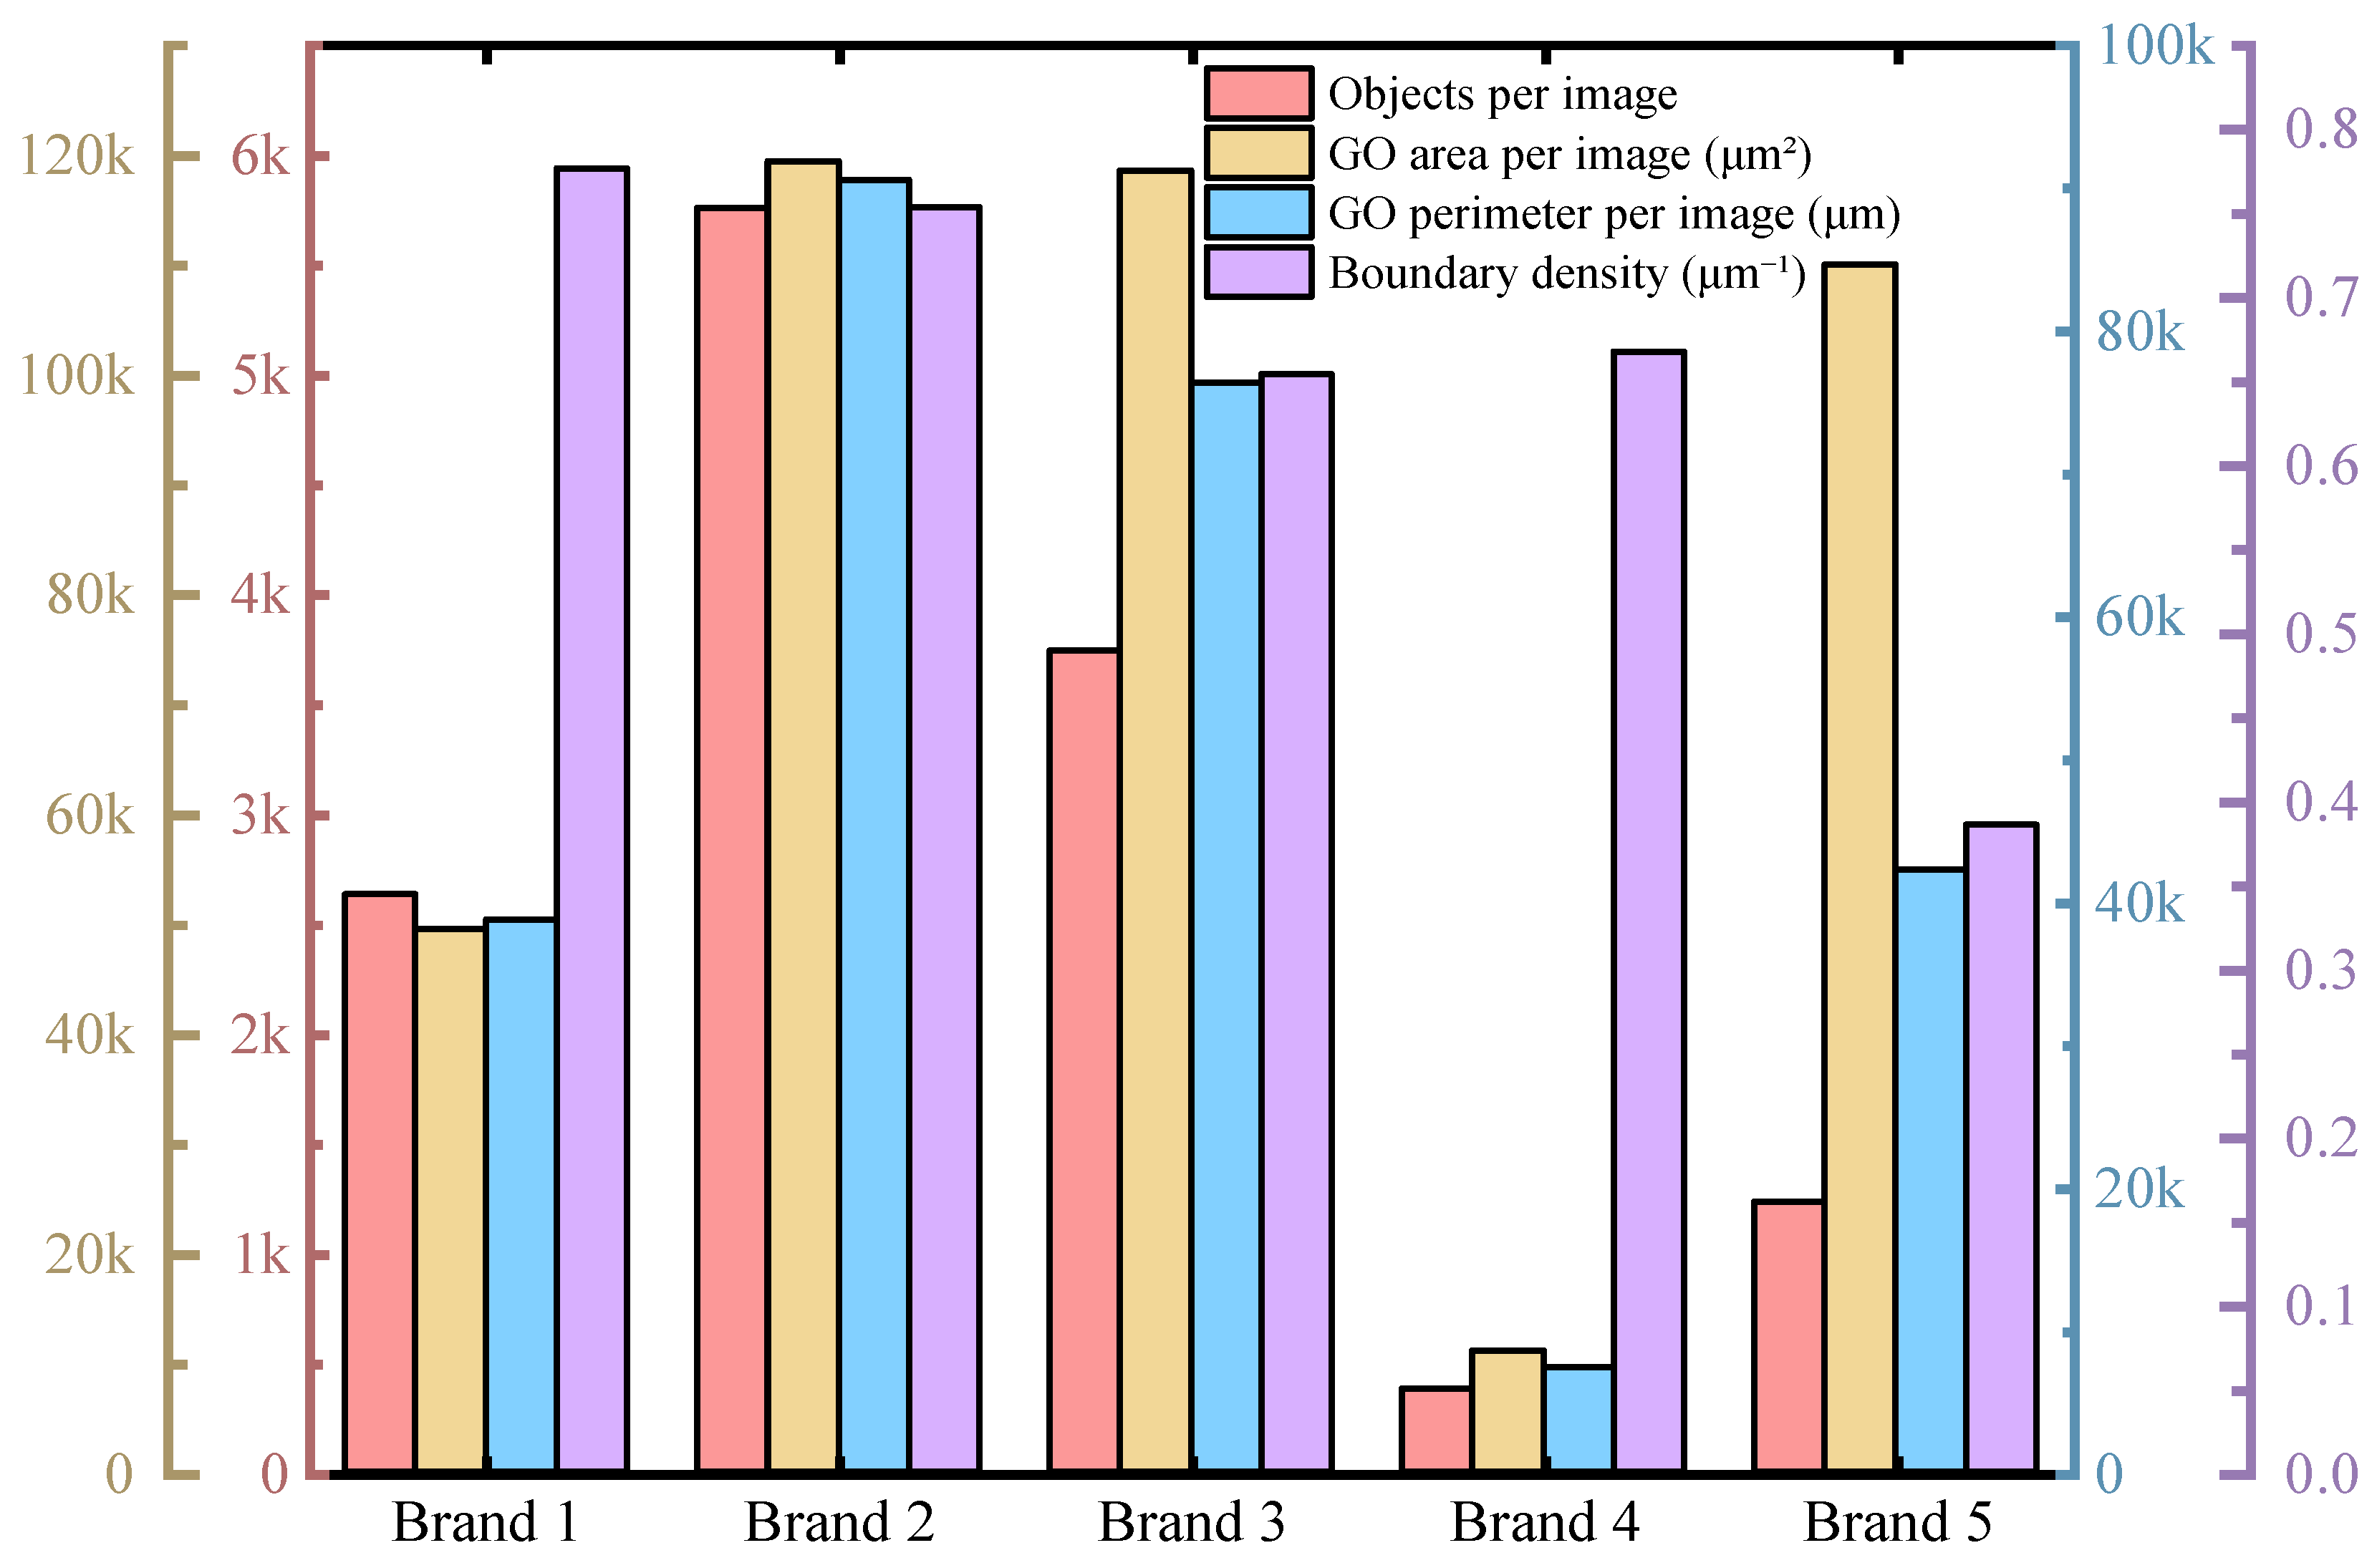
Table 5 summarizes the image-level geometric statistics, including object count per image, projected GO area per image, projected GO perimeter per image, and projected boundary density. Figure 6 further compares these statistics using bar charts. These basic statistics are used to describe the optical image database and to show why the final dispersion quality cannot be determined from a single visible-area or object-count descriptor.
As shown in Table 5 and Figure 6, the five GO products exhibited distinct image-level geometric characteristics under the same imaging and segmentation protocol. Brand 2 showed the highest object count and a large projected GO area, indicating that more GO regions were detected in each field of view. However, the highest projected boundary density was observed for Brand 1 rather than Brand 2, suggesting that object count or visible GO area alone cannot represent boundary richness. Brand 5 further illustrates this limitation: although its projected GO area was comparable to those of Brand 2 and Brand 3, its boundary density was the lowest among all products, implying that much of its visible GO area was contributed by coarser projected objects or agglomerates. These results indicate that image-level statistics provide useful morphological information, but they cannot independently determine the overall initial dispersion quality.
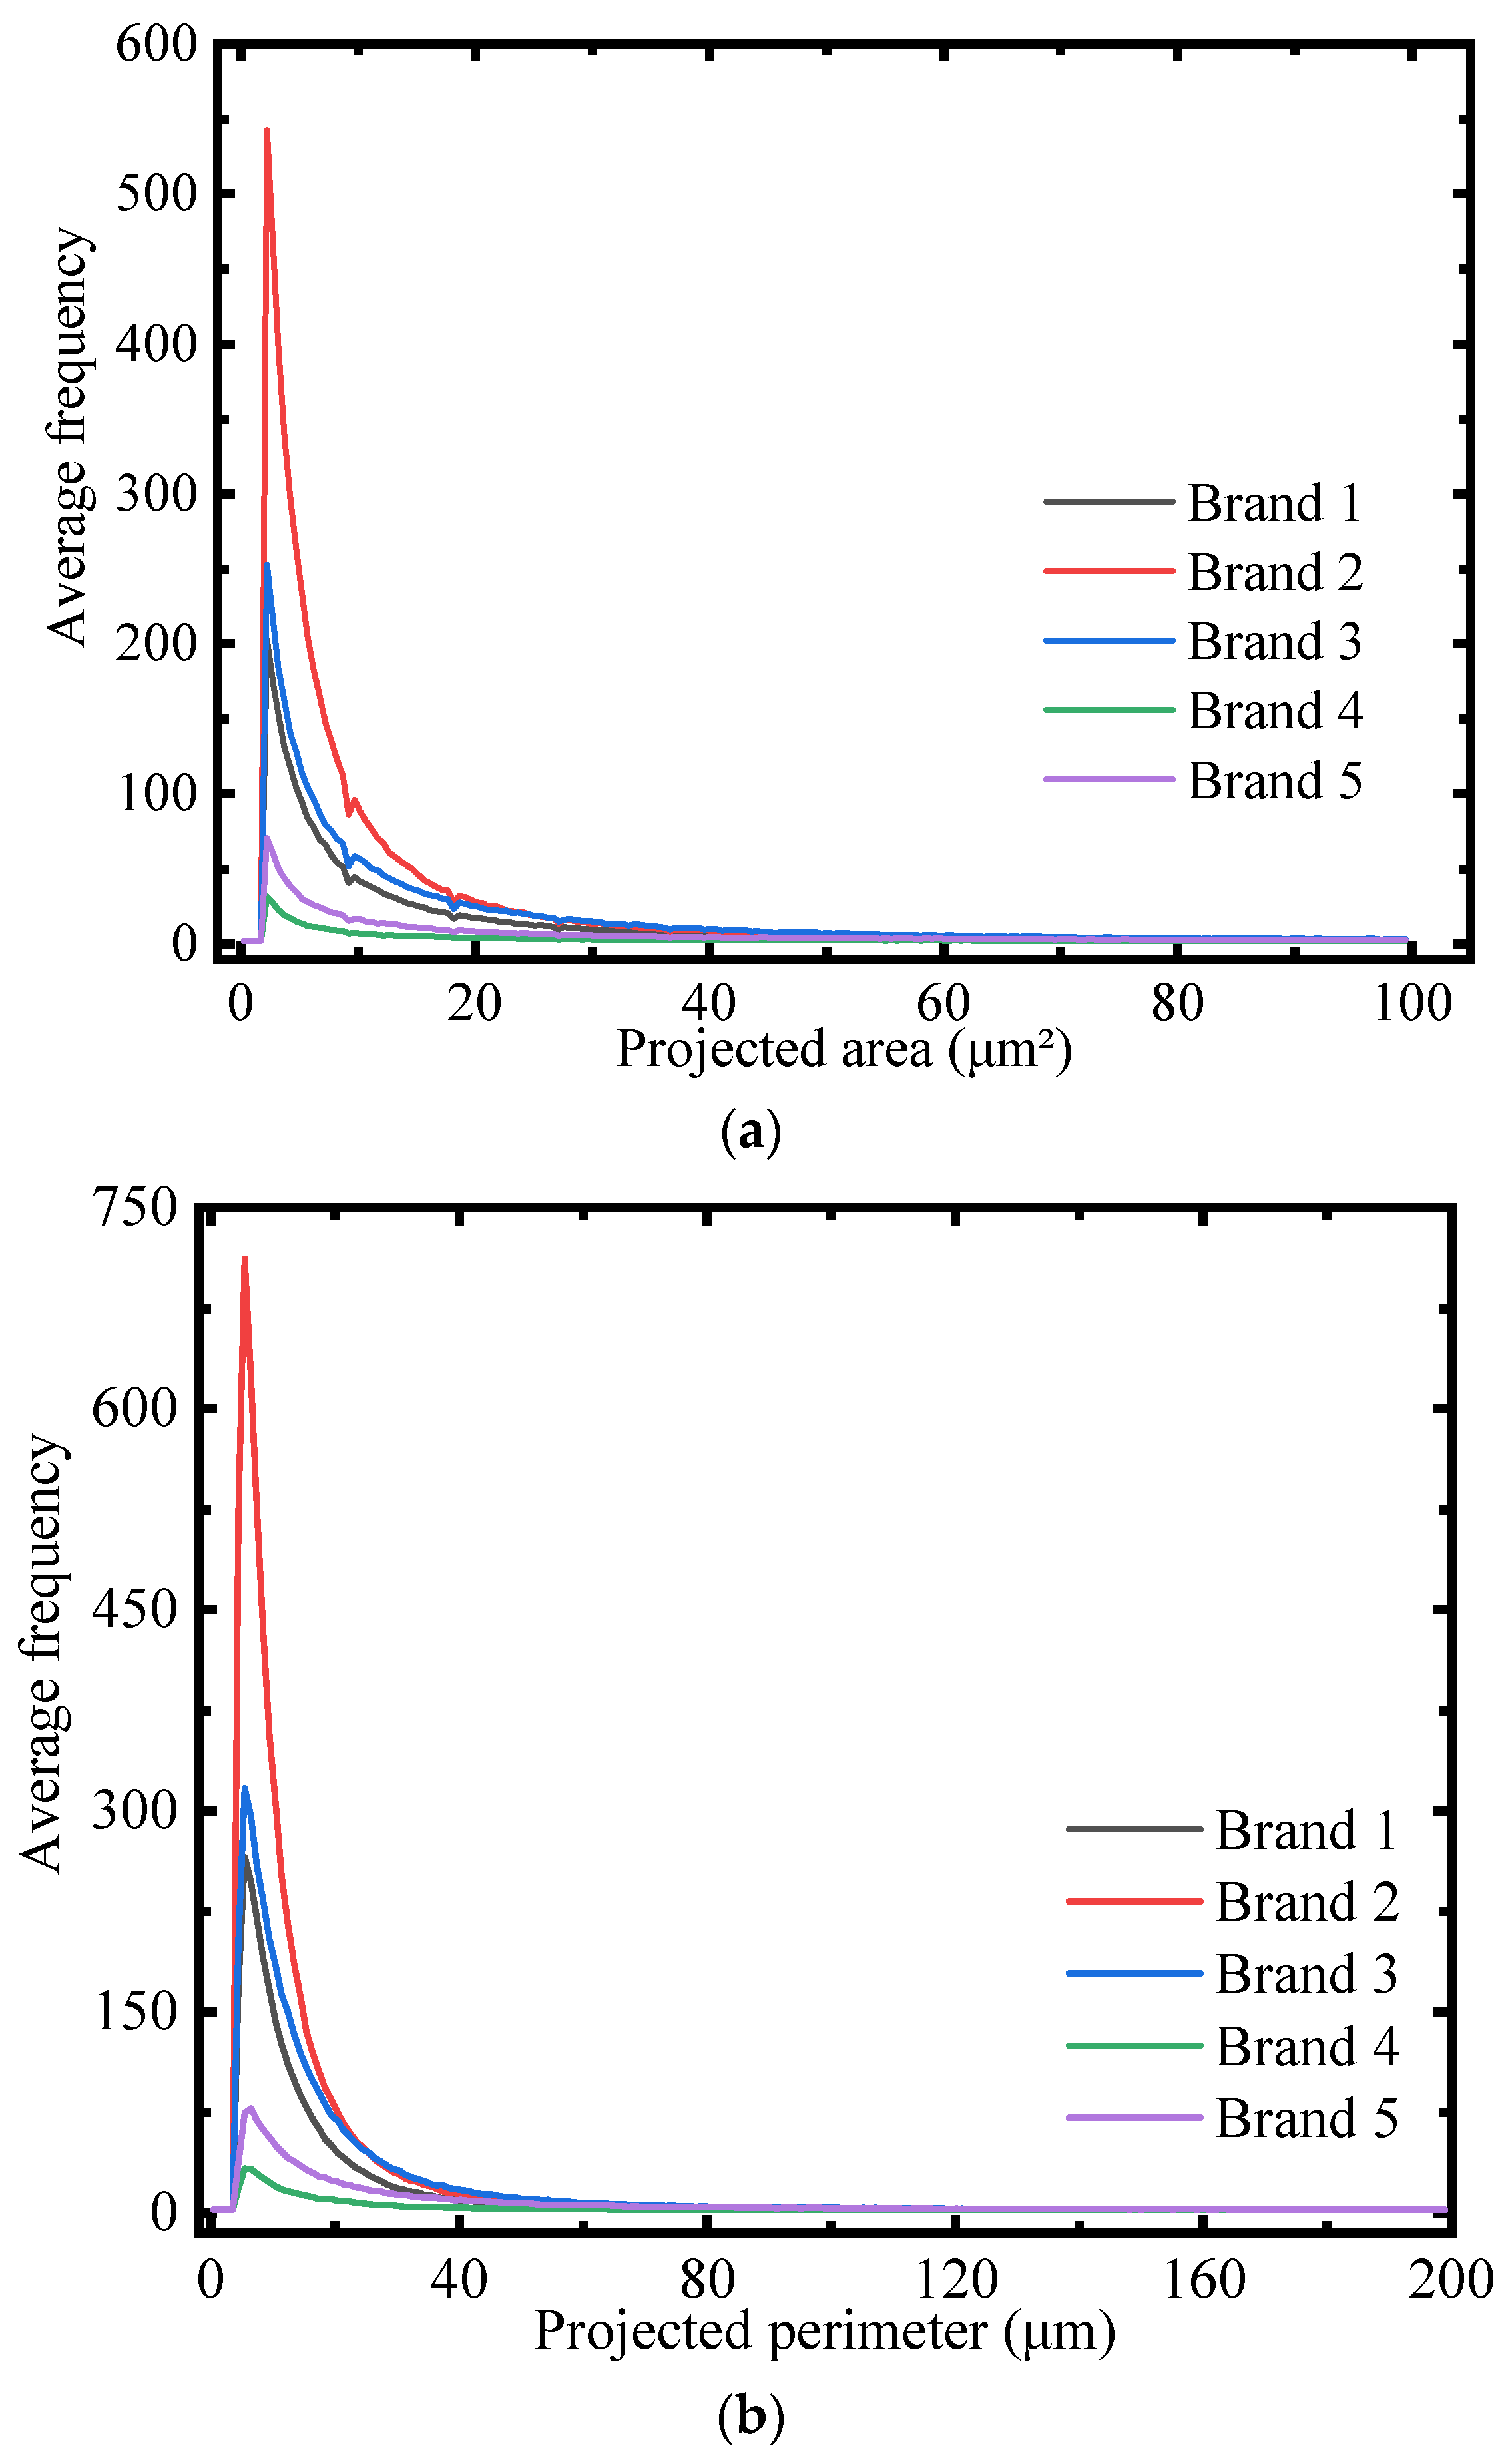
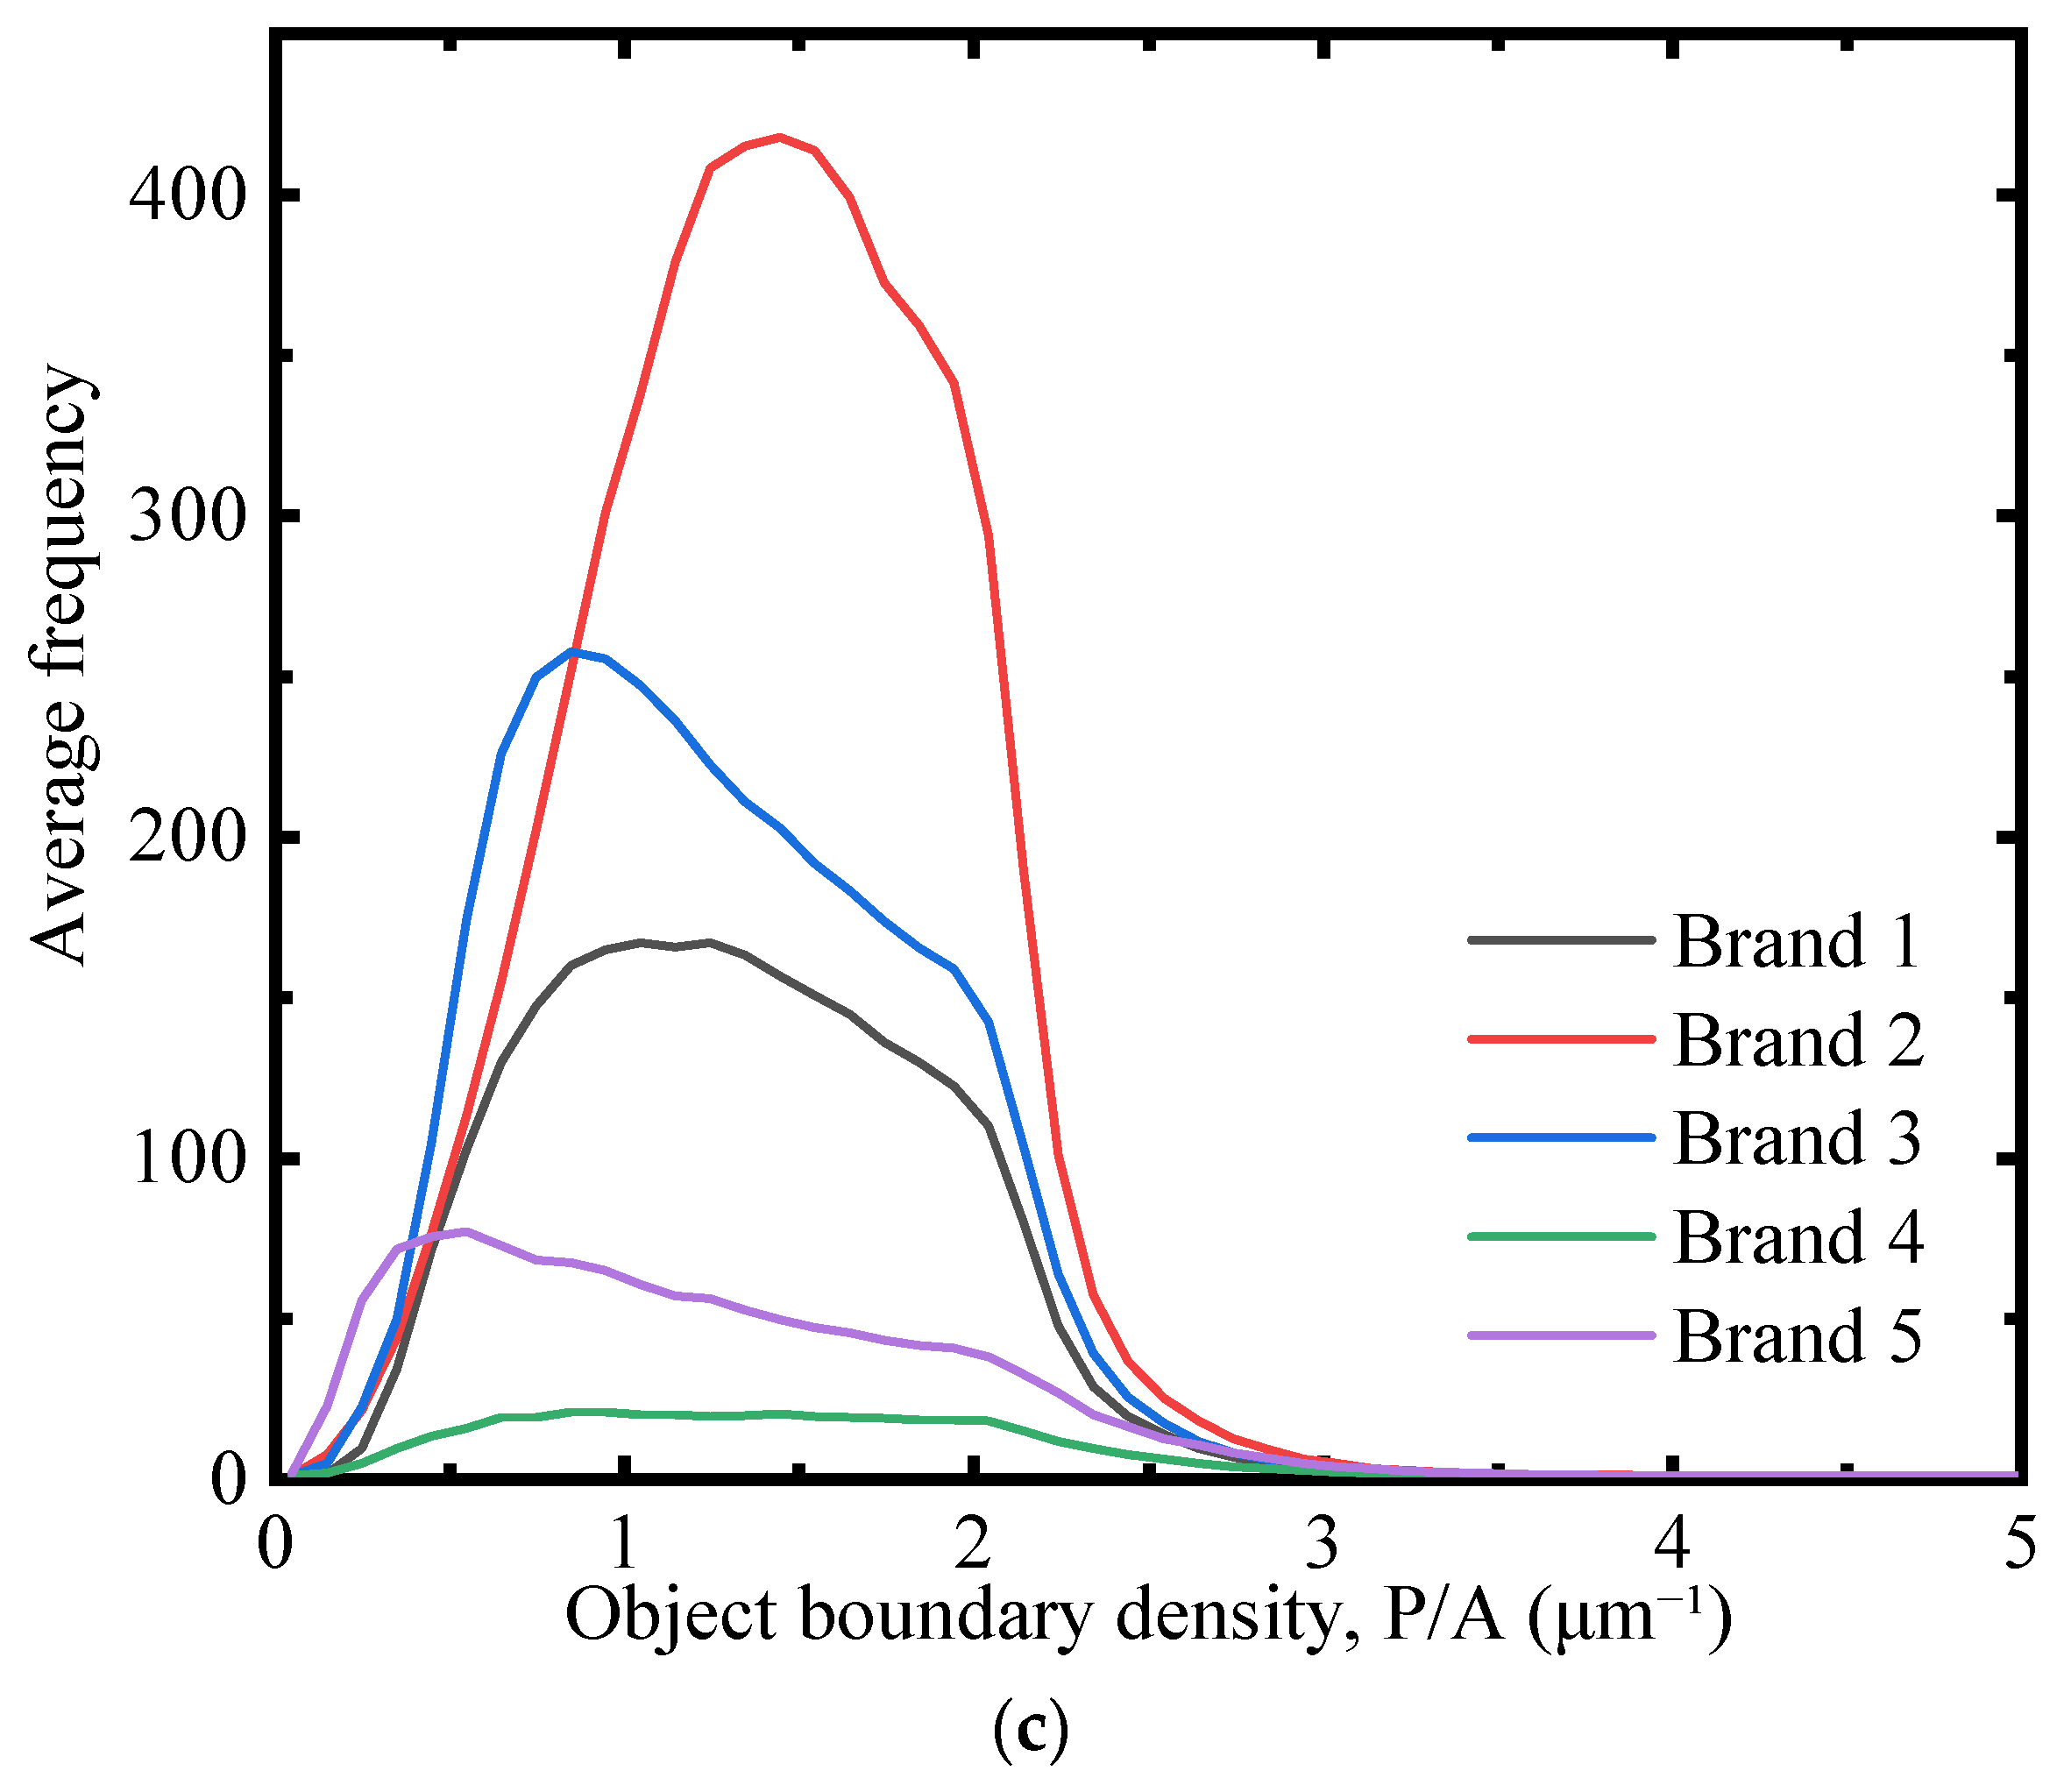
Figure 7 further compares the object-level distributions of projected area, projected perimeter, and boundary density. The projected area and perimeter distributions of all five GO products were strongly right-skewed, indicating that small objects dominated the object population, while large objects occurred less frequently but contributed substantially to the projected GO area. The object-level boundary density distributions also differed among products, showing that the detected GO objects varied not only in size but also in boundary richness. Therefore, object count, projected area, perimeter, and boundary density describe different aspects of the segmented GO morphology, but none of them alone can fully represent the overall initial dispersion quality. Coarse agglomeration and spatial distribution must therefore be further considered in the integrated evaluation.

4.2. Component Factors of the Optical Initial Dispersion Quality Index

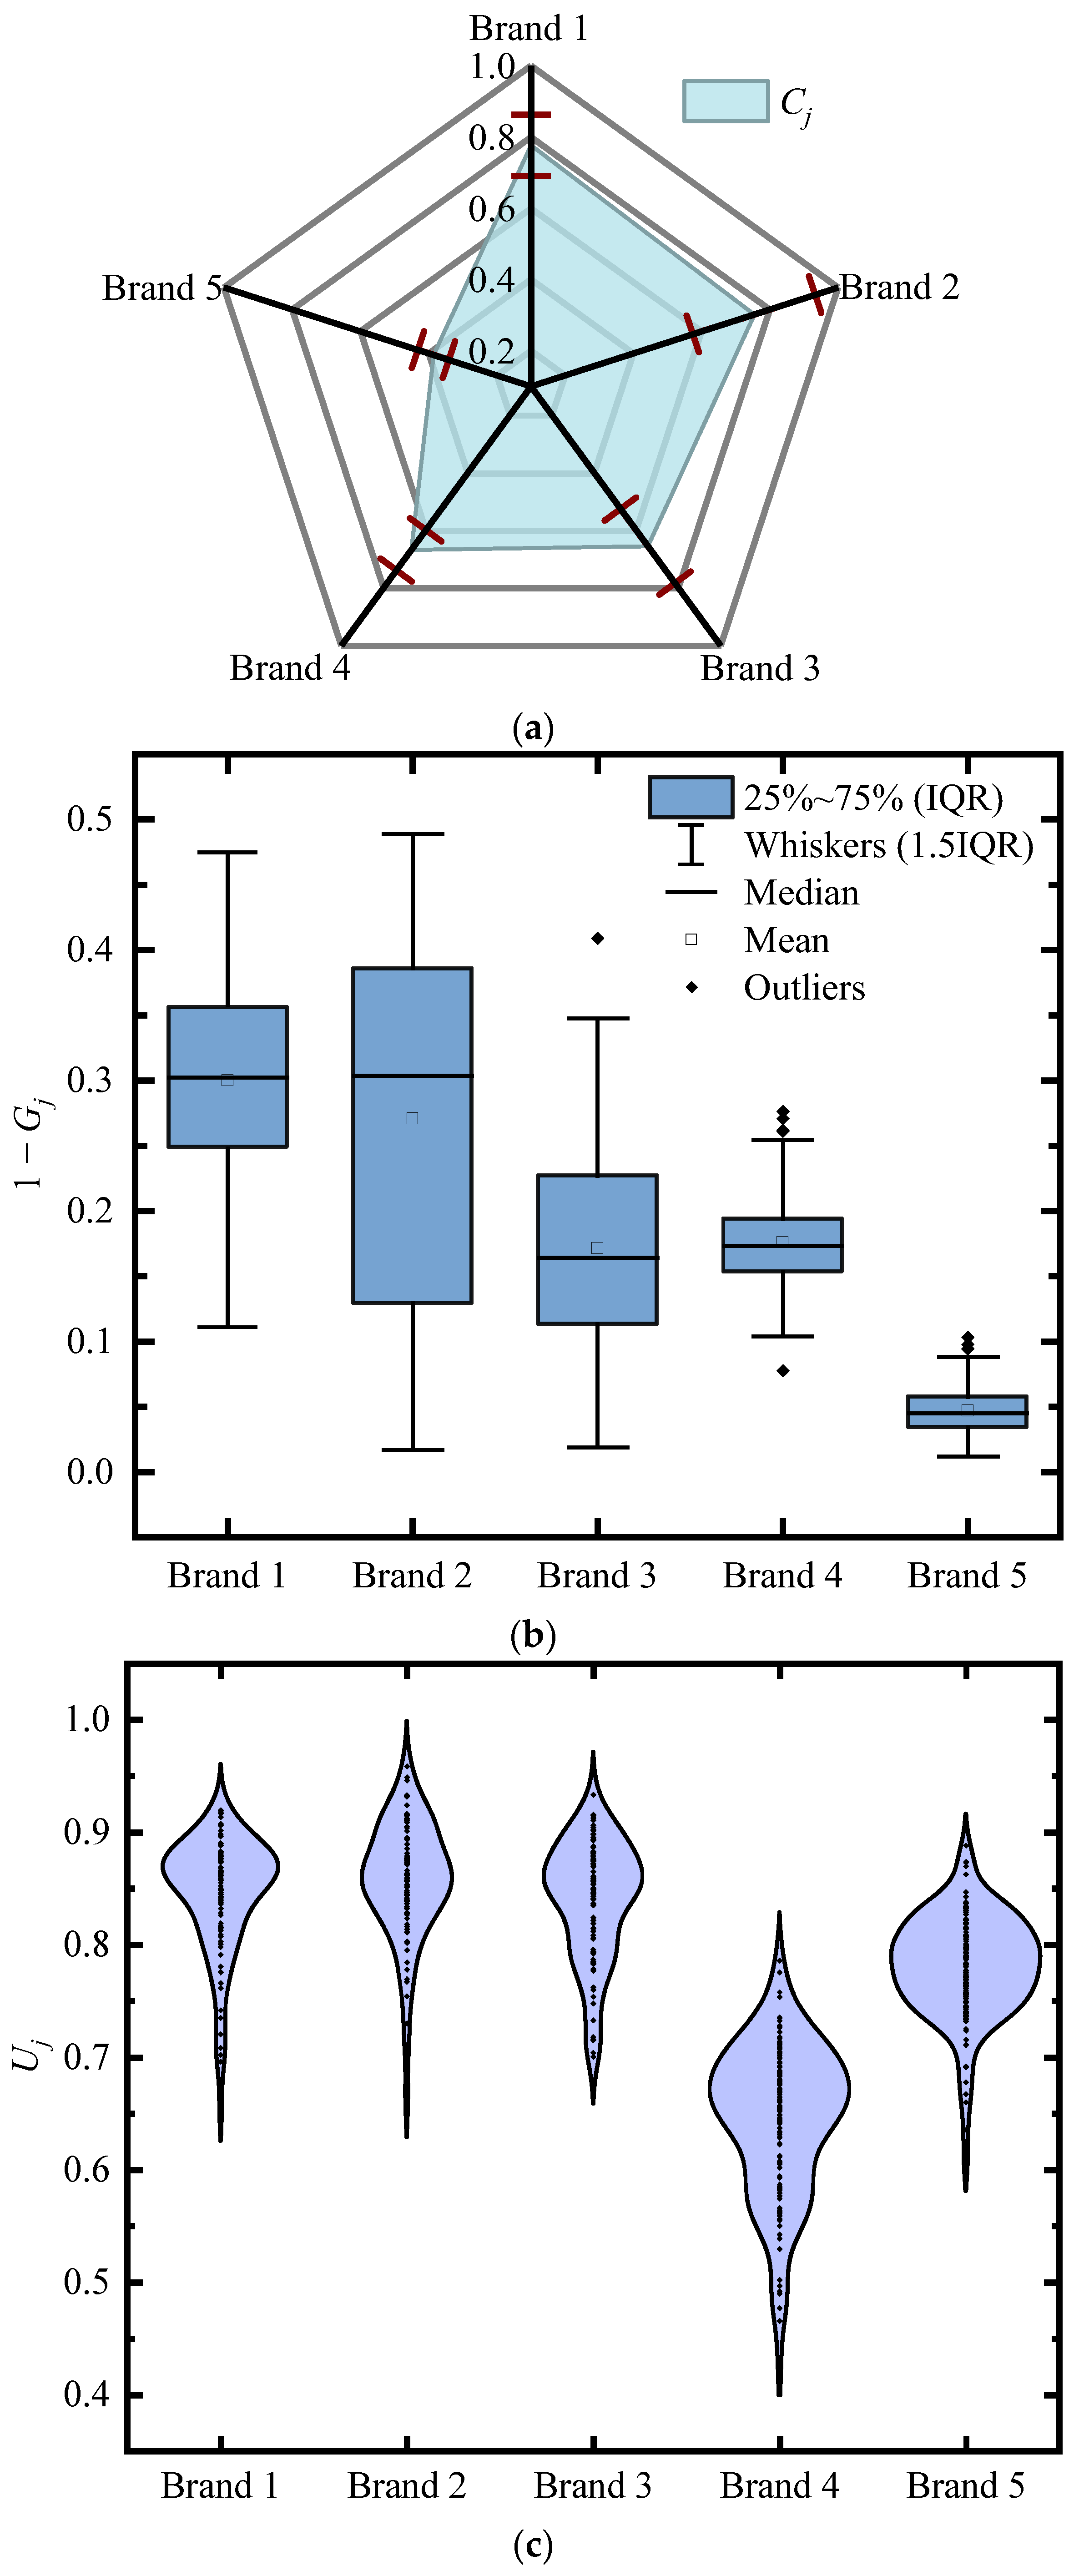
On the basis of the image-level statistics and object-size distributions, the three component factors of the optical initial dispersion quality index were calculated: the Normalized Projected Boundary Density Factor C j , the Coarse-Agglomerate Area Fraction G j , and the Spatial Dispersion Uniformity Factor U j . C j describes boundary richness, G j quantifies the proportion of projected GO area contained in coarse agglomerates, and U j describes the spatial uniformity of segmented GO regions within the optical field.
Table 6 summarizes the component factors and the final optical initial dispersion quality Index, D j . Figure 8 compares the three positive factors used in the index, namely C j , 1 G j , and U j .
As shown in Table 6 and Figure 8, the five GO products exhibited different combinations of projected boundary richness, coarse-agglomerate fraction, and spatial dispersion uniformity. Brand 1 and Brand 2 showed the highest D j values, mainly because they maintained high C j values and relatively large 1 G j values, indicating rich projected boundaries and lower coarse-agglomerate dominance. Brand 3 and Brand 4 showed intermediate D j values. Although their C j values were not the lowest, their 1 G j values were relatively small, indicating that coarse agglomeration reduced their integrated dispersion quality. Brand 5 had the lowest D j , primarily due to its low C j and extremely low 1 G j , suggesting that its visible GO area was dominated by coarse projected objects or agglomerates.
The comparison also shows why the integrated index is necessary. A single descriptor cannot fully represent initial dispersion quality. For example, a product may exhibit acceptable spatial uniformity but still obtain a low D j if its projected boundary richness is weak or its coarse-agglomerate fraction is high. Therefore, the final ranking of D j reflects the combined effect of boundary richness, coarse-agglomerate penalty, and spatial uniformity. At the main threshold condition, the optical initial dispersion quality followed the order: Brand 1 > Brand 2 > Brand 3 > Brand 4 > Brand 5.

4.3. Sensitivity Analysis and Robustness of Dispersion Quality Ranking

After calculating C j , G j , and U j , the optical initial dispersion quality index D j was obtained for each GO product. Since the calculation of G j depends on the selected coarse-agglomerate threshold A c , a threshold sensitivity analysis was first conducted to examine whether the final ranking was controlled by a single threshold value.
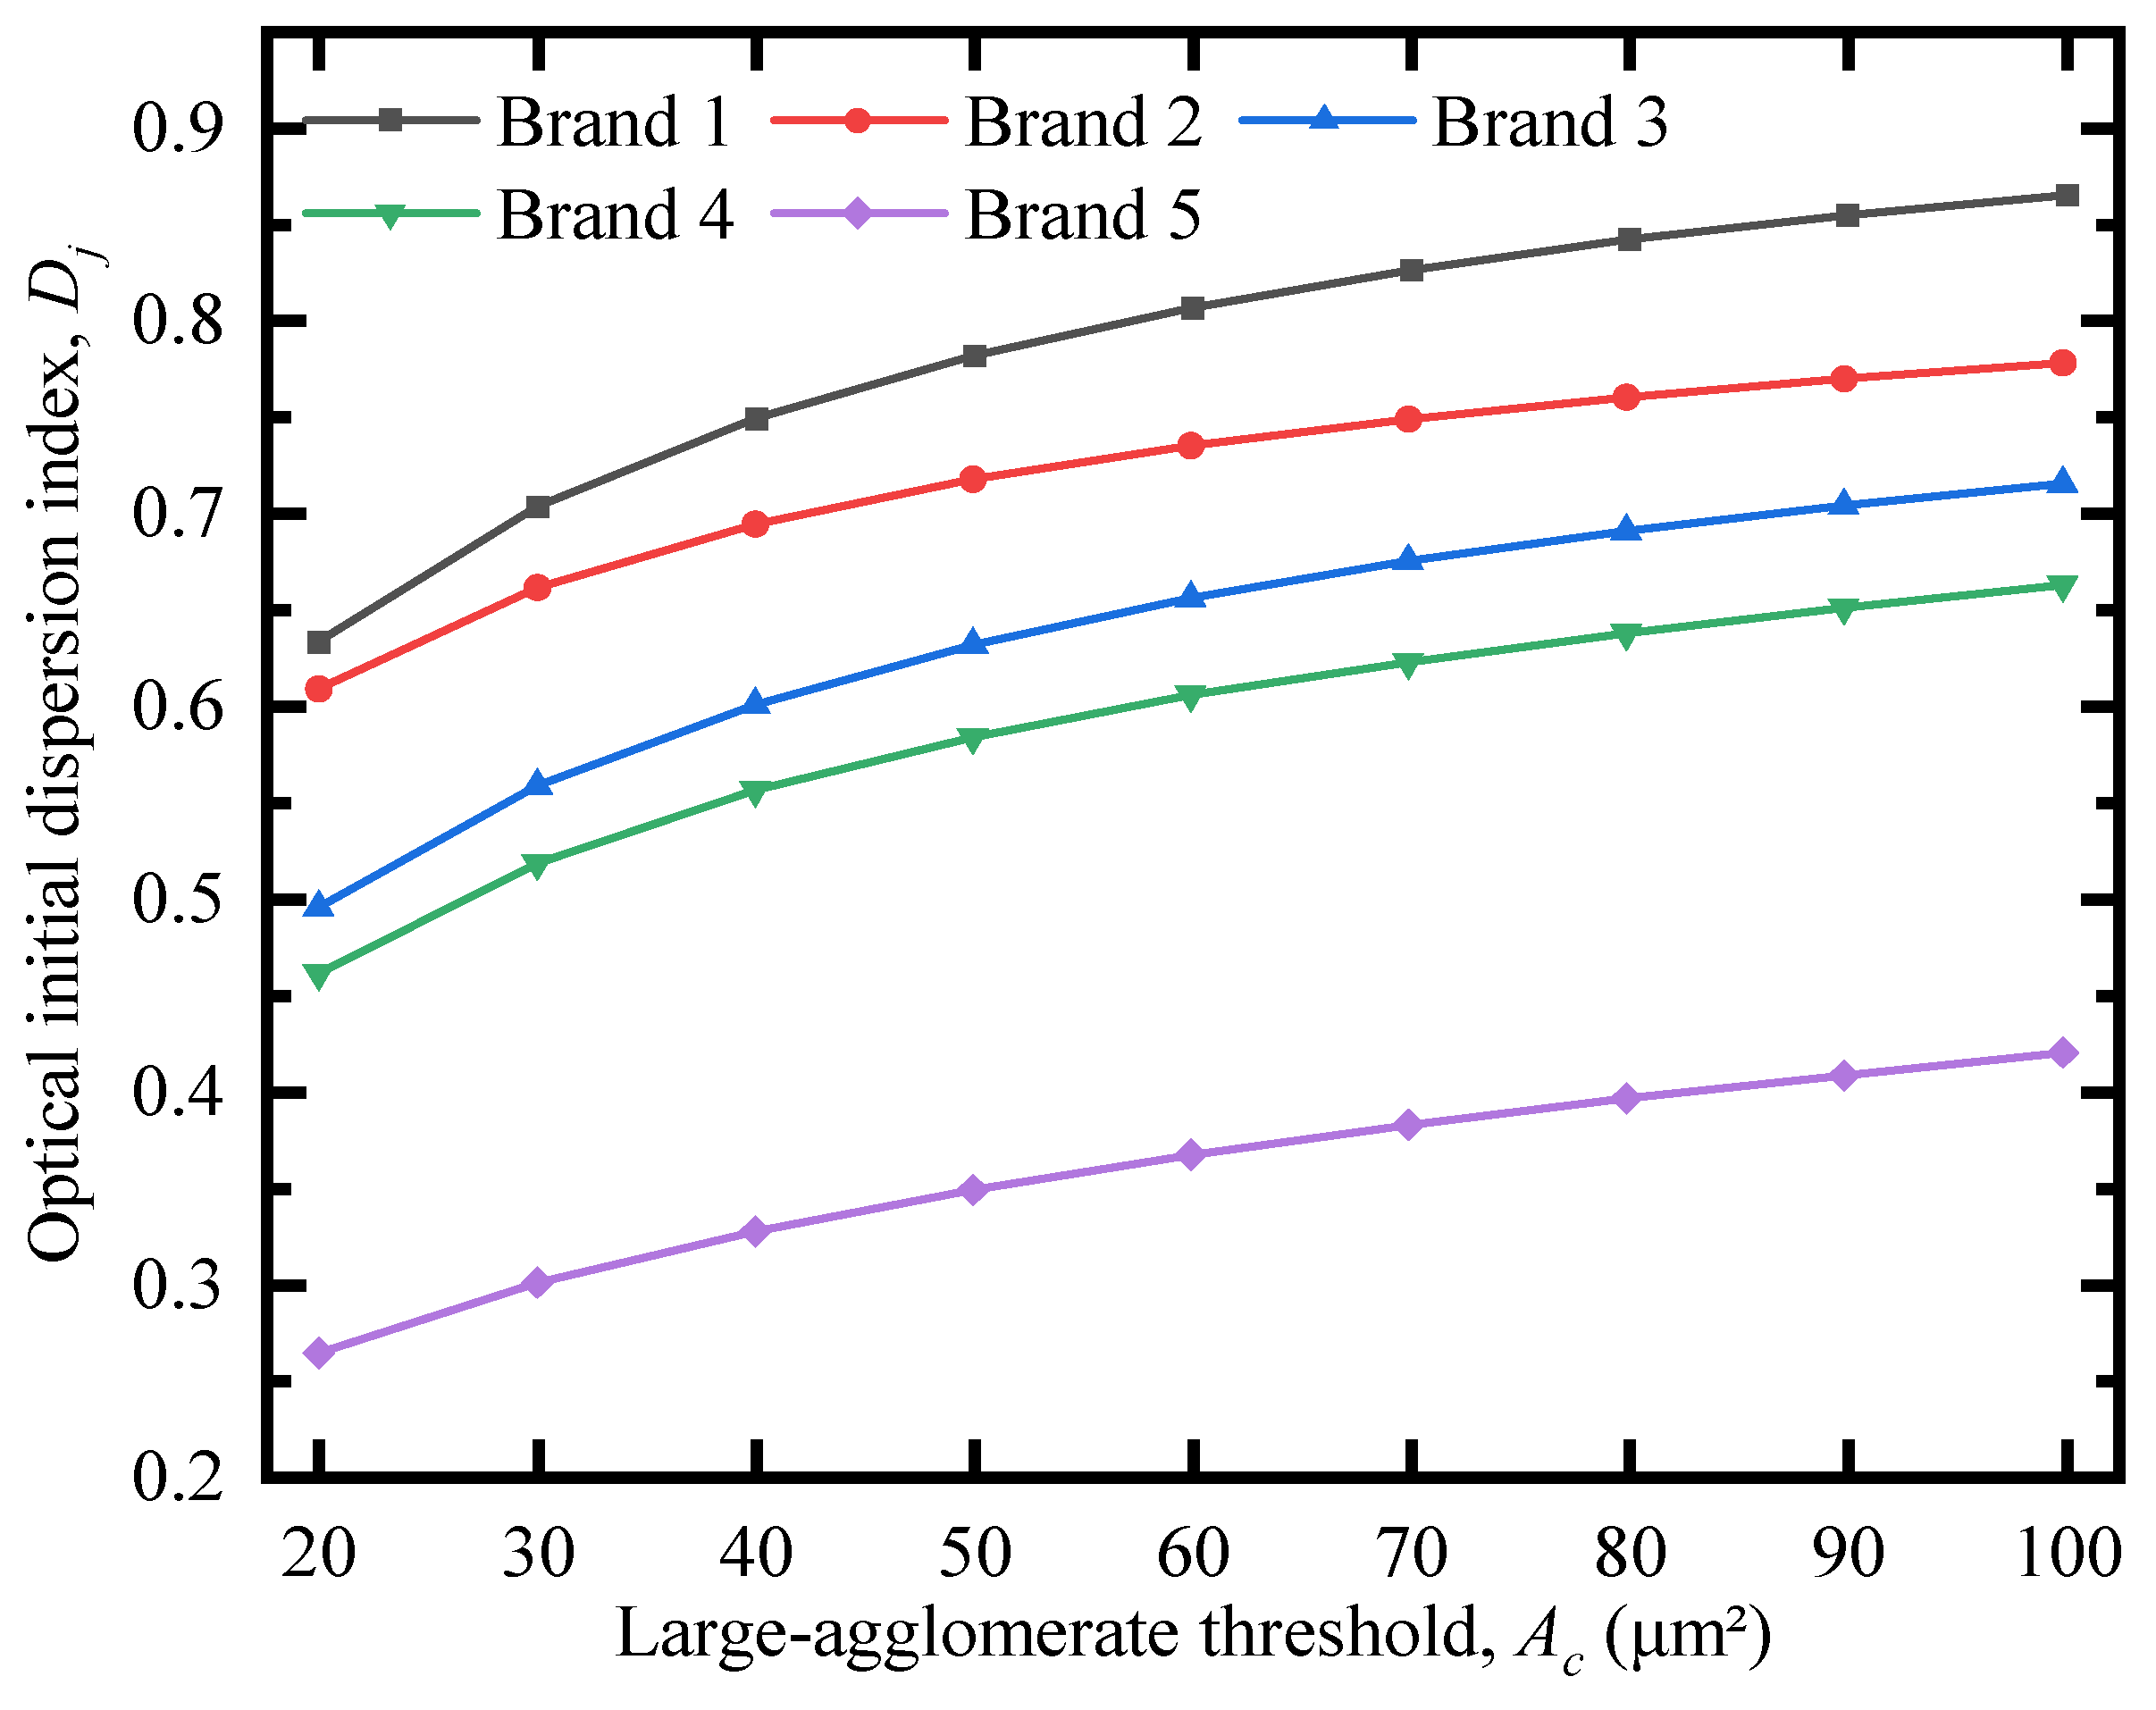
As shown in Figure 9, increasing A c reduced the fraction of GO area classified as coarse agglomerates and therefore increased D j to different extents for all products. However, the relative ranking remained unchanged over the tested threshold range of 20 ~ 100 μ m 2 . The dispersion quality consistently followed the order: Brand 1 > Brand 2 > Brand 3 > Brand 4 > Brand 5. This result indicates that the ranking was not an artifact of the selected baseline threshold A c = 20 μ m 2 , but remained stable over a broader threshold range.
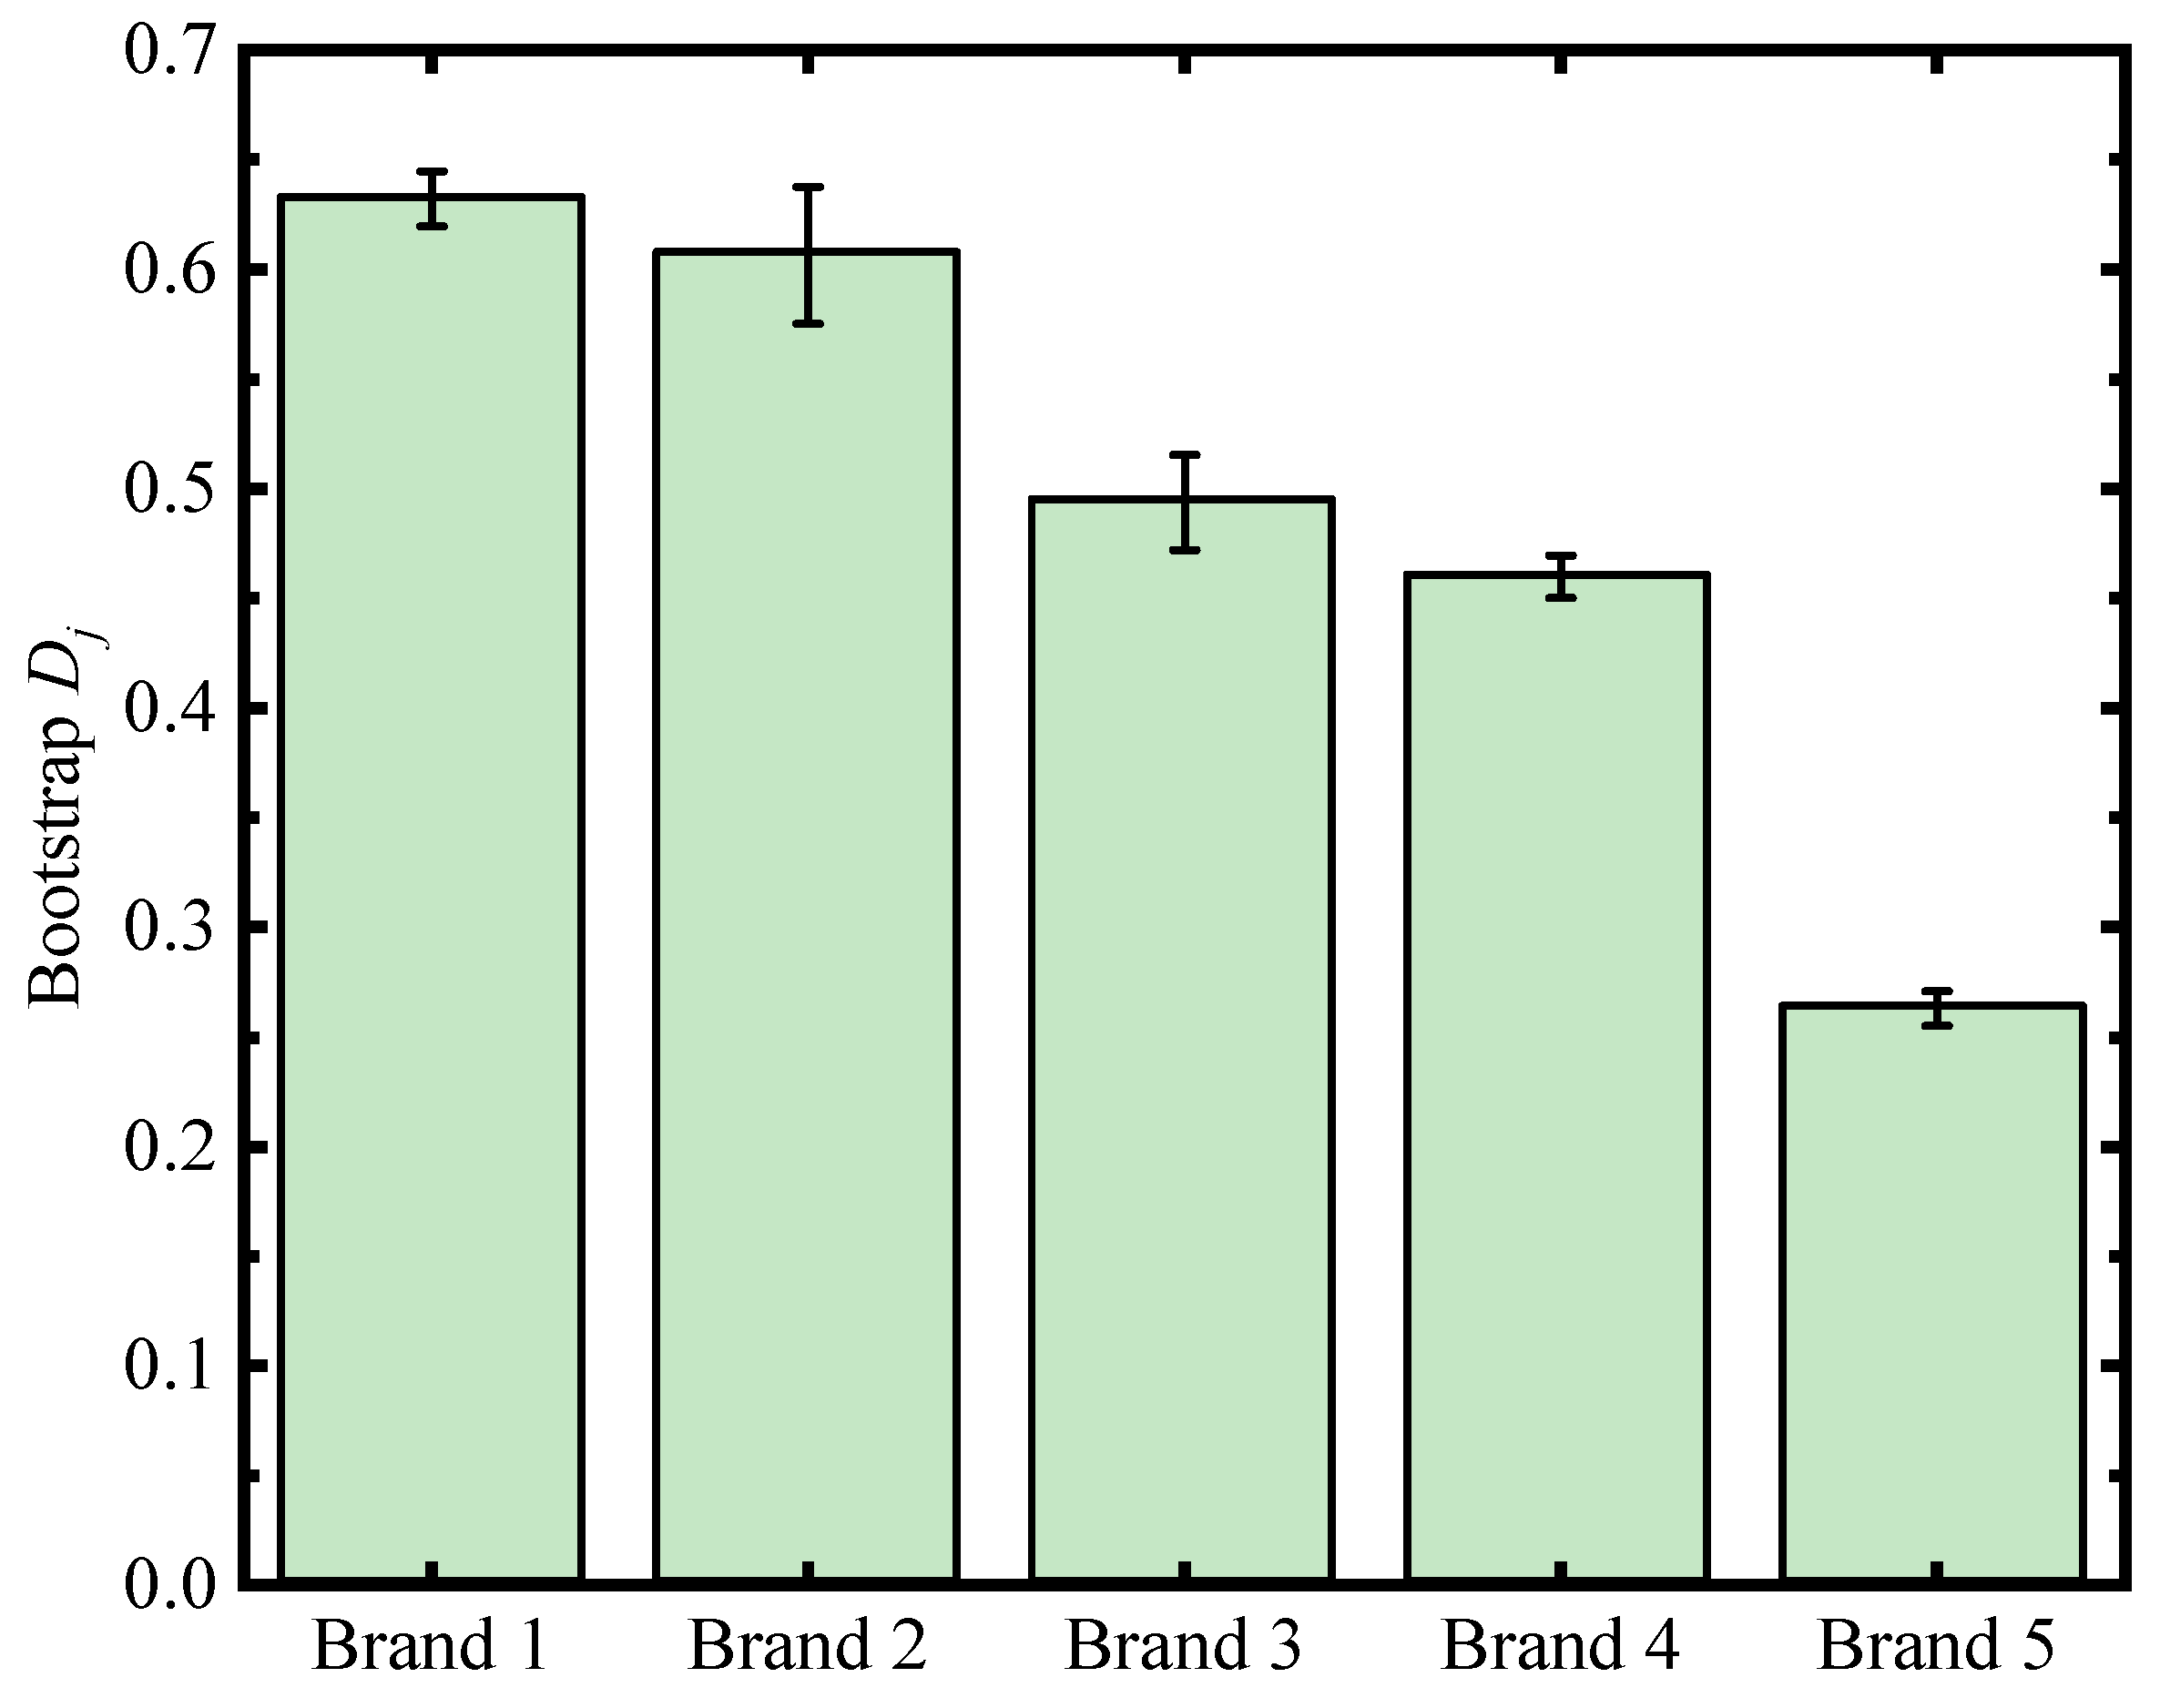
To further evaluate the influence of field-of-view variation, bootstrap resampling was performed using the image-level data. For each GO product, optical micrographs were randomly resampled with replacement using the actual image number of that product as the sampling size. The descriptors C j , G j , U j , and D j were recalculated in each trial, and the process was repeated 1000 times to obtain the statistical distribution and ranking probability of D j .
The bootstrap results are summarized in Table 7 and Figure 10. Brand 1 and Brand 2 showed relatively close D j distributions, indicating minor uncertainty between the top two products. Nevertheless, Brand 1 ranked first in most bootstrap trials, while Brand 2 most frequently ranked second. The rankings of Brand 3, Brand 4, and Brand 5 were highly stable, with Brand 5 consistently showing the lowest D j . These results suggest that the five products can be robustly classified into a high-dispersion-quality group, an intermediate group, and a low-dispersion-quality product.
Considering the complete ranking sequences, the main sequence, Brand 1 > Brand 2 > Brand 3 > Brand 4 > Brand 5, occurred in 91.6% of the bootstrap trials, while the secondary sequence, Brand 2 > Brand 1 > Brand 3 > Brand 4 > Brand 5, occurred in 8.3% of the trials. Therefore, the only notable uncertainty was the relative order between Brand 1 and Brand 2, whereas the overall ranking pattern was highly robust. Combining the threshold sensitivity analysis and bootstrap resampling, the proposed D j -based evaluation method provides a stable optical ranking of the initial dispersion quality of the five GO products.

4.4. Strength-Relevance Examination Based on 3-Day Compressive Strength

To examine the engineering relevance of the optical initial dispersion quality index, D j was compared with the measured 3-day compressive strength enhancement ratio, η j . The strength results were not used to construct, normalize, or calibrate D j , but were used as independent external data to evaluate whether the image-derived optical dispersion ranking was consistent with early-age mechanical performance under the fixed experimental conditions.
As shown in Table 8, the 3-day compressive strength of the control group was 51.1 MPa. After incorporating different GO products at the same dosage, the 3-day strength increased to different extents. Brand 1 achieved the highest strength of 60.8 MPa, corresponding to a strength enhancement of 19.2%, followed by Brand 2, Brand 3, Brand 4, and Brand 5. The strength enhancement ranking was therefore: Brand 1 > Brand 2 > Brand 3 > Brand 4 > Brand 5.
This ranking was identical to the D j -based optical dispersion ranking, indicating that the initial optical dispersion quality was consistent with the early-age strength contribution of the five GO products under the same GO dosage, mixture proportion, and curing age.
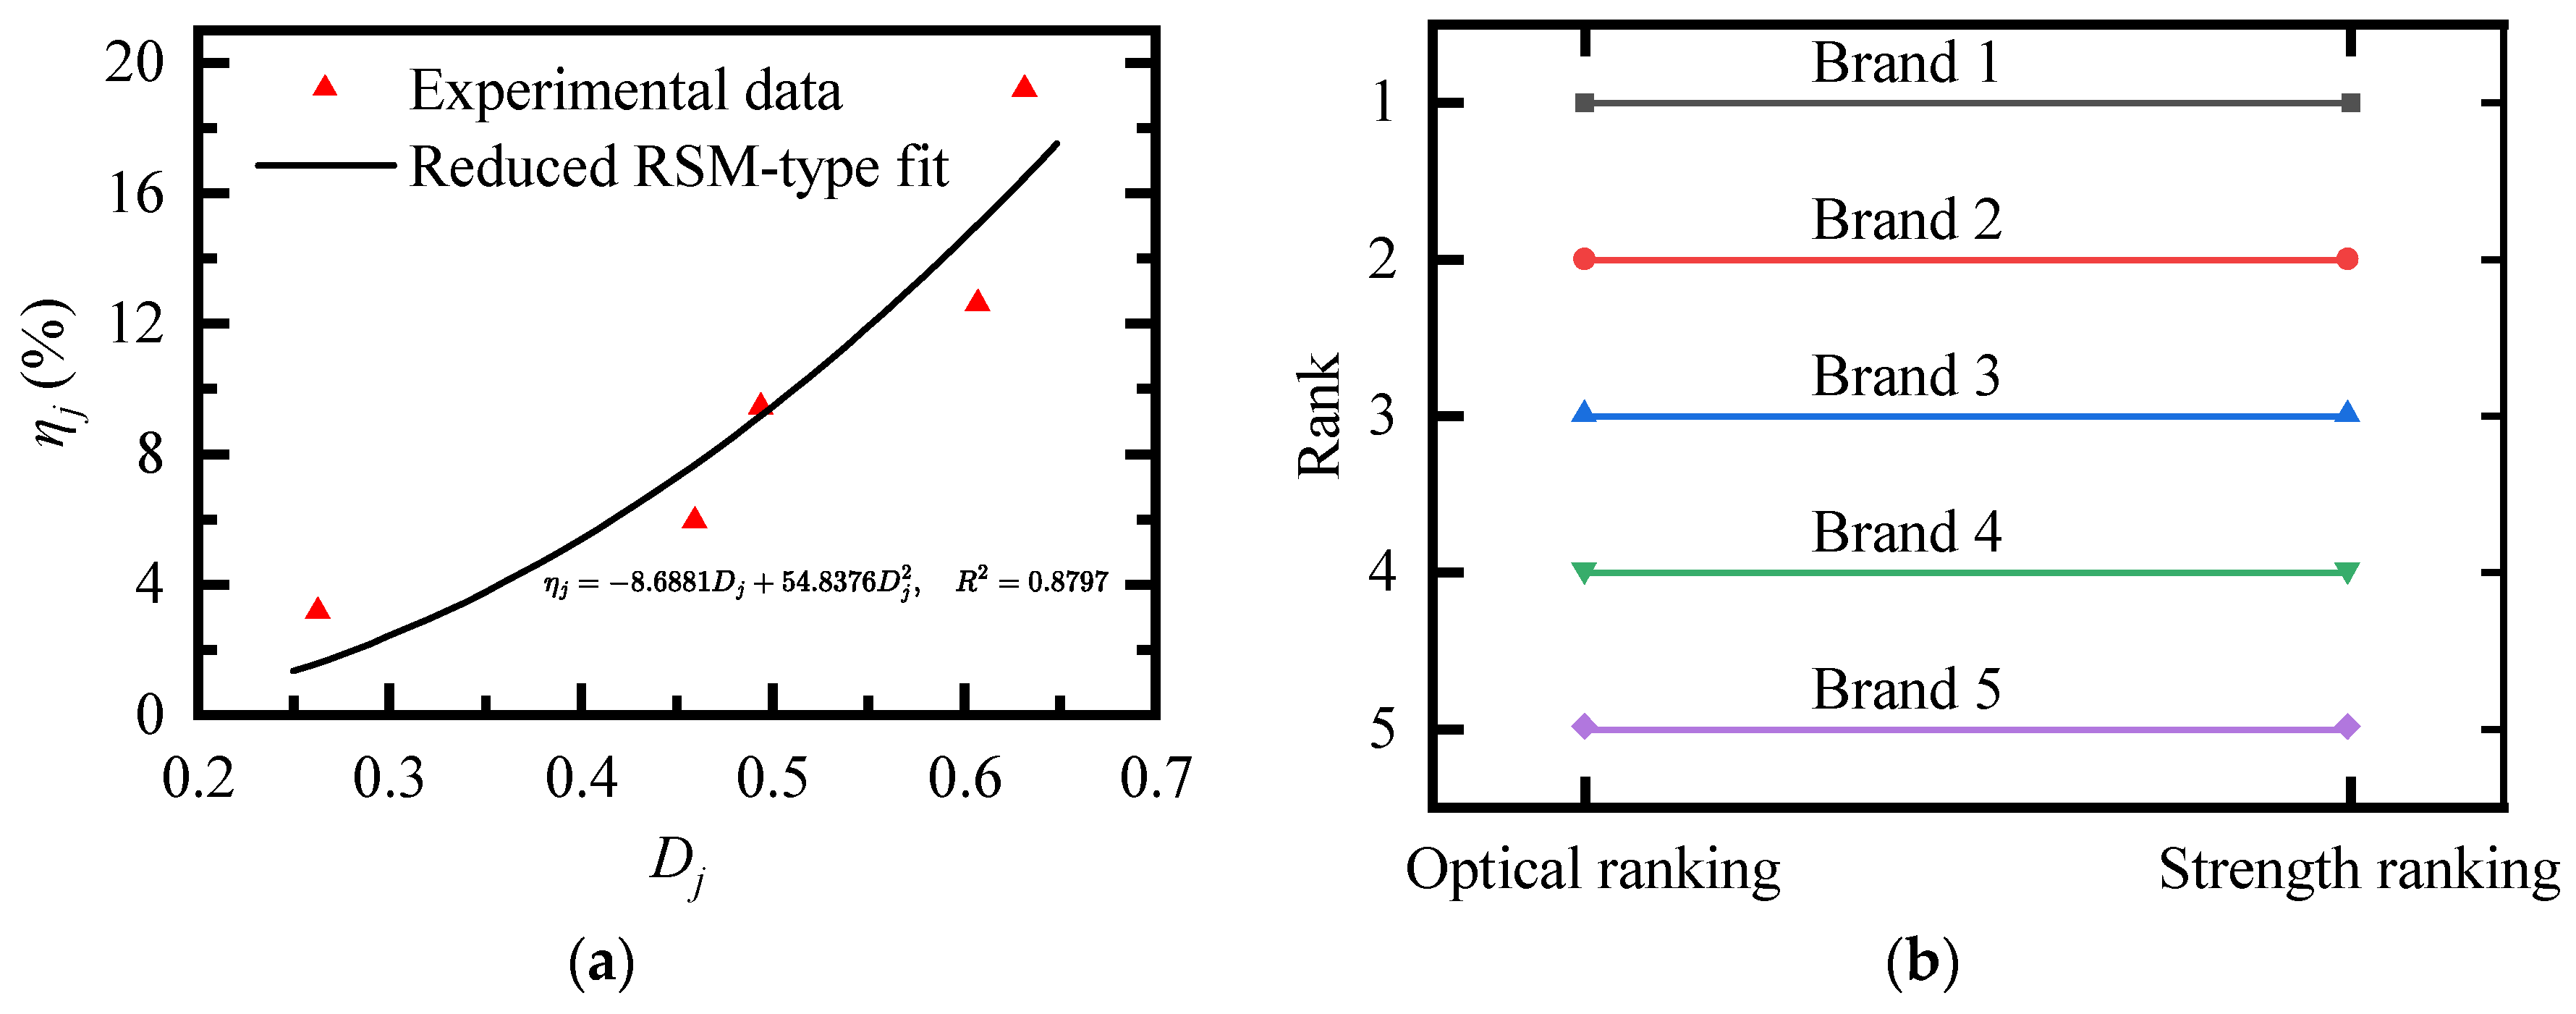
To further visualize the relationship between D j and strength enhancement, a reduced empirical quadratic fit was performed:
η j =   8.6881 D j +   54.8376 D j 2
with a coefficient of determination of R 2 = 0.8797 .
As shown in Figure 11a, a higher D j generally corresponded to a higher 3-day strength enhancement. However, this quadratic relationship should be interpreted only as a dataset-specific empirical trend. Because only five GO products, one GO dosage, one mixture proportion, and one curing age were considered, the fitted coefficients have no transferable physical meaning and should not be used as a general strength prediction model.
More importantly, the ranking consistency between D j and η j was examined using the Spearman rank correlation coefficient. Since all five GO products had identical ranks in the optical dispersion ranking and the strength enhancement ranking, the rank difference d j was zero for every product, giving: ρ s = 1.0 .
Figure 11b further compares the two ranking sequences. The complete agreement between the optical ranking and the strength-enhancement ranking indicates that the proposed image-derived D j index was consistent with the relative early-age strength enhancement of the five GO products under the fixed experimental conditions.
Therefore, the strength-relevance examination supports the practical use of D j as a comparative pre-selection index for commercial GO products. Nevertheless, the present validation is limited to the tested dosage, mixture proportion, curing age, and product set. Further experiments involving more GO products, different dosages, and additional curing ages are required before the empirical relationship can be extended to broader strength prediction.

5. Discussion

5.1. Significance of the Optical Dispersion Index

The results show that the initial dispersion quality of GO suspensions cannot be evaluated reliably using a single image-derived parameter. Object count, projected GO area, projected perimeter, and projected boundary density describe different aspects of the segmented optical morphology. A large projected GO area may originate from either well-separated GO sheets or coarse agglomerates, and a high object count does not necessarily indicate good spatial uniformity. Therefore, these basic parameters are useful for describing the image database, but they are insufficient as independent criteria for ranking dispersion quality.
The proposed optical initial dispersion quality index, D j , integrates three complementary descriptors: projected boundary richness ( C j ), non-coarse-agglomerated area factor ( 1 G j ), and spatial dispersion uniformity ( U j ). This construction reflects the fact that good dispersion requires several conditions to be satisfied simultaneously. A suspension with rich projected boundaries may still be poorly dispersed if coarse agglomerates dominate the visible area, while a sample with limited agglomeration may still be unsuitable if GO regions are locally clustered. Therefore, the geometric-mean form of D j emphasizes the short-board effect of dispersion quality.
The sensitivity analysis and bootstrap resampling further support the robustness of the proposed index. The ranking of D j remained stable when the coarse-agglomerate threshold A c varied from 20 to 100 μm2, and bootstrap analysis showed that the main ranking sequence occurred in most resampling trials. These results indicate that the final ranking was not controlled by a single threshold choice or by random field-of-view variation.

5.2. Comparison with Published GO-Cementitious Material Results

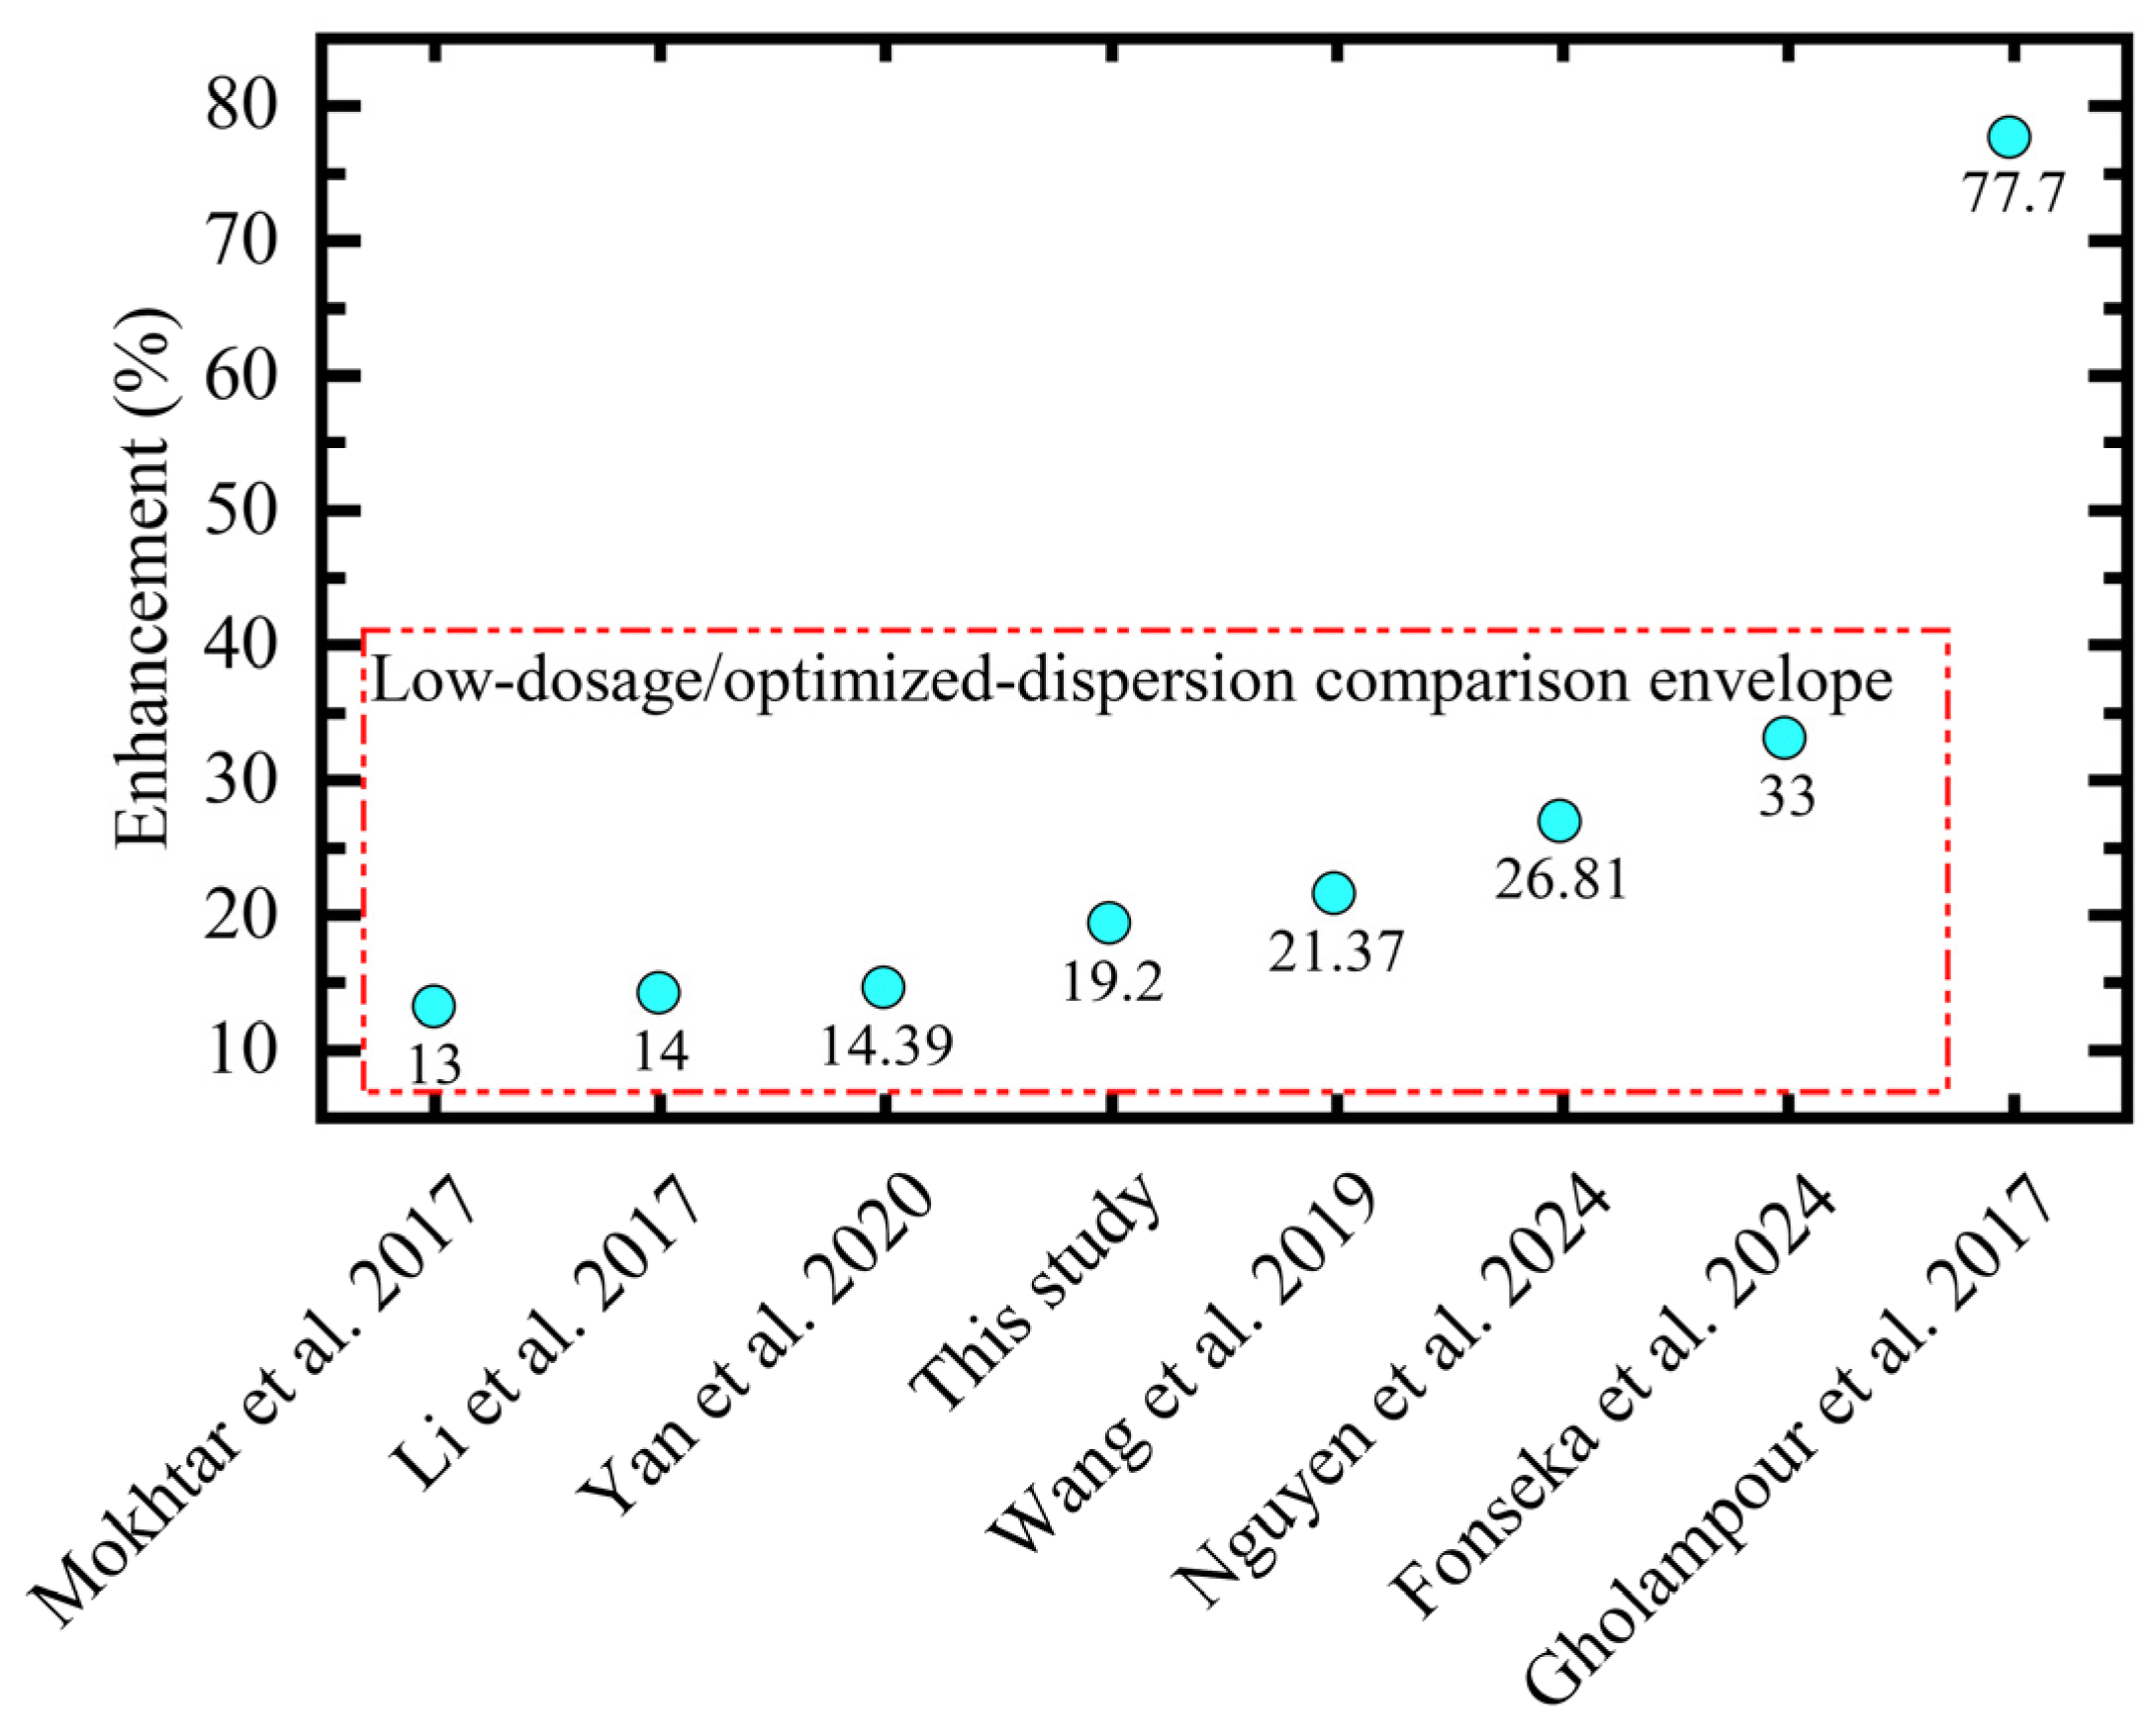
Published GO-cementitious studies generally report mechanical benefits, but the reported strength increments are highly scattered. As summarized in Figure 12, representative compressive-strength enhancements range from approximately 13~14% in low-dosage paste or mortar systems [10,11,20] to more than 70% in a high-response mortar system [27]. In the present study, the maximum 3-day strength enhancement reached 19.2% at 0.03 wt% GO, which falls within the reported range and is close to values reported at similar GO dosages of 0.03~0.04 wt% [11,28].
This scatter is the key methodological issue. Final compressive strength alone cannot isolate the effect of initial GO dispersion quality because GO source, dosage, flake size, oxidation degree, dispersing agent, sonication procedure, superplasticizer system, matrix composition, and curing age often change simultaneously among different studies. In the present work, the GO dosage, mixture proportion, curing age, imaging protocol, and image-processing procedure were fixed, while C j , G j , U j , and D j were measured before cement mixing. Therefore, the published data are used to position the proposed method rather than to benchmark its strength performance. The proposed D j index provides a pre-mixing screening variable for comparing commercial GO products before strength testing or further mixture optimization.

5.3. Position Relative to Conventional Dispersion Characterization Methods

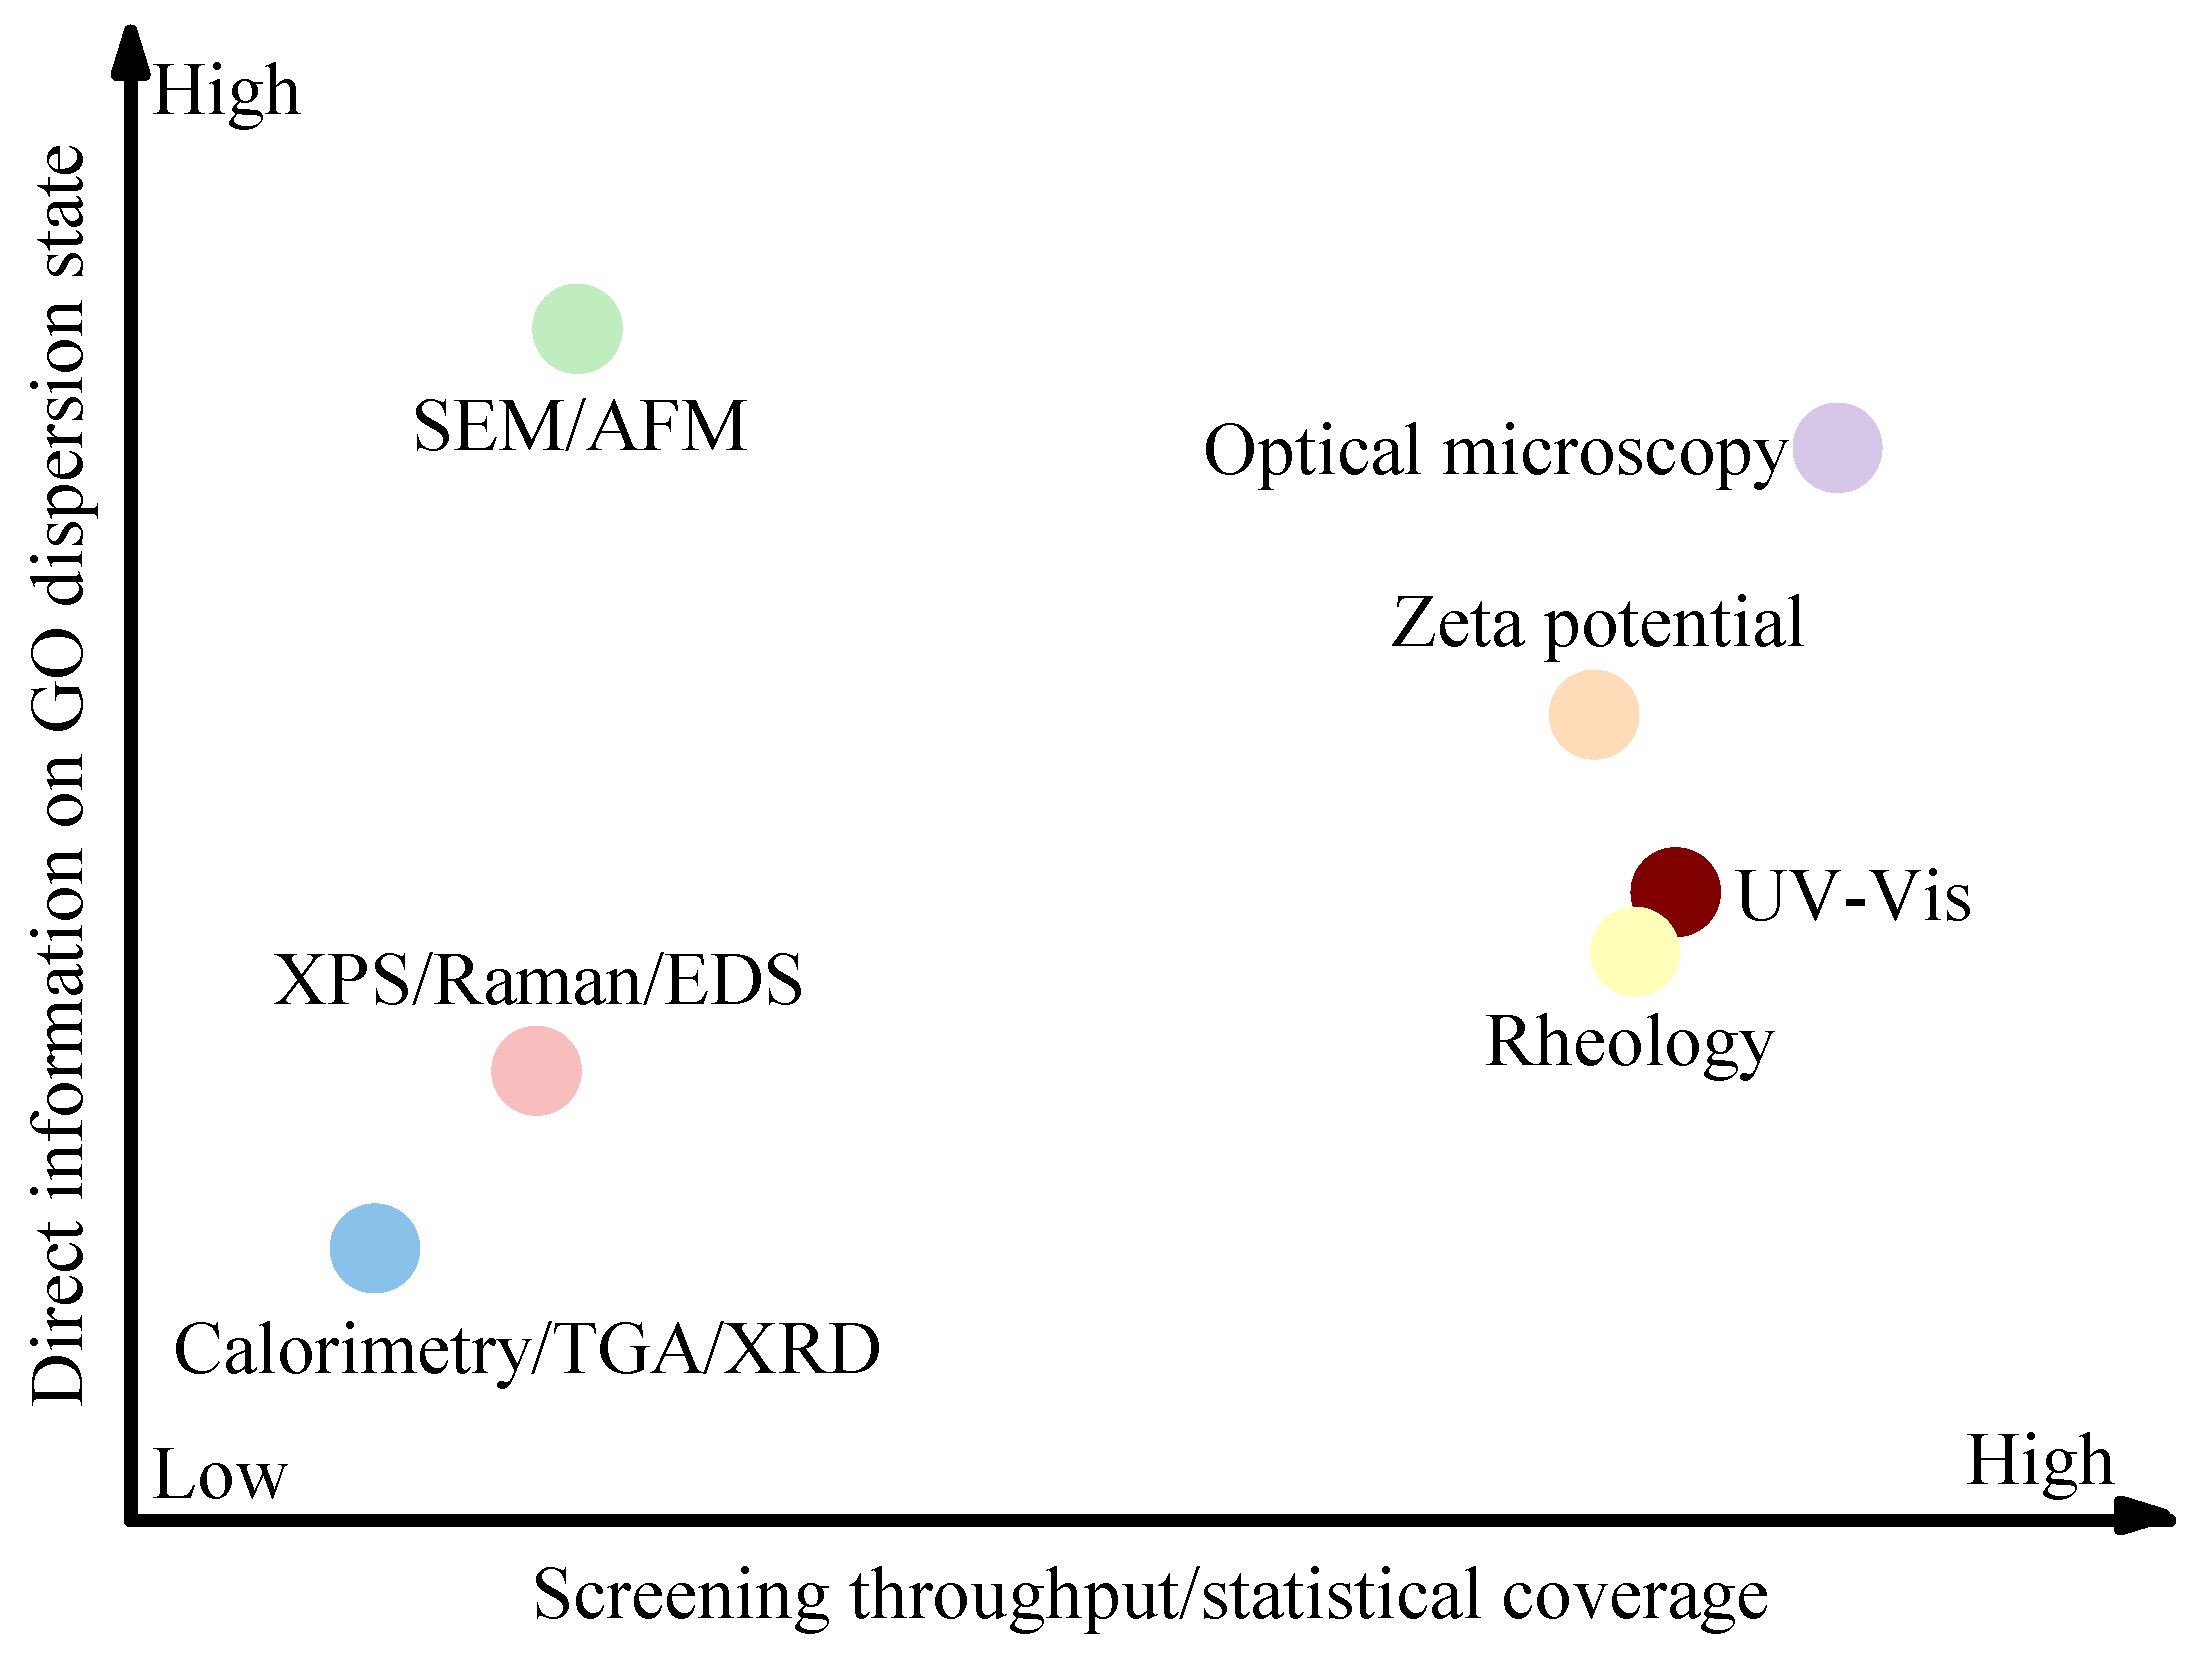
The proposed optical microscopy framework should be positioned as a high-throughput morphology-based screening method rather than a replacement for conventional characterization techniques. As shown in Figure 13, different methods provide different types of information on GO or GO-modified cementitious systems. SEM and AFM can provide direct and high-resolution morphological information on GO sheets or agglomerates, but their limited field coverage and sample-preparation requirements restrict their efficiency for statistical screening of many suspension images. XPS, Raman spectroscopy, and EDS are useful for identifying chemical composition, oxidation degree, and structural features of GO, but they do not directly describe the spatial dispersion state of GO sheets in suspension.
Zeta potential, UV–Vis spectroscopy, and rheology provide important complementary information. Zeta potential is commonly used to evaluate surface charge and colloidal stability, while UV–Vis spectroscopy can monitor bulk dispersion stability through optical absorbance changes. Lu et al. used UV–Vis spectroscopy, zeta potential, particle size analysis, and SEM/AFM to compare GO dispersion in water and cement pore solution, showing that dispersion behavior in water may differ from that in alkaline cementitious environments [30]. Rheological measurements can characterize fresh-state flow response, viscosity, yield stress, and structural build-up in GO-modified cementitious systems [12,31]. However, these methods generally provide bulk colloidal or flow information and cannot directly quantify projected sheet morphology, coarse agglomerates, or local spatial clustering in optical fields. Calorimetry, TGA, and XRD are more suitable for evaluating hydration heat, bound water, phase assemblage, and hydration products [32]. These techniques are essential for understanding the hydration response of GO-modified cementitious materials, but they characterize the consequence of GO incorporation rather than the initial optical dispersion state before cement mixing.
Therefore, the proposed optical microscopy method occupies a complementary position: it provides higher field coverage than high-resolution chemical or morphological techniques and more direct image-level dispersion information than bulk colloidal or rheological measurements. It can analyze many fields of view and extract projected boundary richness, coarse-agglomerate fraction, spatial uniformity, and the integrated optical dispersion index. In this sense, the method provides a practical pre-mixing screening variable for comparing commercial GO products before strength testing or more detailed physicochemical, rheological, and hydration characterization.

5.4. Applicability, Limitations, and Future Validation

The agreement between the D j -based ranking and the 3-day strength ranking supports the engineering relevance of the proposed optical index under the present fixed experimental conditions. However, the reduced empirical relationship between D j and strength enhancement is dataset-specific, because only five GO products, one GO dosage, one mixture proportion, and one curing age were examined. Therefore, the fitted coefficients should not be interpreted as universal strength-prediction parameters or directly applied to other GO-modified cementitious systems.
Several factors beyond the initial optical dispersion state may also influence the final performance of GO-modified cementitious materials, including GO chemistry, oxidation degree, interaction with superplasticizer, mixing protocol, and possible re-agglomeration in cementitious pore solution. Future validation should therefore combine the proposed optical descriptors with XPS, Raman spectroscopy, zeta potential, rheology, calorimetry, TGA, and XRD/Rietveld analysis. Additional datasets involving more GO products, multiple dosages, different cementitious systems, mixing protocols, and longer curing ages are also needed to evaluate the broader applicability of the proposed framework.

6. Conclusions

This study developed an optical microscopy-based framework for evaluating the initial dispersion quality of graphene oxide (GO) suspensions before cement mixing. The framework was applied to five commercial GO products and examined using 3-day compressive strength results obtained under fixed dosage, mixture proportion, curing age, imaging protocol, and image-processing conditions. The main conclusions are as follows.
(1) Optical microscopy provided a practical image-level description of the projected morphology and spatial distribution of GO sheets and agglomerates. The method should be interpreted as a geometric dispersion-evaluation approach rather than a direct chemical or hydration characterization technique.
(2) Single image-derived parameters, such as object count, projected area, projected perimeter, or boundary density, were insufficient for describing GO initial dispersion quality. The proposed index therefore integrated boundary richness, coarse-agglomerate penalty, and spatial dispersion uniformity, allowing poor performance in any one aspect to reduce the final dispersion-quality evaluation.
(3) The proposed optical index distinguished the five commercial GO products clearly. At the baseline coarse-agglomerate threshold of 20μm2, the initial dispersion quality followed the order Brand 1 > Brand 2 > Brand 3 > Brand 4 > Brand 5. This ranking remained unchanged when the threshold varied from 20 to 100μm2. Bootstrap resampling further confirmed the robustness of the ranking, with only minor uncertainty between Brand 1 and Brand 2.
(4) The optical ranking was consistent with the measured 3-day compressive strength enhancement. At a fixed GO dosage of 0.03 wt% of binder, the 3-day compressive strength increased from 51.1 MPa for the control mixture to 52.6~60.8 MPa for GO-modified mortars, corresponding to enhancement ratios of 3.1~19.2%. The strength-enhancement ranking was identical to the optical dispersion ranking, with a Spearman rank correlation coefficient of 1.0.
(5) The reduced empirical relationship between optical dispersion quality and strength enhancement should be regarded as dataset-specific rather than a universal strength-prediction model. Further work should combine the proposed optical descriptors with zeta potential, rheology, UV-Vis spectroscopy, XPS/Raman analysis, calorimetry, TGA, XRD/Rietveld analysis, and SEM/AFM validation, and should include more GO products, multiple dosages, different cementitious systems, mixing protocols, and longer curing ages.

Author Contributions

Conceptualization, N.Z. and X.T.; Methodology, N.Z. and X.T.; Software, N.Z.; Validation, N.Z., J.D. and F.Q.; Formal analysis, N.Z.; Investigation, N.Z., J.D. and F.Q.; Resources, K.Y. and H.H.; Data curation, N.Z.; Writing—original draft preparation, N.Z.; Writing—review and editing, X.T., K.Y. and H.H.; Visualization, N.Z.; Supervision, X.T.; Project administration, X.T. and K.Y.; Funding acquisition, X.T. and K.Y. All authors have read and agreed to the published version of the manuscript.

Funding

This research was funded by the Ministry of Science and Technology of the People’s Republic of China under the National Key Research and Development Program of China (Grant No. 2021YFF0501004) and the Fund of the National Engineering Research Center for Mountainous Highways (Grant No. GSGZJ-2023-09).

Data Availability Statement

The data presented in this study are available on request from the corresponding author.

Conflicts of Interest

Authors Kun Yan and Hao Hu were employed by the company China Merchants Chongqing Communications Technology Research & Design Institute Co., Ltd. The remaining authors declare that the research was conducted in the absence of any commercial or financial relationships that could be construed as a potential conflict of interest.

Abbreviations

Abbreviation or SymbolDescription
AFMAtomic force microscopy
CIConfidence interval
CVCoefficient of variation
EDSEnergy-dispersive X-ray spectroscopy
GOGraphene oxide
RSMResponse surface methodology
SDStandard deviation
SEMScanning electron microscopy
TGAThermogravimetric analysis
UV–VisUltraviolet–visible spectroscopy
XPSX-ray photoelectron spectroscopy
XRDX-ray diffraction
i Index of segmented GO object
j Index of GO product
k Index of optical micrograph
q Index of image sub-region
N i Number of optical micrographs analyzed for the j-th GO product
A i , j , k Projected area of the i-th GO object in the k-th image of the j-th GO product
P i , j , k Projected perimeter of the i-th GO object in the k-th image of the j-th GO product
B k , j Projected boundary density of the k-th image of the j-th GO product
B ¯ j Mean projected boundary density of the j-th GO product
C j Normalized projected boundary density factor
A c Coarse-agglomerate area threshold
G k , j Coarse-agglomerate area fraction of the k-th image of the j-th GO product
G j Mean coarse-agglomerate area fraction of the j-th GO product
1 G j Non-coarse-agglomerated area factor
ϕ q , k , j GO area fraction in the q-th sub-region of the k-th image of the j-th GO product
C V k , j Coefficient of variation of GO area fractions among sub-regions in the k-th image
U k , j Spatial dispersion uniformity factor of the k-th image of the j-th GO product
U j Mean spatial dispersion uniformity factor of the j-th GO product
D j Optical initial dispersion quality index of the j-th GO product
G O 0 Fixed nominal GO dosage
X j Dispersion-weighted GO variable of the j-th GO product
η j 3-day compressive strength enhancement ratio of the j-th GO product
f c , j 3-day compressive strength of the mixture containing the j-th GO product
f c , 0 3-day compressive strength of the control mixture
a , b Empirical fitting coefficients in the reduced empirical response model
e j Residual error for the j-th GO product
d j Rank difference between optical dispersion ranking and strength-enhancement ranking
n Number of GO products
ρ s Spearman rank correlation coefficient
R 2 Coefficient of determination

References

  1. Hu, Z.Y.; Wan, Y.; Duan, Y.J.; Shi, Y.H.; Gu, C.P.; Ma, R.; Dong, J.J.; Cui, D. A Review of the Impact of Graphene Oxide on Cement Composites. Nanomaterials 2025, 15, 216. [Google Scholar] [CrossRef] [Scilit] [PubMed]
  2. Han, B.; Sun, S.; Ding, S.; Zhang, L.; Yu, X.; Ou, J. Review of nanocarbon-engineered multifunctional cementitious composites. Compos. Part A Appl. Sci. Manuf. 2015, 70, 69–81. [Google Scholar] [CrossRef] [Scilit]
  3. Li, H.; Zhao, G.; Zhang, H. Recent Progress of Cement-Based Materials Modified by Graphene and Its Derivatives. Materials 2023, 16, 3783. [Google Scholar] [CrossRef] [Scilit]
  4. Wang, H.; Zhang, L.; Wang, D.; Geng, D.; Zhang, M.; Du, W.; Chen, H. Dispersion of graphene oxide and its application prospect in cement-based materials: A review. J. Dispers. Sci. Technol. 2023, 44, 392–405. [Google Scholar] [CrossRef] [Scilit]
  5. Liu, C.; Huang, X.; Wu, Y.-Y.; Deng, X.; Zheng, Z.; Xu, Z.; Hui, D. Advance on the dispersion treatment of graphene oxide and the graphene oxide modified cement-based materials. Nanotechnol. Rev. 2021, 10, 34–49. [Google Scholar] [CrossRef] [Scilit]
  6. Fonseka, I.; Mohotti, D.; Wijesooriya, K.; Lee, C.-K.; Mendis, P. Influence of graphene oxide properties, superplasticiser type, and dispersion technique on mechanical performance of graphene oxide-added concrete. Constr. Build. Mater. 2024, 428, 136415. [Google Scholar] [CrossRef] [Scilit]
  7. Lu, D.; Qu, F.; Zhao, H.; Li, N.; Han, S. A targeted approach of using graphene oxide in cement composites. Constr. Build. Mater. 2024, 456, 139339. [Google Scholar] [CrossRef] [Scilit]
  8. Du, W.; Wu, H.; Chen, H.; Xu, G.; Li, C. Graphene oxide in aqueous and nonaqueous media: Dispersion behaviour and solution chemistry. Carbon 2020, 158, 568–579. [Google Scholar] [CrossRef] [Scilit]
  9. Peng, H.; Ge, Y.; Cai, C.S.; Zhang, Y.; Liu, Z. Mechanical properties and microstructure of graphene oxide cement-based composites. Constr. Build. Mater. 2019, 194, 102–109. [Google Scholar] [CrossRef] [Scilit]
  10. Li, X.; Liu, Y.M.; Li, W.G.; Li, C.Y.; Sanjayan, J.G.; Duan, W.H.; Li, Z. Effects of graphene oxide agglomerates on workability, hydration, microstructure and compressive strength of cement paste. Constr. Build. Mater. 2017, 145, 402–410. [Google Scholar] [CrossRef] [Scilit]
  11. Yan, X.; Zheng, D.; Yang, H.; Cui, H.; Monasterio, M.; Lo, Y. Study of optimizing graphene oxide dispersion and properties of the resulting cement mortars. Constr. Build. Mater. 2020, 257, 119477. [Google Scholar] [CrossRef] [Scilit]
  12. Long, W.-J.; Li, H.-D.; Fang, C.-L.; Xing, F. Uniformly Dispersed and Re-Agglomerated Graphene Oxide-Based Cement Pastes: A Comparison of Rheological Properties, Mechanical Properties and Microstructure. Nanomaterials 2018, 8, 31. [Google Scholar] [CrossRef] [Scilit]
  13. Zhao, L.; Guo, X.; Liu, Y.; Ge, C.; Chen, Z.; Guo, L.; Shu, X.; Liu, J. Investigation of dispersion behavior of GO modified by different water reducing agents in cement pore solution. Carbon 2018, 127, 255–269. [Google Scholar] [CrossRef] [Scilit]
  14. Long, W.J.; Fang, C.; Wei, J.; Li, H. Stability of GO Modified by Different Dispersants in Cement Paste and Its Related Mechanism. Materials 2018, 11, 834. [Google Scholar] [CrossRef] [Scilit]
  15. Cascardi, A.; Verre, S.; Micelli, F.; Aiello, M.A. Durability-aimed performance of glass FRCM-confined concrete cylinders: Experimental insights into alkali environmental effects. Mater. Struct. 2025, 58, 329. [Google Scholar] [CrossRef] [Scilit]
  16. Lee, W.; Oh, Y.; Lee, K.E.; Lee, J.U. Contrast enhancement for quantitative image analysis of graphene oxide using optical microscopy for Si-based field effect transistors. Mater. Sci. Semicond. Process. 2015, 39, 521–529. [Google Scholar] [CrossRef] [Scilit]
  17. Xu, H.; Qi, Z.; Jin, H.; Wang, J.; Qu, Y.; Zhu, Y.; Ji, H. Identification of graphene oxide and its structural features in solvents by optical microscopy. RSC Adv. 2019, 9, 18559–18564. [Google Scholar] [CrossRef] [Scilit] [PubMed]
  18. Luo, Q.; Wirth, C.; Pentzer, E. Efficient sizing of single layer graphene oxide with optical microscopy under ambient conditions. Carbon 2020, 157, 395–401. [Google Scholar] [CrossRef] [Scilit]
  19. Bondareva, J.V.; Logunov, M.A.; Dyakonov, P.V.; Rubekina, A.A.; Shirshin, E.A.; Sybachin, A.V.; Maslakov, K.I.; Kirsanova, M.A.; Osipenko, S.V.; Kvashnin, D.G.; et al. Tracking the quality of graphene oxide suspension during long-term storage. Surf. Interfaces 2024, 52, 104842. [Google Scholar] [CrossRef] [Scilit]
  20. Nguyen, N.T.T.; Ngo, T.V.; Nguyen, K.K.; Vu, V.Q.; Xia, Y.; Tran, M.Q.; Dang, H.T.; Matos, J.; Dang, S.N. Effects of Fly Ash and Graphene Oxide in Cement Mortar Considering the Local Recycled Material Context. Appl. Sci. 2024, 14, 6140. [Google Scholar] [CrossRef] [Scilit]
  21. Kumar, S.; Bheel, N.; Zardari, S.; Alraeeini, A.S.; Almaliki, A.H.; Benjeddou, O. Effect of graphene oxide on mechanical, deformation and drying shrinkage properties of concrete reinforced with fly ash as cementitious material by using RSM modelling. Sci. Rep. 2024, 14, 18675. [Google Scholar] [CrossRef] [Scilit]
  22. Box, G.E.P.; Wilson, K.B. On the Experimental Attainment of Optimum Conditions. In Breakthroughs in Statistics: Methodology and Distribution; Kotz, S., Johnson, N.L., Eds.; Springer: New York, NY, USA, 1951; Volume 13, pp. 270–310. [Google Scholar]
  23. Myers, R.H.; Montgomery, D.C.; Anderson-Cook, C. Response Surface Methodology: Process and Product Optimization Using Designed Experiments; Wiley: Hoboken, NJ, USA, 2016; Volume 705. [Google Scholar]
  24. Lv, S.; Liu, J.; Sun, T.; Ma, Y.; Zhou, Q. Effect of GO nanosheets on shapes of cement hydration crystals and their formation process. Constr. Build. Mater. 2014, 64, 231–239. [Google Scholar] [CrossRef] [Scilit]
  25. Zhao, Y.; Liu, Y.; Shi, T.; Gu, Y.; Zheng, B.; Zhang, K.; Xu, J.; Fu, Y.; Shi, S. Study of mechanical properties and early-stage deformation properties of graphene-modified cement-based materials. Constr. Build. Mater. 2020, 257, 119498. [Google Scholar] [CrossRef] [Scilit]
  26. GB/T 50081-2019; Standard for Test Methods of Concrete Physical and Mechanical Properties. China Architecture & Building Press: Beijing, China, 2019.
  27. Gholampour, A.; Kiamahalleh, M.V.; Tran, D.N.H.; Ozbakkaloglu, T.; Losic, D. Revealing the dependence of the physiochemical and mechanical properties of cement composites on graphene oxide concentration. RSC Adv. 2017, 7, 55148–55156. [Google Scholar] [CrossRef] [Scilit]
  28. Wang, Y.; Yang, J.; Ouyang, D. Effect of Graphene Oxide on Mechanical Properties of Cement Mortar and its Strengthening Mechanism. Materials 2019, 12, 3753. [Google Scholar] [CrossRef] [Scilit] [PubMed]
  29. Mokhtar, M.M.; Abo-El-Enein, S.A.; Hassaan, M.Y.; Morsy, M.S.; Khalil, M.H. Mechanical performance, pore structure and micro-structural characteristics of graphene oxide nano platelets reinforced cement. Constr. Build. Mater. 2017, 138, 333–339. [Google Scholar] [CrossRef] [Scilit]
  30. Lu, Z.; Hou, D.; Hanif, A.; Hao, W.; Li, Z.; Sun, G. Comparative evaluation on the dispersion and stability of graphene oxide in water and cement pore solution by incorporating silica fume. Cem. Concr. Compos. 2018, 94, 33–42. [Google Scholar] [CrossRef] [Scilit]
  31. Wang, Q.; Wang, J.; Lv, C.-X.; Cui, X.-Y.; Li, S.-Y.; Wang, X. Rheological behavior of fresh cement pastes with a graphene oxide additive. New Carbon Mater. 2016, 31, 574–584. [Google Scholar] [CrossRef] [Scilit]
  32. Meng, S.; Ouyang, X.; Fu, J.; Niu, Y.; Ma, Y. The role of graphene/graphene oxide in cement hydration. Nanotechnol. Rev. 2021, 10, 768–778. [Google Scholar] [CrossRef] [Scilit]
Figure 1. Conceptual Basis for Constructing the Optical Initial Dispersion Quality Index.
Buildings 16 02116 g001
Figure 2. Workflow of GO Glass-Slide Preparation, Optical Microscopic Image Acquisition, Image Preprocessing, GO Object Segmentation, and Geometric Feature Extraction.
Buildings 16 02116 g002
Figure 3. Weighing the Graphene Oxide Dispersion.
Buildings 16 02116 g003
Figure 4. Mixture of Graphene Oxide Dispersion, Water, and Superplasticizer.
Buildings 16 02116 g004
Figure 5. Ultrasonic Dispersion of the Graphene Oxide Mixture.
Buildings 16 02116 g005
Figure 6. Image-Level Comparison of GO Object Statistics across Different Commercial Products.
Buildings 16 02116 g006
Figure 7. Object-Level Geometric Distributions of Different GO Products: (a) Projected Area; (b) Projected Perimeter; (c) Object-Level Projected Boundary Density.
Buildings 16 02116 g007aBuildings 16 02116 g007b
Figure 8. Component Factors of The Optical Initial Dispersion Quality Index for Different GO Products: (a) Normalized Projected Boundary Density Factor Cj; (b) Non-Coarse-Agglomerated Area Factor 1 − Gj; (c) Spatial Dispersion Uniformity Factor Uj.
Buildings 16 02116 g008
Figure 9. Variation of Dj under Different Coarse-Agglomerate Area Thresholds Ac.
Buildings 16 02116 g009
Figure 10. Bootstrap Distributions of Dj for the Five GO Products with 95% Confidence Intervals.
Buildings 16 02116 g010
Figure 11. Relationship between the Optical Initial Dispersion Quality Index and 3-Day Compressive Strength Enhancement: (a) Reduced RSM-Type Quadratic Fit Between Dj and H; (b) Comparison between Optical Ranking and Strength-Enhancement Ranking.
Buildings 16 02116 g011
Figure 12. Comparison of Compressive-Strength Enhancement between the Present Study and Representative Published GO-Cementitious Material Results. Note: The reference numbers on the x-axis correspond to the following studies: [29] Mokhtar et al.; [10] Li et al.; [11] Yan et al.; [28] Wang et al.; [20] Nguyen et al.; [6] Fonseka et al.; and [27] Gholampour et al. The data point for this study represents the maximum 3-day strength enhancement among the five GO products tested at 0.03 wt% GO. The comparison is intended to show the reported enhancement magnitude rather than to rank different studies, because GO source, dosage, dispersion protocol, mixture design, curing age, and testing method differ among studies.
Buildings 16 02116 g012
Figure 13. Qualitative Positioning of the Proposed Optical Microscopy Method Relative to Conventional GO Characterization Methods. Note: The horizontal axis represents screening throughput and statistical field coverage, whereas the vertical axis represents direct physicochemical or material-characterization specificity. The plotted positions are qualitative and indicate the dominant type of information provided by each method rather than quantitative scores.
Buildings 16 02116 g013
Table 1. Supplier-reported nominal parameters of different commercial GO dispersions.
GO BrandSheet Diameter (μm)LayersCarbon ContentOxygen Content
Brand 12~101~545%~61%36%~52%
Brand 23~51~247%~59%30%~40%
Brand 310~501~242%~50%>42%
Brand 40.2~101~344%~52%46%~50%
Brand 52~201~543%~53%42%~54%
Table 2. Representative original microscopic images and feature-enhanced images of different GO dispersion brands.
GO BrandBrand 1Brand 2Brand 3Brand 4Brand 5
Original microscopic imageBuildings 16 02116 i001Buildings 16 02116 i002Buildings 16 02116 i003Buildings 16 02116 i004Buildings 16 02116 i005
Feature-enhanced imageBuildings 16 02116 i006Buildings 16 02116 i007Buildings 16 02116 i008Buildings 16 02116 i009Buildings 16 02116 i010
Table 3. Representative final binary masks and GO boundary overlay images of different GO dispersion brands.
GO BrandBrand 1Brand 2Brand 3Brand 4Brand 5
Final binary maskBuildings 16 02116 i011Buildings 16 02116 i012Buildings 16 02116 i013Buildings 16 02116 i014Buildings 16 02116 i015
GO boundary overlay imageBuildings 16 02116 i016Buildings 16 02116 i017Buildings 16 02116 i018Buildings 16 02116 i019Buildings 16 02116 i020
Table 4. Mix proportions of GO-modified cementitious mortar (kg/m3).
CementFly AshSilica FumeSandWaterSuperplasticizerGO
72519348116018380.29
Table 5. Image-level geometric statistics of different GO products.
ProductImagesObjects per ImageGO Area per Image (μm2)GO Perimeter per Image (μm)Boundary Density (μm−1)
Brand 11102631.6949,480.0438,701.870.776981
Brand 2865760.58119,464.1090,632.430.753882
Brand 3943744.01118,617.4076,343.200.654207
Brand 4133376.4911,058.517314.020.667694
Brand 51421228.87110,019.8042,213.230.385475
Table 6. Component descriptors and integrated optical initial dispersion quality index of different GO products.
ProductCjGj1 − GjUjDjRank
Brand 11.0000000.6998460.3001540.8461220.6332751
Brand 20.9702710.7290990.2709010.8576790.6086152
Brand 30.8419860.8284780.1715220.8392970.4948963
Brand 40.8593440.8239590.1760410.6447600.4603204
Brand 50.4961190.9530490.0469510.7812770.2630345
Table 7. Bootstrap statistics and ranking probabilities of Dj.
ProductMean Bootstrap DjSD95% CIMost Frequent RankRank Probability
Brand 10.63280.00620.6194~0.6449191.7%
Brand 20.60750.01620.5750~0.6376291.7%
Brand 30.49450.01110.4720~0.5153399.9%
Brand 40.45990.00490.4501~0.4695499.9%
Brand 50.26300.00390.2553~0.27075100.0%
Table 8. Comparison between Dj and 3-day compressive strength enhancement.
Product3-Day Strength (MPa)Enhancement η (%)DjOptical RankStrength Rank
Control51.10---
Brand 160.819.20.63327511
Brand 257.412.60.60861522
Brand 355.89.40.49489633
Brand 454.05.90.46032044
Brand 552.63.10.26303455
Disclaimer/Publisher’s Note: The statements, opinions and data contained in all publications are solely those of the individual author(s) and contributor(s) and not of MDPI and/or the editor(s). MDPI and/or the editor(s) disclaim responsibility for any injury to people or property resulting from any ideas, methods, instructions or products referred to in the content.