Abstract
Against the background of rapid global urbanization, the renewal and renovation of historic districts have become an increasingly important concern. As a city with a long and rich history, Beijing contains numerous historic districts that are in urgent need of systematic renewal and renovation. This study proposes a functional enhancement and renovation design methodology for urban historic districts based on space syntax theory and analytical methods, applying it to the Qianmen Historic District in Beijing. Through traffic flow and business format analysis, the research examines traffic patterns and business format distribution characteristics in the Qianmen area and ultimately guides the design based on these findings. Research indicates that restrooms and attractions in Beijing’s Qianmen historic district exhibit dispersed space distribution, broad service coverage, high metric step depth (447 m and 436 m, respectively), and low topological connectivity. In contrast, hotels and restaurants feature smaller service areas, lower metric step depth (395 m and 297 m, respectively), and higher topological connectivity. Based on these findings, this study proposes targeted design recommendations for Qianmen’s street renovations based on traffic flow analysis results. Considering the need for vehicle parking and pedestrian rest demands in urban functional renewal, rest seats and shared charging piles are set up on the streets with big pedestrian flow to meet the needs of pedestrians. Moreover, cycling routes are designed to connect big-traffic-flow streets with small-traffic-flow ones. These renewal measures aim to enhance the overall vitality of the Qianmen district. The renovation approach and methodology proposed in this study can serve as a reference for future updates and renovations of historic districts.
1. Introduction
With the accelerating pace of urbanization, urban development has gradually shifted from incremental spatial expansion toward the optimization of existing urban stock. Consequently, the functional renewal and revitalization of historic cultural districts have emerged as central challenges in contemporary urban renewal practices. To respond to the requirements of modern urban spatial planning, historic districts must undergo systematic renewal and renovation [1]. Historic districts in many countries face comparable challenges, and accordingly, numerous nations have introduced region-specific improvement strategies and policy frameworks aimed at the conservation and revitalization of historic areas [2,3,4]. Within this context, an increasing number of studies have adopted space syntax as a tool for design optimization in historic district renewal. Space syntax provides an analytical framework for examining the structural characteristics of cities, buildings, and landscapes and enables urban spatial research from the perspectives of topological relationships and the prediction of human spatial behavior [5]. It has been widely applied in urban street evaluation, commercial site selection, and traffic flow optimization [6,7,8,9,10]. In the domain of urban renewal, space syntax-based research can generally be categorized into three main areas: street assessment studies [11,12], spatial evaluation research [13,14], and analyses of commercial distribution patterns [15].
In the renovation of historic districts, a growing body of research has applied space syntax theory, which can be broadly categorized into four levels of analysis: spatial planning, functional transformation, street renewal, and commercial distribution. With respect to spatial planning, Liu et al. employed social network analysis in combination with space syntax theory to investigate the tourism network structure, node hierarchy, and spatial positioning within Beijing’s historic urban districts. Their analysis supported the formulation of land-use management strategies for areas lacking attractions and supporting functions, thereby facilitating land-use optimization and offering new perspectives for the renewal and transformation of Beijing’s historic urban areas [16]. Similarly, Chakraborty et al. examined the historic districts of Kolkata, India, using space syntax to interpret the area’s topological structure and socio-spatial attributes, and identified intrinsic spatial characteristics associated with urban decay in historic city centers [17]. In terms of functional transformation, Lyu et al. proposed an innovative revitalization approach for historic districts based on space syntax methodology. By constructing space syntax models, they described, analyzed, and interpreted the urban morphology of the old Yushan District in Qingdao, Shandong Province, China, and subsequently developed revitalization strategies grounded in its spatial characteristics [18]. Fu et al. incorporated space syntax theory and analytical tools into a sustainable urban renewal framework to examine the spatial properties of the Shuixinlin Historic District in Fuzhou, Fujian Province, China, providing theoretical support for planning decisions aimed at enhancing historic district vitality [19]. Regarding street renewal, Huang et al. combined semantic segmentation of street-level imagery with space syntax theory to conduct a quantitative assessment of the internal spatial structure and existing problems in Wuyishan City, Fujian Province. Their study characterized spatial features using measurable indicators and proposed targeted recommendations for urban renewal [20]. Cai et al. focused on the historic streets of Wulin Lane in Hangzhou, Zhejiang Province, China, and applied space syntax methods to quantitatively evaluate spatial structure, assess the relationship between space and vitality, and propose corresponding renewal strategies [21]. Mo Fan et al. utilized space syntax theory to model and analyze the pedestrian landscape of George Town, Malaysia, a historic city characterized by complex urban morphology. Using indicators such as connectivity, integration, intelligibility, and choice, they explored strategies for optimizing pedestrian networks within the historic urban environment [22]. Li et al. investigated the old town of Hsinchu using space syntax-based visibility graph analysis and axial analysis to assess the contribution of historic sites to tourism development [23]. In addition, with respect to commercial distribution, Huang et al. examined traditional villages in Anhui Province by applying space syntax analysis to the street network of Longchuan Village. They developed a commercial space resistance model, identified spatial advantages in the village’s commercial layout, and proposed targeted strategies for optimizing commercial spatial organization [24].
These studies demonstrate that space syntax analysis has been extensively applied in urban renewal research. However, investigations that specifically address functional renewal in historic and cultural districts, particularly those focusing on the functional enhancement of slow-moving traffic systems, remain relatively limited. In many urban historic districts, the original spatial layouts were developed primarily to accommodate pedestrians and other forms of slow-moving traffic, without consideration for modern rapid transportation modes such as private vehicles. As a result, numerous renewal projects have introduced inappropriate functional arrangements and traffic modifications that are poorly aligned with existing spatial conditions. The hutong areas of Beijing, China, represent a typical manifestation of this spatial form. Many hutongs are characterized by narrow street widths, making them unsuitable for rapid vehicular traffic. Nevertheless, some renovation efforts have failed to adequately account for these inherent spatial constraints, leading to issues such as insufficient parking provision and an excessive concentration of commercial functions. In practice, the renewal and redesign of such historic areas should place greater emphasis on the characteristics of slow-moving traffic systems and the behavioral patterns of pedestrians. A design approach grounded in these considerations can encourage visitors to move at a slower pace, reduce safety risks for residents, enhance the cultural and social value of historic districts, and achieve a more effective integration of historical heritage with contemporary urban functions. Despite the recognized importance of these issues, research on the renovation design of slow-traffic systems in urban historic districts based on space syntax theory remains scarce. Addressing this gap constitutes the central focus of the present study.
With this research objective in mind, the Qianmen area of Beijing, China, was selected as the case study to explore renewal strategies and design approaches applicable to narrow-scale blocks within urban historic districts. Space syntax analysis was employed to examine slow-moving traffic patterns within the existing block structure, and the resulting data were used to inform and guide the renovation design process. As a renowned historical and cultural city, Beijing contains numerous districts characterized by similar spatial conditions, among which the Qianmen area is a representative example. Located in the central part of Dongcheng District, the Qianmen area is bounded by Tiananmen Square to the northwest and the Temple of Heaven to the south. Positioned along Beijing’s central axis, it is the only large-scale historic and cultural district in this area and serves as an important showcase of the city’s traditional culture. The district contains a concentration of time-honored commercial brands, traditional hutongs, and historic alleys that collectively reflect Beijing’s long-standing cultural heritage and commercial traditions. Covering approximately 1.09 km2, the Qianmen area integrates commercial, residential, and cultural functions and functions as both a major tourist destination and a key focus of urban renewal in Beijing. As illustrated in Figure 1, this study concentrates on the eastern section of the Qianmen area, which was selected as the primary renewal research zone. This area is characterized by aging residential neighborhoods, relatively well-preserved traditional courtyard dwellings, and distinctive hutong spaces, yet it currently exhibits relatively low spatial vitality. The study area is bounded by Chongwenmen Xiheyan Road to the north, Zhushikou East Street to the south, Qianmen East Road to the west, and Caochang Santiao Hutong to the east. The selected area demonstrates typical spatial characteristics of Beijing’s hutong districts, including pedestrian-oriented hutongs, vehicular roadways, small public parks, historic waterways (such as the Qianmen moat), and a diverse range of commercial activities, including time-honored brands, cultural enterprises, and tourism-related services. Overall, the area exhibits a distinctive “composite spatial texture,” where historical heritage, urban functions, and transportation systems are closely intertwined. It effectively represents the complex interaction between history, function, and movement that characterizes the renewal of old Beijing. Moreover, the Qianmen area can be regarded as a microcosm of many historic districts worldwide that feature narrow streets and multifunctional land use, which is why it was selected as the representative case for analysis in this study.
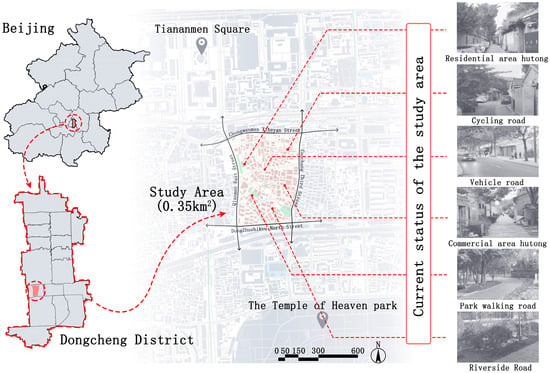
Figure 1.
Study area.
Several studies have examined the renewal and renovation of the Qianmen area. Zhu et al. proposed a method based on internet big data to delineate the boundaries of the recreational business district (RBD) within Qianmen’s historic area and, through a series of analytical procedures, put forward recommendations aimed at balancing RBD development with the conservation of the historic district [25]. Wang analyzed the commercial development background of Qianmen and extracted its economic and cultural attributes in order to propose development concepts and implementation strategies for the morphological transformation of the historic area [26]. Tao et al. constructed an evaluation framework for Qianmen’s renewal based on online review data using grounded theory and applied Importance–Performance Analysis to conduct a quadrant-based assessment of 19 visitor satisfaction indicators, thereby identifying key factors influencing renewal outcomes [27]. Overall, existing research on Qianmen has largely concentrated on macro-level functional renewal strategies and planning-oriented interventions. In contrast, studies addressing micro-scale renewal approaches that preserve the everyday living context and cultural continuity of traditional courtyard-based hutong neighborhoods remain limited. As a traditional residential area, the Qianmen hutong network was historically designed to support pedestrian-oriented and other slow-moving forms of traffic. However, to date, there is a notable lack of micro-renewal design research that focuses on enhancing the area through slow-traffic optimization while simultaneously maintaining its original cultural atmosphere and established lifestyle patterns.
In summary, this study seeks to address the following core research objectives and questions:
- To develop a space syntax-based redevelopment design methodology for slow-traffic systems in traditional urban historic districts, enabling renewal interventions that both enhance tourist attractiveness and improve the quality of life for existing residents;
- To apply this methodology to the Qianmen area of Beijing, a representative hutong district characterized by a complex spatial fabric, in order to verify its practical applicability and to propose a transportation-oriented micro-renewal design scheme that preserves the district’s original cultural context.
Based on these objectives, this study proposes a space syntax-driven, data-informed design framework for the micro-renewal of traditional urban historic districts. The proposed approach is particularly suited to historic areas with narrow street networks, slow-traffic-dominated movement patterns, and intricate spatial configurations. By integrating space syntax analysis into the redevelopment design process, renewal strategies can be formulated in a more systematic, evidence-based, and rational manner. Specifically, this research employs space syntax methods to analyze slow-moving traffic flows and the distribution of commercial functions within the Qianmen Historic District from a human-behavioral perspective. Through an examination of street-level spatial characteristics, the study formulates targeted micro-renewal design recommendations aimed at enhancing overall district vitality while maximizing the preservation of traditional courtyard-based hutong spaces and their associated cultural heritage.
2. Methodology
In this study, space syntax theory was employed to analyze the slow-moving traffic system in the Qianmen area, and the analytical results were subsequently used to inform and optimize regional renovation design strategies. The overall research framework follows the logical sequence of “form–behavior–function,” whereby space syntax is applied to construct and interpret the spatial structure of the case study area. By collecting and analyzing slow-traffic flow data, the study captures spatial behavior, that is, whether the designed spatial configuration can be effectively translated into actual movement patterns. Ultimately, the distribution of commercial spaces is used to evaluate whether observed behaviors generate economic vitality, thereby serving as a robustness test for the bidirectional relationship between traffic flow and business formats.
Field surveys first yielded pedestrian, bicycle, and electric bicycle (E-bike) traffic data in this area, alongside statistical counts of commercial establishments, which was then imported into Depthmap 1.0 software for slow-moving traffic flow analysis and business format distribution analysis. In this way, it summarized the distribution patterns of business formats in the Qianmen area, analyzed the relationship between slow-moving traffic flow and business formats, and predicted traffic flow in the Qianmen area. Based on the results of traffic flow prediction, targeted micro-renewal recommendations were proposed for the Qianmen area. Figure 2 illustrates the research framework of this study.
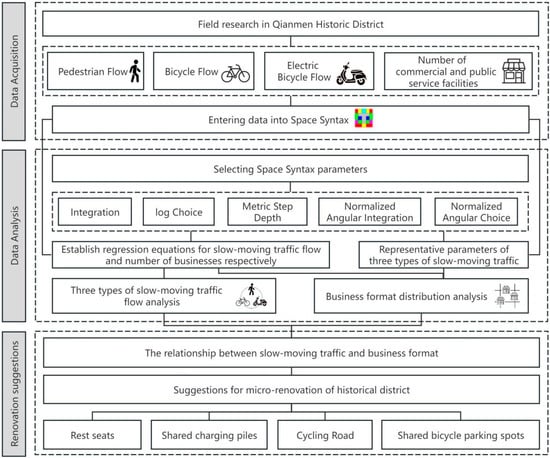
Figure 2.
Research Flowchart.
2.1. Data Acquisition
Data on business formats and slow-moving traffic flow in the Qianmen area were collected through comprehensive field surveys. For business format data acquisition, on-site investigations were conducted to statistically document the types and quantities of non-residential functions present along each street. As this study focuses on the micro-renewal of historic blocks similar to Qianmen, with an emphasis on preserving the traditional cultural context, commercial service-oriented functions were identified as the dominant business types within the area. Accordingly, this study classified and quantitatively analyzed four primary categories of business formats: restrooms, restaurants, hotels, and tourist attractions.
For the collection of slow-moving traffic data, on-site measurements were carried out for three modes of movement within the Qianmen area: pedestrian, bicycle, and e-bike traffic. Monitoring points were evenly distributed across the study area to ensure representative spatial coverage. To avoid ambiguity in assigning traffic flows to specific street segments, particularly at intersections where flow attribution is uncertain, all measurement points were placed along mid-block street segments and away from dead-end roads. This approach ensured that the collected data accurately reflected the overall movement potential of the area while minimizing localized bias.
As the Qianmen area is situated within Beijing’s core tourism zone, slow-moving traffic patterns differ markedly between weekdays and weekends. Weekday traffic is primarily composed of local residents and nearby commuters, whereas weekend traffic is dominated by tourists. To capture these temporal variations, data collection was conducted on both a weekday and a weekend day. Measurements were taken during four representative time periods corresponding to typical daily travel patterns in Beijing: the morning commuting peak (8:00–9:00), the midday lunch period (11:00–12:00), the afternoon working period (14:00–15:00), and the evening commuting peak (17:00–18:00). These intervals encompass both peak and off-peak conditions, making them suitable for estimating average traffic levels. At each monitoring location, traffic volumes for all three transportation modes were recorded over a 5 min interval [28], after which average hourly traffic flows were calculated for each monitoring point based on the observed data.
2.2. Space Syntax Parameters
In this study, a line-segment model was employed to analyze the spatial structure of the Qianmen area. The roads within the study area were divided into a series of interconnected line segments, representing the regional street network, while intersections were represented as segment nodes to construct a comprehensive spatial network. Each segment was characterized by attributes such as length, angle, and connectivity, reflecting both the geometric configuration and the topological relationships of the urban space. Specifically, these space parameters were calculated for each segment using the Urban Segment Model in Depthmap 1.0 software. Considering that the Qianmen site covers approximately 1 km2 and, as a historical and cultural district, exerts influence on the surrounding urban area, the analysis scope was extended by an additional 1 km, resulting in a 2 km radius for the space syntax evaluation. The selection of this spatial radius was supported by correlation analysis to ensure a meaningful representation of spatial interactions. The specific space parameters used in the analysis are as follows:
2.2.1. Integration
Integration refers to the degree of clustering or dispersion between an element and other elements within a space system. It measures a space’s capacity to attract inbound traffic as a destination and reflects its centrality within the overall system. Street segments with higher integration exhibit stronger accessibility and more prominent centrality, making them more likely to attract pedestrian traffic. For this study, integration can help identify the core streets and peripheral streets within the study area and enables targeted functional upgrades that enhance the vitality of peripheral streets while preserving the appeal of core streets.
2.2.2. Log Choice
Log Choice refers to the logarithm of the frequency with which a given segment in a space system serves as the shortest path between two nodes. It quantifies the segment’s advantage as the shortest travel route and reflects its likelihood of being traversed. Street segments with higher Log Choice values are more likely to be traversed and may experience greater traffic flow. In this study, Log Choice could identify locations of roads with high-frequency and low-frequency traversing and further provide reference for optimizing traffic flow patterns within the study area.
2.2.3. Normalized Angular Choice
When navigating urban spaces, people tend to favor paths with fewer turns and minimal directional changes, so path angular choice was selected to measure this preference by quantifying the total angular rotation required across different routes from point of departure to destination. Normalized angular choice (Nach) is a standardized parameter derived from angular choice. Larger space scales and more complex road networks may yield higher angular choice values. Nach serves to eliminate the influence of street quantity variations on analysis outcomes [29], so that the likelihood of a space being traversed can be better reflected. Segments with higher Nach values indicate a greater probability of being the shortest travel path and thus become more attractive to people. Given the significant variations in street length and quantity within the Qianmen Historic District, direct use of Angular Choice might introduce errors due to differences in street quantity. Therefore, this study employed Nach for calculations to ensure direct comparability of traversal potential across different street types, thereby better identifying people’s path selection preferences. The Nach calculation formula is shown in Equation (1).
where n represents the coverage radius, while T1024 denotes the computational precision, corresponding to a division of 360° into 1024 angular intervals for calculation. The T1024 Choice Rn metric indicates the number of times a given line segment is selected as the optimal path when the space coverage radius is set to n. The T1024 Total Depth Rn metric represents the average angular variation of a line segment relative to all other segments within the defined spatial domain. During calculations, the T1024 Choice Rn metric will be zero for dead-end segments; however, taking the logarithm of zero is mathematically undefined. Similarly, the T1024 Total Depth Rn metric may return a value of −1 if a segment is too long to be reached within the coverage radius r; taking the logarithm of (−1 + 2) also yields an invalid calculation. To avoid these issues, constants of 1 and 3 are, respectively, added to the T1024 Choice Rn and T1024 Total Depth Rn metrics, ensuring that all logarithmic operations produce meaningful values.
2.2.4. Normalized Angular Integration
Angular Integration is the reciprocal of the sum of path angle changes. This parameter could help to measure path selection by replacing distance changes with angular changes. Higher Angular Integration indicates that the total turning angle from other segments to this location is smaller, and it is more likely to be included in path selection. Since Angular Integration is also influenced by space scale, Normalized Angular Integration (Nain) was used for calculation to eliminate the impact of space scale. Segments with higher Nain values are more likely to be incorporated into travel path selections. Since this study analyzed data from three categories of slow-moving traffic mode, namely, walking, cycling, and e-bikes, each with distinct radius ranges, Nain could enable comparability of integration degrees across different radii. This allowed for more precise comparisons of space attractiveness differences within varying radius ranges. The formula for Nain is as follows:
where n represents the coverage radius, and the T1024 Node Count Rn metric denotes the total number of nodes within a radius of n centered on a given street segment. This metric is used to assess the complexity of road network connectivity within the space. Based on their case study, Yang et al. identified a power-law relationship between the Node Count Rn and Total Depth Rn metrics, with an average power exponent of 1.2. Additionally, when a line segment is too long to fall within the defined coverage radius r, Depthmap assigns a value of −1 to the T1024 Total Depth Rn metric. In such cases, using (−1 + 1) as a denominator would result in a meaningless calculation. To address this issue, a constant of 2 is added to the T1024 Total Depth Rn metric, ensuring that all computations remain valid [29].
2.2.5. Metric Step Depth
Metric Step Depth (MSD) is a parameter that quantifies space accessibility based on actual distances. By setting a fixed distance increment, it counts the number of other space nodes reachable from a given node within that distance range, so as to reflect the local accessible scope of the space. In this study, analyzing the MSD of various business formats enabled examination of the distance patterns in their distribution, thus providing reference for future renovation and renewal of the district.
2.3. Slow-Moving Traffic Flow Analysis
2.3.1. Selection of Representative Space Syntax Parameters
To determine the optimal space syntax parameters for three types of traffic during weekdays and weekends and further investigate the impact of space structure on slow-moving traffic, data for three traffic categories (pedestrian, bicycle, and e-bike) during weekdays and weekends were input into the line segment model of space syntax. After standardizing the traffic data, space parameters at different radii were calculated and the R2 values of data related to the three categories of traffic flow during weekday and weekend were determined. The space parameters exhibiting the highest fitting degree with the three slow-moving traffic categories of traffic flow were identified as representative space parameters for analyzing the topological patterns of business format distribution under these three slow-moving traffic conditions.
2.3.2. Slow-Moving Traffic Flow Regression Analysis
To investigate the relationship between slow-moving traffic flow and business formats, slow-moving traffic flow analysis is required. The distribution pattern of slow-moving traffic flow serves as a crucial basis for retail location selection and the layout of public service facilities. Simultaneously, slow-moving traffic flow analysis ensures that public facilities and services can effectively meet public demand. When analyzing slow-moving traffic flow, regression equations were constructed using space parameters and business format counts in Section 2.2 alongside three types of actual slow-moving traffic flow data. Then, identify which space parameters and business format influenced each of the three types of slow-moving traffic. Subsequently, slow-moving traffic flow on streets within the Qianmen area was forecasted to identify big-traffic-flow and small-traffic-flow zones, providing reference for targeted micro-renewal of streets within the district.
2.4. Business Format Distribution Analysis
Analysis of the topological patterns in the distribution of each business format was conducted by coupling the representative space syntax parameters obtained from Section 2.3.1. with business formats. Subsequently, the distribution density of each business format was analyzed. After inputting the locations and quantities of each business format into Depthmap 1.0 software, the Metric Step Depth (MSD) was calculated starting from these street segments. Since the site perimeter is 1 km, the statistical distance range was set to 1 km to derive the distance patterns of each business format’s distribution. Subsequently, the distribution patterns of business formats in the Qianmen area were summarized by integrating topological and distance patterns. Regression analysis was then employed to investigate factors influencing the number of business formats. In this way, it guided the site selection for the area’s renovation design by combining with the results of slow-moving traffic flow analysis.
3. Results
3.1. Selection of Space Syntax Parameters
The actual slow-moving traffic data related to the Qianmen area was input into Depthmap 1.0 software, and the weekday versus weekend traffic patterns in this zone were obtained, as shown in Figure 3. It indicates that pedestrian traffic flow on the weekend in the Qianmen area is relatively bigger than that on weekdays and is primarily concentrated on main roads and scenic routes, followed by secondary streets and radiating out to surrounding alleyways. Bicycle traffic flow on the weekend also increases compared to that in weekdays, predominantly consisting of tourist cyclists. Regarding e-bike traffic, flow on weekdays exceed that on weekends because tourist numbers are lower during weekdays, and nearby residents’ reliance on e-bikes for travel reduces the shared bicycle usage. Similarly to pedestrian traffic, bicycle and e-bike flows concentrate on main roads and secondary streets, with minimal presence in hutong.
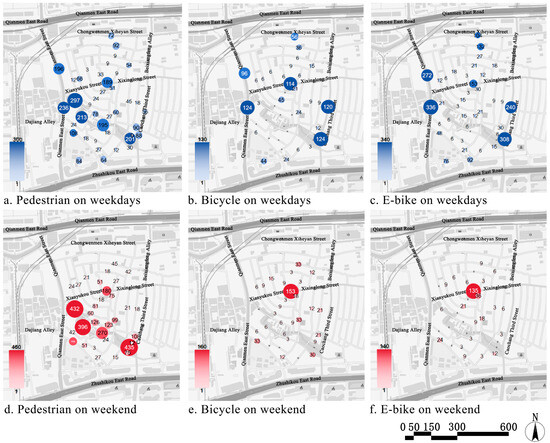
Figure 3.
Schematic diagram of actual slow-moving traffic flow in the Qianmen area.
The correlation analysis between the flows of three slow-moving traffic modes and various space syntax parameters is presented in Figure 4. The results indicate that weekday traffic flows exhibit strong correlations with normalized angular choice (Nach) and normalized angular integration (Nain). Specifically, pedestrian, bicycle, and e-bike flows show the highest correlations with Nain at a 500 m radius, Nain at a 1000 m radius, and Nach at a 2000 m radius, respectively. These patterns are consistent with behavioral logic: pedestrians move at slower speeds and have a smaller activity range, whereas bicycles and e-bikes are more mobile and cover larger spatial extents, making space parameters with broader coverage more representative for these modes. The correlation curves demonstrate rapid increases at smaller radii, followed by slight declines or stabilization after reaching their peaks. In contrast, the degree of integration fluctuates considerably across different radii, indicating lower stability. Weekend slow-moving traffic flows show generally unstable relationships with space parameters, reflecting the unpredictable nature of tourist activity in the Qianmen area. Weekend flows are highly influenced by factors such as weather and surrounding events, and do not exhibit clear spatio-temporal patterns. Consequently, this study prioritized weekday traffic as the basis for selecting representative space syntax parameters for the three slow-moving traffic categories in subsequent regression analyses of business format distribution. This approach aligns with the core objective of the district’s renovation: to guide functional micro-renewal without replicating commercialized tourist district models, while preserving the living cultural context of traditional neighborhoods.
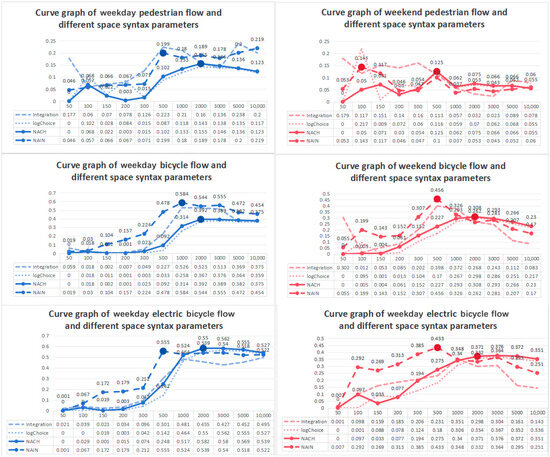
Figure 4.
Correlation between three categories of slow-moving traffic and space syntax parameters.
3.2. Regression Analysis of Slow-Moving Traffic Flow on Weekdays
3.2.1. Regression Analysis of Pedestrian Flow
A stepwise regression analysis was conducted using pedestrian flow as the dependent variable, and log Business Format, MSD ATTRACTION, space parameter Nain1000, and logChoice100 as independent variables. The results are shown in Table 1. With the p-values of log Business Format, MSD ATTRACTION, and logChoice100 all below 0.05, the three space parameters have a statistically significant influence on pedestrian flow and can effectively predict pedestrian flow. Therefore, these three parameters can be adopted as core variables in the predictive model. The regression equation is shown in Equation (3), which will be used for subsequent pedestrian flow prediction and business format planning.

Table 1.
Regression analysis of street pedestrian flow.
The coefficients in Equation (3) indicate that weekday pedestrian flow in the Qianmen area is positively correlated with log Business Format, logChoice100, and MSD ATTRACTION. An increase in the number of business formats corresponds to more consumer and service facilities, thereby attracting additional pedestrian traffic. High street selectivity, as measured by logChoice100, reflects good visibility and accessibility, which also contributes to higher pedestrian flow. In the Qianmen area, where many residential neighborhoods exist, residents’ daily needs can generally be met within a 100 m radius, making logChoice100 particularly representative. This finding also highlights a limitation in the district: most service facilities primarily serve local residents and do not cater effectively to tourists. MSD ATTRACTION represents the distance pedestrians travel to reach attractions. Higher MSD values indicate a broader service area for the attraction, drawing more pedestrians. For example, Sanlihe Park is a key destination for both residents and tourists; however, the narrow, winding streets of the hutong network make access challenging. Improving MSD ATTRACTION through design interventions, such as better wayfinding and street connectivity, can expand the attraction’s effective service area and draw more visitors to Qianmen. The regression equation was input into Depthmap software to predict pedestrian flows. Figure 5 compares predicted and observed flows, revealing a strong overall alignment in spatial distribution. High-traffic areas cluster around major attractions and streets adjacent to main roads, including Lane Defeng, Changxiang Toutiao Hutong, Changxiang Ertiao Hutong, and the intersections along Dongzhushikou North Road, with only minor localized discrepancies. This demonstrates that the model effectively represents pedestrian density within the study area. Furthermore, the predicted high-traffic zones coincide with areas featuring diverse business formats, indicating a close correlation between pedestrian flow and business distribution, and providing further validation of the analyses presented in Section 3.1.
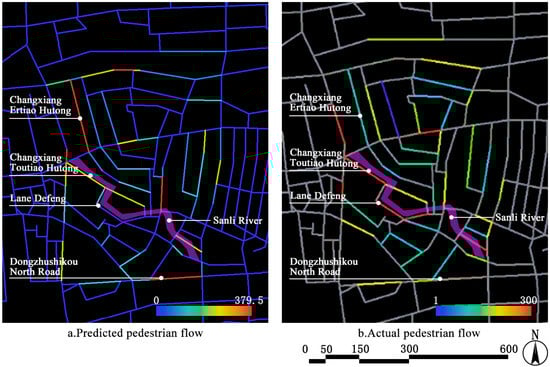
Figure 5.
Changes in pedestrian flow before and after the prediction.
3.2.2. Regression Analysis of Bicycle Traffic Flow
A stepwise regression analysis was conducted using weekday bicycle traffic as the dependent variable, and log Business Format, MSD Business Format, Nain1000, and logChoice100 as independent variables. Table 2 indicates that the p-values of log Business Format and logChoice100 are below 0.05, confirming that these two space parameters can be used to predict bicycle traffic. The regression equation is shown in Equation (4).
Table 2.
Regression analysis of street bicycle traffic flow.
Bicycle traffic flow is positively correlated with log Business Format and logChoice100. Increased diversity in business formats stimulates consumption, pedestrian movement, and cyclist activity. In the Qianmen area, local residents primarily walk or use e-bikes, whereas shared bicycles are mostly utilized by tourists exploring the historic district. Existing service facilities predominantly cater to residents; therefore, increasing the number of tourist-oriented facilities is necessary to attract more cyclists. High logChoice100 values indicate elevated street selectivity, corresponding to greater cyclist passage and higher traffic volumes. As discussed in Section 3.2.1, logChoice100 reflects the travel range of local residents, primarily within the hutong network. For tourists traveling by bicycle, the hutong area is particularly attractive as it best preserves the traditional cultural heritage of the district. Bicycle traffic flow was predicted by inputting the regression equation into Depthmap software. Figure 6 compares predicted and observed flows, revealing some discrepancies between the two. Cyclists tend to prefer routes with high accessibility and scenic appeal, leading areas dense with hotels and attractions, such as Changxiang Ertiao Hutong and Changxiang Wutiao Hutong, to become traffic hotspots. These locations offer a combination of consumption, entertainment, and unique urban landscapes, encouraging cyclists to linger. The predicted bicycle flow patterns provide guidance for designing distinctive cycling routes that connect high-traffic zones and cultural hotspots, thereby enhancing the overall cycling experience within the district.
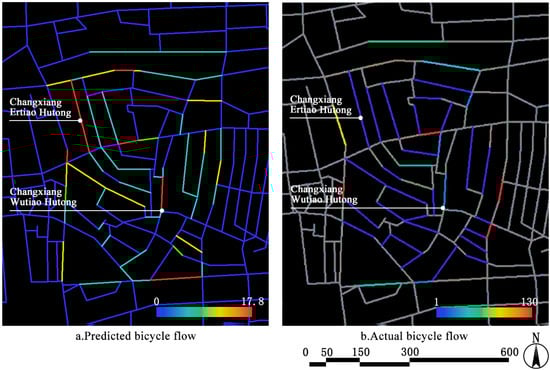
Figure 6.
Changes in bicycle flow before and after the prediction.
3.2.3. Regression Analysis of E-Bike Traffic Flow
A stepwise regression analysis was conducted using weekday E-bike traffic flow as the dependent variable, and log Business Format, MSD ATTRACTION, Nain1000, and logChoice100 as independent variables. The results are shown in Table 3. With p-values of log Business Format and logChoice100 both below 0.05, the two space parameters can effectively predict e-bike traffic and exert statistically significant effects on e-bike traffic. Therefore, these two parameters can serve as core variables in the predictive model for subsequent e-bike traffic forecasting and route planning. The regression equation is shown in Equation (5).
Table 3.
Regression analysis of street e-bike traffic flow.
Then, the regression equation was input into Depthmap software to predict e-bike traffic flow. Figure 7 presents a comparison between predicted and observed e-bike flows. The predicted patterns differ somewhat from those of regular bicycles. Simulation results suggest that large numbers of e-bikes are expected to cluster around commercial areas and attractions; however, actual measurements show fewer e-bikes in these locations. This discrepancy arises from access restrictions on e-bikes within significant portions of the district, reflecting common management constraints in historic and culturally sensitive urban areas.
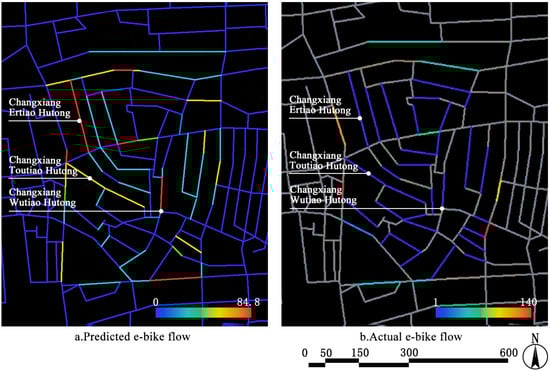
Figure 7.
Changes in e-bike flow before and after the prediction.
4. Discussion
4.1. Topological Patterns in Business Format Distribution
Analysis of slow-moving traffic in Section 3.1 indicates that the most representative space syntax parameters for pedestrians, bicycles, and e-bikes are Nain500, Nain1000, and Nach2000, respectively. Using these parameters as benchmarks, the accessibility of business formats in the Qianmen area was analyzed. As noted in Section 2, Qianmen must balance the convenience of residents’ daily activities with the commercial appeal to tourists. Research identified the primary business formats in the area as restrooms, restaurants, hotels, and attractions, as shown in Figure 8. Within the highly integrated branch road network at 500 m and 1000 m radii, differences in walking and cycling accessibility among business formats were minimal, with standard deviations below 0.08. This indicates little variation in shortest-path slow-travel flows within the study area. A closer examination of functional demand reveals that hotels and restaurants require frequent access for guests and delivery personnel, necessitating higher accessibility to the shortest routes within the hutongs. In contrast, public restrooms and attractions are primarily destination-oriented, resulting in relatively lower accessibility requirements. At the arterial road level (main streets or primary roads within the hutong network) at a 2000 m radius, short-distance accessibility rankings follow the pattern Hotel ≈ Restaurant > Restroom > Attraction, demonstrating that functional characteristics largely determine the selectivity of slow-moving traffic tiers. These findings provide a quantitative basis for differentiated renewal strategies, including the development of a “hutong slow-moving traffic loop” and the enhancement of main street functions. As a densely structured historic district, the Qianmen area faces challenges in aligning business formats with slow-moving traffic, a key factor for enhancing district vitality. By quantifying accessibility differences through space syntax parameters, hotels and restaurants with high-frequency traffic can improve connectivity with the hutongs and increase e-bike charging stations to stimulate customer flow. For destination-oriented facilities such as restrooms and attractions, wayfinding and guidance systems can compensate for lower accessibility, preserving the historical texture of the hutongs while improving the efficiency of space utilization.
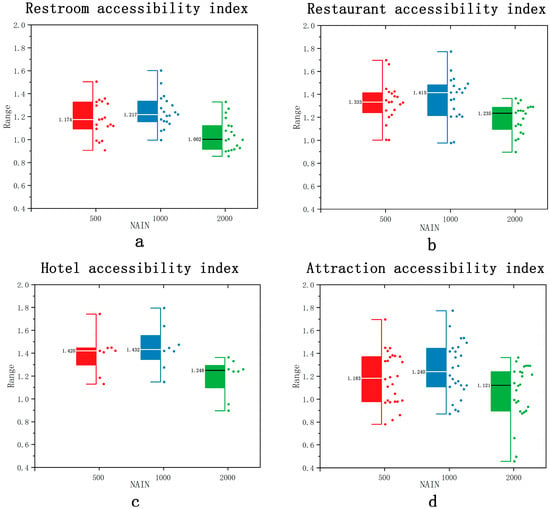
Figure 8.
Three accessibility indexes for different business formats. (a) Three accessibility indexes for restroom; (b) Three accessibility indexes for restaurant; (c) Three accessibility indexes for hotel; (d) Three accessibility indexes for attraction.
4.2. Distance Patterns in Business Format Distribution
This study examined how spatial distance patterns influence different business formats by analyzing their distribution densities, with the goal of determining their respective service radii. Using the recorded locations of various business formats as starting points, the mean shortest distance (MSD) was calculated for street segments within a 1 km radius, as shown in Figure 8. The MSD represents the effective service radius for each business format. Additionally, the coefficient of variation (the ratio of standard deviation to mean) was used to assess the uniformity of business format distribution. Figure 9 shows that the service radii for restrooms, restaurants, hotels, and attractions are 447 m, 395 m, 297 m, and 436 m, respectively, with corresponding coefficients of variation of 0.62, 0.62, 0.58, and 0.64. In terms of distribution uniformity, the ranking is Hotel > Restroom = Restaurant > Attraction. Hotels exhibit the most uniform distribution, with minimal variation in distances within their service radii, allowing customers to conveniently access hotel services across a broader area. In contrast, the distribution of restrooms, restaurants, and attractions is less uniform. However, all four business formats have coefficients of variation around 0.6, indicating the presence of localized service gaps throughout the area. These findings reflect the characteristics of Qianmen’s street layout, narrow, winding, and complex, which complicates the even coverage of service facilities. Nevertheless, the distribution patterns of business formats within their service radii are discernible, providing a quantitative basis for informing subsequent regional renovation strategies. The analysis also highlights a common issue in historic districts: service facility layouts often follow historical patterns, resulting in uneven functional coverage relative to contemporary needs. Specifically, restrooms and attractions exhibit relatively long service radii because they are typically tucked deep within winding hutongs, making them easily accessible only to local residents, while tourists may struggle to locate them quickly. Conversely, tourist-oriented facilities such as hotels and restaurants have shorter service radii and cannot fully accommodate visitor flows. Targeted micro-renewal interventions, such as adding signage and supplementing service nodes, can reduce service gaps without altering the original hutong layout, thereby preserving the historical appearance of the district while enhancing functional accessibility.
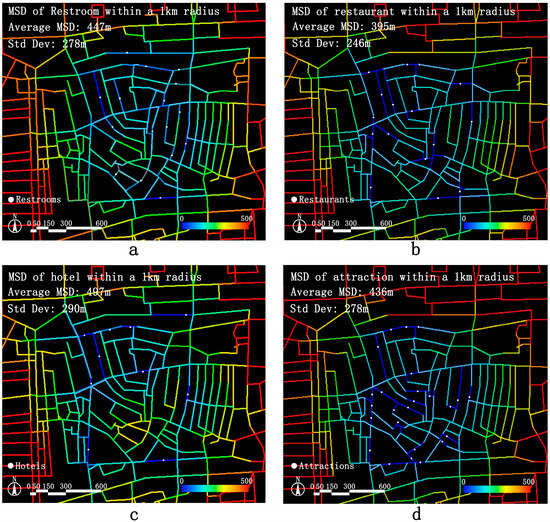
Figure 9.
MSD of various business formats. (a) MSD of restroom; (b) MSD of restaurant; (c) MSD of hotel; (d) MSD of attraction.
4.3. Comprehensive Analysis of Topological and Distance Patterns in Business Format Distribution
As shown in Section 4.1 and Section 4.2, the accessibility of pedestrian and bicycle slow-moving traffic systems within this area is relatively similar. When conducting a comprehensive analysis of the topological distribution and distance patterns of business formats, this study focused on analyzing the distinct space patterns of the four business formats to guide design. Therefore, this study analyzed the distance and topological patterns of the four land use types exclusively in relation to the Nain500 of the walking system and the Nach2000 of the E-bike system. Specific results are presented in Figure 10. The topological patterns are simplified into e-bike accessibility (Y-axis) and walking accessibility (X-axis), represented by Nach2000 and Nain500, respectively. Based on traffic flow levels, these four business formats broadly form two clusters.
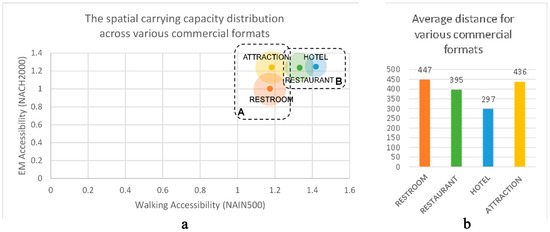
Figure 10.
Functional clustering visualization integrating topology and distance patterns. (a) The spatial carrying capacity distribution across various commercial formats; (b) Average distance for various commercial formats.
Business formats in Category A, including restrooms and attractions, exhibit dispersed spatial distribution, serve broad coverage areas, feature high MSD values, and possess low topological connectivity. Public restrooms typically serve a wide area and are often located in remote alleys, resulting in longer travel distances, while attractions experience uneven visitor distribution due to factors such as location, scale, and appeal. Although both types require a certain level of walking or cycling accessibility, their overall accessibility demands are lower compared to hotels and restaurants.
In contrast, business formats in Category B, including hotels and restaurants, cluster in densely populated and highly accessible areas to accommodate frequent customer visits and supply deliveries. Customers generally prefer walking or cycling for short trips, often relying on alleyways for quick access. These business formats serve smaller areas, exhibit lower average MSD values, and demonstrate higher topological connectivity.
The challenges observed in the Qianmen area reflect a common pattern in historic districts characterized by mixed functions and inefficient spatial layouts. These areas often lack a systematic arrangement of business formats, resulting in overlapping functions or service gaps. Classifying the mixed functions in Qianmen clarifies the characteristics of each type and informs targeted renovation strategies. For Category A (restrooms and attractions), renovations should focus on “expanding service coverage and strengthening guidance”, using signage and wayfinding to mitigate low connectivity and make dispersed facilities easier to locate. For Category B (hotels and restaurants), the emphasis should be on “strengthening agglomeration and improving accessibility”, leveraging the clustering effect in high-traffic areas to optimize connections with slow-moving traffic networks.
4.4. Regression Analysis of Total Business Formats
After analyzing the correlation between the logarithm of total business formats and various space parameters with business format data, the contribution of each parameter to the total number of business formats was observed. Then, the most significant correlation was found with ATTRACTION, i.e., the number of attractions, followed by MSD Business Format, i.e., the distance from the service area to the business format. Additionally, log Choice100 also showed a certain degree of correlation.
Therefore, ATTRACTION, MSD Business Format, and log Choice100 were selected as independent variables for multiple linear regression. The results are shown in Table 4, and the regression equation is presented in Equation (6). In the current model, all three independent variables passed the 0.001 significance level test and exerted statistically significant effects on the total number of business formats along the street segment.
where N is TOTAL Business Format.
Table 4.
Regression analysis of total business formats on streets.
The regression equation indicates that an increase in the number of attractions can draw larger crowds, thereby stimulating the development of surrounding commercial activities. MSD COMMERCE reflects the ease of customer access to these activities; shorter distances enhance customer willingness and frequency of visits, whereas longer distances reduce density and intensity of commercial activity, weaken the commercial atmosphere, and diminish infrastructure and consumer concentration, ultimately adversely affecting retail operations. The correlation between logChoice100 and total business formats reveals a negative relationship. This occurs because the study area contains numerous residential zones. The shortest traversal routes often pass through internal residential roads, i.e., the hutongs, while hotels and restaurants, which primarily cater to tourists, are typically located along more accessible main roads. Consequently, street segments with higher traversing likelihood (logChoice100) tend to have fewer business formats, resulting in a negative correlation. As shown in Figure 11, business formats predominantly cluster along scenic areas and major roads, whereas the upper section and lower-left corner of the study area contain fewer business establishments. Slow-moving traffic flow analysis in Section 3.2 indicates that these two areas also exhibit lower pedestrian and cycling flows, supporting the conclusion that slow-moving traffic positively correlates with the number of business formats. Regression analysis highlights that in historic districts like Qianmen, characterized by narrow roads and mixed functions, attractions that meet public demand for traditional culture are more likely to revitalize the area. Conversely, the complex spatial structure of hutongs, with long distances and low selectivity, limits the distribution of various service functions. The sparse business presence in the upper-right and lower-left corners of the study area, where streets are winding and convoluted, exemplifies this constraint. Based on these findings, subsequent renewal and renovation efforts should increase the number of business formats on streets such as Nanshengou Hutong and Luanqing Hutong in the upper section, integrating traffic flow planning to attract pedestrian movement from high-traffic streets and further enhance the vitality of the entire district.
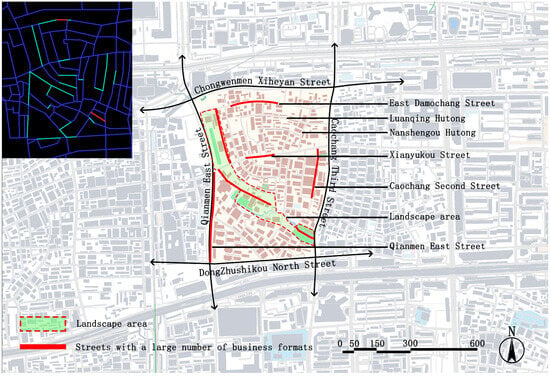
Figure 11.
Distribution of business formats by number.
4.5. Renovation Design Plan
Based on the analysis of slow-moving traffic flow in the Qianmen area (Section 3.2) and the space syntax assessment of business formats (Section 4.4), functional micro-renewal of the historic district must fully account for the interplay between human behavior and spatial configuration, while maximizing the preservation of the traditional historical context. For Category A business formats, such as restrooms and attractions, space planning should prioritize expanding service coverage to ensure convenient access for both tourists and local residents across a broader area. Currently, existing restrooms and attractions primarily serve local residents. Restrooms are often located deep within hutongs, and attractions are similarly embedded within winding alleys, making them difficult for tourists to locate. To better serve visitors and enhance the openness of the Qianmen area, while preserving the original hutong street layout, directional signage should be installed along key pathways to guide tourists, facilitating access to restrooms and attractions. Simultaneously, given the potential for high visitor concentrations at attractions, surrounding traffic flow patterns should be carefully managed to prevent congestion and minimize safety risks.
For Category B business formats, such as hotels and restaurants, layout planning should prioritize high-traffic areas and convenient access to transportation. These establishments should be located as close as possible to main pedestrian walkways, transportation hubs, or key pedestrian flow nodes to maximize accessibility and attractiveness. Moreover, hotels and restaurants can generate synergistic effects by sharing customer resources and enhancing overall service quality, thereby collectively promoting commercial vitality within the district.
Regarding the renovation and revitalization of historic districts, targeted upgrades can be implemented along streets with high pedestrian and vehicular traffic, based on the findings from Section 3.2 and Section 4.4. On densely trafficked streets, such as Changxiang Ertiao Hutong, Changxiang Wutiao Hutong, and the route bordering Sanlihe Park, the placement of amenities like rest seats and shared charging piles can enhance space utilization and encourage pedestrian lingering. Using space syntax analysis, pedestrian flow patterns can be predicted to strategically position these amenities. By incorporating traditional Beijing elements into the Qianmen area and adding rest facilities along high-traffic streets, pedestrians are more likely to pause, satisfying their rest needs while simultaneously increasing foot traffic to nearby commercial establishments.
Additionally, installing shared fast-charging piles on high-traffic streets can address the battery needs of tourists’ smartphones, laptops, and other electronic devices. This encourages pedestrians to linger in the surrounding area while returning power banks to designated locations, increasing the time spent exploring nearby attractions. Such measures create additional opportunities for interaction between pedestrians and street-level commercial spaces. An illustrative layout of rest benches and shared charging piles is shown in Figure 12.
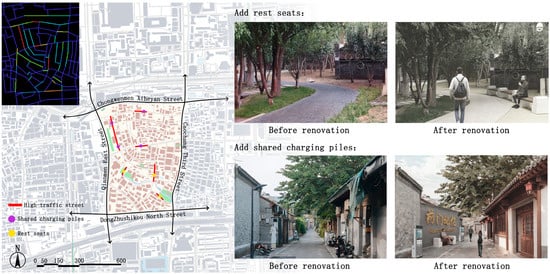
Figure 12.
Renovation design for pedestrian flow.
For streets with high bicycle and e-bike traffic, dedicated cycling routes marked with colored pavement and equipped with rest areas can be established. Based on the predicted bicycle and e-bike traffic flows, high-traffic streets, such as Changxiang Ertiao Hutong and Changxiang Wutiao Hutong, can be linked to lower-traffic streets, such as Nanshenggou Hutong and Caochang Ertiao Hutong, to form a cycling loop. Signage can guide cyclists to voluntarily choose streets with lower traffic, which not only alleviates congestion on busy streets but also directs potential customers to shops, cafes, and cultural stores along less-traveled streets, thereby revitalizing commercial activity across the district. In addition, bicycle parking spots can be installed along both sides of the streets to prevent disorderly parking and reduce street congestion. An illustrative example of the proposed street renovation is shown in Figure 13.
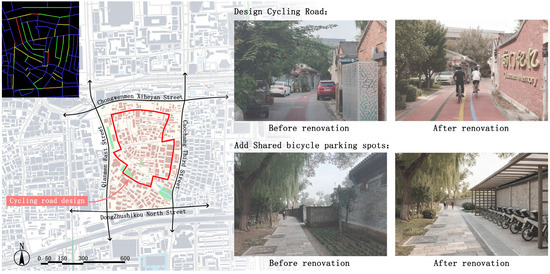
Figure 13.
Renovation design for bicycle and e-bike flow.
5. Conclusions
This study analyzed the distribution patterns of business formats and road traffic flow in the Qianmen historic district using space syntax analysis, predicting both the total number of business formats and three types of slow-moving traffic flow.
In terms of traffic flow, the three categories of slow-moving traffic, pedestrians, bicycles, and e-bikes, are primarily concentrated along main thoroughfares and scenic routes. On weekends, due to increased visitor numbers, both pedestrian and bicycle traffic flows are higher than on weekdays, whereas e-bike traffic is lower during weekends. Regression analysis further indicates that pedestrian flow is positively correlated with log Business Format, log Choice100, and MSD ATTRACTION, while bicycle and e-bike traffic are positively correlated with log Business Format and log Choice100. Increasing the number of business formats can attract tourists with diverse service needs. In this context, log Choice100 effectively represents the activity range of local residents in the hutong area, which simultaneously retains the richest historical and cultural atmosphere attractive to visitors. Moreover, expanding MSD ATTRACTION, for example, by installing signage to guide tourists through winding hutongs to attractions, can increase the accessibility and flow of slow-moving traffic in the Qianmen area, enhancing both visitor experience and commercial activity.
Regarding the distribution of business formats, public restrooms and attractions are dispersed, covering broad service areas, exhibiting high mean shortest distance (MSD) values, and possessing low topological connectivity. In contrast, restaurants and hotels serve smaller areas, exhibit lower MSD values, and display higher topological connectivity, tending to cluster in zones with dense pedestrian flow and convenient transportation access. Regression analysis indicates that the total number of business formats is positively correlated with the number of attractions and negatively correlated with log Choice100 and MSD Business Format. The primary attraction in the Qianmen area is Sanlihe Park, which, along with a historical waterway and surrounding buildings preserving the traditional hutong layout, best reflects the district’s historical culture. Increasing the number of attractions can draw more visitors, thereby stimulating the development of surrounding businesses. However, the study area contains a substantial residential population. Log Choice100, representing short-distance travel, primarily involves hutong areas, whereas businesses are typically located along accessible main roads, avoiding the narrower hutongs. MSD COMMERCE reflects the ease with which customers can access business formats; businesses located on main roads are close and convenient, while those in hutongs require navigating complex alley networks. Increased travel distance reduces customer willingness to visit, resulting in a relatively lower concentration of business formats in these areas.
In terms of specific renovations, the Qianmen area faces several challenges. Although the complex hutong networks retain a strong historical atmosphere, they are often difficult for visitors to navigate. After spending extended periods wandering through the alleys, pedestrians encounter a lack of comfortable rest areas, and the abundance of residential spaces fragments the visitor experience, preventing a fully immersive experience. To address these issues, streets with high pedestrian density can be enhanced by adding amenities such as seating areas and shared charging piles. Additionally, on streets with heavy bicycle and e-bike traffic, designated cycling routes can be established to connect neighborhoods and revitalize quieter streets.
This study adopts space syntax theory as its core technical foundation and constructs a comprehensive research framework encompassing data acquisition, parameter analysis, flow prediction, business format coupling, and design strategy. Using the Qianmen area as a case study, the approach demonstrates the full process from quantitative analysis to targeted design. By leveraging tools such as Space Syntax to examine the relationship between spatial structure and slow-moving behavior, the study achieves minimal intervention in historical scenes while maximizing functional improvement. Nevertheless, this study has certain limitations. The conclusions drawn specifically for Qianmen may not be directly applicable to other regions due to their unique spatial and cultural characteristics. As the renovation project has not yet been completed, post-renovation spatial data are unavailable, and a before-and-after assessment of spatial syntax changes cannot be conducted. In this study, spatial syntax analysis is applied to the existing street configuration to diagnose current spatial characteristics and to inform the proposed renovation strategies, rather than to evaluate their effects. This is one of the limitations of this study, and a comparative pre-renovation and post-renovation analysis shall be conducted for future research once the project is finished. Nevertheless, the primary focus of this paper is the methodological framework itself. The concept of “research methods guiding design” provides not only targeted solutions for the sustainable development of Qianmen but also a replicable methodological reference for the micro-renewal of similar historical districts worldwide, characterized by narrow streets, mixed functions, and rich cultural context, shifting historical block renewal from an experience-based approach toward evidence-based, scientific design.
Author Contributions
Conceptualization, W.Z. (Wen Zhang); Data curation, W.Z. (Wen Zhang); Formal analysis, W.Z. (Wen Zhang), P.W., Y.C., Q.S., W.Z. (Wei Zhang), J.Z. and S.C.; Funding acquisition, W.Z. (Wen Zhang); Investigation, W.Z. (Wen Zhang), P.W., Y.C., Q.S., W.Z. (Wei Zhang) and J.Z.; Methodology, W.Z. (Wen Zhang); Resources, W.Z. (Wen Zhang); Software, W.Z. (Wen Zhang); Validation, W.Z. (Wen Zhang); Writing—original draft, W.Z. (Wen Zhang), P.W., Y.C., Q.S., W.Z. (Wei Zhang) and J.Z.; Writing—review and editing, W.Z. (Wen Zhang) and S.C. All authors have read and agreed to the published version of the manuscript.
Funding
This work was supported by the Foundation of the National Natural Science Foundation of China (Grant No. 52208004).
Data Availability Statement
The raw data supporting the conclusions of this article will be made available by the authors on request.
Conflicts of Interest
Author Wei Zhang and Jie Zheng were employed by the China Architecture Design & Research Group, China. The remaining authors declare that the research was conducted in the absence of any commercial or financial relationships that could be construed as a potential conflict of interest.
References
- Liu, W. Research on Street Reservation and Renewal Based on Historical District Context Inheritance—Take Anpin Street, Qinhuai District, Nanjing, China as An Example. In Conservation of Architectural Heritage (CAH) Embodiment of Identity; Springer International Publishing: Cham, Switzerland, 2022; pp. 269–275. [Google Scholar]
- Kakiuchi, E. Cultural heritage protection system in Japan: Current issues and prospects for the future. Gdańskie Stud. Azji Wschod. 2016, 10, 7–27. [Google Scholar] [CrossRef]
- Sirisrisak, T. Conservation of Bangkok old town. Habitat Int. 2009, 33, 405–411. [Google Scholar] [CrossRef]
- Government of the People’s Republic of China. Outline of the 14th Five-Year Plan for National Economic and Social Development and Long-Range Objectives Through the Year 2035. 2021. Available online: https://www.gov.cn/zhuanti/shisiwu/ie/index.html (accessed on 10 December 2025).
- Bafna, S. Space syntax: A brief introduction to its logic and analytical techniques. Environ. Behav. 2003, 35, 17–29. [Google Scholar] [CrossRef]
- Mehrinejad Khotbehsara, E.; Yu, R.; Somasundaraswaran, K.; Askarizad, R.; Kolbe-Alexander, T. The walkable environment: A systematic review through the lens of Space Syntax as an integrated approach. Smart Sustain. Built Environ. 2025; ahead-of-print. [Google Scholar] [CrossRef]
- Yu, M.; Chen, X.; Zheng, X.; Cui, W.; Ji, Q.; Xing, H. Evaluation of spatial visual perception of streets based on deep learning and spatial syntax. Sci. Rep. 2025, 15, 18439. [Google Scholar] [CrossRef]
- Li, Y.; Wang, M.; Wang, B.; Liang, Y. Bridging Subjective and Objective Dimensions of Resilience: A Space Syntax Approach to Analyzing Urban Public Spaces. Sustainability 2025, 17, 5937. [Google Scholar] [CrossRef]
- Jiang, Z.; Qi, Z.; Chen, L.; Xu, L.; Wan, D.; Burak-Gajewski, P.; Zawisza, R.; Liu, L. External spatial morphology of creative industries parks in the industrial heritage category based on spatial syntax: Taking Tianjin as an example. Buildings 2024, 14, 559. [Google Scholar] [CrossRef]
- Fan, W.; Zhang, J.; Shan, B.; Liu, Y. Evaluating the impact of road network configuration on hotel layout based on big data, GIS and space syntax–evidence from Shanghai. Curr. Issues Tour. 2024, 27, 787–804. [Google Scholar] [CrossRef]
- Wu, Y.; Liu, Q.; Hang, T.; Yang, Y.; Wang, Y.; Cao, L. Integrating restorative perception into urban street planning: A framework using street view images, deep learning, and space syntax. Cities 2024, 147, 104791. [Google Scholar] [CrossRef]
- Wang, L.; Han, X.; He, J.; Jung, T. Measuring residents’ perceptions of city streets to inform better street planning through deep learning and space syntax. ISPRS J. Photogramm. Remote Sens. 2022, 190, 215–230. [Google Scholar] [CrossRef]
- Yang, L.; Jin, Q.; Fu, F. Research on urban street network structure based on spatial syntax and POI Data. Sustainability 2024, 16, 1757. [Google Scholar] [CrossRef]
- Benameur, O.; Leghrib, F.; Laroui, A. Assessing Urban Green Space Accessibility for Sustainable Development in Mostaganem, Algeria: A Space Syntax Approach. J. Contemp. Urban Aff. 2024, 8, 197–211. [Google Scholar] [CrossRef]
- Sheng, Q.; Wang, Z. Spatial logic at different scales: An empirical study on emerging online catering in Beijing. Front. Archit. Res. 2024, 13, 1009–1021. [Google Scholar] [CrossRef]
- Liu, Z.; Wang, S.; Wang, F. Isolated or integrated? Planning and management of urban renewal for historic areas in Old Beijing city, based on the association network system. Habitat Int. 2019, 93, 102049. [Google Scholar] [CrossRef]
- Chakraborty, B.; Dey, P. Spatial characterisation of blighted urban areas using space syntax analysis: The case of historic city centre of Kolkata, India. GeoJournal 2024, 89, 231. [Google Scholar] [CrossRef]
- Lyu, Y.; Abd Malek, M.I.; Jaafar, N.H.; Sima, Y.; Han, Z.; Liu, Z. Unveiling the potential of space syntax approach for revitalizing historic urban areas: A case study of Yushan Historic District, China. Front. Archit. Res. 2023, 12, 1144–1156. [Google Scholar] [CrossRef]
- Fu, J.M.; Tang, Y.F.; Zeng, Y.K.; Feng, L.Y.; Wu, Z.G. Sustainable Historic Districts: Vitality Analysis and Optimization Based on Space Syntax. Buildings 2025, 15, 657. [Google Scholar] [CrossRef]
- Huang, J.; Yang, G. Research on urban renewal based on semantic segmentation and spatial syntax: Taking Wuyishan City as an example. In Proceedings of the International Conference on Smart Transportation and City Engineering (STCE 2023), Chongqing, China, 22–24 September 2023; SPIE: Bellingham, WA, USA, 2024; Volume 13018, pp. 1179–1185. [Google Scholar]
- Cai, B.; Chen, W. Research on the Micro-Renewal of Street Space Vitality in Mituosi Road Block Based on Space Syntax. In Proceedings of the 2024 9th International Conference on Modern Management, Education and Social Sciences (MMET 2024), Hangzhou, China, 18–20 May 2024; Atlantis Press: Dordrecht, The Netherlands, 2024; pp. 786–800. [Google Scholar]
- Fan, M.; Hedayati Marzbali, M.; Abdullah, A.; Maghsoodi Tilaki, M.J. Using a space syntax approach to enhance pedestrians’ accessibility and safety in the Historic City of George Town, Penang. Urban Sci. 2024, 8, 6. [Google Scholar] [CrossRef]
- Li, S. Analysis of Points of Interest in Hsinchu Old City Blocks Using Space Syntax. Eng. Proc. 2025, 91, 8. [Google Scholar]
- Huang, Y.; Zhang, Z.; Fei, J.; Chen, X. Optimization strategies of commercial layout of traditional villages based on space syntax and space resistance model: A case study of Anhui Longchuan village in China. Buildings 2023, 13, 1016. [Google Scholar] [CrossRef]
- Zhu, H.; Liu, J.; Liu, H.; Wang, X.; Ma, Y. Recreational Business District boundary identifying and spatial structure influence in historic area development: A case study of Qianmen area, China. Habitat Int. 2017, 63, 11–20. [Google Scholar] [CrossRef]
- Wang, Z. Remodeling and Reflection Historic District-Taking Qianmen Street as an example. In IOP Conference Series: Earth and Environmental Science; IOP Publishing: Bristol, UK, 2017; Volume 86, p. 012001. [Google Scholar]
- Tao, S.; Duan, W. A Post-Evaluation Study on the Renewal of Public Space in Qianmen Street of Beijing’s Central Axis Based on Grounded Theory. Buildings 2024, 14, 3969. [Google Scholar] [CrossRef]
- Sheng, Q.; Jiao, J.; Pang, T. Understanding the impact of street patterns on pedestrian distribution: A case study in Tianjin, China. Urban Rail Transit 2021, 7, 209–225. [Google Scholar] [CrossRef]
- Hillier, W.R.G.; Yang, T.; Turner, A. Normalising least angle choice in Depthmap-and how it opens up new perspectives on the global and local analysis of city space. J. Space Syntax. 2012, 3, 155–193. [Google Scholar]
Disclaimer/Publisher’s Note: The statements, opinions and data contained in all publications are solely those of the individual author(s) and contributor(s) and not of MDPI and/or the editor(s). MDPI and/or the editor(s) disclaim responsibility for any injury to people or property resulting from any ideas, methods, instructions or products referred to in the content. |
© 2026 by the authors. Licensee MDPI, Basel, Switzerland. This article is an open access article distributed under the terms and conditions of the Creative Commons Attribution (CC BY) license.