1. Introduction
Concrete is the second most widely used material in the world, surpassed only by water [
1]. In 2017 alone, the United States consumed over 2.9 billion metric tons of natural aggregates for concrete production [
2]. This immense demand is accelerating the depletion of natural resources and increasing the energy required to process raw materials for construction. Meanwhile, the volume of plastic waste continues to increase annually. In 2017, plastics accounted for nearly 20% of the total municipal solid waste (MSW) in the United States of America, with more than 75% of this plastic ending up in landfills [
3]. The growing accumulation of landfilled waste poses serious environmental and economic challenges. One potential solution is the partial replacement of natural aggregates with plastic particles in concrete. This approach could help reduce both the volume of landfilled plastic waste and the reliance on natural aggregates.
The effective utilization of plastic waste in concrete necessitates a careful selection of plastic types that are both prevalent in municipal waste streams and amenable to industrial-scale processing. This study focuses on six of the most commonly encountered plastic types in MSW recycling: polyethylene terephthalate (PET), high-density polyethylene (HDPE), polyvinyl chloride (PVC), low-density polyethylene (LDPE), polypropylene (PP), and polystyrene (PS) [
4,
5,
6,
7]. These plastics consistently dominate global plastic production and are consequently the most abundant in post-consumer waste streams, making them highly relevant for large-scale recycling efforts.
The incorporation of plastic waste into concrete as a filler material has been studied for over two decades, with PET receiving particular attention due to its abundance and established recyclability [
8,
9,
10,
11,
12,
13,
14,
15]. In contrast, research on other types of plastic, such as HDPE, PVC, LDPE, PP, and PS, remains limited [
16,
17,
18,
19,
20]. The literature presents conflicting findings regarding the effects of replacing natural aggregates with plastic waste aggregates. Some studies report improvements in concrete properties, especially at lower replacement ratios (RR), attributing these gains to the formation of a high-strength composite microstructure and the flexibility of plastic particles, which help redistribute internal stress concentrations [
12,
13,
21]. Conversely, other studies note reductions in strength, either due to the substitution of strong natural aggregates with weaker plastic components [
18] or because of the hydrophobic nature of plastics, which can increase porosity and weaken the interfacial transition zone (ITZ), ultimately leading to debonding failures [
13,
14,
22,
23]. As a result, the current body of research yields inconsistent conclusions, leaving the overall impact of incorporating plastic into concrete unresolved.
Previous researchers typically investigated concrete performance by incorporating a single or limited set of plastic materials under different experimental conditions, which hindered a sufficient understanding of the effect of plastic components on the overall characteristics of concrete. Even when the plastic type and replacement ratio were consistent across studies, inconsistencies in the results were observed. This could be attributed to several factors, including plastic particle morphology and size, concrete handling, and test conditions.
By selecting the predominantly found plastic types in waste streams and adopting a preparation methodology that aligns with typical post-consumer degradation levels and essential industrial recycling steps, this research aims to provide insights into the structural performance of concrete that are directly relevant to large-scale, sustainable waste valorization practices. In particular, to address conflict findings of previous research and ensure an accurate assessment of the effect of varying plastic types on concrete performance, this study presents a comprehensive experimental program examining the impact of using different types of plastic aggregate (i.e., PET, HDPE, PVC, LDPE, PP, and PS) on concrete properties under consistent conditions.
2. Materials
Ordinary Portland Cement (OPC), specifically Type I cement from the QUIKRETE brand, was used throughout the experimental program. Laser diffraction particle size analysis was performed on samples of each plastic powder type. The mean particle size of the plastic powders is shown in
Table 1. Natural fine aggregate (NFA) was sourced from river sand, while natural coarse aggregate (NCA) consisted of #57 crushed limestone with a maximum nominal size of 38 mm. The physical properties of these materials are summarized in
Table 1.
Six types of plastic, dominating MSW streams, were used as plastic fine aggregate (PFA): polyethylene terephthalate (PET), high-density polyethylene (HDPE), polyvinyl chloride (PVC), low-density polyethylene (LDPE), polypropylene (PP), and polystyrene (PS). The preparation of plastic waste for use as aggregate followed the methodology outlined by Abduallah [
23] and involved multiple processing steps. This study examined each of the seven types of plastics separately. Consequently, the presorting of plastic type from MSW for use in concrete is an essential step at a laboratory or industrial scale. The degradation level was based on single-use items, which are representative of many plastic products used by consumers (such as food containers and beverage bottles) [
24,
25,
26,
27].
While real-world municipal waste presents varying contamination levels, it is well-established that decontamination and washing are indispensable steps in any viable industrial-scale plastic recycling process aimed at utilizing discarded plastics in different applications. This mandatory pre-treatment ensures a consistent cleanliness standard, making the initial contamination level of collected waste less critical to the final product quality for reprocessing. In addition, a mechanical single-blade grinder was used for converting the plastic waste into particles. Hypothetically, the same particle morphology could be generated from any other mechanical grinder [
28].
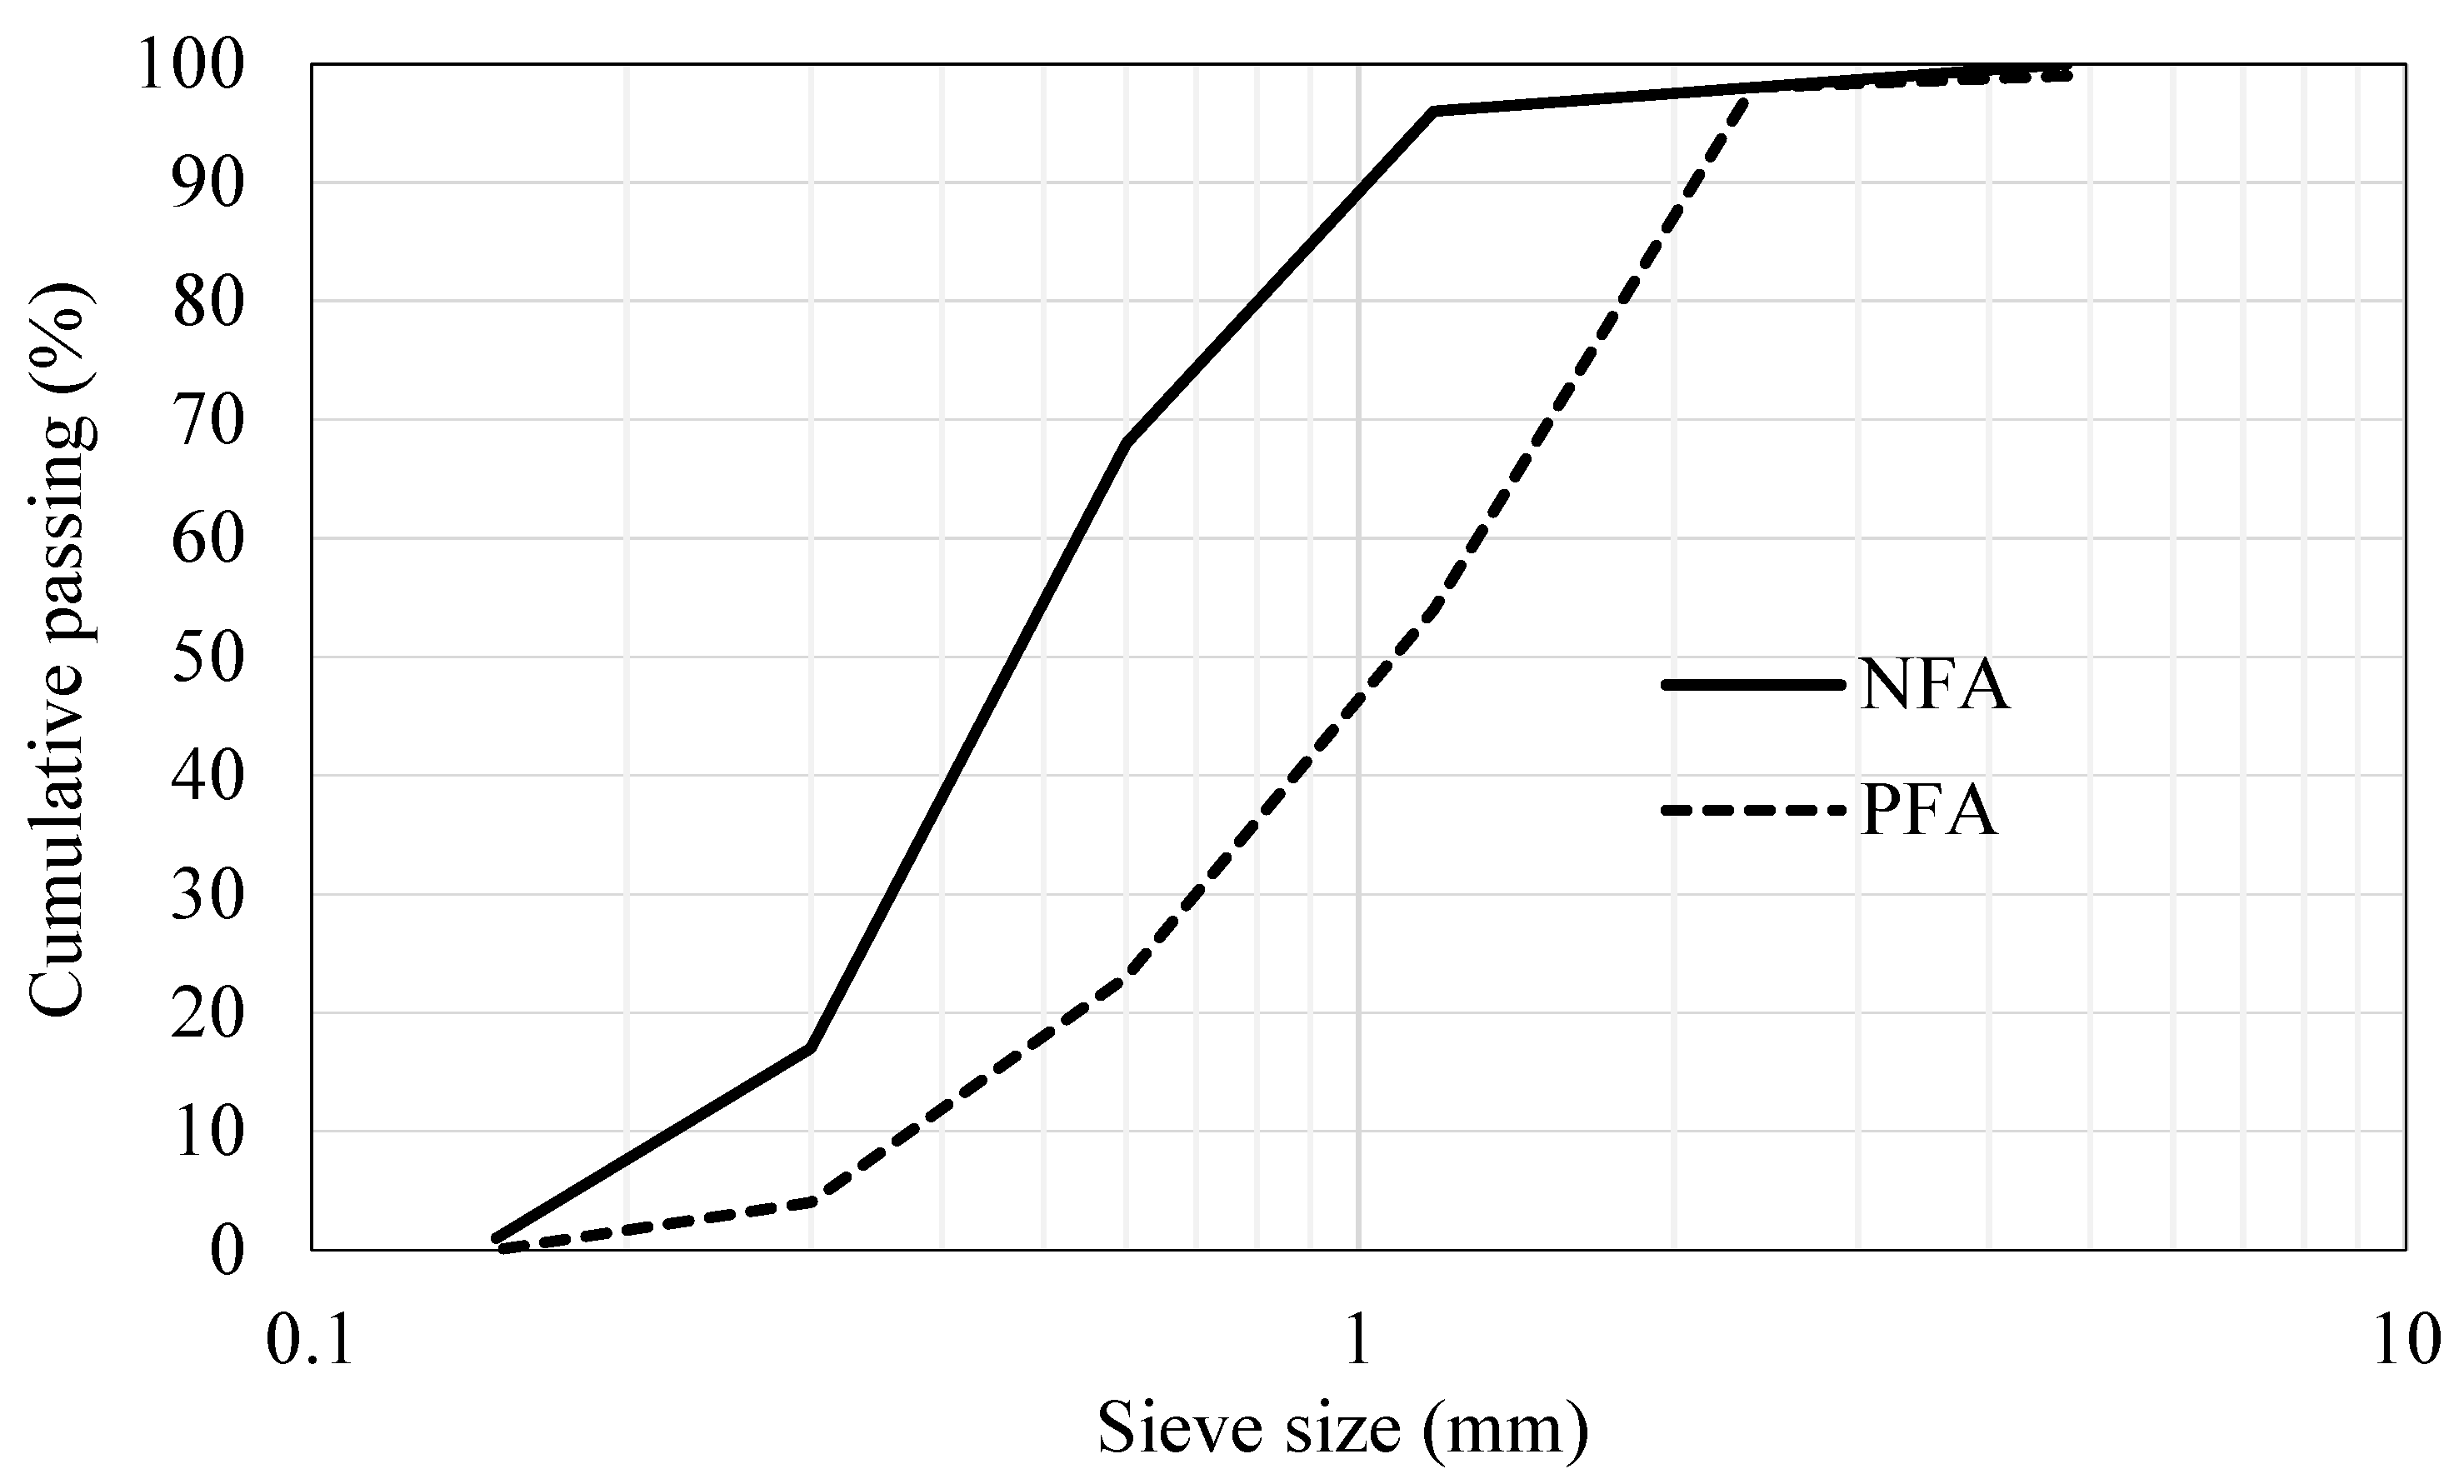
Therefore, after presorting plastics, all plastic materials were decontaminated to remove any foreign substances. Each plastic type was then washed using soap, thoroughly rinsed with tap water, and dried using an air gun. The dried plastics were ground using an electric grinder and subsequently sieved to obtain particles passing through a 4.75 mm sieve and retained on a 75 µm sieve, meeting the size requirements for fine aggregates. Size optimization was performed to make sure all plastic fine aggregate has a constant fineness modulus of 3.2 (i.e., Abduallah [
23]). This step was executed to ensure that the effects of particle size on mortar and concrete characteristics are eliminated, since particle size and size distribution influence the interfacial transition zone between filler particles and cement paste.
Figure 1 shows the size distribution of the natural fine aggregate (NFA) and the optimized plastic fine aggregate (PFA).
To ensure uniformity in mix design, the saturated surface-dry (SSD) bulk specific gravity of each plastic type was determined in accordance with ASTM C128 [
29], while particle size distribution and gradation were assessed using ASTM C136 [
30]. Gradation was further adjusted to achieve a consistent fineness modulus across samples. Prior to mixing, all plastic aggregates were oven-dried at 95 °C to eliminate moisture and ensure zero water content. The drying temperature of 95 °C was used based on a trial-and-error process to minimize the effects on the surface condition of the plastic particles. Unlike higher temperatures, at a temperature of 95 °C, no visible surface or physical changes were observed in all plastic particles used in this research. Physical characteristics, the mechanical behavior of each plastic type, specifically Poisson’s ratio, was also considered, as it influences the deformation and stress distribution within the concrete matrix. Based on data from Guerra and Lima [
31] and Akay [
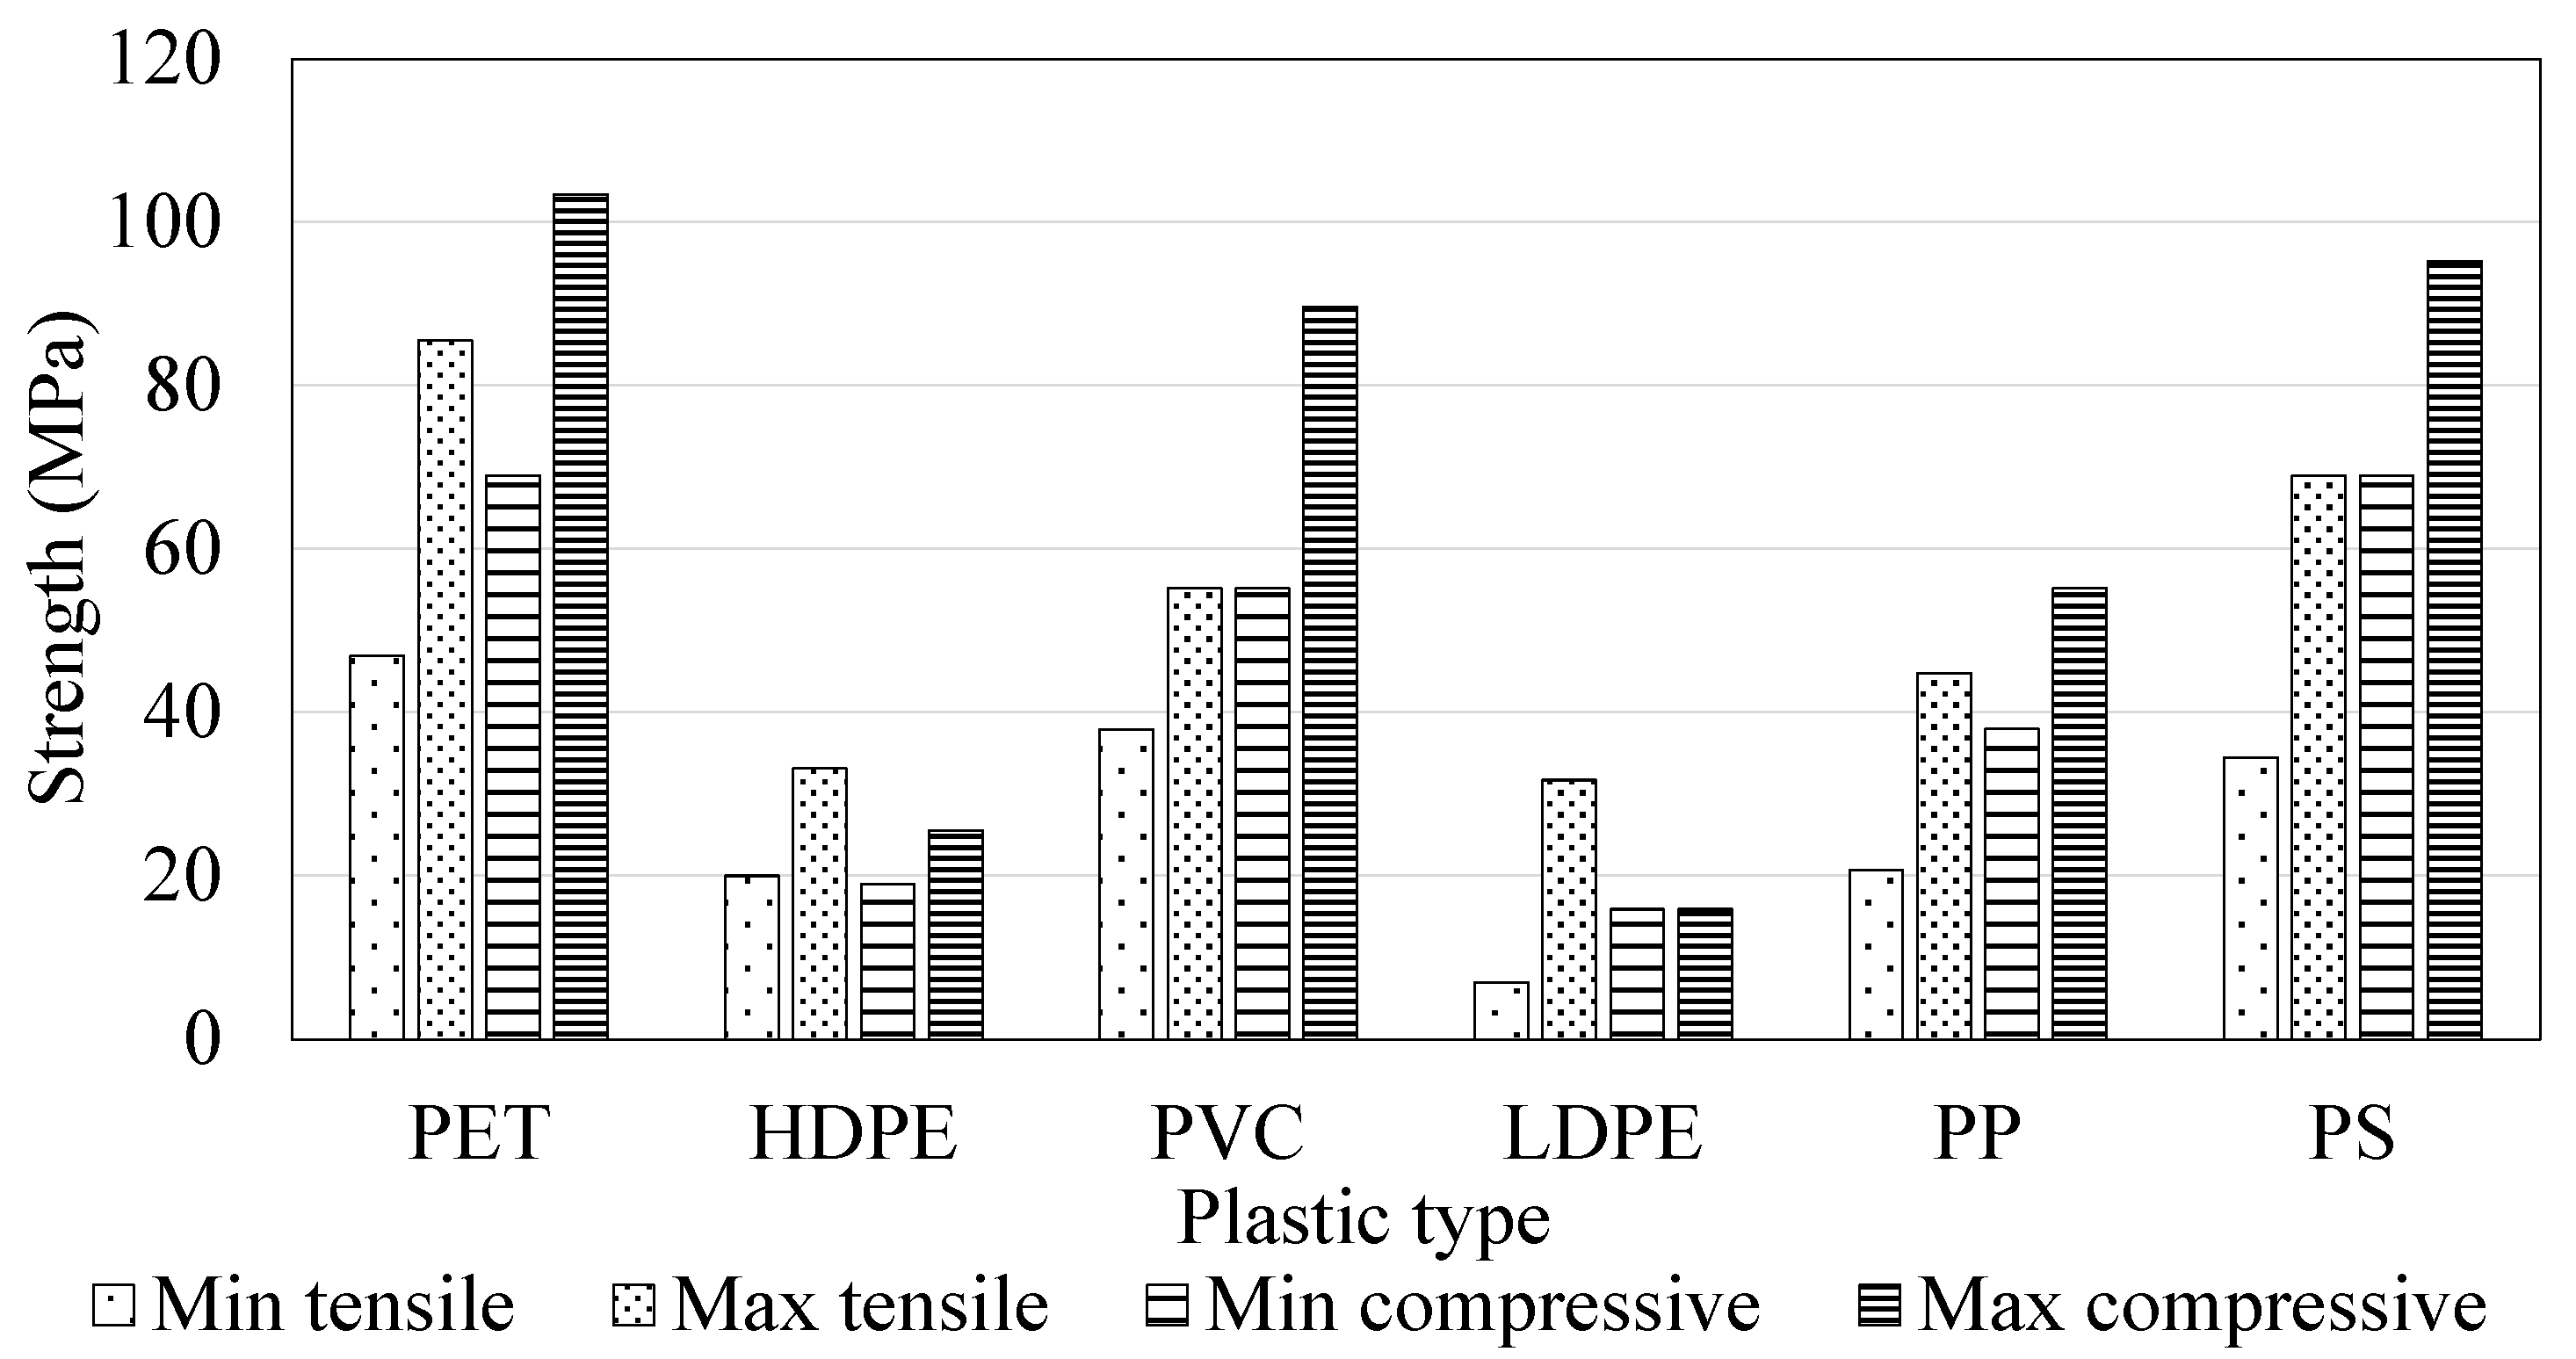
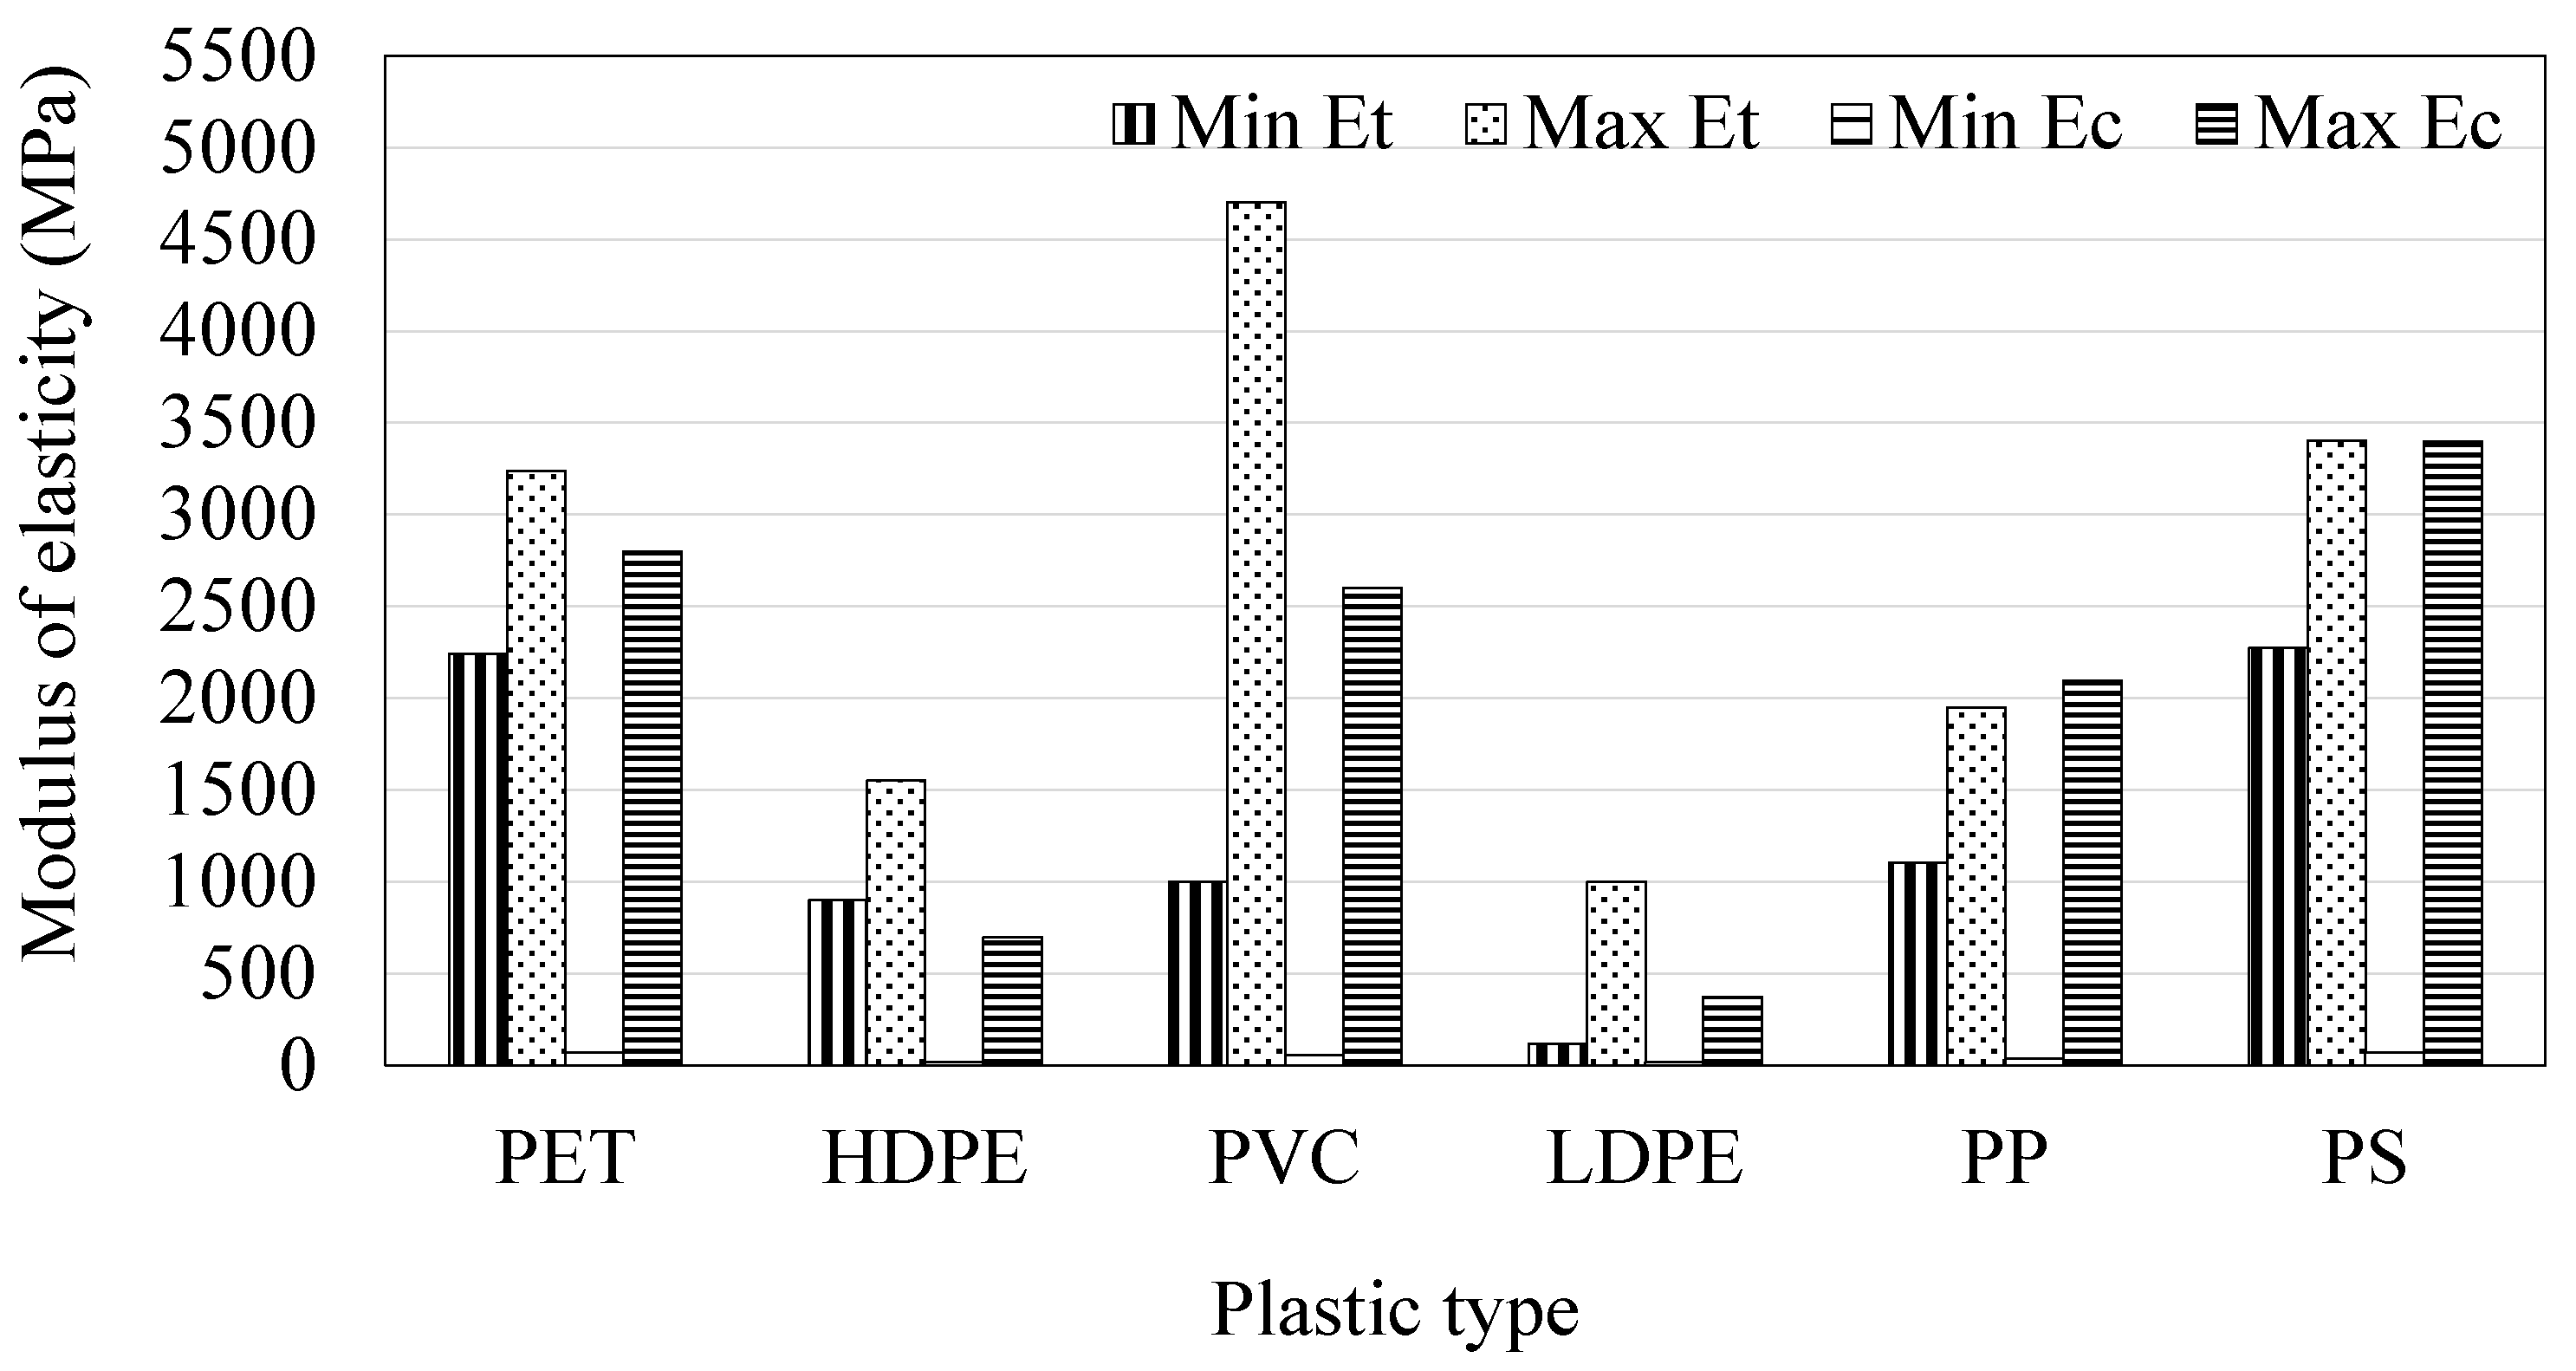
32], the Poisson’s ratio values for the plastics used are as follows: PET and PP each have a value of 0.43, HDPE and LDPE both have a value of 0.46, PVC has a value of 0.40, and PS has the lowest value at 0.35. The overall physical and mechanical properties of the selected plastics used as aggregates are summarized in
Table 1 and
Figure 2 and
Figure 3. It should be noted that the plastic mechanical strength provided by Guerra and Lima [
31] and Akay [
32] corresponds to bulk polymer behavior. However, these values could be different for ground plastic.
Moreover, the process of converting waste plastics into aggregates for concrete, often involving grinding, can yield consistent particle morphology for a given plastic type, irrespective of the specific grinding equipment used [
27,
28]. This suggests that the plastic aggregates prepared in this study are representative of what could be achieved in an industrial setting with similar cleanliness and particle morphology after appropriate mechanical processing and sorting.
The particle morphology of each plastic type used in this study is detailed in Abduallah [
23]. The plastic fine aggregate sizes ranged from 75 µm to 4.75 mm. Representative samples of each plastic type were scanned and analyzed using Image J (version 1.53m). Individual particles were thresholded and measured to obtain aspect ratio and circularity (4πA/P
2). These parameters were used to quantify differences in particle shape and angularity across plastic types (
Table 2). PET particles exhibited a flaky shape with a thickness of approximately 0.10 mm, characterized by sharp edges and smooth surfaces. PP particles were similar in shape to PET but thicker (around 0.30 mm) and with less pronounced edges (circularity ~0.48). Both HDPE and PVC particles were granular with a lower aspect ratio. However, HDPE particles displayed a rougher surface texture and greater angularity compared to PVC. LDPE particles were predominantly granular but also included long, fiber-like forms, with visual inspection suggesting that about 20% of LDPE particles were fibrous. Polystyrene (PS) particles were irregularly shaped, featuring sharp edges with the highest aspect ratio (~0.71), indicating more equidimensional fragments.
3. Methods
The main variable in this experimental program was the type of plastic used to partially replace natural fine aggregate (NFA) in concrete. To ensure meaningful comparisons, several parameters were held constant: the water-to-cement ratio (w/c), ordinary Portland cement (OPC) content, aggregate particle size, and size gradation (i.e., maintaining a consistent fineness modulus). The plastic fine aggregate (PFA) was free of moisture and contaminants, and all plastic materials were uniformly degraded, representing a single-use condition. Additionally, all specimens underwent identical mixing, curing, and testing procedures.
Concrete mixtures incorporating six different types of plastic aggregates were prepared, each with a fixed volumetric replacement ratio (RR) of 10% for the NFA. The fresh properties of each mixture were evaluated prior to casting. Mix designs followed the volumetric method outlined in ACI 211 [
33], targeting a compressive strength of 45 MPa at 28 days. The w/c ratio was maintained at 0.445 across all mixtures, and PFA replaced NFA volumetrically at 10%, except for the control mix. The basis for the selection of 10% RR was the experiments conducted by Abduallah [
23], which involved mortar specimens with three different RRs: 5%, 10%, and 15%. Mortar test results showed that replacing up to 10% of NFA with PFA did not exhibit large compressive strength reduction [
16].
Table 3 provides details on the proportions of each concrete mixture. The control concrete was labeled as C, while mixes containing plastic aggregates were named according to the type of plastic used; for example, the mix with PET particles was designated as PET.
The concrete mixing procedure was carried out in accordance with ASTM C192 [
34]. All materials, including OPC, water, natural fine aggregate (NFA), natural coarse aggregate (NCA), and plastic fine aggregate (PFA), were weighed to the nearest 0.001 kg. Initially, the NFA and PFA were thoroughly mixed. Then, the full amount of NCA and approximately 30% of the mixing water were placed into the mixer before starting. The remaining ingredients were gradually added while the mixer was running. Once all components were combined, the concrete was mixed for three minutes, rested for three minutes, and then mixed again for an additional two minutes.
Prior to casting specimens, the concrete’s workability, air content, and fresh density were measured. The slump test was performed following ASTM C143 [
35]. Air content and fresh density were determined using the pressure method described in ASTM C231 [
36]. Concrete cylinders for testing were cast in triplicate using molds measuring 101.6 mm in diameter and 203.2 mm in height, as specified by ASTM C192 [
34].
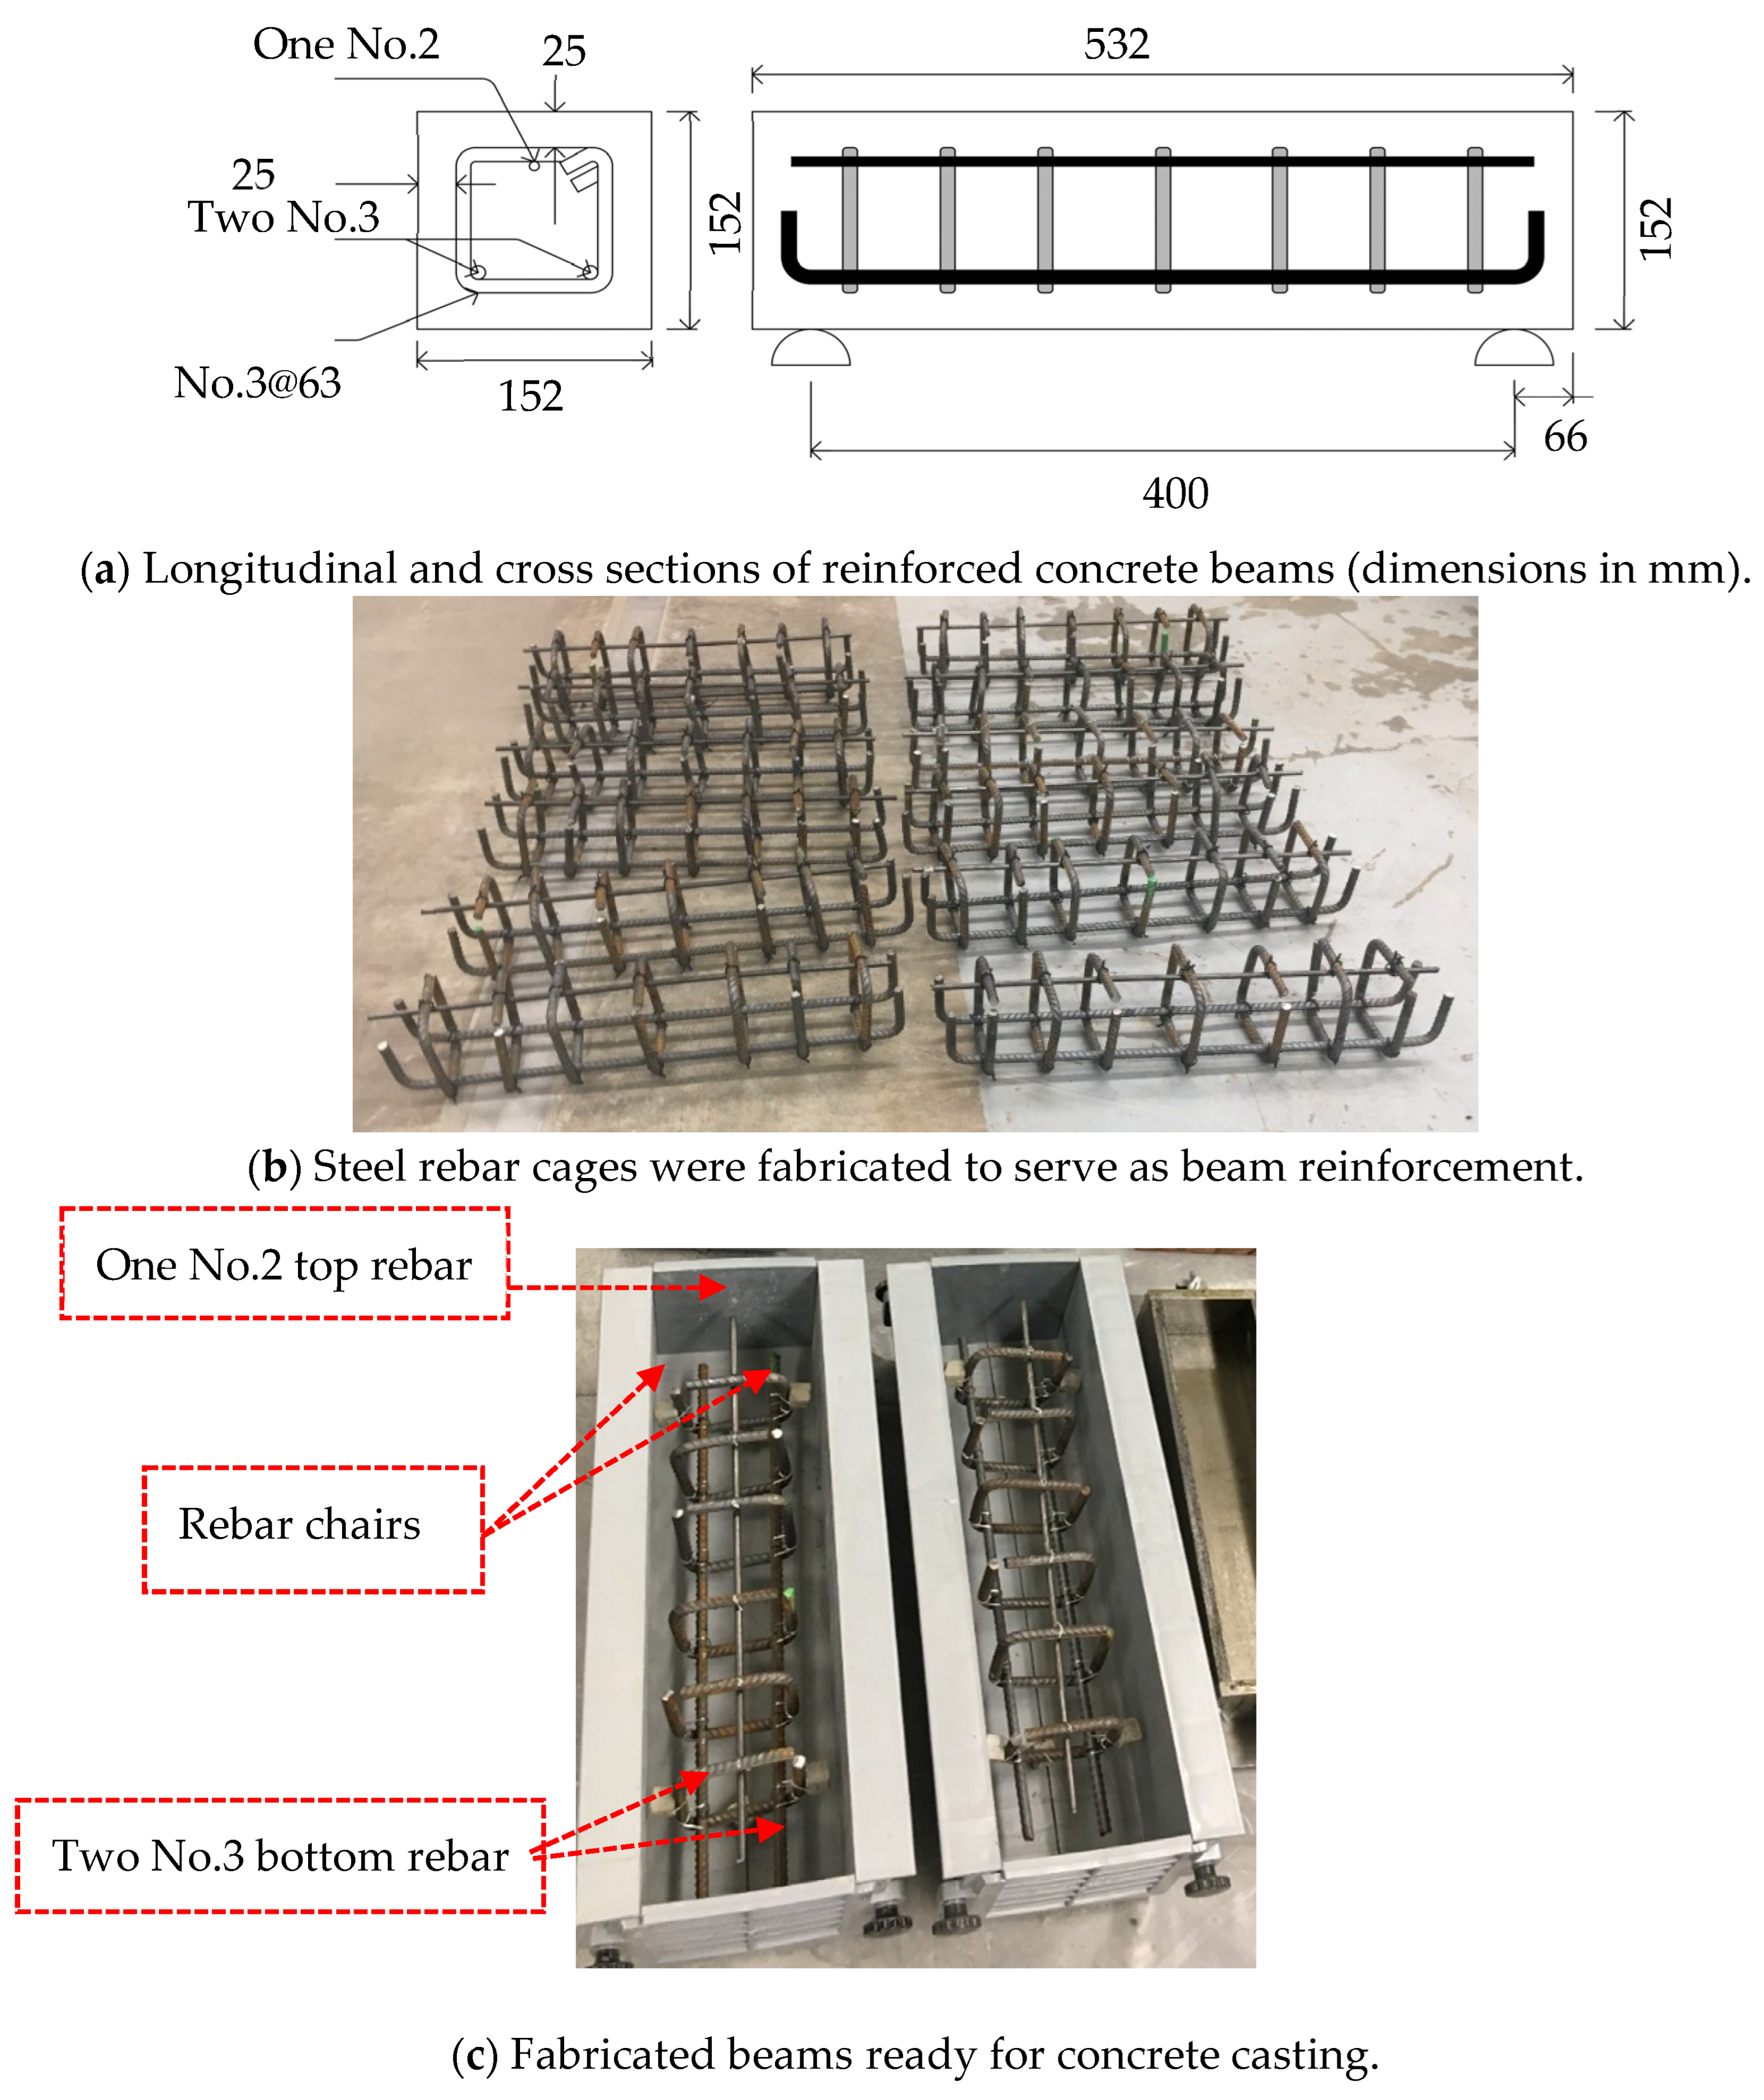
Beams measuring 152 × 152 × 532 mm were designed to fail in flexure rather than shear. For each type of fine aggregate, two beams were cast. The steel reinforcement cages consisted of two types of bars: Grade 60 deformed (ribbed) rebar with a 9.5 mm diameter (No. 3) to ensure strong bonding and minimize slippage, and plain (smooth surface) Grade 40 rebar with a 6.4 mm diameter (No. 2). Each beam was reinforced with two No. 3 bars placed at the bottom and one No. 2 bar at the top to secure the cage, as illustrated in
Figure 4a–c. The bottom bars were equipped with 90-degree hooks at their ends to prevent slippage.
Vertical stirrups made from No. 3 rebar were spaced at 63 mm center-to-center near the supports and 76.5 mm at midspan. After 24 h of initial curing, all concrete specimens were demolded and transferred to a curing room maintained at 100% relative humidity and 23 ± 2 °C until testing at 3, 7, and 28 days. Additional cylindrical specimens were tested at 365 days.
The dry density of concrete cylinders was determined based on their dimensions, following the procedures outlined in ASTM C39 [
37]. Prior to weighing, surface moisture was removed using a towel, and the mass of each specimen was recorded to the nearest 0.001 kg. To assess compressive strength, three cylindrical specimens from each concrete mixture were tested in accordance with ASTM C39 [
37] using a Forney universal testing machine (UTM) with a capacity of 2200 kN. The indirect splitting tensile strength was evaluated following ASTM C496 [
38]. Additionally, the modulus of elasticity and Poisson’s ratio were determined in accordance with ASTM C469 [
39].
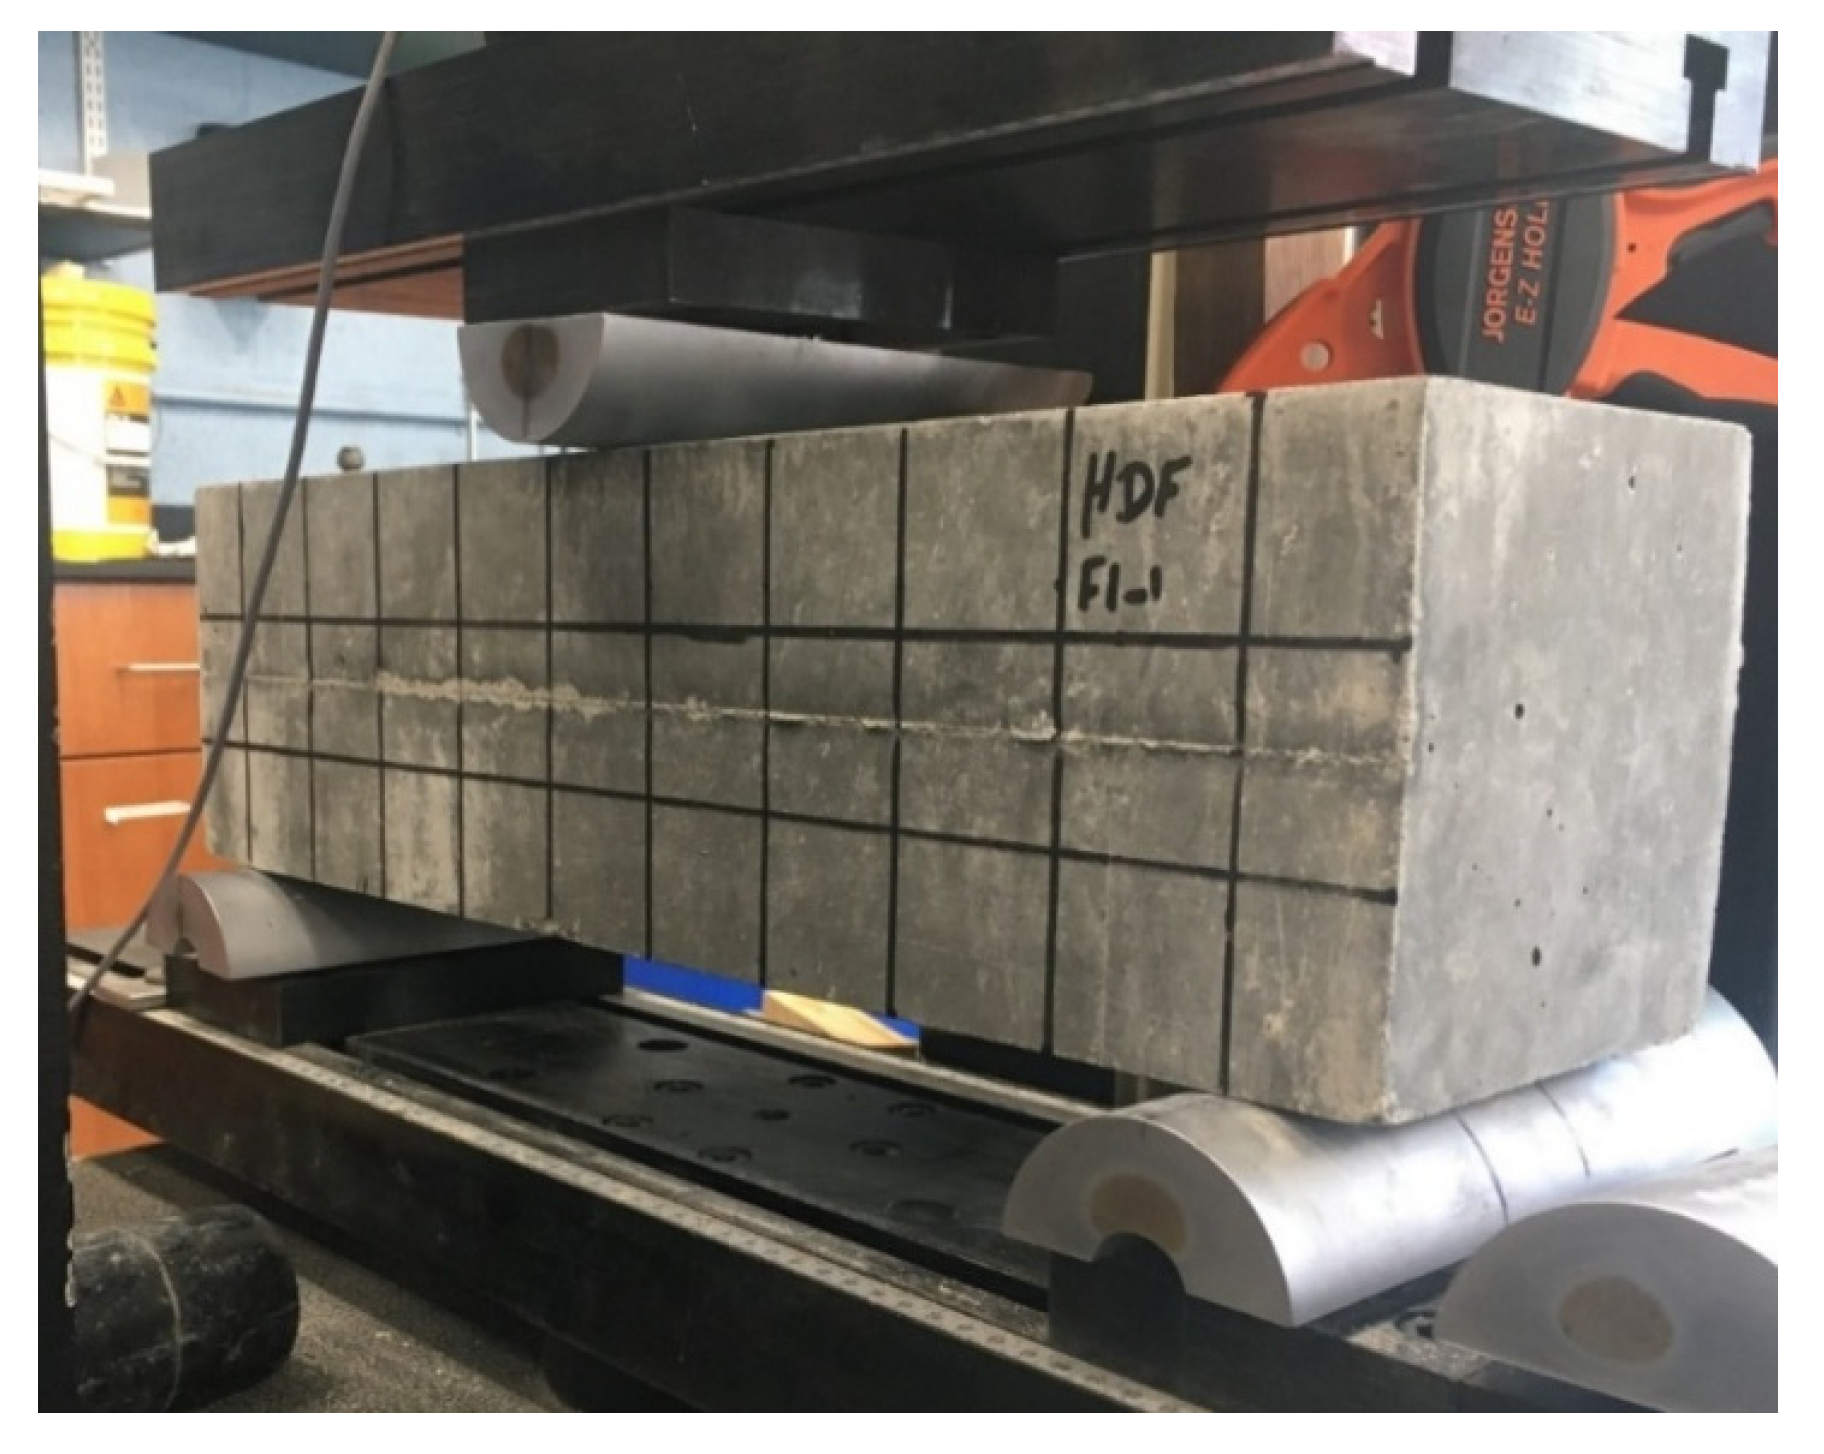
To evaluate the structural performance of concrete incorporating plastic fine aggregate, reinforced concrete (RC) beams were cast to simulate flexural behavior under monotonic loading. The beams were simply supported and tested using a UTM with a maximum capacity of 133 kN (
Figure 5). A point load was applied at midspan under displacement-controlled conditions at a loading rate of 2 mm per minute.
In addition, the ultrasonic pulse velocity (UPV) test was employed to assess the internal quality of plastic-aggregate concrete and compare it with conventional concrete. UPV testing provides insight into concrete uniformity and void content, with higher pulse velocities generally indicating better quality and durability [
40,
41]. The test was performed according to ASTM C597 [
42] on three concrete cylinders per mixture type, and the average UPV value was reported.
The electrical resistivity test offers insight into the pore structure of concrete, specifically pore size and the degree of pore interconnectivity. This parameter is closely linked to concrete durability, as it can be correlated with the chloride diffusion coefficient through the Nernst-Einstein equation [
43]. Concrete with larger, more interconnected pores exhibits lower resistivity, higher permeability, and reduced durability. In contrast, higher electrical resistivity indicates a denser microstructure with greater resistance to ion movement, which is associated with improved durability and a lower likelihood of corrosion [
44,
45,
46]. Resistivity is also affected by changes in the chemistry of the pore solution of a concrete sample. This study’s test matrix altered only the aggregate composition, so it is assumed that the pore solution was functionally similar in all samples, resulting in changes in resistivity due primarily to changes in pore structure. In this study, the uniaxial bulk electrical resistivity of concrete cylinders was measured using the Proceq Resipod bulk resistivity device. The electrical resistivity (ER), expressed in kΩ·cm, was calculated using Equations (1)–(3).
where
Rcy is Resipod reading,
a is the Resipod probe spacing (38 mm),
A is the cross-sectional area of the cylinder (8107 mm
2),
L is the cylinder height (203.2 mm), and
k is a shape factor.
Utilizing plastic-aggregate concrete for making RC beams demonstrated flexural elastic and plastic behavior comparable to that of the control specimen. Flexural properties, including load and displacement, first cracking load (Pcr), and displacement at the first crack (Δcr), were determined. Cracking properties were determined based on the visual observation of the first crack initiation. A timer was used to track the time of the first crack appearance. Data synchronization was performed to determine Pcr and Δcr. Py is the loading value that caused the steel to yield, and Δy is the associated displacement. Py and Δy were obtained from the load-deflection relationship. Pu is the load at ultimate, and Δu is the associated displacement. After the concrete at the top of the midspan of the beam was crushed, the test stopped, and both Pu and Δu were determined.
4. Results and Discussion
4.1. Concrete Workability
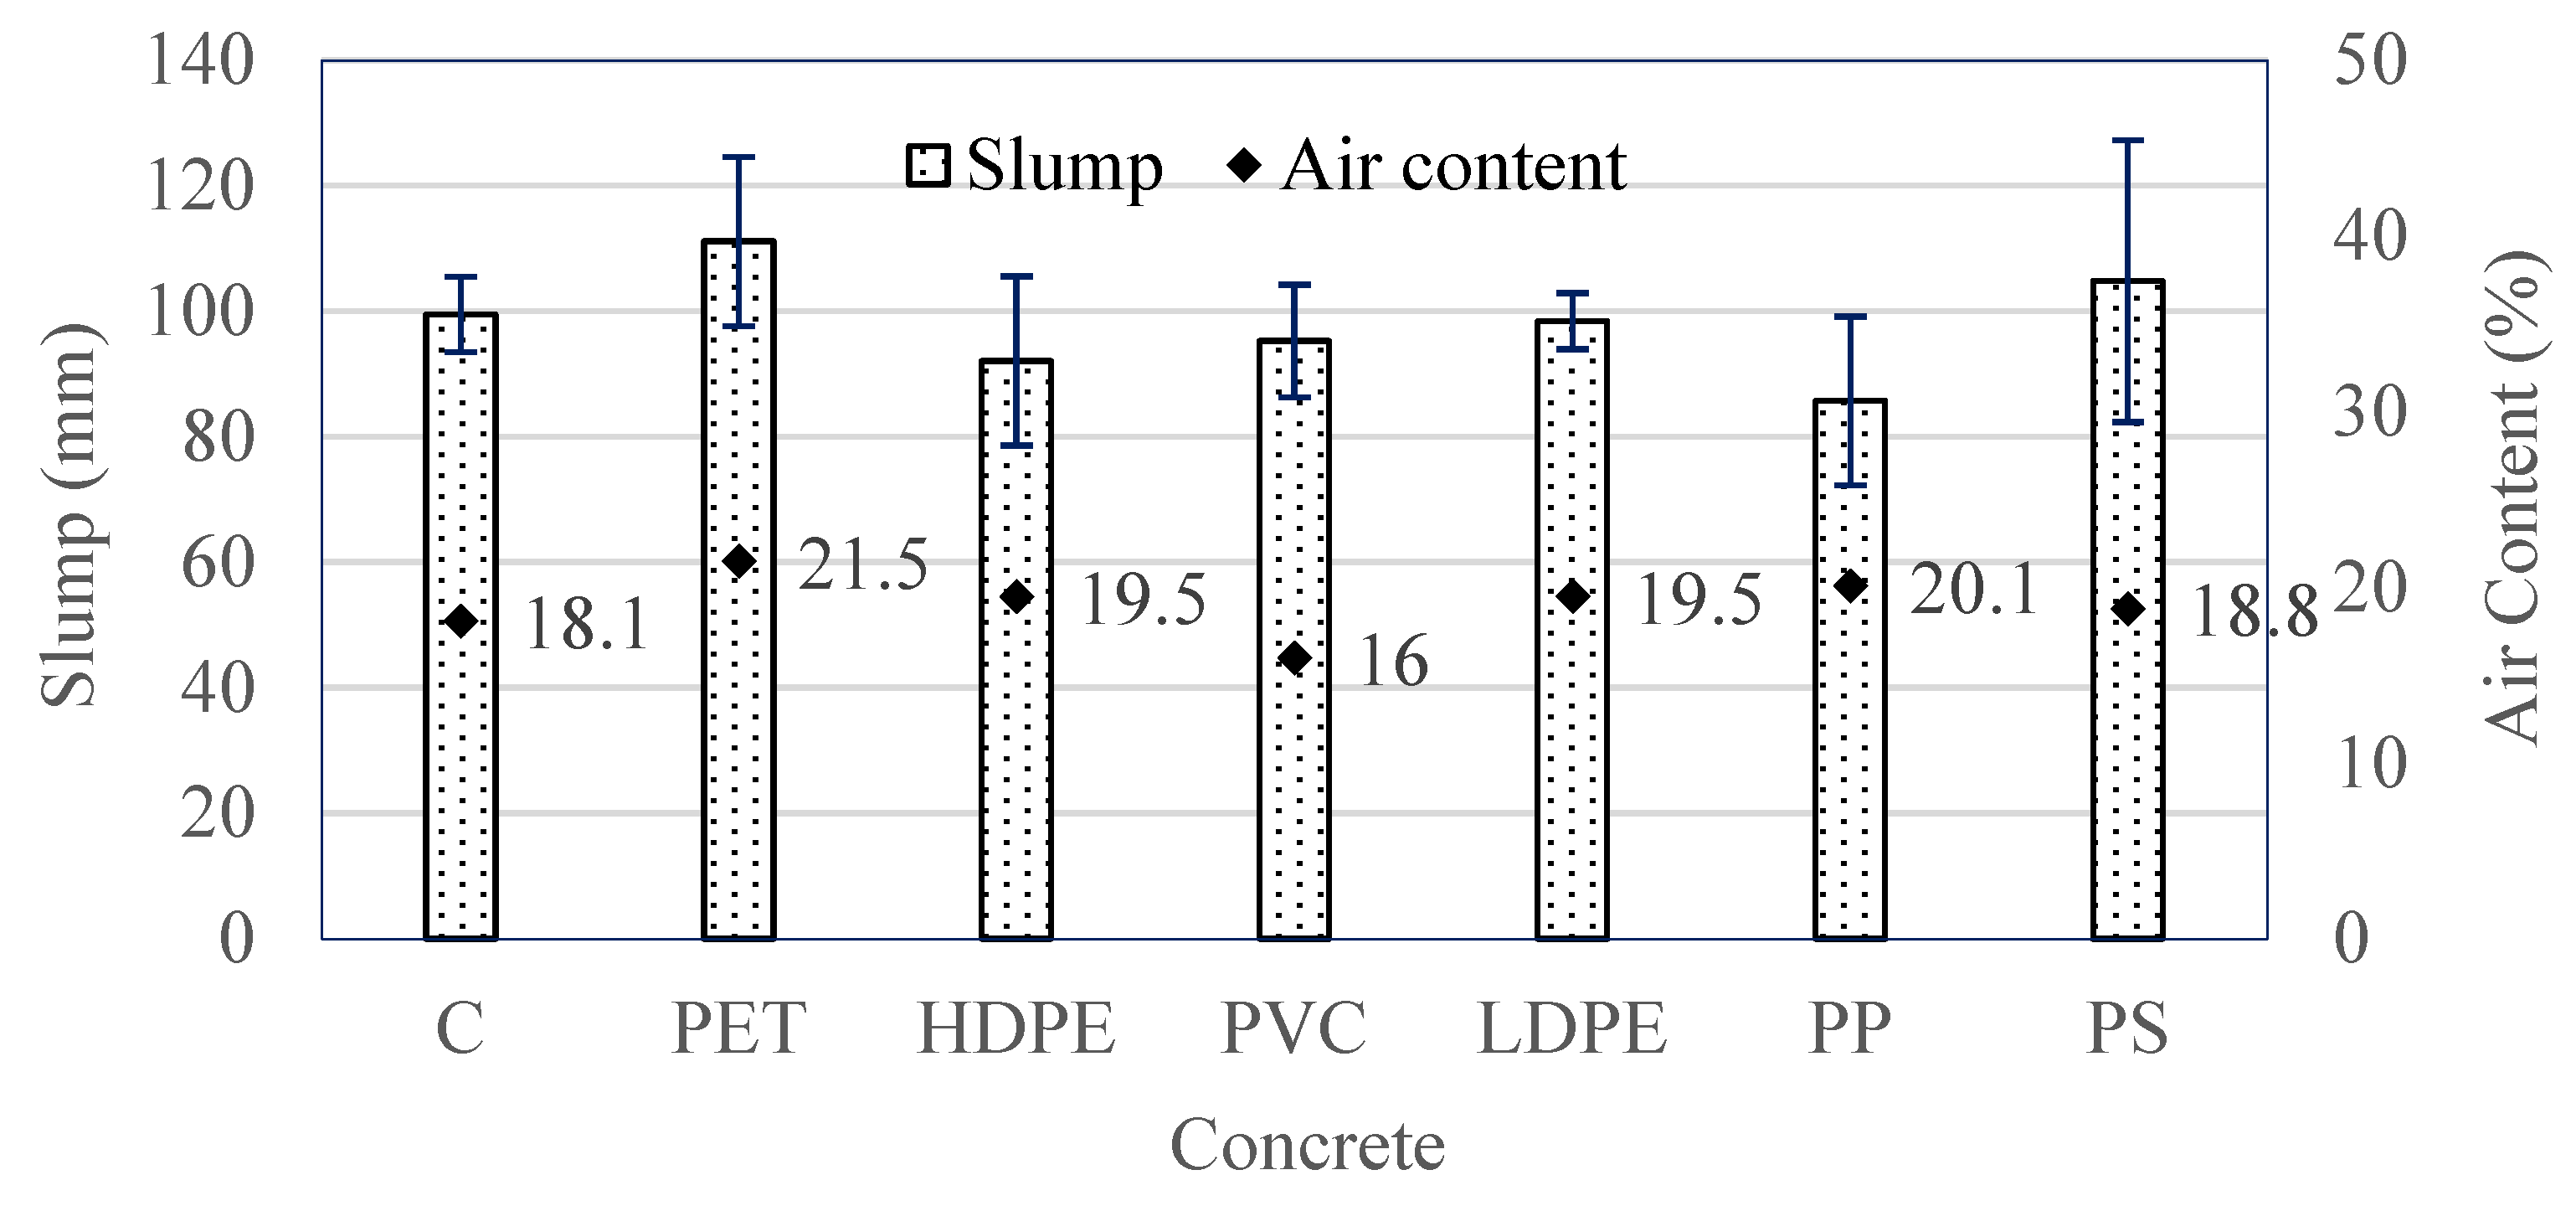
Figure 6 presents the slump test results for the various concrete mixtures. The effect of replacing natural fine aggregate (NFA) with plastic fine aggregate (PFA) varied depending on the type of plastic used. Workability slightly increased in the PET and PS mixtures, while a slight reduction was observed in mixtures containing other plastic types. However, the changes in slump compared to the control concrete were not statistically significant, as they remained within ± one standard deviation of the control values. This limited impact is likely due to the relatively low proportion of plastic particles (10% volumetric replacement) compared to other components in the mix, such as coarse aggregate.
It is possible that more pronounced effects on workability would emerge at higher plastic replacement levels. Previous studies have also reported inconsistent trends, with both increases and decreases in workability observed when plastic was used to replace sand in concrete [
47,
48,
49]. Overall, no consistent pattern has been established regarding whether the inclusion of plastic particles enhances or reduces concrete workability.
4.2. Concrete Air Content
As presented in
Figure 6, replacing natural fine aggregate (NFA) with plastic fine aggregate (PFA) generally led to a modest increase in the entrapped air content compared to the control concrete, which had an air content of 1.81%. While limited research has addressed the effect of plastic aggregates on air content in fresh concrete, findings from Chen et al. [
12] support the results observed in this study. They reported a 2% increase in air content when 10% of NFA was replaced with HDPE, aligning with the trends noted here.
The observed increases in air content are likely attributable to the geometry of the plastic particles. Air becomes entrapped during the mixing and consolidation processes, and angular, flat, or elongated particles tend to trap more air than rounded particles typically found in natural sand [
50,
51]. Among the mixtures tested, concrete containing PET, which had thin, flaky particles, exhibited the highest air content, with an 18.8% increase relative to the control. Mixtures with HDPE, LDPE, and PP, all characterized by angular particle shapes, also showed elevated air contents. Conversely, concrete containing PVC, which had more uniform, granular particles, exhibited the lowest air content, a reduction of 11.6% compared to the control.
An increase in entrapped air content is generally associated with reduced concrete strength and durability [
33]. According to ASTM C128 [
29], each 1% rise in air content can result in a 2–6% decrease in compressive strength. However, in this study, the variations in air content among the different concrete mixtures were not considered significant. All measured values remained within the typical range of expected fluctuations and fell within the acceptable error margin of 2 ± 1%, as specified by ACI 211 [
33].
4.3. Fresh and Dry Densities
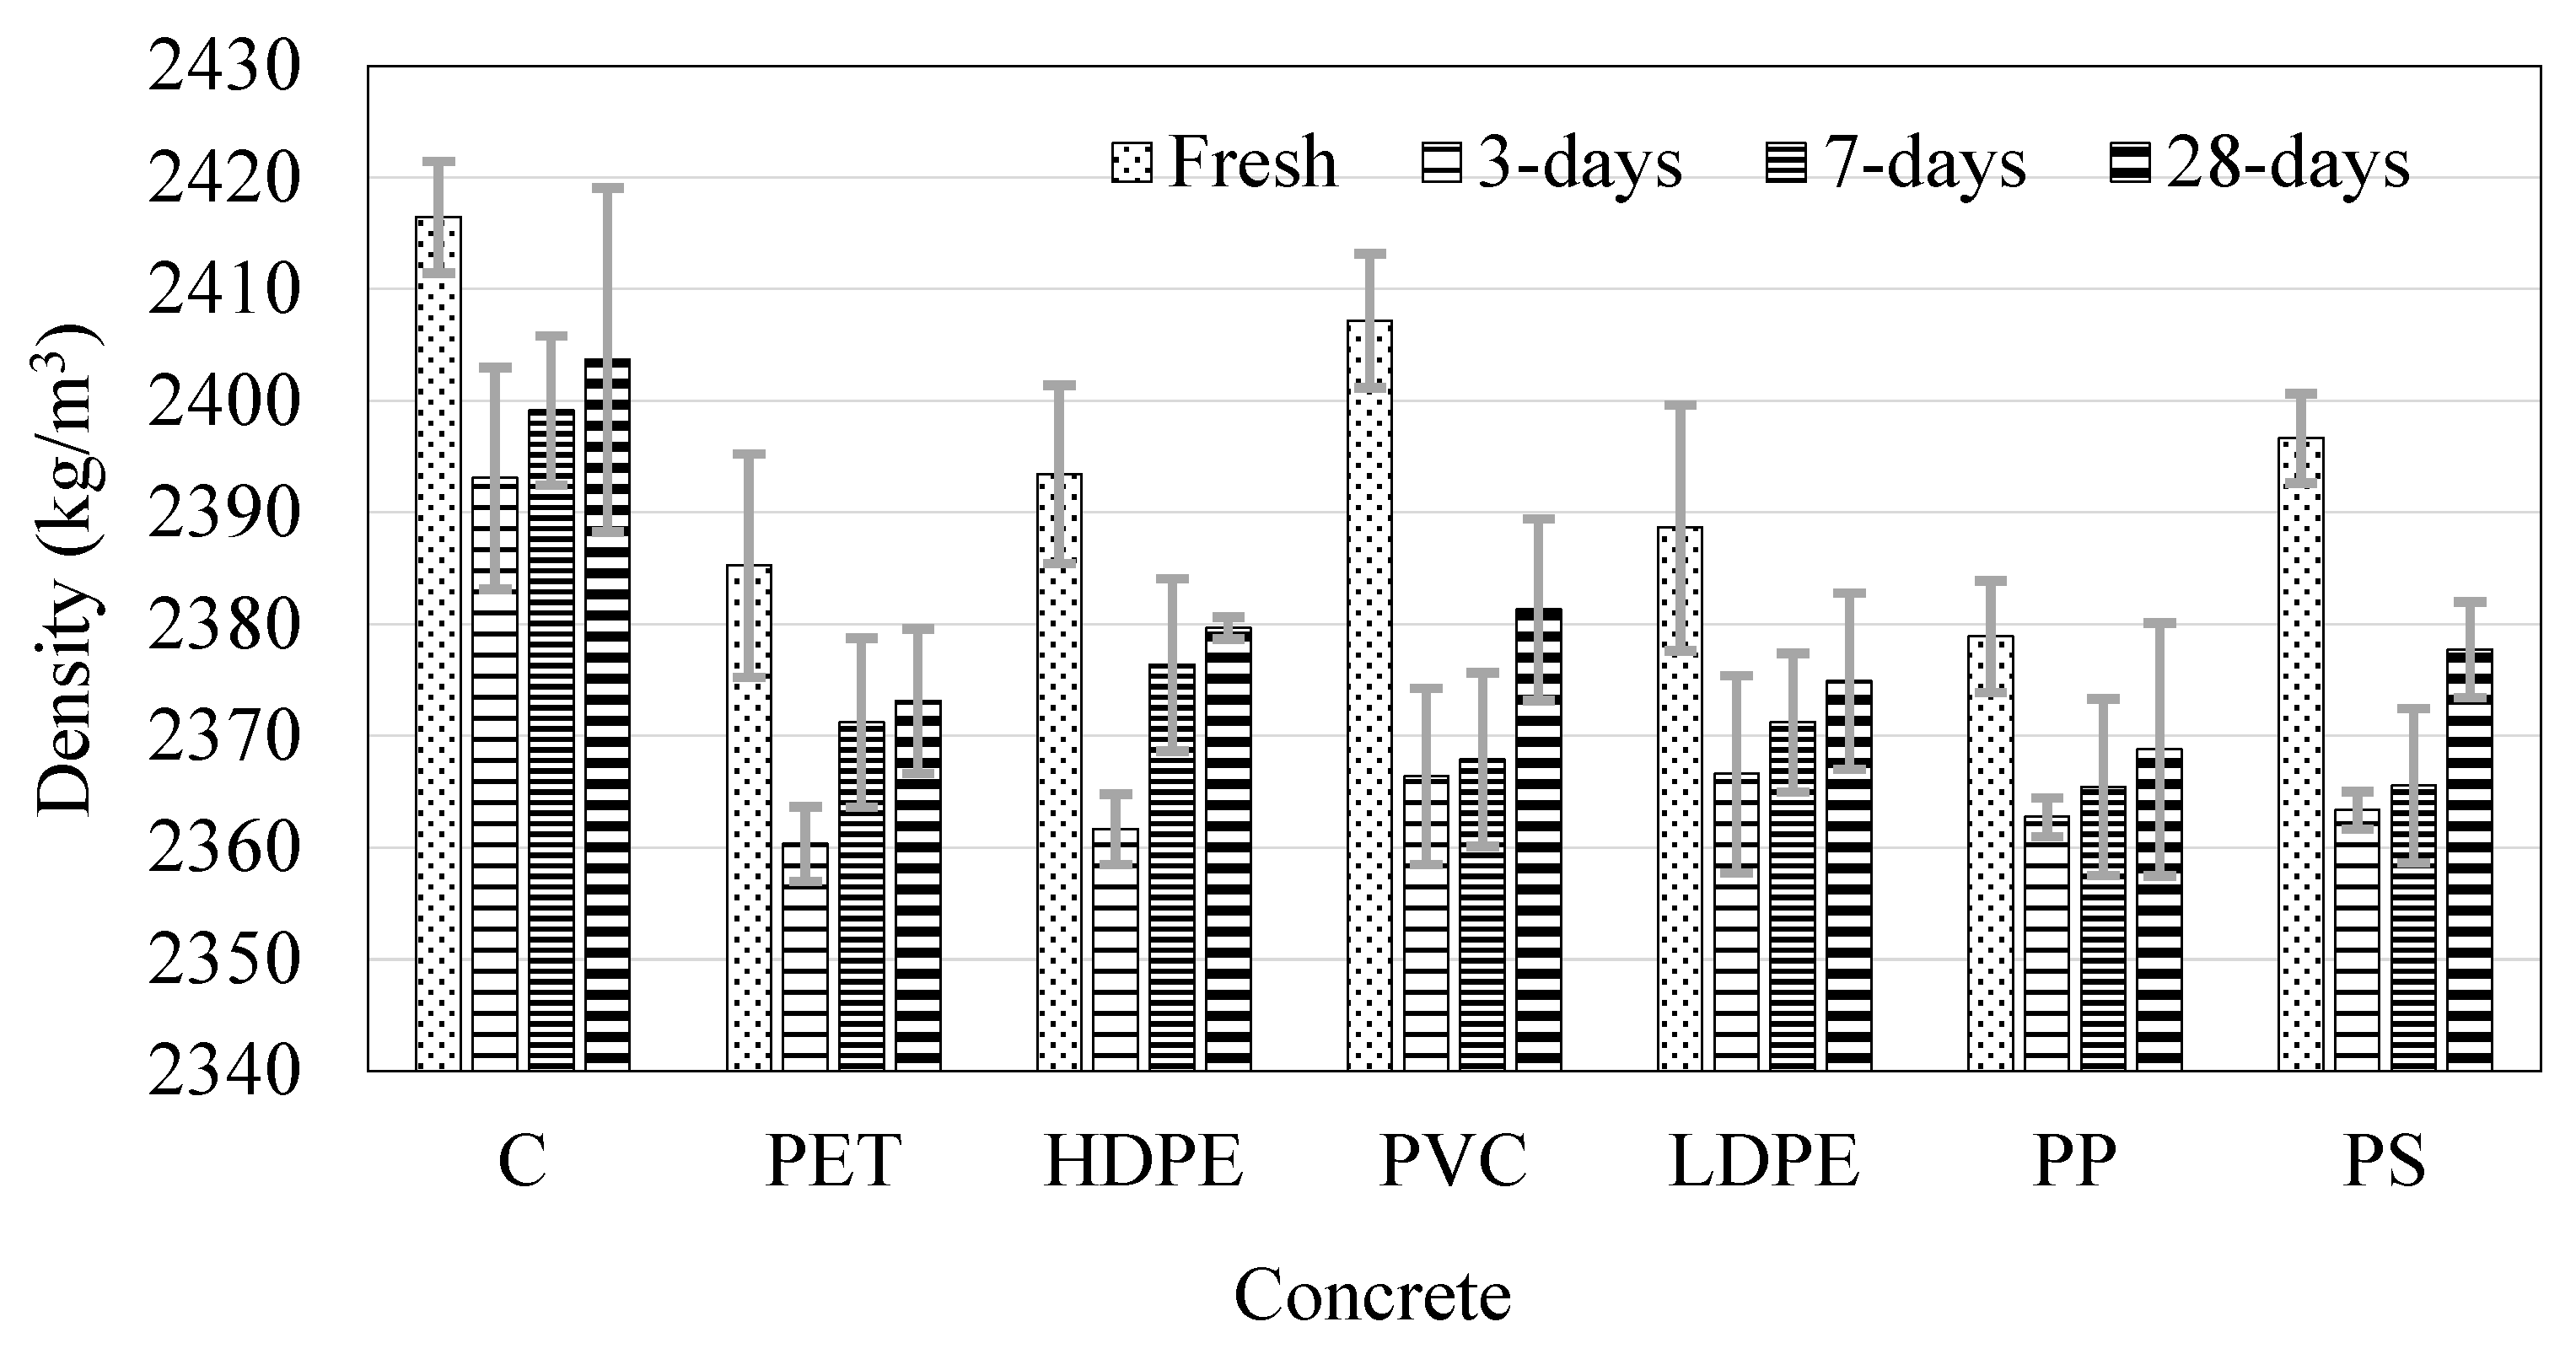
Figure 7 illustrates the fresh and dry densities of both control concrete and concrete incorporating plastic fine aggregate (PFA). A comprehensive description of the experimental procedures and concrete property evaluations is provided by Abduallah [
23]. Among various influencing factors, the density of concrete is strongly affected by the density of its aggregates [
52]. In all cases, concrete containing PFA exhibited lower density values, as the plastics used have lower specific gravities than natural fine aggregate (NFA), as shown in
Figure 7. Replacing 10% of the sand fraction with plastic resulted in a density reduction of no more than 2.0% relative to the control mix. However, a clear correlation between the specific gravities of the plastic types and the unit weights of the corresponding concrete mixes could not be established, likely due to the low replacement ratio and the resulting marginal changes in overall density.
In all concrete mixtures, the fresh densities were consistently higher than the corresponding dry densities. Over time, dry densities increased, likely due to continued hydration and the retention of additional moisture within the hydration products. At 28 days, the concrete incorporating PVC showed the smallest reduction in density compared to the control mixture, only 0.9%, with a value of 2381 kg/m
3. In contrast, the concrete containing PP exhibited the largest reduction, at 1.5% (2369 kg/m
3) relative to the control. These findings are consistent with those reported by Rahmani et al. [
11] and Yang et al. [
53]. Overall, concrete mixes with 10% PFA as a replacement for natural fine aggregate (NFA) maintain densities within the range of normal-weight concrete (2240 to 2400 kg/m
3), as defined by ACI 211 [
33] and ACI 318 [
54].
4.4. Compressive Strength
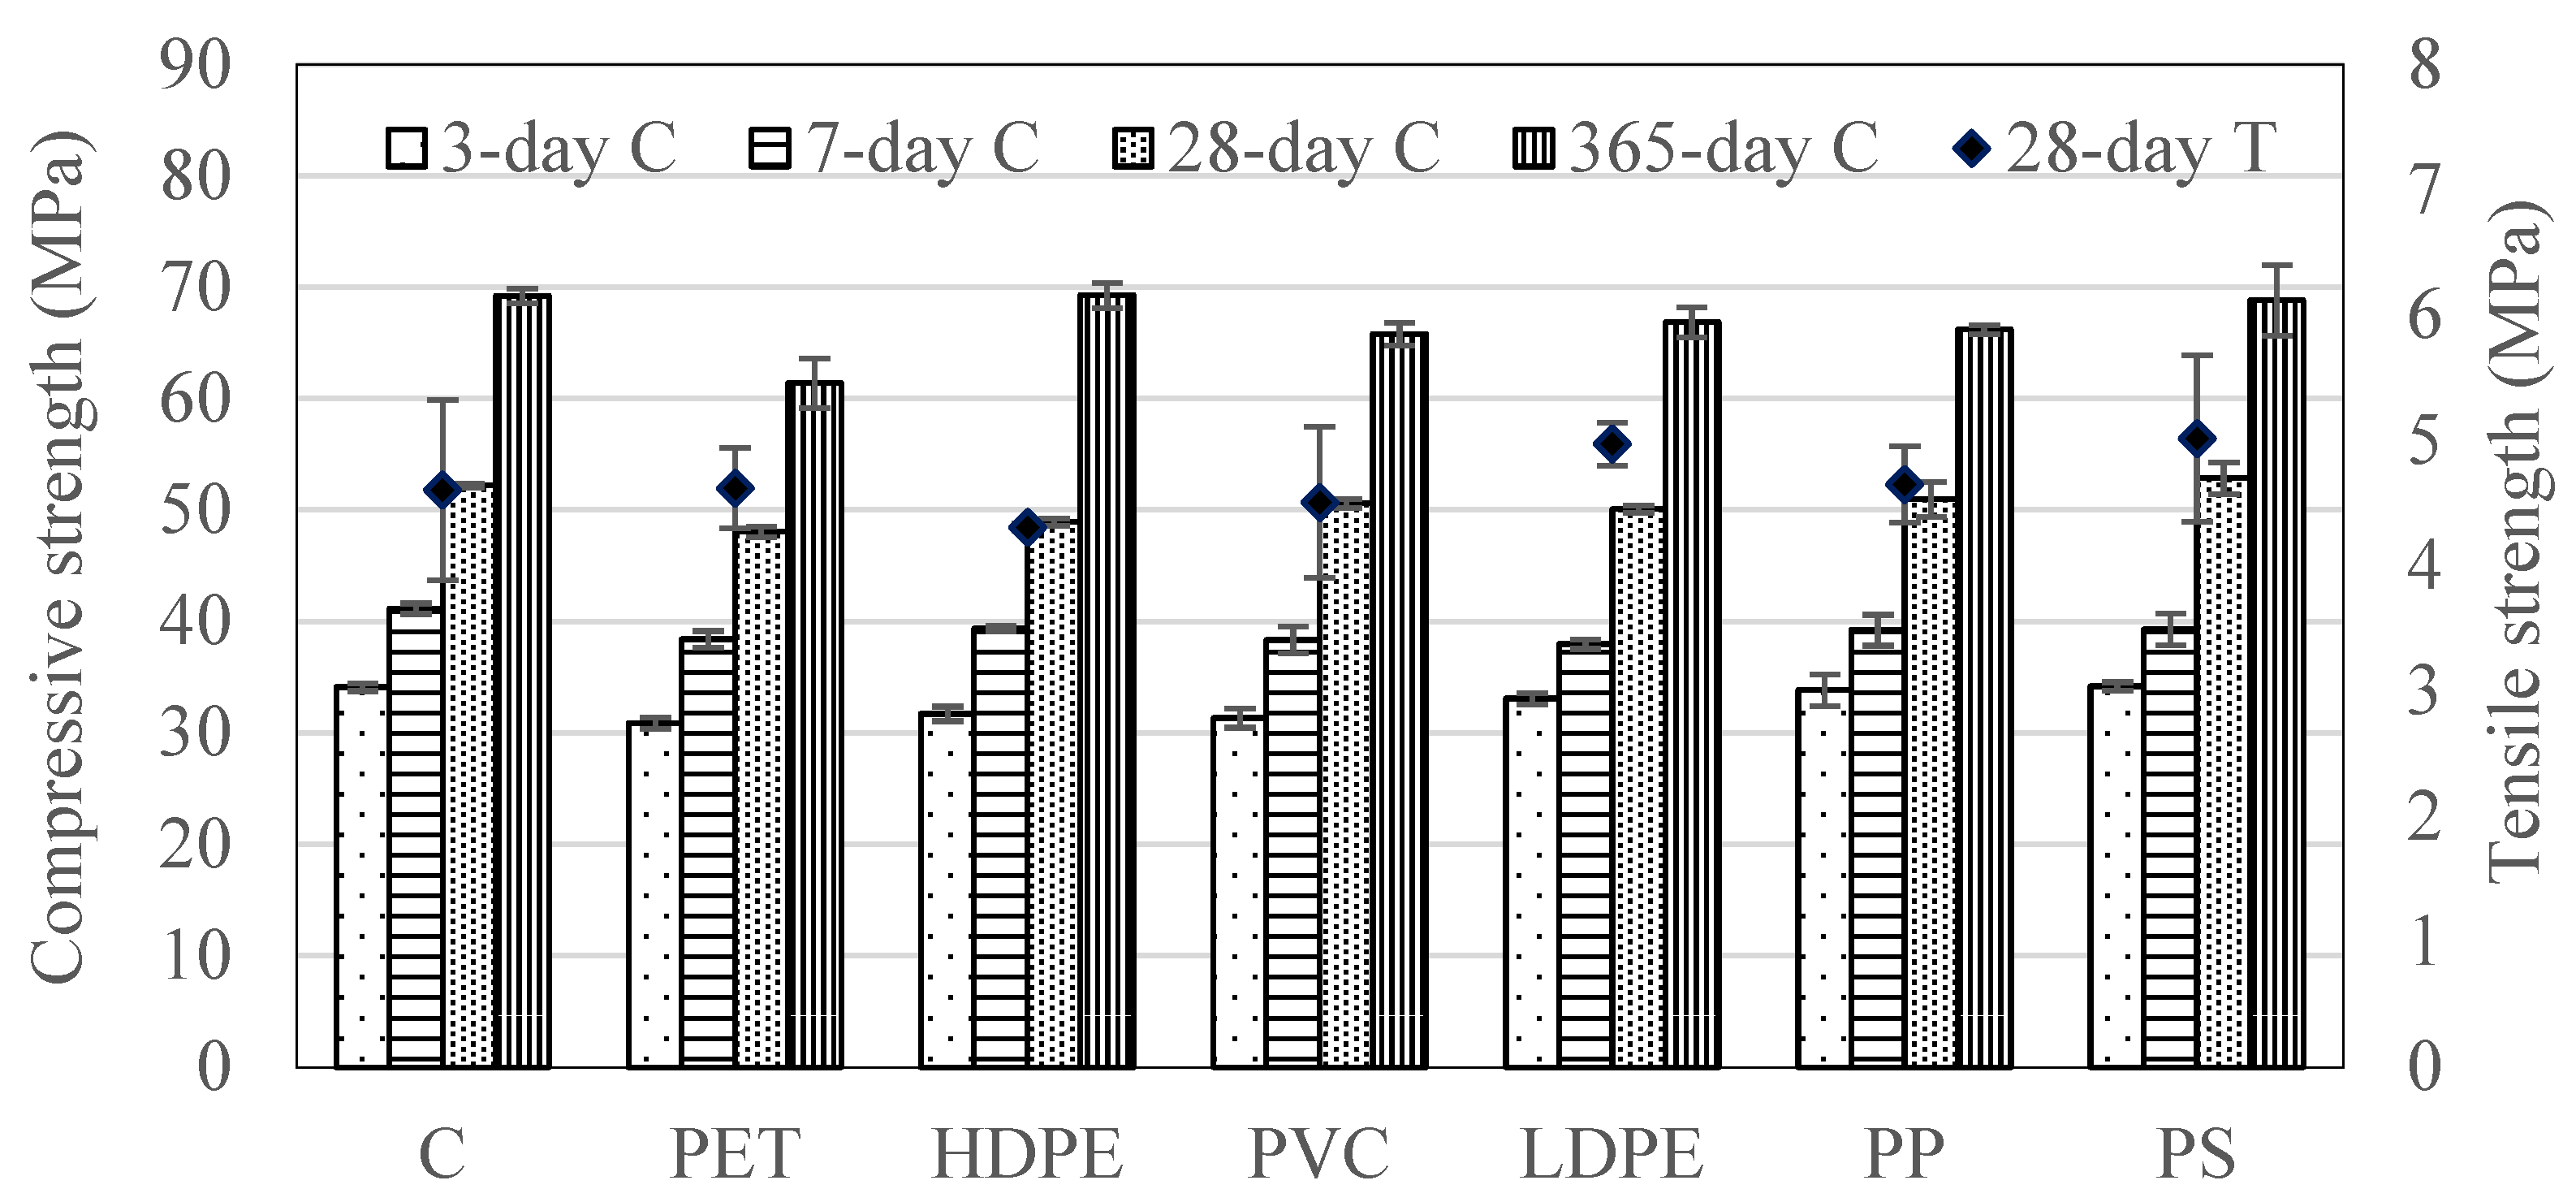
The variation in compressive strength for concrete mixtures incorporating 10% plastic fine aggregates (PFAs) as a replacement for natural fine aggregate (NFA) (i.e., three concrete cylinders measuring 101.6 mm in diameter and 203.2 mm in height at ages of 3, 7, 28, and 365 days) is presented in
Figure 8. A comprehensive account of the experimental procedures and compressive strength measurements is available in Abduallah [
23]. Most concrete mixes containing plastics exhibited slightly reduced compressive strengths compared to the control concrete. This trend supports the findings of Vandhiuan et al. [
55], who observed a positive correlation between aggregate density and concrete strength, indicating that heavier fine aggregates tend to produce stronger concrete. Accordingly, the use of lightweight materials such as plastics is likely to contribute to reduced strength.
However, compressive strength is influenced by several factors beyond aggregate density. These include the intrinsic strength of the plastic particles, their packing efficiency, the quality of the interfacial bond between the plastic and cement paste, and the interaction between plastic particles and water. These variables lead to differences in strength across plastic types, which are not solely attributable to their apparent densities.
At various curing ages, PET-modified concrete exhibited the most significant reduction in compressive strength, with decreases ranging from 7% to 11.3% relative to the control, and more pronounced losses were observed at later stages. At 28 days, in comparison with the compressive strength of the control mix (52.2 MPa), concrete mixes containing HDPE, PVC, and LDPE showed strength reductions of 6.3% (48.9 MPa), 3.1% (50.6 MPa), and 4.1% (50.1 MPa), respectively, as illustrated in
Figure 8. In contrast, the compressive strengths of PP and PS modified concrete remained within the experimental margin of error when compared to the control mixture.
After 365 days, the compressive strengths of HDPE, LDPE, PP, and PS concrete were not significantly different from that of the control concrete. Hypothetically, if a 28-day concrete mix were made using a combined stream of all six plastic types, representative of a typical single-stream recycling source, the average reduction in compressive strength would be approximately 4.0%, with an estimated variability of ±4.0 MPa.
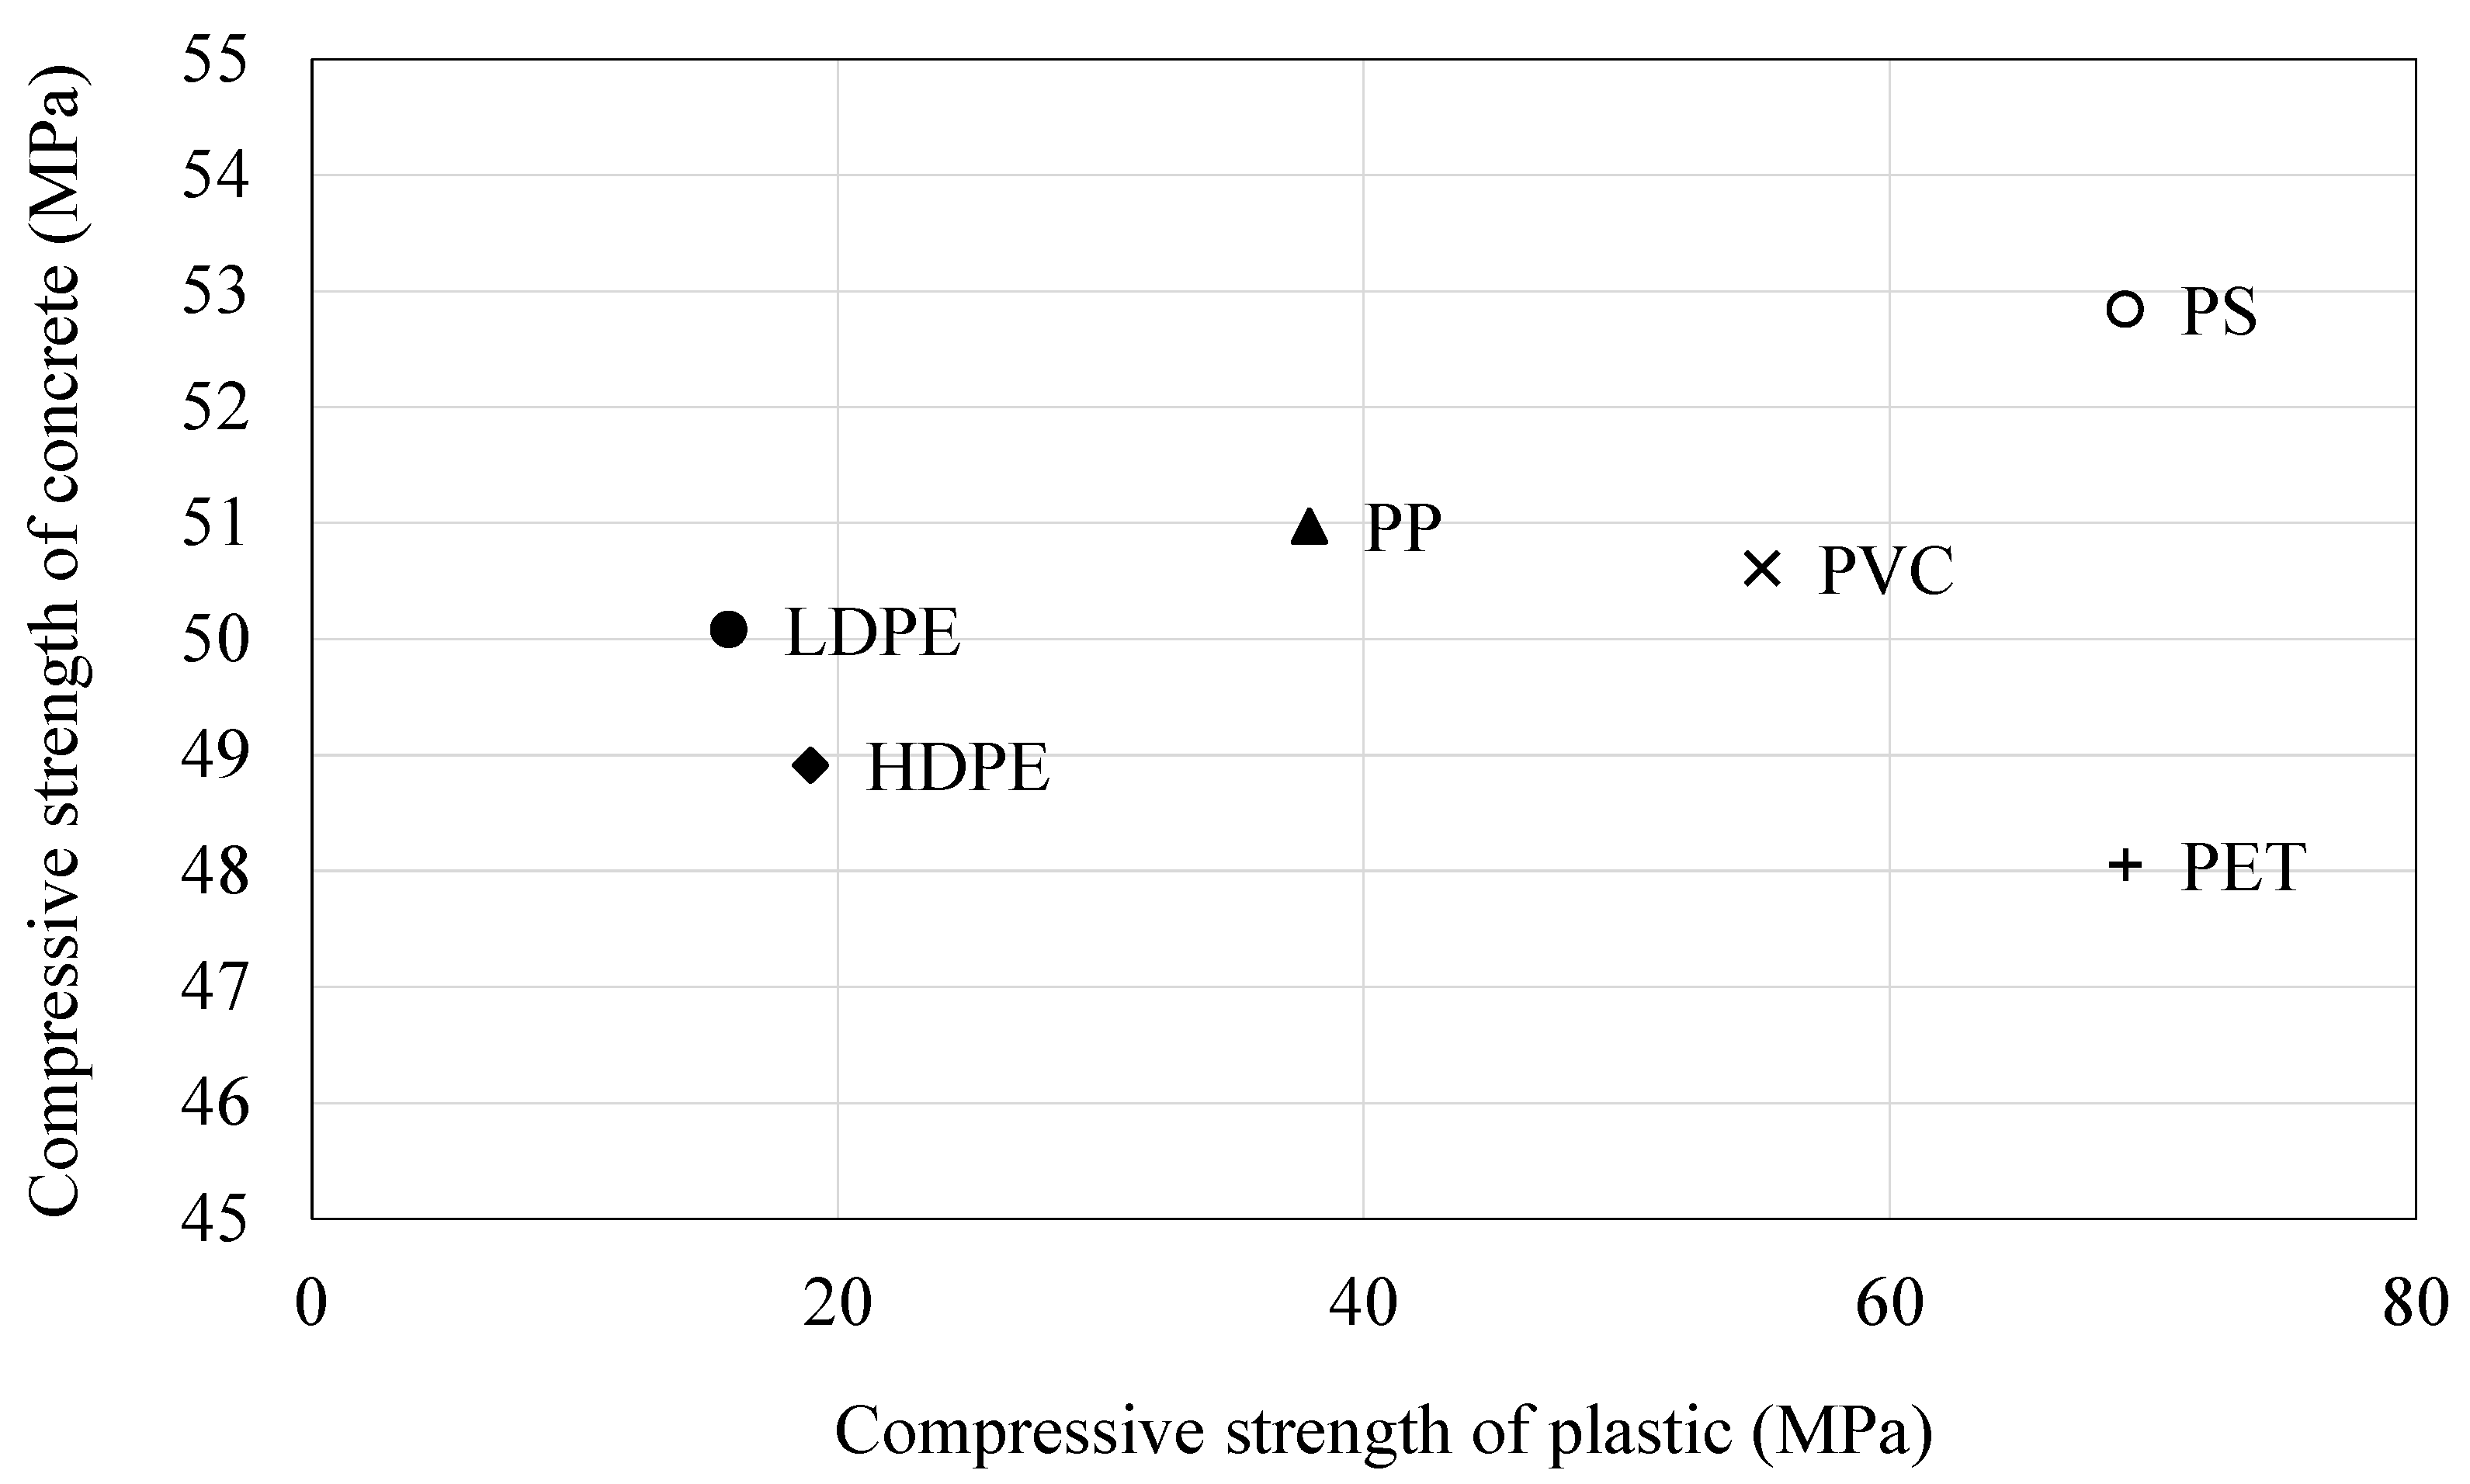
The compressive strength of most plastic-aggregate concrete types did not show a correlation with the compressive strength of the plastics used as aggregates (
Figure 9). This indicates that the relationship between the compressive strength of the plastics and that of the corresponding concrete was not direct and was significantly affected by other factors, such as particle morphology and concrete void volume.
4.5. Tensile Strength, Modulus of Elasticity, and Poisson’s Ratio
The illustration of the variation in the tensile strength of 28-day concrete incorporating 10% plastic fine aggregate (PFA) as a replacement for natural fine aggregate (NFA) (i.e., three concrete cylinders measuring 101.6 mm in diameter and 203.2 mm in height at ages of 28 days) is provided in
Figure 8. A detailed account of the experimental procedures and strength data is provided in Abduallah [
23]. Overall, the changes in tensile strength observed in plastic-modified concrete were smaller than the corresponding changes in compressive strength. The effect of replacing 10% of NFA with PFA varied depending on the type of plastic used; however, for most plastic types, the variations in tensile strength remained within the experimental error margin when compared to the control concrete. Consequently, it can be concluded that incorporating plastics at this substitution level has only a minor impact on the tensile strength of concrete.
Figure 10 shows the variation in the modulus of elasticity for concrete containing 10% plastic fine aggregate (PFA) as a replacement for natural fine aggregate (NFA). While the modulus of elasticity of concrete is primarily influenced by the stiffness of the aggregate itself [
47,
56], studies by Mehta and Monteiro [
48,
57] and Kosmatka and Wilson [
49] have also highlighted the importance of aggregate density, shape, and size, which affect the interfacial transition zone (ITZ) and overall concrete porosity.
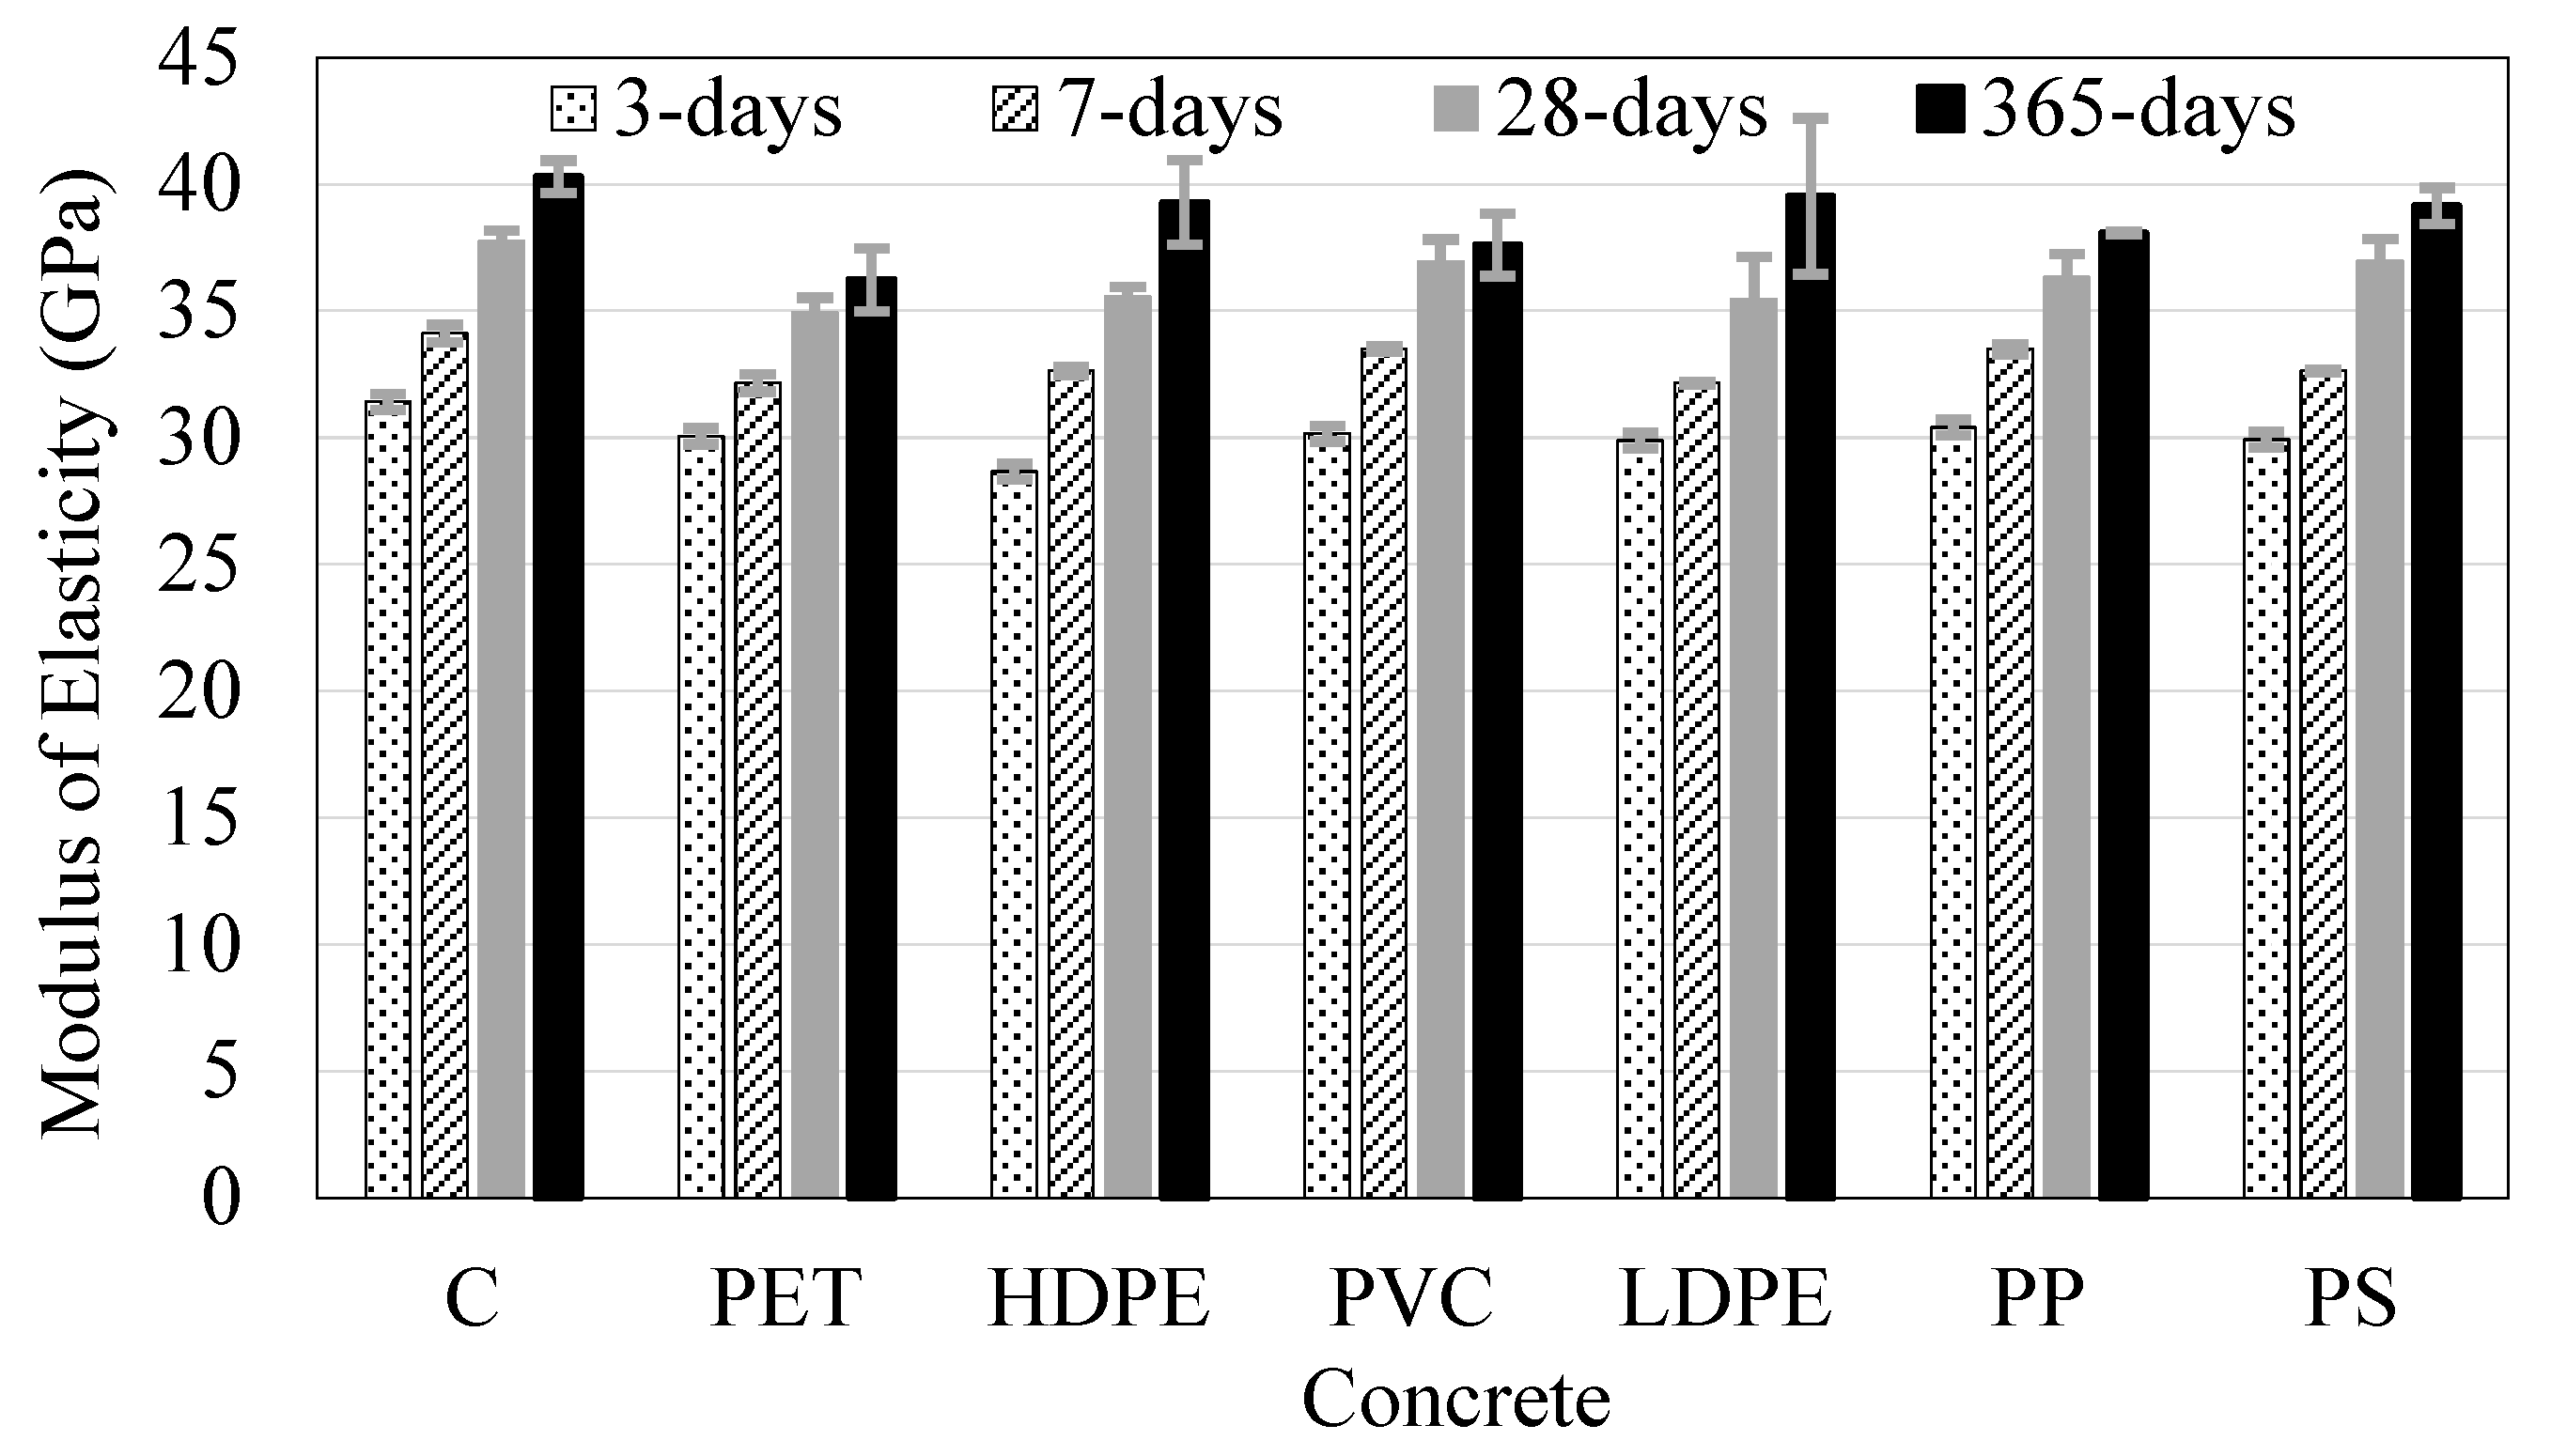
Across all mixtures, the inclusion of plastic aggregates led to a reduction in the modulus of elasticity compared to the control, regardless of the plastic type. PET-modified concrete exhibited the lowest modulus values at both 28 and 365 days, 35.0 GPa and 36.2 GPa, respectively. This reduction may be attributed to the higher porosity of PET concrete, resulting from its greater workability and elevated air content (
Figure 10). The smooth surface of PET particles may also weaken the bond with the cement matrix, increasing the potential for micro-cracking under lower stress levels. Other plastic-based concrete mixes, such as those containing HDPE, LDPE, and PS, showed slightly higher moduli than PET concrete and were not significantly different from the control mix at either age (
Figure 10).
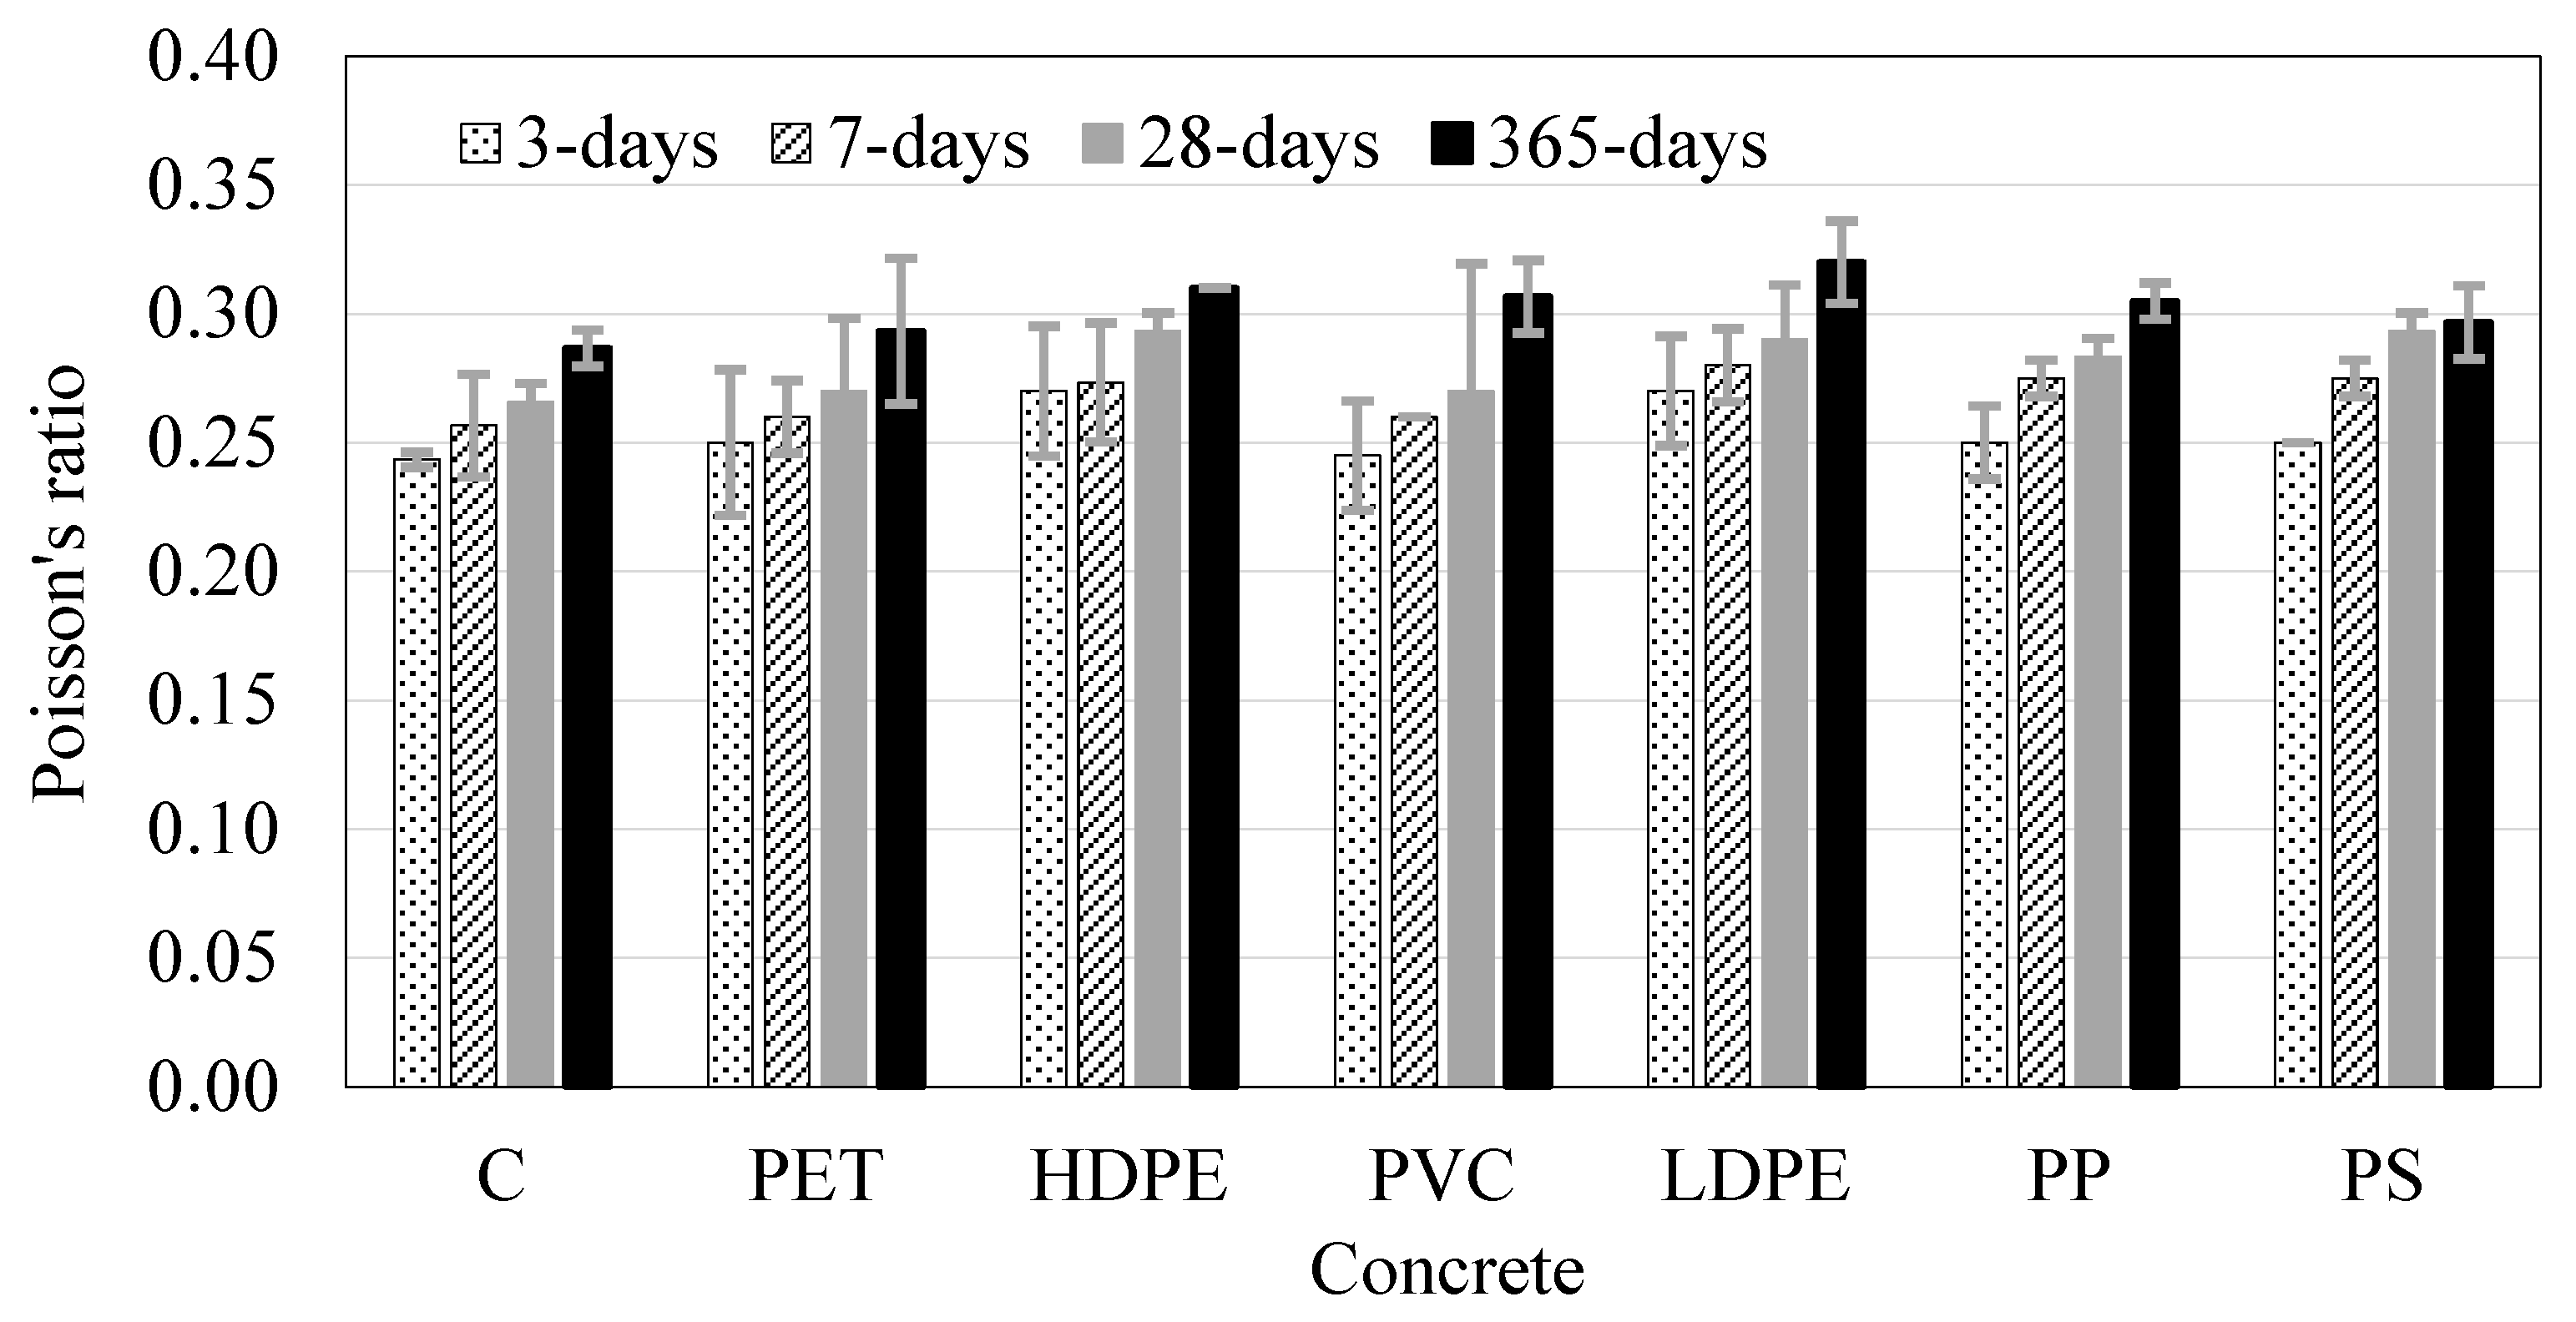
The ratio between lateral and longitudinal strains, Poisson’s ratio, for concrete containing plastic fine aggregates (PFA) is illustrated in
Figure 11. Concrete typically exhibits a relatively low Poisson’s ratio compared to materials like plastics. Incorporating plastics as fine aggregate in concrete resulted in an increased Poisson’s ratio, which can be attributed to the inherently higher Poisson’s ratios of plastic, as mentioned in Materials.
At early ages (3 and 7 days), changes in Poisson’s ratio for plastic-modified concrete remained within the experimental error range when compared to the control mix. By 28 days, concrete made with PET, HDPE, PVC, and LDPE also showed no statistically significant differences from the control. However, after one year, most plastic-modified concrete exhibited higher Poisson’s ratios than the control concrete. This long-term increase suggests that plastic-aggregate concrete may exhibit greater elastic deformation capacity, which could help mitigate cracking, one of the most common durability issues in concrete infrastructure.
The reductions in elastic modulus observed for the plastic-modified concretes lead to modest changes in serviceability performance under ACI 318 [
54]. Because deflection is approximately inversely related to stiffness, a 5–10% decrease in modulus results in an estimated 8–15% increase in immediate deflections, with long-term deflections rising by roughly 10–20% once creep is considered. Crack widths are also expected to increase slightly (around 5–10%) due to higher tensile strains. These effects are manageable and do not threaten structural safety, but they indicate that serviceability, not strength, is the primary design consideration when using concrete containing plastic particles.
4.6. Flexure Response of Reinforced Concrete Beams
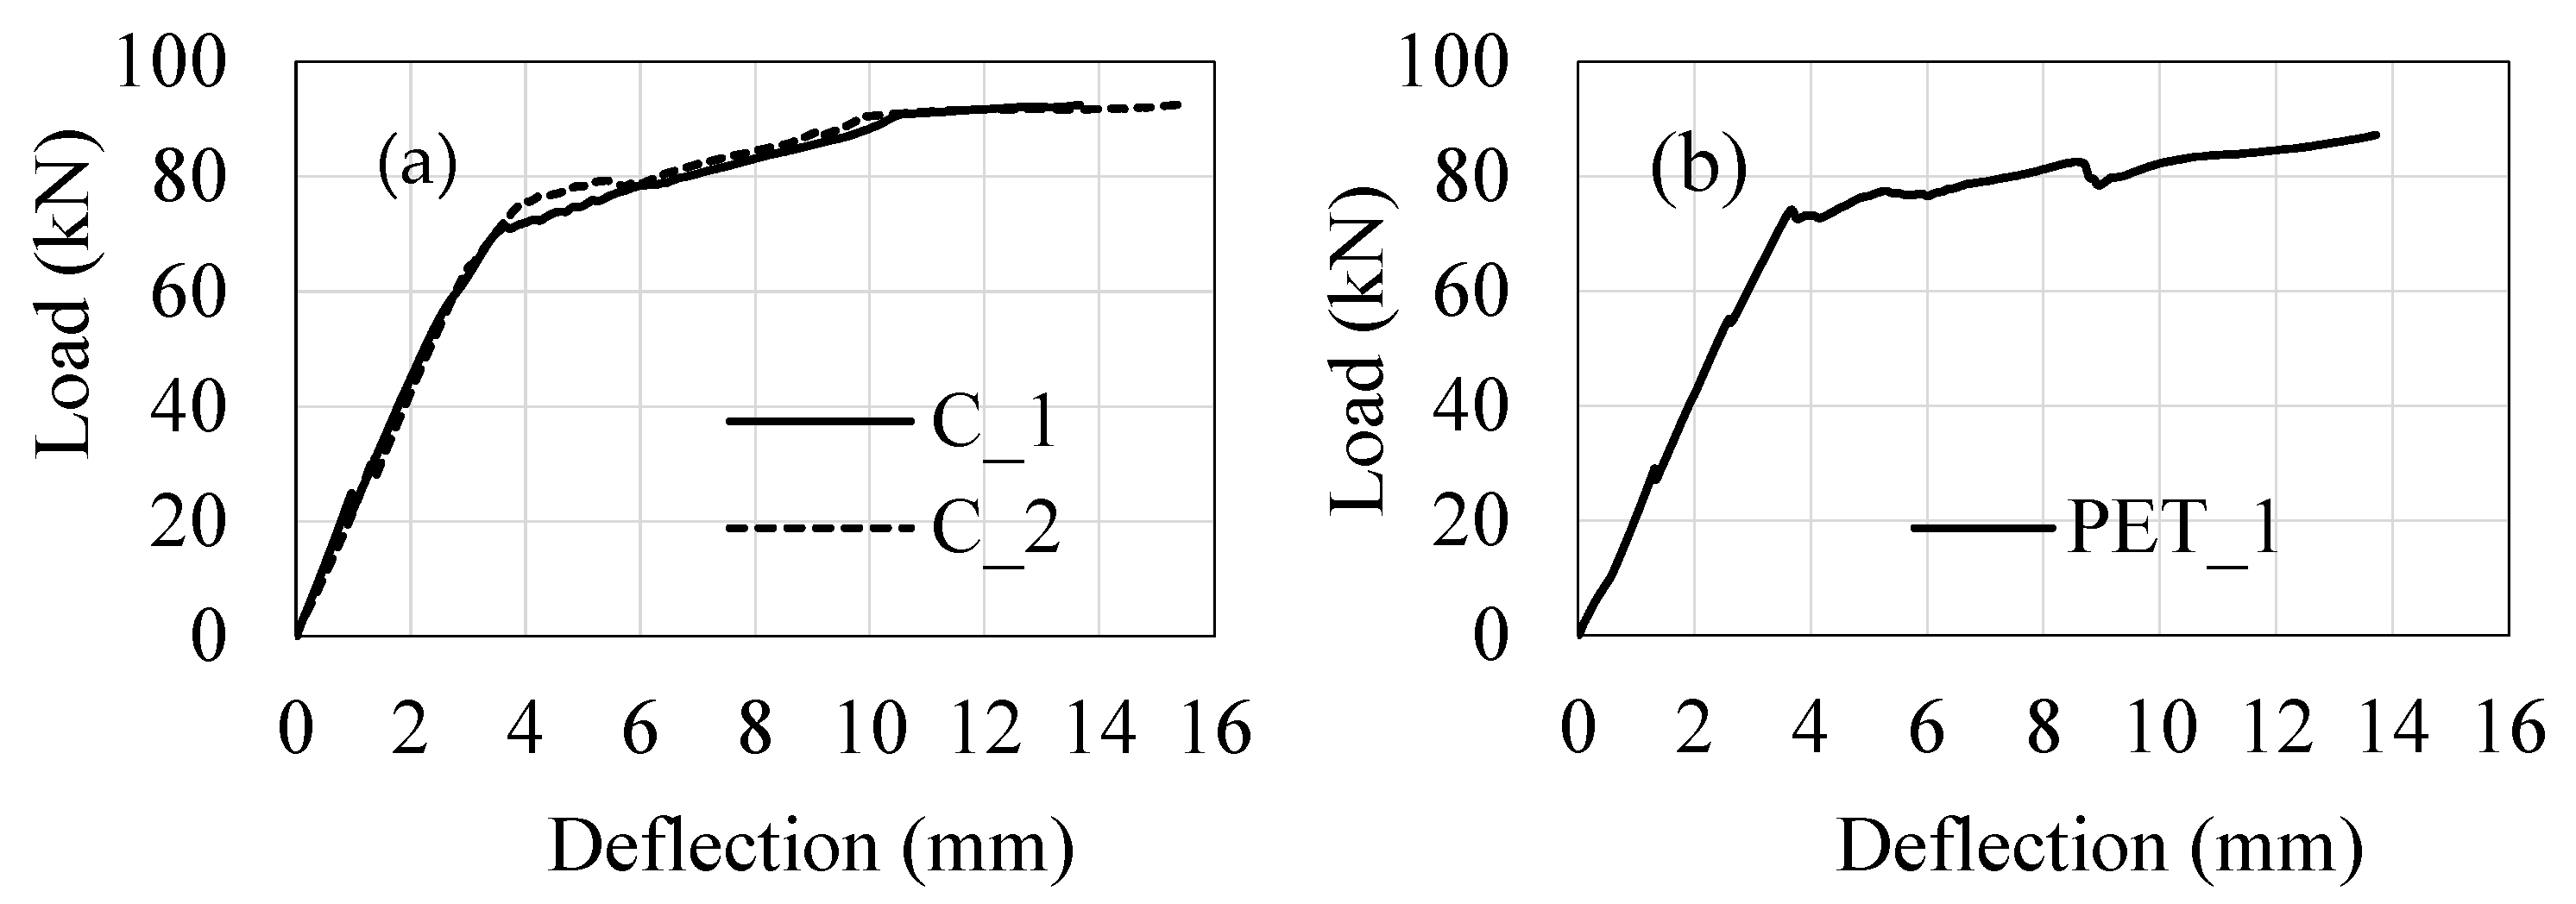
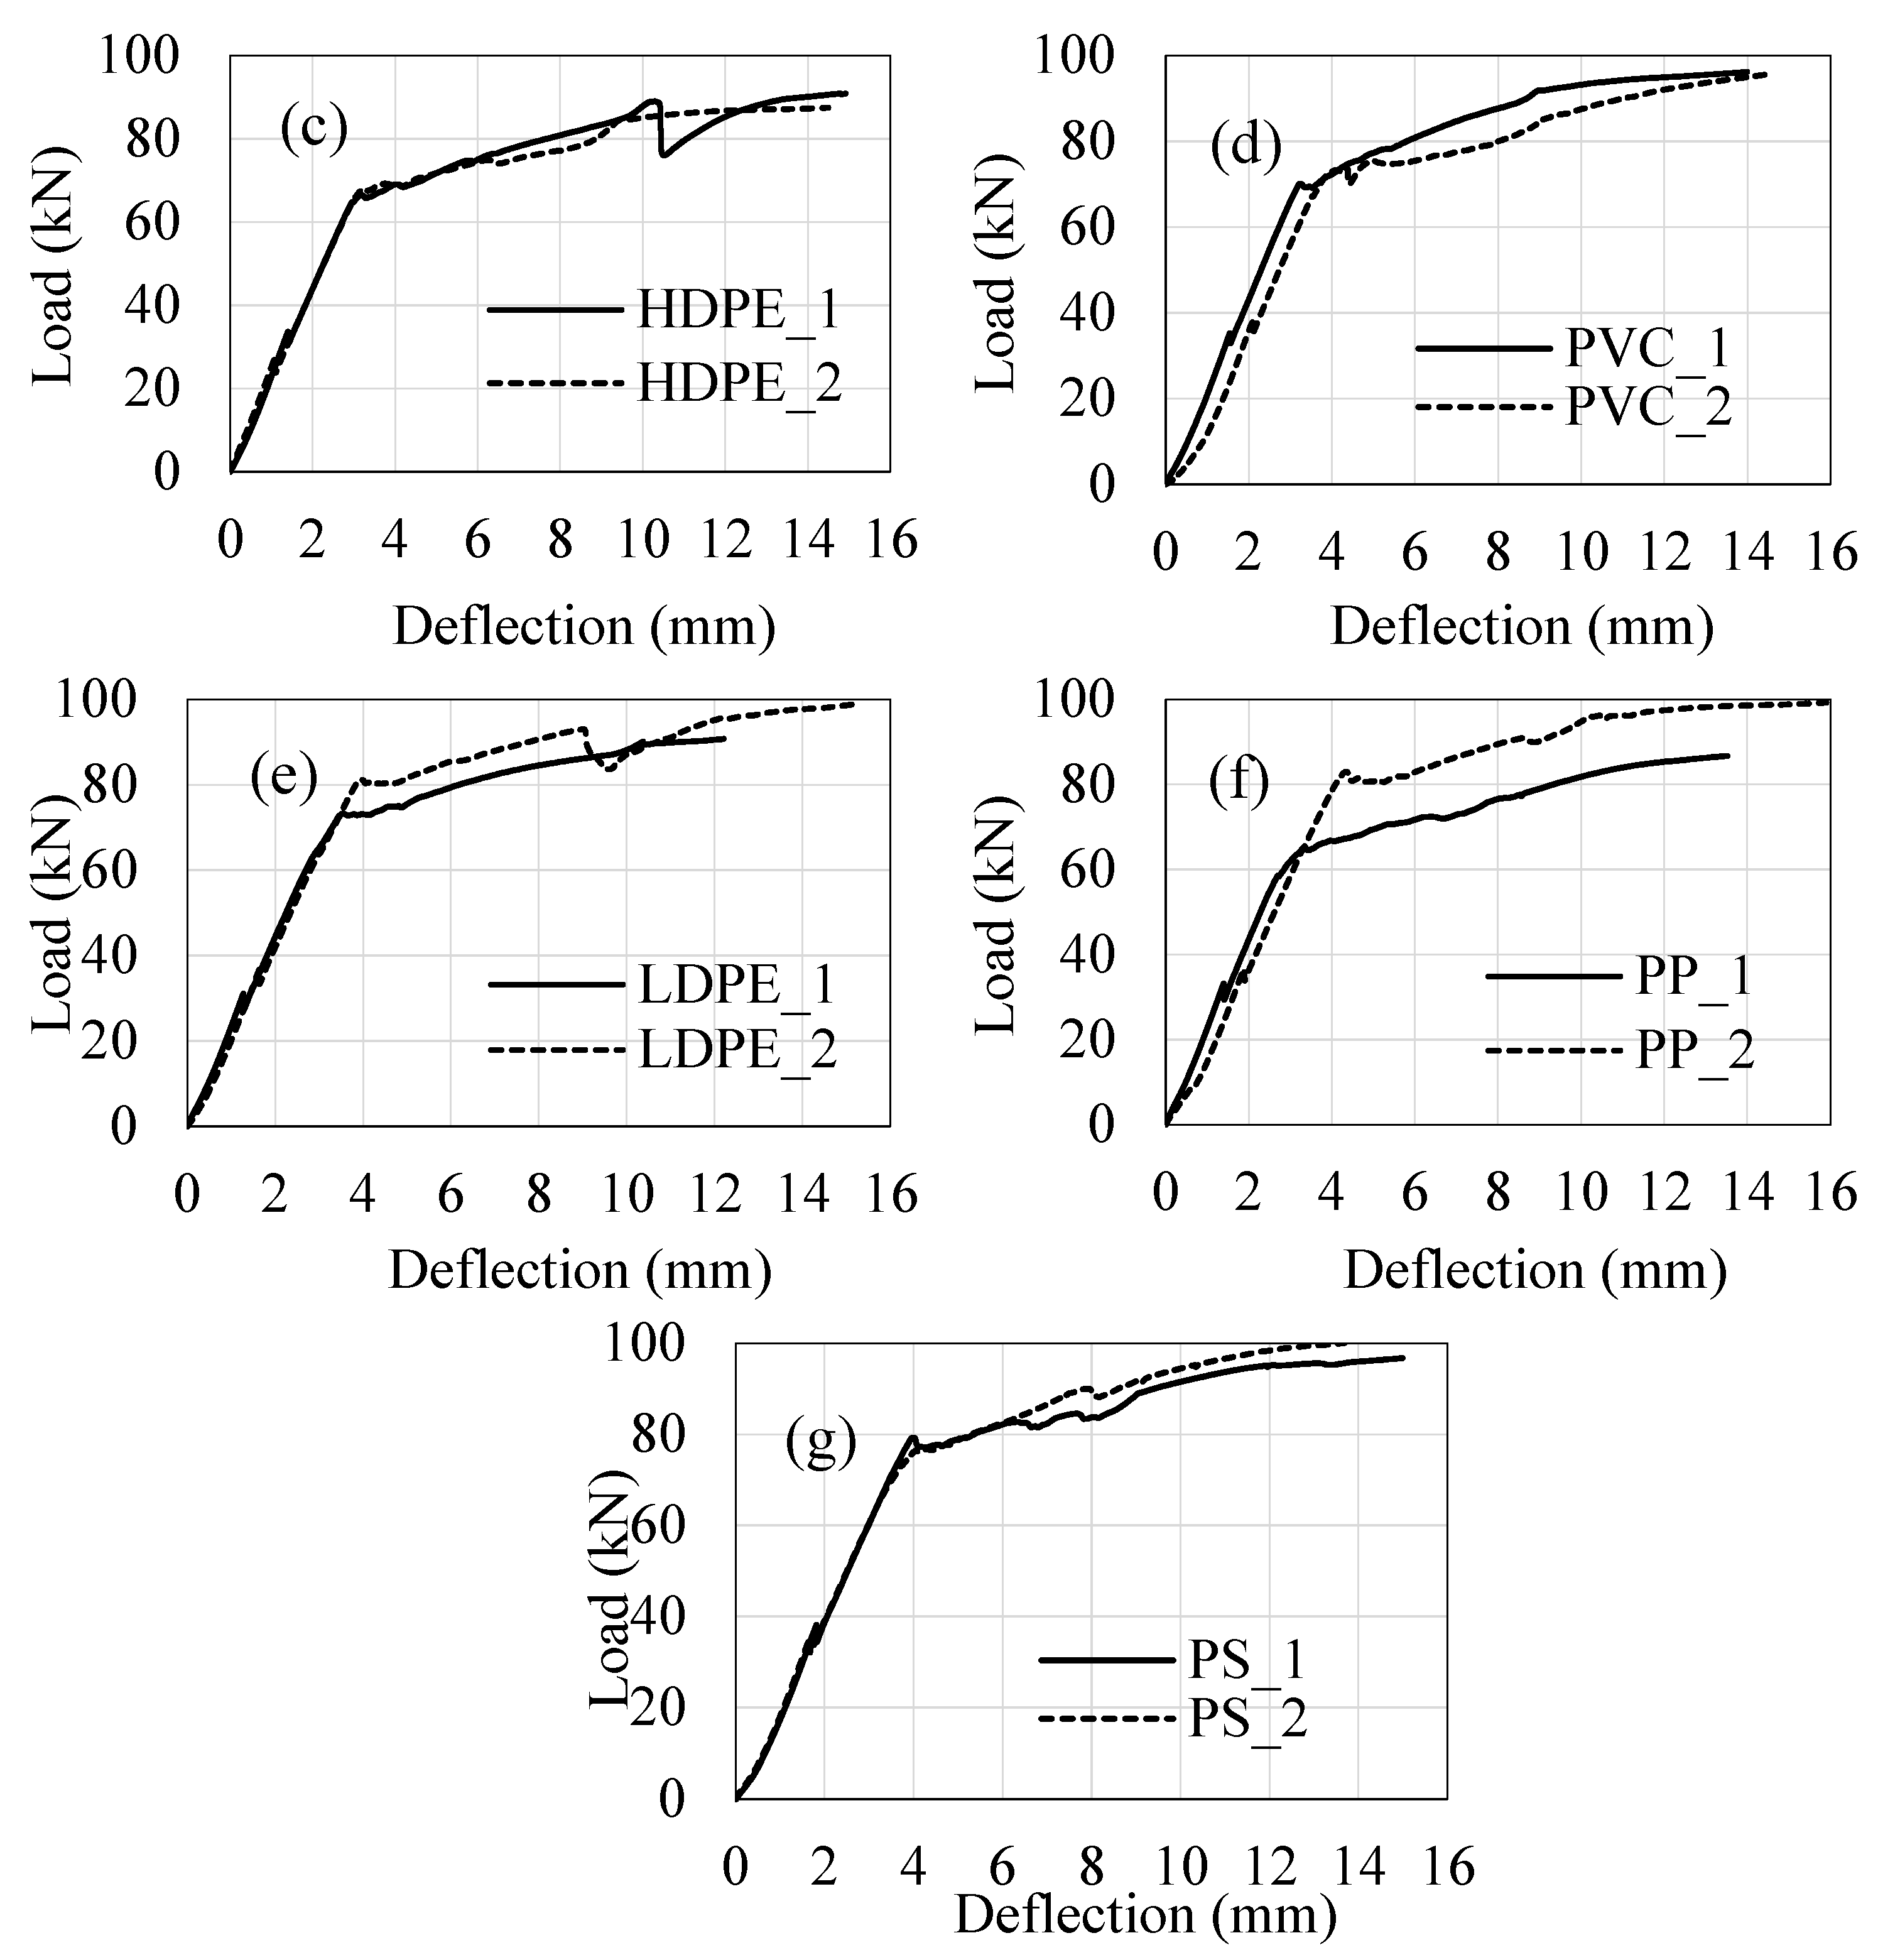
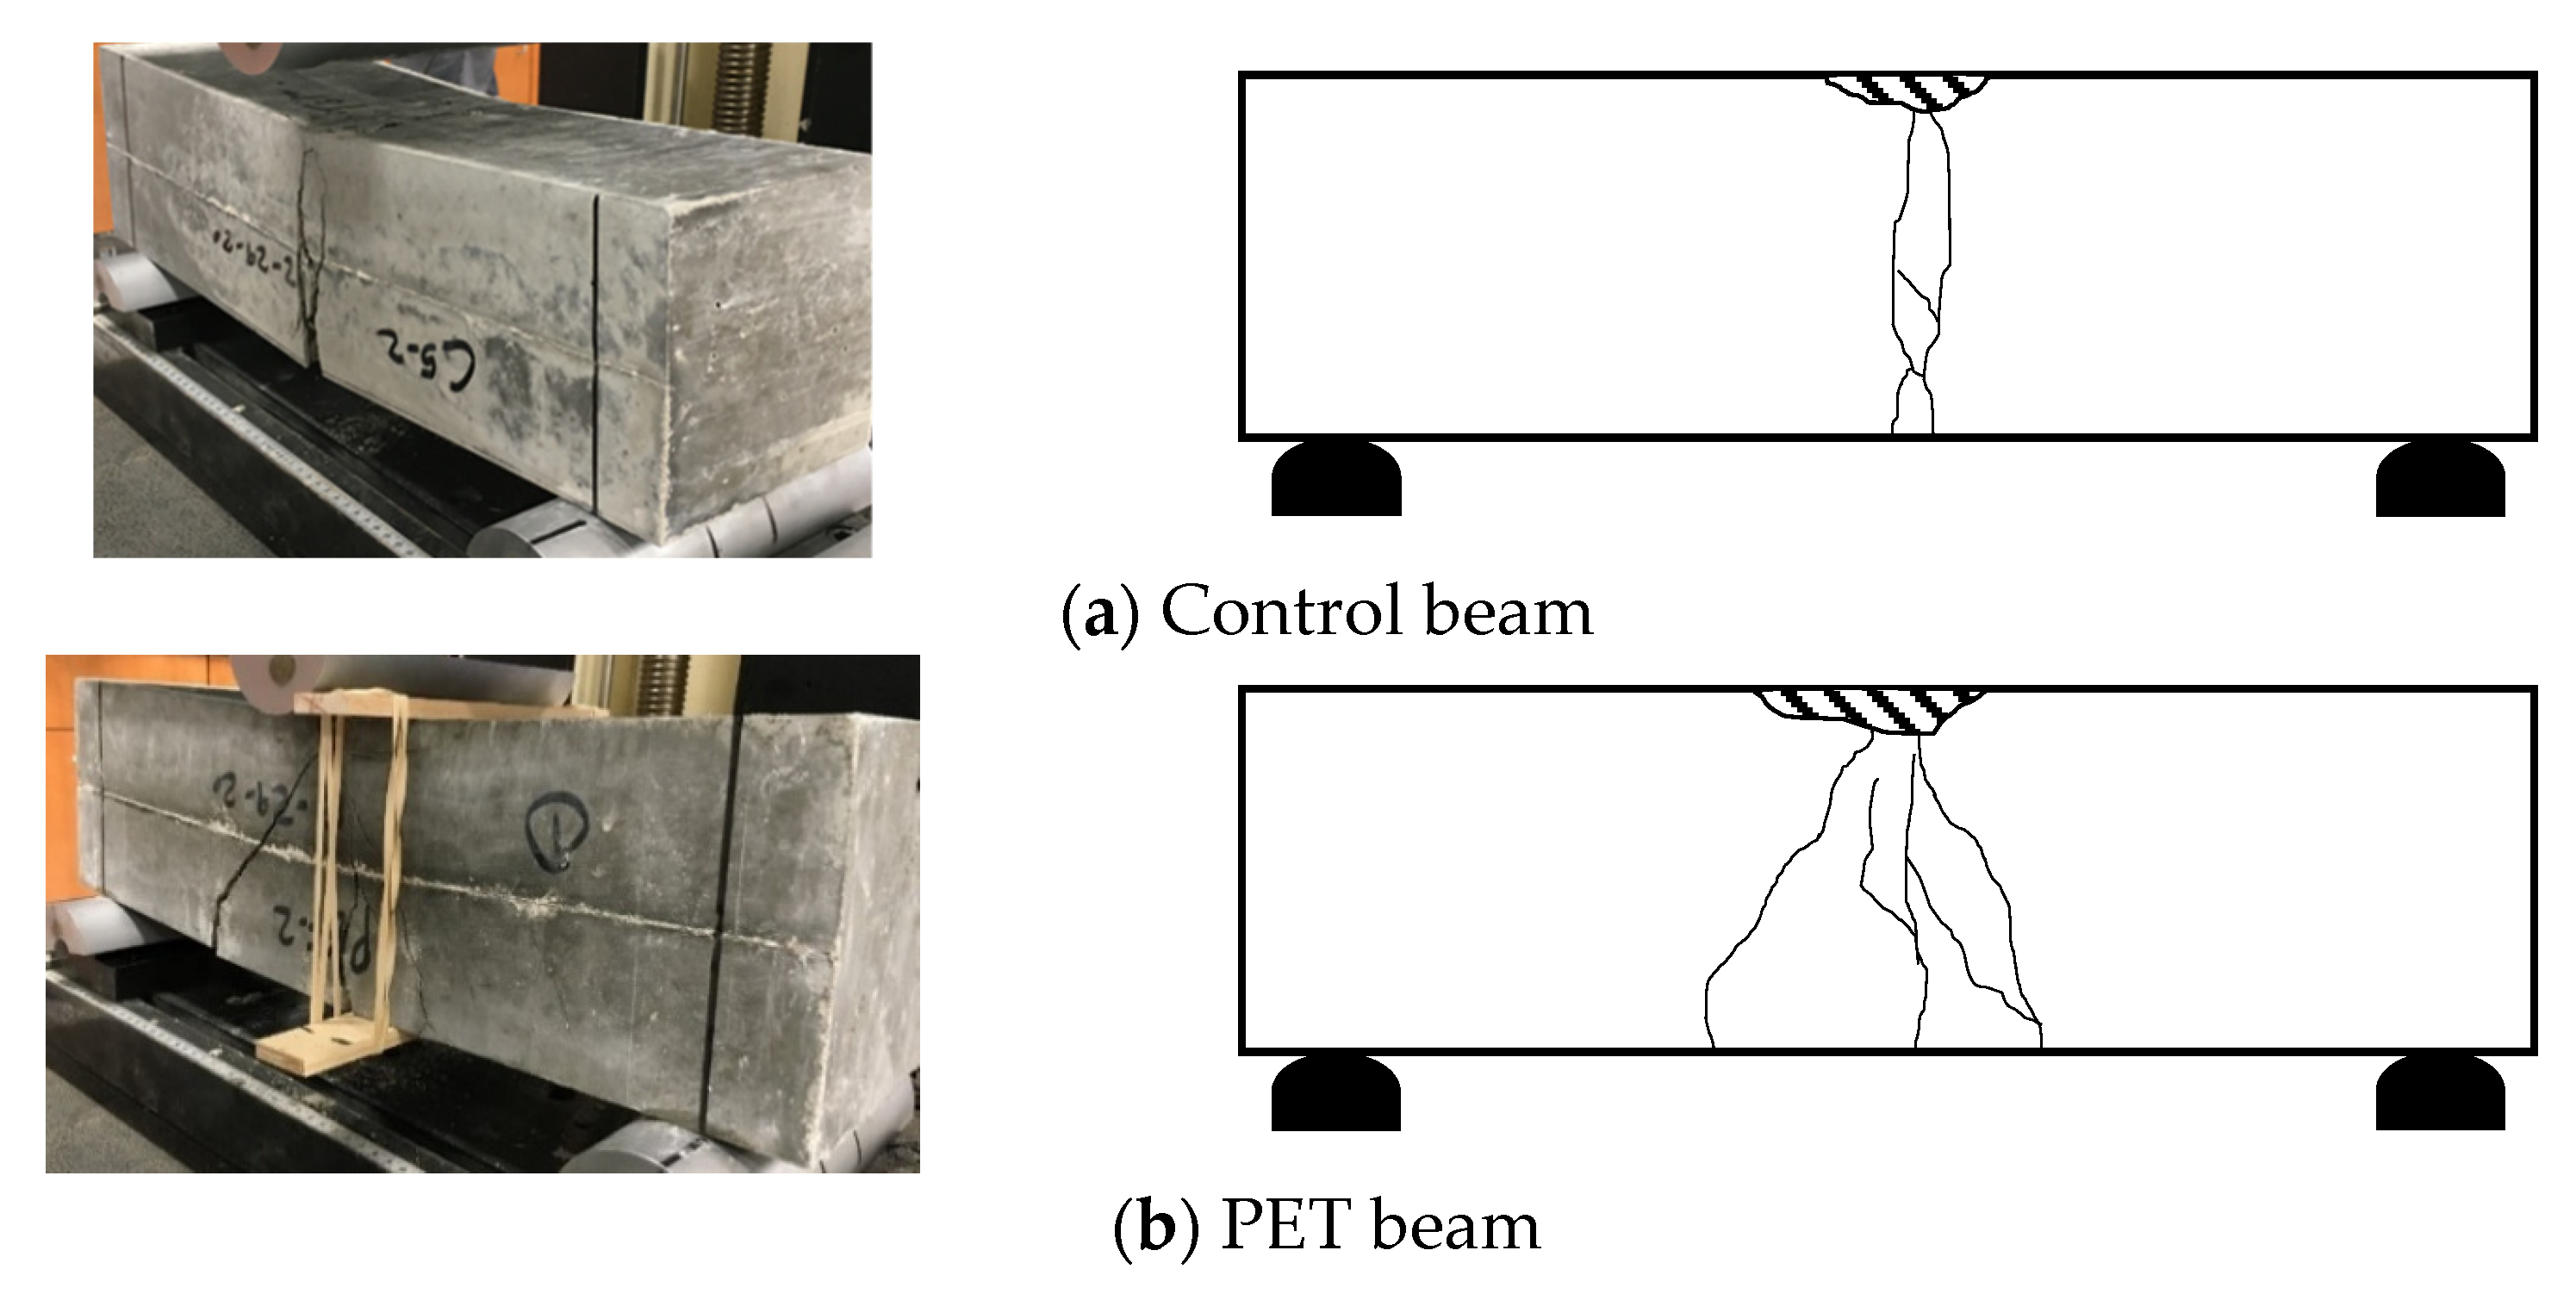
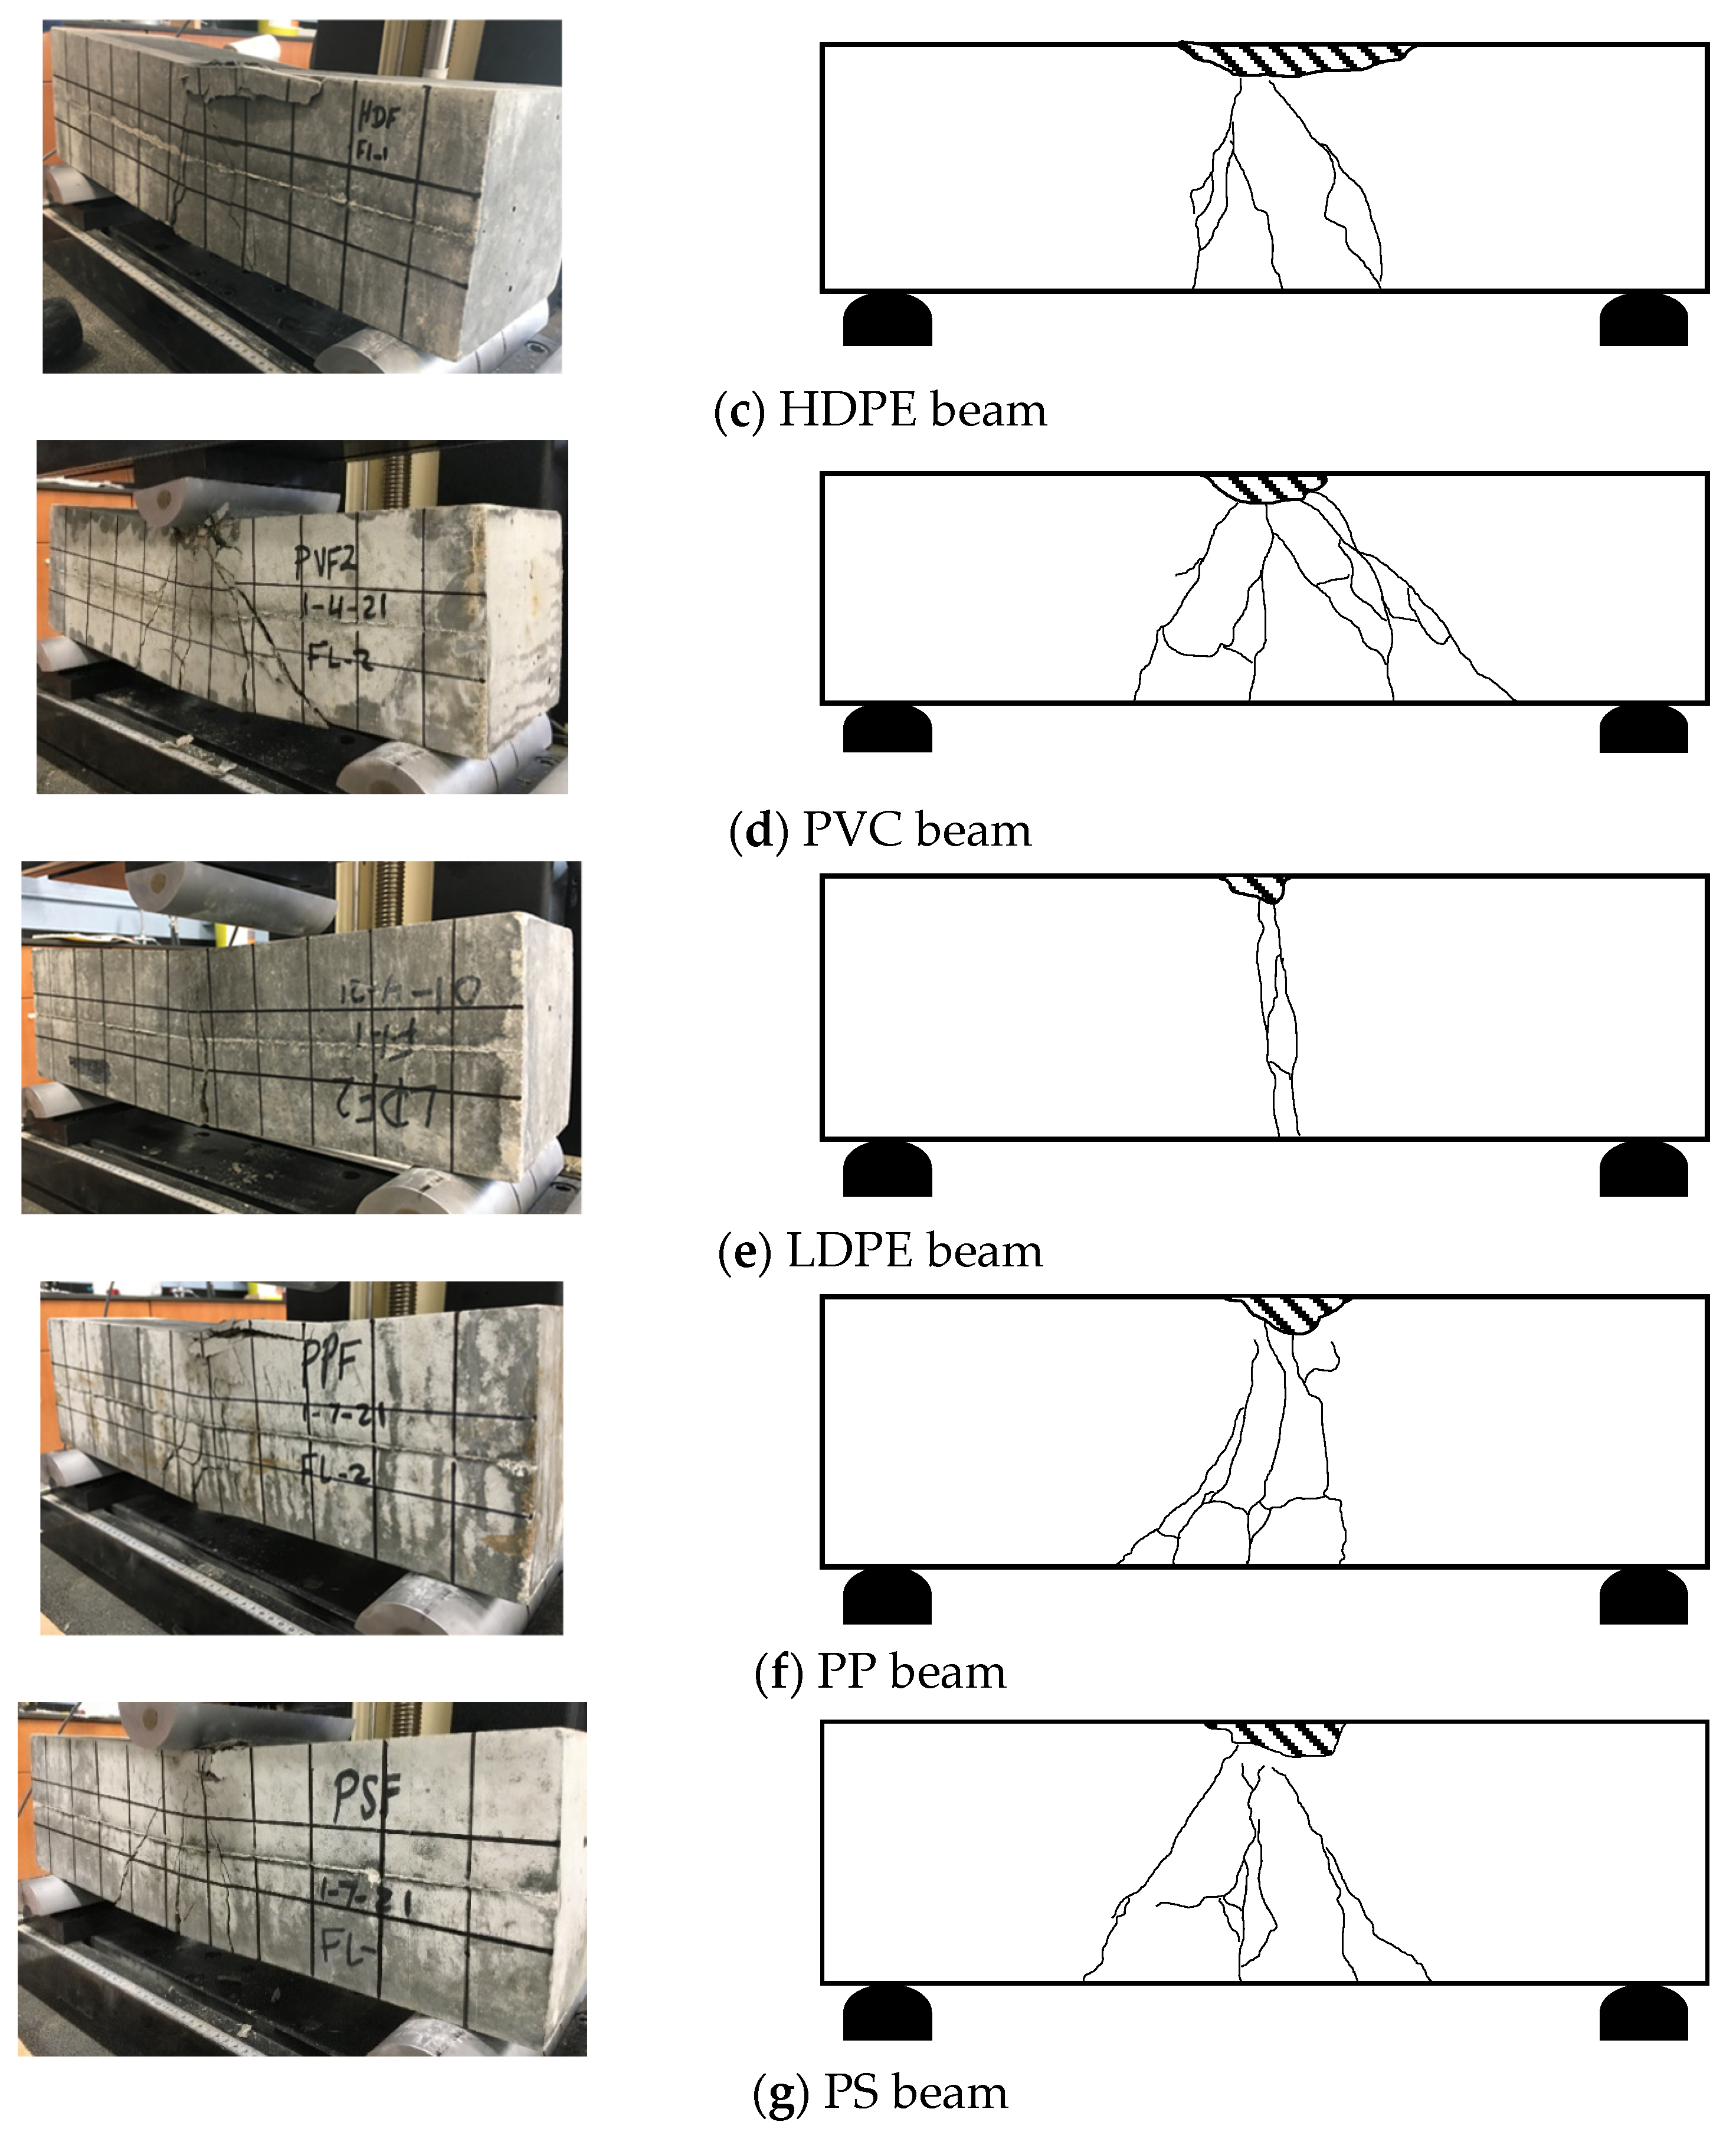
Figure 12 exhibits crack patterns and their schematic illustrations of all successfully tested beams (i.e., two RC beams measuring 152 × 152 × 532 mm at the age of 28 days). One beam of the PET mix was excluded due to a testing issue. The load–deflection behavior of the reinforced concrete (RC) beams is shown in
Figure 13, with detailed experimental procedures and data provided by Abduallah [
23]. All beams initially exhibited linear elastic behavior, characterized by a steep load–deflection slope (flexural stiffness) up to the formation of the first crack at the bottom face. As loading increased, stiffness gradually decreased due to crack propagation, which continued upward until yielding of the tension reinforcement occurred.
Following steel yielding, strain hardening led to a renewed increase in stiffness, indicating enhanced load-carrying capacity. Testing was terminated when concrete crushing occurred in the compressive zone near the top face at midspan, i.e., the ultimate state was reached. More details on how these flexural properties were determined are provided in Abduallah [
23].
Table 4 presents the results as the average values (mean) for each pair of RC beams that were constructed and successfully tested. The cracking loads of the RC beams were notably influenced by the tensile strength of the concrete. All plastic-aggregate beams exhibited higher cracking loads than the control beam (
Table 4), consistent with the higher tensile strength of plastic-modified concrete (
Figure 8). These beams also maintained significant resistance to flexural stresses beyond initial cracking.
The control beam yielded at 73.41 kN and 3.8 mm deflection (
Table 4). As shown in
Figure 13 and
Table 4, the post-cracking/pre-yielding stiffness (S2) varied depending on the plastic type, with changes ranging from 0% to 11.1% compared to the control value of 19.5 kN/mm. Beams with PP and PS aggregates showed negligible change, while HDPE-modified concrete exhibited the highest stiffness increase at 11.1% (21.6 kN/mm). These variations indicate that the plastic type influenced the flexural stiffness of RC beams during this phase.
In the post-yielding stage, as cracking intensified along the tension zone, the beams relied primarily on steel reinforcement for load resistance. After initial yielding, a slight dip in load resistance was observed, followed by a steady increase in the load–deflection slope due to strain hardening of the steel (
Figure 13). This continued until the response plateaued, characterized by increasing displacement without further load gain, culminating in concrete crushing at the compression face near midspan.
The experimental investigation demonstrated that incorporating 10% plastic fine aggregates (PFAs) into reinforced concrete (RC) beams had a measurable effect on their structural behavior, particularly in terms of cracking load, flexural stiffness, and post-yield performance. All plastic-modified RC beams exhibited higher cracking loads than the control specimen, which aligns with the observed increase in tensile strength of the plastic-based concrete. While initial stiffness was comparable across all beams, variations in post-cracking stiffness were evident and dependent on the plastic type, with HDPE- modified beams showing the greatest increase. The load–deflection response across all specimens followed a typical pattern of elastic behavior, cracking, steel yielding, strain hardening, and eventual crushing in the compression zone. Notably, the inclusion of plastics did not compromise the structural integrity of the beams and, in some cases, enhanced their performance under flexural loading. These findings suggest that plastic aggregates can be a viable partial replacement for natural fine aggregates in structural concrete, contributing to both sustainability and mechanical efficiency. However, since only a limited number of specimens, specifically two beams from each batch, were tested, conclusions regarding flexural strength based on this research are indicative rather than definitive.
The modest increases in cracking loads observed for beams with plastic-modified concrete (control = 28.4 kN; PET +2.5%, HDPE +6.7%, PVC +27.1%, LDPE +18.0%, PP +22.5%, PS +28.5%) correspond directly to proportional increases in cracking moment Mcr because Mcr scales with the concrete tensile capacity or modulus of rupture. However, the nominal flexural capacity Mn of a typical under-reinforced beam is controlled primarily by the reinforcing steel and the concrete compressive block. Therefore, small changes in concrete tensile strength or the moderate reductions in fc′ observed here are expected to change Mn only marginally (on the order of a few percent for the reinforcement ratios used in our tests). By contrast, reinforcement ratio, bar layout, and span-to-depth ratio will strongly influence whether serviceability (cracking and deflection) or strength governs the design. For members near the minimum reinforcement limit, changes in Mcr are more relevant to serviceability, whereas for heavily reinforced, short or deep members, the effect on ultimate capacity is still limited. We recommend using the measured Ec, fr, and fc′ from this study in section checks for practical designs and note that a targeted section analysis can be provided on request to quantify the effect for specific geometries and reinforcement levels.
Plastic-modified beams exhibited cracking loads, ductility, and ultimate resistance comparable to control specimens, yielding encouraging flexural results. Nevertheless, the experimental program’s scope was inherently limited. Each configuration included a small number of beams, and only one reinforcement layout, replacement level (10%), and loading configuration were examined. As such, the findings should be interpreted as evidence that, for the specific geometry and reinforcement tested, plastic inclusion did not compromise flexural behavior, rather than as a general conclusion for all structural members. Applications where safety factors are tight or where variability is critical would require additional testing across a wider range of parameters (e.g., reinforcement ratio, span-to-depth ratio, higher plastic contents, and environmental conditions) before design-level confidence can be established.
4.7. Effects of Plastics on Concrete Quality and Durability: UPV
Concrete quality was assessed using ultrasonic pulse velocity (UPV), a non-destructive technique that evaluates internal integrity by measuring the speed of longitudinal stress waves through the material. Cracks, voids, and other discontinuities reduce wave velocity, making UPV a reliable indicator of concrete quality.
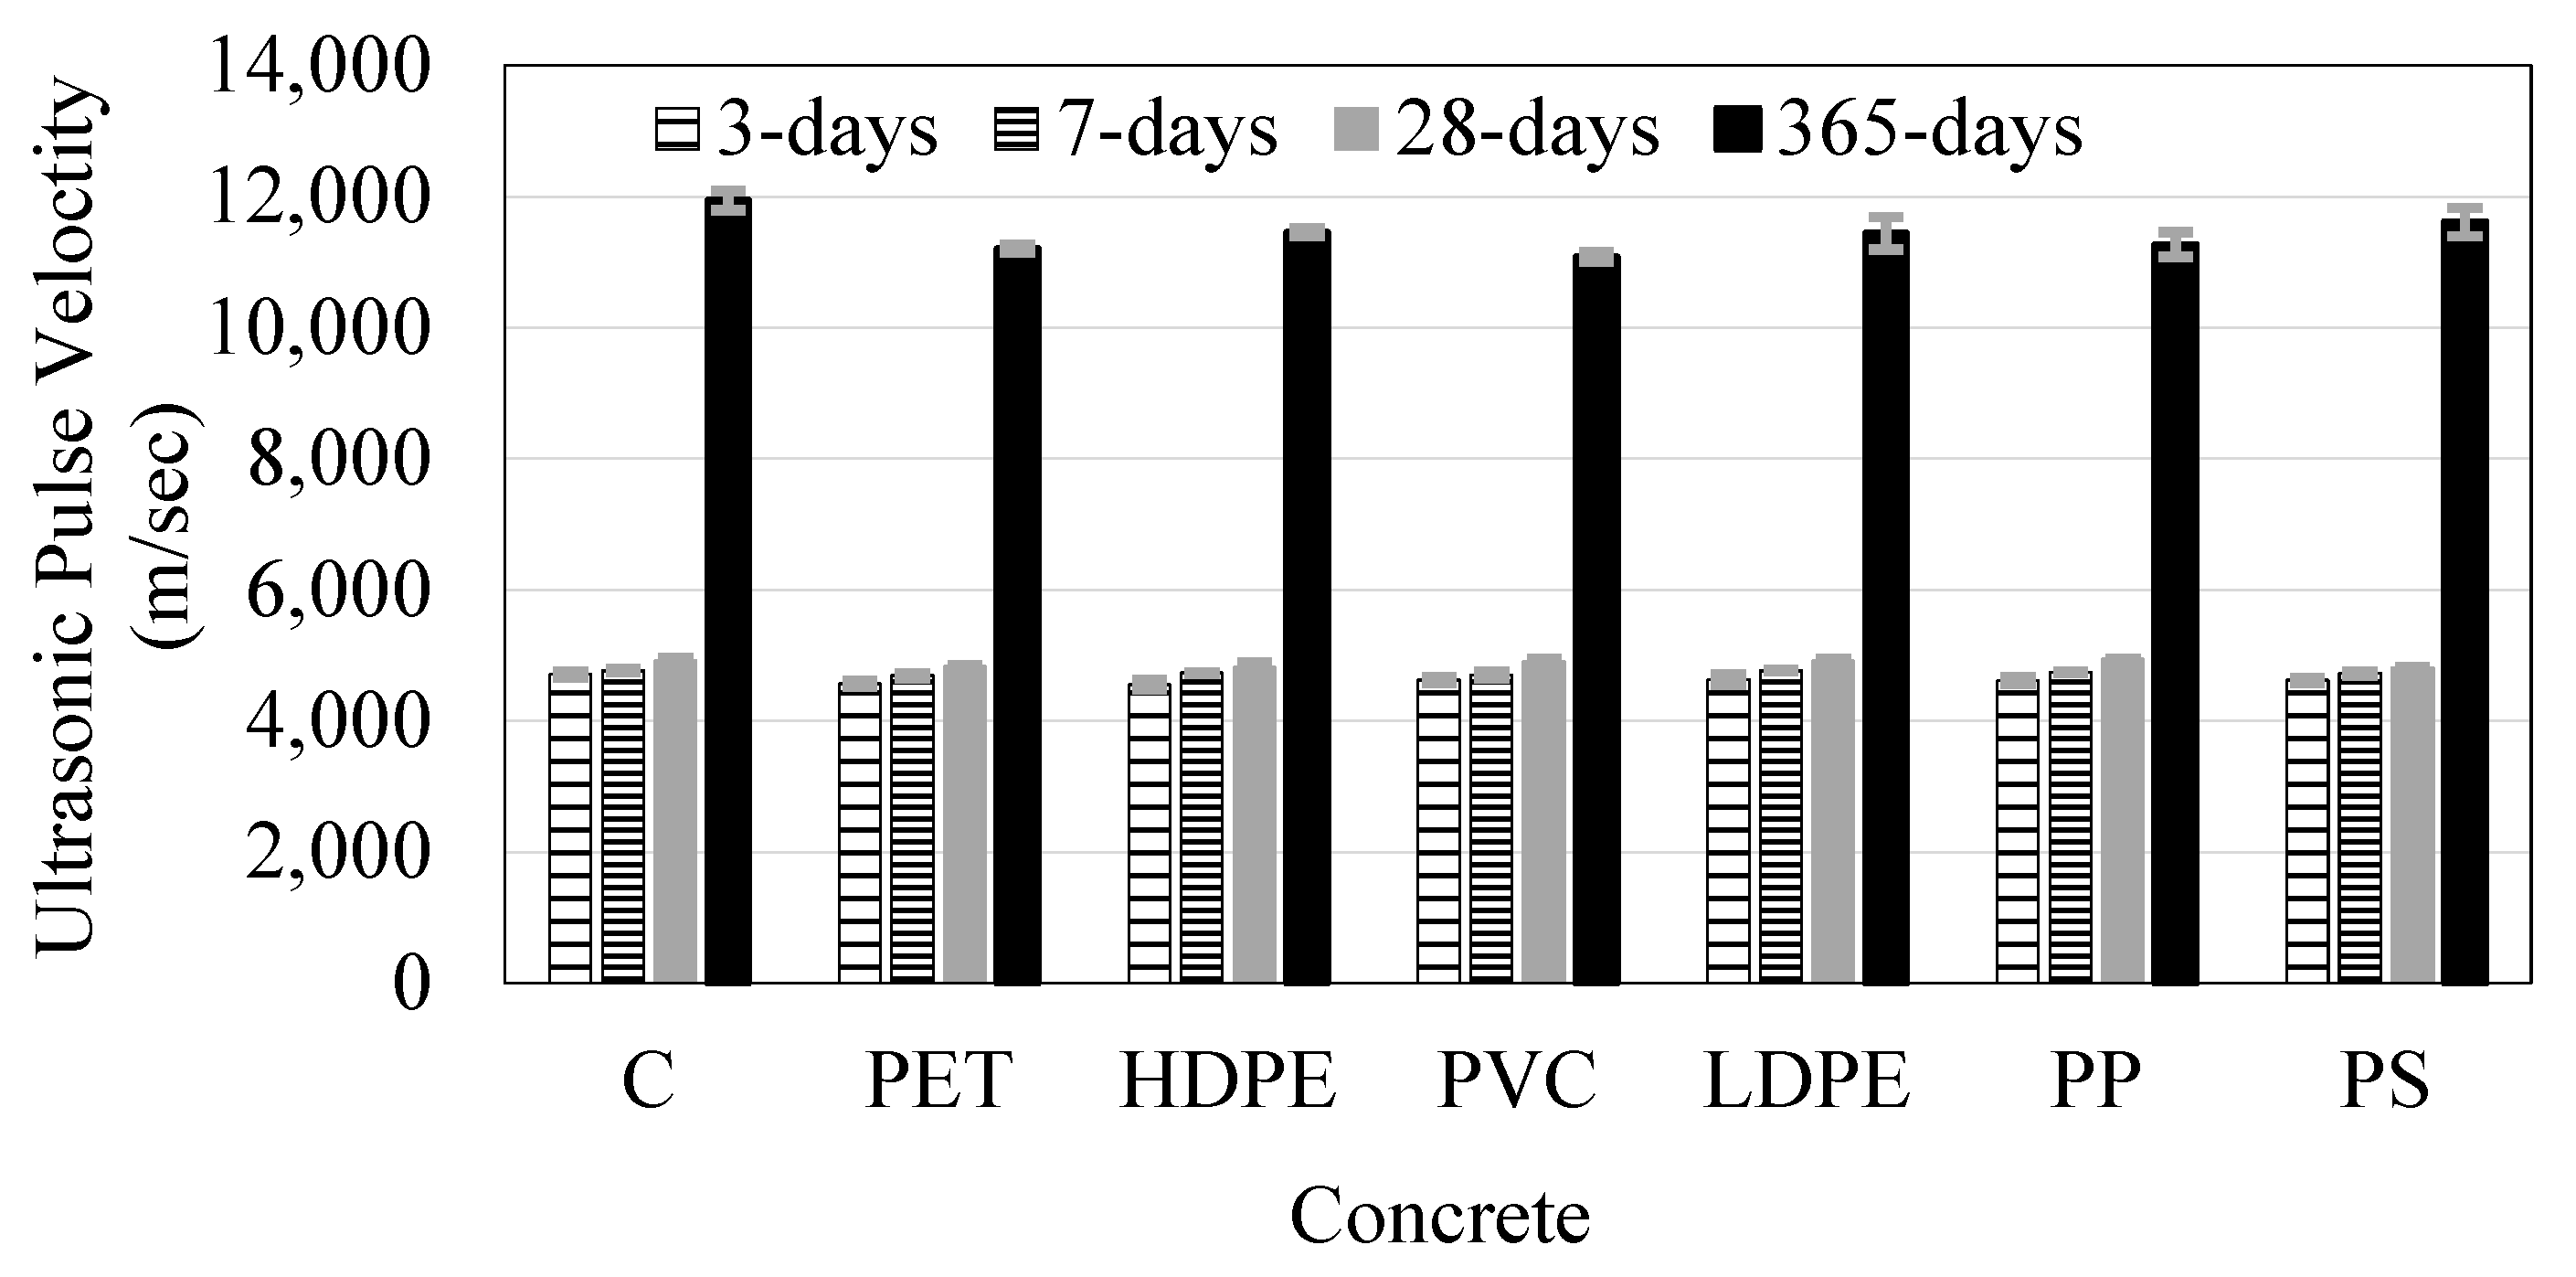
Figure 14 illustrates the UPV values as a function of plastic aggregate type and content at various curing ages.
For all plastic-aggregate concrete mixes, UPV values generally increased over time up to 28 days, relative to their 3-day measurements, indicating ongoing hydration and continued material development. Across all ages up to 28 days, differences in UPV between plastic-aggregate and control concrete remained within one standard deviation, suggesting similar quality. At 365 days, however, concrete, including plastics, exhibited UPV values that were 3–7% lower than those of the control mix, indicating a slight reduction in long-term quality.
The entrapped air volume across all concrete mixes (
Figure 6) showed no significant variation, indicating that differences in UPV were not due to air content. Overall, the reduction in UPV for plastic-aggregate concrete was minimal, suggesting that replacing natural fine aggregate (NFA) with plastic fine aggregate (PFA) has only a minor effect on concrete durability. Furthermore, according to the quality classifications proposed by Whitehurst [
58], Jones and Gatfield [
59], and Neville and Brooks [
60], all concrete mixes incorporating plastics can be considered of good quality, as their UPV values exceeded 4500 m/s at all testing ages.
4.8. Effects of Plastics on Concrete Quality and Durability: Electrical Resistivity
Electrical surface resistivity was also employed to evaluate concrete durability, based on the principle that electrical charge passing through concrete encounters resistance unique to each mix [
44].
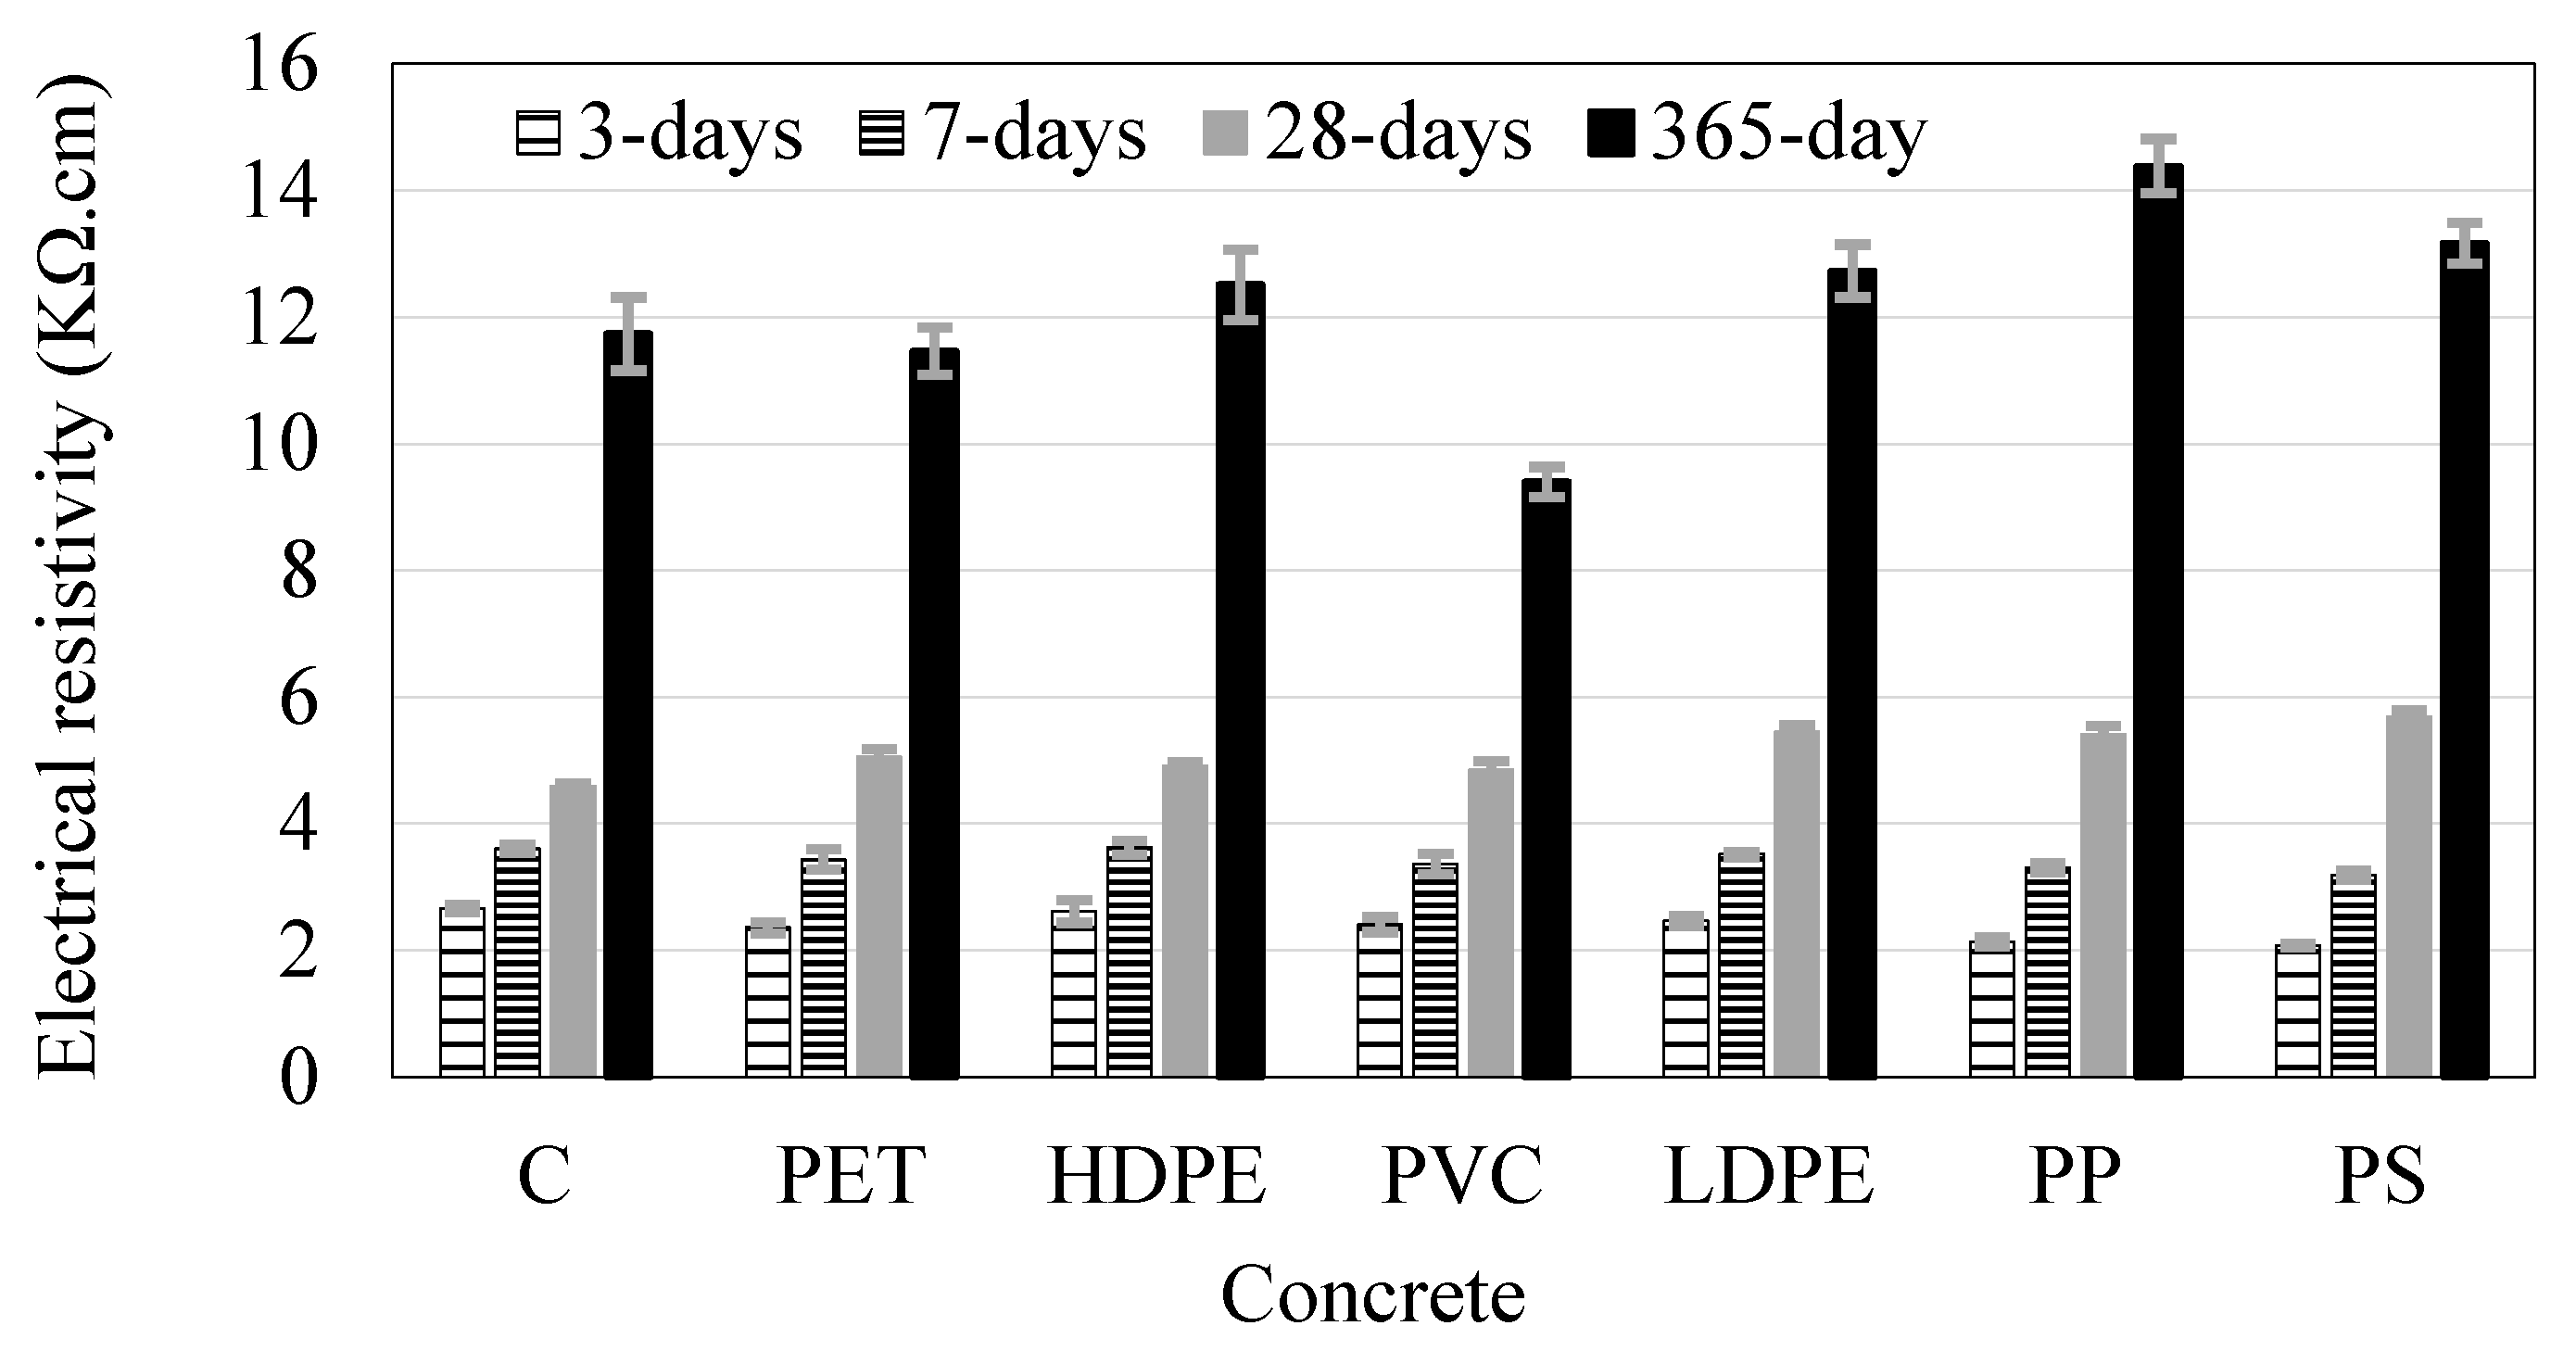
Figure 15 presents the bulk electrical resistivity of concrete specimens at various ages. Resistivity increased with curing time for all mixes. At early ages (3 and 7 days), the control concrete exhibited the highest resistivity values of 2.66 and 3.61 kΩ·cm, respectively. Compared to the control, all plastic-modified concrete showed lower resistivity at these early stages, with PS concrete showing the largest reductions of 22% (2.08 kΩ·cm) and 12% (3.19 kΩ·cm) at 3 and 7 days, respectively.
By 28 days, all concrete mixes containing plastics demonstrated higher resistivity than the control (4.60 kΩ·cm). PVC concrete exhibited the smallest increase of 5% (3.43 kΩ·cm), while PS concrete showed the largest growth of 24% (5.69 kΩ·cm). At 365 days, concretes modified with PP and PS significantly exceeded the control in resistivity. Conversely, concretes containing PET, HDPE, and LDPE exhibited similar resistivity values to each other. However, the PVC-containing concrete’s resistivity was significantly lower than that of the control and all other plastic concretes. The rise in electrical resistivity is largely attributed to the intrinsically high resistivity of plastics (>10
13 Ω·cm), which far exceeds that of natural sand (<10
6 Ω·cm), but it is not clear why the resistivity of the PVC concrete was lower than that of the other samples, especially considering the particle size of the PVC was significantly lower than that of the other plastics (
Table 1).
Previous studies (e.g., [
46]) suggest that higher electrical resistivity correlates with improved resistance to chloride ion penetration and thus enhanced durability. However, given the influence of the highly resistive plastic aggregates, it remains uncertain whether these resistivity changes reflect actual modifications in pore structure or permeability. Until further investigations confirm the predictive capability of resistivity measurements in concrete containing highly resistive materials, these results should be interpreted with caution.
To provide a more practical durability interpretation, the measured electrical resistivity values (generally above 15–20 kΩ·cm for all mixes) were compared with empirical correlations commonly used to estimate apparent chloride diffusion coefficients. Based on relationships reported for normal-strength concretes, resistivity in this range typically corresponds to Dapp on the order of 5 × 10⁻¹² to 1 × 10⁻¹² m2/s, which is consistent with moderate-to-good resistance to chloride ingress. Similarly, service-life models suggest that concretes with resistivity above ~20 kΩ·cm generally achieve longer corrosion initiation times under typical exposure conditions. While direct diffusion testing was not performed in this study, these benchmark comparisons indicate that the inclusion of 10% plastic fine aggregate does not reduce durability-related performance to levels associated with premature chloride-induced deterioration.
While UPV and bulk electrical resistivity provide useful first indicators of internal quality and transport behavior, recent developments in quantitative non-destructive evaluation (NDE), such as array-based ultrasonic imaging and machine-learning-assisted interpretation, offer far more detailed mapping of defect connectivity and moisture pathways. The present study should therefore be viewed as providing baseline NDT results rather than a full durability assessment. Moreover, key long-term mechanisms, including drying shrinkage, creep, freeze–thaw resistance, alkali–silica reactivity, and chemical attack, were not evaluated here. Comprehensive characterization of these parameters will be necessary before plastic fine-aggregate concrete can be reliably specified for harsh exposure environments or long-service-life structural applications.
4.9. Code and Practice Implications
Because current prescriptive codes, such as ACI 318 [
54], do not explicitly address concrete incorporating plastic fine aggregate, its adoption in structural applications would need to rely on performance-based provisions. In practice, this would involve demonstrating compliance with standard mechanical and durability tests (e.g., ASTM C39, C469 [
37,
39], and relevant durability indices) and seeking approval through ACI 318 [
54] which allows alternative materials provided their performance is shown to be equivalent for the intended use. Until formal code language is developed, the most practical near-term applications of plastic-modified concrete lie in non-critical or lightly loaded members, where modest reductions in stiffness can be accommodated. This pathway enables practitioners to adopt the material within the existing code framework while ensuring safety and adequate performance.
Plastic particles differ substantially from natural aggregates in their thermal expansion, softening temperature, and decomposition behavior, which has implications for fire performance. Under elevated temperatures typical of structural fire exposures, most plastic types soften at 100–160 °C and melt by 200–300 °C, potentially leading to localized loss of stiffness, increased pore pressure, and additional microcracking. While the modest plastic content used in this study (10%) is unlikely to compromise ambient structural behavior, its influence at high temperature remains uncertain. Current fire-resistance design provisions are calibrated for concrete with natural aggregates and may not directly apply to plastic-modified mixes. As such, dedicated high-temperature testing is required before these materials can be recommended for fire-exposed structural elements. The present findings should therefore be interpreted as room-temperature mechanical results only.
Compared with some earlier studies, including our own prior work [
15,
17,
23], the present results suggest that the influence of plastic type is more pronounced for the elastic modulus than for compressive strength. This difference appears to stem from the much lower stiffness of plastics relative to the cementitious matrix, which disproportionately affects composite elasticity but contributes less to peak load capacity. Variations in particle morphology and surface roughness also influence interfacial bonding, helping to explain why certain plastic types reduce stiffness more strongly than strength. Highlighting these differences relative to previous findings underscores the need for unified testing frameworks, such as the one used here, to fully isolate material-specific effects.
Recent research trends increasingly place durability, crack control, and quantitative condition assessment at the center of concrete-material performance. Studies on expansive agents for shrinkage mitigation and on high-precision ultrasonic or array-based imaging have demonstrated that long-term transport behavior and internal defect evolution are now treated as core design parameters. The present study contributes to this trajectory by providing baseline NDE and mechanical indicators for plastic-modified concrete, while acknowledging that more advanced durability testing and spatially resolved NDE approaches will be essential for comprehensive evaluation.
Despite the promising mechanical and durability results of the plastic-modified concretes evaluated in this study, their adoption in structural building or bridge elements is constrained by existing prescriptive codes that do not explicitly permit recycled plastic aggregates. In practice, approval would occur through alternative-materials clauses, which require the designer to demonstrate that the proposed concrete achieves equivalent structural safety and durability as a conventional mix. A viable approach is therefore a performance-based specification that defines acceptance in terms of quantifiable criteria, minimum compressive and tensile strengths, elastic modulus targets, limits on drying shrinkage and creep, chloride penetration or diffusion thresholds, water absorption and resistivity metrics, and verified serviceability predictions for deflection and crack width under representative loading. By framing evaluation around measurable performance rather than prescribed material composition, owners and regulators can systematically assess the suitability of plastic-modified concretes for structural applications.
5. Life Cycle Assessment
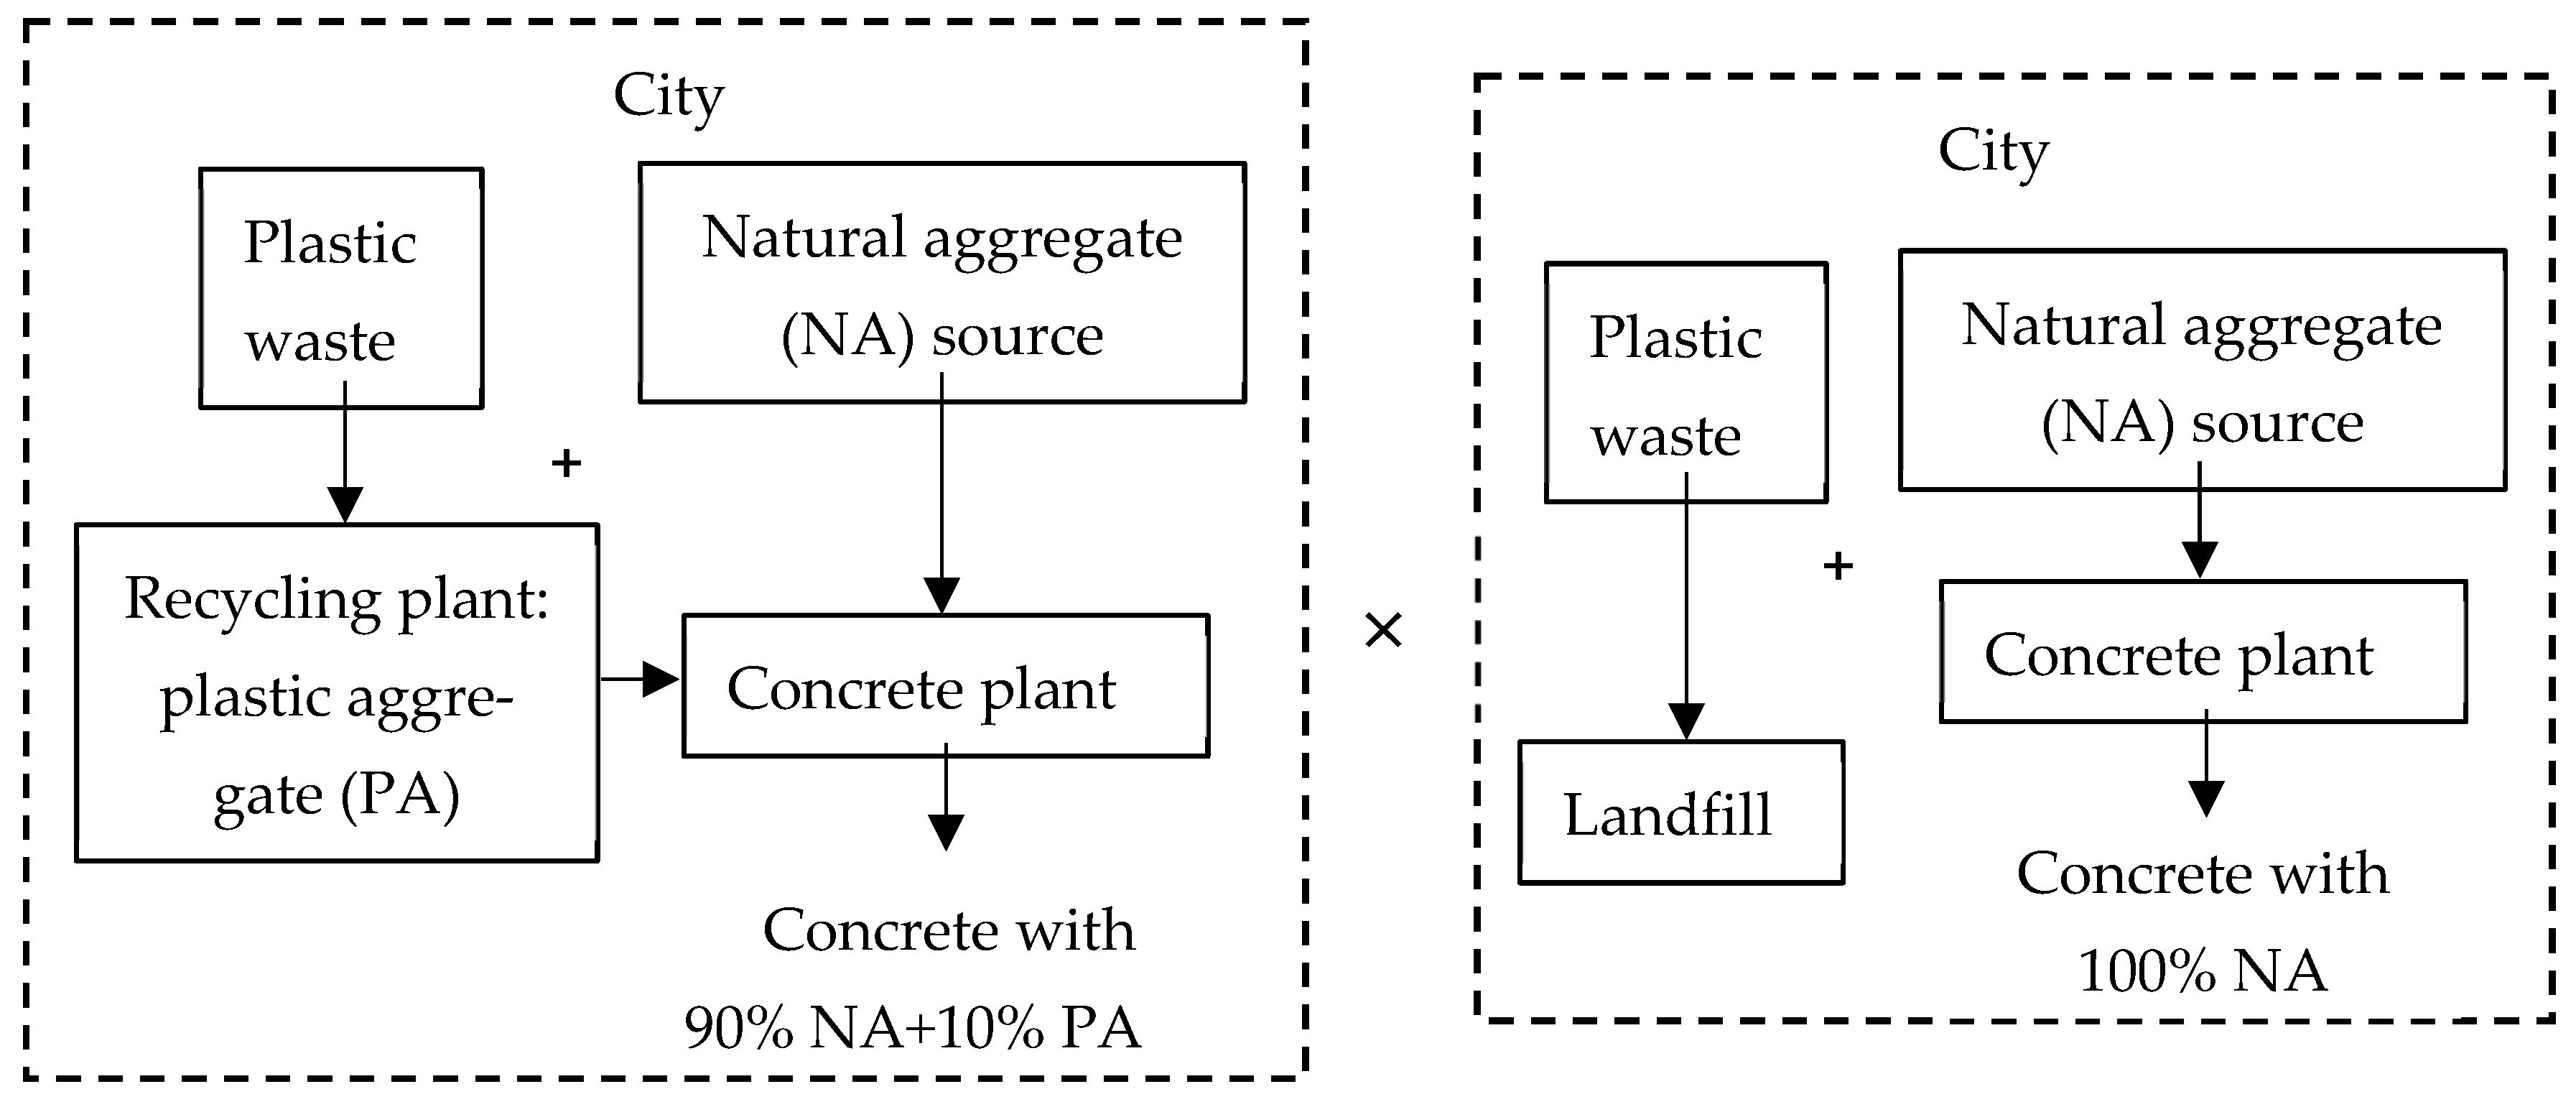
A life cycle assessment was performed to evaluate the greenhouse emissions from two scenarios. Twenty most populated cities in Ohio were included as a case study. The first scenario included recycling plastic waste generated from these 20 cities as plastic aggregate and using it to replace 10% of natural aggregate in concrete. In the second scenario, all plastic waste produced from these 20 cities is landfilled and the same amount of plastic aggregate is prepared from natural rocks. The greenhouse gas volume generated from handling plastic waste, recycling it and transporting it was determined. In addition, emissions generated from the production of natural aggregate and transporting it were determined. The exact locations of Ohio cities, landfills, aggregate mines, and plastic recycling plants were included in the LCA models to achieve gas emission volume as realistically as possible. The energy needed at the different stages at each transfer station, landfills, material recovery facilities, plastic recycling plants were estimated based on peer reviews and EPA publications. Emissions generated from landfilling plastic were ignored assuming that all landfills comply with EPA rules.
The comparison is performed between two main LCA scenarios as illustrated in
Figure 16. In the first LCA scenario, instead of landfilling plastic waste, it is recycled as aggregate to replace 10% of natural aggregate in concrete. In the second LCA scenario, plastic waste is landfilled, and concrete is made with 100% natural aggregate. A complete description of the LCA model can be found in Abduallah [
23]. The study shows that with strategic improvements in recycling technology and logistics, using plastic waste in concrete can become an environmentally friendly option, helping to reduce our carbon footprint.
6. Summary and Conclusions
This study presents a comprehensive experimental investigation on the use of processed plastic materials as a partial replacement (10% by volume) for natural fine aggregate (NFA) in concrete. This study is unique and evaluates six types of plastic materials: PET, HDPE, PVC, LDPE, PP, and PS. The study assessed a wide range of fresh and hardened concrete properties, including slump, density, entrapped air content, compressive and tensile strengths, modulus of elasticity, Poisson’s ratio, and structural behavior in reinforced concrete (RC) beams. These properties were compared against those of conventional concrete, and crucial findings are summarized in
Table 5 using directional indicators (↑ increase, ↓ decrease, → no significant change).
Workability and Air Content:
The inclusion of plastic fine aggregates (PFAs) resulted in minor changes in slump and entrapped air content. Most variations remained within experimental error ranges and were considered insignificant.
Fresh and Dry Densities:
Plastic-aggregate concrete exhibited slightly lower densities (up to 2% reduction) compared to the control mix, due to the lower specific gravity of plastics.
Compressive Strength:
The reduction in compressive strength across all plastic-modified concrete was generally less than 10% at 28 days. A hypothetical blend of all six plastic types would yield an average strength reduction of approximately 4%, with an error range of ±4%, indicating overall acceptable performance for certain concrete applications.
Tensile Strength:
Most concrete mixes incorporating PFAs showed tensile strengths comparable to the control, with changes falling within the experimental error margin.
Modulus of Elasticity:
The elastic modulus was generally reduced by 2–9% in plastic-concrete mixes, primarily due to the lower stiffness and bonding characteristics of plastic particles.
Poisson’s Ratio:
The use of plastics led to slight increases in Poisson’s ratio (1–11%), suggesting a higher capacity for elastic deformation, which may help mitigate cracking.
Reinforced Concrete Beam Behavior:
Replacing 10% of NFA with PFA had no adverse effects on flexural behavior under the specific test conditions.
Non-Destructive Testing:
Ultrasonic pulse velocity (UPV) and surface resistivity tests confirmed that concrete containing PFAs maintained an overall quality level equivalent to the control concrete. Although minor reductions in UPV were observed at later ages, resistivity generally increased—possibly indicating potentially improved resistance to chloride ingress.
The life cycle assessment (LCA) study indicated that with strategic improvements in recycling technology and logistics, using plastic waste in concrete can become an environmentally friendly option, helping to reduce our carbon footprint
This novel investigation demonstrates the feasibility of using plastic waste as a sustainable alternative to natural fine aggregate in concrete, with minimal compromise to structural and durability performance. Further long-term and large-scale studies are encouraged to validate these findings in real-world applications. Furthermore, due to some limitations of the current work, the authors highlight the following points:
The effect of replacing NFA with different RRs of PFA on concrete behavior should be studied.
The plastic mechanical strength used in this research was based on the information provided by the literature that corresponds to bulk polymer behavior. However, these values could be different for ground plastic. Thus, it is recommended to use the mechanical strength of plastics tested in a particle state.
Testing RC beams with a bigger scale and a larger number of specimens would provide more conclusive results regarding the impact of replacing natural sand with plastic particles.
For a better understanding of the differences in the properties of concrete containing different plastics, the interfacial transition zone (ITZ) between cement paste and plastic particles should be examined.
The results obtained from the electrical resistivity test could be directly or indirectly affected by the high electrical resistivity of the plastic particles, leading to unreliable results.