Abstract
The disposal of tunnel waste slag has emerged as a major ecological challenge. Highway pavement bases require large quantities of graded crushed stone as fill material, but large-scale quarrying of such stone also poses significant environmental problems. An innovative approach involves crushing tunnel waste slag into graded crushed stone for use as fill material, offering an economical and environmentally friendly solution to both issues. However, the performance of this recycled graded crushed stone needs to be carefully evaluated. This study employed particle flow analysis software to simulate the California Bearing Ratio (CBR) test process, followed by analysis and verification to assess its performance. A CBR model was developed and validated, the meso-mechanical parameters of the penetration process were analyzed, and the results were examined in terms of both CBR values and particle contact force fields. The findings indicated that different particle stiffness ratios had no significant effect on the CBR test, while the friction coefficient showed a linear positive correlation with the CBR value. It was also concluded that the slenderness ratio of the contact force field first increased and then decreased with an increase in the stiffness ratio . As the friction coefficient increased, the slenderness ratio of the contact force field decreased accordingly. This study provides valuable insights into the influence of meso-mechanical parameters on the performance indicators of graded crushed stone pavement and offers a promising approach for the processing and reuse of tunnel waste slag to alleviate ecological pressures.
1. Introduction
With a large number of tunnels being excavated to meet the demands of mountainous engineering projects, tunnel waste slag has become a troublesome issue [1]. One method for treating tunnel waste slag is to crush it into graded crushed stones of specific particle sizes, which not only resolves the waste disposal problem, but also addresses the shortage of engineering stones [2,3,4,5]. However, whether the performance of this graded crushed stone allows it to be used in engineering still requires theoretical and experimental research.
Graded crushed stone, mainly composed of aggregates and stone chips, is a three-phase discrete material. Its performance is influenced by multiple factors, such as aggregate strength, gradation, shape, surface characteristics of granular materials, and construction methods [1,6,7,8,9]. Many scholars have studied the mechanical properties of graded crushed stone through physical experiments and finite element numerical simulation from the aspects of aggregate strength, gradation, shape, and particle material [10,11,12,13,14,15,16,17]. In recent years, the theory of graded crushed stone has been developed. Many studies have shown significant differences in the granular structure characteristics and nonlinear mechanical properties of graded crushed stone compared to the assumption of homogeneity, continuity, uniformity, and isotropy in the layered elastic system theory [18,19]. Therefore, more and more scholars tend to use the discrete element method to study graded crushed stone in view of the limitations of the finite element method. They mostly use direct shear tests, triaxial tests, and other laboratory tests combined with THE discrete element method to study the mechanical properties of graded crushed stone [20,21,22].
The California Bearing Ratio (CBR) is an important index to evaluate the performance of graded gravel pavement [23]. In the aspect of using CBR to study the mechanical properties of graded gravel, Ma et al. [13] evaluated the mechanical properties of high-liquid-limit clay after recycled concrete aggregate and recycled brick aggregate treatment through CBR and other tests, which provided a basis for improving high-liquid-limit clay. Ji et al. [24] developed a numerical simulation method combining discrete element and computed tomography to solve the problem of laboratory tests being unable to measure the CBR of large-size gravel. Liu et al. [25] evaluated the feasibility of replacing traditional sand–gravel filler with silty phosphate tailings as roadbed filler through CBR tests and PFC simulation. Hu et al. [26] discussed the establishment of a CBR model in PFC, studied the influence of different particle sizes on CBR value, and proposed the method of model parameter calibration. Taking limestone as the research object, Jiang et al. [27] analyzed the meso-mechanism of graded crushed stone and the influence of its parameters on CBR value. However, most of these studies on mechanical properties are from a macro perspective, and the research on their internal mechanisms is not deep enough. The influence of the model on the CBR value is not clear enough. In general, there are few studies on other types of graded gravel in this research direction, and the influence of meso-mechanical parameters on the performance index of graded gravel pavement is not clear enough.
Although previous studies, such as Jiang et al. [27,28], have developed numerical CBR testing frameworks using particle flow modeling for materials like limestone—focusing on meso-mechanisms and the influences of friction and shear modulus—and Peng et al. [29] and Hu et al. [26] have further explored gradation and particle size effects, these works predominantly adopt a macro perspective or focus on conventional materials. Consequently, the contact force field dynamics and the behavior of waste-derived aggregates remain insufficiently analyzed. Our research addresses this research gap by utilizing tunnel waste slag as the graded crushed stone. Through CBR process simulations, we examine the specific influences of meso-mechanical parameters—specifically the stiffness ratio () and friction coefficient ()—on both CBR values and the anisotropy/slenderness ratio of the particle contact force field. This study provides novel insights into penetration mechanisms and advances the sustainable reuse of tunnel waste, thereby mitigating ecological pressures while elucidating the parameter–performance relationships that remain unclear in the existing literature.
In this paper, based on the actual project, the appropriate theoretical model is selected and the PFC particle flow simulation is carried out. The correctness of the model is verified by the comparison of CBR test results. According to the model, the mesoscopic mechanism of tunnel slag graded gravel in the process of CBR penetration and the influence of meso-mechanical parameters on CBR value and particle contact force field are simulated and studied.
2. Methods
2.1. Theoretical Model
The simulation model is based on the contact model and Newton’s second law. The contact force is calculated by the contact model, that is, the force–displacement relationship. Newton’s second law is used to solve the displacement, velocity, and acceleration.
Through the vibration motion equation, the contact motion mode between particles and particles, as well as particles and boundaries, is simulated, and the vibration is decomposed from the normal and tangential directions to obtain the normal and tangential vibration models, as shown in Figure 1a,b. The sliding model between particles and between particles and boundaries is shown in Figure 1c.
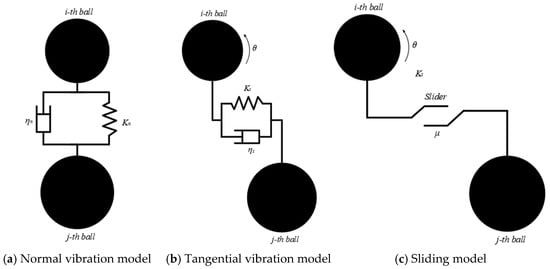
Figure 1.
Model decomposition diagram.
After decomposition, the normal vibration motion equation can be obtained as follows:
The tangential vibration motion between particles is manifested as tangential sliding and rolling (between particles) or sliding (between particles and boundaries), as follows:
where is the equivalent rotational inertia of the particles; and are the normal and tangential relative displacements of the particles, respectively; and are the normal and tangential damping coefficients; and and are the normal and tangential stiffness of the particles.
The judgment conditions of tangential sliding or rolling of particles can be obtained from the sliding model, as follows:
where is the friction coefficient and is the sign judgment function, as follows:
According to the force–displacement relationship, the force acting on the particles can be obtained according to the displacement that has occurred. The displacement that has occurred can be obtained by Newton’s second law, then the equation of motion of particle is as follows:
The Euler method can be used to integrate both sides of the above formula at the same time to obtain the update speed of the next time step, as follows:
The updated expression of the displacement can be obtained by reintegrating the two sides, as follows:
The updated value of the particle displacement is obtained, and the updated value is substituted into the force–displacement relationship to calculate the new force. The movement of each particle at any time is monitored in such a cycle.
Based on previous research (Yue et al., 2024 [22]), the linear contact key model is selected. The contact key has constant normal stiffness and shear stiffness, and the springs set in the normal and tangential directions of the contact key have corresponding tensile strength and shear strength. In this model, the contact key cannot resist relative rotation, and there are two cases of contact establishment and non-establishment, as shown in Figure 2b,c.
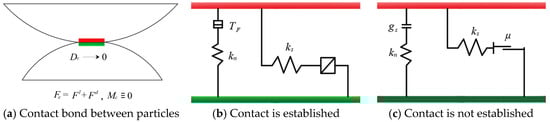
Figure 2.
Schematic of internal operation mechanism of linear contact bond model.
2.2. Model Initialization
This study is based on the tunnel slag processing and reuse project of the Huizhou Qingyuan section of the Shanzhan Expressway (western Guangdong, China), and conducts a meso-mechanical parameters study on the graded crushed stone used for filling the pavement base. The original particle size distribution of the crushed stone soil retrieved from the site was obtained by sieving using a vibrating-screen machine. Crushed stone samples and the vibrating-screen machine are shown in Figure 3 and Figure 4. After the grading was adjusted, CBR tests were performed to obtain data for subsequent simulation tests.
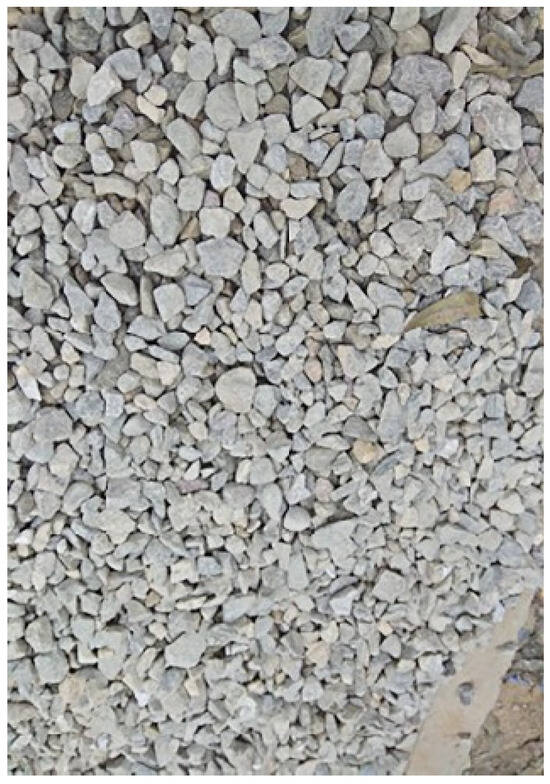
Figure 3.
Examples of graded crushed stone samples used in this study.
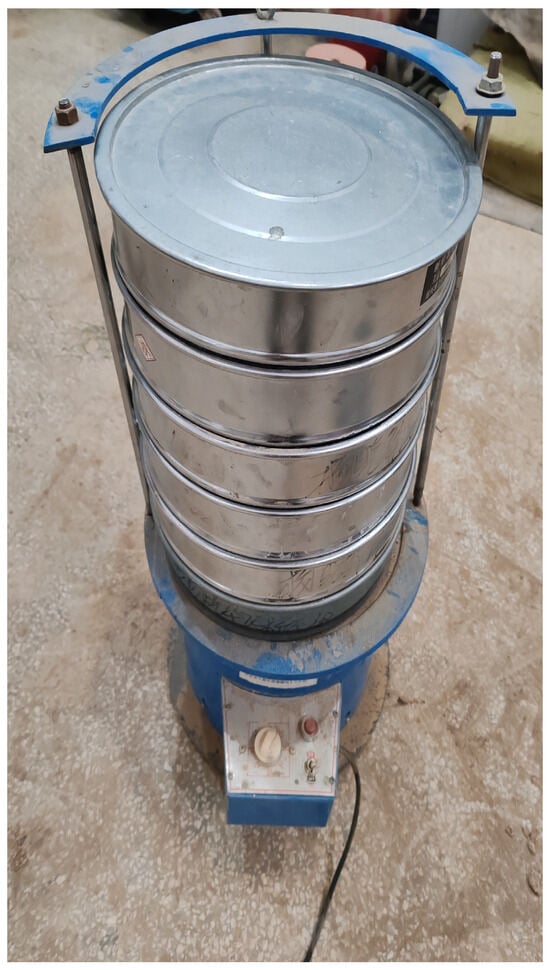
Figure 4.
The vibrating-screen machine used in this study.
To eliminate the size effect of the sample in the simulation experiment and simplify the experimental process, the particle grading and sample size used in the numerical simulation experiments were the same as those used in the laboratory experiments. The minimum particle size was set to 2 mm to ensure the efficiency of the numerical simulation experiments.
Setting the minimum particle size to 2 mm is a common simplification in discrete element method (DEM) simulations to mitigate computational costs, as the inclusion of finer particles would exponentially increase the particle count and simulation time. This upscaling strategy aligns with previous CBR studies utilizing Particle Flow Code (PFC) to ensure computational feasibility while isolating dominant mechanical behaviors [26,27]. While omitting fines may slightly influence packing density and force chain distribution by underrepresenting the role of small particles in facilitating inter-particle contacts, the model’s validation against experimental data—yielding a 5.33% deviation in CBR values—confirms its reliability for the scope of this investigation. Although the secondary effects of fines merit future sensitivity analysis, the strong correlation observed here indicates that the coarse skeleton sufficiently captures the primary load-bearing mechanisms.
The grading curve before and after adjustment is shown in Figure 5, and the adopted particle size ranges and corresponding mass percentages are listed in Table 1.
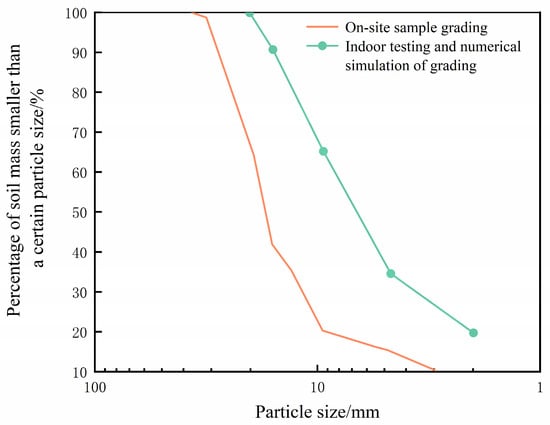
Figure 5.
Grading curves for the on-site samples prior to adjustment and after particle size adjustment.

Table 1.
Adjusted particle size ranges and corresponding mass percentages used in the laboratory experiments.
2.3. CBR Model Design
In the process of establishing the discrete element model, considering the complexity of the individual shape of the sample gravel, the influence of the particle shape on the simulation results was realized by adjusting the particle contact model and the related parameters. The influence of normal force, tangential force, friction force, and bite force in particle contact was simulated by using a linear model of rotational resistance and compared with a linear contact bond model. While utilizing spherical particles simplifies the numerical model and enhances computational efficiency, this assumption inherently omits the complex effects of particle angularity and geometric interlocking. Consequently, the simulated shear resistance may be marginally lower than that of actual angular aggregates. Nevertheless, our validation against experimental CBR benchmarks demonstrates a high consistency in macro-scale mechanical response, with deviations maintained below 6%. This level of accuracy confirms that the spherical particle assembly is a robust and valid framework for investigating mesoscopic parameter relationships in this study.
2.3.1. Calibration of Meso-Mechanical Parameters
The meso-mechanical parameters were determined using the linear contact model and the rotational resistance model. The resulting simulation results were in good agreement with the CBR test results obtained by repeated simulation tests. The final meso-mechanical test parameters are presented in Table 2.
Table 2.
Meso-mechanical parameters of particles.
To accurately represent the stiff behavior of crushed stone, high contact stiffness values were adopted to facilitate numerical stability and restrict particle overlap to negligible levels. These meso-parameters were calibrated via a systematic trial-and-error process until the simulated CBR responses exhibited strong agreement with experimental benchmarks. The selected values are consistent with those reported in the literature for similar geomaterials, such as the ranges cited by Hu et al. (2022) [26] and studies on asphalt–aggregate systems. Note that in the DEM, mesoscopic parameters are considered effective properties tuned for macroscopic accuracy and do not necessarily correspond directly to the measurable elastic moduli of individual particles.
2.3.2. CBR Model Construction
The CBR model parameters were set based on the particle meso-mechanical parameters listed in Table 2, and the model was constructed to match the boundary conditions of the laboratory CBR test samples. Graded gravel particles were generated within the set range. Considering the effect of gravity, the force chain network became gradually denser from top to bottom. Pressure was applied downward from the top wall, and the consolidation was completed when the vertical force chain extended throughout the whole specimen.
Upon removing the top wall, Walls 1, 2, and 3 were established to simulate the penetration rod: Wall 1 served as the 50 mm diameter contact face, while Walls 2 and 3 defined the rigid cylindrical body. Surcharge weights were modeled using an annular configuration of loading plates, each 50 mm wide (Figure 6), with a cumulative mass of 5 kg to satisfy standard CBR requirements. Lateral confinement—mimicking the mold’s side pressure—was achieved through Walls 4 and 5, each applying a constant 25 N force. Following an initial indenter preload of 45 N, the lateral stress was regulated by a servo-control algorithm in PFC. This mechanism dynamically modulated wall velocity to maintain the target confinement, thereby ensuring that the sample experienced a consistent stress state without over- or under-loading during the penetration phase.
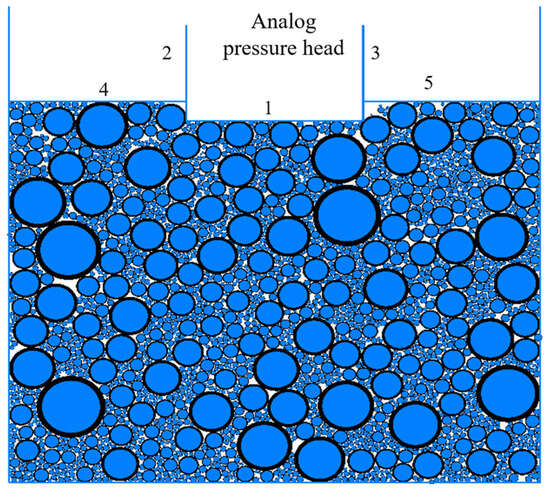
Figure 6.
Boundary condition diagram of a CBR specimen.
After the loading condition of the sample boundary met the test requirements, a constant speed was given to the simulated indenter to press it into the sample. A speed of 1.25 mm/min was selected as the penetration speed, and the loading was stopped when the penetration distance increased to 6 mm. A penetration depth of 6 mm was adopted to surpass the standard CBR measurement thresholds of 2.5 mm and 5.0 mm. This ensures robust validation against experimental benchmarks while facilitating a comprehensive analysis of contact force evolution and particle interactions. This selection strategically balances the model’s capacity for meso-mechanical investigation with computational overhead in the PFC environment; further penetration would significantly increase simulation time without yielding proportional gains in physical insight for the current research scope.
A sensitivity analysis was conducted to assess the impact of key parameters: varying wall stiffness by ±20% resulted in CBR value changes of less than 5%, indicating low sensitivity; loading rates between 1.0 and 1.5 mm/min altered peak unit pressures by under 3%, consistent with quasi-static assumptions; and an alternative initial compaction method affected sample porosity by <2%, with minimal influence on penetration curves, confirming the robustness of the selected procedure.
2.4. Model Validation
To verify the effectiveness of the model, CBR tests were conducted and the experimental results were compared with the simulation results. Figure 7 shows the process of indoor CBR test, and Figure 8 shows a comparison between CBR curves from the laboratory test results and from the numerical simulation. As shown in Figure 8, the trends of the two curves are consistent. Moreover, the simulated curve shows a rapid initial increase in unit pressure, aligning with the actual test results and confirming the simulation’s validity.
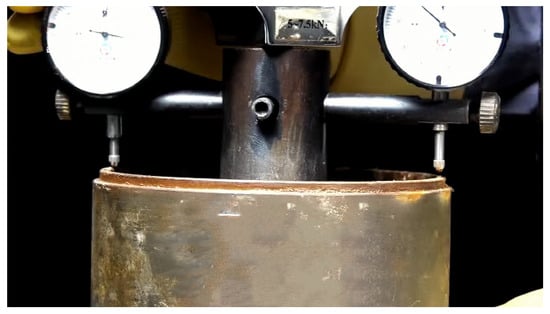
Figure 7.
Indoor CBR test.
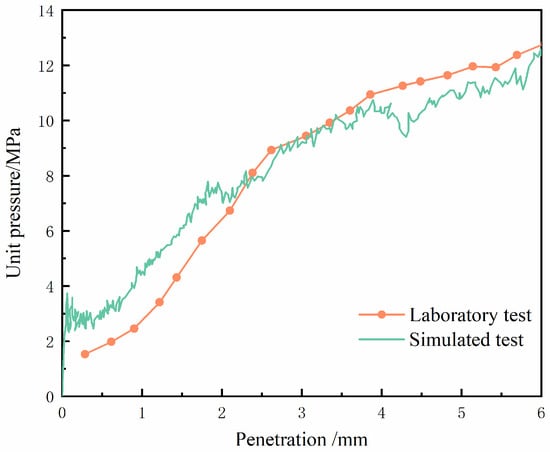
Figure 8.
Comparison of CBR curves obtained from the laboratory test and the numerical test.
While the model validation demonstrates strong agreement—evidenced by a 5.33% deviation in CBR values (Table 3)—it is currently based on a single laboratory benchmark due to limitations in experimental resources. It is noted that standard geotechnical protocols, such as ASTM D1883, typically recommend multiple replicates to account for inherent variability in sample preparation and testing conditions. Nevertheless, the high degree of alignment observed across the entire load–penetration curve, particularly at the critical 2.5 mm and 5.0 mm thresholds, suggests that the DEM model is sufficiently representative for the objectives of this study. While future research incorporating statistical replicates would further enhance robustness, the current agreement provides a reliable foundation for the ensuing meso-mechanical analysis.
Table 3.
Comparison of CBR values obtained from laboratory test and numerical test.
It can be seen from Table 3 that the deviation between the laboratory and numerical test results is 5.33%, indicating that the simulated test results are not significantly different from the actual situation, which also verifies the effectiveness of the simulation. Therefore, the following results related to simulated particle meso-mechanical parameters are valid.
To quantitatively evaluate the model performance beyond qualitative visual comparison, the experimental penetration curves were digitized and compared with the simulation results using statistical metrics. The root mean square error (RMSE) between the laboratory and simulated unit pressures across the full range (0–6 mm) is 0.73 MPa, with a mean absolute error (MAE) of 0.64 MPa. Notably, the coefficient of determination (R2) is 0.97, indicating a strong correlation and excellent overall fit. These metrics confirm that the DEM model possesses high fidelity in replicating the load-bearing response of the tunnel waste aggregates.
From a mechanical perspective, the increasing divergence observed at later penetration stages can be attributed to inherent modeling simplifications, specifically the assumption of non-breakable particles and the constraints of the linear rotational resistance contact model. In laboratory settings, high localized stresses frequently trigger particle breakage (comminution) and subsequent densification, which contribute additional penetration resistance. Because these fragmentation-induced mechanisms and the resulting changes in grain size distribution are not fully captured by the current simulation, the numerical model exhibits the observed deviations from the experimental results at high load levels.
3. Analysis of Mesoscopic Mechanics Mechanism
The penetration process of the CBR test encompassed particle embedding and inter-particle friction. The mechanical mechanism is explained from the mesoscopic point of view, as follows, with the help of the particle flow model.
3.1. Contact Force Chain Distribution
The unit pressure on the surface of the sample increased accordingly as the penetration amount increased, and force chains were formed between the sample particles to transfer stress during the test. The particle contact force chains diffused uniformly in the sample during the compaction and elastic deformation of the sample.
To quantitatively characterize the spatial morphology of the contact force field during penetration, we define the slenderness ratio () of the force chain network as follows:
where represents the maximum vertical extent (depth) of the force field, measured from the indenter surface to the lowest point where contact forces exceed a specific threshold. To ensure the exclusion of weak peripheral forces and focus on the primary load-bearing skeleton, this threshold was established at 10% of the maximum contact force, based on sensitivity analysis. denotes the maximum horizontal width within this identified active region. These dimensions were extracted from the PFC-generated force chain visualizations by fitting a bounding ellipse to the active contact zone and computing its major (vertical) and minor (horizontal) axes. The values were calculated at critical penetration depths (e.g., 2.5 mm and 5.0 mm) and averaged across simulations to ensure statistical reliability.
The sample was vertically penetrated by the force chain as the penetration process progressed, indicating that the sample entered the shear stage as a whole.
The development of the force chain extension at the main nodes during the test process is shown in Figure 9. As seen in the figure, the particle force chain beneath the penetration rod gradually extended downward until it reached the bottom of the specimen. The middle layer of the specimen had a horizontal force chain growth until it extended to the lateral boundary, while the four corners of the specimen were basically incapable of chain growth. It could be inferred that the force chain network was rugby-shaped and developed vertically in the sample, and this meant that force chains primarily grew vertically, supplemented by horizontal extension.
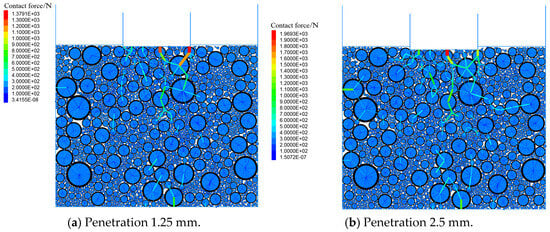
Figure 9.
Evolution of contact force chain in CBR test.
The corresponding change in the maximum contact force and the number of contact bonds is shown in Figure 10. The maximum and minimum values kept rising with increasing penetration, indicating that the contact force of all particles in the sample increased with an increase in penetration. When the force chain extended to the bottom of the whole specimen, the minimum contact force occurred between particles near the upper load plate.
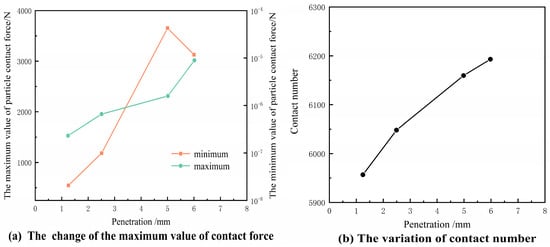
Figure 10.
Evolution of maximum and minimum contact force and contact number of particles.
3.2. Particle Displacement Vector Field Distribution
The sample particles were correspondingly displaced and the displacement vector was formed with the penetration of the pressure bar. Figure 11 shows the shape and change of the particle displacement field after the amplification of the displacement vector by the amplification coefficient SA.
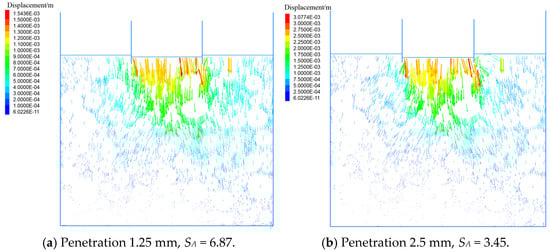
Figure 11.
Evolution of particle displacement vector field in CBR test.
By comparing the subgraphs in Figure 11, it can be concluded that when the penetration amount was small, the direction of the particle displacement vectors was mainly vertical. As the penetration amount increased, except for the inverted triangular area beneath the penetration rod, the displacement vectors of the sample particles primarily developed in a “herringbone” shape. The larger the penetration amount, the more obvious the phenomenon, and the whole sample profile finally formed “X”-shaped cracks. The particles in the middle of the bottom of the sample were the most stable and the displacement was the smallest.
4. Results and Discussion
4.1. Correlation Between Meso-Mechanical Parameters and CBR Values
In the actual CBR test process, the force conditions of the sample particles are complex. The model used in this study was developed to examine the influence of particle meso-mechanical parameters—specifically, the stiffness ratio and the friction coefficient —on the CBR value. To gain deeper insights into the force transmission within the particle system, a force chain model was integrated with the initial model. This combined approach allowed us to explore the relationship between particle properties and the force transfer pathways in the particle flow model, clarifying how individual interactions at the mesoscopic level influenced the material’s overall mechanical behavior. The maximum value of the particle contact force and the number of contacts in the model were taken using a penetration amount of 6 mm to ensure a reasonable and complete value of the force-chain-related data.
4.1.1. Stiffness Ratio
The CBR values and curves are shown in Figure 12. From this diagram, it can be seen that had little influence on the CBR value. The CBR value corresponding to each variable fluctuated around a fixed value, and the CBR curve shapes corresponding to different values were not very different.
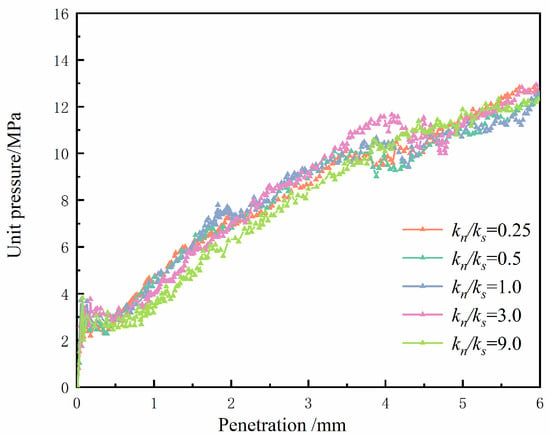
Figure 12.
CBR test results of different particle stiffness ratios.
There were “steps” after a penetration of 3.5 mm in Figure 12, which was similar to the stress softening phenomenon. The penetration force no longer increased at the original rate until the penetration amount increased to about 4.5 mm, which suggested that the overall particles of the sample underwent a large displacement during a penetration of 3.5~4.5 mm, and the particle contact key mainly occurred as a tangential failure simultaneously. The main reason may have been that a more intense particle position redistribution occurred, so the force chain network structure was reconstructed, which strengthened the overall resistance to deformation of the sample.
Figure 13 shows the force chain properties of each particle stiffness ratio. The maximum contact force of the particles increased first and then decreased with = 3 as the boundary, and the change range was small, as shown in Figure 13. The growth was faster at < 3, and the minimum value of contact force developed slowly while > 3. When the normal stiffness of the particles was small, the range of the contact force field and the gradient growth rate caused by the penetration were weakened by the normal elasticity of the particles, resulting in a smaller stress at the two corners of the bottom of the specimen far from the bottom of the penetration rod. With an increase in the normal stiffness of the particles, the contour of the particle contact force field caused by penetration extended outward, which made its proportion in the bottom particle contact force increase sharply. As the stiffness ratio of particles increased, the contact between particles became more rigid. This meant that, under the same external force, the deformation between particles decreased, resulting in an increase in contact force. Consequently, the maximum contact force between particles also rose with an increasing stiffness ratio. Overall, changes in the stiffness ratio influenced the interparticle forces, causing variations in both the maximum and minimum contact forces. This phenomenon is significant in materials science and engineering, as it aids in understanding and predicting material behavior under different conditions. Although these meso-level transitions in force chain architecture and contact density are evident under varying stiffness ratios (), they do not manifest as significant macroscopic fluctuations in CBR values. As illustrated in Figure 12, the CBR curves exhibit negligible sensitivity to these parameter changes. This suggests a compensation mechanism within the granular fabric: internal structural adjustments—such as enhanced contact rigidity facilitating more efficient force redistribution—effectively stabilize the assembly. Consequently, the granular structure maintains overall load-bearing stability, ensuring that the bulk performance index remains largely unaffected despite the underlying microscopic variations.
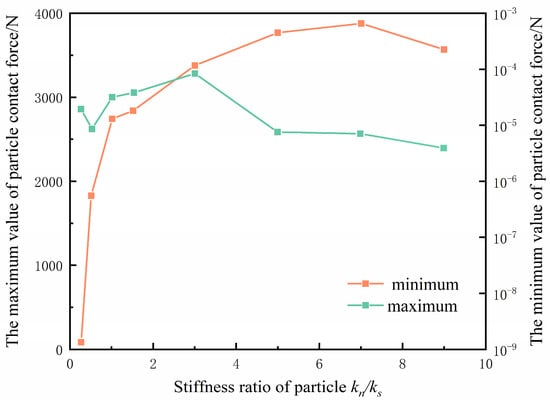
Figure 13.
The change in stress chain with different particle stiffness ratios.
Mechanically, the marginalized impact of the stiffness ratio () on the CBR value arises because the penetration process is predominantly governed by shear failure and particle rearrangement rather than elastic deformation. In dense granular assemblies, such as graded crushed stone, contact stiffness dictates the initial compressive response but exerts negligible influence on the ultimate bearing capacity, which is fundamentally controlled by frictional resistance. For tunnel slag, the inherent angularity of the particles promotes geometric interlocking, further subordinating the role of the stiffness ratio to behaviors driven by surface roughness and friction. Furthermore, the spatial influence of these stiffness parameters coincides significantly with the particle displacement field, suggesting that their effects are localized and constrained within the active shear zone.
The development of a particle contact number can be used to explain the evolution of the stress field in a specimen. The number of contacts seen in Figure 13 is linearly related to the stiffness ratio, and the slope of the front section is large, while the rear section is small, taking = 3 as the boundary. This is mainly caused by the superposition of the increase of the stress field range and the increase in each gradient value. Moreover, the increase in stiffness ratio not only enhances contact rigidity, but may also lead to an increase in the number of contact points between particles. As particle deformation decreases, more contact points can form, leading to a rise in contact numbers. Changes in stiffness ratio may also affect the meso-structure of the material, altering the arrangement and contact modes between particles, which, in turn, results in an increase in contact points. A higher stiffness ratio implies more efficient force transmission between particles, allowing a greater number of particles to engage in contact, thus further increasing the contact number. This suggests that in the studied system, as the stiffness ratio of the particles increases, the mode of particle interaction shifts, and the contact number grows accordingly.
In the CBR test, particle interactions play a crucial role in determining the material’s bearing capacity and deformation resistance. These interactions involve the formation and transmission of contact forces through force chains, with friction forces limiting particle movement and enhancing stiffness. The particle stiffness, both in the normal and tangential directions, influences the efficiency of force transmission and deformation control, while the compaction process improves particle arrangement and density, reducing voids. The dynamic evolution of the contact force field ensures stress distribution stability, and boundary conditions further constrain particle movement, enhancing overall material integrity. Additionally, the shape and gradation of particles impact the formation of contact points and force chains, with well-graded materials exhibiting better mechanical performance. These interaction mechanisms ensure efficient stress transfer and deformation coordination, providing a solid foundation for the use of graded crushed stone in highway engineering.
4.1.2. Friction Coefficient
The particle friction coefficient had a great influence on the macroscopic mechanical properties of a sample, as shown in Figure 14. The CBR values corresponding to each friction coefficient increased linearly, and the discreteness of the corresponding CBR curves was obvious. When the penetration amount was in the range of 0~1 mm, the penetration force growth paths corresponding to different were basically the same, indicating that the sample particles mainly underwent compaction and elastic deformation during this stage, and most of the contact keys had not yet entered the dynamic friction stage. Each curve was close to linear development, and the slope growth relationship can be expressed by the relationship between the corresponding CBR values. This shows that mainly affects the dynamic friction stage of relative motion between particles, which means that its influence range is highly overlapped with the range of the particle displacement field. The dominance of the friction coefficient () in influencing CBR values arises because friction directly dictates inter-particle sliding and the stability of force chains during shearing—the primary resistance mechanism in CBR tests. In contrast to the stiffness ratio, which primarily affects reversible elastic deformation, governs irreversible energy dissipation through frictional work. This leads to an enhanced load-bearing capacity in tunnel slag assemblies, where the rough, angular nature of the particles facilitates high intrinsic friction and effectively mitigates particle slippage under penetration.
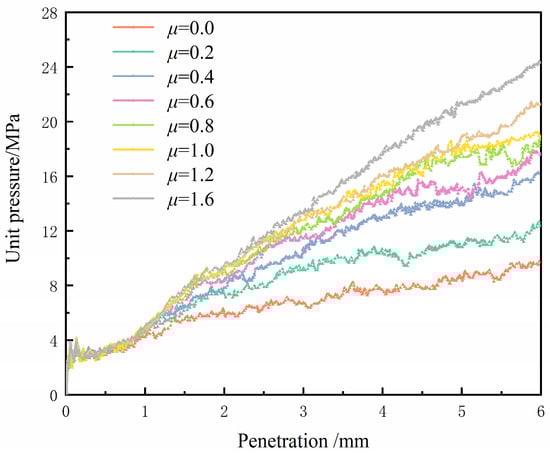
Figure 14.
CBR test results for different particle friction coefficients.
Figure 15 shows the trend of the effect of the friction coefficient on the maximum value of the contact force. The maximum contact force of particles increased linearly with an increase in , and its internal logic was basically the same as the -CBR value. The minimum contact force decreased when < 10, while the minimum value of the contact force suddenly increased when > 10. We can presume that the energy consumed by the tangential force between particles in the tangential motion increased as the friction coefficient increased, and the kinetic energy of the particles decreased accordingly, resulting in a decrease in the relative displacement of the particles. Due to the small contact area between the spherical particles, the relative friction movement of the particles was limited, so the energy consumed in the dynamic friction process was also limited.
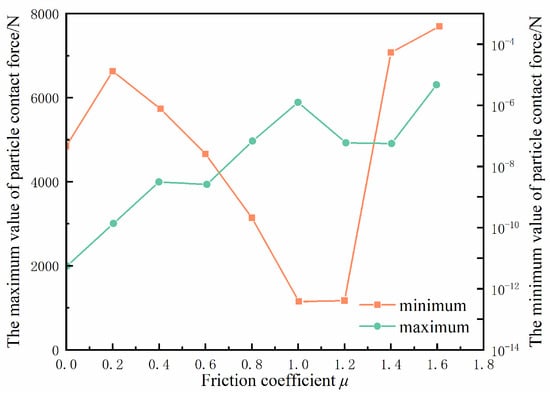
Figure 15.
The change in stress chain with different particle friction coefficients.
The relationship between the contact number and the friction coefficient can be expressed as a quadratic function opening upward, as shown in Figure 15. As the friction coefficient increases, the contact number and its rate of change decrease initially and then increase, confirming the aforementioned changes in the particle displacement field range and gradient value with increasing . This shows that when the friction coefficient increases to a certain value, its hindering effect on the development of particle displacement field cannot increase at the original rate.
4.2. Influencing Factors on the Shape of Contact Force Field
Different particle surface properties will affect the shape, size, and gradient of the particle contact force field, and then change the binding force of a sample for graded gravel. In this paper, the influence of meso-mechanical parameters of the sample particles on the contact force field of the sample particles and the constraint force of the sample is explored, by means of the stress evolution of the side plate and the bottom plate of a sample during the CBR test.
4.2.1. CBR Test and Silo Effect
The Silo Effect refers to the phenomenon when the force at the bottom of a barn is maintained at a constant value after the grain stored in the barn increases above a certain height. The principle is that under the lateral constraint condition, the friction force between grains diffuses laterally, and the vertical component is balanced by the gravity of the grains. This phenomenon is closely related to the surface properties of particles and walls.
In the CBR test, the constraint environment of the sample is similar to that of the barn, but the upper part does not increase the vertical force of the particles in the sample by increasing its height, but by means of the vertical movement of the penetration rod and the loading plate. So, the correlation between the meso-mechanical parameters of particles and the barn effect is examined. The investigation is carried out using the evolution process of the normal force on the side plate and the bottom plate, and the ratio change is analyzed.
Figure 16 records the ratio of the force between the side plate and the bottom plate during the test, and the contact force of the side plate is the average force of the two sides. The force of the side plate increased rapidly until the penetration was about 0.5 mm, and there was an obvious peak in the curve, which reflects that the particles of the sample were obviously squeezed to both sides by the penetration behavior; meanwhile, the horizontal force chain expanded in the upper part of the sample. Subsequently, tangential failures of particle contact bonds began to occur. The particles produced downward displacement, and the sample was vertically penetrated by a force chain, causing the penetration force to be directly transmitted to the bottom plate, resulting in a rapid drop in peak value. The curve then rose in a parabolic shape, indicating that the growth rate of lateral constraint force was relatively high.
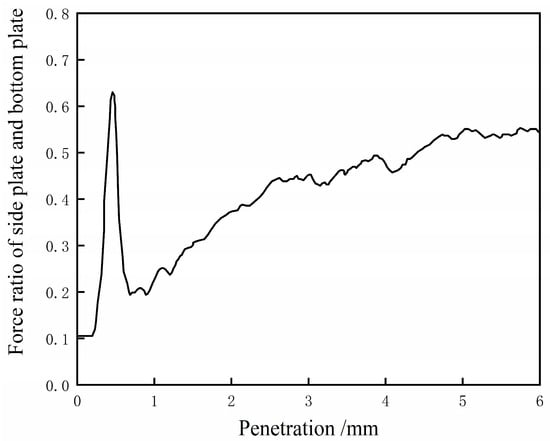
Figure 16.
The evolution of the normal force ratio between the side plate and the bottom plate of the sample cylinder.
4.2.2. Stiffness Ratio
Similar to the lack of significant change in the CBR value when adjusting the stiffness ratio, the particle stiffness ratio had no substantial effect on the boundary stress of the sample, as shown in Figure 17. The discreteness of each force curve was relatively small, further indicating that the normal stiffness of particles had no significant adjustment effect on the shape of the contact force field.
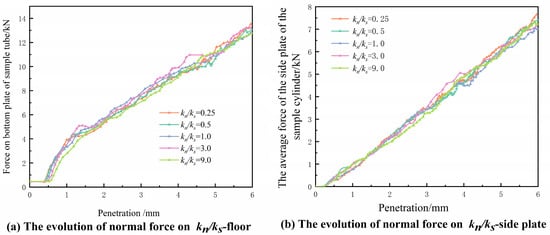
Figure 17.
The evolution of the normal force on the boundary of the sample corresponding to different .
Figure 18 shows the variation in the ratio of the side plate to the bottom plate with a varying stiffness ratio. With an increase in , the ratio decreased first and then increased. When < 6, the penetration force had a greater vertical effect on the specimen, and the contact force of the bottom plate increased positively with an increase in the normal stiffness. The growth rate of the side plate force was significantly smaller than that of the bottom plate. When > 6, the force growth rate of the side plate increased, and the lateral range and gradient growth rate of the contact force field in the sample increased significantly.
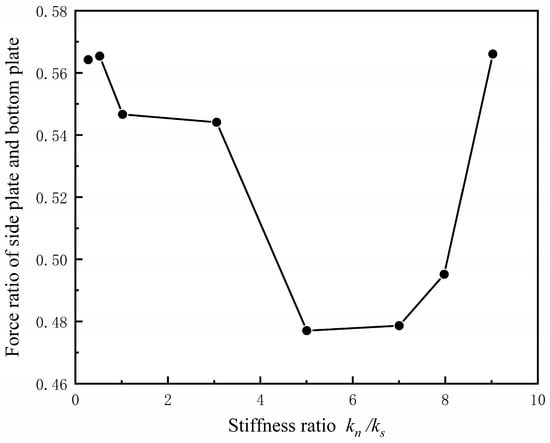
Figure 18.
The change in the ratio of the normal force on the side plate and the bottom plate of the sample cylinder with .
4.2.3. Friction Coefficient and Boundary Force
It can be clearly seen that the stress curves of the bottom plate and the side plate corresponding to different friction coefficients changed obviously, and the absolute value of the slope of each curve increased positively with the friction coefficient from Figure 19. According to the slope, the force curve of the side plate could be divided into two groups. The corresponding curves with friction coefficient values of 0.0 and 0.2 were close, and the trend of other variable groups was similar, which might be caused by the nonlinear relationship between the friction coefficient and the side plate force in this interval.
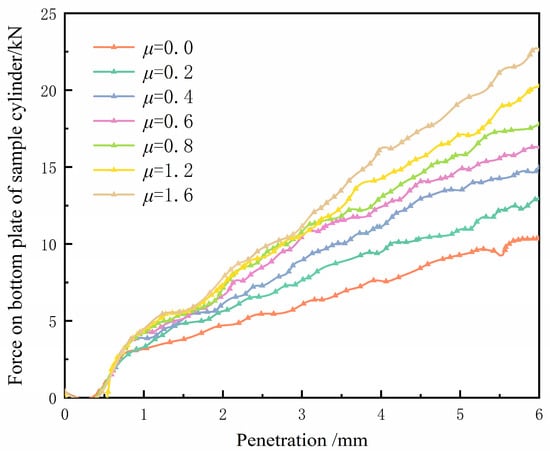
Figure 19.
The evolution of the boundary stress of the specimen corresponding to different .
Observing the force ratio curve of the wall in Figure 20, it can be fitted by a linear function with a negative slope, indicating that had a great influence on the force of the constrained wall of the specimen, and the two were linearly related. The curve showed that with an increase in , the shape of the contact force field of the sample tended to develop vertically, and the vertical slenderness ratio increased linearly. An increase in would make the work carried out by the penetration force on the particles more consumed in the dynamic friction behavior at the mesoscopic level, thus changing the influence range and gradient value of the contact force field.
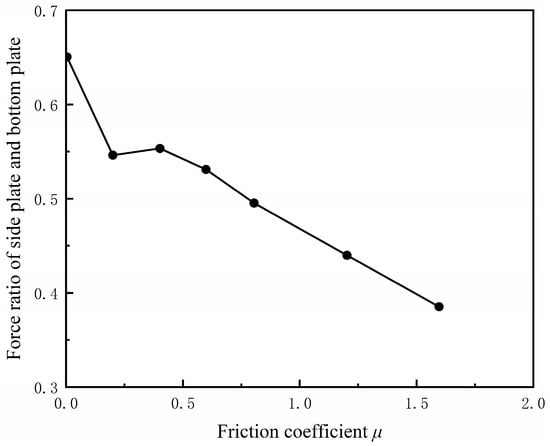
Figure 20.
The change in the ratio of the normal force on the side plate and the bottom plate of the sample cylinder with μ.
4.3. Discussion
In this paper, PFC is used to simulate the CBR test of tunnel waste slag graded gravel, and its penetration process and meso-mechanical parameters are analyzed. These results are consistent with the research results of Jiang et al. (2011) [28] and Peng et al. (2019) [29]. This not only proves the accuracy of this study, but also provides a reference for the application and theoretical research of graded crushed stone made of tunnel slag.
Moreover, this study presents several distinct perspectives, as follows:
(a) When the penetration depth reaches 2.5 mm, the force applied to the limestone graded crushed stone studied by Jiang et al. approaches 50 MPa, while this study reports a force of less than 10 MPa at the same penetration depth. This indicates that the road performance of the graded crushed stone derived from tunnel slag is not sufficiently superior.
(b) During the penetration process described in this study, the displacement of the sample exhibits minimal change, and the difference between horizontal and vertical displacements is not significant. In comparison, the force applied by Jiang et al. is greater than that applied in this study under the same conditions, resulting in a larger vertical displacement than horizontal displacement.
The differences in displacement behavior between this study and Jiang et al.’s can be attributed to several factors, as follows: force levels, particle stiffness and friction, boundary conditions, and the efficiency of force chain development. In this study, lower applied force, higher stiffness, or a more compact sample likely led to smaller displacements, with minimal differences between horizontal and vertical movement. In contrast, Jiang et al.’s study, with higher force and different boundary constraints, allowed more pronounced vertical displacement. This indicates that force chain dynamics play a central role in the CBR testing process, determining the material’s load-bearing capacity, deformation characteristics, and stability. By analyzing the formation, evolution, fracture, and reorganization of force chains, a deeper understanding of the stress transfer mechanisms in granular materials can be achieved. These findings provide important theoretical foundations and practical guidance for the gradation design, construction control, and shear stability optimization of pavement materials. The tunnel slag aggregates achieved a CBR of 117.56% at 2.5 mm penetration, surpassing the standard requirement of 100% for high-grade pavement bases. When benchmarked against the limestone results reported by Jiang et al. (2015) [27], our material shows a marginal performance deficit; however, this gap could be narrowed to less than 10% through optimized gradation and compaction strategies. While the current DEM validation is robust, the reliance on a single laboratory test remains a limitation. Future investigations involving multiple replicates are necessary to further substantiate these findings and address the inherent uncertainties in the meso-mechanical responses of recycled geomaterials.
In the investigation of meso-mechanical parameters, this study demonstrates that varying stiffness ratios have minimal impact on the CBR curves and values, which aligns with the findings of Ren (2012) [30]. However, Peng et al. (2019) [29] suggest that while stiffness ratio has no significant effect on CBR curves, CBR values may be slightly influenced. In Jiang et al.’s study, the contact force was found to be greater, whereas in this paper (Figure 8), the force had not fully developed by the time the penetration depth reached 6 mm. This phenomenon indicates that, in CBR tests, the overall mechanical behavior of the material is more significant than local stiffness variations, which is why the stiffness ratio has a limited impact on CBR curves. Although CBR values may exhibit minor fluctuations, these differences primarily stem from variations in stress distribution and compaction under different stiffness conditions. Furthermore, the incomplete development of contact force at a penetration depth of 6 mm may result from elastic recovery, nonlinear material responses, or particle rearrangement during the initial stages of penetration. While the 6 mm penetration limit may not fully capture mature force chain states or late-stage particle breakage, it remains sufficient for identifying primary mechanical trends given the robust validation up to the critical 5 mm threshold. Although this constraint might slightly underrepresent long-term pavement stability, the current depth provides a reliable basis for meso-mechanical analysis, with deeper simulations reserved for future model enhancement. In practical engineering applications, it is essential to consider both macro- and meso-level characteristics to more accurately predict the mechanical performance of subgrades.
A key factor contributing to these differences lies in the variety of graded gravel types. Limestone, as a widely used engineering material in roadbed and pavement construction, exhibits superior mechanical properties. In contrast, tunnel waste slag, which is derived from construction debris, has a comparatively less favorable mechanical performance. Nonetheless, its application in engineering not only reduces costs, but also promotes environmental sustainability—one of the innovative aspects of this study. Beyond the material type, the gradation of the gravel also plays a crucial role in influencing mechanical behavior. For instance, Liu et al. (2022) [25] studied the discontinuous gradation design of phosphate tailings–graded waste rock mixture, and concluded that when the coarse polymer M1 (19–31.5 mm)/M2 (9.5 to 19 mm)/M3 (4.75–9.5 mm) = 21:49:30, it can form the best main skeleton. The gradation used in this study is M1/M2/M3 = 3:32:65, and the mechanical properties of the samples prepared accordingly are bound to be different. The optimization of gradation enhances the material’s density, stability of the force chain, and frictional contact strength, thereby improving its load-bearing capacity and shear strength at the meso-mechanical level. Consequently, the performance enhancement is not solely due to differences in particle size; rather, the optimized particle proportions create a better force transfer network and stress distribution, reducing the risk of failure and increasing the overall stability of the material. These meso-mechanical mechanisms elucidate why the performance of samples with optimized gradation exceeds that of non-optimized gradation. These findings provide practical guidance for pavement design by emphasizing compaction to minimize voids and gradation optimization to enhance interlocking. For tunnel slag reuse, preserving particle angularity during processing boosts the friction coefficient (), enabling eco-friendly base layers that meet highway standards (CBR > 80%). Our results show that properly graded and compacted slag achieves CBR values exceeding 110%, confirming its suitability for high-grade highway bases. Consequently, designers should select slag with high surface roughness and prioritize compaction effort to maximize bearing capacity, minimize settlement, and support sustainable resource utilization.
A limitation of this DEM study is the assumption of uniform particle characteristics, which overlooks the inherent variability of recycled tunnel slag. In reality, slag exhibits heterogeneous mineral compositions, angularity, and absorption rates. This simplification may lead to an overestimation of CBR values, potentially causing challenges such as uneven field compaction or reduced long-term durability. To bridge this gap, future research should incorporate stochastic properties through site-specific testing and explore mitigation strategies, such as blending or chemical stabilization, to ensure the reliability of ecological reuse in infrastructure.
While our simulations offer insights into meso-scale mechanisms—such as force chain evolution and displacement fields—these interpretations currently lack direct physical verification. Although similar DEM frameworks have been validated using X-ray computed tomography (CT) and digital image correlation (DIC) (e.g., Ji et al., 2020 [24]), our claims remain primarily based on numerical outputs. Our macro-scale CBR validation provides indirect support, yet future experimental work utilizing advanced imaging is warranted to fully substantiate these meso-mechanical interpretations and confirm the predicted force distributions.
5. Conclusions
In this paper, the discrete element method is used to simulate the CBR test, and the formation of force chains and displacement fields is analyzed during the CBR test process. The influence of two meso-mechanical parameters, the particle stiffness ratio and the friction coefficient , on the CBR test results and the contact force field is determined.
(1) The force chain starts to develop from the contact particles at the bottom of the penetration rod, and the time to pass through a compaction stage in the initial stage is needed. As the penetration rate increases, a conical compression solid appears at the bottom of the sample, and the overall integrity of the compression solid will continue to be strengthened due to boundary conditions and increased particle density.
(2) According to the results of multiple sets of orthogonal tests, the CBR curves and CBR values corresponding to different do not change much, and it can be considered that there is no significant effect on macroscopic CBR performance, despite observable meso-level variations in force chains and contact numbers, while is linearly positively correlated with the CBR value. Specifically, the range of the contact force field decreases first and then increases with an increase in .
(3) The mechanism of particle stiffness ratio on the contact force field shape of the sample is analyzed. That is, the slenderness ratio of the contact force field increases first and then decreases with an increase in the normal stiffness, with as the boundary.
(4) The influence logic of on the contact force field of the sample is relatively clear, which is to work by changing the tangential resistance strength of the contact key and the external force required for the damage of the contact key. Further analysis reveals that the slenderness ratio () of the contact force field decreases as the friction coefficient () increases. To validate these meso-scale DEM predictions and minimize interpretive speculation, future research should integrate physical verification techniques, such as X-ray CT for internal force chain imaging and Digital Image Correlation (DIC) for surface deformation tracking. At a minimum, high-speed imaging or strain measurements should be employed to observe physical deformation patterns and corroborate the numerical outputs.
Author Contributions
Conceptualization, J.C., H.L. and X.Z.; Methodology, X.W. and J.C.; Software, J.C.; Investigation, L.S.; Resources, X.W., L.S. and X.Z.; Data curation, H.L., L.S. and X.Z.; Writing—original draft, H.L.; Visualization, X.W. All authors have read and agreed to the published version of the manuscript.
Funding
The research in this paper is supported by National Key Research and Development Projects (211221220042), General Fund of National Natural Science Foundation of China (52178310) and Natural Science Basic Research Plan in Shaanxi Province of China (2016NY-218).
Data Availability Statement
The California Bearing Ratio (CBR) test results, particle size distribution data, and photographs of graded crushed stone samples derived from tunnel slag of the Huizhou–Qingyuan section of the Shanzhan Expressway (western Guangdong, China). Due to confidentiality agreements with the project owner, the raw laboratory data cannot be made publicly available.
Conflicts of Interest
The authors declare that they have no known competing financial interests or personal relationships that could have appeared to influence the work reported in this paper.
References
- Deng, C.; Jiang, Y.; Zhang, Y.; Yi, Y.; Tian, T.; Yuan, K.; Fan, J. Mechanical properties and influencing factors of vertical-vibration compacted unbound graded aggregate materials. Transp. Geotech. 2021, 28, 100538. [Google Scholar] [CrossRef]
- Jing, C.; Shi, W.; Wang, N.; Xue, Z.; Zhao, Q.; Meng, X. Laboratory investigation of solid wastes combined with tunnel slag in cement stabilized base of asphalt pavement. Constr. Build. Mater. 2023, 392, 131807. [Google Scholar] [CrossRef]
- Ou, Y.; Tian, G.; Chen, J.; Chen, G.; Chen, X.; Li, H.; Liu, B.; Huang, T.; Qiang, M.; Satyanaga, A.; et al. Feasibility Studies on the Utilization of Recycled Slag in Grouting Material for Tunneling Engineering. Sustainability 2022, 14, 11013. [Google Scholar] [CrossRef]
- Tang, Y.; Qiu, W.; Liu, D.; Zhang, W.; Zhang, R. Experimental Study on the Properties of Mortar and Concrete Made with Tunnel Slag Machine-Made Sand. Materials 2022, 15, 4817. [Google Scholar] [CrossRef] [PubMed]
- Wang, F.; Meng, F.; Feng, T.; Wang, Y.; Jiang, J.; Shi, J. Effect of stone powder content on the mechanical properties and microstructure of tunnel slag aggregate-based concrete. Constr. Build. Mater. 2023, 388, 131692. [Google Scholar] [CrossRef]
- Chen, X.B. Study of dilatancy effect of redstong coarse grained soil by large sacle triaxial tests. Chin. J. Rock Mech. Eng. 2010, 29, 3145–3149. [Google Scholar]
- Hardin, B.O.; Kalinski, M.E. Estimating the shear modulus of gravelly soils. J. Geotech. Geoenviron. Eng. 2005, 131, 867–875. [Google Scholar] [CrossRef]
- Indraratna, B.; Ionescu, D.; Christie, H.D. Shear behavior of railway ballast based on large-scale triaxial tests. J. Geotech. Geoenviron. Eng. 1998, 124, 439–449. [Google Scholar] [CrossRef]
- Indraratna, B.; Nimbalkar, S.; Coop, M.; Sloan, S.W. A constitutive model for coal-fouled ballast capturing the effects of particle degradation. Comput. Geotech. 2014, 61, 96–107. [Google Scholar] [CrossRef]
- Du, T.; Wang, W.; Liu, Z.; Lin, H.; Guo, T. The complete stress-strain curve of recycled aggregate concrete under uniaxial compression loading. J. Wuhan Univ. Technol.-Mater. Sci. Ed. 2010, 25, 862–865. [Google Scholar] [CrossRef]
- Mendoza, C.; Caicedo, B. Elastoplastic framework of relationships between CBR and Young’s modulus for fine grained materials. Transp. Geotech. 2019, 21, 100280. [Google Scholar] [CrossRef]
- Montes-Arvizu, M.E.; Chavez-Alegria, O.; Rojas-Gonzalez, E.; Gaxiola-Camacho, J.R.; Millan-Almaraz, J.R. CBR predictive models for granular bases using physical and structural properties. Appl. Sci. 2020, 10, 1414. [Google Scholar] [CrossRef]
- Ma, Q.; Hu, Z.; Hu, Z.; Li, J. Strength characteristics and micro-scale mechanism of high liquid limit clay treated by recycled construction and demolition wastes (CDW) aggregates. Constr. Build. Mater. 2022, 332, 127367. [Google Scholar] [CrossRef]
- Narzary, B.K.; Ahamad, K.U. Estimating elastic modulus of California bearing ratio test sample using finite element model. Constr. Build. Mater. 2018, 175, 601–609. [Google Scholar] [CrossRef]
- Shaban, A.; Cosentino, P. Characterizing structural performance of unbound pavement materials using miniaturized pressuremeter and California bearing ratio tests. J. Test. Eval. 2017, 45, 818–834. [Google Scholar] [CrossRef]
- Shan, Y.; Shu, Y.; Zhou, S. Finite-infinite element coupled analysis on the influence of material parameters on the dynamic properties of transition zones. Constr. Build. Mater. 2017, 148, 548–558. [Google Scholar] [CrossRef]
- Zhang, P.; Gao, Z.; Shi, Y.; Lin, Y.; Li, J. Effect of large broken stone content on properties of roller compacted concrete based on fractal theory. Constr. Build. Mater. 2020, 262, 120821. [Google Scholar] [CrossRef]
- Li, N.; Ma, B.; Wang, H.; Sun, W. Development of elasto-plastic constitutive model for unbound granular materials under repeated loads. Transp. Geotech. 2020, 23, 100347. [Google Scholar] [CrossRef]
- Li, S.; Hao, P. Stress dependent and redistribution behaviour of unbound granular material. Int. J. Pavement Eng. 2020, 21, 347–356. [Google Scholar] [CrossRef]
- Xu, X.F.; Wei, H.Z.; Meng, Q.S.; Wei, C.; Ai, D. Effects of shear rate on shear strength and deformation characteristics of coarse-grained soils in large-scale direct shear tests. Chin. J. Geotech. Eng. 2013, 35, 728–733. [Google Scholar]
- Yuan, J.; Huang, X.M. Resilient deformation behavior of unbound stone aggregates. J. Chang’an Univ. (Nat. Sci. Ed.) 2007, 27, 29–33. [Google Scholar]
- Yue, X.; Wu, G.; Jiang, S.; Xie, X.; Xie, Y.; Meng, J. Analysis of granular mechanical parameters characteristics in graded gravel triaxial test. Environ. Earth Sci. 2024, 83, 357. [Google Scholar] [CrossRef]
- Talukdar, D.K. A study of correlation between California Bearing Ratio (CBR) value with other properties of soil. Int. J. Emerg. Technol. Adv. Eng. 2014, 4, 559–562. [Google Scholar]
- Ji, X.; Li, J.; Cui, Z.; Li, S.; Xiong, Y.; Hu, J.; Jiang, Y. A Prediction Method for the California Bearing Ratio of Soil-Rock Mixture Based on the Discrete Element Method and CT Scanning. Adv. Civ. Eng. 2020, 2020, 9794756. [Google Scholar] [CrossRef]
- Liu, Z.; Li, J.; Zhao, Q.; Wang, J.; Liu, T.; Zhang, Q. Gradation Design of Phosphorus Tailing–Graded Waste Rock Subgrade Filling Using Discrete Element Method. Minerals 2022, 12, 573. [Google Scholar] [CrossRef]
- Hu, Z.; Liu, H.; Zhang, W.; Hei, T.; Ding, X.; Dong, Z. Evaluation of CBR of graded crushed stone of flexible base structural layer based on discrete element model. Materials 2022, 16, 363. [Google Scholar] [CrossRef]
- Jiang, Y.; Wong, L.N.Y.; Ren, J. A numerical test method of California bearing ratio on graded crushed rocks using particle flow modeling. J. Traffic Transp. Eng. (Engl. Ed.) 2015, 2, 107–115. [Google Scholar] [CrossRef]
- Jiang, Y.; Ren, J.; Xu, Y.; Li, D. Simulation Method of Mechanical Properties of Graded Broken Stone Based on Particle Flow Code. J. Tongji Univ. (Nat. Sci. Ed.) 2011, 39, 699–704. [Google Scholar]
- Peng, A.P.; Li, L.; Zhang, Z. Study on the meso-mechanical behavior of California bearing ratio of graded gravel with discrete element method. J. Railw. Sci. Eng. 2019, 16, 2467–2474. [Google Scholar]
- Ren, J.L. CBR Simulation Test Method of Graded Broken Stone and Its Appliance. Master’s Thesis, Chang’an University, Xi’an, China, 2012. [Google Scholar]
Disclaimer/Publisher’s Note: The statements, opinions and data contained in all publications are solely those of the individual author(s) and contributor(s) and not of MDPI and/or the editor(s). MDPI and/or the editor(s) disclaim responsibility for any injury to people or property resulting from any ideas, methods, instructions or products referred to in the content. |
© 2025 by the authors. Licensee MDPI, Basel, Switzerland. This article is an open access article distributed under the terms and conditions of the Creative Commons Attribution (CC BY) license.