Article

Carbonated Aggregates and Basalt Fiber-Reinforced Polymers: Advancing Sustainable Concrete for Structural Use

1
Department of Civil and Environmental Engineering, Brunel University of London, London UB8 3PH, UK
2
College of Built Environment, Birmingham City University, Birmingham B4 7BD, UK
3
Division of Civil Engineering, School of Engineering and Design, College of Technology and Environment, London South Bank University, London SE1 0AA, UK
4
Department of Civil Engineering, Jerash University, Jerash 26150, Jordan
*
Author to whom correspondence should be addressed.
Buildings 2025, 15(5), 775; https://doi.org/10.3390/buildings15050775
Submission received: 3 February 2025 / Revised: 23 February 2025 / Accepted: 23 February 2025 / Published: 26 February 2025
(This article belongs to the Topic Green Construction Materials and Construction Innovation)

Abstract

In the transition towards a circular economy, redesigning construction materials for enhanced sustainability becomes crucial. To contribute to this goal, this paper investigates the integration of carbonated aggregates (CAs) and basalt fibre-reinforced polymers (BFRPs) in concrete infrastructures as an alternative to natural sand (NS) and steel reinforcement. CA is manufactured using accelerated carbonation that utilizes CO2 to turn industrial byproducts into mineralised products. The structural performance of CA and BFRP-reinforced concrete simply supported slab was investigated through conducting a series of experimental tests to assess the key structural parameters, including bond strength, bearing capacity, failure behavior, and cracking bbehaviour. Carbon footprint analysis (CFA) was conducted to understand the environmental impact of incorporating BFRP and CA. The results indicate that CA exhibits a higher water absorption rate compared to NS. As the CA ratio increased, the ultrasonic pulse velocity (UPV), compressive, tensile, and flexural strength decreased, and the absorption capacity of concrete increased. Furthermore, incorporating 25% CA in concrete has no significant effect on the bond strength of BFRP. However, the load capacity decreased with an increasing CA replacement ratio. Finally, integrating BFRP and 50% of CA into concrete slabs reduced the slab’s CFA by 9.7% when compared with steel-reinforced concrete (RC) slabs.

1. Introduction

As the construction industry transitions to a circular economy, there is a need for re-engineering construction materials to make them more sustainable. This can contribute to the reduction of embodied carbon that is associated with the manufacturing and use of construction materials. Cement and concrete production accounts for 5 to 8% of global greenhouse gas emissions, with an annual CO2 production of 2.2 Gt [1]. Thus, reducing concrete’s carbon footprint is crucial for achieving the net-zero targets by 2050.
The use of sustainable construction materials has become an attractive subject, focusing on enhancing performance while reducing environmental impact. In recent decades, research on the replacement of natural coarse aggregate (NCA) and natural sand (NS) with recycled coarse aggregate (RCA) from construction and demolition waste (CDW) has become increasingly popular. This trend is primarily driven by CDW, which accounts for approximately 36% of total waste generated [2]. Although some studies suggest that the use of CDW has negligible influence on mechanical properties [3], most studies indicate that using CDW as a primary aggregate replacement reduces both strength and durability [4,5,6,7,8,9,10]. This is due to the quality of the RCA varies significantly depending on the source material and the processing methods used. Variations in attached mortar, contaminants, and the particle size distribution lead to inconsistencies in concrete’s mechanical properties. To offset the negative impact of CDW as a replacement material, studies have looked at treatment methods of removing the old, adhered mortar [11] and strengthening the old, adhered mortar [12].
Recently, the accelerated carbonation of recycled aggregates has been an alternative solution to improve the sustainability of concrete [13,14,15,16,17]. Scanning Electron Microscopy (SEM) analysis of accelerated carbonation of recycled aggregates also showed that there was a positive impact on the microstructure of concrete due to the improved performance of the adhered mortar near the new interfacial transition zone, which led to improved mechanical properties and shrinkage behaviors [18].
One of the primary causes for the deterioration of reinforced concrete structures is the corrosion of the reinforcements, which leads to cracking, spalling of the concrete cover, and severe structural deficiencies, particularly in aggressive environmental conditions [19,20,21,22,23,24,25]. Even in moderate environmental conditions, other factors such as increased exposure to de-icing salts and higher pollution levels may lead to reinforcement corrosion. Therefore, there is an imminent need to improve the durability and service life of these structures. There are various techniques to mitigate reinforcement corrosion, including sealants, surface membranes, increased concrete cover thickness, cement inhibitors, and reinforcement coatings [26,27,28,29]. However, these measures may not be efficient in aggressive corrosive conditions. Consequently, several studies have explored the feasibility of using stainless steel (SS) as an alternative reinforcement material due to its enhanced durability and reduced life-cycle costs [30,31,32,33,34]. Stainless steel reinforcement offers a long-lasting solution compared to conventional carbon steel, although its high initial cost restricts its widespread application. In this context, fiber-reinforced polymer (FRP) reinforcement has emerged as a promising alternative for RC applications, offering excellent corrosion resistance at a significantly lower cost and weight compared to stainless steel and enhancing the longevity and sustainability of concrete structures [35,36,37,38,39,40,41,42,43,44].
Fiber-reinforced polymer (FRP) reinforcements include commonly used glass (GFRP) and carbon (CFRP) composites, as well as a more recent type made from basalt fibers known as BFRP. BFRP is manufactured by melting crushed volcanic rock to produce basalt fibers (BFs) [45]. Notably, BFRP is distinguished by its exceptional resistance to corrosion and heat, lightweight properties (approximately one-third that of steel), and superior strength relative to steel and GFRP. Moreover, BFRP stands out as an environmentally friendly, non-toxic construction material with exceptional resilience against deterioration in alkaline environments, surpassing other types of FRPs [46]. Additionally, the production process for BFs is simpler and requires less energy compared to glass fibers, and they can be easily recycled, unlike GFRP or CFRP, which necessitates high temperatures and/or chemicals for recycling [47]. Life-cycle analysis (LCA) studies showed that BFRP bars have a significantly lower global warming potential (excluding transportation), measured in kg CO2eq, by around 74%, 49%, 88%, and 44% for carbon steel, galvanised steel, stainless steel, and Glass FRP, respectively [48].
More recently, there has also been research conducted to further reduce the embodied carbon content through the mineral carbonation of industrial waste. One such waste material is cement kiln dust (CKD). CKD, a byproduct of OPC production, is removed at kiln temperatures of 800 °C to 1000 °C [49]. CKD contains alumina, silica, calcium oxide, alkalis, and sulphates, and its compositions are often comparable to ordinary Portland cement (OPC). Nevertheless, CKD has far more alkalis and sulphates than OPC, and large quantities are produced and sent to landfills [50]. CKD can be used as cement replacement, however. The compressive strength of the resultant concrete decreases as the replacement ratio of CKD increases [51]. For example, with 10% and 40% CKD contents, the decrease in compressive strength percentage after 1 month was 15% and 44%, respectively. A novel approach to utilize cement residues, such as cement bypass and CKD, is by using CO2 to carbonate and treat the residues using accelerated carbonation technology. The technology turns the industrial byproducts into mineralized products that can be used as artificial aggregates, called carbonated aggregates (CA), to replace the natural sand in concrete. However, these aggregates differ in mechanical and physical properties from natural sand, limiting their applications to non-structural concrete such as blocks and breaks.
The novelty of this paper lies in the innovative combination of carbonated aggregates (CA) and basalt fiber-reinforced polymer (BFRP) in the structural concrete slab. This area has received limited attention in the existing literature, with most of the previous literature focusing on the material level rather than the structural level. The present study provides new insights into mechanical behavior and environmental impact, offering practical applications for designers and practitioners. The study expands the application of CA, which has traditionally been limited to non-structural concrete, by demonstrating its potential for structural use when combined with BFRP. By assessing the combined effect of these two sustainable materials, this research aims to contribute to the development of more sustainable and resilient construction applications, reducing embodied carbon and providing a sustainable alternative to traditional steel-reinforced concrete. In this paper, the structural performance of CA and the BFRP-reinforced concrete slab is investigated by conducting a series of experimental tests to assess the key structural parameters, including bond strength, bearing capacity, failure behavior, and cracking behavior. Furthermore, a carbon footprint analysis (CFA) is conducted to evaluate the contribution to the carbon footprint and the development of sustainable concrete.

2. Materials and Methods

2.1. Material Properties

The materials used in the concrete mixes include manufactured carbonated aggregate, basalt fibre-reinforced plastic rebars, natural aggregates, cement, and water.

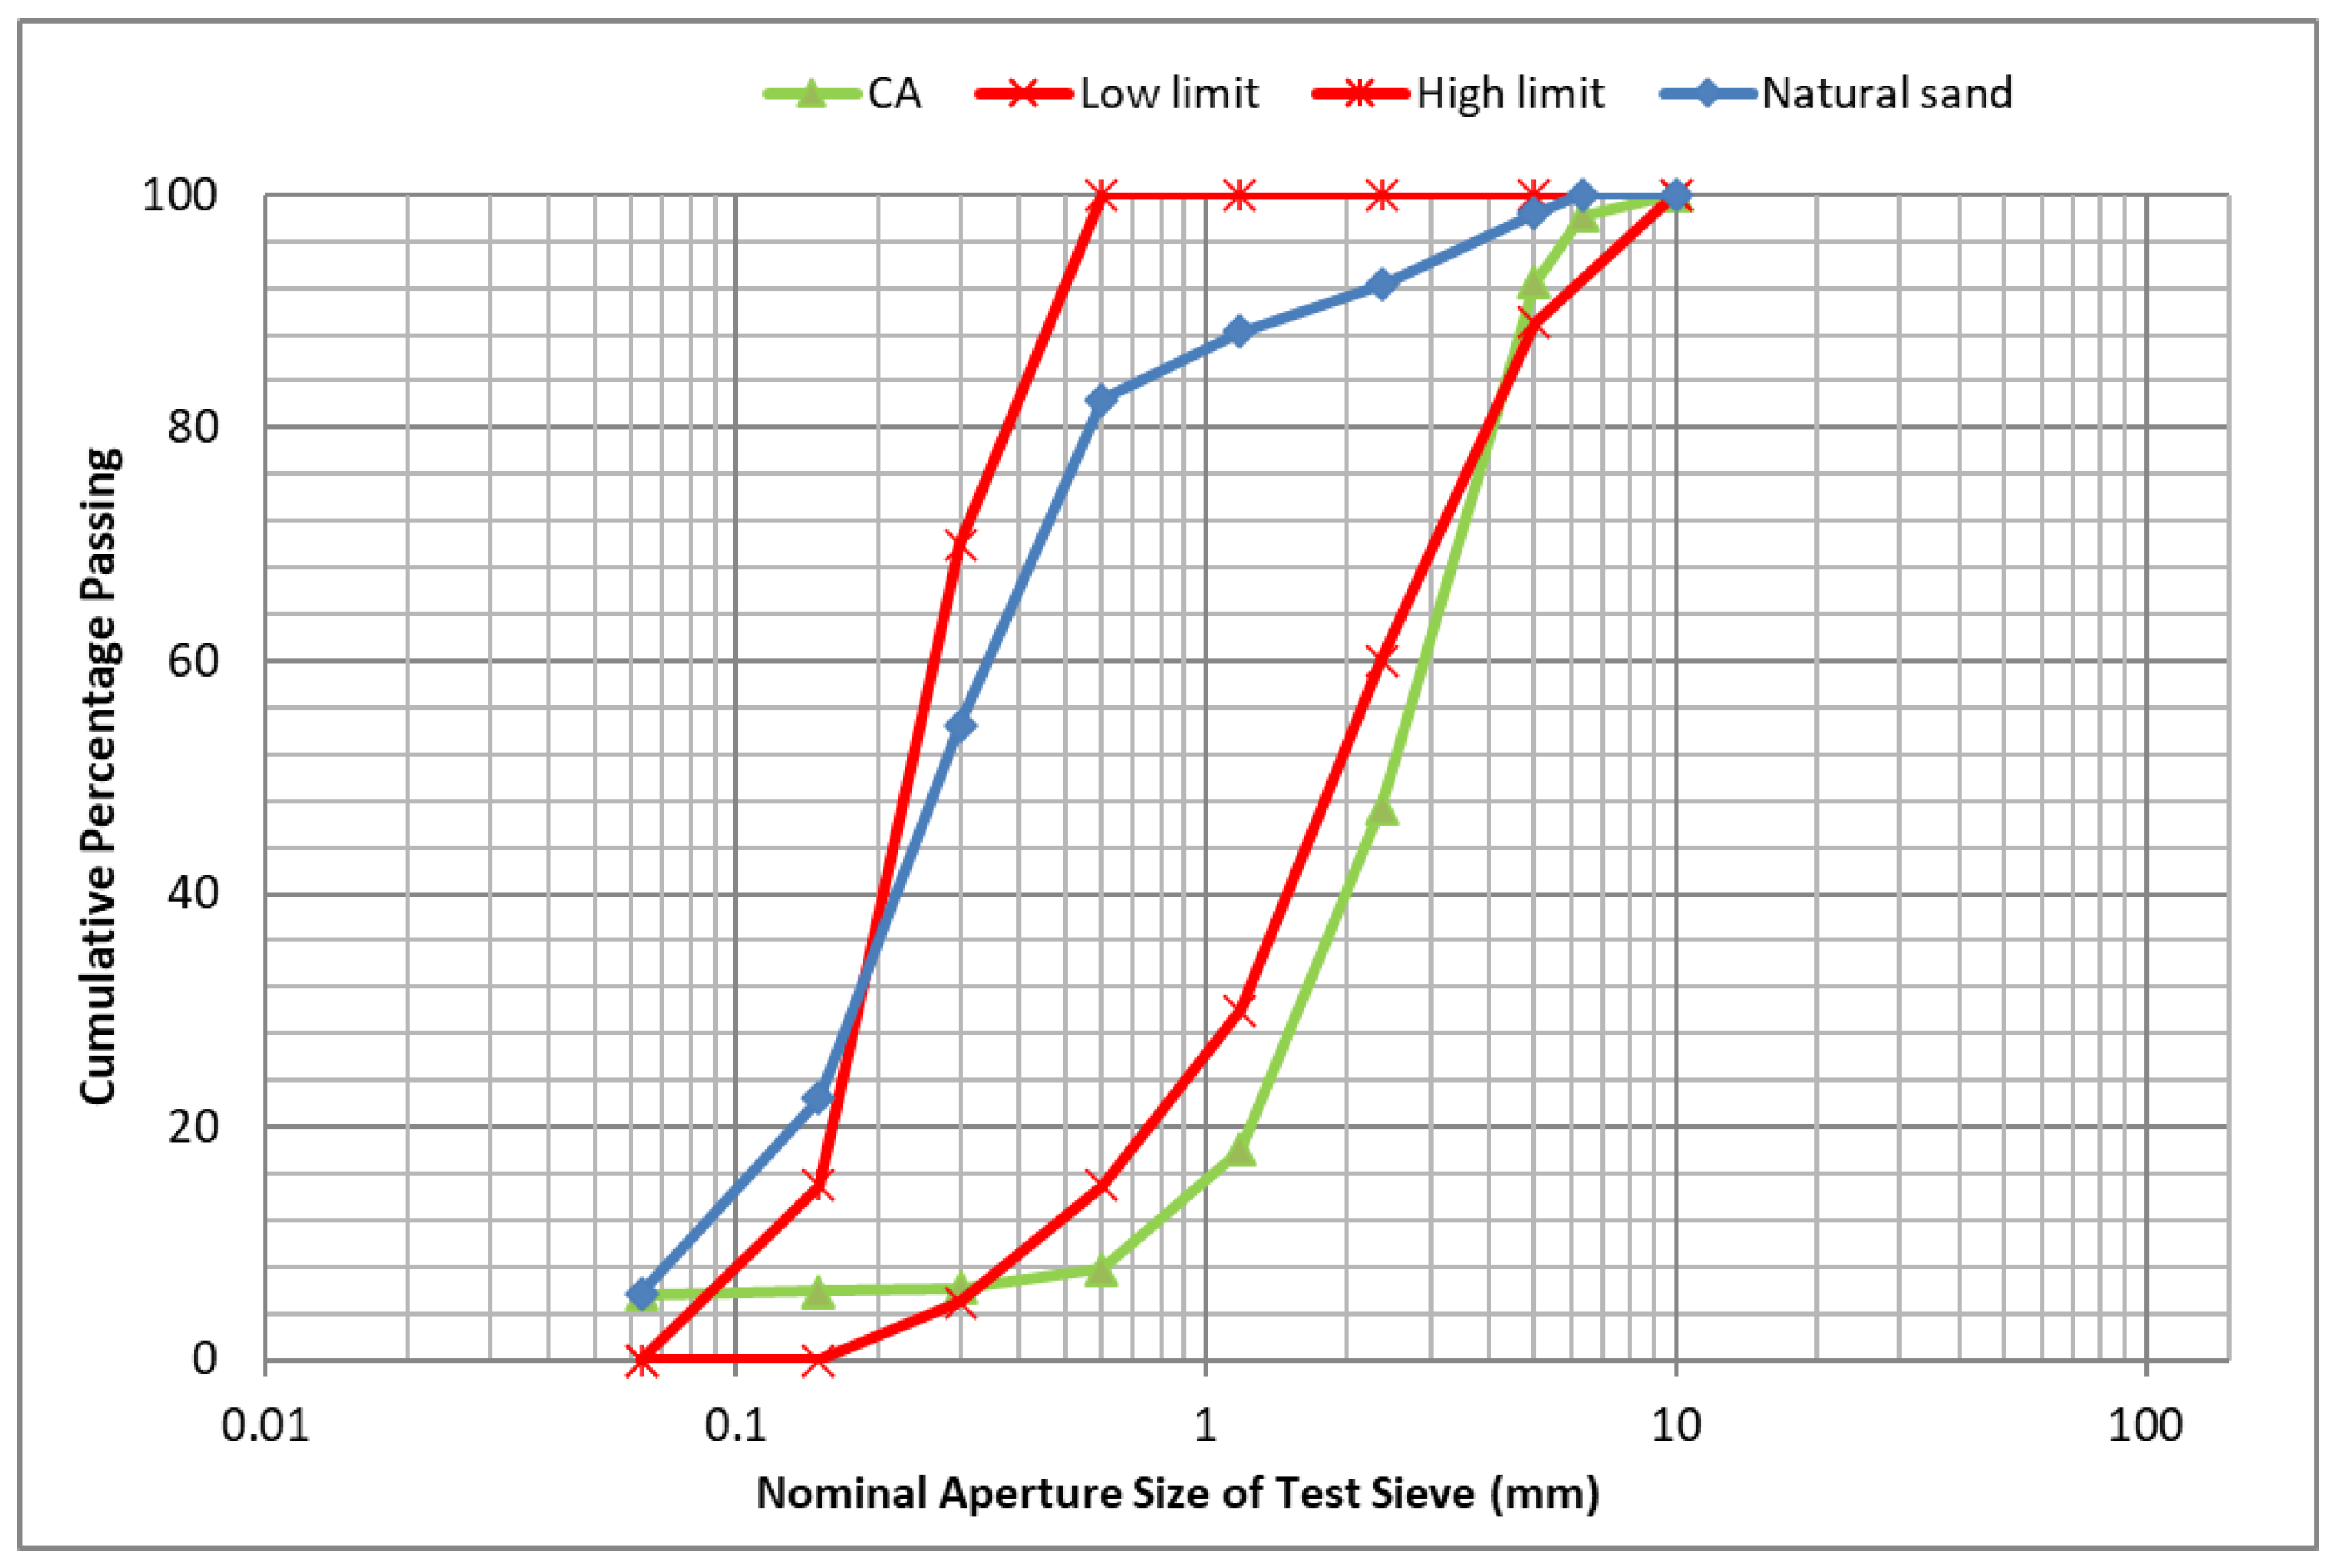
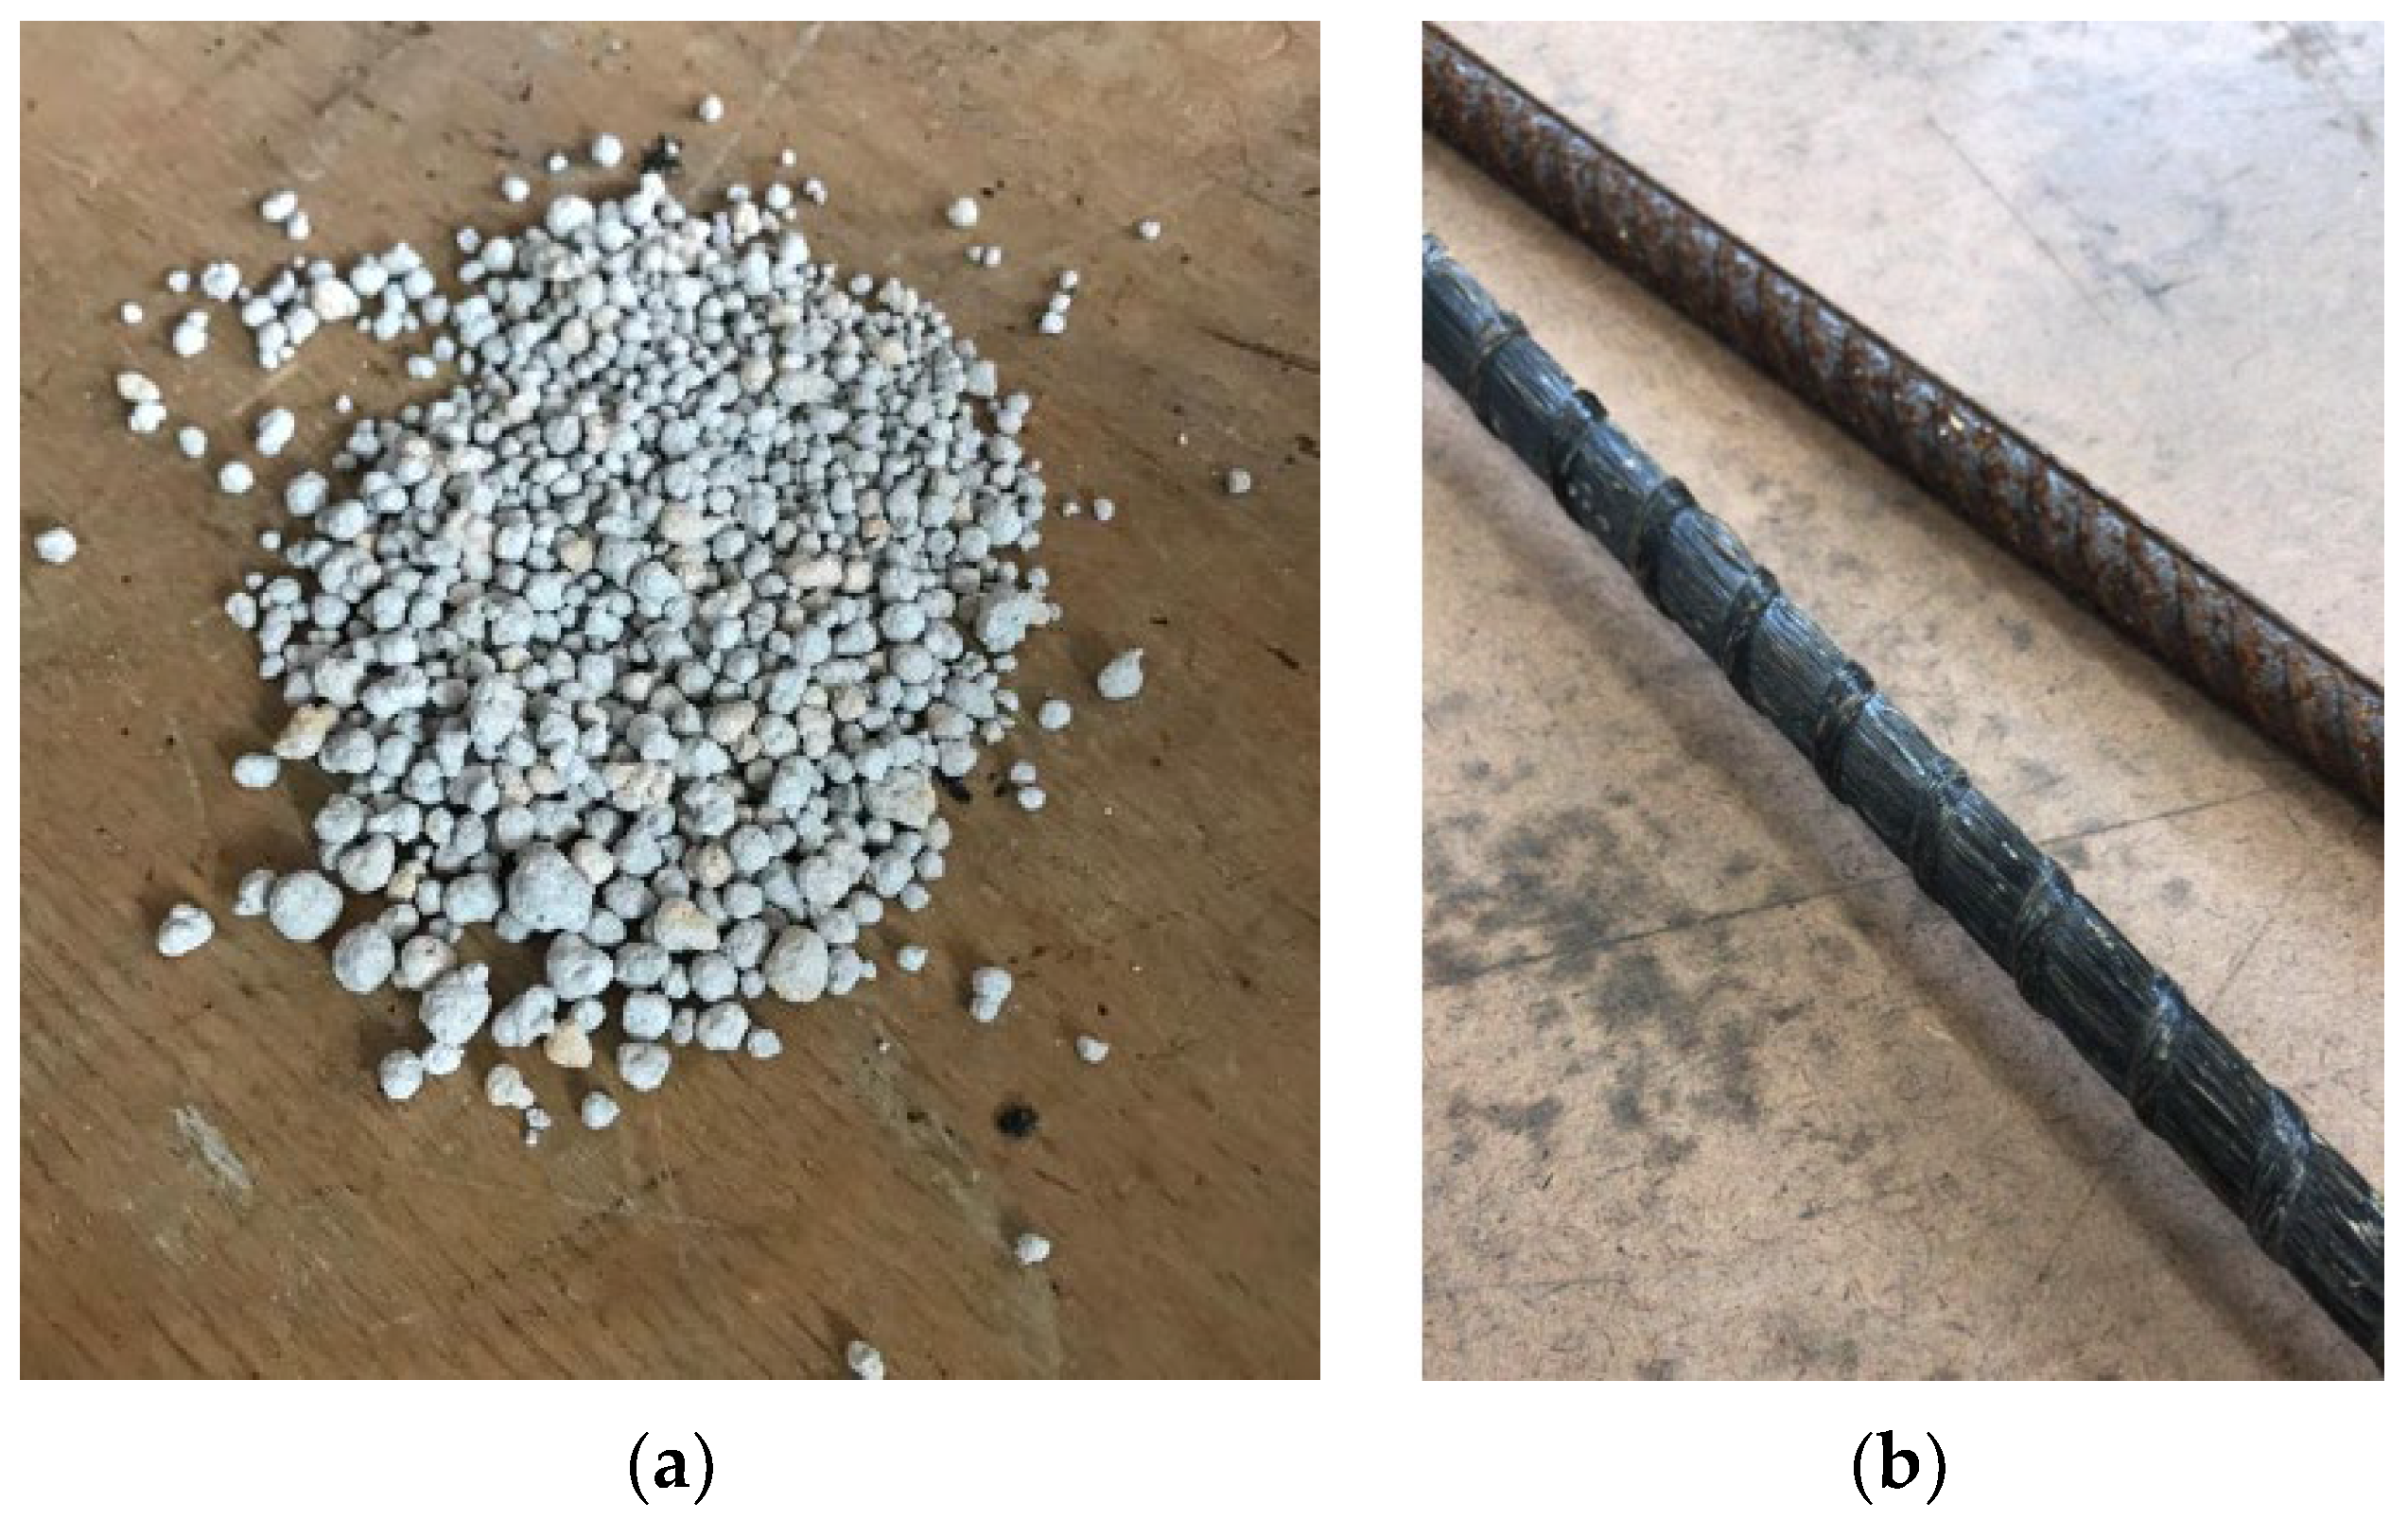
2.1.1. Carbonated Aggregates

Circabuild (the carbonated aggregates in the concrete mixes) was produced by Carbon8 Systems Limited from Cement Kiln Dust (CKD) using its accelerated carbonation technology (ACT). The ACT process regulates the condition of the reaction of mineral phases (e.g., portlandite) in CKD and the directly captured carbon dioxide (CO2) to form carbonates [52]. The carbonation reaction, a natural process associated with the weathering of ultrabasic and basic rocks, which would otherwise take millennia to complete, is accelerated by the ACT, enabling industrial residues to permanently and safely store CO2 within 15 to 20 min. The product of this process is carbonated aggregate, with a particle size of less than 5 mm, which is used as a partial replacement for natural sand in the concrete mixes.
The concrete mixture utilized natural coarse aggregate (NCA) with a maximum dimension of 10 mm, and fine aggregate sourced from the Thames River (i.e., natural sand) with a maximum dimension of 5 mm. Figure 1 displays the particle size distribution curves for both CA and natural sand, along with the upper and lower limits outlined in BS EN 933 [53]. It is noteworthy that the CA curve closely aligns with the lower limit prescribed by BS EN 933 [53]. Table 1 displays the particle density and water absorption rates of NCA, natural sand, and CA, as per the specifications outlined in BS 812 [54]. As expected, CA demonstrated a lower saturated surface dry density (SSD) and a notably higher absorption ratio compared to NCA and natural sand. Figure 2a illustrates the CA used in this study.

2.1.2. Basalt FRP

Helically wrapped BFRP rebars were used as reinforcement with a nominal diameter Ø of 10 mm, measured according to ISO 10406-1 [55]. The mechanical properties of the BFRP were also obtained by testing at least five representative samples according to ISO 10406-1 [55]. The measured ultimate tensile strength, modulus of elasticity, and ultimate strain measured were 1134 Mpa, 49.04 Gpa, and 2.31%, respectively.
The production of basalt fiber-reinforced polymer (BFRP) bars involves melting basalt rock, fiber formation, and a pultrusion process for bar creation. Basalt roving filaments are fed from reels and pre-heated to enhance epoxy resin impregnation. The resin is evenly distributed in a wetting bath, with excess removed via tensioning. The filaments are then pulled through a die box, forming the bar’s diameter, followed by ribbing through a helix system. The bar undergoes polymerization curing at 130–230 °C for about 5 min, then cooled in water. A pultrusion tractor applies tension and measures the bar length for precision cutting.

2.2. Concrete Mix Design
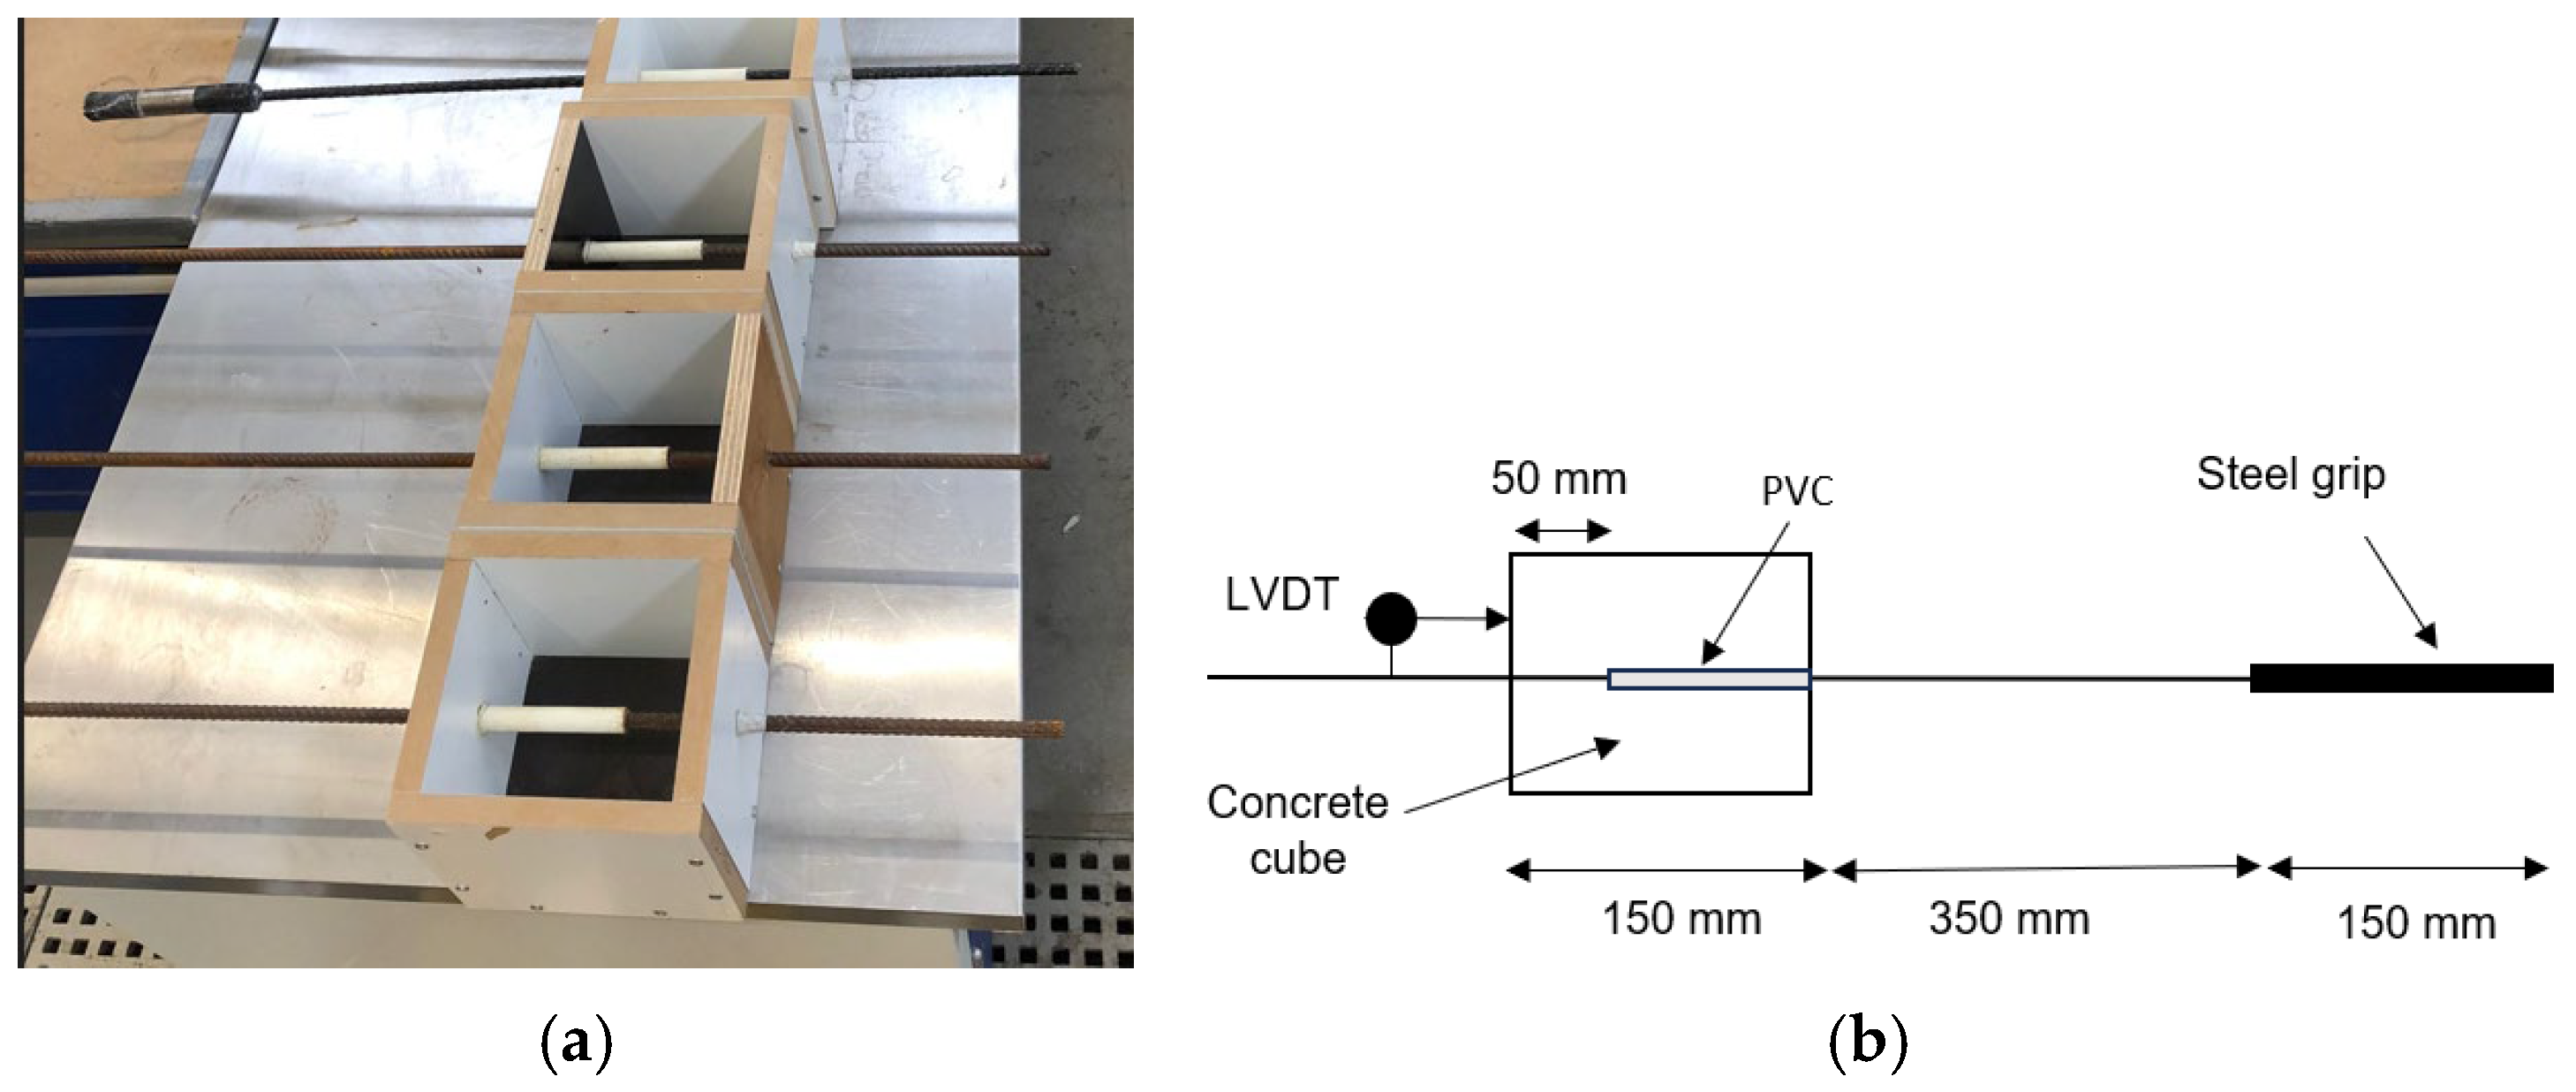
Four concrete mixes were prepared to investigate the impact of replacing natural sand with CA. Table 2 provides the mix design in kg/m3. The control mix is made from natural coarse and sand aggregates, while the 25 CA, 50 CA, and 100 CA mixes contained 20%, 50%, and 100% CA replacement ratio, respectively. All concrete mixes were prepared with a water-to-cement ratio of 0.54. To mitigate variations stemming from aggregate moisture levels, both natural coarse aggregate and sand underwent a 7-day air-drying procedure in the laboratory. A C30/37 concrete mix with a target slump of 200 mm was designed using the BRE concrete mix design method [56]. The saturated surface dry (SSD) of the aggregates was utilised in the concrete mix design, maintaining a consistent total volume of CA plus natural aggregates in one cubic meter of concrete across all mixes. Additional water was introduced to regulate the SSD condition of the CA.
To achieve the SSD state of CA, it was submerged in half of the water for 2 h. Afterward, it was mixed with the NCA and NS for 3–4 min. Ordinary Portland cement (OPC) was gradually introduced into the mixer to prevent the formation of dry clumps, and the remaining water was slowly added and mixed for 3–4 min to achieve a consistent blend. Four standard 100 mm × 100 mm × 100 mm cubes were fabricated for the compressive and ultrasonic pulse velocity (UPV) tests. Further, four cube samples were cast for the absorption capacity tests. Three Ø150 mm × 300 mm cylinders and three 100 mm× 100 mm× 500 mm prismatic beams were cast from each mix to define the splitting tensile strength (ft) and modulus of rupture (fr), according to BS EN12390 [57]. The moulds were removed the next day, and the concrete samples were placed in a curing tank at a temperature of 20 degrees Celsius. The cube, cylinder, and prismatic beam samples were tested for 28 days.

2.3. Pull-Out Tests

The bond interaction between the rebars and concrete was assessed through direct pull-out tests, adhering to the ACI 440.3R-04 standard [58], using a 150 mm cube mould. The reinforcement used in this research was Basalt FRP and steel, both with 10 mm nominal diameters (Figure 2b). The bond length was taken as 50 mm (five times the bar diameter). One hundred-millimetre-length polyvinyl chloride (PVC) pipes were placed to segregate the concrete and the bars, as illustrated in Figure 3. The bars were positioned vertically inside the mould and in the middle of the specimen, and the concrete was poured. The specimens were left to cure for 24 h in a curing room, along with five additional concrete cubes for compressive strength testing. After that, the pull-out specimens were removed from the mould and cured until the day of testing. Three pull-out specimens were prepared and tested for each CA percentage (0%, and 25%), and type of the bar (steel or BFRP) was cast and tested. In total, nine specimens were tested.

2.4. Slab Tests

In the second stage of the experimental program, four reinforced concrete slabs having various CA replacement ratios were fabricated, cast, and tested. There were three specimens reinforced with basalt FRP and one with regular steel bars as a control slab. The tested slabs were S-NS-B, S-25CA-B, S-50CA-B, and S-NS-Steel. The first letter indicates the slab “S”, the second letter indicates the natural sand “NS” or the carbonated aggregates “CA” with replacement ratio (i.e., 25 CA, and 50 CA), and the last letter refers to type of reinforcement (i.e., “B” for Basalt FRP). All the slabs had identical dimensions, with a length of 1500 mm, a width of 400 mm, and an overall depth of 150 mm. Figure 4 illustrates schematic representations of the slab specimen setup, detailing the reinforcement and geometrical aspects of the slab specimen, along with images of the slab molds showcasing the arrangement of reinforcement. The slabs underwent four-point bending tests with a clear span of 1200 mm, depicted in Figure 4b, where two-point loads (P/2) were applied. Each slab was reinforced with three 10 mm longitudinal bars, spaced 175 mm apart, which were either basalt FRP or steel. The nominal concrete cover was 25 mm. In the transverse direction, four 8 mm rebars were placed on each slab, as illustrated in Figure 4a. Besides the RC slabs, each batch also included the casting of five standard 100 mm× 100 mm× 100 mm cubes to determine the compressive strength (fc) on the day when the slabs were tested.

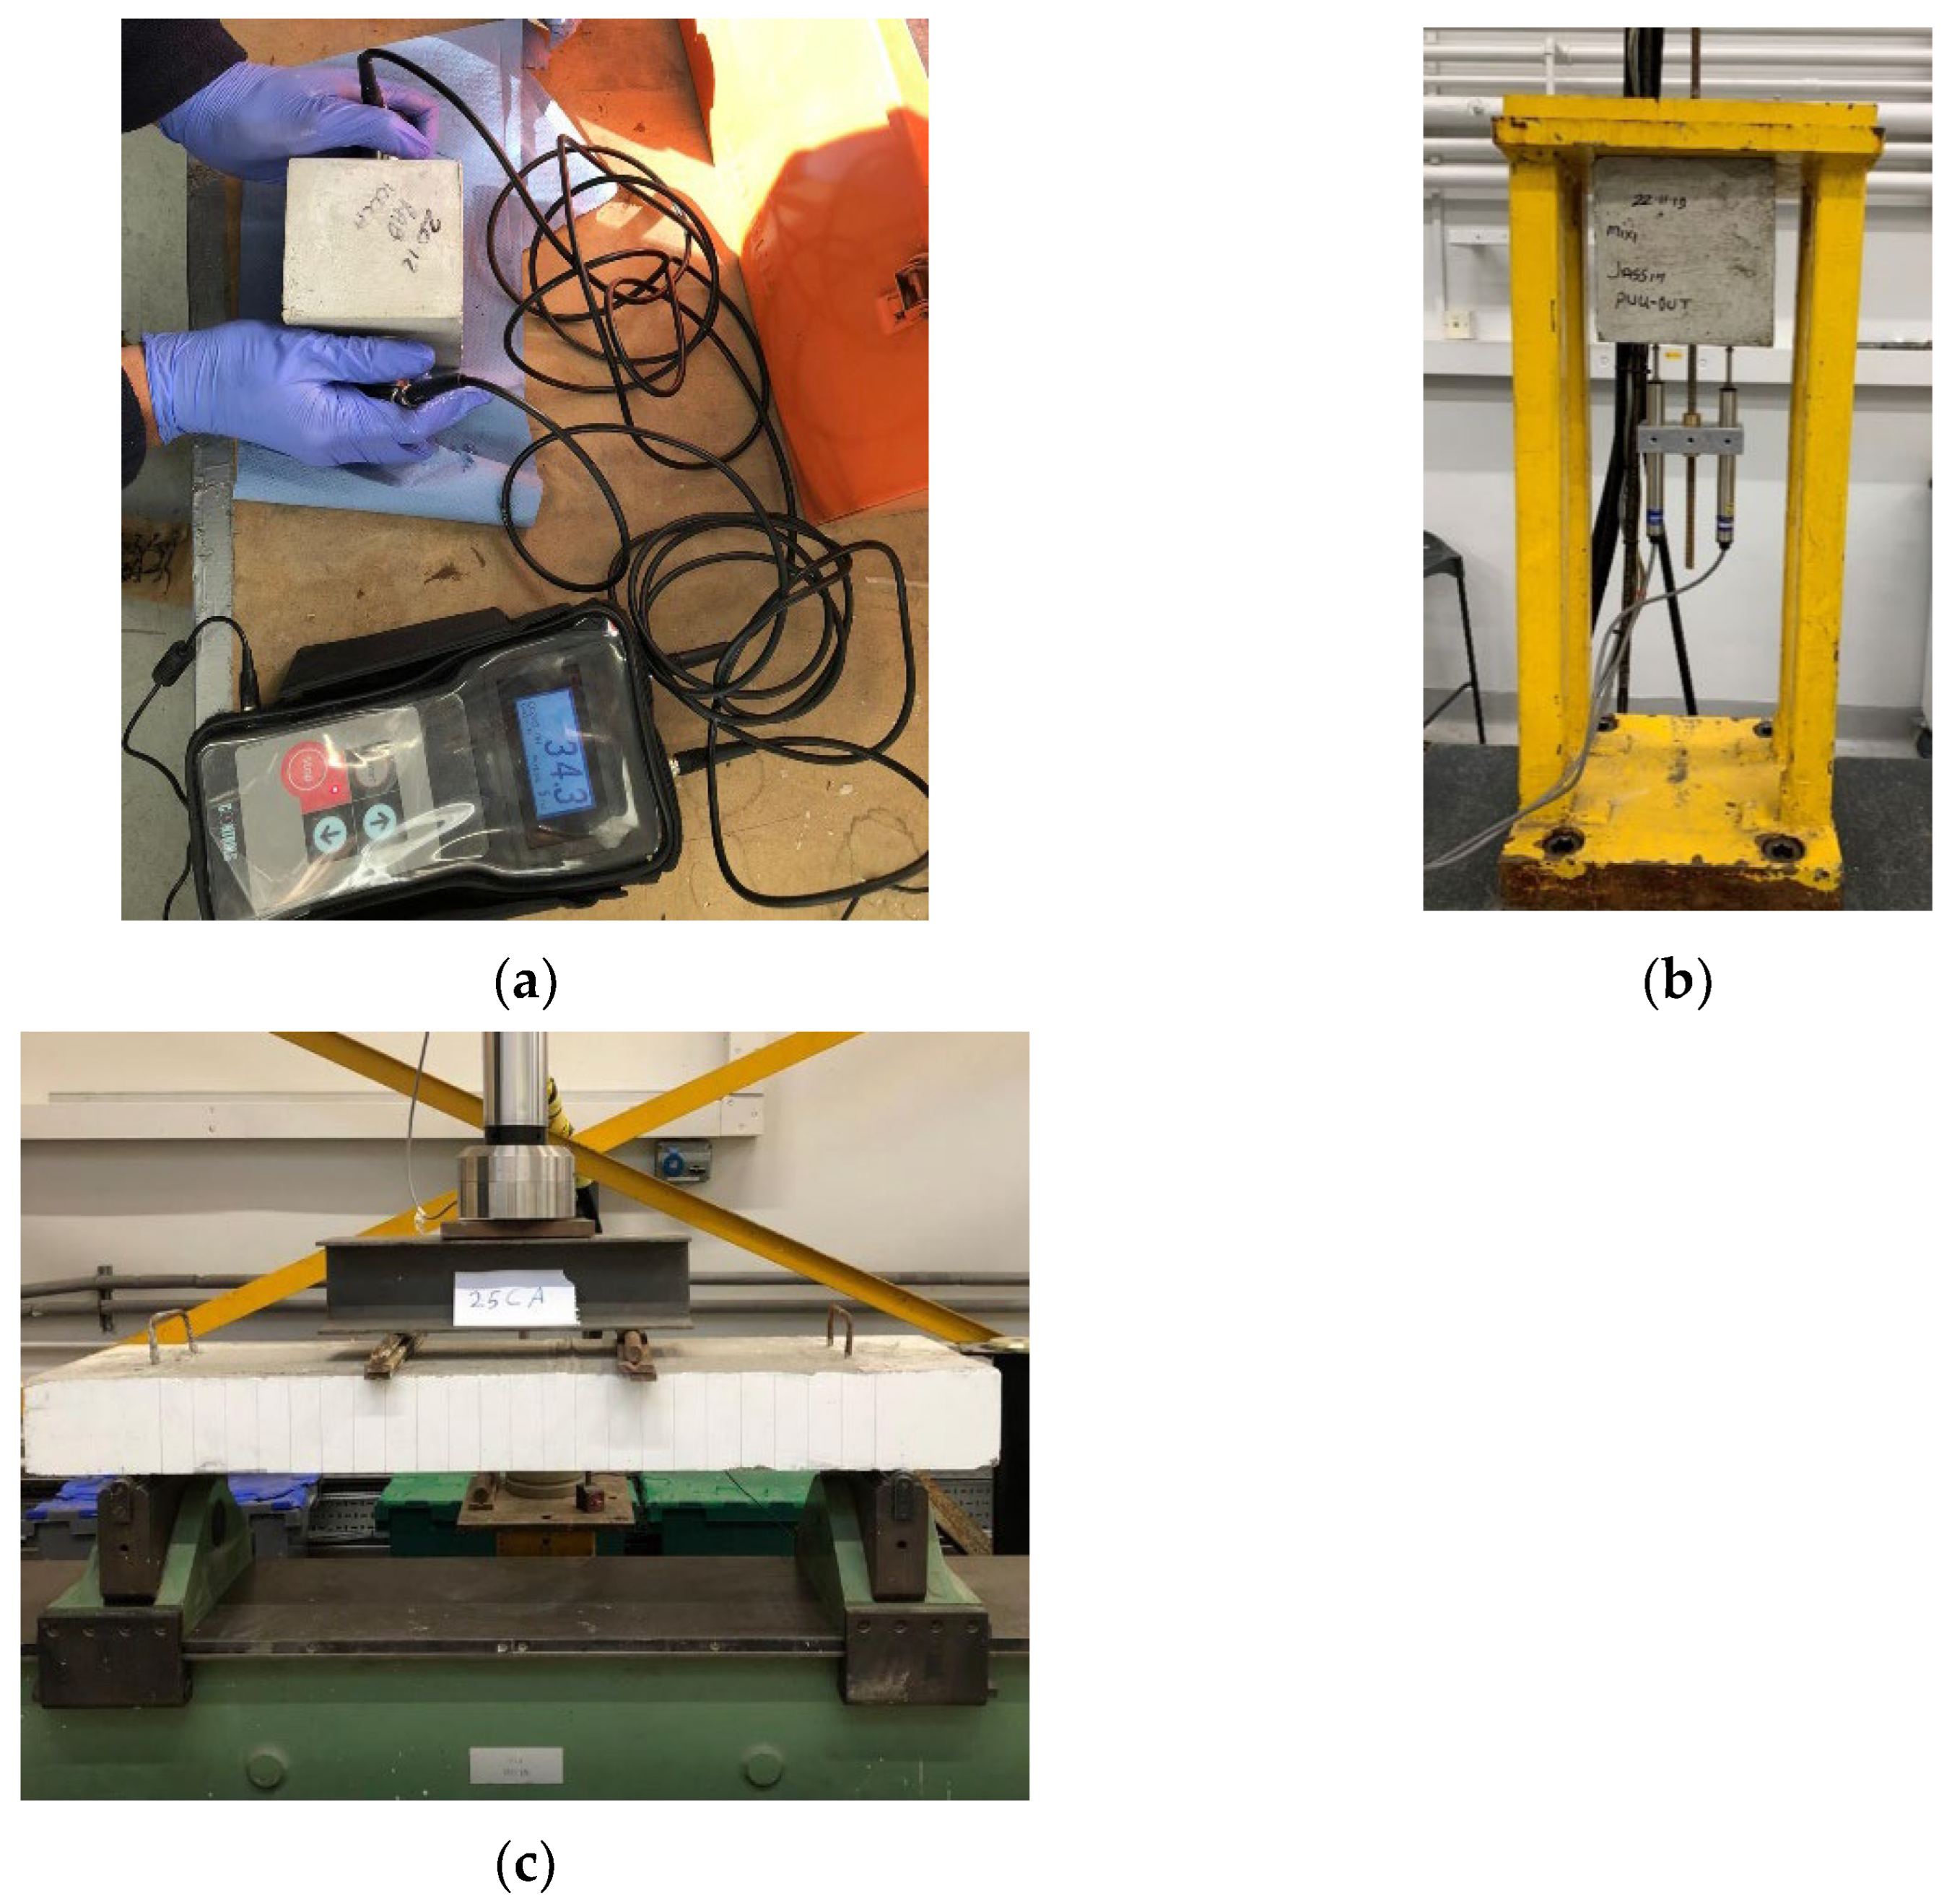
2.5. Instrumentation and Testing Procedure

In order to assess the concrete’s density, homogeneity, and internal integrity, an ultrasonic pulse velocity (UPV) test was conducted on each fully cured concrete cube, preceding the compression test (Figure 5a). This UPV test followed the direct transmission method detailed in BS EN 12504-4 [59]. During this examination, the recorded “T” (in microseconds or μs) represented the time it took for a pulse to traverse the length of the specimen, which measured 100 mm, between the transmitting transducer and the receiving transducer. This recorded time, in turn, was used to calculate the wave pulse velocity denoted as “V” (in kilometers per second or km/s), achieved by dividing the pulse’s distance by the transit time.
The setup for the pull-out test is depicted in Figure 5b. Hydraulic testing equipment with a capacity of 300 kN was used during testing. Displacement control was selected to capture post-peak behavior. The load was incrementally applied to the pull-out sample at a speed of 0.5 mm/min and monitored using the electronic load cell of the testing machine. Two linear variable differential transformers (LVDTs) were employed to measure relative displacements.
The slab testing was performed in displacement control using a hydraulic testing machine with a capacity of 500 kN, and the tests were conducted at a rate of 1 mm/min until failure (Figure 5c). The mid-span vertical deflection was recorded using a linear variable differential transducer (LVDT) while the loading was recorded. During testing, the first crack was visually observed, and the corresponding cracking load was recorded. The propagation and distribution of cracks along the length of the slabs were closely monitored and manually recorded during the tests. Upon the first visible crack in each test, loading was paused, and the crack was marked on the specimen. Testing then resumed, with additional cracks being marked at 5 kN intervals.

3. Results and Discussion

In this section, the primary findings and analysis of the test results are outlined. The effect of the carbonated aggregate replacement ratio on the physical and mechanical properties of concrete is thoroughly examined. Additionally, a detailed discussion is presented on the pull-out performance of the BFRP embedded in concrete, focusing on key performance parameters, including bonding strength and slip-bond behavior. The structural performance of the slabs in terms of cracking moment, ultimate capacity, load-deflection response, and crack patterns is discussed. Finally, the CFA has been discussed.

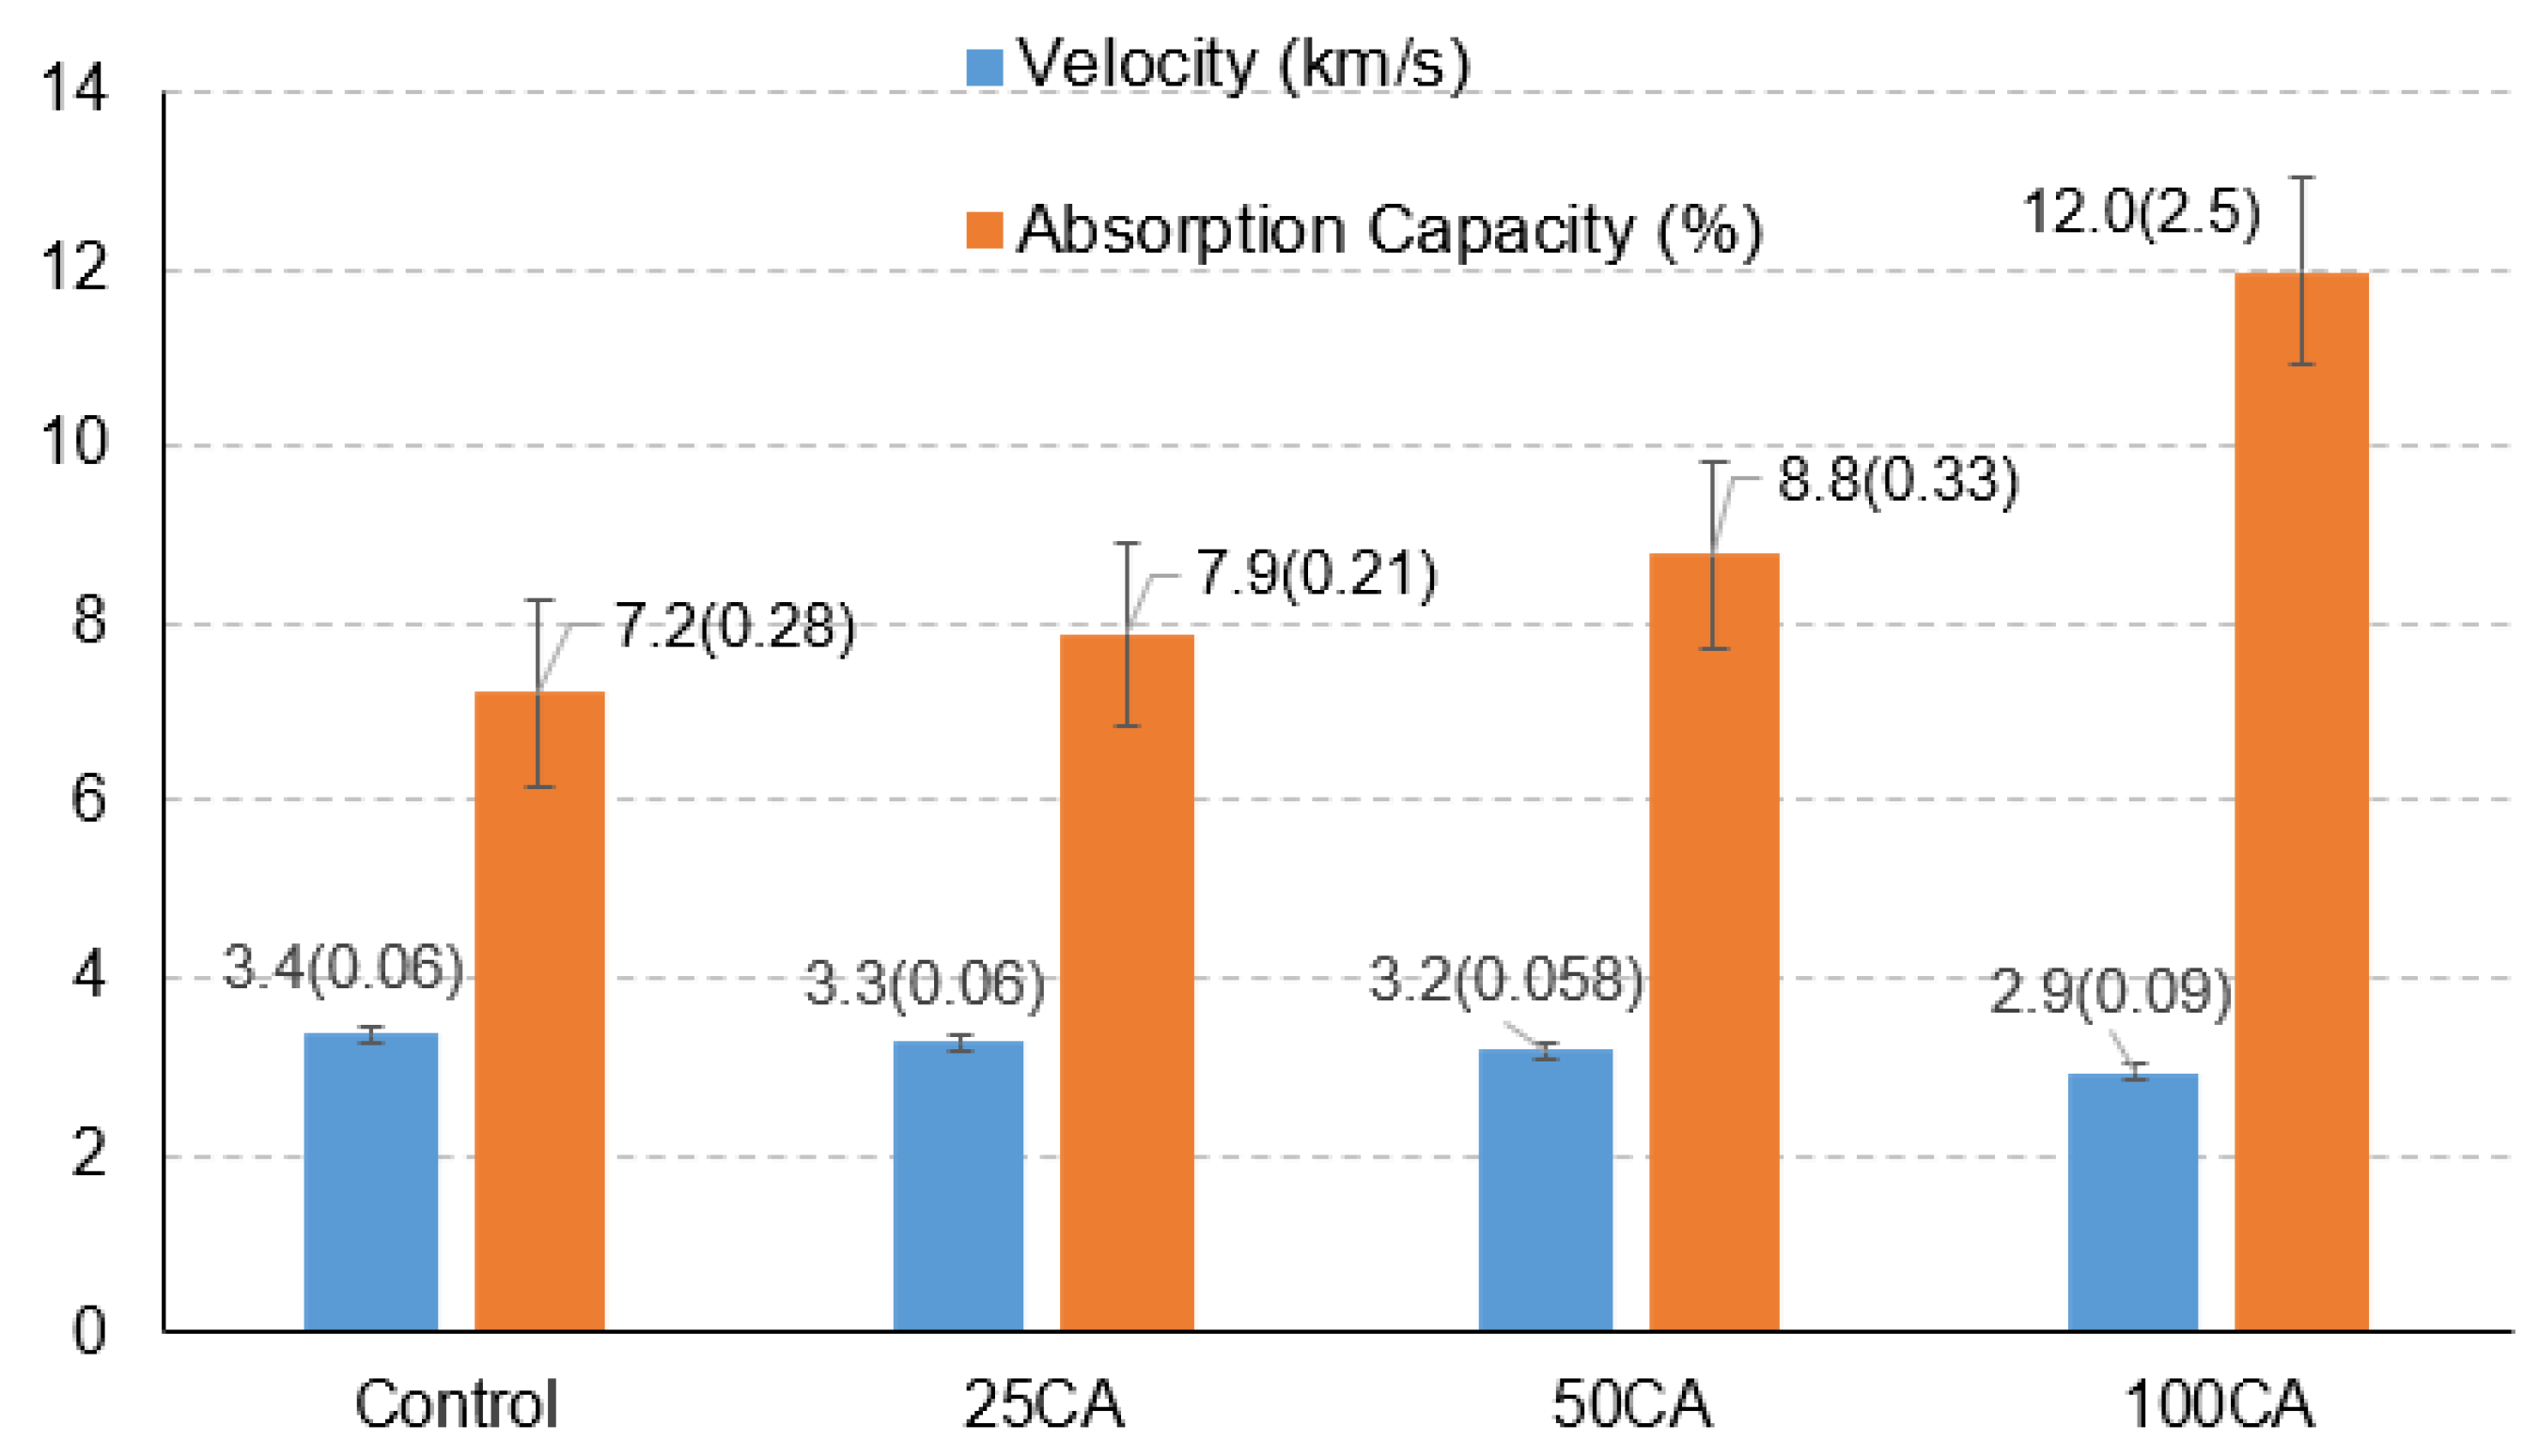
3.1. UPV and Absorption Capacity

The UPV results shown in Figure 6 indicate that the quantities of CA in the concrete mix have a significant impact on its density, porosity, and ability to transmit ultrasonic waves. Figure 6 displays the average values of the measured velocity, with the corresponding standard deviation values shown within parentheses. The results showed that pulse velocity PV reduces as the replacement ratio of CA increases. For instance, the PV for mixes with 50% and 100% CA is 4.5% and 13.3% lower than that for the control mix. The CA is a lightweight and slightly porous material, as shown in Table 3, resulting in a reduction in the UPV. There is generally an inverse relationship between UPV and absorption capacity. A similar observation was made by Räsänen et al. [60], where lower UPV values for brick samples were found to correspond to a higher water absorption capacity. The increase in porosity and voids due to the addition of CA is responsible for slowing the speed of the pulse wave, hence lower UPV values. A similar observation was found by Raza et al. [61], where the use of porous aggregates (e.g., recycled aggregates) noticeably reduces the pulse velocity, hence the quality of concrete degrades. The absorption capacity of the concrete increases with CA percentage increases. For instance, the absorption capacity of the mixes 50 CA and 100 CA is 22% and 65% higher, respectively, than that for the control mix. High absorption capacity for mixes with high CA contents is associated with high porosity of the aggregates.

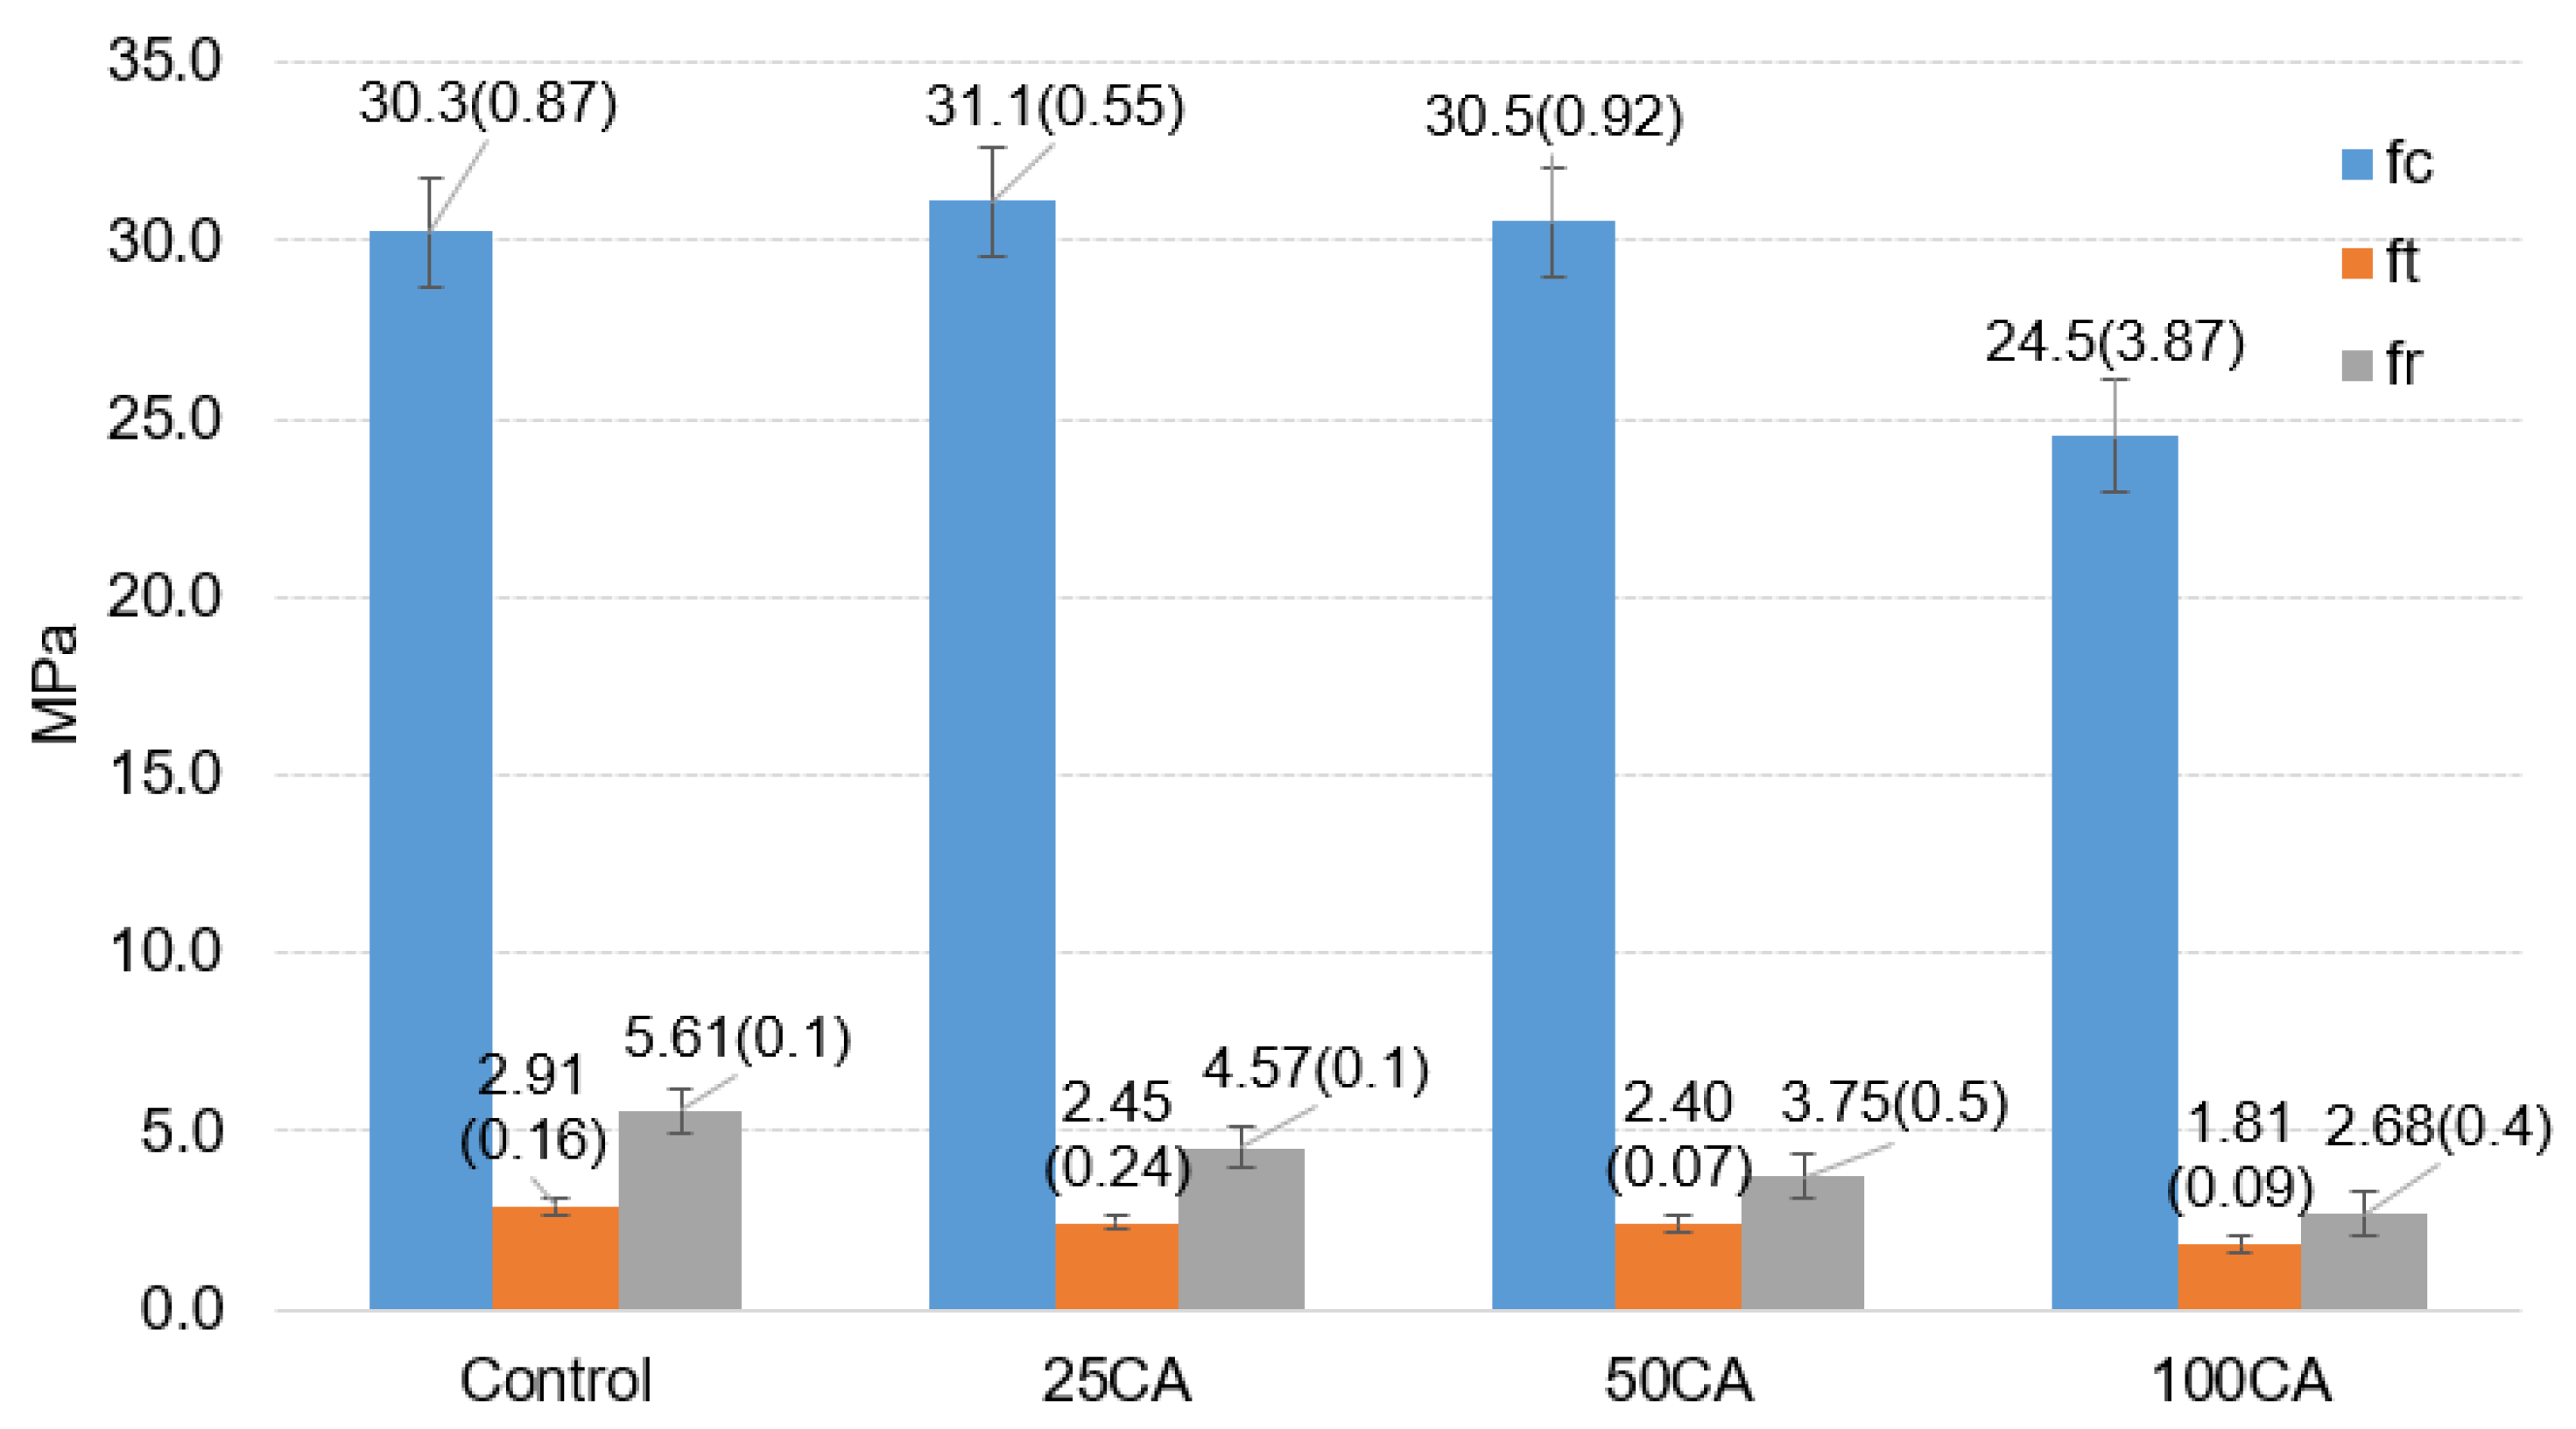
3.2. Mechanical Properties of Concrete

Figure 7 illustrates the compressive strength (fc), splitting tensile strength (ft), and rupture strength (fr) of concrete mixes after 28 days. Figure 7 displays the average values of the measured data, with the corresponding standard deviation values shown within parentheses. Results showed that 25% and 50% CA replacement increased the compressive strength by 3% and 1%, respectively, when compared to the control. Thereafter, at 100% replacement, there was a 19% decrease in strength in comparison to the control mix. When reviewing the particle distribution of NS and CA in Figure 1, NS was closer to the lower limits of the standards, while CA was closer to the upper limits of the standards. As the replacement levels increased, therefore, the particle distribution was more evenly distributed, which resulted in more pores being filled and, therefore, comparable/greater strengths at 25% and 50% replacement. At 100% replacement, the increase in CA leads to a greater quantity of larger particles, which resulted in a higher fineness modulus and created a mix in which the workability was decreased.
Similar trends were not noted for the flexural and splitting tensile strength. For these, the trends were consistent in which the strength was reduced as the replacement ratios increased. As replacement levels increased, in comparison to the control, the splitting tensile was 14%, 18%, and 38% lower, and the flexural strength was 19%, 33%, and 52% lower at 25%, 50%, and 100% replacement, respectively. Compared to NS, CA has a much smoother texture that impacts the interfacial transition zones (ITZ). This smoother surface will cause a weaker bond between the CA and cement paste. Around smooth regions of aggregates with convex and concave surfaces, anhydrous cement particles cannot pack as tightly, increasing the porosity of the ITZ microstructure [62] compared to smooth and rounded aggregates, while irregular and rough aggregates typically obstruct crack initiation and propagation more severely [63]. This, combined with the larger particles of CA, results in a lower density, greater pores, and a weaker interfacial transition zone (ITZ).

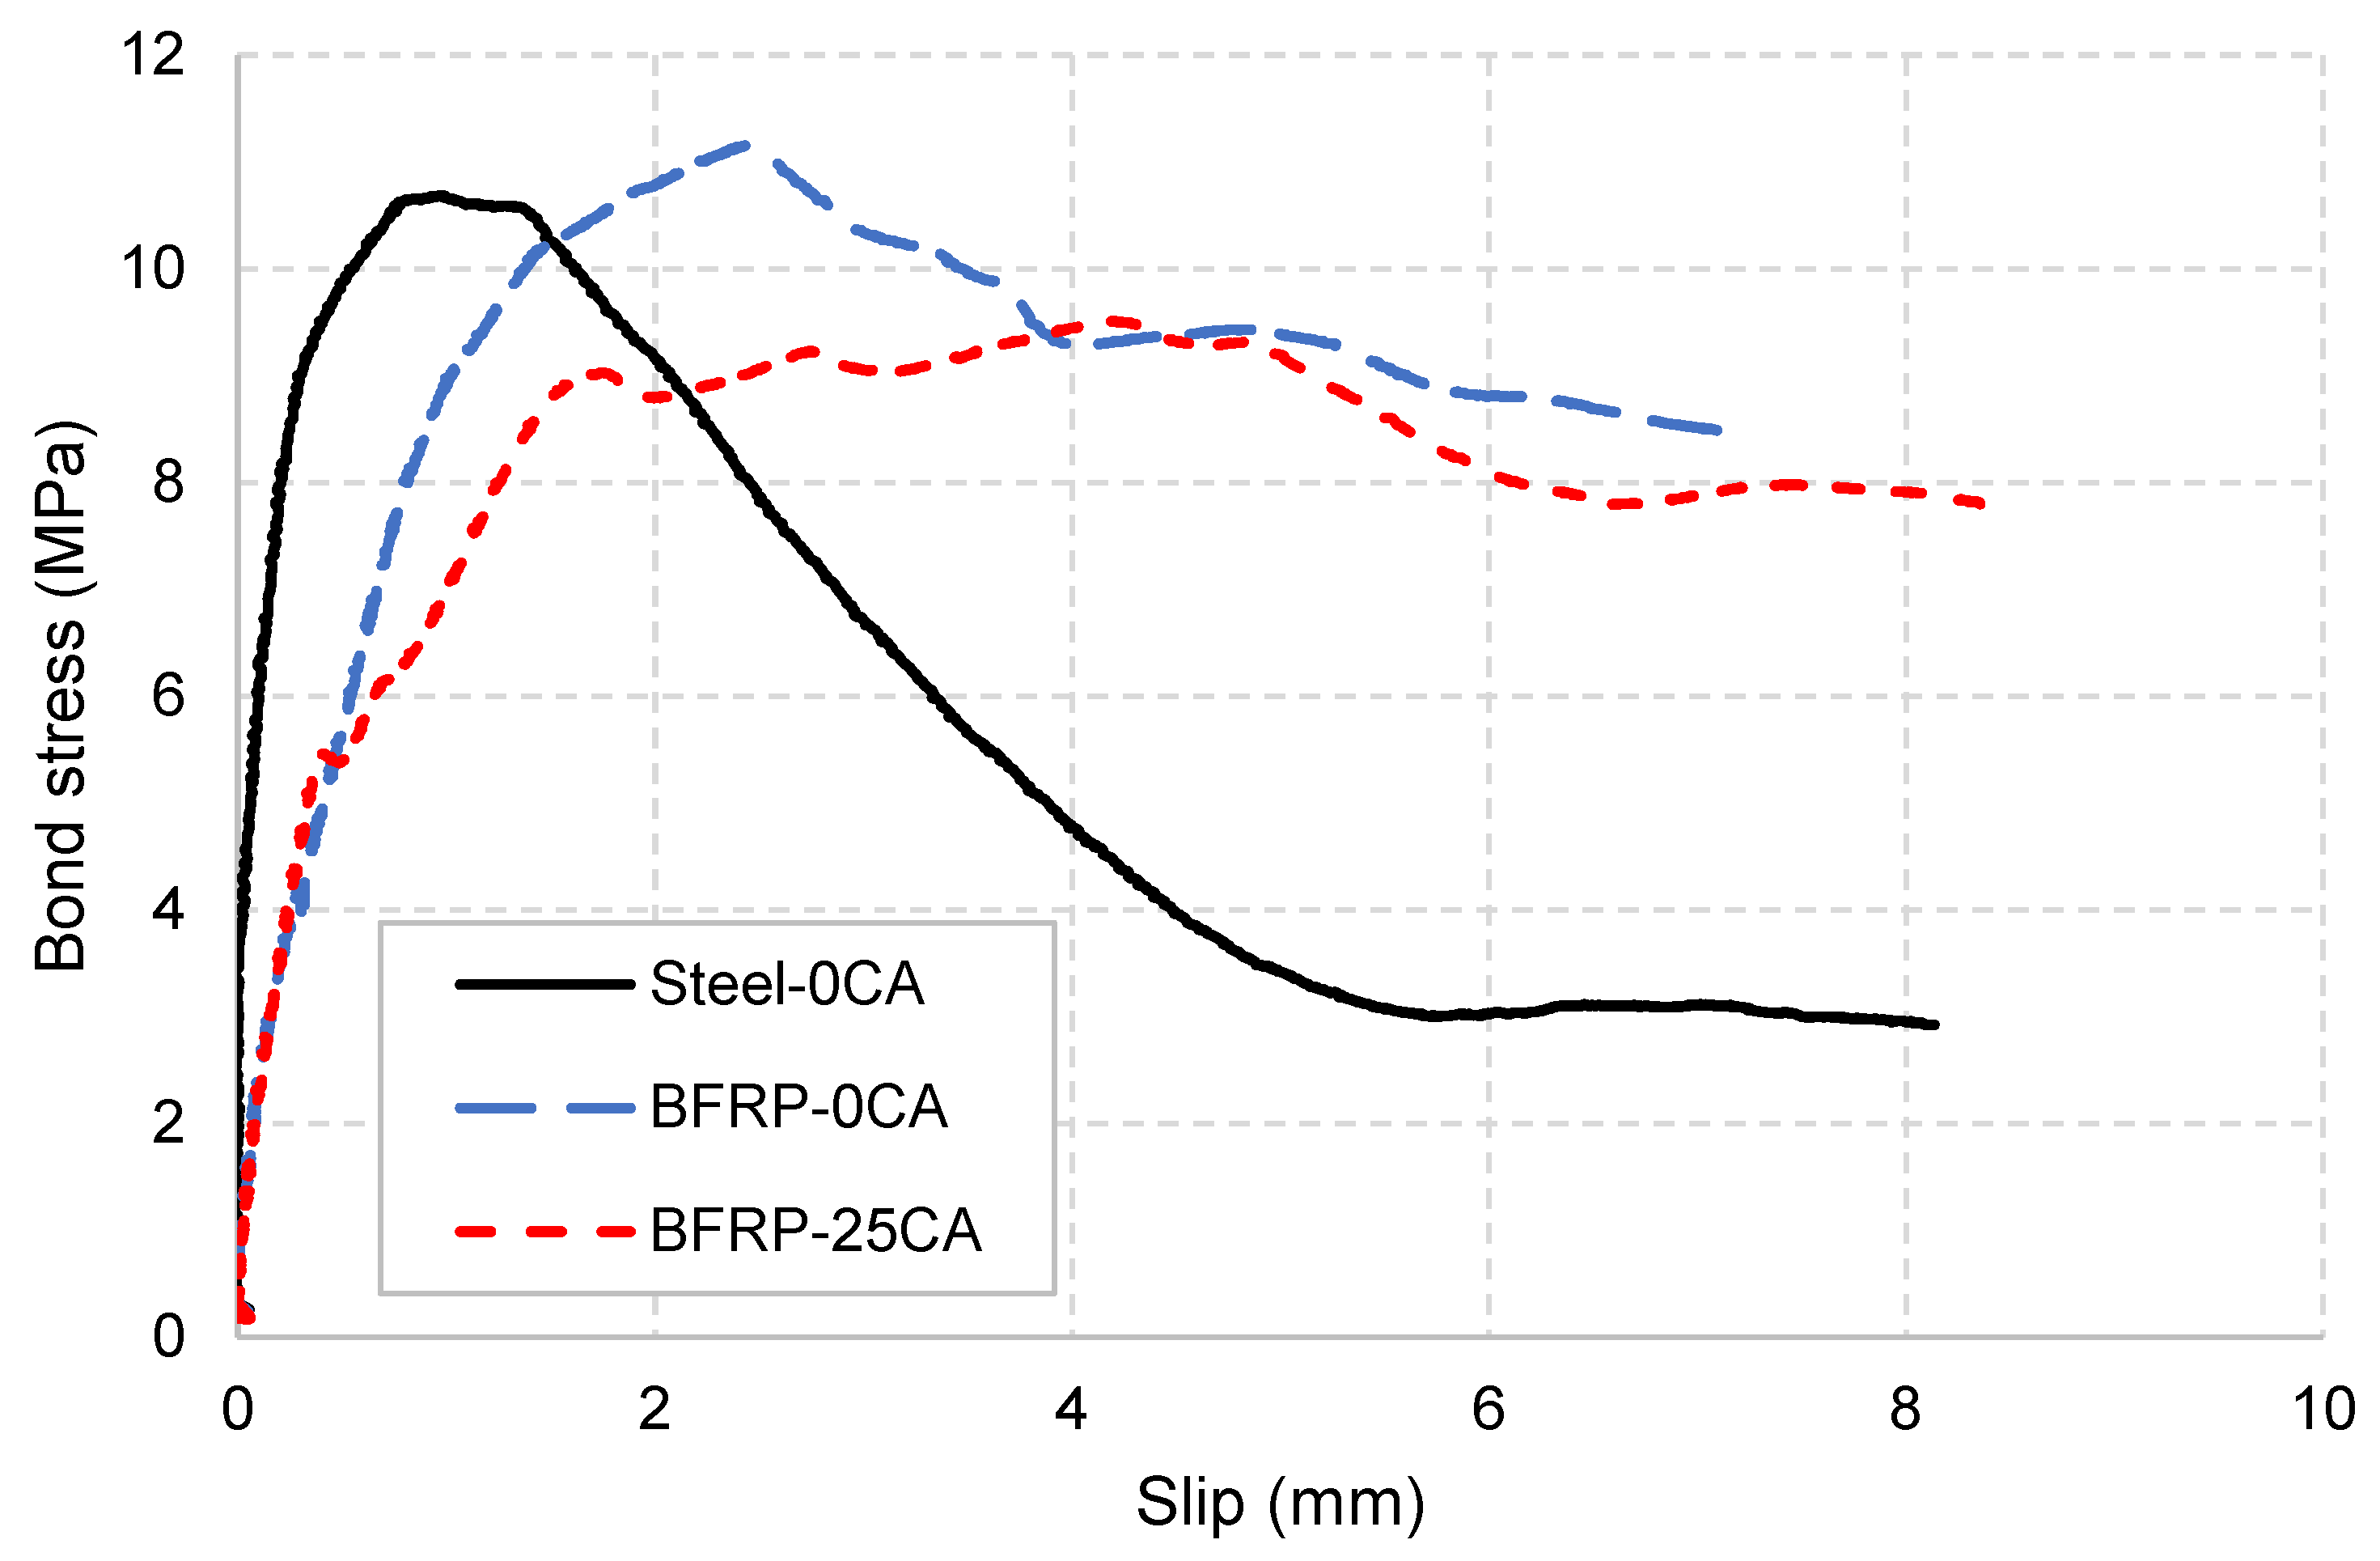
3.3. Pull-Out Tests Results

The outcomes of the pull-out tests for both BFRP and steel reinforcement are presented in Table 3. It is worth noting that the results pertaining to the concrete mix with 50 CA are omitted due to the observed disparity in the surface texture, a key influential parameter in assessing the bond capacity. The results are reported as the average of the three repeated samples. All the specimens failed by pull-out of the rebar irrespective of the reinforcement type or the percentage of the carbonated aggregate. The ultimate experimental bond strength ( τ ) is obtained using Equation (1), where L is the bonded length, F is the ultimate applied load, and ϕ is the diameter of the reinforcement:
τ = F π ϕ L
From the results presented in Table 3, both BFRP and steel reinforcement exhibit relatively similar ultimate bond capacity with a standard deviation of 0.47 and 0.44, respectively. However, there is a slight decrease in the ultimate bond capacity of the BFRP with 25 CA by around 11.8% compared with that of 0 CA. In addition, the BFRP samples with 0 CA demonstrate a greater level of slipping corresponding to the ultimate bond stress by around 191% with a stander deviation of 0.59 compared with that of steel samples. The increase in the content of carbonated aggregate to 25 CA results in an increase in the slipping of the BFRP at the ultimate bond stress by around 19%. These results show that the bond behaviour of the BFRP is slightly compromised with the use of 25 CA. However, further tests are required to generalise and verify the bond behaviour of BFRP with a higher content of carbonated aggregates.
Figure 8 shows the bond-slip response obtained for steel and BFRP samples with different carbonated aggregate contents. The figure effectively illustrates the earlier observations in terms of the ultimate bond stress and the corresponding slip values. Clearly, both steel and BFRP samples have shown similar bond strength when 0 CA is employed, while a lower bond strength is attained for BFRP samples with 25 CA. In general, the BFRP samples demonstrate lower initial stiffness and greater slip at the ultimate bond stress compared with that of steel. This could be attributed to the type of the BFRP fibre and the inherent lower modulus of elasticity of the BFRP (i.e., 49 GPa) compared with that of steel reinforcement (i.e., 200 GPa) [64,65,66]. This results in reduced stiffness in the bond–slip curve, as presented in the figure. Moreover, the BFRP samples exhibit an obvious difference in the response in the softening stage. After reaching the ultimate stress, the bond–slip curve exhibits a steady and gradual decline response, showing further slip without great reduction in the bond stress. In contrast, the steel samples show a sharper response after the ultimate bond stress is reached, characterized by a greater reduction in the bond stress and a lower level of slip. There is no significant difference in the softening response when the percentage of carbonated aggregate is increased to 25%. It is obvious that BFRP samples demonstrate a greater level of residual bond stress compared with steel samples. This is in line with previous observations reported in the literature [67]. This is mainly owing to different mechanical interlocking mechanisms, as well as different surface textures and compositions, which improve the adhesion property with the surrounding concrete, leading to an increase of the bond interface and accordingly higher residual bond stress [68]. In addition, other distinctive mechanical properties of the BFRP, including the high tensile strength, contribute to sustaining the bond stress even beyond the yielding limit.

3.4. Slab Tests Results

The laboratory test included four slab specimens: one slab with ductile steel RC and three slabs with BFRP RC (S-NS-B, S-25CA-B, and S-50CA-B), as detailed in Table 4. In this section, the primary observations and analysis of the one-way slab test results are provided. The influence of reinforcement type (steel and BFRP) on performance is discussed, along with an examination of the impact of carbonated aggregate replacement ratio on behavior. Key performance indicators for reinforced concrete elements include load-deflection response, cracking moment, ultimate capacity, and crack patterns.

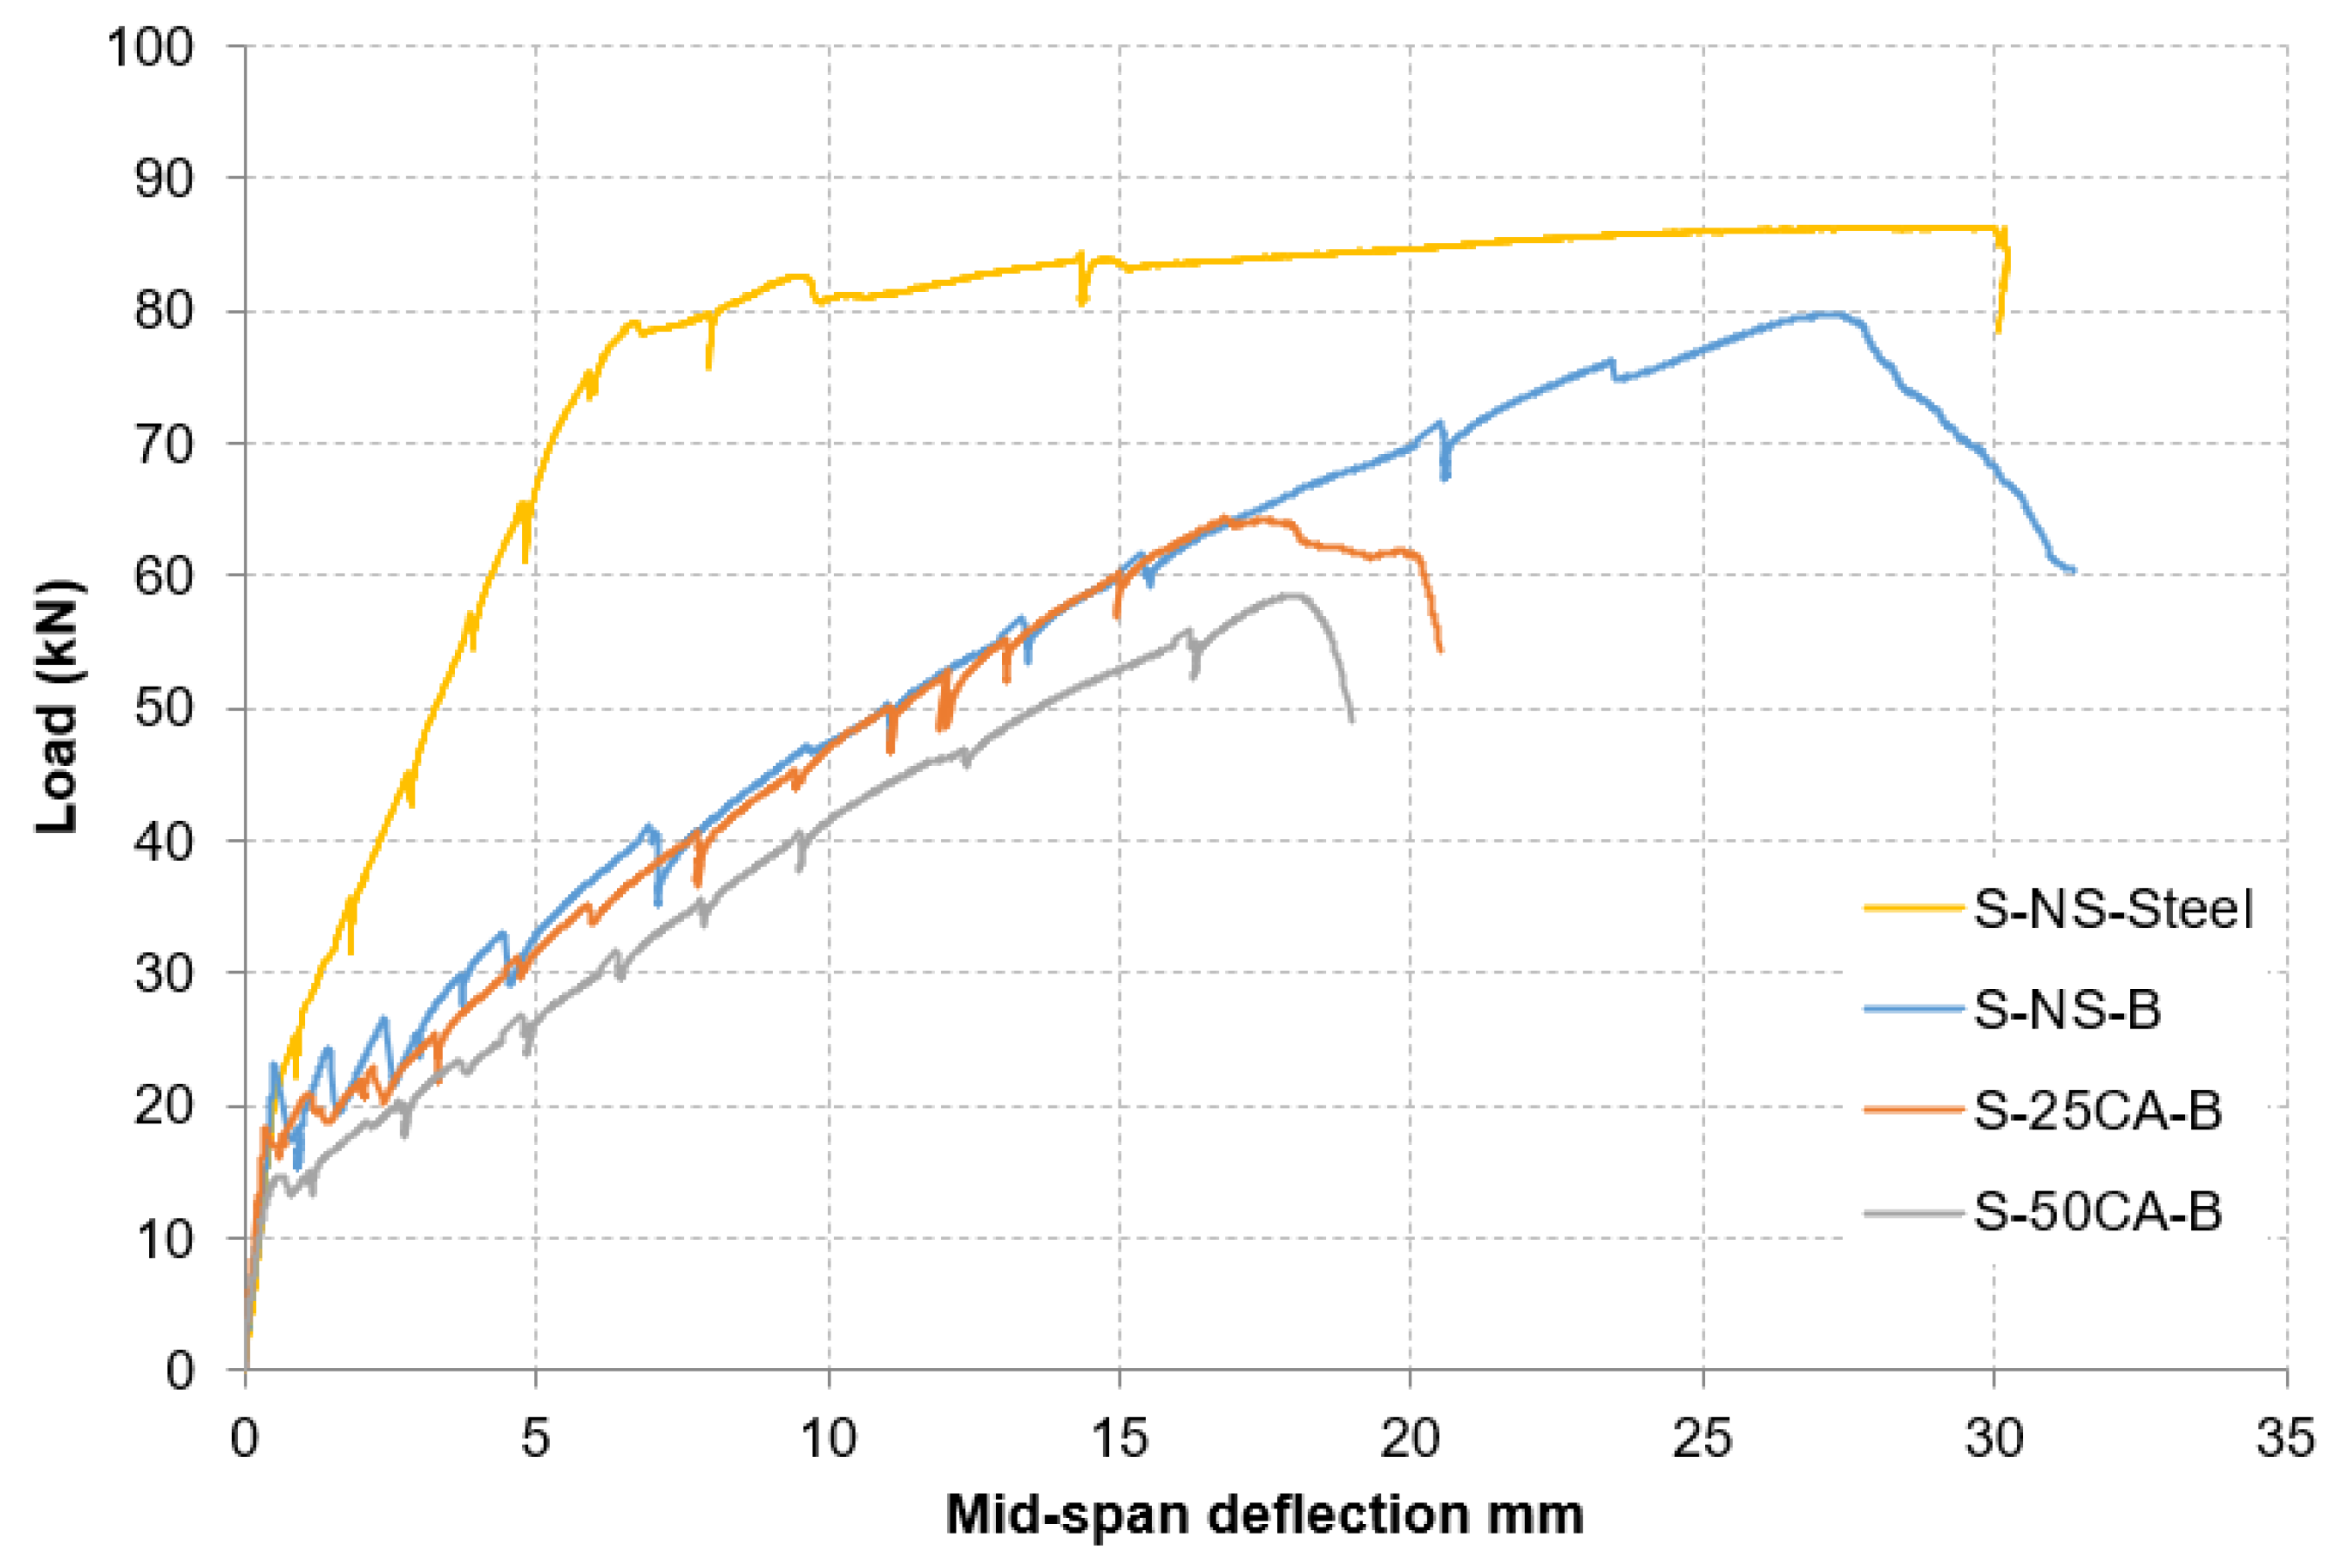
3.4.1. Load–Deflection Response

Figure 9 illustrates the load–deflection response for all four one-way spanning slabs. All one-way spanning slabs exhibited similar behavior until the occurrence of the initial crack. However, after the first crack was initiated, it was very clear that the stiffness of the steel-reinforced slabs (S-NS-Steel) was much higher than that for the BFRP-reinforced slabs owing to the much lower elastic modules of BFRP compared to steel bars. The RC steel slab (S-NS-Steel) displayed predominantly linear behaviours up to the point where the stress in the steel reached its yield stress at approximately 80 kN of applied load. Subsequently, there was a short yield plateau, along with a slight elevation in the loading capacity due to strain hardening in the steel reinforcement, showing that the RC steel slab experienced flexural failure. In contrast, following the initial cracking phase, all BFRP RC slabs showed linear behavior until reaching the ultimate load, followed by abrupt shear failure. BFRP’s low elastic modulus leads to wider, deeper cracks, thereby reducing shear transfer through aggregate interlock and the shear contribution of the uncracked concrete in the compression zone [69]. Additionally, the shear contribution through the dowel action of BFRP is negligible due to their low transverse strength [69]. These factors will affect the overall capacity of the BFRP RC slabs, and the dominated failure is shear failure. A similar observation was reported by Al-Zu’bi et al. [70], who found that BFRP RC slabs primarily failed in shear. It is important to note that the RC steel slab experienced significantly lower deflections and stiffness compared to the three slabs reinforced with BFRP. This discrepancy arises from the higher elastic modulus of steel rebars compared to BFRP rebars. This is in line with the observations by many research studies [70,71]. For example, the slab S-NS-B has 79% lower bending stiffness than that for the slab S-NS-Steel. The deflection at the ultimate load for the slab S-NS-B was four times higher than that for the slab S-NS-Steel. It is worth pointing out that the inclusion of the CA in concrete has a slight effect on the overall performance of the slabs reinforced with BFRP. All BFRP one-spanning slabs exhibited linear behaviour until the ultimate load capacity with a sudden failure of the slabs. However, the ultimate load capacity is significantly affected, which will be further discussed in Section 3.4.2. The slabs S-25CA-B and S-NS-B have similar bending stiffness, while the slab S-50CA-B has slightly lower stiffness than that for the other two BFRP RC slabs. This could be attributed to incorporating 50% CA, which leads to a reduction in the elastic modulus of concrete, and the bonding between the BFRP rebars and concrete may be affected by the high CA content.

3.4.2. Ultimate Load Capacity

The experimental ultimate load capacity of the tested one-way spanning slabs is presented in Table 4. The table also displays the average values of the measured compressive strength, with the corresponding standard deviation values shown within parentheses. The ultimate load capacity of the steel RC slab (S-NS-Steel) exhibited only 4% higher load capacity than that for the BFRP RC slabs without carbonated aggregate (i.e., S-NS-B). This is an interesting observation, as it is expected that the BFRP RC slab should have lower capacity than that for the steel RC slab as the BFRP RC slab fails in shear, while the steel RC slab fails in flexure. For instance, Shamass and Cashell [71] noted that steel RC slabs with the same reinforcement ratio had higher load capacity compared to BFRP RC slabs. It is evident that the ultimate load capacity of BFRP RC slabs is affected by the presence of CA, with higher replacement ratios resulting in lower load capacity. For example, slabs S-25CA-B and S-50CA-B have 19.5% and 27% lower ultimate load than that for slabs without CA (i.e., S-NS-B). This is because adding CA into the concrete mix reduces the tensile strength of the concrete, as discussed in Section 3.2. Consequently, the shear capacity of the slab is reduced as well. Furthermore, the shape and surface texture of carbonated aggregate particles can influence the internal friction between particles. The smooth-textured surface of the carbonated aggregates tends to provide inferior interlocking, which may contribute to reduced shear capacity. The strength and effectiveness of the bond between the CA particles and the cementitious matrix influences the overall shear capacity of the concrete. The results indicated that the CA has lower inherent strength than that for the natural sand, which can affect the overall shear strength of concrete.

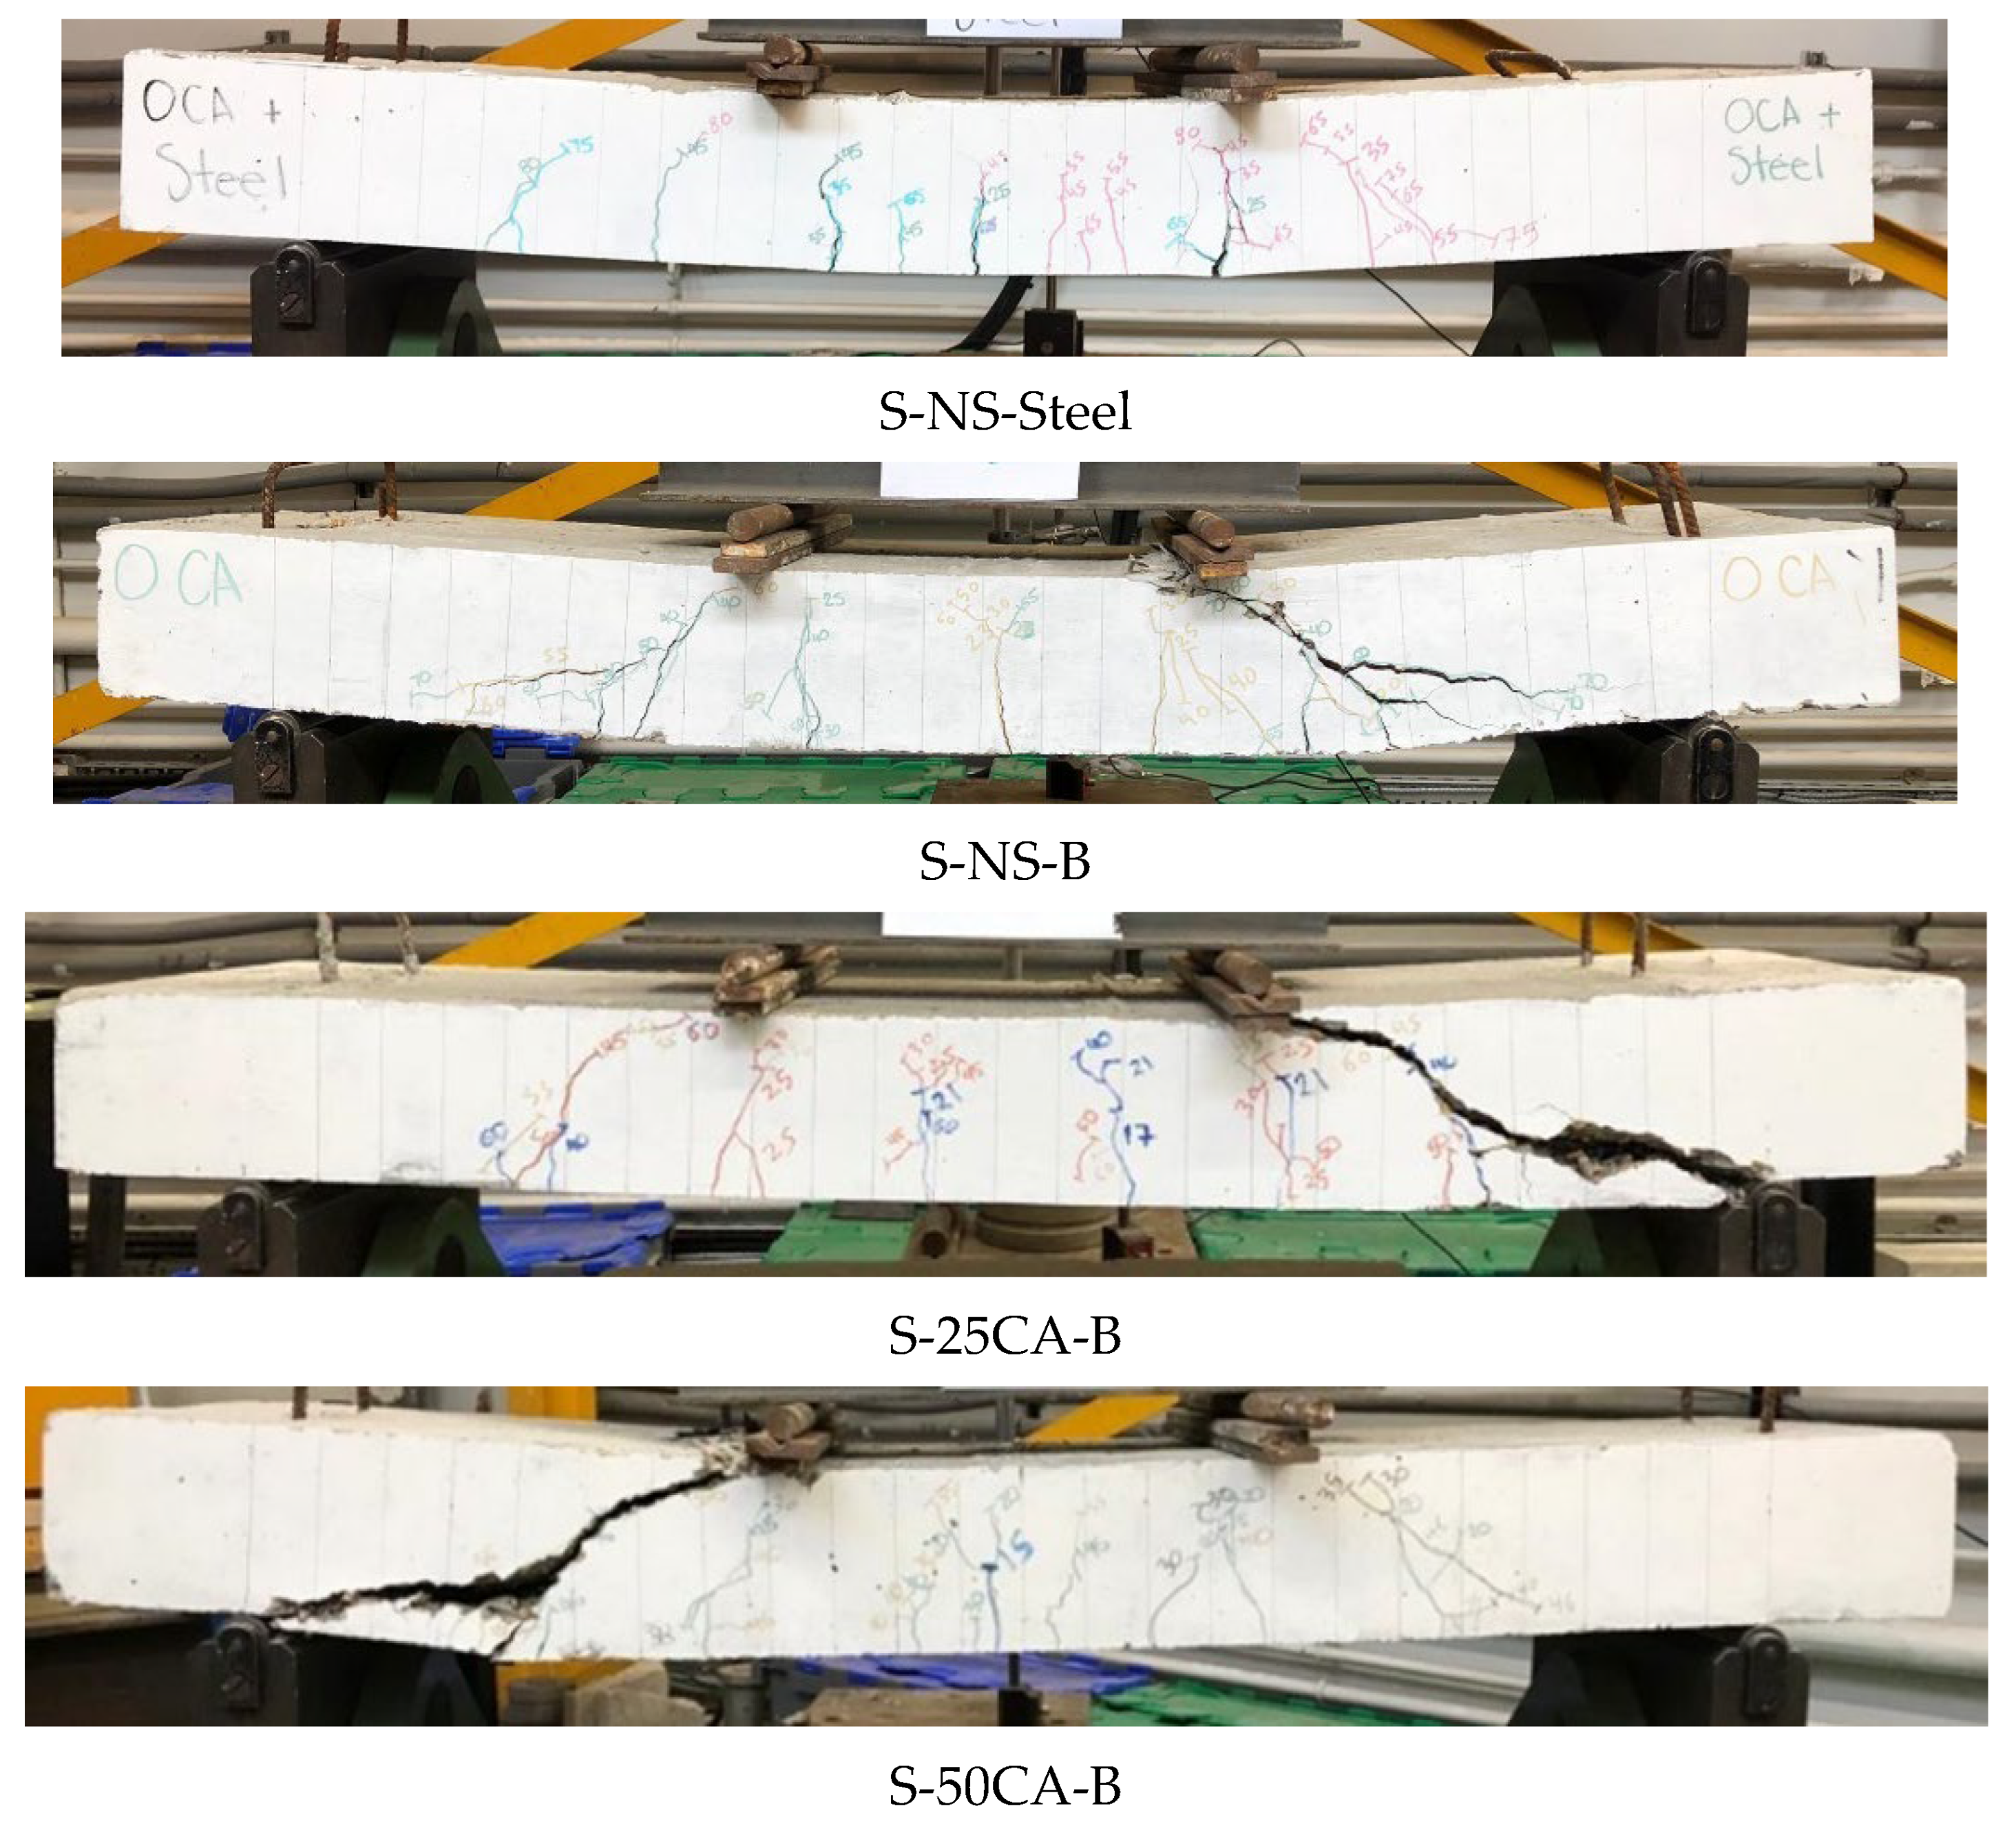
3.4.3. Cracking Behaviour

Figure 10 shows a view of the crack patterns at failure for the slabs S-NS-Steel, S-25CA-B, S-50CA-B, and S-50CA-B. After reaching the cracking load, an initial crack initiated at the bottom of the slab in the region between the mid-span of the slab and point of load application. With an increasing load beyond the initial cracking point, more flexural cracks developed and extended vertically upward toward the compression zone. As the load continued to rise, some cracks also appeared in the shear region and propagated diagonally toward the point load application. At the ultimate load, the steel RC slab failed by steel yielding, indicating flexural failure. For BFRP RC slabs, as the loading increased, new cracks continued to form in the shear span, while the existing cracks widened and propagated diagonally toward the top of the slab. These shear cracks joined and caused a shear failure. The cracks in the BFRP slabs were longer and wider than those in the steel RC slab due to lower elastic modulus of the BFRP than that for the steel.
The cracking load (Pcr) corresponding to the development of the first visible crack for each slab was recorded during the test (see Table 4). Pcr ranged between 25.6% and 30% of the Pu for the examined slab. Additionally, the cracking load for the steel RC slab has a slightly higher value than that for the S-NS-B by 8%. However, as the replacement ratio of CA increases, the cracking load reduces. For example, the cracking load for slab S-25CA-B was 35% lower than that of slab S-NS-B. This is due to the lower tensile strength of concrete with carbonated aggregates in comparison with the traditional steel RC.

3.5. Carbon FootPrint Analysis

3.5.1. System Boundary

This study adopts a cradle-to-gate approach to evaluate the carbon footprint of BFRP rebars and carbonated aggregates, focusing on their environmental impact up to the production stage. The system boundary includes raw material extraction of basalt fibres, resin and aggregates, transportation to the production site, and processing and manufacturing emissions from fiber production, polymer processing, and aggregate carbonation. The system boundaries for this study exclude use phase, installation, transportation to the construction site, maintenance, and end-of-life impacts such as demolition, recycling, or disposal.

3.5.2. Inventory Analysis

All emissions calculations in this section are based on the work of Gibbon and Orr [72], considering the A1–A3 life-cycle modules. These emissions represent the aspects of structural embodied carbon that structural engineers can directly influence and typically account for the largest share of total embodied emissions. Equation (2) illustrates the approach for estimating the total embodied carbon for Modules A1–A3 ( E C A 13 ), where Q i represents the quantity of ith material (kg) and E C F A 13 , i denotes the modules A1–A3 embodied carbon factor for ith material (kgCO2e/kg).
E C A 13 = i = 1 n Q i E C F A 13 , i
The embodied carbon value for steel, considering the A1–A3 life-cycle modules, was obtained from Jayasinghe et al. [73], who investigated the minimum embodied carbon in reinforced concrete beams. For sand, aggregate, water, and cement, the embodied carbon values (kg CO2/kg or kg CO2-e/kg) were sourced from the Inventory of Carbon and Energy (ICE) [74], using “general” values as recommended by The Institution of Structural Engineers (ISTUCE) when manufacturer-specific data are unavailable. The approximated values are 0.0048 kg CO2/kg for sand, 0.0050 kg CO2/kg for aggregate, 0.0010 kg CO2/kg for water, and 0.73 kg CO2/kg for cement (Table 5).
Additionally, the Environmental Product Declaration (EPD) from a basalt manufacturer indicates that the embodied carbon for 10 mm Basalt FRP (BFRP) bars is 2.6 kg CO2/kg. Meanwhile, the EPD from Carbon8 reports that the embodied carbon for carbonated aggregates is −0.0918 kg CO2/kg, highlighting their potential to offset emissions. Table 5 presents a summary of these CO2 emissions values, including contributions from the product stage.

3.5.3. Impact Analysis

In this carbon footprint analysis, four different slab configurations are evaluated: a steel-reinforced OPC slab, a BFRP-reinforced OPC slab, a BFRP-reinforced OPC slab with 25% carbonated aggregates (CA), and a BFRP-reinforced OPC slab with 50% CA. Each slab has identical dimensions of 1000 mm × 1000 mm × 250 mm, resulting in a total concrete volume of 0.25 m3. The reinforcement consists of five 10 mm diameter rebars, spaced 200 mm apart.
To calculate emissions, the quantity (kg) of each component in the mix was multiplied by its respective CO2 emission factor per kg, as provided in Table 6, considering the A1–A3 modules (raw material extraction, transportation, and processing). The total emissions for each slab were then determined by summarising the emissions of all individual components. Table 6 presents the total cradle-to-gate CO2 emissions for different reinforced concrete slabs, highlighting the percentage contribution of each material to emissions and the total CO2 emissions for each slab type. The focus is how each material influences the overall carbon footprint of the concrete mix.
In the steel-reinforced OPC slab, the total CO2 emissions amount to 90.3 kg CO2-e, with cement being the dominant contributor (93.5%). The 10 mm steel reinforcement contributes 4.2%, while sand, aggregate, and water collectively contribute about 2.3%. This slab demonstrates that cement production is the primary source of emissions in conventional concrete, while steel reinforcement also adds a significant amount.
Switching to BFRP reinforcement results in a slight reduction in emissions, lowering the total to 88.6 kg CO2-e. In this case, cement’s contribution increases to 95.4%, while BFRP bars contribute 2.3% (2.0 kg CO2-e). The reduction in emissions is minimal (1.7 kg CO2-e less than the steel-reinforced slab), indicating that replacing steel with BFRP alone does not significantly reduce the carbon footprint. However, it is important to mention that the carbon footprint analysis does not account for the possibility of thinner slabs due to BFRP’s higher strength and excellent durability. A reduction in slab thickness could significantly influence the findings and alter the relative environmental impacts of the systems, as less material use would further lower emissions.
The introduction of carbonated aggregates (CA) in the BFRP-reinforced slab with a 25% CA replacement ratio leads to a further reduction in total emissions to 85.1 kg CO2-e. Cement remains the dominant contributor, accounting for 99.3% of emissions, while BFRP bars contribute 2.4%. The key difference in this scenario is that CA contributes negative emissions (−3.9%) or offsets −3.30 kg CO2-e, reducing the overall environmental impact. Carbonated aggregates absorb CO2 during production, making them an effective strategy for lowering embodied carbon in concrete.
Further increasing the CA replacement ratio to 50% results in the lowest total emissions (81.5 kg CO2-e), achieving a reduction of 8.8 kg CO2-e compared to the steel-reinforced slab. In this case, cement’s relative contribution surpasses 100% (103.6%) because the negative emissions from CA (−8.1%) offset a significant portion of the total footprint. This slab highlights how carbonated aggregates can play a critical role in reducing CO2 emissions, making them a valuable addition to sustainable concrete formulations.
The steel-reinforced OPC slab has the highest total emissions at 90.3 kg CO2-e, making it the least environmentally favorable option. Replacing steel with BFRP reinforcement slightly reduces emissions to 88.6 kg CO2-e, representing a 1.9% decrease. A more substantial reduction occurs when carbonated aggregates (CA) are introduced. The BFRP-reinforced slab with 25% of CA achieves a 5.7% decrease compared to the steel-reinforced slab. This drop is due to CA’s ability to offset emissions through CO2 absorption. Further increasing CA content to 50% results in the lowest emissions at 81.5 kg CO2-e, marking a 9.7% reduction from the steel-reinforced slab and an 8% reduction compared to the standard BFRP-reinforced slab.

4. Conclusions

This study investigated the feasibility of using two low-carbon materials in concrete: carbonated manufactured aggregate (CA) as a substitute for natural sand and basalt fiber-reinforced plastic (BFRP) as a replacement for steel reinforcement. The impact of CA replacement ratios on the mechanical and physical properties of concrete was investigated, along with the mechanical and carbon footprint of BFRP-reinforced concrete. The following conclusions were reached:
  • Replacing natural sand (NS) with the CA affected the homogeneity and internal integrity of the concrete mix. This was evidenced by the 4.5% and 13.3% reduction in ultrasonic pulse velocity (UPV) for concrete samples containing 50% CA and 100% CA since the CA is lighter and slightly more porous than the NA.
  • Compressive strength increased by 3% at 25% CA and 1% at 50% CA. As CA replacement levels increased, the splitting tensile strength was 14%, 18%, and 38%, and the flexural strength was 19%, 33%, and 52% lower than that for the control mix at 25%, 50%, and 100% replacement, respectively.
  • The stiffness of the steel-reinforced slabs (S-NA-Steel) was much higher than that of the BFRP-reinforced slabs due to the much lower elastic module of BFRP. The deflection at the ultimate load for the slab BFRP slab was four times lower than that for the steel RC slab.
  • The inclusion of the CA in concrete had a slight effect on the overall performance of the slabs reinforced with the BFRP. All BFRP one-spanning slabs exhibited linear behavior until the ultimate load capacity with the sudden failure of the slabs. However, the ultimate load capacity was notably influenced.
  • Both BFRP and steel reinforcement exhibit similar ultimate bond capacities, with a slight decrease in BFRP’s capacity with concrete mix with 25% CA compared control mix, suggesting a compromised bond behavior, especially with higher CA content.
  • The incorporation of BFRP and CA can have an impact on the carbon savings of concrete slabs, which incorporate them. For example, using 50% CA in concrete reinforced with Basalt FRP reduced the embodied carbon of the slab by 9.7%, in comparison with the steel RC slab.
  • Further studies are needed to investigate the effect of CA inclusion on the compressive stress–strain behaviour, ultimate strain, workability, and the elastic modulus of concrete. Additionally, the strength development of concrete containing CA at different ages (7, 14, and 56 days) requires further investigation.

Author Contributions

Conceptualization, R.S., V.L. and O.A.; methodology, R.S., V.L., O.A. and M.R.; formal analysis, R.S., V.L., O.A., M.R., H.U.L.L. and X.Z.; investigation, R.S., V.L., O.A., M.R. and H.U.L.L.; methodology, R.S., V.L., O.A., M.R., H.U.L.L. and X.Z.; resources, R.S., V.L. and O.A.; data curation, R.S., V.L. and O.A.; writing—original draft preparation, R.S., V.L., O.A. and M.R.; writing—review and editing, R.S., V.L., O.A., M.R. and X.Z.; visualization, R.S., V.L., O.A. and M.R.; supervision, R.S. and V.L.; project administration, R.S. and V.L. All authors have read and agreed to the published version of the manuscript.

Funding

This research received no external funding.

Data Availability Statement

The original contributions presented in this study are included in the article. Further inquiries can be directed at the corresponding author.

Acknowledgments

We acknowledge BASTECH https://basalt.tech/ (accessed on 22 February 2025) for supplying BFRP materials.

Conflicts of Interest

The authors declare no conflicts of interest.

References

  1. Kong, D.; Lei, T.; Zheng, J.; Ma, C.; Jiang, J. Strengthening of the ITZ in recycled aggregate concrete. In Proceedings of the Xi’an International Conference on Architecture and Technology, Proceedings–Architecture in Harmony, Xi’an, China, 23–25 September 2006; pp. 614–617. [Google Scholar]
  2. de Andrade Salgado, F.; de Andrade Silva, F. Recycled aggregates from construction and demolition waste towards an application on structural concrete: A review. J. Build. Eng. 2022, 52, 104452. [Google Scholar] [CrossRef]
  3. Shamass, R.; Rispoli, O.; Limbachiya, V.; Kovacs, R. Mechanical and GWP assessment of concrete using Blast Furnace Slag, Silica Fume and recycled aggregate. Case Stud. Constr. Mater. 2023, 18, e02164. [Google Scholar] [CrossRef]
  4. Wang, B.; Yan, L.; Fu, Q.; Kasal, B. A comprehensive review on recycled aggregate and recycled aggregate concrete. Resour. Conserv. Recycl. 2021, 171, 105565. [Google Scholar] [CrossRef]
  5. Upshaw, M.; Cai, C.S. Critical review of recycled aggregate concrete properties, improvements, and numerical models. J. Mater. Civ. Eng. 2020, 32, 03120005. [Google Scholar] [CrossRef]
  6. Folino, P.; Xargay, H. Recycled aggregate concrete–Mechanical behavior under uniaxial and triaxial compression. Constr. Build. Mater. 2014, 56, 21–31. [Google Scholar] [CrossRef]
  7. Tahar, Z.; Ngo, T.; Kadri, E.H.; Bouvet, A.; Debieb, F.; Aggoun, S. Effect of cement and admixture on the utilization of recycled aggregates in concrete. Constr. Build. Mater. 2017, 149, 91–102. [Google Scholar] [CrossRef]
  8. Thomas, J.; Thaickavil, N.N.; Wilson, P.M. Strength and durability of concrete containing recycled concrete aggregates. J. Build. Eng. 2018, 19, 349–365. [Google Scholar] [CrossRef]
  9. Verian, K.P.; Ashraf, W.; Cao, Y. Properties of recycled concrete aggregate and their influence in new concrete production. Resour. Conserv. Recycl. 2018, 133, 30–49. [Google Scholar] [CrossRef]
  10. Singh, R.; Nayak, D.; Pandey, A.; Kumar, R.; Kumar, V. Effects of recycled fine aggregates on properties of concrete containing natural or recycled coarse aggregates: A comparative study. J. Build. Eng. 2022, 45, 103442. [Google Scholar] [CrossRef]
  11. Shima, H. New technology for recovering high quality aggregate from demolished concrete. In Proceedings of the 5th International Symposium on East Asian Recycling Technology, Tsukuba, Japan, 15–17 June 1999. [Google Scholar]
  12. Li, J.; Xiao, H.; Zhou, Y. Influence of coating recycled aggregate surface with pozzolanic powder on properties of recycled aggregate concrete. Constr. Build. Mater. 2009, 23, 1287–1291. [Google Scholar] [CrossRef]
  13. Silva, R.V.; Neves, R.; De Brito, J.; Dhir, R.K. Carbonation behaviour of recycled aggregate concrete. Cem. Concr. Compos. 2015, 62, 22–32. [Google Scholar] [CrossRef]
  14. Lu, Z.; Tan, Q.; Lin, J.; Wang, D. Properties investigation of recycled aggregates and concrete modified by accelerated carbonation through increased temperature. Constr. Build. Mater. 2022, 341, 127813. [Google Scholar] [CrossRef]
  15. Tang, Y.; Xiao, J.; Zhang, H.; Wang, D.; Zhang, M.; Zhang, J. Effect of accelerated carbonation of fully recycled aggregates on fracture behaviour of concrete. Cem. Concr. Compos. 2024, 148, 105442. [Google Scholar] [CrossRef]
  16. Zhang, T.; Chen, M.; Wang, Y.; Zhang, M. Roles of carbonated recycled fines and aggregates in hydration, microstructure and mechanical properties of concrete: A critical review. Cem. Concr. Compos. 2023, 138, 104994. [Google Scholar] [CrossRef]
  17. Zhan, B.J.; Xuan, D.X.; Poon, C.S. Enhancement of recycled aggregate properties by accelerated CO2 curing coupled with limewater soaking process. Cem. Concr. Compos. 2018, 89, 230–237. [Google Scholar] [CrossRef]
  18. Xiao, J.; Zhang, H.; Tang, Y.; Deng, Q.; Wang, D.; Poon, C.S. Fully utilizing carbonated recycled aggregates in concrete: Strength, drying shrinkage and carbon emissions analysis. J. Clean. Prod. 2022, 377, 134520. [Google Scholar] [CrossRef]
  19. Cramer, S.D.; Covino Jr, B.S.; Bullard, S.J.; Holcomb, G.R.; Russell, J.H.; Nelson, F.J.; Laylor, H.M.; Soltesz, S.M. Corrosion prevention and remediation strategies for reinforced concrete coastal bridges. Cem. Concr. Compos. 2002, 24, 101–117. [Google Scholar] [CrossRef]
  20. Chemrouk, M. The deteriorations of reinforced concrete and the option of high performances reinforced concrete. Procedia Eng. 2015, 125, 713–724. [Google Scholar] [CrossRef]
  21. Hu, J.Y.; Zhang, S.S.; Chen, E.; Li, W.G. A review on corrosion detection and protection of existing reinforced concrete (RC) structures. Constr. Build. Mater. 2022, 325, 126718. [Google Scholar] [CrossRef]
  22. Soltani, M.; Safiey, A.; Brennan, A. A state-of-the-art review of bending and shear behaviors of corrosion-damaged reinforced concrete beams. Struct. J. 2019, 116. [Google Scholar] [CrossRef]
  23. Rodrigues, R.; Gaboreau, S.; Gance, J.; Ignatiadis, I.; Betelu, S. Reinforced concrete structures: A review of corrosion mechanisms and advances in electrical methods for corrosion monitoring. Constr. Build. Mater. 2021, 269, 121240. [Google Scholar] [CrossRef]
  24. Breysse, D. Deterioration processes in reinforced concrete: An overview. In Non-Destructive Evaluation of Reinforced Concrete Structures; Woodhead Publishing: Sawston, UK, 2010; pp. 28–56. [Google Scholar]
  25. Naidu Gopu, G.; Joseph, S.A. Corrosion behavior of fiber-reinforced concrete—A review. Fibers 2022, 10, 38. [Google Scholar] [CrossRef]
  26. Al-Jabari, M. Waterproofing coatings and membranes. In Integral Waterproofing of Concrete Structures: Advanced Protection Technologies of Concrete by Pore Blocking and Lining; Woodhead Publishing: Sawston, UK, 2022; p. 393. [Google Scholar]
  27. Li, S.; Jiang, J.; Geng, Y.; Hu, J.; Sui, S.; Liu, A.; Hu, M.; Shan, Y.; Liu, Z. Application of silane protective materials in the concrete durability improvement in recent years: A review. Eng. Fail. Anal. 2024, 160, 108140. [Google Scholar] [CrossRef]
  28. Thissen, P.; Bogner, A.; Dehn, F. Surface treatments on concrete: An overview on organic, inorganic and nano-based coatings and an outlook about surface modification by rare-earth oxides. RSC Sustain. 2024, 2, 2092–2124. [Google Scholar] [CrossRef]
  29. Liu, Y.; Shi, J. Recent progress and challenges of using smart corrosion inhibitors in reinforced concrete structures. Constr. Build. Mater. 2024, 411, 134595. [Google Scholar] [CrossRef]
  30. Rabi, M.; Cashell, K.A.; Shamass, R. Flexural analysis and design of stainless steel reinforced concrete beams. Eng. Struct. 2019, 198, 109432. [Google Scholar] [CrossRef]
  31. Rabi, M.; Cashell, K.A.; Shamass, R. Ultimate behaviour and serviceability analysis of stainless steel reinforced concrete beams. Eng. Struct. 2021, 248, 113259. [Google Scholar] [CrossRef]
  32. Rabi, M.; Cashell, K.A.; Shamass, R.; Desnerck, P. Bond behaviour of austenitic stainless steel reinforced concrete. Eng. Struct. 2020, 221, 111027. [Google Scholar] [CrossRef]
  33. Rabi, M.; Shamass, R.; Cashell, K.A. Experimental investigation on the flexural behaviour of stainless steel reinforced concrete beams. Struct. Infrastruct. Eng. 2023, 19, 1847–1859. [Google Scholar] [CrossRef]
  34. Rabi, M.; Shamass, R.; Cashell, K.A. Description of the constitutive behaviour of stainless steel reinforcement. Case Stud. Constr. Mater. 2024, 20, e03013. [Google Scholar] [CrossRef]
  35. Khodadadi, N.; Roghani, H.; Harati, E.; Mirdarsoltany, M.; De Caso, F.; Nanni, A. Fiber-reinforced polymer (FRP) in concrete: A comprehensive survey. Constr. Build. Mater. 2024, 432, 136634. [Google Scholar] [CrossRef]
  36. Harle, S.M. Durability and long-term performance of fiber reinforced polymer (FRP) composites: A review. Structures 2024, 60, 105881. [Google Scholar] [CrossRef]
  37. Coppola, L.; Beretta, S.; Bignozzi, M.C.; Bolzoni, F.; Brenna, A.; Cabrini, M.; Candamano, S.; Caputo, D.; Carsana, M.; Cioffi, R.; et al. The improvement of durability of reinforced concretes for sustainable structures: A review on different approaches. Materials 2022, 15, 2728. [Google Scholar] [CrossRef] [PubMed]
  38. Ascione, F.; Maselli, G.; Nesticò, A. Sustainable materials selection in industrial construction: A life-cycle based approach to compare the economic and structural performances of glass fibre reinforced polymer (GFRP) and steel. J. Clean. Prod. 2024, 475, 143641. [Google Scholar] [CrossRef]
  39. Das, S.C.; Nizam, M. Applications of fiber reinforced polymer composites (FRP) in civil engineering. Int. J. Adv. Struct. Geotech. Eng. 2014, 3, 299–309. [Google Scholar]
  40. Rabi, M.; Jweihan, Y.S.; Abarkan, I.; Ferreira, F.P.V.; Shamass, R.; Limbachiya, V.; Tsavdaridis, K.D.; Santos, L.F.P. Machine learning-driven web-post buckling resistance prediction for high-strength steel beams with elliptically-based web openings. Results Eng. 2024, 21, 101749. [Google Scholar] [CrossRef]
  41. Rabi, M.; Abarkan, I.; Shamass, R. Buckling resistance of hot-finished CHS beam-columns using FE modelling and machine learning. Steel Constr. 2024, 17, 93–103. [Google Scholar] [CrossRef]
  42. Rabi, M.; Ferreira, F.P.V.; Abarkan, I.; Limbachiya, V.; Shamass, R. Prediction of the cross-sectional capacity of cold-formed CHS using numerical modelling and machine learning. Results Eng. 2023, 17, 100902. [Google Scholar] [CrossRef]
  43. Jain, R.; Lee, L. (Eds.) Fiber Reinforced Polymer (FRP) Composites for Infrastructure Applications: Focusing on Innovation, Technology Implementation and Sustainability; Springer Science & Business Media: Berlin/Heidelberg, Germany, 2012. [Google Scholar]
  44. Mohamed, O.A.; Al Hawat, W.; Keshawarz, M. Durability and mechanical properties of concrete reinforced with basalt fiber-reinforced polymer (BFRP) bars: Towards sustainable infrastructure. Polymers 2021, 13, 1402. [Google Scholar] [CrossRef]
  45. Jagadeesh, P.; Rangappa, S.M.; Siengchin, S. Basalt fibers: An environmentally acceptable and sustainable green material for polymer composites. Constr. Build. Mater. 2024, 436, 136834. [Google Scholar] [CrossRef]
  46. Brik, V. Advanced concept concrete using basalt fiber/BF composite rebar reinforcement. IDEA Proj. 2003, 86, 71. [Google Scholar]
  47. Sim, J.; Park, C. Characteristics of basalt fiber as a strengthening material for concrete structures. Compos. Part B Eng. 2005, 36, 504–512. [Google Scholar] [CrossRef]
  48. Pavlović, A.; Donchev, T.; Petkova, D.; Staletović, N. Sustainability of alternative reinforcement for concrete structures: Life cycle assessment of basalt FRP bars. Constr. Build. Mater. 2022, 334, 127424. [Google Scholar] [CrossRef]
  49. Pedraza, J.; Zimmermann, A.; Tobon, J.; Schomäcker, R.; Rojas, N. On the road to net zero-emission cement: Integrated assessment of mineral carbonation of cement kiln dust. Chem. Eng. J. 2021, 408, 127346. [Google Scholar] [CrossRef]
  50. Lachemi, M.; Şahmaran, M.; Hossain, K.M.A.; Lotfy, A.; Shehata, M. Properties of controlled low-strength materials incorporating cement kiln dust and slag. Cem. Concr. Compos. 2010, 32, 623–629. [Google Scholar] [CrossRef]
  51. Siddique, R. Utilization of cement kiln dust (CKD) in cement mortar and concrete—An overview. Resour. Conserv. Recycl. 2006, 48, 315–338. [Google Scholar] [CrossRef]
  52. Carey, P. Unlocking Circularity for EfW: The Power of Carbonation. Carbon8. 2022. Available online: https://www.carbon8.co.uk (accessed on 30 August 2023).
  53. BS EN 933-1; Tests for Geometrical Properties of Aggregates: Part 1. Determination of Particle Size Distribution. Sieving Method. British Standards Institution: London, UK, 2021.
  54. BS 812; Testing of Aggregates Part 2: Method of Determination of Density. British Standards Institution: London, UK, 1995.
  55. ISO 10406-1:2008; Fibre-Reinforced Polymer (FRP) Reinforcement of Concrete—Test Methods—Part 1: FRP Bars and Grids. International Standard Organization: Geneva, Switzerland, 2008.
  56. Teychenné, D.C.; Franklin, R.E.; Erntroy, H.C.; Marsh, B.K. Design of Normal Concrete Mixes; HM Stationery Office: London, UK, 1975. [Google Scholar]
  57. BS EN 12390-4; Testing Hardened Concrete. Compressive Strength. Specification for Testing Machines. British Standards Institution: London, UK, 2019.
  58. ACI 440.3R-04; Guide Test Methods for Fiber-Reinforced Polymers (FRPs) for Reinforcing or Strengthening Concrete Structures; ACI Com-mittee 440. American Concrete Institute: Farmington Hills, MI, USA, 2004.
  59. BS EN 12504-4; Testing Concrete—Determination of Ultrasonic Pulse Velocity. British Standards Institution: London, UK, 2004.
  60. Räsänen, A.; Huuhka, S.; Pakkala, T.; Lahdensivu, J. Methods for evaluating the technical performance of reclaimed bricks. Case Stud. Constr. Mater. 2022, 17, e01504. [Google Scholar] [CrossRef]
  61. Raza, S.S.; Fahad, M.; Ali, B.; Amir, M.T.; Alashker, Y.; Elhag, A.B. Enhancing the Performance of Recycled Aggregate Concrete Using Micro-Carbon Fiber and Secondary Binding Material. Sustainability 2022, 14, 14613. [Google Scholar] [CrossRef]
  62. Chen, Q.; Zhang, J.; Wang, Z.; Zhao, T.; Wang, Z. A review of the interfacial transition zones in concrete: Identification, physical characteristics, and mechanical properties. Eng. Fract. Mech. 2024, 300, 109979. [Google Scholar] [CrossRef]
  63. Prokopski, G.; Halbiniak, J. Interfacial transition zone in cementitious materials. Cem. Concr. Res. 2000, 30, 579–583. [Google Scholar] [CrossRef]
  64. Ramagiri, K.K.; Chintha, R.; Bandlamudi, R.K.; Kara De Maeijer, P.; Kar, A. Cradle-to-gate life cycle and economic assessment of sustainable concrete mixes—Alkali-activated concrete (Aac) and bacterial concrete (bc). Infrastructures 2021, 6, 104. [Google Scholar] [CrossRef]
  65. Antonietta Aiello, M.; Leone, M.; Pecce, M. Bond performances of FRP rebars-reinforced concrete. J. Mater. Civ. Eng. 2007, 19, 205–213. [Google Scholar] [CrossRef]
  66. Baena, M.; Torres, L.; Turon, A.; Barris, C. Experimental study of bond behaviour between concrete and FRP bars using a pull-out test. Compos. Part B Eng. 2009, 40, 784–797. [Google Scholar] [CrossRef]
  67. Wang, Y.; Li, Z.; Zhang, C.; Wang, X.; Li, J.; Liang, Y.; Chu, S. Bond behavior of BFRP bars with basalt-fiber reinforced cement-based composite materials. Struct. Concr. 2021, 22, 154–167. [Google Scholar] [CrossRef]
  68. Nepomuceno, E.; Sena-Cruz, J.; Correia, L.; D’Antino, T. Review on the bond behavior and durability of FRP bars to concrete. Constr. Build. Mater. 2021, 287, 123042. [Google Scholar] [CrossRef]
  69. Issa, M.A.; Ovitigala, T.; Ibrahim, M. Shear behavior of basalt fiber reinforced concrete beams with and without basalt FRP stirrups. J. Compos. Constr. 2016, 20, 04015083. [Google Scholar] [CrossRef]
  70. Al-Zu’bi, M.; Shamass, R.; Ferreira, F.P.V. Mechanical performance and life cycle assessment of BFRP-reinforced AAC slabs strengthened with basalt macro-fibers. Constr. Build. Mater. 2025, 461, 139917. [Google Scholar] [CrossRef]
  71. Shamass, R.; Cashell, K.A. Experimental investigation into the flexural behaviour of basalt FRP reinforced concrete members. Eng. Struct. 2020, 220, 110950. [Google Scholar] [CrossRef]
  72. Gibbon, O.P.; Orr, J.J.; Archer-Jones, C.; Arnold, W.; Green, D. How to Calculate Embodied Carbon; The Institution of Structural Engineers: London, UK, 2022. [Google Scholar]
  73. Jayasinghe, A.; Orr, J.; Ibell, T.; Boshoff, W.P. Minimising embodied carbon in reinforced concrete beams. Eng. Struct. 2021, 242, 112590. [Google Scholar] [CrossRef]
  74. Hammond, G.; Jones, C. Inventory of Carbon & Energy: ICE (Vol. 5); Sustainable Energy Research Team, Department of Mechanical Engineering, University of Bath: Bath, UK, 2008. [Google Scholar]
Figure 1. Particle size distribution.
Buildings 15 00775 g001
Figure 2. (a) The CA used in this study; (b) the BFRP and steel bars.
Buildings 15 00775 g002
Figure 3. Pull-out test. (a) The sample preparation; (b) a schematic of the pull-out specimen.
Buildings 15 00775 g003
Figure 4. (a) The slab mould showing the reinforcement arrangements; (b) a diagram illustrating the elevation and end-view of the slab specimens.
Buildings 15 00775 g004
Figure 5. (a) Ultrasonic pulse velocity testing; (b) the testing arrangement for the pull-out; (c) the testing arrangement of the slabs.
Buildings 15 00775 g005
Figure 6. UPV and absorption capacity for different mixes.
Buildings 15 00775 g006
Figure 7. Mechanical properties of concrete mixes at twenty-eight days.
Buildings 15 00775 g007
Figure 8. Bond–slip curves for steel and BFRP samples with different carbonated aggregate content.
Buildings 15 00775 g008
Figure 9. The load–deflection relationship of the slabs.
Buildings 15 00775 g009
Figure 10. Failure modes of the tested slabs.
Buildings 15 00775 g010
Table 1. Particle density and water absorption rate for the used aggregates.
Natural Coarse AggregatesNatural SandCA
Saturated surface dry density SSD (kg/m3)241324161980
Specific gravity2.42.41.98
Water absorption rate %1.74.4416.4
Table 2. Concrete mixes.
MixCement (kg/m3)Natural Sand (kg/m3)NCA (kg/m3)CA (kg/m3)Free Water (kg/m3)Additional Water for CA SSD (kg/m3)
Control46370092702500
25 CA4635259271442505
50 CA46335092728925010
100 CA463092757825020
Table 3. The results of the pull-out tests.
SpecimenMean Measured Compressive Strength, fc (MPa)Failure Mode Ultimate   Bond   Strength ,   τ
(MPa)
Slip at Ultimate Bond Strength (mm)
Mean ValueStandard
Deviation
Mean ValueStandard
Deviation
Steel-0 CA30.3Pull-out10.30.441.010.05
BFRP-0 CA30.3Pull-out10.70.472.940.59
BFRP-25 CA31.1Pull-out9.440.993.510.74
Table 4. The ultimate load and cracking moment for the tested slabs.
Slabfc (Mpa)Pcr (kN)Pu (kN)
S-NS-B36.3 (0.7)2380
S-25CA-B31.6 (0.41)1764.4
S-50CA-B34.0 (0.62)1558.5
S-NS-Steel36.7 (0.52)2583.3
Table 5. Cradle-to-gate CO2 emission values (in kg CO2 equivalent (CO2-e)).
Material10 mm BFRP Rebar10 mm Steel RebarCarbonated AggregatesNatural SandCoarse
Aggregate
WaterCement
A1–A32.61.2−0.09180.00480.0050.0010.73
Ref.EPD *[73]EPD[74][74][74][74]
* Environmental Product Declaration.
Table 6. Total cradle-to-gate CO2 emissions for concrete (in kg CO2 equivalent (CO2-e)).
SlabMaterialQuantity (kg)A1–A3Contribution to Emission (%)
Steel-reinforced OPC slab10 mm steel bars3.143.704.2
Cement115.7584.593.5
Sand1750.840.9
Aggregate231.751.161.3
Water62.50.0630.06
Total85890.3
BFRP-reinforced OPC slab10 mm BFRP bars0.7852.002.3
Cement115.7584.5095.4
Sand1750.840.9
Aggregate231.751.161.3
Water62.50.060.1
Total858 88.6
BFRP-reinforced OPC slab with 25% CA10 mm BFRP bars0.7852.042.4
Cement115.7584.5099.3
Sand131.250.630.7
Aggregate231.751.161.4
Water62.50.060.1
CA36−3.30−3.9
Total577.2585.1
BFRP-reinforced OPC slab with 50% CA10 mm BFRP bars0.7852.042.5
Cement115.7584.50103.6
Sand87.50.420.5
Aggregate231.751.161.4
Water62.50.060.1
CA72.25−6.63−8.1
Total569.881.5
Disclaimer/Publisher’s Note: The statements, opinions and data contained in all publications are solely those of the individual author(s) and contributor(s) and not of MDPI and/or the editor(s). MDPI and/or the editor(s) disclaim responsibility for any injury to people or property resulting from any ideas, methods, instructions or products referred to in the content.

