Article

Comparative Energy Balance Analysis—Case Study of Total Binder Energy Demand Evaluation

1
Department of Construction Management, Faculty of Civil Engineering, University of Zilina, Univerzitna 8215/1, 01026 Zilina, Slovakia
2
Department of Materials and Road Technology, Faculty of Civil Engineering and Architecture, Kielce University of Technology, Al. Tysiaclecia P.P. 7, 25-314 Kielce, Poland
*
Author to whom correspondence should be addressed.
Buildings 2025, 15(17), 3220; https://doi.org/10.3390/buildings15173220
Submission received: 7 July 2025 / Revised: 22 August 2025 / Accepted: 4 September 2025 / Published: 6 September 2025

Abstract

Energy demand is a critical challenge for sustainable infrastructure, yet in road asset management, it is rarely considered a central decision criterion. Most decision frameworks remain focused on financial and structural performance. This study introduces a comparative Energy Balance Analysis (EBA) as a complementary tool to existing life-cycle approaches. A case study is presented in which the only variable is binder composition—conventional 50/70 bitumen versus the same binder modified with 3% styrene–butadiene–styrene (SBS) polymer. The methodology integrates material-level energy demand estimation, laboratory performance testing, and pavement life modeling with HDM-4, and vehicle operational energy analysis. Results show that although SBS modification increases initial binder production energy by 13.3%, it doubles pavement service life and avoids mid-life rehabilitation, leading to a net saving of 110,671.75 MJ over 20 years. These findings confirm that early-stage material improvements can generate long-term energy efficiency gains. The study thus demonstrates the potential of EBA as a practical decision-support tool for sustainable pavement management.

1. Introduction

In the field of road asset management, energy consumption is rarely considered as a core decision-making criterion, despite growing concerns over climate change, resource depletion, and the environmental impacts of transport infrastructure. Traditional decision frameworks are dominated by financial, technical, and structural performance metrics, often neglecting the significant energy implications of material selection, maintenance frequency, and operational efficiency over a pavement’s life cycle [1,2,3,4,5].
A Life-Cycle Assessment (LCA) combined with Life-Cycle Cost Analysis (LCCA) is widely recognized as a well-established tool for supporting sustainable pavement selection. For instance, comparative studies such as [6] have evaluated bituminous versus concrete surfacing options, while others [7,8,9] have explored the relative energy and environmental performance of various bituminous technologies, including Hot-Mix Asphalt (HMA), Warm-Mix Asphalt (WMA), and those incorporating Reclaimed Asphalt Pavement (RAP).
To address the research gap concerning the actual integration of energy consumption in pavement asset management, this study introduces Comparative Energy Balance Analysis (EBA) as a practical tool that complements existing strategies, demonstrated through a targeted case study evaluating the energy performance of alternative bituminous binders. EBA enables the quantification of energy demand across the full pavement life cycle—from material production and construction, through maintenance, to energy consumption associated with vehicle operation on the road. It provides a robust basis for comparing alternative design options not only in terms of cost and service life, but also energy performance and environmental impact.
While comprehensive life-cycle energy assessments have been conducted, their focus generally remains broader than energy alone. Aryan et al. [10] reviewed LCA studies on pavements and road infrastructure, noting methodological challenges and the need to better integrate energy-related impacts. Hasan et al. [11] highlighted similar issues at the road network level, where energy flows are often inconsistently addressed. Giustozzi et al. [12] applied a multi-attribute LCA to preventive maintenance treatments, treating energy as one of several impact categories. These studies show that while energy is acknowledged in LCA frameworks, it is usually a secondary consideration, whereas the present study isolates and deepens the energy perspective through a focused Energy Balance Analysis (EBA). While these offer valuable insights, they are often complex, data-intensive, and difficult to implement in standard road planning practice. For most practical applications, this level of detail may not be necessary. Instead, a targeted differential approach—focusing only on variables [13] that differ between compared scenarios—can yield actionable results with significantly lower data requirements. By isolating the energy impact of a specific material or technological change, such as polymer modification of bitumen, decision-makers can make more informed and sustainability-oriented choices without overburdening the analysis.
A second challenge in applying energy assessments to pavement technologies lies in obtaining reliable input data for material production and performance over time [14,15]. This study demonstrates a methodology that integrates laboratory testing, spectral analysis (FTIR), and mechanistic pavement modeling (HDM-4) to overcome this barrier [16,17]. Specifically, the SBS polymer used for bitumen modification was characterized via Fourier Transform Infrared Spectroscopy (FTIR) to determine its composition and support energy demand estimation for polymerization processes. Simultaneously, standardized mechanical tests (penetration, softening point, elastic recovery) and fatigue modeling were employed to evaluate the structural performance of both conventional and modified binders [18,19].
This article presents a full comparative case study in which only one material component—the binder—is altered. By holding all other parameters constant (ceteris paribus principle), the energy effects of bitumen modification with SBS are isolated and evaluated.
The results demonstrate that even though SBS modification introduces a higher initial energy demand, it reduces operational energy consumption by enhancing pavement performance. Over a 20-year analysis period, the SBS-modified pavement results in a net energy savings of 110,671.75 MJ, validating the value of targeted EBA as a viable decision-support tool in pavement management.

Comparative Insights with Previous Studies

Although sustainability assessments of pavements frequently rely on established methods such as Life-Cycle Assessment (LCA) and Life-Cycle Cost Analysis (LCCA), energy demand itself is seldom treated as a central decision-making criterion in road asset management. This constitutes a critical research gap, since energy consumption is directly linked to both economic costs and environmental impacts such as CO2 emissions. The present study addresses this gap by introducing Energy Balance Analysis (EBA) as a complementary tool to LCA/LCCA. While LCA/LCCA provide a comprehensive overview of environmental and financial implications, EBA enables a more focused assessment of energy flows across the pavement life cycle. The binder was chosen as the key variable under investigation because it is the most energy-intensive component of asphalt mixtures and significantly influences long-term pavement performance. Consequently, binder modification offers a suitable case for demonstrating how EBA can capture both material-level energy effects and user-phase operational energy savings.
Previous research has demonstrated the importance of life-cycle-oriented methods in pavement sustainability assessments. For instance, ref. [10,11] critically reviewed methodological issues in integrated LCA and identified data availability as a persistent barrier to practical implementation, which is consistent with the challenges highlighted in this study. Similarly, ref. [9,14] emphasized that material production and binder modification are dominant contributors to the environmental footprint of asphalt pavements. Our findings corroborate these conclusions, particularly the strong influence of polymer modification on construction-phase energy demand.
However, unlike most comprehensive LCA-based studies [8,15], which aim to capture the full spectrum of environmental impacts across multiple materials and processes, the present research introduces a targeted differential Energy Balance Analysis (EBA). This approach isolates a single material variable—binder modification—and links it directly to both construction energy demand and vehicle operational energy consumption. In this sense, the study advances beyond prior work by explicitly connecting binder-level modifications with user-phase energy performance, which is rarely quantified in LCA-based comparisons.
Another contribution lies in the integration of laboratory performance data with mechanistic pavement modeling (HDM-4). Previous studies typically apply generic deterioration functions or default databases [12,16], whereas this paper demonstrates how experimental fatigue and rutting parameters can directly feed into life-cycle energy models. This methodological link strengthens the robustness of the comparative results and reduces the reliance on secondary data sources.
Despite these advancements, some research gaps remain. First, most existing studies—including this one—focus on conventional and polymer-modified binders; other alternative binders (bio-binders, recycled polymers, nano-modified bitumen) require systematic EBA-based evaluation. Second, the regional variability of traffic spectra, climate conditions, and maintenance strategies is still insufficiently addressed in energy-based frameworks. Finally, the integration of energy demand with broader environmental indicators such as GHG emissions, air quality, and resource circularity remains an open field for future studies.
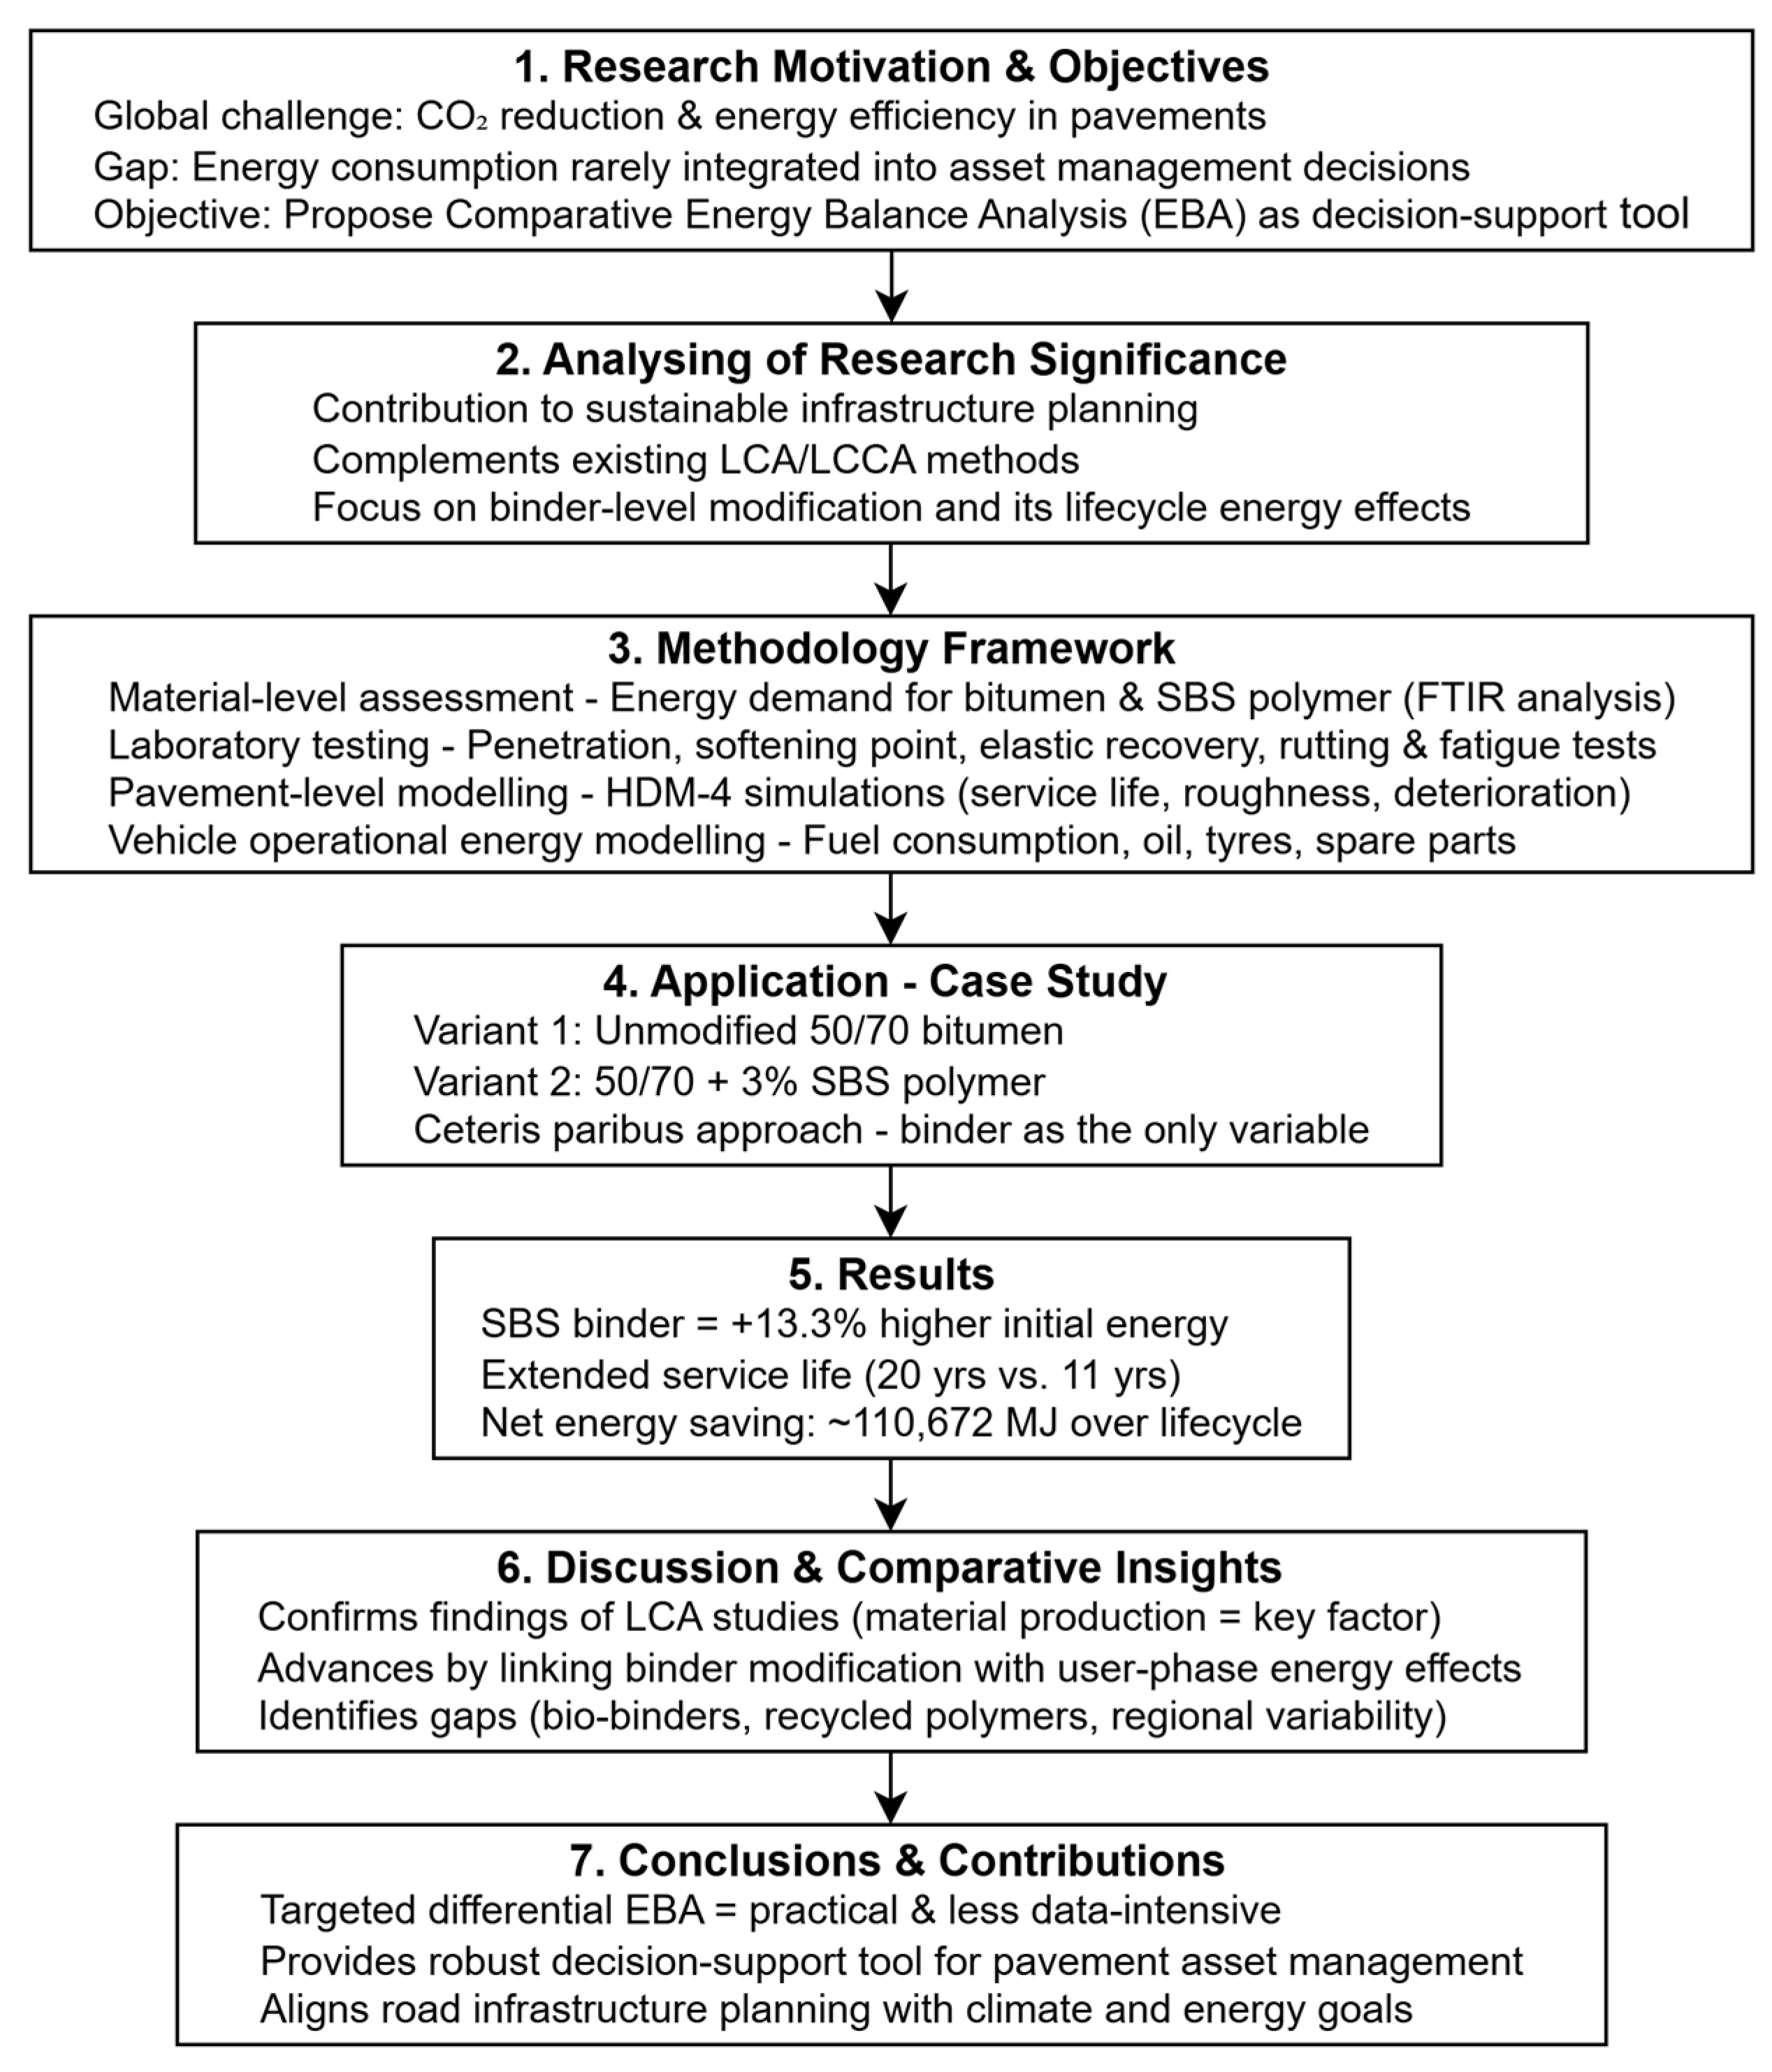
To enhance the readability of the study and to provide a clear overview of its logical structure, a research flowchart has been developed, shown in Figure 1. The diagram summarizes the motivation, objectives, and significance of the study, followed by the methodological framework, case study design, and key findings. By presenting the research process in a visual format, the flowchart allows readers to quickly grasp the scope and direction of the work, while also highlighting how each stage contributes to the overall aim of integrating energy balance analysis into pavement asset management.

2. Materials and Methods

The study applies a targeted differential Energy Balance Analysis (EBA) to compare two pavement variants that differ solely in the composition of the binder. All other structural, environmental, and traffic parameters are kept constant. This approach enables the isolation of energy effects associated with binder modification and avoids the complexity of full-system energy modeling.
The analysis consists of three integrated components:
  • Material-level energy demand assessment for bitumen and SBS polymer;
  • Laboratory-based performance testing of unmodified and modified binders;
  • Pavement-level modeling of service life and operational energy use using HDM-4 Version 2.11.01.

2.1. Spectroscopic Analysis of Polymer Modifier

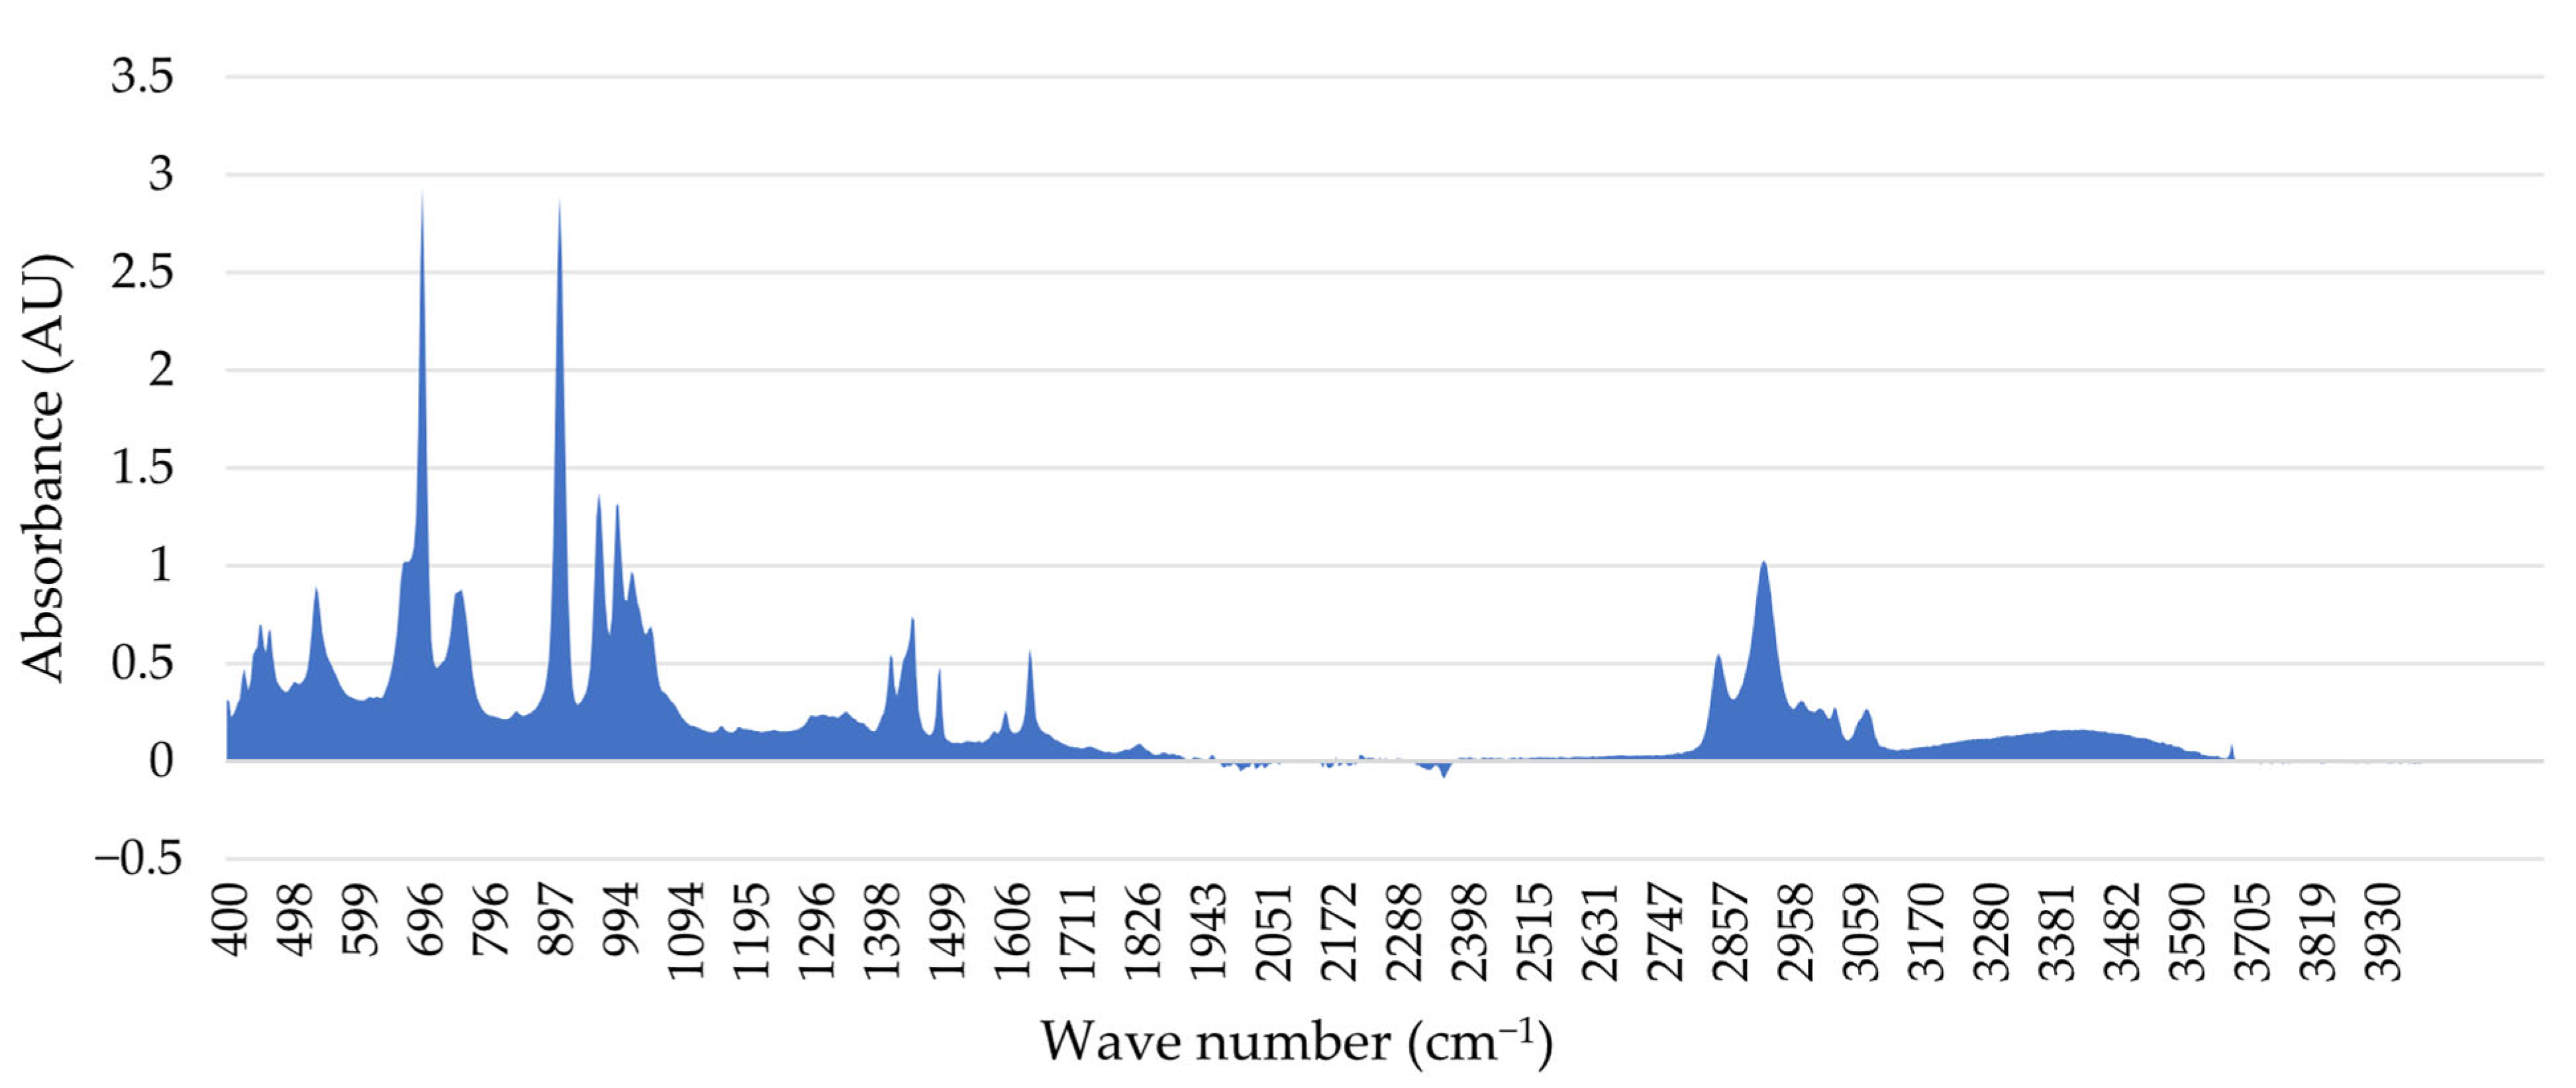
The SBS polymer used in the modification was analyzed using Attenuated Total Reflection Fourier Transform Infrared Spectroscopy (ATR-FTIR). The spectrum was used to estimate the PB/PS phase ratio and confirm the expected copolymer composition (Figure 2). This analysis supported energy demand estimation by verifying polymer identity and typical production pathways.
To conduct a comparative analysis and determine the PB/PS ratio, the characteristic peak areas at 699 cm−1 and 966 cm−1 were examined. Based on the relationship outlined in [20], the initial estimation indicated a PB/PS ratio of 51:49 in the SBS copolymer. Consequently, the SBS copolymer used in the tests is expected to exhibit a well-balanced interaction between the PS phase, which enhances bitumen stiffness, and the PB phase, which improves the elasticity of polymer-modified bitumen [21,22,23].

2.2. Laboratory Performance Testing

To assess the mechanical properties of the binders and mixtures, the following tests, shown in Figure 3, were conducted:
  • Penetration (EN 1426) [24];
  • Softening point (EN 1427) [25];
  • Elastic recovery (EN 13398) [26];
  • Wheel tracking Test (EN 12697-22) [27];
  • Fatigue testing (EN 12697-24) [28].
The results are shown in Table 1 and Table 2. Bitumen modification levels ranged from 0% to 3.5%, with 3% selected for detailed life-cycle modeling. The fatigue strain parameter (ε6) was used to estimate pavement service life.

2.3. Pavement Modeling and Service Life Estimation

A mechanistic pavement model was constructed to estimate the bearing capacity and fatigue life of each variant. The binder course (asphalt concrete maximum 22 mm grain size) was modeled using the material properties obtained from laboratory testing. Pavement layer inputs included the following:
  • Elastic modulus and flexural strength;
  • Layer thicknesses and Poisson’s ratios;
  • Traffic loading (converted to standard axle loads).
Two different asphalt concrete, maximum 22 mm grain size binder course layers were analyzed using an elastic half-space calculation model to evaluate service life and fatigue performance. The only variable in the analysis was the material composition of the binder course layer. The evaluated pavement structures included the following AC 22 mixtures:
  • AC 22 with unmodified road bitumen 50/70;
  • AC 22 with road bitumen 50/70 modified with 3% SBS.
The parameters for the calculation of pavement are presented in Table 3.
The estimation of residual pavement life follows the pavement structure design methodology outlined in [32]. This approach integrates the rheological properties of pavement layers with experimental fatigue testing, specifically measuring the fatigue parameter ε6 for the asphalt mixtures used in the pavement composition.
The maximum number of design axle load repetitions that the pavement can endure is determined using Equation (1):
E S A L s = 10 6 × ε 6 ε j B
where ESALs is the total number of design standard axle loads the pavement can sustain; ε6—the average strain (in micro strain, µm/m) obtained from the fatigue curve after 106 loading cycles; εj—the calculated relative strain at the bottom of the critical bituminous sub-layer within the pavement structure. This value is determined using a multilayer system model based on a homogeneous half-space approach. In this study, it refers specifically to the bottom edge of the AC 22 course. B is a fatigue characteristic representing the decline rate of the fatigue curve, where B = −1/b.
HDM-4 was used to simulate pavement deterioration over a 20-year period (2025–2045), calculate the time to rehabilitation, and project the evolution of the International Roughness Index (IRI).

2.4. Vehicle Operational Energy Modeling

Vehicle energy consumption was modeled as a function of pavement condition. Fuel energy use, oil consumption, tire wear, and spare parts replacement were calculated for each year using HDM-4-compatible formulas [33,34]. Fuel-cycle energy losses were incorporated using standard Fuel-Cycle Energy-Use Factors (FCEU). The Energy Balance Analysis (EBA) module within the Highway Development and Management Model (HDM-4) is designed to estimate total life-cycle energy consumption for road infrastructure projects. This includes energy use associated with construction, maintenance, vehicle operation, and supporting processes such as fuel and material production. In this research, the framework for analyzing energy used by motorized vehicle operation was used as direct propulsion energy (fuel burned during travel), as well as indirect consumption, such as the following:
  • Lubricating oil consumption;
  • Tire wear;
  • Spare parts usage;
  • Energy used in the manufacturing and maintenance of vehicles.

3. Results—Case Study of Energy Balance Analysis

The assessment of total energy demand across the life cycle of asphalt pavements represents a critical component in the evaluation of sustainable infrastructure solutions. Energy Balance Analysis (EBA) facilitates the quantification of energy consumption associated with material production, construction activities, maintenance interventions, and road usage. This framework enables the comparison of alternative investment options not only on the basis of financial metrics, but also in terms of their energy intensity and environmental demand of the pavement life cycle.
The present study undertakes a comparative EBA of two asphalt pavement variants that differ exclusively in the type of binder employed. The first variant incorporates unmodified road bitumen 50/70, while the second employs the same base bitumen modified with 3% of styrene–butadiene–styrene (SBS) polymer.
Adhering to the ceteris paribus principle, all other design and operational parameters—such as aggregate type, layer thickness, construction processes, and equipment usage—are held constant. This methodological constraint ensures that the observed differences in energy demand arise solely from the binder modification.
By isolating the energy implications of this single material substitution, the study illustrates that comprehensive life-cycle energy assessments may not always be necessary. In such cases, a targeted differential energy analysis offers a more efficient and methodologically sound approach for evaluating the sustainability of construction technologies. Nonetheless, as SBS modification has been shown to enhance pavement performance, extend service life, and reduce the frequency of maintenance interventions, these functional improvements must be explicitly incorporated into the analysis. This is achieved through a comparative assessment of operational energy consumption arising from motorized vehicle usage over the lifespan of each pavement alternative.

3.1. Comparative Energy Balance Analysis of Binder as a Variable Component in Asphalt Concrete Production

In line with the methodological framework introduced in the previous section, this subchapter presents the energy demand calculations for the binder component of the asphalt mixture, comparing Variant 1 (unmodified bitumen) and Variant 2 (SBS-modified bitumen).
The pavement structure under consideration consists of a surfacing course with a thickness of 160 mm, a lane width of 4.25 m, and a longitudinal section length of 1000 m. This configuration results in a total asphalt volume of 680 m3, as shown in Table 4. Given the bulk density of asphalt concrete AC 11, measured at 2422 kg/m3, the total mass of the mixture is calculated to be approximately 1646.96 tonnes.
A binder content of 6.0% by mass was selected for this analysis. This value was chosen as a conservative and representative figure based on production standards. While the minimum required binder content is dependent on nominal maximum aggregate size—typically decreasing from approximately 5.6% for 8 mm aggregates to 5.2% for 16 mm aggregates—a slightly higher value was adopted to ensure adequate durability and performance, and to align with the upper range of typical values cited in the literature. This selection is further supported by independent research, which indicates that the typical bitumen content for hot-mix asphalt commonly falls within a range of 4.5% to 6% [35]. Consequently, the total binder mass is determined to be 98.82 tonnes. The remaining 94% (1458.14 tonnes) consists of mineral aggregate, which remains unchanged in both variants and is therefore excluded from the comparative energy calculation.
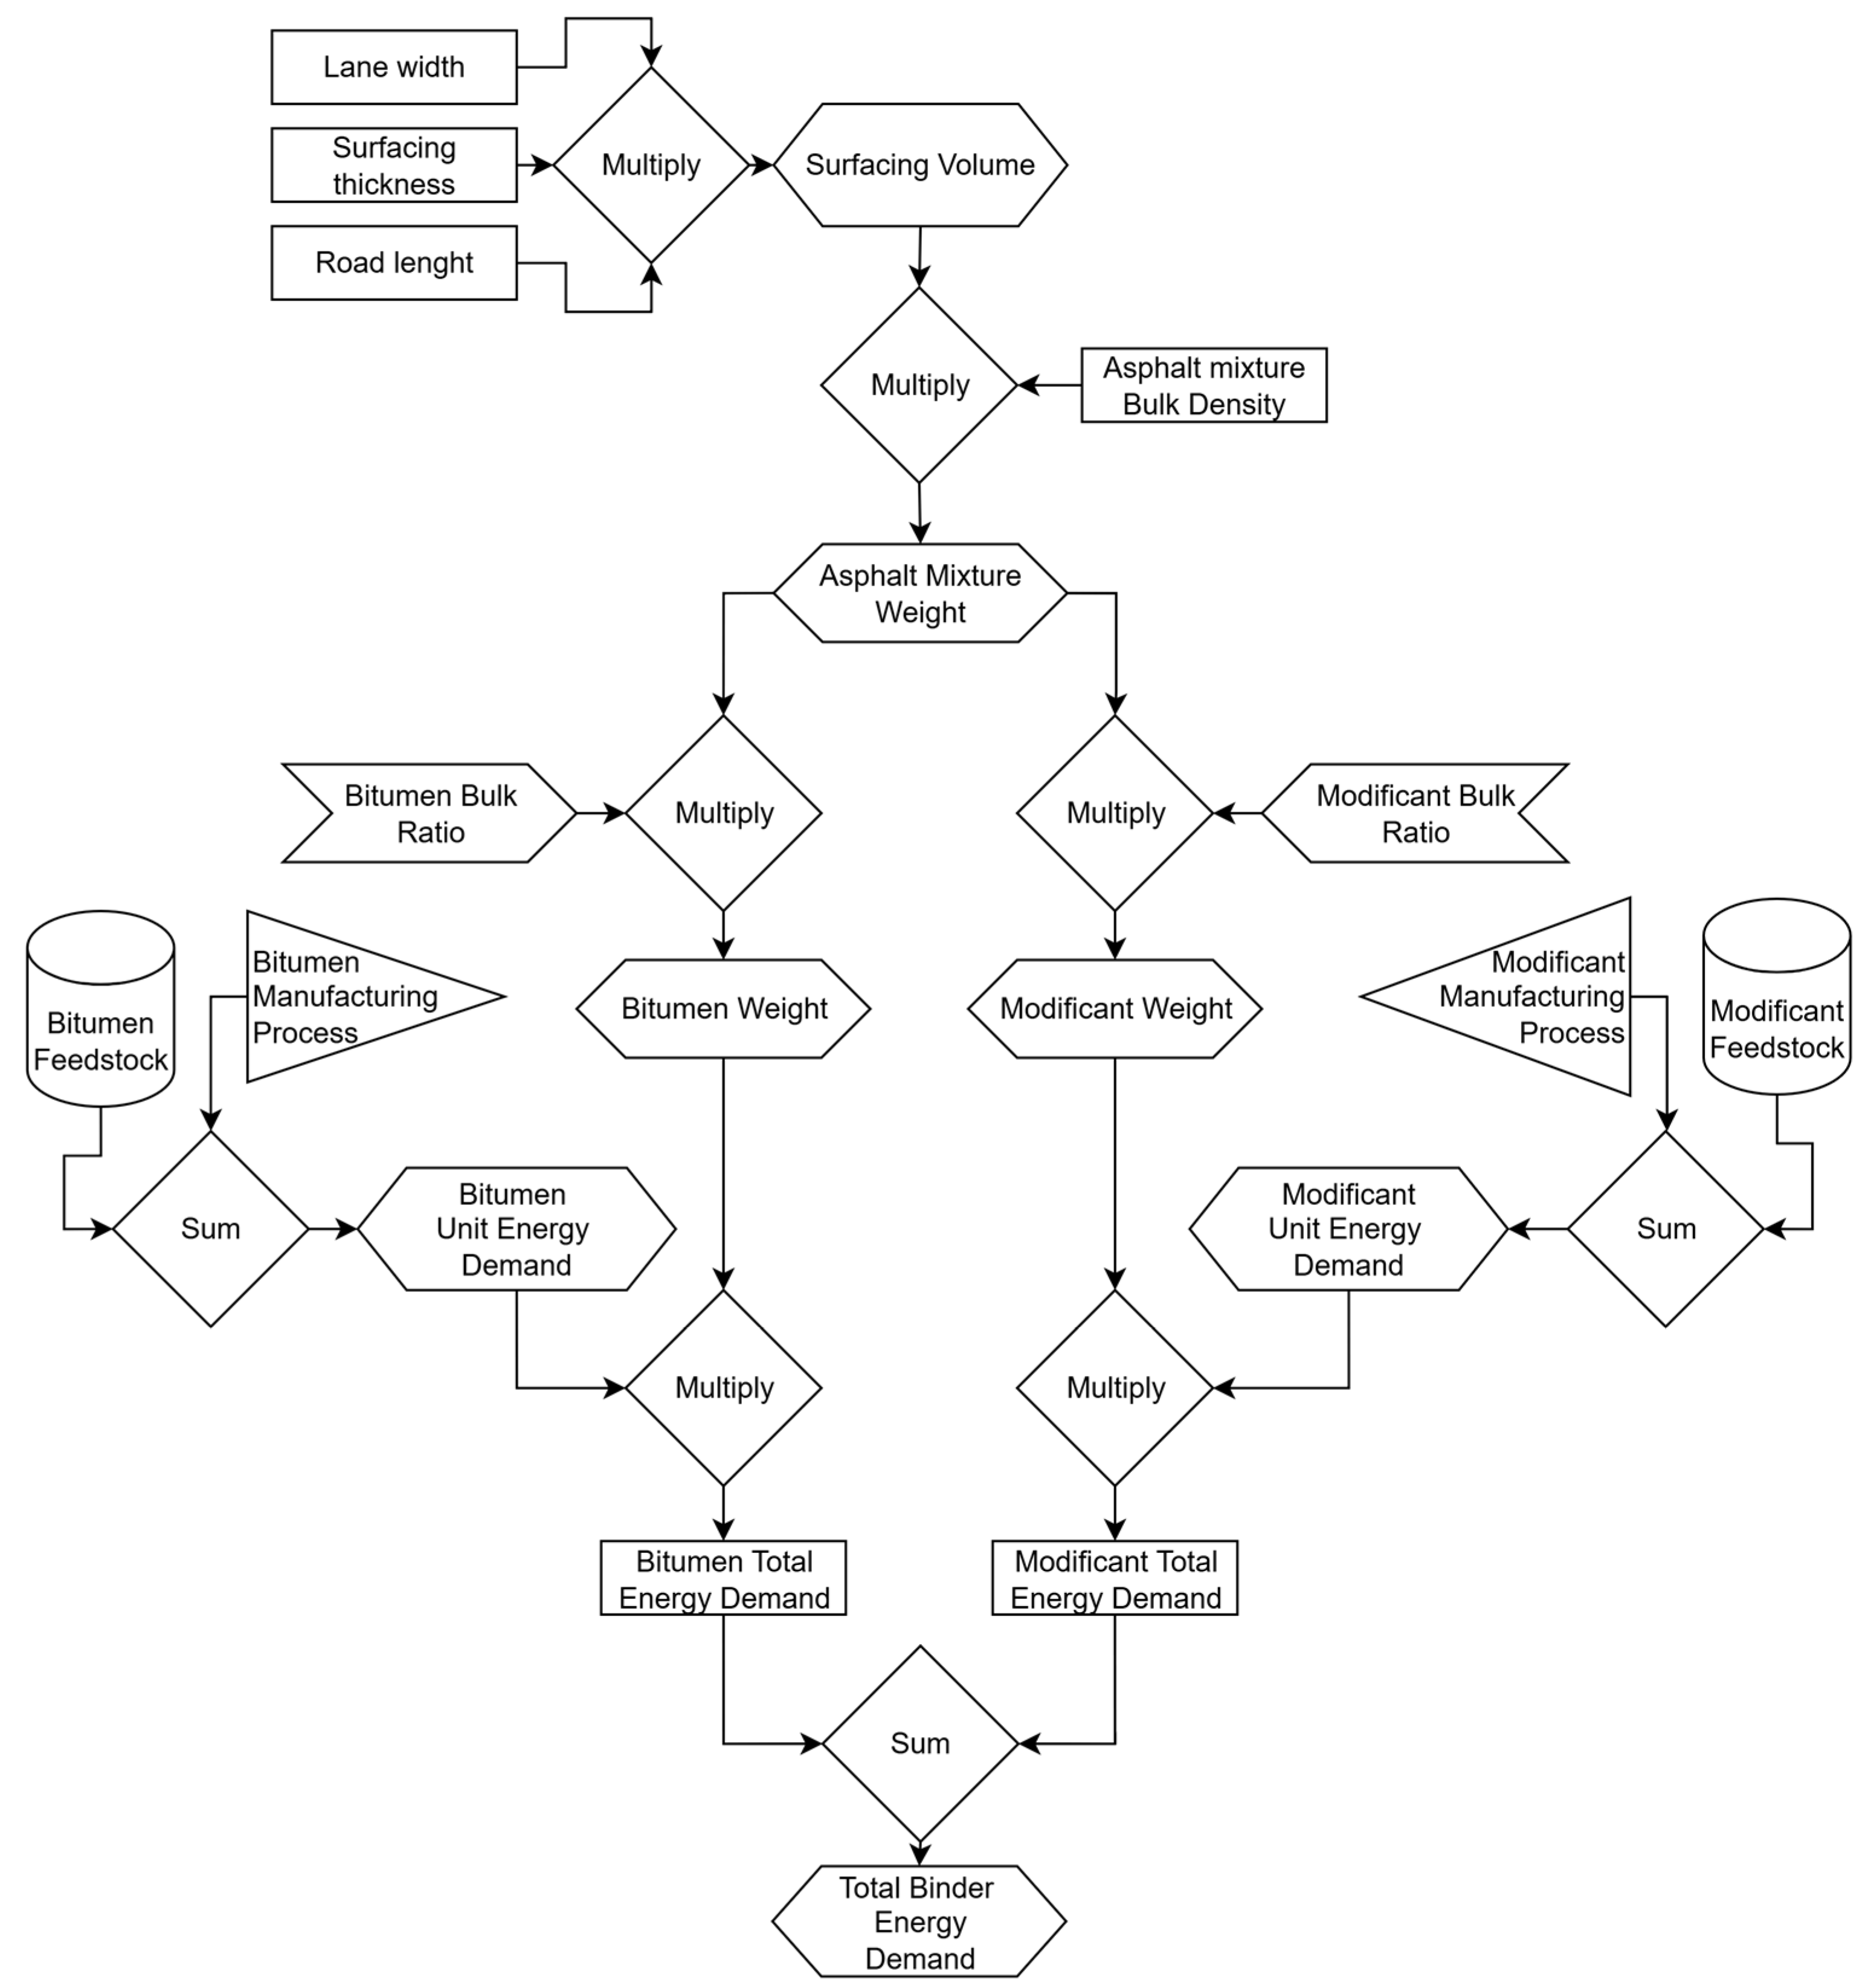
This subsection presents the calculation of energy demand per unit of material (MJ/tonne), derived according to the algorithm outlined in Figure 4. The procedure integrates case study parameters with material-specific input values in order to quantify the comparative energy balance of different binders. The input values presented in Table 5, Table 6, Table 7 and Table 8 were gathered in collaboration with professional partners, including asphalt mixing plants and refinery managers. These data reflect local production practices and may vary under different regional or technological conditions. Consequently, readers aiming to replicate the methodology are advised to obtain comparable input values from relevant stakeholders in their own context.
Natural crushed aggregates from several sources, located in east Europe – Slovakia region, were used in the evaluation as follows:
  • Melaphyre;
  • Andesite;
  • Dolomite.

3.1.1. Variant 1—Unmodified 50/70 Bitumen

In the first variant, the entire binder content consists of unmodified 50/70 road bitumen. The specific energy demand for the production of this bitumen is estimated at 4879.29 MJ per tonne. Applying this factor to the total binder quantity yields a cumulative energy demand of 482,171.44 MJ for Variant 1.

3.1.2. Variant 2—SBS-Modified Bitumen

The second variant incorporates a modified binder in which 3% of the total binder mass consists of SBS polymer, and the remaining 97% is unmodified 50/70 bitumen. This translates to 2.96 tonnes of SBS polymer and 95.86 tonnes of 50/70 bitumen.
The production energy demand for SBS polymer is substantially higher than for road bitumen, with an average value of 26,500 MJ per tonne, reflecting the complexity of its polymerization and processing stages. Based on this, the energy demand for each component in Variant 2 is calculated as follows:
50/70 Bitumen: 95.86 tonnes × 4879.29 MJ/t = 467,728.74 MJ
SBS Polymer: 2.96 tonnes × 26,500 MJ/t = 78,440 MJ
The total energy demand for the binder in Variant 2 is therefore 546,168.74 MJ.
The average value of 26,500 MJ/tonne for SBS polymer represents the result of a detailed energy analysis of its production, provided in collaboration with our industrial partner. This figure accounts for feedstock preparation, reaction energy, and separation and purification processes. As such values can differ significantly depending on regional production technologies and energy supply structures, researchers replicating this methodology are advised to obtain analogous data directly from the producers of the polymer or other modification agents considered in their analysis.

3.1.3. Comparative Evaluation

The net increase in energy demand resulting from the introduction of SBS modification is 63,997.30 MJ, representing a 13.3% increase relative to Variant 1. This additional energy demand must be assessed in conjunction with the expected improvements in pavement performance and service life associated with the modified binder, which are addressed in subsequent sections. The detailed data supporting this calculation are presented in Table 9.

3.2. Comparative Analysis of Pavement Performance and Vehicle Fleet Operational Energy Consumption

The influence of pavement design extends far beyond the initial construction phase, affecting not only structural longevity but also the operational efficiency of vehicles using the roadway. Pavement performance—defined by parameters such as fatigue resistance, rutting behaviour, and stiffness—directly impacts surface roughness and deformation, which in turn influence fuel consumption, maintenance, and deterioration of vehicle parts that need to be produced. As a result, the energy required for vehicle operation becomes an essential component of total life-cycle energy demand.
This chapter evaluates the impact of binder modification on pavement performance and the associated energy consumption of the vehicle fleet. The performance of both evaluated variants is assessed over a 20-year analysis period (2025–2045), based on mechanistic design and performance prediction using the HDM-4 framework. Both pavement variants are subjected to identical traffic and environmental conditions. The average annual daily traffic (AADT) is 6894 vehicles, with a composition of 4167 passenger cars and 2182 heavy articulated trucks. The remaining vehicles include vans, buses, and medium commercial vehicles. A compound annual traffic growth rate of 1.5% was applied to passenger cars and 1.0% to the remaining vehicle classes, based on regional forecasts. The cumulative traffic loading was converted to equivalent standard axle loads (ESALs) for the bearing capacity evaluation.

3.2.1. Pavement Performance—Variant 1: Asphalt Concrete with Unmodified 50/70 Bitumen

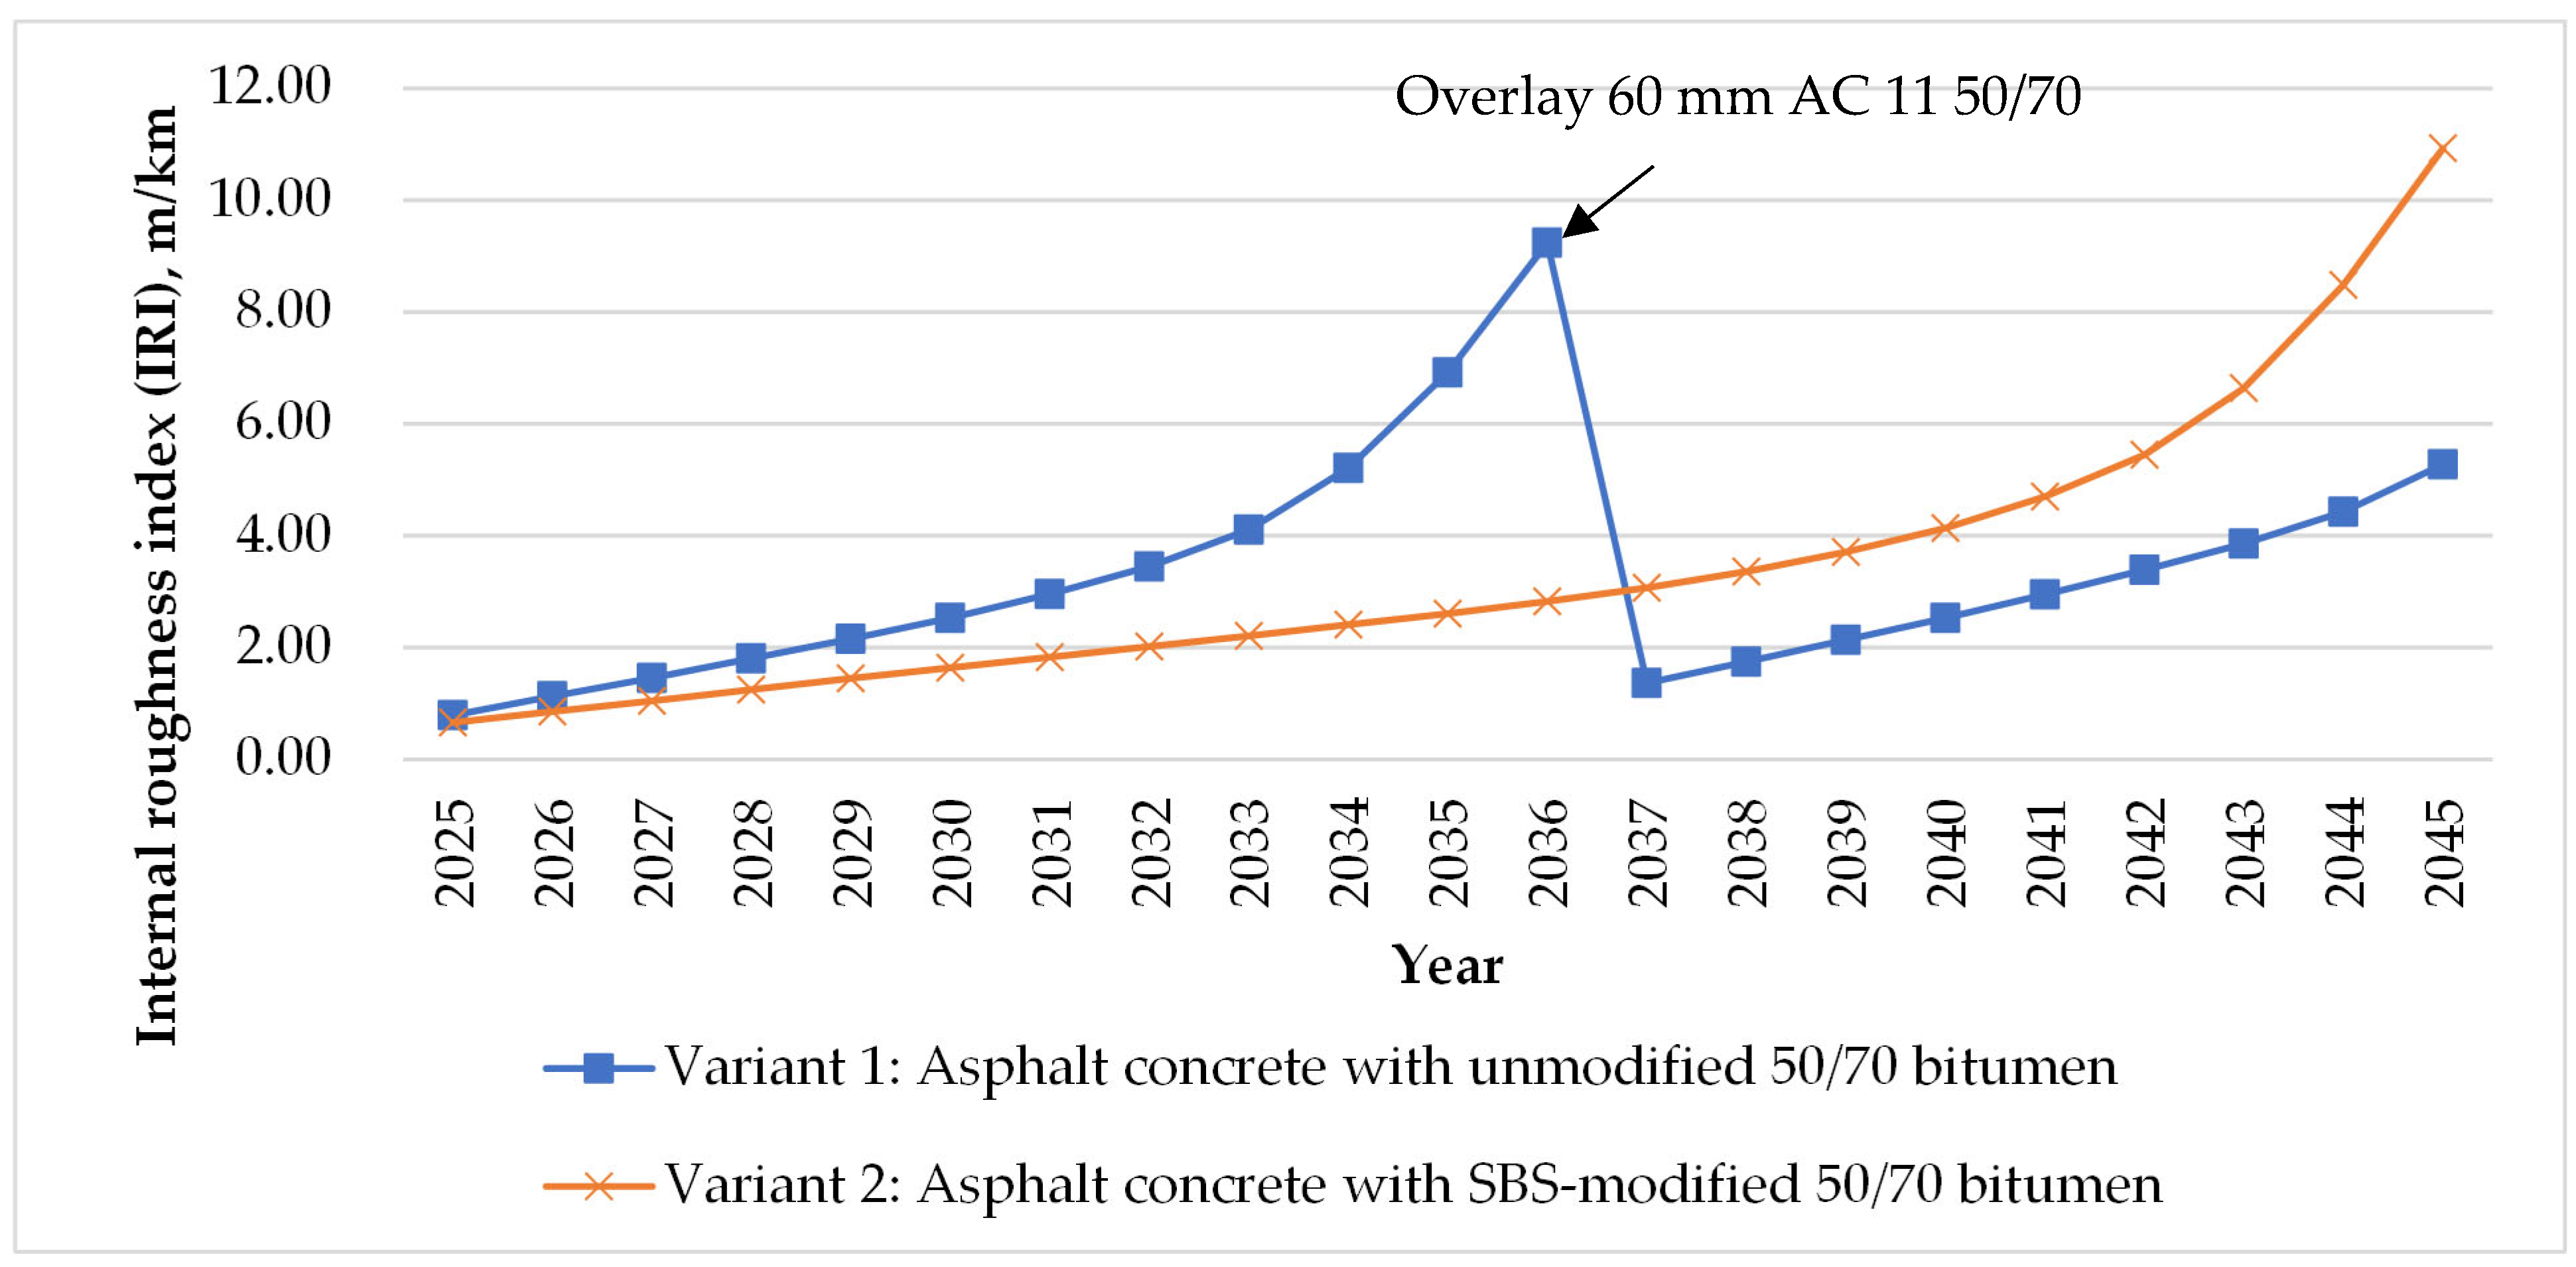
The calculated structural bearing capacity of Variant 1 allows for approximately 11 million design axle load repetitions, beyond which the fatigue criteria and surface condition thresholds are exceeded. According to HDM-4 projections, this point is reached after 11 years of operation, in the year 2036. By this time, the pavement roughness index (IRI) reaches 10 m/km, a value considered unacceptable for this road class under prevailing performance standards. Consequently, the pavement requires rehabilitation in the form of a 60 mm asphalt overlay of the surfacing layer.
The rehabilitation strategy assumes the use of the same material composition as the initial construction (AC 11 with 50/70 bitumen), and the energy demand for the overlay is calculated accordingly using identical material-specific energy factors. The reduced overlay thickness (60 mm compared to the original 160 mm) results in proportionally lower material quantities and energy demand. Following rehabilitation in 2037, the pavement performance is effectively reset and maintained at acceptable serviceability levels until the end of the analysis period in 2045.

3.2.2. Pavement Performance—Variant 2: Asphalt Concrete with SBS-Modified 50/70 Bitumen

In contrast, Variant 2—featuring 3% SBS polymer modification—exhibits substantially improved structural performance. The estimated bearing capacity is approximately 22 million design axle loads, effectively doubling that of Variant 1. As a result, the pavement maintains functional performance over the entire 20-year analysis period without requiring rehabilitation. The predicted IRI progression remains below the critical 10 m/km threshold throughout the period, preserving acceptable ride quality and minimizing maintenance needs.
Although Variant 2 avoids the need for mid-life structural rehabilitation, its bearing capacity is nearly exhausted by the end of the analysis window (2045). However, since the objective of the study is to evaluate comparative energy demand over a defined 20-year life cycle, no further extrapolation beyond this period is performed. The graphical comparison of performance outcomes for both variants is presented in Figure 5.

3.2.3. Calculation Principles for Vehicle Operational Energy Consumption

The energy consumed by vehicles during operation constitutes a major component of total life-cycle energy demand for road infrastructure. Vehicle propulsion is driven by a net force that overcomes resistive forces such as rolling resistance, air drag, gradient resistance, and inertial forces. While the propulsion force acts at the tire–pavement interface, its source lies in the combustion of fuel within the engine.
Each fuel type possesses a specific calorific value, known as the energy content of propulsion fuel (ECPF), expressed in megajoules per liter (MJ/L). These values may vary depending on fuel formulation, blending components, and octane rating; however, typical values are well-established and are presented in Table 10. The values in Table 10 and Table 11 represent widely used parameters for fuel properties and vehicle fleet composition, which are generally accessible from national statistics or technical handbooks. Since such parameters can differ depending on regional fleet characteristics and energy supply structures, researchers applying this methodology are encouraged to source the most context-appropriate data available in their country. In this study, the presented values were used to calculate operational energy demand in accordance with Equations (2)–(6).
Importantly, the energy content of fuel reflects only the energy stored in the final delivered product. The fuel production process itself—comprising extraction, refining, blending, and distribution—also requires substantial energy input. These upstream energy demands are expressed through a fuel-cycle energy use factor (FCEU), representing the energy required to produce one unit of fuel energy. The complete fuel-cycle energy demand is computed as the sum of the operational fuel energy and the upstream production energy, and representative values are listed in Table 11.
Thus, the total operational energy consumption per kilometer, which accounts for both direct combustion energy and fuel-cycle losses, is calculated as follows:
E O T k = F C T k × E C P F × 1 + F C E U
where EOTk is operation energy consumption for vehicle type k (MJ/km); FCTk is fuel consumption during trip for vehicle type k (L/km); ECPF is energy content of propulsion fuel (MJ/L); and FCEU is fuel-cycle energy use factor (MJ/MJ of delivered fuel).
In addition to fuel, vehicles powered by internal combustion engines consume lubricating oil, which contributes to operational energy use. Oil is either gradually consumed due to mechanical operation or replaced at regular intervals due to contamination. Oil consumption during operation is typically modeled as a function of fuel consumption.
Oil replacement due to contamination is distance-based, often linked to manufacturer maintenance schedules. As with fuel, lubricating oil has a defined energy content, and its production also requires energy input. The standard value for the energy content of lubricating oil, including its production energy, is approximately 47.7 MJ per liter [39].
The lubricating oil-related energy consumption per vehicle type is calculated as follows:
E O I L k = O C T k × E C L O
where EOILk is energy consumption due to lubricating oil for vehicle type k (MJ); OCTk is lubricating oil consumption (liters); and ECLO is energy content of lubricating oil (MJ/L), typically 47.7 MJ/L [39].
Vehicle tires suffer material loss during the operation of the vehicle due to friction from circumferential, lateral, and normal forces acting on the wheel. The rate of tread wear is usually expressed as a consumption of a new tire equivalent. The energy content of a tire is usually 32 MJ/kg of tire material [39]. The following Equation (4) is used to calculate energy consumption due to tire wear:
E T Y R k = T C k × E C T × T W k
where ETYRk is tire energy consumption of vehicle k (MJ/km), TCk is number of equivalent new tires consumed per km, ECT is energy content of a tire, and TWk is tire weight of vehicle type k (kg per tire).
Spare parts and associated labour are closely related to vehicle operation. Vehicles sustain damage to components such as transmission, suspension, brake pads, and discs, and many others. The requirements for these parts depend mostly on vehicle age (in kilometers) and pavement surface, i.e., ride quality. Acceleration noise (acceleration and deceleration frequency and intensity) and road alignment also play a part in the consumption of spare parts. Spare parts consumption is expressed as a fraction of the new vehicle price. This fraction can be converted by a 1:1 ratio from energy demand for spare parts to energy demand for the construction of a new car. The following Equation (5) is used to calculate energy demand for spare parts and Equation (6) for production of a new car:
E S P k = S P C k × E V P k
where ESPk is energy for spare parts consumption of vehicle k (MJ/km), SPCk is spare part consumption as a proportion of new vehicle price, and EVPk is vehicle production energy use (MJ/km).
E V P k = E N V P R O D k × P V S L k
where ENVPRODk is total energy used in the production of vehicle type k, and PVSLk is predicted vehicle service life of vehicle type k (km).
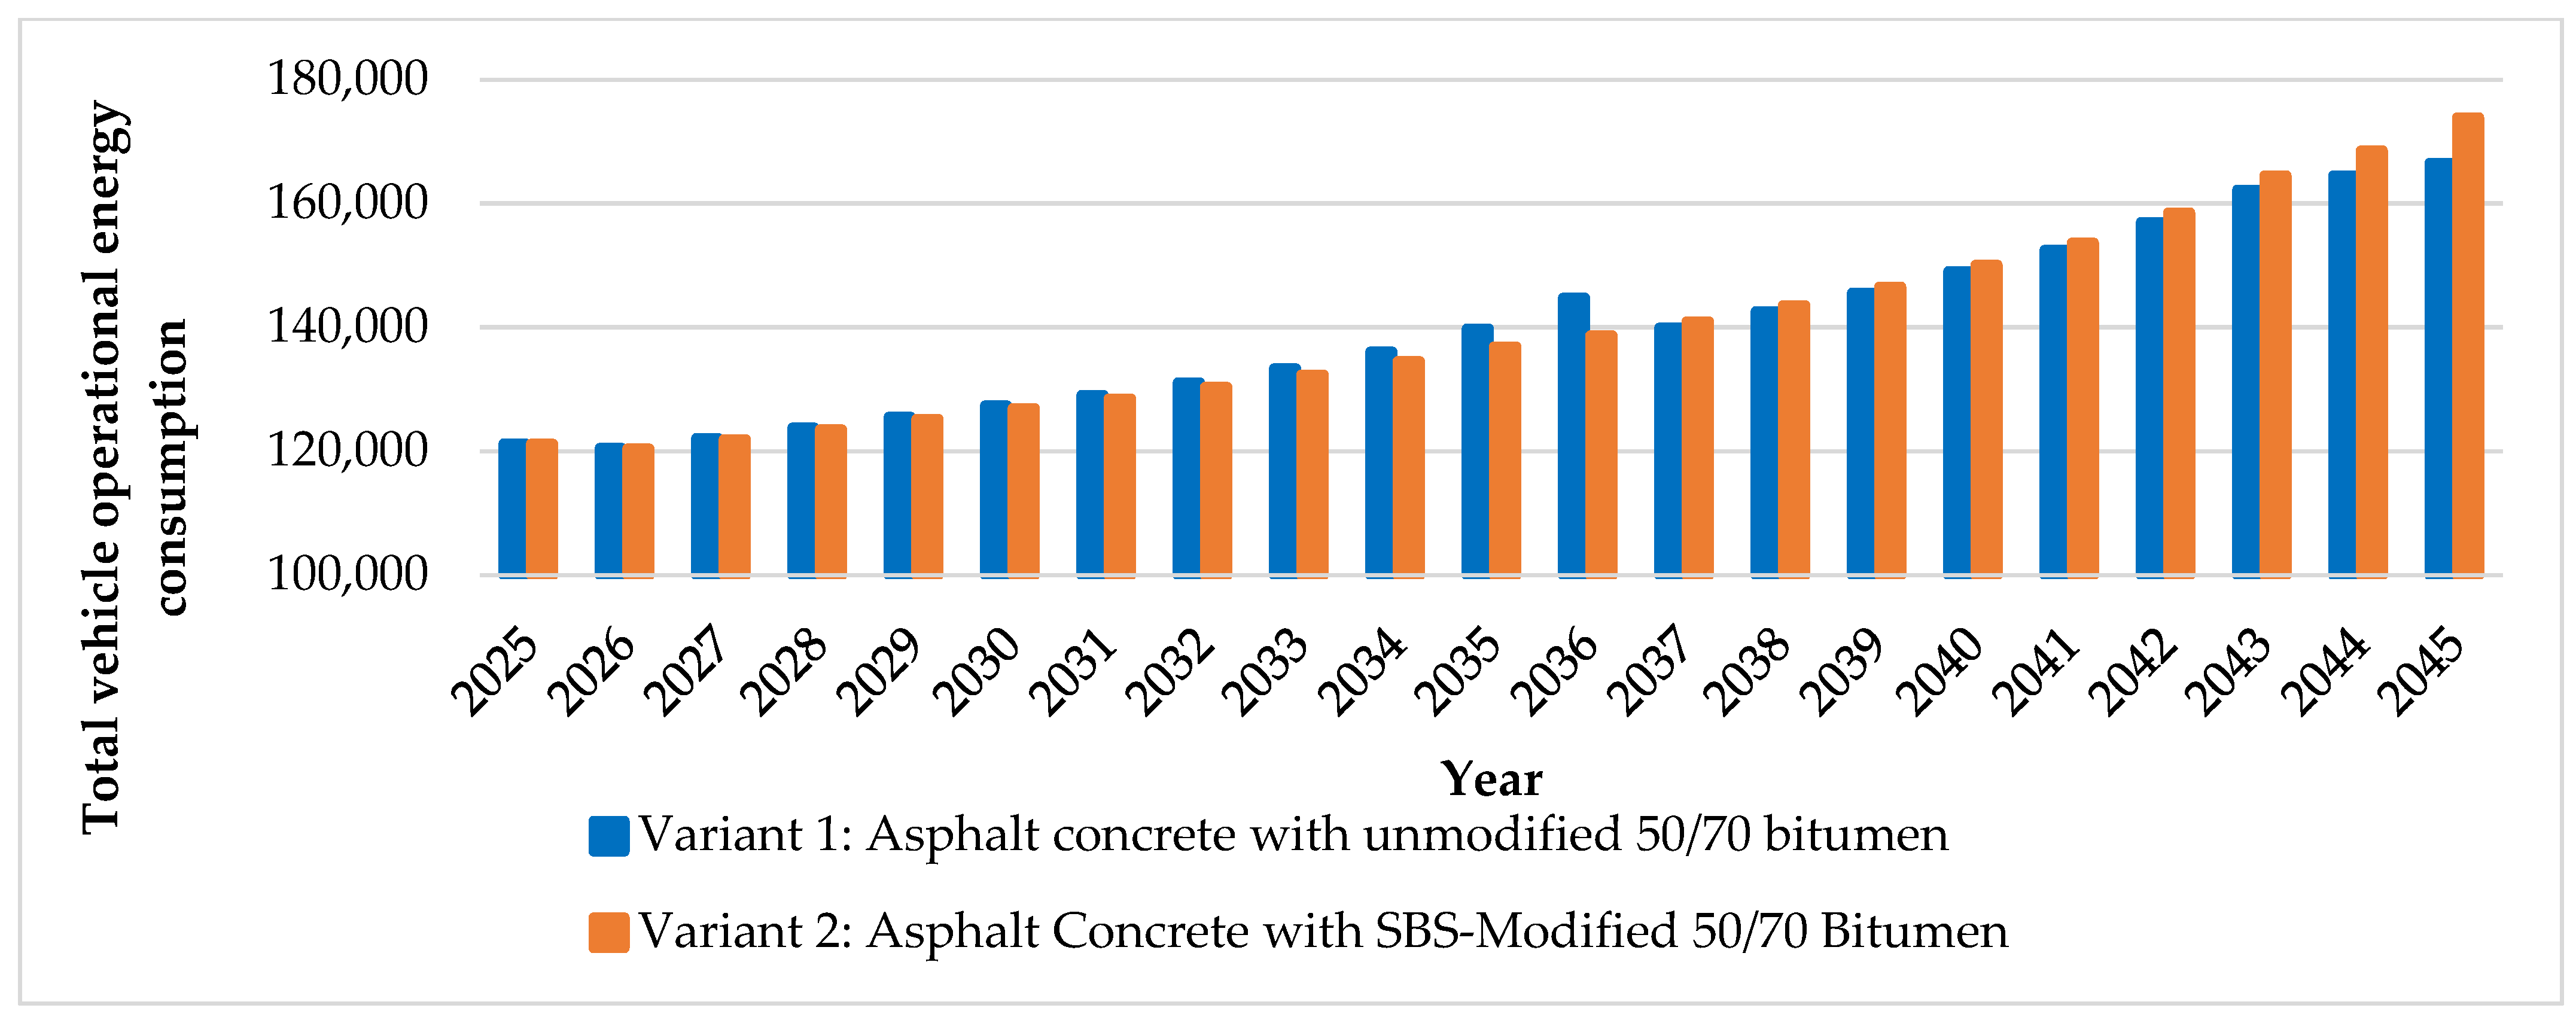
Figure 6 presents the annual total operational energy consumption of the vehicle fleet for both pavement variants over the 20-year analysis period (2025–2045). For consistency and to avoid speculative assumptions, present-day fleet energy consumption values were applied uniformly across the analysis horizon, analogous to the use of fixed prices in life-cycle cost analysis (LCCA).
The results clearly reflect the dynamic relationship between pavement performance and energy demand. As pavement surface condition deteriorates—most notably through increasing roughness and deformation—vehicle rolling resistance and fuel consumption rise accordingly, leading to higher operational energy use. This trend is particularly evident in Variant 1, where the progressive deterioration of the unmodified pavement culminates in a marked increase in energy consumption prior to rehabilitation in 2037. Following the overlay intervention, pavement roughness is restored to near-initial levels, resulting in an immediate and observable reduction in vehicle energy demand. In contrast, Variant 2, which incorporates the SBS-modified binder, maintains lower operational energy consumption during the initial years due to its superior fatigue resistance and slower deterioration. However, in the later years of the analysis period—particularly after 2037—its energy consumption exceeds that of Variant 1, which benefits from restored pavement condition following rehabilitation.
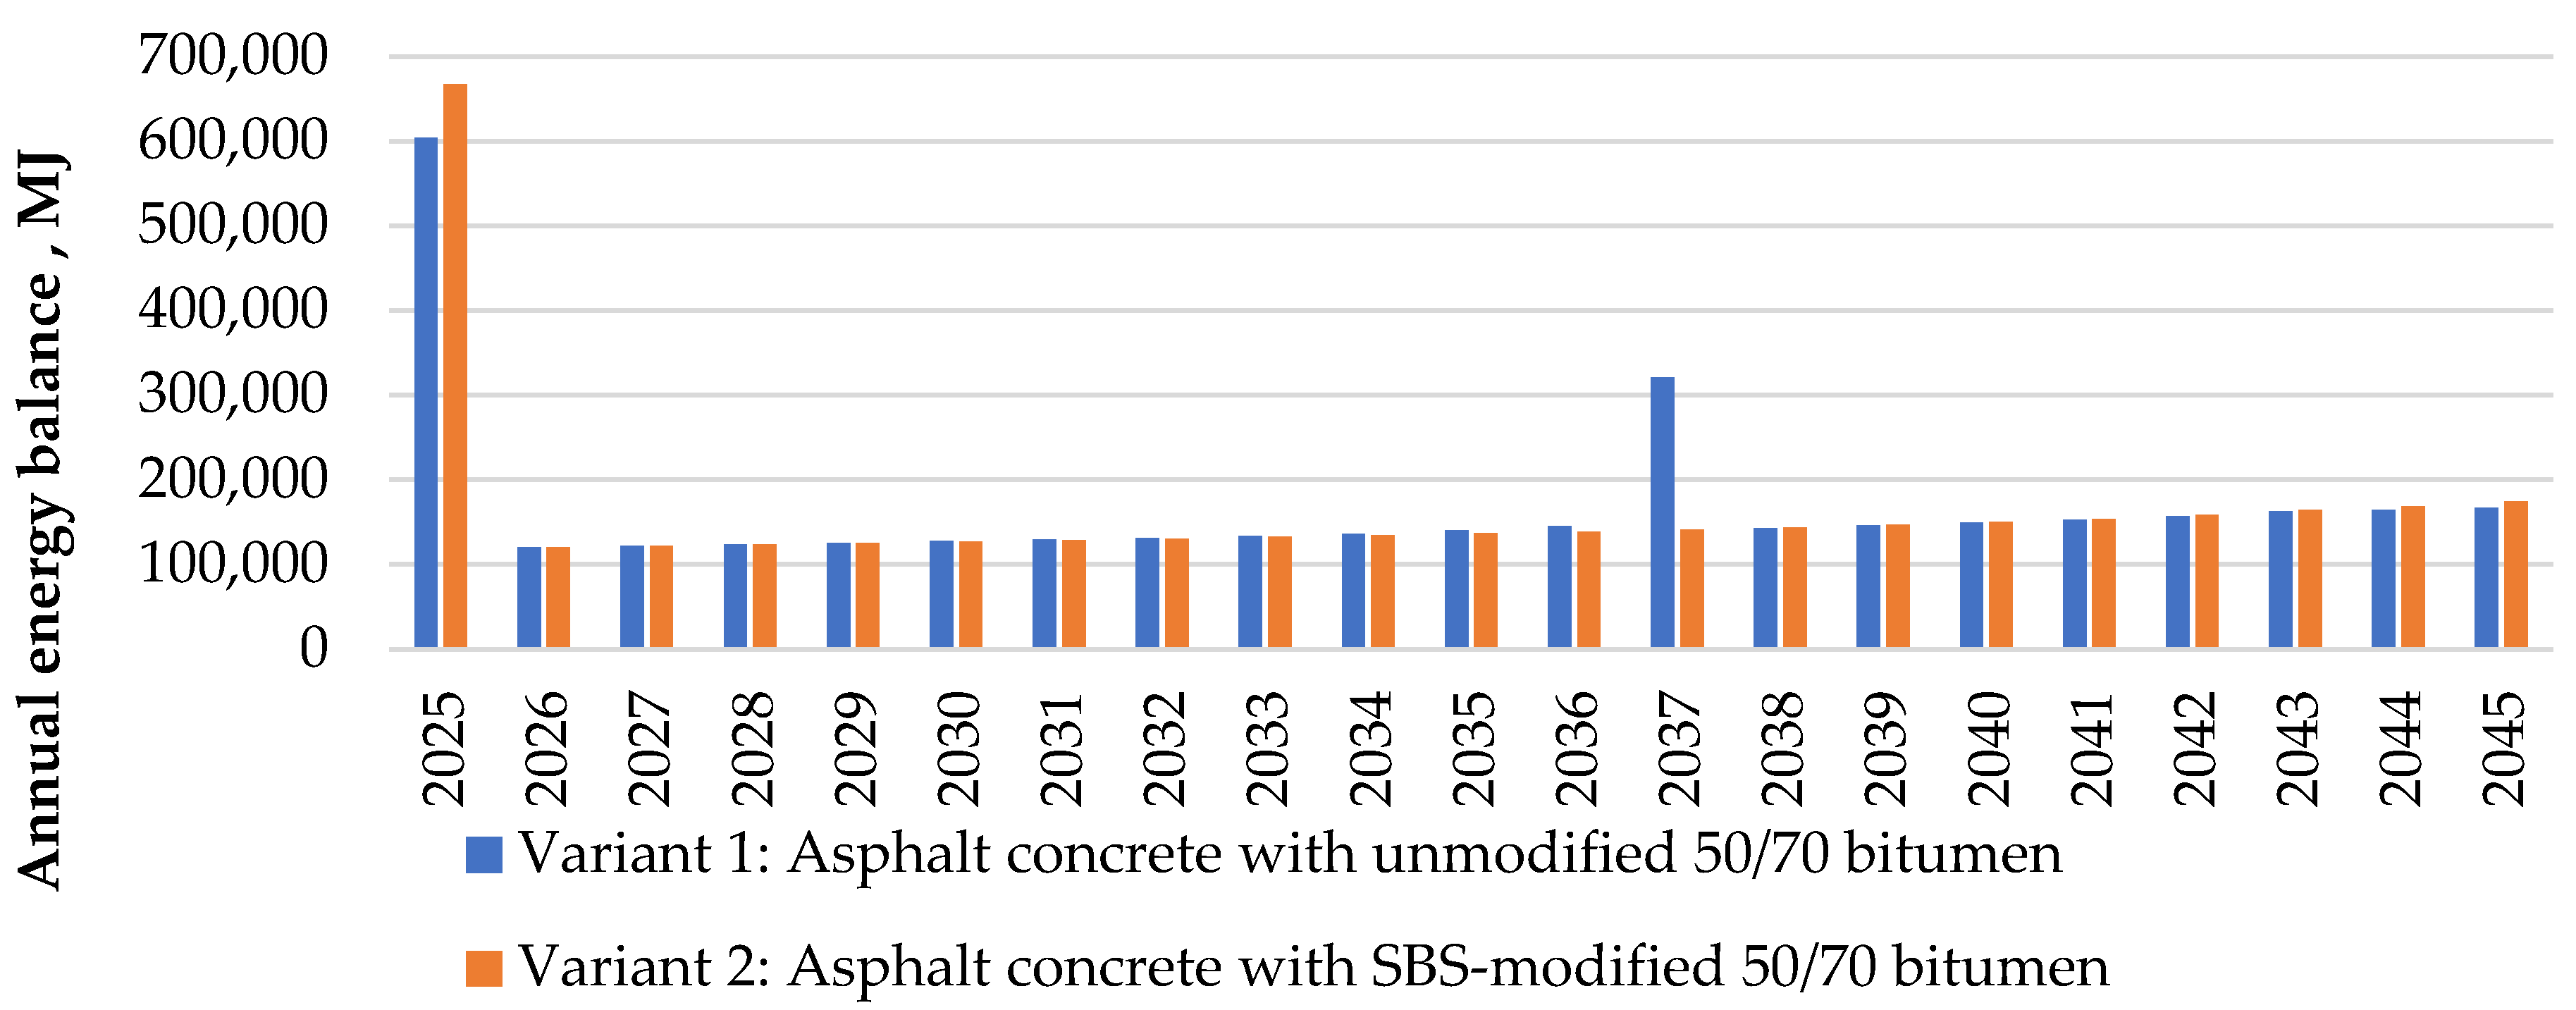
To synthesize the comparative findings, Table 12 and Figure 7 present the annual energy demand for each variant, segmented into initial construction (binder-related energy), operational energy (vehicle fleet consumption), and—where applicable—rehabilitation energy. For Variant 1, the energy demand includes both the binder energy in the original pavement layer (482,171.44 MJ in the year of its construction, 2025) and the binder energy associated with the 60 mm asphalt overlay applied during rehabilitation in 2037 (180,809.90 MJ). Variant 2 includes only the initial binder energy (546,168.74 MJ in the year of its construction, 2025), as no rehabilitation is required within the analysis horizon.
The columns Vehicle Fleet Operational Energy Consumption represent the annual energy requirements of the traffic stream for both variants. These values were calculated using Equations (2)–(6) for all vehicle classes, which remain identical in both scenarios. Therefore, the only factor influencing the differences in operational energy consumption between Variant 1 and Variant 2 is the progression of pavement condition, not traffic demand.
The column Annual Energy Balance Difference is the net energy difference between Variant 1 and Variant 2 for each year. The column Cumulative Energy Balance represents the running total of these annual differences over the entire analysis period.
The results demonstrate that although Variant 2 begins with a higher construction-phase energy input due to the energy-intensive SBS polymer (approximately 13.3% higher than Variant 1), it consistently offers lower operational energy consumption in the early and middle years. After 2037, following the rehabilitation of Variant 1, this trend reverses; however, the additional operational energy demand in Variant 2 does not outweigh the energy demand of the rehabilitation works required in Variant 1.
By the end of the evaluation period in 2045, the Cumulative Energy Balance reaches +110,671.75 MJ, indicating that the SBS-modified pavement resulted in a net reduction of over 110 GJ in life-cycle energy consumption when compared to the conventional 50/70 binder. This saving is equivalent to approximately 2850 L of diesel fuel, or the annual operational energy consumption of about eight average passenger cars. This outcome highlights the long-term energy efficiency advantages of early-stage material improvements, even when they entail higher initial energy investment.
4. Discussion

The application of Energy Balance Analysis (EBA) in infrastructure asset management provides valuable insights into the environmental efficiency of alternative design and maintenance strategies. However, its implementation raises several methodological and practical considerations that influence its applicability and usefulness in routine decision-making.

4.1. Data Availability and Material Identification

A key challenge in energy-based assessments is obtaining accurate and transparent data on material composition and production energy demand. While laboratory techniques such as Fourier Transform Infrared (FTIR) spectroscopy can be used to identify polymeric modifiers and validate material properties, these methods are time-consuming, equipment-intensive, and impractical for routine project-level analysis. For this reason, direct cooperation with material suppliers is preferred, as they are best positioned to provide reliable data on feedstock sources, manufacturing processes, and associated energy consumption. Encouraging suppliers to disclose this information as part of standardized Environmental Product Declarations (EPDs) would significantly enhance the quality, transparency, and comparability of EBA inputs. The development of sector-wide EPD databases could provide a robust foundation for integrating energy performance into procurement and asset management frameworks.

4.2. Targeted Differential Analysis vs. Full Life-Cycle Assessments

One of the key findings from this study is the practical advantage of applying a targeted differential approach in EBA. Instead of attempting a comprehensive life-cycle energy assessment that includes every construction input, transportation activity, and maintenance procedure, it is often more effective to identify and isolate the variables that differ between compared investment options. This approach significantly reduces data requirements while still delivering a robust comparative outcome.
Nevertheless, it is important to clarify when a full LCA is still required. In cases where policy or regulatory frameworks demand an assessment of the full environmental footprint—including greenhouse gas emissions, air pollutants, water consumption, or resource circularity—a comprehensive LCA remains indispensable. EBA should therefore be viewed as a complementary method that can provide rapid and focused insights into energy efficiency, while broader environmental dimensions continue to rely on full LCA. It should also be emphasized that energy demand, as quantified in this study, is the direct precursor of CO2 emissions. The results can therefore be easily translated into carbon equivalents by applying national or regional energy mix emission factors. This ensures that the comparative proportionality between scenarios is preserved, while keeping the methodology transparent and transferable across different policy and geographic contexts.

4.3. Significance of Energy-Relevant Variables

Not all design variables have the same impact on total energy demand. For example, material transport to the construction site and on-site processing are typically minor contributors compared to material production, particularly when the same transport distances apply to both variants. However, this assumption should not be generalized without scrutiny. In some cases—such as projects involving remote sites, heavy imported materials, or energy-intensive construction equipment—transport and processing energy may be non-negligible and should be explicitly included in the analysis.

4.4. Functional Impact of Material Choices

Equally important is the long-term performance of materials. The results of this study demonstrate that SBS modification, despite its higher initial energy demand, extends pavement service life and reduces rehabilitation needs. When these benefits are considered in terms of total energy demand of ownership or life-cycle value, the advantages become even more pronounced: reduced maintenance interventions lead to lower user delay energy demand, deferred capital expenditures, and a smaller operational energy footprint. This broader perspective reinforces the importance of performance-driven material choices.

4.5. EBA as a Supportive Decision-Making Tool

While EBA is an important addition to sustainability evaluation, it should be viewed as a complementary tool within a broader asset management framework. Financial, structural, and technical criteria will continue to drive most investment decisions. However, EBA can enhance these evaluations by introducing an environmental energy dimension that reflects both material production and use-phase energy effects. EBA can support decision-making in several ways:
  • Procurement and bidding: EBA-based indicators could be incorporated into tender specifications, encouraging contractors to propose energy-efficient material and design solutions.
    As a standalone environmental criterion for sustainability-oriented procurement;
    As a sub-criterion within broader environmental impact categories, such as the following:
    a.
    CO2 emissions (through conversion of MJ to CO2 eq using fuel-based emission factors);
    b.
    Air pollution (e.g., NOₓ and PM associated with fuel combustion);
    c.
    Resource efficiency (e.g., non-renewable energy share)
    d.
    Life cycle environmental footprint.
  • Design optimization: Designers can use EBA results to compare alternative pavement structures and select options that balance energy demand, durability, and energy efficiency.
  • Policy support: Road agencies may integrate EBA as a sub-criterion within sustainability-oriented asset management strategies, aligning infrastructure planning with energy and climate goals.

5. Conclusions

This study has demonstrated the applicability and value of targeted differential Energy Balance Analysis (EBA) as a decision-support tool in road asset management. By isolating the binder as the only variable between two asphalt pavement variants—unmodified 50/70 bitumen and SBS-modified bitumen—the analysis provided a clear and quantifiable comparison of their energy demands across both construction and operational phases.
Despite its higher production energy, the SBS-modified binder resulted in improved pavement performance, which translated into extended service life, deferred rehabilitation, and lower vehicle operational energy consumption. Over a 20-year life cycle, this led to a net energy saving of 110,671.75 MJ compared to the conventional binder. This outcome underscores the potential of early-stage material improvements to yield long-term energy and environmental benefits.
The study also highlights that comprehensive life-cycle assessments are not always necessary to support energy-informed decision-making. A targeted differential approach can effectively capture the relative impact of key variables, provided that material performance is well understood and accurately modeled. Laboratory testing and HDM-4 simulations were essential to quantify these performance-driven energy effects.
Finally, while EBA should not replace financial or structural performance metrics, it offers a valuable environmental perspective that can inform more sustainable investment decisions. Its integration—either as a standalone environmental criterion or as part of a broader sustainability assessment—can help align road infrastructure planning with energy efficiency and climate goals.

Author Contributions

Conceptualization, M.K. and Ľ.R.; methodology, M.K.; software, Ľ.R.; validation, M.K. and Ľ.R.; formal analysis, M.K. and J.Š.; investigation, Ľ.R.; resources, Š.Š.; data curation, M.K., J.Š., Š.Š., G.M. and Ľ.R.; writing—original draft preparation, M.K. and Ľ.R.; writing—review and editing, Ľ.R.; visualization, M.K. and G.M.; supervision, Š.Š., Ľ.R. and J.Š.; project administration, Š.Š.; funding acquisition, G.M., Š.Š. and J.Š. All authors have read and agreed to the published version of the manuscript.

Funding

This paper was supported by the Slovak Research and Development Agency under the contract No. APVV-22-0040.

Data Availability Statement

The data presented in this study are available on request from the corresponding author.

Conflicts of Interest

The authors declare no conflict of interest.

Nomenclature

Abbreviations
EBA Energy Balance Analysis
FTIRFourier Transform Infrared Spectroscopy
LCA Life-Cycle Assessment
LCCA Life-Cycle Cost Analysis
EPD Environmental Product Declaration
HDM-4 Highway Development and Management, version 4
SBS Styrene–Butadiene–Styrene polymer
NOxNitrogen Oxides
PMParticulate Matter
Laboratory and Pavement Parameters
ε6 Fatigue strain at 106 loading cycles [µm/m]
S Stiffness modulus [MPa]
r Rut depth [mm]
Nf Number of cycles to fatigue failure [–]
h Pavement layer thickness [mm]
Traffic and Modeling
AADT Annual Average Daily Traffic [vehicles·day−1]
HV Share of heavy vehicles in traffic stream [%]
ESAL Equivalent Single Axle Load [–]
t Year of analysis [year]
SL Pavement service life [years]
Variables in Equations (2)–(6)
EOTk Operational energy consumption for vehicle type k [MJ·km−1]
FCTk Fuel consumption for vehicle type k [L·km−1]
ECPF Energy content of propulsion fuel [MJ·L−1]
FCEU Fuel-cycle energy use factor [MJ·MJ−1]
EOILk Energy due to lubricating oil for vehicle type k [MJ·km−1]
OCTk Lubricating oil consumption [L·km−1]
ECLO Energy content of lubricating oil [MJ·L−1]
ETYRk Energy due to tire wear for vehicle type k [MJ·km−1]
TCk Equivalent new tires consumed per kilometer [tyres·km−1]
ECT Energy content per unit tire mass [MJ·kg−1]
TWk Tire mass for vehicle type k [kg·tyre−1]
ESPk Energy for spare parts for vehicle type k [MJ·km−1]
SPCk Spare parts consumption fraction [–]
EVPk Vehicle production energy use per kilometer [MJ·km−1]
ENVPRODk Total energy used in production of vehicle type k [MJ·vehicle−1]
PVSLk Predicted vehicle service life [km]

References

  1. Haas, R.; Hudson, W.R. Pavement Asset Management; John Wiley & Sons: Hoboken, NJ, USA, 2015. [Google Scholar]
  2. Zhang, H.; Keoleian, G.A.; Lepech, M.D. Network-level pavement asset management system integrated with life-cycle analysis and life-cycle optimization. J. Infrastruct. Syst. 2013, 19, 99–107. [Google Scholar] [CrossRef]
  3. Zofka, A. Proactive pavement asset management with climate change aspects. IOP Conf. Ser. Mater. Sci. Eng. 2018, 356, 012005. [Google Scholar] [CrossRef]
  4. Markow, M.J. Current asset management practices applied to pavement markings. Transp. Res. Rec. 2008, 2055, 78–86. [Google Scholar] [CrossRef]
  5. Mandičák, T.; Spišáková, M.; Mésároš, P. Sustainable Design and Building Information Modeling of Construction Project Management towards a Circular Economy. Sustainability 2024, 16, 4376. [Google Scholar] [CrossRef]
  6. Heidari, M.R.; Heravi, G.; Esmaeeli, A.N. Integrating life-cycle assessment and life-cycle cost analysis to select sustainable pavement: A probabilistic model using managerial flexibilities. J. Clean. Prod. 2020, 254, 120046. [Google Scholar] [CrossRef]
  7. Zheng, X.; Easa, S.M.; Ji, T.; Jiang, Z. Incorporating uncertainty into life-cycle sustainability assessment of pavement alternatives. J. Clean. Prod. 2020, 264, 121466. [Google Scholar] [CrossRef]
  8. Azadgoleh, M.A.; Mohammadi, M.M.; AzariJafari, H.; Santos, J.; Ahmadi, A.; Alavi, M.Z.; Ayar, P. A comparative life cycle assessment (LCA), life cycle cost analysis (LCCA), mechanical and long-term leaching evaluation of road pavement structures containing multiple secondary materials. J. Clean. Prod. 2024, 458, 142484. [Google Scholar] [CrossRef]
  9. Gulotta, T.M.; Mistretta, M.; Praticò, F.G. A life cycle scenario analysis of different pavement technologies for urban roads. Sci. Total Environ. 2019, 673, 585–593. [Google Scholar] [CrossRef]
  10. Aryan, Y.; Dikshit, A.K.; Shinde, A.M. A critical review of the life cycle assessment studies on road pavements and road infrastructures. J. Environ. Manag. 2023, 336, 117697. [Google Scholar] [CrossRef] [PubMed]
  11. Hasan, U.; Whyte, A.; Al Jassmi, H. Critical review and methodological issues in integrated life-cycle analysis on road networks. J. Clean. Prod. 2019, 206, 541–558. [Google Scholar] [CrossRef]
  12. Giustozzi, F.; Crispino, M.; Flintsch, G. Multi-attribute life cycle assessment of preventive maintenance treatments on road pavements for achieving environmental sustainability. Int. J. Life Cycle Assess. 2012, 17, 409–419. [Google Scholar] [CrossRef]
  13. Wenzel, H. Application dependency of LCA methodology: Key variables and their mode of influencing the method. Int. J. Life Cycle Assess. 1998, 3, 281–288. [Google Scholar] [CrossRef]
  14. Praticò, F.G.; Giunta, M.; Mistretta, M.; Gulotta, T.M. Energy and environmental life cycle assessment of sustainable pavement materials and technologies for urban roads. Sustainability 2020, 12, 704. [Google Scholar] [CrossRef]
  15. Kleizienė, R.; van de Beek, M.; Zofka, A.; Karbočius, M. Application of single score methods for environmental impact assessment to compare pavement technologies. Road Mater. Pavement Des. 2025, 26, 503–524. [Google Scholar] [CrossRef]
  16. Anand, S.; Gaur, A.; Hussain, S. Pavement deterioration modelling for urban and rural roads using HDM-4. Int. J. Pavement Res. Technol. 2025, 18, 493–515. [Google Scholar] [CrossRef]
  17. Chua, K.H.; Monismith, C.L.; Crandall, K.C. Dynamic decision model for pavement management using mechanistic pavement performance submodel. Transp. Res. Rec. 1993, 1397, 15–25. [Google Scholar]
  18. Masson, J.F.; Pelletier, L.; Collins, P. Rapid FTIR method for quantification of styrene-butadiene type copolymers in bitumen. J. Appl. Polym. Sci. 2001, 79, 1034–1041. [Google Scholar] [CrossRef]
  19. Zhang, Q.; Wang, T.; Fan, W.; Ying, Y.; Wu, Y. Evaluation of the properties of bitumen modified by SBS copolymers with different styrene–butadiene structure. J. Appl. Polym. Sci. 2014, 131. [Google Scholar] [CrossRef]
  20. Canto, L.B.; Mantovani, G.L.; deAzevedo, E.R.; Bonagamba, T.J.; Hage, E.; Pessan, L.A. Molecular Characterization of Styrene-Butadiene-Styrene Block Copolymers (SBS) by GPC, NMR, and FTIR. Polym. Bull. 2006, 57, 513–524. [Google Scholar] [CrossRef]
  21. Kozel, M.; Remek, Ľ.; Mikolaj, J.; Mušuta, J.; Šrámek, J.; Mazurek, G. Performance and lifecycle of hot asphalt mix modified with low-percentage polystyrene and polybutadiene compounds. Buildings 2024, 14, 389. [Google Scholar] [CrossRef]
  22. Mazurek, G.; Buczyński, P.; Iwański, M.; Podsiadło, M.; Pypeć, P.; Kowalczyk, A. Effects of the Mixing Process on the Rheological Properties of Waste PET-Modified Bitumen. Materials 2023, 16, 7271. [Google Scholar] [CrossRef]
  23. Mazurek, G.; Buczyński, P.; Kowalczyk, A. The Effect of Recycled Geogrid Fibres on Asphalt Concrete Performance: A Case Study from Poland. Materials 2024, 17, 5923. [Google Scholar] [CrossRef]
  24. EN 1426; Bitumen and Bituminous Binders—Determination of Needle Penetration. CEN: Brussels, Belgium, 2015.
  25. EN 1427; Bitumen and Bituminous Binders—Determination of the Softening Point—Ring and Ball Method. CEN: Brussels, Belgium, 2015.
  26. EN 13398; Bitumen and Bituminous Binders—Determination of the Elastic Recovery of Modified Bitumen. CEN: Brussels, Belgium, 2018.
  27. EN 12697-22; Bituminous Mixtures—Test Methods—Part 22: Wheel Tracking. CEN: Brussels, Belgium, 2020.
  28. EN 12697-24; Bituminous Mixtures—Test Methods for Hot Mix Asphalt—Part 24: Resistance to Fatigue. CEN: Brussels, Belgium, 2018.
  29. Šrámek, J.; Kozel, M.; Remek, L.; Mikolaj, J. Evaluation of bitumen modification using a fast-reacting SBS polymer at a low modifier percentage. Materials 2023, 16, 2942. [Google Scholar] [CrossRef]
  30. Decký, M.; Drusa, M.; Papán, D.; Šrámek, J. The relationship between dynamic and static deformation modulus of unbound pavement materials used for their quality control methodology. Materials 2022, 15, 2922. [Google Scholar] [CrossRef] [PubMed]
  31. Gago, F.; Valletta, A.; Mužík, J. Formulation of a basic constitutive model for fine-grained soils using the hypoplastic framework. Civ. Environ. Eng. 2021, 17, 450–455. [Google Scholar] [CrossRef]
  32. Kozel, M.; Remek, Ľ.; Ďurínová, M.; Šedivý, Š.; Šrámek, J.; Danišovič, P.; Hostačná, V. Economic impact analysis of the application of different pavement performance models on first-class roads with selected repair technology. Appl. Sci. 2021, 11, 10409. [Google Scholar] [CrossRef]
  33. Perrotta, F.; Parry, T.; Neves, L.C.; Buckland, T.; Benbow, E.; Mesgarpour, M. Verification of the HDM-4 fuel consumption model using a Big data approach: A UK case study. Transp. Res. Part D Transp. Environ. 2019, 67, 109–118. [Google Scholar] [CrossRef]
  34. Ko, K.H.; Moon, B.K.; Lee, T.W.; Lee, W.H.; Yoo, I.Y.; Lee, S.Y.; Jeong, S.H. An economic calibration method for fuel consumption model in HDM4. Wirel. Pers. Commun. 2016, 89, 959–975. [Google Scholar] [CrossRef]
  35. Nega, A.; Ainalem, N.; Nikraz, H.; Leek, C.; Ghadimi, B. Pavement Materials Characterization of Hot-Mix Asphalt Mixes in Western Australia. Adv. Mater. Res. 2013, 723, 434–443. [Google Scholar] [CrossRef]
  36. Birkenmajer, K.; Grocholski, A.; Milewicz, J.; Nairn, A.E. Palaeomagnetic studies of Polish rocks. II. The Upper Carboniferous and Lower Permian of the Sudetes. Ann. Soc. Geol. Pol. 1968, 38, 435–474. [Google Scholar]
  37. Lakirouhani, A.; Asemi, F.; Zohdi, A.; Medzvieckas, J.; Kliukas, R. Physical parameters, tensile and compressive strength of dolomite rock samples: Influence of grain size. J. Civ. Eng. Manag. 2020, 26, 789–799. [Google Scholar] [CrossRef]
  38. Török, Á.; Czinder, B. Relationship between density, compressive strength, tensile strength and aggregate properties of andesites from Hungary. Environ. Earth Sci. 2017, 76, 566. [Google Scholar] [CrossRef]
  39. Odoki, J.B.; Kerali, H.G. HDM-4: Highway Development and Management. Volume Four: Analytical Framework and Model Descriptions; Asociación Mundial de Carreteras (PIARC): París, France, 2000. [Google Scholar]
Figure 1. Research flowchart.
Buildings 15 03220 g001
Figure 2. FTIR spectra for the SBS block copolymers.
Buildings 15 03220 g002
Figure 3. From the left side—penetration, elastic recovery, softening point, wheel tracking, and fatigue.
Buildings 15 03220 g003
Figure 4. EBA analysis scheme.
Buildings 15 03220 g004
Figure 5. Pavement performance of Variant 1 and Variant 2.
Buildings 15 03220 g005
Figure 6. Total vehicle operation energy consumption analysis.
Buildings 15 03220 g006
Figure 7. Annual energy balance.
Buildings 15 03220 g007
Table 1. Parameters of bitumen—penetration, softening point, and elastic recovery [data from [29], used for estimation of polymer content dosage].
BitumenModification DosageEl. Recovery (%)Softening Point (°C)Penetration (0.1 mm)
50/700%114966
2%225255
2.5%395353
3%505346
3.5%505345
Table 2. Parameters of mixture—fatigue and rutting parameters of mixtures (data from [21] used for estimation of rheology and RUT parameters of mixtures).
MixtureBitumen50/70 + 3% SBS 50/70
Stone mastic asphalt maximum 11 mm grain sizeWTS (mm)0.085 mm0.098 mm
RD (mm)1.875 mm1.890 mm
PRD (%)4.68%4.69%
Ɛ6 (μm)120110
Asphalt concrete maximum 11 mm grain sizeWTS (mm)0.10 mm0.125 mm
RD (mm)2.000 mm2.310 mm
PRD (%)4.98%5.46%
Ɛ6 (μm)117105
Asphalt concrete maximum 22 mm grain sizeWTS (mm)0.145 mm0.182 mm
RD (mm)2.370 mm2.700 mm
PRD (%)3.95%4.91%
Ɛ6 (μm)9890
Table 3. Pavement construction and layer properties.
LayerLayer ThicknessPoisson NumberComplex ModulusFlexural Strength
Asphalt concrete max 11 mm grain40 mm0.306000 MPa3.20 MPa
Asphalt concrete max 16 mm grain60 mm0.304600 MPa2.80 MPa
Asphalt concrete max 22 mm grain —with road bitumen 50/70 60 mm0.333050 MPa2.40 MPa
Asphalt concrete max 22 mm grain —with road bitumen 50/70 +3% SBS0.334250 MPa2.71 MPa
Cement stabilization C8/10180 mm0.222000 MPa0.80 MPa
Gravel subbase200 mm0.35350 MPa-
Subgrade estimated via [30,31] -0.3580 MPa-
Table 4. Volume of evaluated surfacing layer.
Volume of Evaluated Surfacing Layer
Surfacing courseThicknessLane widthRoad section lengthVolume
160 m4.25 m1000 m680 m3
Table 5. Bulk density of asphalt concrete.
Bulk Density of Asphalt Concrete AC 11, kg/m3 and Mass
AC 11 bulk density2422 kg/m3
AC 11 mass of surfacing layer1646.96
Table 6. Aggregate type and parameters (the compressive strength and density taken from the literature [36,37,38]).
Rock TypeCompressive Strength (MPa)Density (kg/m3)Excavation DifficultyExpected Energy Consumption (kWh/m3)Expected Energy Consumption
(MJ/m3)
Expected Energy Consumption
(MJ/t)
Melaphyre150–2502600–2900high1.2–2.54.32–9.001.57–3.27
Andesit100–2002400–2800medium–high0.8–2.02.88–7.20 1.11–2.77
Dolomite50–1502700–2900medium0.5–1.51.80–5.400.64–1.93
Table 7. Mass of Constituent Materials in the Evaluated Layer.
Mass of Constituent Materials in the Evaluated Asphalt Surfacing Layer
ComponentVariant 1: AC 11 50/70Variant 2: AC 11 50/70 + 3% SBS
50/70 Bitumen98.82 t95.86 t
SBS polymer-2.96 t
Mineral aggregate1458.14 t1458.14 t
Total1556.96 t1556.96 t
Table 8. Energy demand per unit of material.
Energy Demand Per Unit of Material MJ/t
Bitumen 50/704879.29
SBS modifier26,500
Table 9. Total energy demand of the binder component in the evaluated surfacing layer for both variants.
Binder ComponentVariant 1: AC 11 50/70Variant 2: AC 11 50/70 + 3% SBS
50/70 Bitumen482,171.44 MJ467,728.74 MJ
SBS polymer-78,440 MJ
Total482,171.44 MJ546,168.74 MJ
Difference63,997.30 MJ
Table 10. Energy content of propulsion fuels (ECPF) in MJ/L [39].
FuelEnergy Content of Propulsion Fuel (MJ/L)
Diesel38.7
Petrol34.7
CNG (MJ/m3)40
LPG (90% propane, 10% butane)25.5
Ethanol23.9
Methanol18.1
Biodiesel32.8
Table 11. Fuel-cycle energy use factors (FCEU) by fuel type (MJ/MJ delivered) [39].
FuelFuel Production Energy Use (MJ/MJ)
Diesel0.122
Petrol0.169
CNG (MJ/m3)0.061
LPG (90% propane, 10% butane)0.122
Biomethanol0.514
Biodiesel0.655
Biomethanol0.510
Table 12. Comparative energy balance analysis.
YearEnergy Consumption of Binder Production During Construction and RehabilitationVehicle Fleet Operational Energy ConsumptionAnnual Energy Balance DifferenceCumulative Energy Balance
Variant 1Variant 2Variant 1Variant 2
2025482,171.44546,168.74121,191.62121,157.51−63,963.19−63,963.19
2026 120,494.31120,389.71104.60−63,858.59
2027 122,078.43121,899.30179.13−63,679.46
2028 123,746.53123,488.60257.93−63,421.53
2029 125,505.88125,163.38342.50−63,079.03
2030 127,323.42126,885.07438.35−62,640.68
2031 129,018.46128,461.90556.56−62,084.12
2032 131,055.28130,339.38715.90−61,368.22
2033 133,313.78132,337.78976.00−60,392.22
2034 136,049.63134,497.631552.00−58,840.22
2035 139,762.72136,860.172902.55−55,937.67
2036 144,742.66138,634.596108.07−49,829.60
2037180,809.90 139,919.53140,947.28179,782.15129,952.55
2038 142,566.52143,547.95−981.43128,971.12
2039 145,567.92146,533.36−965.44128,005.68
2040 149,034.63150,045.89−1011.26126,994.42
2041 152,465.39153,637.05−1171.66125,822.76
2042 156,986.75158,520.00−1533.25124,289.51
2043 162,221.72164,509.00−2287.28122,002.23
2044 164,520.72168,516.17−3995.45118,006.78
2045 166,549.31173,884.34−7335.03110,671.75
Total662,981.34546,168.742,934,115.212,940,256.06110,671.75110,671.75
Disclaimer/Publisher’s Note: The statements, opinions and data contained in all publications are solely those of the individual author(s) and contributor(s) and not of MDPI and/or the editor(s). MDPI and/or the editor(s) disclaim responsibility for any injury to people or property resulting from any ideas, methods, instructions or products referred to in the content.