Abstract
To address the dilemma of China’s rural areas becoming increasingly homogeneous due to large-scale, campaign-style rural construction. This study proposes an innovative rural spatial pattern evaluation model that integrates geomancy theory with modern spatial analysis methods. Chawan village, Suzhou city, Jiangsu Province, China, is used as the study area, with the aim of better assessing and optimizing rural spatial patterns in China. The Analytic Hierarchy Process (AHP) is a method for ranking factors based on their relative importance, which is used to assign weights to indicators. Combined with the fuzzy comprehensive evaluation (FCE) method based on fuzzy set theory and ArcGIS weighted overlay analysis, it is used for evaluating rural spatial patterns. The results show that natural environmental indicators hold more weight than artificial ones. Among these, water body landscapes (0.111), water body buffer zones (0.103), and vegetation ecology (0.073) are the highest weighted indicators. The top three spatial pattern evaluation values are landscape environment (3.85), water bodies (3.52), and vegetation (3.51). The final result for the village is moderate, with an evaluation score of 3.385. This result suggests that the rural spatial pattern has a solid foundation for cultural continuity and significant potential for optimization, particularly in ecological and water body features. The AHP–GIS–FCE multi-method evaluation framework provides an effective tool for assessing and optimizing rural spatial patterns. This approach offers a systematic solution for rural development, promoting localized and diverse planning models, as opposed to the homogenized “one-size-fits-all” approach, and contributes to the protection of cultural heritage and sustainable development.
1. Introduction
In recent years, with the steady implementation of China’s rural revitalization strategy, a nationwide surge in rural construction has occurred, leading to a significant increase in the demand for rural planning. However, owing to the underdeveloped nature of rural planning theory in China, rural construction continues to rely heavily on theories and methods originally designed for urban planning []. In rural cultural protection, assessment, and renovation work, planners often resort to coercive planning methods. While these methods produce immediate results, they may overlook the unique characteristics and cultural value of rural spaces. Moreover, the rural planning approach, which prioritizes quick results while neglecting the intrinsic qualities of rural areas, has become widespread []. Therefore, there is an urgent need to establish an evaluation system applicable to China’s rural spatial pattern, and to conduct a comprehensive quantitative evaluation by combining geomancy theory with modern spatial planning methods, so as to provide theoretical support for guiding rural planning.
Relevant studies have shown that rural spatial analysis theories based on traditional geomancy can contribute to the improvement of rural living environments []. Geomancy can be traced back to the pre-Qin period in China. It was formed in the Wei and Jin periods, matured in the Tang and Song periods, and gave rise to two major schools, the Situation Sect and the Liqi Sect. The Situation Sect’s doctrines were mainly concerned with the siting of villages and spatial planning and design, and were disseminated to the public from the Tang dynasty onwards in the Yu (Ganzhou) region. During the Ming and Qing dynasties, the theory of geomancy played a key role in the spatial layout and architectural design of rural areas and had a profound impact on village culture and agricultural production. Today, it remains an indispensable part of rural culture []. Research results indicate that approximately three-quarters of traditional villages in China were influenced or guided by geomancy principles during their initial construction or the formation of their spatial patterns. This reflects the deep-rooted influence of geomancy theory in rural planning in China []. However, since the advent of modern society, the value and role of traditional geomancy theory in rural spatial planning and construction in China have been largely neglected, leading to a significant disconnect in the historical evolution of rural spatial patterns in current rural planning models. In recent years, due to the emergence of global environmental pollution, resource depletion, and other problems, people have gradually paid attention to the relationship between human beings and nature, which has aroused the extensive attention of scholars at home and abroad to geomancy. The architectural and spatial studies of Japan and Korea in the East Asian Cultural Circle have had the most significant impact, and geomancy has been better integrated into the geographical features and cultural customs of these countries, and the localization of the geomancy view has been realized [,]. In particular, Korean scholars have proposed that Korean land evaluation should combine modern planning principles with traditional feng shui concepts as a way to develop a new spatial planning framework []. Current research on the application of geomancy in rural space mainly focuses on village siting and spatial layout, as well as verifying the scientific validity of geomancy theory in rural spatial layout []. These studies utilize ArcGIS, CFD numerical simulations, or empirical data techniques to assess the selection of ancient villages on the basis of traditional geomancy theories []. Quantitative methods are employed to study the coupling relationship between the “form” of rural landscape patterns from a geomancy perspective and the microclimatic environment [,]. Previous research has highlighted the critical role of geomancy theory in the spatial formation of ancient Chinese villages. However, the current study of rural spatial planning lacks a systematic evaluation framework that organically combines traditional feng shui theories with modern spatial planning methods, resulting in an inability to solve the current problems of rural spatial planning.
At present, common rural spatial pattern evaluation methods contain expert analysis, principal component analysis, gray correlation analysis, hierarchical analysis, and the fuzzy comprehensive evaluation method. Traditionally, face-to-face interviews and questionnaires are mainly used, and Likert scales are applied for quantitative analysis. However, this approach is subjective and time-consuming, resulting in a diversity of findings. Hierarchical analysis (Analytic Hierarchy Process (AHP)) is a decision-making method that combines quantitative analysis and qualitative analysis through the application of mathematical methods, and rationally allocates the weights of each factor through group decision-making by experts []. However, the results depend largely on the feng shui experience of the experts, and it is difficult to adapt to the analysis of complex problems []. Mathematical fuzzy comprehensive evaluation (FCE) is based on the fuzzy mathematical degree of affiliation, combined with the weighted average method to transform the qualitative evaluation into a comprehensive quantitative evaluation method. The evaluation method has the advantages of high accuracy and reliability []. However, the method is more subjective in constructing the affiliation function and requires higher data support []. With the continuous deepening of research, the geographic information system (GIS), as a powerful spatial data analysis tool, gradually shows its unique advantages in the evaluation of rural spatial patterns []. For example, some scholars have used ArcGIS spatial analysis methods to study the spatial pattern of French railroads in historical periods [] or to combine multi-scale geographically weighted regression models to analyze the focus and spatial heterogeneity of rural spatial distribution elements []. Wang et al. used GIS to analyze the characteristics of traditional village geographic patterns and morphological indicators []. These studies illustrate the superiority of ArcGIS in rural spatial planning analysis.
This study aims to construct a comprehensive assessment framework that combines traditional feng shui theories and modern planning methods to develop a new model for assessing rural spatial patterns. Through this framework, the planning and construction of rural space can be assessed and guided more effectively to ensure that it inherits traditional culture while adapting to modern needs. The analytical hierarchy process (AHP), geographic information system (GIS), and fuzzy comprehensive evaluation (FCE) are combined with traditional geomancy theory. This approach closely incorporates key elements of both the natural and built environments in rural areas to construct a rational cognitive framework for evaluating rural spatial patterns. On the basis of this framework, a new model for assessing rural spatial patterns is developed, enabling the comprehensive evaluation of rural spatial structures. This model transforms qualitative indicators from traditional geomancy perspectives into quantitative metrics, integrating the advantages of both qualitative and quantitative approaches. It not only effectively reflects the applicability of traditional geomancy theory in modern rural areas but also provides a new practical approach for current rural planning and construction.
2. Materials and Methods
2.1. Study Area
2.1.1. Location
This study focuses on the Taihu Lake Cultural Area in China, a region that is both widely known and represents a more developed rural socio-economic area in China, to carry out a study on the inheritance of the theory of geomancy and the optimization path of rural space. The study area is Chawan village, Dongshan Island, Suzhou city, Jiangsu Province, which is located in the core of the Taihu Lake Cultural District. It is under the jurisdiction of Shuangwan administrative village, Dongshan town. Chawan village consists of three natural villages: Guzhou Lane, Paizhou Lane, and Shihuibang (Figure 1).
2.1.2. Historical Significance
Chawan village boasts an extensive history. According to the village history, residents have lived in the Chawan and Paizhou Lane areas on Dongshan Island since the Spring and Autumn period []. Field surveys have confirmed that the existing ancient buildings in Chawan village include the He Family Sanmao Hall, the Ye Family Shuyin Hall, and the Zhou Family Shide Hall. The historical sites include Baoan Temple, ancient stone bridges, ancient ponds, traces of ancient Paifang (archway), five ancient wells from the Ming and Qing dynasties, and 12 ancient ginkgo trees over 100 years old (Figure 2). Chawan village has survived to the present day, owing much to the wisdom of ancient geomancy practices in its construction. Geographically, Chawan village is situated with mountains to one side and water to the other. The village is surrounded by mountains on three sides, with many reclaimed fields closely distributed along the shores of Taihu Lake. This layout is representative of ancient geomancy-centric villages in the Jiangnan region of China. Additionally, Chawan village follows the geomancy principle of “backed by mountains and facing water,” an approach common among ancient geomancy villages in Jiangnan, China.
2.1.3. Cultural and Geomantic Relevance
Chawan village has survived to the present day, owing much to the wisdom of ancient geomancy practices in its construction. Geographically, Chawan village is situated with mountains to one side and water to the other. It borders Jinwan village of Shuangwan administrative village to the east and Yangwan administrative village to the west. To the north, it is bordered by the foothills of Molifen, whereas to the south, it faces Taihu Lake, which is separated from the village by the Dongshan Island Ring Road. The village is surrounded by mountains on three sides, with many reclaimed fields closely distributed along the shores of Taihu Lake. This layout is representative of ancient geomancy-centric villages in the Jiangnan region of China (Figure 3).
2.1.4. Economic and Social Conditions
Chawan village was included on the National Traditional Villages List in 2022. Owing to its warm and humid climate with distinct seasons and the mist from Taihu Lake, Chawan village has become the origin and production area of Biluochun tea. Additionally, many fruits, such as loquats, bayberries, and citrus, are produced there, providing a stable economic income for local residents.
2.1.5. Reasons for Site Selection
The reasons for selecting Chawan village as the study area are as follows. First, the village has a long history and is an important origin of ancient Chinese geomancy theory. During the Spring and Autumn period, the famous generals Wu Zixu and Sun Tzu, the authors of The Art of War, resided in Chawan village for a period of time. Their geomancy ideas deeply influenced the village’s construction, and to this day, the village still embodies a wealth of geomancy wisdom in its layout. Second, it is located in the Jiangnan region of China, which is a prominent area for the development of Wu culture. Since the Qin and Han dynasties, multiple waves of northern migration to the south have allowed Wu culture to be continuously influenced by Central Plains culture. The convergence of northern and southern geomancy philosophies occurred here, blending the two and ultimately evolving into the distinctive local cultural landscape present in Jiangnan’s rural spaces. In addition, the geographical layout and historical elements of the ancient village have been preserved, as shown in the following image. The spatial layout of the village remains relatively independent and intact, with the architectural layout well preserved. The characteristics of the spatial layout and the approach to space utilization provide valuable universal references and insights.
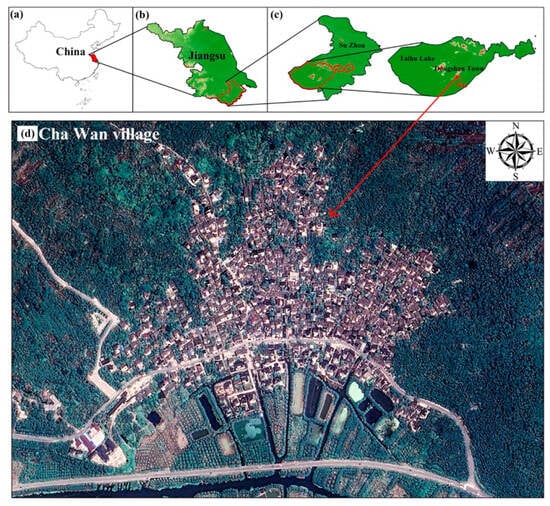
Figure 1.
Location of the study area (image source: Google Satellite Map): (a) location of Jiangsu Province in southern China, (b) location of Suzhou within Jiangsu Province, (c) district of Wu Zhong, highlighting Chawan village, and (d) spatial layout of Chawan village.
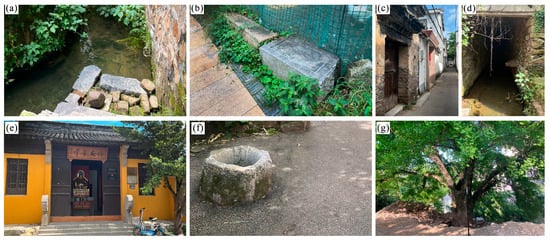
Figure 2.
Historical elements of Chawan village: (a) Qing dynasty Pool, (b) decorated archway, (c) ancient building, (d) old bridge from the Qing dynasty, (e) Baoan Temple, (f) ancient well from the Qing dynasty, and (g) ancient well from the Qing dynasty.
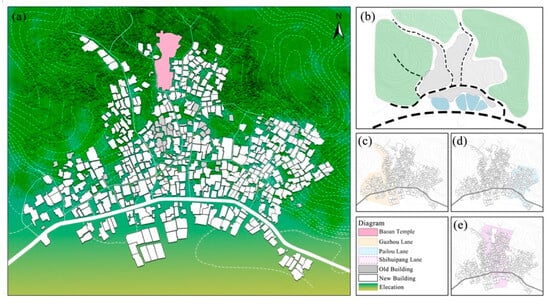
Figure 3.
Distribution of the geomancy pattern in Chawan village: (a) rural spatial layout of Chawan village, (b) geomancy pattern of Chawan village, (c) Guzhou Lane Location Area, (d) Pailou Lane Location Area, and (e) Shishuipang Lane Location Area.
2.2. Data Collection
The remote sensing imagery used in this study is from the Landsat 8 OLI-TIRS satellite, with a spatial resolution of 30 m. The Landsat 8 satellite is equipped with two sensors: the Operational Land Imager (OLI) and the Thermal Infrared Sensor (TIRS). The OLI sensor captures nine spectral bands, such as the visible light, near-infrared, and shortwave infrared bands, with a spatial resolution of 30 m. The TIRS sensor captures two thermal infrared bands, with a spatial resolution of 100 m. The digital elevation model (DEM) adopted is from GDEM data, and it can be obtained through the geospatial data cloud sharing platform (http://www.gscloud.cn, accessed on 15 February 2024).
2.3. Methodology
The three major stages of the research methodology used in the present study are presented in Figure 4.
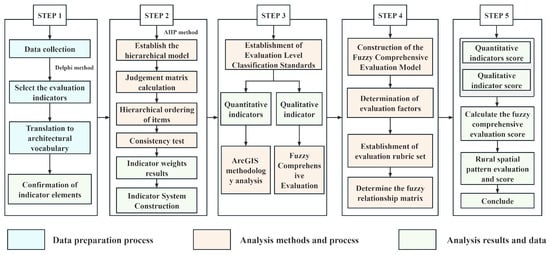
Figure 4.
Research framework for the present study.
First, we compiled representative elements of geomancy theory to construct a rural spatial evaluation model on the basis of geomancy principles. Relationships between the evaluation indicators were quantified via the AHP and were compared pairwise to calculate the weights of the indicators.
Second, a systematic grading standard for rural spatial evaluation indicators was established. The indicators were categorized into quantitative indicators and qualitative indicators according to their characteristics. Quantitative indicators were calculated via ArcGIS tools through reclassification and overlay analysis, whereas qualitative indicators were evaluated via the fuzzy comprehensive evaluation (FCE) method, which was used to transform human-based subjective qualitative assessments into quantifiable evaluation results. Additionally, an indicator evaluation set and corresponding scale vectors were established, with separate classifications and value assignments for the quantitative and qualitative indicators. Finally, geomantic theory was integrated into this approach to verify the rural spatial cognitive evaluation results. In the FCE method, the membership function principle is applied to perform hierarchical evaluations of qualitative indicators, followed by fuzzy comprehensive evaluation calculations for both quantitative and qualitative indicators to obtain the final comprehensive evaluation score.
Finally, the multisource remote sensing data for the rural study area were processed and imported into a GIS for three-dimensional analysis. The scores from the quantitative indicator layers obtained through ArcGIS weighted overlay analysis were then input into the FCE model. Data for qualitative indicators, collected through questionnaires, were sequentially imported into the FCE model with the quantitative indicator scores to derive the final rural spatial cognitive evaluation results.
2.3.1. Indicator System Construction
To construct a rural spatial pattern evaluation indicator system on the basis of the theoretical foundation of Chinese geomantic science, the first step was to select evaluation indicators. Geomantic theory originated in the pre-Qin period, and the term “geomancy” first appeared in Huainanzi-Tianwen Xun []. Geomancy focuses on the study of landforms and terrain features, particularly descriptions of landforms. During the Wei–Jin periods, numerous geomantic scholars emerged, contributing significantly to the development of geomantic theory. Among them, Guo Pu published Zangjing (The Book of Burial) during the Jin dynasty, and it had a profound influence and was later regarded as a classical text []. This work confirmed that geomancy is an environmental design theory and an early form of environmental science originating in ancient China.
Geomantic theory matured during the Tang and Song dynasties, during which two major schools of thought gradually emerged. The first was the “Form and Situation” school, which focuses primarily on the selection of sites for capitals, villages, and architectural environments. The second is the “Qi and Principles” school, in which the interior and exterior orientations of settlements and the layout of buildings are determined on the basis of the theories of Yin–Yang, the Five Elements, the Chinese zodiac (Gan-Zhi), the Eight Trigrams, the Nine Palaces, and astrology []. In popular culture, the “Qi and Principles” school is commonly referred to as “geomancy,” a term that appeared during the Jin dynasty, 518 years prior to the foundation of this school of thought. Therefore, the evaluation model constructed in this study is based on the geomantic theory of the “Form and Situation” school of thought. The indicators for the evaluation model were selected and validated. The sources of the indicators are summarized from ancient geomancy books and the literature related to the “Form and Situation” school of geomancy. Geometric terms were extracted from these sources. These include Guo Pu’s Zangjing [], Wang Yi’s Qingyan Conglu [], Xu Shen’s Shuowen Jiezi [], Liu Xi’s Shiming [], and Guanzi [].
In order to establish an objective and effective hierarchical model, the Delphi method is usually used for screening and correction, and anonymous questionnaires are used to seek opinions from experts on the issues to be studied through collective decision-making by the experts, and then anonymous feedback is given to the experts through sorting and summarizing, and this step is carried out until a unanimous opinion is obtained. Therefore, in order to filter the indicators of the hierarchy, we sent the collected feng shui indicators in the form of a questionnaire to 30 experts from sociology, geomancy, landscape architecture, urban and rural planning, and design-related research fields. The hierarchy and specific indicators were finally obtained after three rounds of opinion modification. The survey was conducted in September 2023, with a response rate of 100% and an effective rate of 100% (Figure 5). Descriptions of the experts are given in Figure 5. The next step is to translate the expert-screened feng shui indicators into architectural terms. The Delphi method was then used to further select and adjust the indicators to ultimately establish the evaluation indicator system (Table 1). The criterion layer consisted of the natural environment and the artificial environment. The subcriterion layer included topography, water bodies, vegetation, soil, the residential environment, and the landscape environment. The indicator layer included elevation, slope, slope direction, terrain wetness, water body buffer zones, the water body landscape, vegetation coverage, vegetation ecology, soil moisture, soil temperature, the enclosure of street and alley spaces, street traffic accessibility, the openness of indoor and outdoor spaces, landscape sightlines, village landscape aesthetics, and landscape form aesthetics (Figure 6).
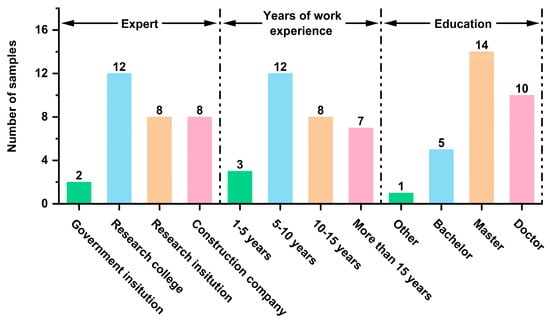
Figure 5.
Details regarding the experts.

Table 1.
Evaluation indicator sources and indicator translation.
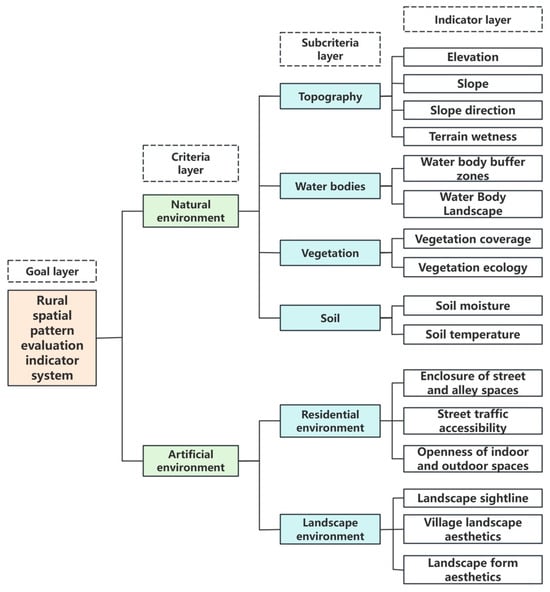
Figure 6.
System of evaluation indicators (photo credit: authors’ own graph).
2.3.2. Calculation of Indicator Weights
We construct an evaluation index system via the AHP to calculate the weight of each index. First, a questionnaire was distributed to 40 experts in the fields of geomancy, landscape architecture, and urban and rural planning, and a second round of surveys was designed. A 1–9 scale was used for the pairwise comparison of each indicator, with the experts’ judgments used to determine the relative importance of each indicator; subsequently, a judgment matrix was constructed []. The survey was conducted in October 2023, with a response rate of 100% and an effective response rate of 100% (Figure 7). Next, the survey data were imported into Yaahp 2.6 software to calculate the weight value of each index. The power method was used for matrix calculations, adjustments, and consistency testing. The consistency test result was less than 0.1 [], indicating that the judgment matrix was consistent and reasonable. Finally, the weight value of each index layer was calculated via the power method, as follows [].
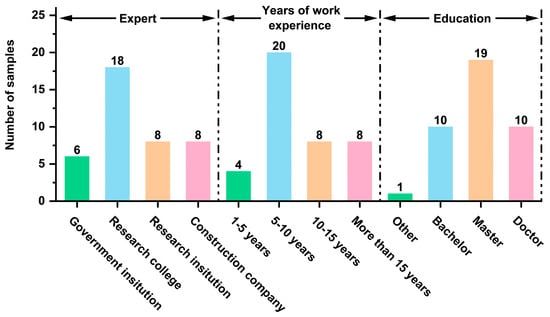
Figure 7.
Details of the experts.
The matrix factors were calculated as follows:
The normalized judgment matrix was summed by row.
Normalization was performed to obtain the eigenvector ω via the following formula:
After the weight value for each indicator was obtained, consistency testing of the judgment matrix was performed. First, the maximum eigenvalue was calculated via the following formula:
Then, the consistency indicator CR was calculated, and CR was input into the following formula for consistency testing:
If the consistency index CR was <0.1, the consistency test was passed. If CR > 0.1, the consistency test failed.
2.3.3. Establishment of Evaluation Level Classification Standards
Considering the different characteristics of the indicators, the indicators in the evaluation model were categorized and evaluated. To ensure the scientific nature of the evaluation, the 16 indicators screened in Section 2.3.1 were divided into quantitative and qualitative indicators. The results for the indicators of elevation, slope, slope direction, terrain wetness, water body buffer zones, vegetation coverage, vegetation ecology, soil moisture, and soil temperature were quantitatively analyzed with ArcGIS 10.6 software (Table 2). Indicators of the water body landscape, enclosure of street and alley spaces, street traffic accessibility, the openness of indoor and outdoor spaces, landscape sightlines, village landscape aesthetics, and landscape form aesthetics are subjective. Therefore, a qualitative analysis was performed with the FCE method. In the end, nine quantitative and seven qualitative indicators were selected. Quantitative indicators were calculated via ArcGIS tools via reclassification and overlay analysis. The qualitative indicators were obtained via fuzzy integration (Table 3).

Table 2.
Sources of data for evaluation indicators.

Table 3.
Classification of evaluation indicators.
The establishment of quantitative indicators was based on an analysis in ArcGIS, where each quantitative indicator was graded and assigned a value. The grading criteria for indicators were obtained from previous research related to geomancy []. The natural breaks method was used to determine the grades. The indicator evaluation set was E^ = [E1, E 2, E3, E4, E5] = [higher, high, moderate, low, and lower], the corresponding scalar vector was [5, 4, 3, 2, 1], and the scores for each indicator were calculated through a weighted overlay methodology in ArcGIS (Table 4).

Table 4.
Classification and scoring standards for quantitative indicators.
2.3.4. ArcGIS Methodology and Analysis
The values of the quantitative evaluation indicators (topography, water bodies, vegetation, and soil) are input into ArcGIS, and an attribute database is established for each evaluation unit. The data undergo preprocessing, such as unifying the geographic coordinate system, clipping, and rasterization. On the basis of the weight value of each indicator and the established evaluation grading standards, methods such as Euclidean distance determination, multilevel buffering, normalized indicator reclassification, and overlay analysis are applied for indicator calculation and analysis.
The terrain and landform criterion layer consists of four indicators: elevation, slope, slope direction, and terrain wetness. The data for elevation, slope, and aspect were obtained through a DEM from the Geographic Spatial Cloud Sharing Platform (http://www.gscloud.cn, accessed on 12 August 2025). The 30 m DEM data were imported into ArcGIS for analysis to obtain the indicator evaluation results. The lower the elevation is, the greater the potential for surface water accumulation. The slope index was determined by calculating the elevation difference between adjacent pixels to assess the slope. The terrain wetness indicator was analyzed via the “moisture index,” where the moisture component from the cap transformation is used to represent the moisture index. The corresponding formulas are as follows [].
The wetness formula for the TM sensor is as follows:
The wetness formula for the OLI sensor is as follows:
In Equations (6) and (7), is the blue band, is the green band, is the red band, is the near-red band, is the shortwave infrared 1 band, and is the shortwave infrared 2 band. The vegetation criterion layer consists of vegetation coverage and vegetation ecology indicators. The vegetation coverage is based on the NDVI, which accurately reflects the growth status of plants and the distribution and density of vegetation, allowing for the estimation of vegetation coverage. When the NDVI is negative, it indicates that the ground cover is water, snow, or relatively barren; alternatively, clouds may be obstructing NDVI measurements. When the NDVI is positive, it indicates that there is vegetation on the ground surface. A large NDVI value indicates a high level of vegetation cover, and the density of vegetation cover is positively proportional to the NDVI value [].
The matrix is shown in Equation (8) []:
In Equation (8), NIR5 refers to the near-infrared band (band 5) and refers to the visible red band (band 4). Landsat 8 OLI-TIRS data obtained from the Geographic Spatial Data Cloud are used for analysis.
The vegetation ecology index is determined based on the normalized difference water index (NDWI), which can be used to assess the water content of vegetation. The values range from −1 to 1, with higher values indicating higher water contents in plants, and vice versa.
The corresponding equation is shown in (9) []:
In Equation (9), represents the reflectance of the green band, and represents the reflectance of the near-infrared band.
Soil moisture was analyzed via the topographic wetness index. This method enables the quantitative assessment of the influence of topography on the spatial distribution of soil moisture. Moreover, this approach can aid in determining rainfall and runoff patterns, potential areas of increased soil moisture, and areas of waterlogging. Soil moisture plays an important role in climatic, environmental, and ecological research and applications, and the level of soil moisture can effectively reflect the ecological and environmental quality of a region.
The corresponding formula is as follows []:
In Equation (10), CA is the local uphill catchment area draining through the cell, and slope is the steepest outward slope of each grid cell.
In this study, the soil temperature represents the surface temperature, which affects the growth of vegetation and has a crucial influence on the ecological environment. We use the single-channel method to analyze and invert the land surface temperature. The method proposed by Qin Zhihao et al. is simple and highly accurate, requiring only the use of information from the thermal infrared bands obtained via remote sensing [].
The corresponding formula is as follows:
In Equation (11), L is the radiance value, DN is the pixel gray value, and gain and bias represent the gain and bias values for the thermal infrared band, respectively.
In Equation (12), K1 and K2 are the calibration parameters, and is the blackbody radiant luminance value.
2.3.5. Construction of the Fuzzy Comprehensive Evaluation Model
- Determination of Evaluation Factors
After selecting the evaluation indicators, the set of factors V = [V1, V2, V3, …, Vn] is obtained; subsequently, Vi = [Vi1, Vi2, Vi3, …, Vim] (i = 1, 2, …, n) denotes the m factors associated with the ith factor as the set of secondary indicators, and the same approach is used to obtain indicators at the tertiary level and beyond [].
- 2.
- Establishment of weight sets
The second step is to establish the weight set. Using the Analytical Hierarchy Process (AHP), we derive the weight vector
where each ai represents the relative importance of factor Vi.
- 3.
- Establishment of a comment set
Each of the previous 16 indicators was assigned a level of importance, from which the desired outcome was rated, and the rubric set W = [W1, W2, W3, …, Wn] was established, where n is the number of evaluation levels. This study is based on a fuzzy mathematical five-point scale [,], and the comment set was represented as W = [W1, W2, W3, W4, W5] = [higher, high, moderate, low, and lower], corresponding to a scale vector of [5, 4, 3, 2, 1]. Geomancy experts were invited to evaluate rural spatial patterns based on this scale (Table 5). To ensure the accuracy and scientific validity of the data, 40 rural spatial pattern survey questionnaires were distributed to experts and scholars in related fields (geomancy, landscape architecture, urban and rural planning, and design). Figure 8 shows the characteristics of the experts. A total of 40 valid questionnaires were collected, with a response rate of 100%.

Table 5.
Assignment of values to evaluation comments.
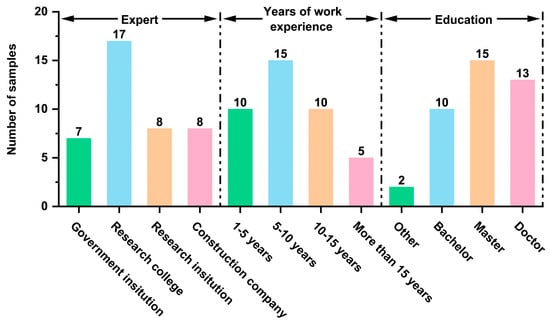
Figure 8.
Details of the experts (photo credit: authors’ own graph).
- 4.
- Obtain the fuzzy relationship matrix
If the membership degree of the i-th factor in the factor set U for factor j in the evaluation set V is denoted as Rij, then the fuzzy evaluation set for the i-th factor is Ri = [Ri1, Ri2, Ri3, …, Rim] (where i = 1, 2, …, n). For n factors, the comprehensive analysis and evaluation yield n fuzzy evaluation sets R1, R2, …, Rn. The matrix R, formed by combining these fuzzy evaluation sets, is the fuzzy relation matrix. The evaluation affiliation matrix R is constructed by Equation (13), and the fuzzy comprehensive evaluation matrix B is calculated by Equation (14) []. And finally, the comprehensive assessment value C of the research object is calculated by Equation (15) [].
The corresponding formula is as follows:
- 5.
- Calculate the fuzzy comprehensive evaluation score
We import the scores of the quantized indicator layers obtained from the ArcGIS weighted overlay analysis into the FCE model. The scores for the qualitative indicators are obtained through a questionnaire survey. The survey results are sequentially imported into the FCE model, which already contains the scores for the quantitative indicators. Ultimately, a comprehensive fuzzy evaluation score is obtained.
3. Results
3.1. Weighting Results for the Evaluation Indicator System
In this section, we first organize and summarize the expert scoring results from Section 2.3.1. On the basis of the AHP results, we imported the questionnaire data of 40 experts into the Yaahp 2.6 software to calculate the weight value of each index, and obtained the weight results (Table 6). The power method was used for matrix calculation, correction setting, and consistency test, and the results showed that the consistency test passed (CR ≤ 0.1). In the criterion layer, the weight of the natural environment is greater than that of the artificial environment. The high weight of the natural environment indicates the importance of topography in the feng shui environment in contemporary rural planning and construction. Priority should be given to the rural environment and ecological protection to prevent soil erosion. In the natural environment criterion layer, the subcriterion weights in descending order are topography (0.218), water bodies (0.214), vegetation (0.142), and soil (0.128) in Figure 9. In the artificial environment criterion layer, the subcriterion weights in descending order are residential environment (0.150) and landscape environment (0.148). In the subcriterion layer, the weight of the topography (0.218) is the highest, indicating that the topography factor plays a crucial role in the evaluation of rural spatial patterns. In traditional Chinese geomancy, topography is the main factor considered when selecting locations in rural geographic site selection, referred to in Chinese geomantic terminology as “Xun Long”. In contemporary rural practice, topography can directly affect the ecological environment and architectural layout of the countryside, playing an important role in the sustainable development of the rural environment. In the indicator layer, water body landscape has the highest weighting (0.111), reflecting the importance of its water body landscape and its connection to traditional feng shui principles. In contemporary rural planning, this feng shui principle translates into design concerns for water body landscapes. Among these, the highest weighted indicators are water body landscapes (0.111), water body buffer zones (0.103), and vegetation ecology (0.073). Buffer zones for water bodies reflect their ecological importance and their relevance in traditional feng shui theory. In feng shui principles, “Shui kou sha” is an important factor in the siting of villages. Shui Kou is considered to be an area where water energy is concentrated, and the “sand” (or landform) around it helps to control and direct the flow of this energy, ensuring that it is beneficial to the surrounding environment. This is consistent with the principle of modern rural planning practice to set up water buffers in advance, which can help to reduce erosion, improve water quality, and enhance the ecological environment of the countryside. In addition, vegetation ecology (0.073), as one of the top three highest weighted indicators, is regarded as an integral part of maintaining airflow and balancing the energy of the spatial environment in traditional feng shui principles. In contemporary rural planning and practice, this translates into the role that vegetation can play in providing ecosystem services to the countryside, playing a key role in the long-term sustainability of rural ecosystems.

Table 6.
Weight results of the indicator.
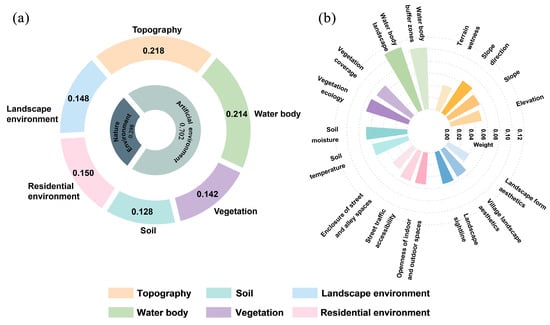
Figure 9.
Weighting results: (a) criterion layer and subcriterion layer indicator weighting results; (b) indicator layer weighting results.
3.2. Quantitative Indicator Evaluation Results Based on ArcGIS Software
3.2.1. Topography
As shown in Figure 10, the elevation indicator for Chawan village has a maximum value of 134 m and a minimum value of −20 m, with the elevation range of the mountainous area falling between 50 and 134 m. In Chawan village, the elevation range of the residential areas near the mountainous region is between 9 and 23 m, the elevation range of the central roads and farmland areas is between 1 and 9 m, and the low-lying areas near Taihu Lake have an elevation range between −21 and 1 m. According to the field survey, this area is a reclaimed land area around the lake. On the basis of the quantitative indicator grading standards, the elevation grade for Chawan village is classified as high, with a score of 5.
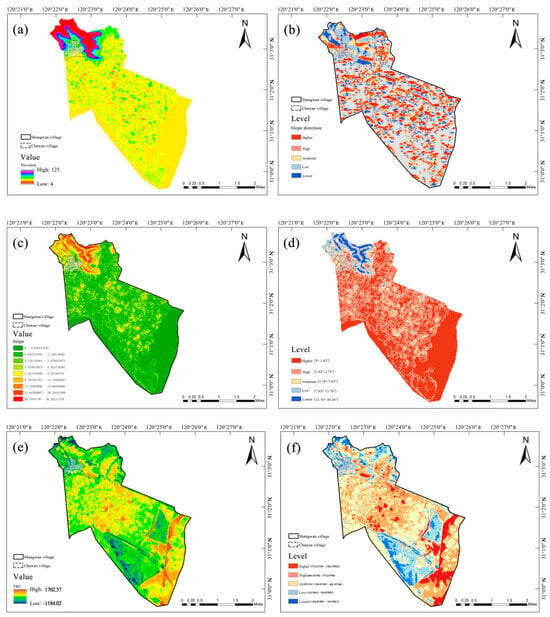
Figure 10.
Terrain indicator results: (a) elevation indicator results; (b) slope direction indicator results; (c) slope indicator results; (d) results of the evaluation of the slope indicator; (e) terrain moisture results; and (f) results of terrain moisture evaluation.
The slope indicator in Chawan village has a maximum value of 30.26 and a minimum value of 0. Notably, 40% of the area has a slope range of 7.83 to 13.76, 55% of the area has a slope range of 3.79 to 7.83, and 5% of the area has a slope range of 13.76 to 30.26. Therefore, the evaluation result for the slope indicator is poor, with a score of 2. Overall, the evaluation result is moderate, with a score of 3.
3.2.2. Water Body Index
As shown in Figure 11, the highest value of the water body index for Chawan village is 1.42254 m, and the lowest value is −0.540712 m. In Chawan village, 95% of the area falls within the index range of −0.121226 to 0.15062 m, whereas 3.56% of the area has a value between 0.151 and 0.434 m. Overall, the evaluation result is moderate, with a score of 3.
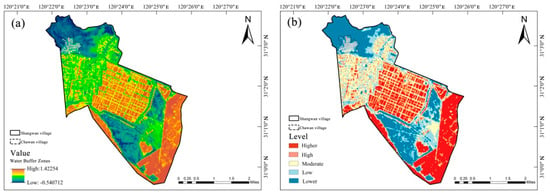
Figure 11.
Water body buffer zones index analysis results: (a) water body buffer results; (b) results of water body buffer evaluation.
3.2.3. Vegetation
As shown in Figure 12, the highest value of the vegetation coverage index is 0.313, and the lowest value is −0.122. In Chawan village, 92% of the area has HDVI values ranging from 0.016 to 0.08, whereas 8% of the area has HDVI values ranging from 0.081 to 0.171. The results show that the evaluation is moderate, with a score of 3 (Figure 12).
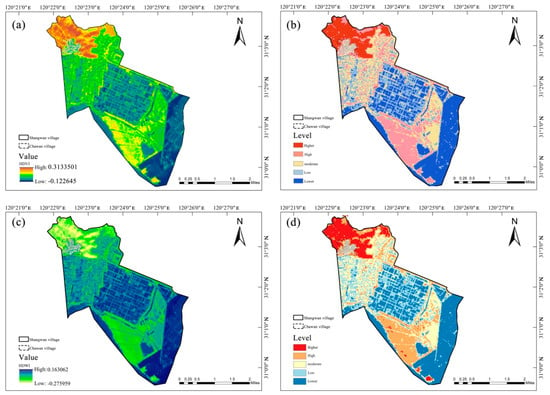
Figure 12.
Results of the vegetation indicator analysis: (a) results of the vegetation coverage index; (b) vegetation coverage index evaluation results; (c) results of the vegetation ecological index; and (d) results of the vegetation ecological index evaluation.
The vegetation ecological index was based on the basis of the NDWI. The results show that 85% of the areas in Chawan village are classified as moderate, with a value of 3. Fifteen percent of the areas are classified as low, with a value of 2. The final evaluation result is moderate, with an overall score of 3.
3.2.4. Soil
The soil moisture index is analyzed via the TWI, and the soil moisture is calculated in ArcGIS with a DEM. The results reveal that the highest value of the soil moisture index in Shuangwan administrative village is 18.350, and the lowest value is 4.022. The soil moisture values in the residential areas of Chawan village range from 4.022 to 7.088, with a low score. Additionally, there is a main watershed area in Chawan village, which stretches from the mountain top to the lake, covering the entire village. The soil moisture values in this area range from 13.248 to 18.350, with a rating of excellent. In conclusion, the overall evaluation rating is moderate, with a score of 3.
The soil temperature index is analyzed on the basis of land surface temperature (LST). The results reveal that the highest value of the soil temperature index in Shuangwan administrative village is 10.572, and the lowest value is 6.589. The soil temperature in the residential areas of Chawan village ranges from 10.572 to 13.179, with the highest temperatures observed in highly populated areas. This is due to the high density of residential buildings in these areas. In addition, 75% of the area in Chawan village has soil temperatures ranging from 9.553 to 10.572 (Figure 13 and Figure 14). Therefore, the final evaluation rating is low, with a score of 2 (Table 7).
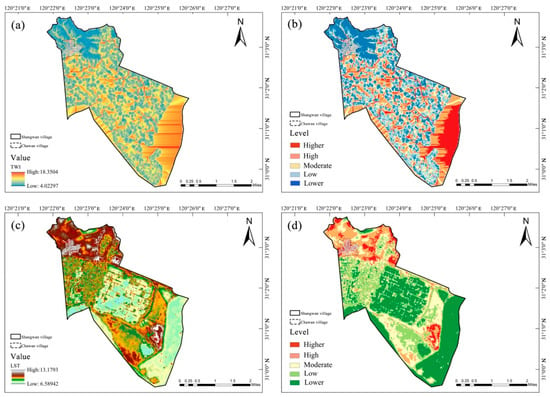
Figure 13.
Soil index analysis results: (a) results of soil moisture index; (b) results of soil moisture index evaluation; (c) results of soil temperature index; and (d) results of soil temperature index evaluation.
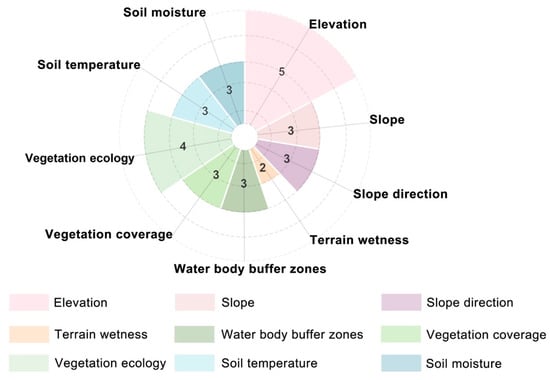
Figure 14.
Quantitative indicator results.

Table 7.
Evaluation results of indicators based on ArcGIS analysis.
3.3. Qualitative Indicator Evaluation Results
On the basis of the AHP-GIS-FCE model, objective quantitative values were assigned to the indicators of elevation, slope, slope direction, terrain wetness, water body buffer zones, vegetation coverage, vegetation ecology, soil moisture, and soil temperature. Moreover, other indicators were classified as subjective qualitative indicators. Moreover, other indicators were classified as subjective qualitative indicators. The membership degree matrix of each indicator was multiplied by the corresponding indicator weight on the basis of the survey results from 40 experts in the fields of geology, landscape architecture, urban planning, rural planning, and design, along with the objective quantitative evaluation results derived from the ArcGIS and ENVI analyses (Figure 15 and Table 8). The final fuzzy comprehensive evaluation values were obtained.
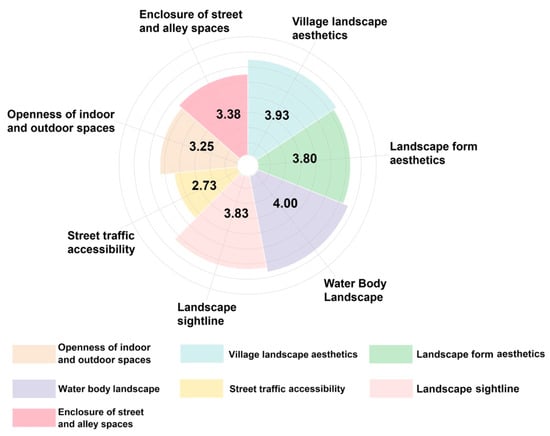
Figure 15.
Qualitative indicator results (image source: authors’ own creation).

Table 8.
Indicator analysis results based on the fuzzy comprehensive evaluation method.
For the natural environment criteria, the elevation indicator (5) has the highest evaluation score, whereas the slope, terrain wetness, and soil moisture indicators have lower scores. For the artificial environment criteria, the water body landscape value indicator (4.00) has the highest score, whereas the street traffic accessibility value indicator (2.73) has a lower score. Overall, the subcriteria evaluation scores are as follows: landscape environment (3.85), water bodies (3.52), vegetation (3.51), topography (3.27), residential environment (3.10), and soil (3.000). The ranking of the indicator layer evaluation scores is as follows: elevation (5.0), water body landscape (4.00), vegetation ecology (4.00), village landscape aesthetics (3.93), landscape sightline (3.83), landscape form aesthetics (3.80), enclosure of street and alley spaces (3.38), openness of indoor and outdoor spaces (3.25), water body buffer zones (3.00), vegetation coverage (3.00), soil moisture (3.00), soil temperature (3.00), street traffic accessibility (2.73), and terrain wetness (2.00). The maximum membership degree result for the village is moderate, with an evaluation score of 3.385.
4. Discussion
In this study, traditional Chinese geomantic theory is used as a basis to construct a rural spatial pattern evaluation model grounded in Chinese geomancy. Two primary criterion layers, the natural environment and the artificial environment, which are further subdivided into six subcriterion layers, namely, topography, water bodies, vegetation, soil, the residential environment, and the landscape environment, are established. A total of 16 indicators are derived: elevation, slope, slope direction, terrain wetness, water body buffer zones, the water body landscape, vegetation coverage, vegetation ecology, soil moisture, soil temperature, enclosure of street and alley spaces, street traffic accessibility, the openness of indoor and outdoor spaces, landscape sightlines, village landscape aesthetics, and landscape form aesthetics.
Relevant studies have shown that the combination of local knowledge and modern planning methods has achieved remarkable results in building a theoretical framework for rural planning. In rural spatial planning, Japanese scholars have focused on the orientation of mountains and the distribution of water systems to ensure the safety of residents and ecological balance by optimizing the layout of topography and water resources, which is highly compatible with the principles of Chinese geomantic theory []. Korean researchers have tried to integrate geomantic concepts into modern urban spatial planning, exploring a new model of rural planning that takes into account modern development needs while respecting cultural heritage, which is similar to the evaluation framework proposed in this study []. Meanwhile, Peru and Mexico have introduced traditional land management experience and indigenous ecological knowledge into urban and rural development practices to guide land use and ecological conservation [,]. Although these international cases provide valuable lessons, most of the studies remain only at the conceptual level and lack an operational evaluation model or a complete theoretical framework. This study proposes a rural spatial pattern assessment model based on feng shui principles and integrating AHP, GIS, and FCE techniques, which not only provides a systematic and quantifiable solution for rural planning in China, but also provides ideas and methodological tools for other countries to use when combining local traditional knowledge with modern planning methods.
In this work, the representativeness and traditional features of spatial elements such as mountains, water, fields, forests, roads, and dwellings are considered in the selection of the case study area and the screening of indicators. However, there are significant differences among rural areas in terms of climate, terrain, and local customs. Therefore, verification studies and rural planning practices based on the findings of this research should be adjusted and refined according to the unique characteristics of each region. The rural spatial pattern evaluation model and evaluation methods introduced in this study are based on the natural conditions and cultural characteristics of rural areas in the Jiangnan region of China. In the future, a rural spatial pattern database based on traditional geomantic theory will be constructed to address these limitations.
5. Conclusions
In conclusion, the purpose of this study was to develop a spatial pattern evaluation model that aligns with the unique characteristics of rural China, with the aim of better assessing and optimizing rural spatial patterns. This study successfully achieved this objective by integrating traditional Chinese geomantic theory with modern spatial analysis methods. The results indicate that the AHP–GIS–FCE multi-method evaluation framework provides an effective tool for assessing and optimizing rural spatial patterns. This research is the first to integrate the traditional Chinese concept of geomancy into a modern rural planning system. Notably, a theoretical framework for spatial planning and assessment tools that align with the characteristics of the local Chinese countryside has been developed. First, ancient geomancy terms are translated into modern architectural vocabulary to form evaluation indices for rural spatial planning, given local characteristics in China. Second, using the above-established rural spatial planning evaluation indicators as the influencing factors, the AHP-GIS-FCE model is used to scientifically analyze the spatial pattern of the countryside and reasonably assess the appropriateness of the spatial pattern. Chawan village in Suzhou city, China, is selected as a case study. Owing to the rapid acceleration of the urbanization process and the lack of theoretical guidance on rural spatial planning in accordance with local characteristics, the two evaluation indicators of terrain wetness and street traffic accessibility in Chawan village display low grades, reflective of irrational growth. Consequently, the ecological and living environment of Chawan village has been affected, with the suitability of the environment reduced for villagers. This is an urgent problem that the government of Chawan village needs to solve in the future. In this study, the traditional Chinese geomancy view is combined with the integrated AHP-GIS-FCE model, and a new type of rural spatial planning and evaluation system that considers the local characteristics of China is developed. This study provides an excellent basis for theoretical research on and the practical implementation of rural planning in China.
The five indicators with the highest weights are water body landscape (0.111) > water body buffer zones (0.103) > vegetation ecology (0.073) > vegetation coverage (0.069) > soil moisture (0.068). The three indicators with the highest rural spatial pattern evaluation values are elevation (5.00) > vegetation ecology (4.00)> water body landscape (4.00). The maximum membership result for the rural area is medium, with an evaluation value of 3.385. This indicates that, through thousands of years of development, the rural spatial pattern of Chawan village has been well preserved and continues to thrive. This is largely attributed to the village’s favorable natural environment and geographic location, which align with the principles of traditional Chinese geomantic theory for village site selection. However, the evaluation result for Chawan village is moderate, with low scores for the indicators of street traffic accessibility and the openness of indoor and outdoor spaces, which impact the suitability score of the rural artificial environment. Therefore, the construction of an AHP-GIS-FCE combined evaluation system is important for effectively assessing and guiding the development of beneficial and sustainable rural spatial patterns.
The main innovations of this study are as follows: (1) Theoretically, this study incorporates traditional geomantic theory and methods into the rural planning system in China, aiming to construct an effective and localized rural space evaluation model. This model provides a scientific theoretical basis for the sustainable and ongoing development of rural planning research and practice. This approach not only reflects the applicability of traditional geomantic theory in modern rural areas but also offers a new practical method for contemporary rural planning and construction. (2) Methodologically, this study pioneers the use of a comprehensive multi-method approach, integrating AHP, GIS, and FCE to evaluate traditional rural geomantic spaces. The integration of multiple methods and models provides a solid approach for theoretical and practical assessments of rural planning in China. Geomantic theory, rooted in early Chinese cosmology and divination traditions, has evolved over millennia through the practical experiences of rural residents in China, making it highly suitable for rural planning and construction in China. However, current academic research and practical work in rural planning often prioritize Western theories and methods, neglecting traditional Chinese geomantic views. As a result, geomantic theory is considered a nonmainstream theory in the field of rural planning. While some countries have developed mature rural planning systems, these systems may not align with China’s specific needs. Therefore, integrating traditional Chinese geomantic theory into contemporary rural planning is crucial for developing a localized theoretical framework that can support rural development in China.
However, the current research has some limitations. First of all, this study uses hierarchical analysis methods to construct judgment matrices and determine the weights of indicators with a small sample of expert interviewees, which has a certain subjective component in the decision-making results. Second, while the village case study provides valuable insights, its research framework cannot be directly applied to other rural areas, and its generalizability may be limited due to the fact that different rural areas have different climatic environments, geographic landscapes, and cultural characteristics. Therefore, the model cannot be used directly by planners or policy makers, and the assessment of rural spatial patterns in other areas needs to be adapted and improved according to the actual situation. Finally, the cultural applicability of this model outside of China remains uncertain, and further research is needed in the future to determine its relevance in different cultural contexts.
In future research, the AHP-GIS-FCE rural spatial pattern evaluation model developed in this study will be applied to other rural areas, especially those with different geographic and cultural backgrounds, to assess its robustness and identify area-specific adjustments. In addition, time series data will be incorporated into the AHP-GIS-FCE framework in the future. By tracking changes in key indicators over decades using remotely sensed satellite imagery, trend forecasting and assessment of the dynamization of rural spatial patterns can be carried out, and long-term policies affecting rural spatial patterns can be proposed.
Author Contributions
L.W. and Y.B. were equal contributors and are therefore co-first authors. Conceptualization, L.W. and Y.B.; methodology, L.W. and Y.B.; software, Y.B.; validation, L.W. and Y.B.; formal analysis, L.W. and Y.B.; investigation, Y.H.; resources, Y.B.; data curation, Y.B.; writing—original draft preparation, L.W. and Y.B.; writing—review and editing, L.W., Y.B., and Y.H.; visualization, Y.H.; supervision, Y.H. and S.Y.; project administration, Y.H. and S.Y.; funding acquisition, Y.H. and L.W. All authors have read and agreed to the published version of the manuscript.
Funding
This research is supported by the Philosophy and Social Sciences Research General Project Foundation of the Jiangsu Higher Education Institutions of China [2022SJYB1427], the Natural Science Foundation of the Jiangsu Higher Education Institutions of China [22KJB560028], both led by Yang Hu, and the Specification for construction of environmental systems in ancient villages of China, led by Lei Wang.
Data Availability Statement
Some or all the data, models, or codes that support the findings of this study are available from the corresponding author upon reasonable request.
Acknowledgments
We are grateful to Lei Wang for providing reference and funding support for this study during the process of editing the specification for the construction of the environmental system of ancient villages in China. We also gratefully acknowledge Yang Hu for providing assistance as the corresponding author in this study and financial support, including grants from the Philosophy and Social Sciences Research General Project Foundation of the Jiangsu Higher Education Institutions of China [2022SJYB1427] and the Natural Science Foundation of the Jiangsu Higher Education Institutions of China [22KJB560028].
Conflicts of Interest
The authors declare that they have no known competing financial interests or personal relationships that could have appeared to influence the work reported in this paper.
Abbreviations
The following abbreviations are used in this manuscript:
| AHP | Analytical hierarchy process |
| GIS | Geographic information system |
| FCE | Fuzzy comprehensive evaluation |
| DEM | Digital elevation model |
| NDVI | Normalized difference vegetation index |
| NDWI | Normalized difference water index |
| TWI | Topographic wetness index |
| LST | Land surface temperature |
References
- Hibbard, M.; Frank, K.I. Bringing Rurality Back to Planning Culture. J. Plan. Educ. Res. 2021, 44, 1212–1222. [Google Scholar] [CrossRef]
- Cao, Y.; Yu, X.; Jiang, F. Application of 3D Image Technology in Rural Planning. ACM Trans. Asian Low-Resour. Lang. Inf. Process. 2024, 23, 1–13. [Google Scholar] [CrossRef]
- Wang, Z.; Ma, Y.; Du, Z. Research on the construction of rural interface style based on aesthetic rules. Appl. Math. Nonlinear Sci. 2023, 8, 2527–2540. [Google Scholar] [CrossRef]
- Yu, J. (Ed.) The Source of Geomancy; China Architecture & Building Press: Beijing, China, 2005; p. 189. [Google Scholar]
- Li, X.; Li, W.; Smith, K.S.; Smith, A.C. Hidden from the wind and enjoying the water: The traditional cosmology of fengshui and the shaping of Dong villages in Southwestern China. Landsc. Res. 2018, 5, 614–627. [Google Scholar] [CrossRef]
- Hongji, Y.; Nemeth, D. The Culture of Fengshui In Korea: An Exploration of East Asian Geomancy. By Hong–key Yoon. Geogr. Rev. 2019, 101, 610–614. [Google Scholar] [CrossRef]
- Li, Q.; Cao, X. A Comparative Study of Feng Shui Culture in China, Japan, and South Korea. Northeast Asia Forum 2013, 1, 108–118+129. [Google Scholar] [CrossRef]
- Hong, S.-K.; Song, I.-J.; Wu, J. Fengshui theory in urban landscape planning. Urban Ecosyst. 2006, 10, 221–237. [Google Scholar] [CrossRef]
- Jin, Z.; Juan, Y.-K. Is Fengshui a science or superstition? A new approach combining the physiological and psychological measurement of indoor environments. Build. Environ. 2021, 201, 107992. [Google Scholar] [CrossRef]
- Cao, F.G.; Feng, W.B. Based on Geomantie Omen and GIS Technology Comparative Study of Site Selection ofTraditional Dwellings: Take Longxing Town in Chongqing as an Example. J. Chongging Norm. Univ. (Nat. Sci.) 2014, 31, 119–124+145. [Google Scholar]
- Xu, Y.; Peng, Q.; Wu, Y. An empirical study on the influence of geomantic environmental school’s theory on ancient village’s space pattern-Taking donglong village as the example. J. East China Inst. Technol. (Soc. Sci.) 2012, 31, 315–320. [Google Scholar]
- Qi, L.; Ma, Z.; Guo, Y.; Liu, J.G.; Song, Z.S. Study on the Mountain-water Patterns of Xijingyu Village in Jizhou District, Tianjin Based on the Comprehensive Analysis of Micro-climate Adaptability and Design Mechanism. Chin. Landsc. Archit. 2018, 34, 34–41. [Google Scholar]
- Hu, Y.; Zhang, Y.; Xia, X.; Li, Q.; Ji, Y.; Wang, R.; Li, Y.; Zhang, Y. Research on the evaluation of the livability of outdoor space in old residential areas based on the AHP and fuzzy comprehensive evaluation: A case study of Suzhou city, China. J. Asian Archit. Build. Eng. 2023, 23, 1808–1825. [Google Scholar] [CrossRef]
- Wang, C.; Zhang, G.; Zhai, Y. Integrating AHP-Entropy and IPA Models for Strategic Rural Revitalization: A Case Study of Traditional Villages in Northeast China. Buildings 2025, 15, 2475. [Google Scholar] [CrossRef]
- Zhang, P.; Feng, G. Application of fuzzy comprehensive evaluation to evaluate the effect of water flooding development. J. Pet. Explor. Prod. Technol. 2018, 8, 1455–1463. [Google Scholar] [CrossRef]
- Alaoui, Y.L.; Tkiouat, M. Assessing the performance of microfinance lending process using AHP-fuzzy comprehensive evaluation method. Int. J. Eng. Bus. Manag. 2017, 9, 1847979017736692. [Google Scholar] [CrossRef]
- Li, S.; Liang, Y.; Deng, X.; Xu, W.; Li, X. Exploring the Spatial Heterogeneity of Rural Development in Laos Based on Rural Building Spatial Database. Land 2023, 12, 2008. [Google Scholar] [CrossRef]
- Lin, G.; Xiang, L.; Sang, K. Scenic Railway Mapping: An Analysis of Spatial Patterns in France Based on Historical GIS. ISPRS Int. J. Geo-Inf. 2022, 10, 99. [Google Scholar] [CrossRef]
- Zou, Q.; Sun, J.; Luo, J.; Cui, J.; Kong, X. Spatial Patterns of Key Villages and Towns of Rural Tourism in China and Their Influencing Factors. Sustainability 2023, 15, 13330. [Google Scholar] [CrossRef]
- Wang, H.; Shan, Y.; Xia, S.; Cao, J. Traditional Village Morphological Characteristics and Driving Mechanism from a Rural Sustainability Perspective: Evidence from Jiangsu Province. Buildings 2024, 14, 1302. [Google Scholar] [CrossRef]
- Wu, L.Z. Twin Bay Village Chronicles; China Jiangsu People’s Press: Nanjing, China, 2021; pp. 21–85. [Google Scholar]
- Major, J.S.; Queen, S.A.; Meyer, A.S.; Roth, H.D. (Eds.) The Huainanzi; Columbia University Press: New York, NY, USA, 2010; pp. 11–101. [Google Scholar]
- Guo, P. Burial Scripture; China Economic Press: Beijing, China, 2004. [Google Scholar]
- Magli, G. Astronomy and Feng Shui in the projects of the Tang, Ming and Qing royal mausoleums: A satellite imagery approach. Archaeol. Res. Asia 2019, 17, 98–108. [Google Scholar] [CrossRef]
- Wang, W.; Gu, Y.E.; Fan, Q.E. Qingyan Conglu; Zhonghua Book Company: Beijing, China, 1991; pp. 1–15. [Google Scholar]
- Xu, S. The Collected Explanations of Huainanzi; China Bookstore Press: Beijing, China, 1989. [Google Scholar]
- Liu, X.; Ren, J.F.; Liu, J.T.E. Trans. & Annotations. Explanation of Name; Zhonghua Book Company: Beijing, China, 2021. [Google Scholar]
- Guan, Z.; Cheng, J.; Hu, X.W.; Cai, L. (Eds.) Guanzi; Yunnan University Press: Kunming, China, 2003; pp. 1–201. [Google Scholar]
- Gupta, U.G.; Clarke, R.E. Theory and application of the Delphi technique: A bibliography (1975–1994). Technol. Forecast. Soc. Change 1996, 53, 185–211. [Google Scholar] [CrossRef]
- Rios, R.; Duarte, S. Selection of ideal sites for the development of large-scale solar photovoltaic projects through Analytical Hierarchical Process—Geographic information systems (AHP-GIS) in Peru. Renew. Sustain. Energy Rev. 2021, 149, 111310. [Google Scholar] [CrossRef]
- Cay, T.; Uyan, M. Evaluation of reallocation criteria in land consolidation studies using the Analytic Hierarchy Process (AHP). Land Use Policy 2013, 30, 541–548. [Google Scholar] [CrossRef]
- Manchen, X.; Hailin, X.; Linna, Z.; Jiuyu, W.; Shiqi, C.; Shuo, T. Evaluation of Livability of Living Environment in Grassland Small Towns under the Concept of Feng Shui. Urban Rural Dev. 2022, 13, 63–66. [Google Scholar]
- Liu, Y.; Xiang, W.; Hu, P.; Gao, P.; Zhang, A. Evaluation of Ecological Environment Quality Using an Improved Remote Sensing Ecological Index Model. Remote Sens. 2024, 16, 3485. [Google Scholar] [CrossRef]
- Ye, X.; Kuang, H. Evaluation of ecological quality in southeast Chongqing based on modified remote sensing ecological index. Sci. Rep. 2022, 12, 15694. [Google Scholar] [CrossRef]
- Gao, B.-C. NDWI—A normalized difference water index for remote sensing of vegetation liquid water from space. Remote Sens. Environ. 1995, 58, 257–266. [Google Scholar] [CrossRef]
- Maduako, I.N.; Ndukwu, R.I.; Ifeanyichukwu, C.; Igbokwe, O. Multi-Index Soil Moisture Estimation from Satellite Earth Observations: Comparative Evaluation of the Topographic Wetness Index (TWI), the Temperature Vegetation Dryness Index (TVDI) and the Improved TVDI (iTVDI). J. Indian Soc. Remote Sens. 2016, 45, 631–642. [Google Scholar] [CrossRef]
- Qin, Z.H.; Zhang, M.H.; Karnieli, A.; Berliner, P. Mono-window Algorithm for Retrieving Land Surface. Temperature from Landsat TM6data. ACTA Geogr. Sin. 2001, 56, 456–466. [Google Scholar]
- Wu, X.; Hu, F. Analysis of ecological carrying capacity using a fuzzy comprehensive evaluation method. Ecol. Indic. 2020, 113, 106243. [Google Scholar] [CrossRef]
- Adair, A.; Hutchison, N. The reporting of risk in real estate appraisal property risk scoring. J. Prop. Invest. Financ. 2005, 23, 254–268. [Google Scholar] [CrossRef]
- Locurcio, M.; Tajani, F.; Anelli, P.M.D. A Multi-criteria Decision Analysis for the Assessment of the Real Estate Credit Risks. Apprais. Valuat. Contemp. Issues New Front. 2020, 327–337. [Google Scholar] [CrossRef]
- Li, C.; Liu, Q.; Zong, Z.; Fang, Y. Rural Environmental Quality Evaluation Indicator System: Application in Shangluo City, Shaanxi Province. Sustainability 2024, 16, 3198. [Google Scholar] [CrossRef]
- Waley, P.; Åberg, E.U. Finding Space for Flowing Water in Japan’s Densely Populated Landscapes. Environ. Plan. A Econ. Space 2011, 43, 2321–2336. [Google Scholar] [CrossRef]
- Rivero-Romero, A.D.; Moreno-Calles, A.I.; Casas, A.; Castillo, A.; Camou-Guerrero, A. Traditional climate knowledge: A case study in a peasant community of Tlaxcala, Mexico. J. Ethnobiol. Ethnomed. 2016, 12, 33. [Google Scholar] [CrossRef] [PubMed]
- Saylor, C.R.; Alsharif, D.K.A.; Torres, H. The importance of traditional ecological knowledge in agroecological systems in Peru. Int. J. Biodivers. Sci. Ecosyst. Serv. Manag. 2017, 13, 150–161. [Google Scholar] [CrossRef]
Disclaimer/Publisher’s Note: The statements, opinions and data contained in all publications are solely those of the individual author(s) and contributor(s) and not of MDPI and/or the editor(s). MDPI and/or the editor(s) disclaim responsibility for any injury to people or property resulting from any ideas, methods, instructions or products referred to in the content. |
© 2025 by the authors. Licensee MDPI, Basel, Switzerland. This article is an open access article distributed under the terms and conditions of the Creative Commons Attribution (CC BY) license (https://creativecommons.org/licenses/by/4.0/).