Article

Experimental Investigation on Physical and Mechanical Behaviors of Paraffin Microcapsule Phase-Change Energy-Storage Concrete

1
Nanxun Innovation Institute, Zhejiang University of Water Resources and Electric Power, Hangzhou 310018, China
2
Zhejiang Hydropower Construction and Installation Co., Ltd., Hangzhou 310051, China
3
Wenzhou Water Conservancy Construction Management Center, Wenzhou 325608, China
*
Author to whom correspondence should be addressed.
Buildings 2025, 15(11), 1907; https://doi.org/10.3390/buildings15111907
Submission received: 10 May 2025 / Revised: 28 May 2025 / Accepted: 30 May 2025 / Published: 1 June 2025

Abstract

:
Phase-change materials (PCMs) are gradually being applied in the field of building energy conservation due to their ability to absorb and release heat through phase changes within a specific temperature range. This study prepared a paraffin-microencapsulated phase-change aggregate (PCA) and used the equal volume sand replacement method to replace standard sand with PCA under a fixed water–cement ratio and curing conditions. Five sets of concrete specimens with varying PCA content were designed and tested for their apparent densities, compressive strengths, water absorptions, thermal conductivities, and microstructures. The experimental results show that the apparent density, compressive strength, ultrasonic velocity, and thermal conductivity of phase-change energy-storage concrete (PCC) gradually decrease with the increasing PCA content. Its apparent density, compressive strength, ultrasonic velocity, and thermal conductivity all reach their minimum values when the PCA content reaches 40%; minimum values are 2.07 g/cm3, 42.461 MPa (56 days), 8.93 km/s, and 1.43 W/(m·K), respectively. The water-absorption rate of PCC specimens exhibits non monotonic response characteristics with the variation of PCA dosage. This study can provide a theoretical basis for the preparation of PCCs by the PCA method.

1. Introduction

The consumption of energy in various industries continues to increase with the rapid development of the social economy, and non-renewable energy raw materials are gradually being depleted [1,2,3,4]. From a global perspective, the construction industry consumes a huge proportion of energy, mainly due to the high energy consumption of cooling and heating spaces inside buildings. According to the “2024 Research Report on Carbon Emissions in China’s Urban and Rural Construction Sector” [5], the total energy consumption of China’s construction and building industry in 2022 was 2.42 billion tons of standard coal, accounting for 44.8% of the country’s total energy consumption; among factors contributing to this percentage of total energy consumption, construction energy consumption accounts for 22.8%, and building operation energy consumption accounts for 22.0%. The total carbon emissions related to construction and operation are 5.13 billion tons of carbon dioxide, accounting for 48.3% of the national energy-related carbon emissions. Among them, the construction industry accounts for 26.6% of the construction carbon emissions, and the construction operation carbon emissions account for 21.7%. Therefore, achieving an appropriate balance between reducing operating costs in the construction industry, achieving energy conservation and emission reduction [6], reducing energy consumption, and providing a comfortable indoor environment has become an urgent problem to be solved [7].
The current Chinese building insulation standards are mainly limited to external wall insulation systems, and the insulation materials mainly include organic insulation materials such as polystyrene board, extruded polystyrene board, and paper-faced gypsum polystyrene board. This insulation system and related construction technology have drawbacks such as insufficient fire resistance and poor durability [8,9]. Research and development of new green building materials is the best way to reduce energy consumption and carbon emissions [10]. Among them, phase-change materials (PCMs) are gradually being applied in the construction industry due to their efficient absorption and release of heat through phase change near the phase-transition point, as well as their high heat-storage density, heat-recovery capacity, and reusability [11,12,13,14]. This use of PCMs to absorb and release thermal energy to regulate the temperature of the building environment can not only improve the energy efficiency of the building and reduce building energy consumption but also enhance the thermal comfort of the building [15,16].
Due to its chemical inertness, good thermal storage density, small phase segregation, and relatively low price, paraffin wax is often used as a PCM in engineering [17,18,19]. However, paraffin wax has high fluidity when it is in liquid form during the phase-transition process. If no protective material is wrapped around its surface, leakage often occurs [20]. Microcapsule PCM is a micro-scale phase-change capsule made of paraffin as the core material and polymethyl methacrylate (PMMA) with good mechanical properties as the wall material. It not only effectively solves the leakage problem of paraffin during phase transition but also has high thermal cycling stability [21,22,23].
In recent years, a large number of scholars have conducted research on PCC and accumulated much useful experience. Jia et al. [24] compared the performance of benchmark concrete (REF), 50% recycled aggregate concrete (50RA), and 50% PCM-containing recycled aggregate concrete (50RA-PCM), and their research results indicated that PCM filling of aggregate pores improves workability and reduces the water consumption and capillary water-absorption coefficient of 50RA-PCM but leads to a decrease in compressive/flexural strength. The experimental results of Chen et al. [25] showed that PCMs can reduce the peak temperature inside concrete, delay the peak time, and slow down the heating and cooling rates, thereby reducing the temperature gradient and reducing the risk of cracks. The research results of Erdene et al. [26] indicated that an increase in PCM content will reduce the compressive strength of concrete, but at a content of 30%, it still meets the requirements for lightweight wall panels, and the PCM can improve the thermal performance of concrete and is suitable for building insulation. High temperature PCMs have great potential in hot areas. Zhang et al. [27] prepared a novel sheet-like graphite-doped phase-change microcapsule, and their study results showed that the composite PCMs can effectively reduce indoor temperature fluctuations. Cun et al. [28] studied the physical and mechanical properties of cement mortar mixed with a non-encapsulated PCM, and the results showed that non-encapsulated PCMs can be used as a more economical solution to improve building energy efficiency without negatively affecting the mechanical properties of the material. The experimental results of Cabeza et al. [29] showed that energy storage could be achieved by encapsulating PCM in the wall. Compared with traditional concrete without PCM, concrete with PCM added exhibited higher thermal inertia and lower indoor temperature. Sun et al. [30] prepared cement mortar using paraffin/expanded perlite material, and their results showed that the compressive strength of cement mortar gradually decreased with the increasing paraffin/expanded perlite material content. Zhang et al. [31] developed a structurally functional integrated composite PCA to replace coarse aggregates in large volume concrete, and their research results showed that compared to unencapsulated PCA, PCC prepared with PCA encapsulated with epoxy resin exhibited significantly improved compressive strength. Qiu et al. [32] used vacuum adsorption to wrap paraffin wax inside the expanded perlite and made PCAs, effectively solving the problem of leakage in the application of solid–liquid PCMs. The study results of Zhu [33] showed that when the content of phase-change microcapsules was less than or equal to 10%, the mechanical properties and thermal properties of the specimens reached equilibrium, making it suitable for building envelope structures. In response to the problem of concrete freeze–thaw damage in cold regions, Tian et al. [34] prepared artificial phase-change aggregates (APCAs) using microencapsulated PCMs (MPCMs) as the core material and cement as the shell through the disc granulation method, and their experimental results showed that APCAs had high strength (63–112 MPa), good heat-storage capacity, and excellent freeze–thaw resistance (strength retention rate > 50%) when the MPCM content was 10–30%, and the MPCM content had a significant impact on the APCA performance.
From the above research, it can be concluded that PCMs can effectively improve the temperature of building environments and reduce energy consumption. However, the incorporation of PCMs into concrete in different ways can lead to significant changes in its physical and mechanical properties [35]. This article investigates the influence of PCA dosage on the physical and mechanical properties of PCC by preparing PCAs with paraffin microcapsules accounting for 20% of the total cement mass and adding it to concrete in a certain proportion. Under the same water–cement ratio and curing conditions, by testing the apparent densities, compressive strengths, water absorptions, thermal conductivities, and microstructures of PCC specimens with different PCA dosages, the influence of different PCA content on the physical and mechanical properties of ordinary Portland cement concrete is explored, and a more suitable range of PCA dosages can be obtained through comparative analyses, in order to meet the mechanical performance requirements of concrete in engineering while possessing certain temperature control capabilities and minimizing the strength-loss rate, thereby providing theoretical basis for the design and construction of PCC.

2. Materials and Methods

2.1. Experimental Materials

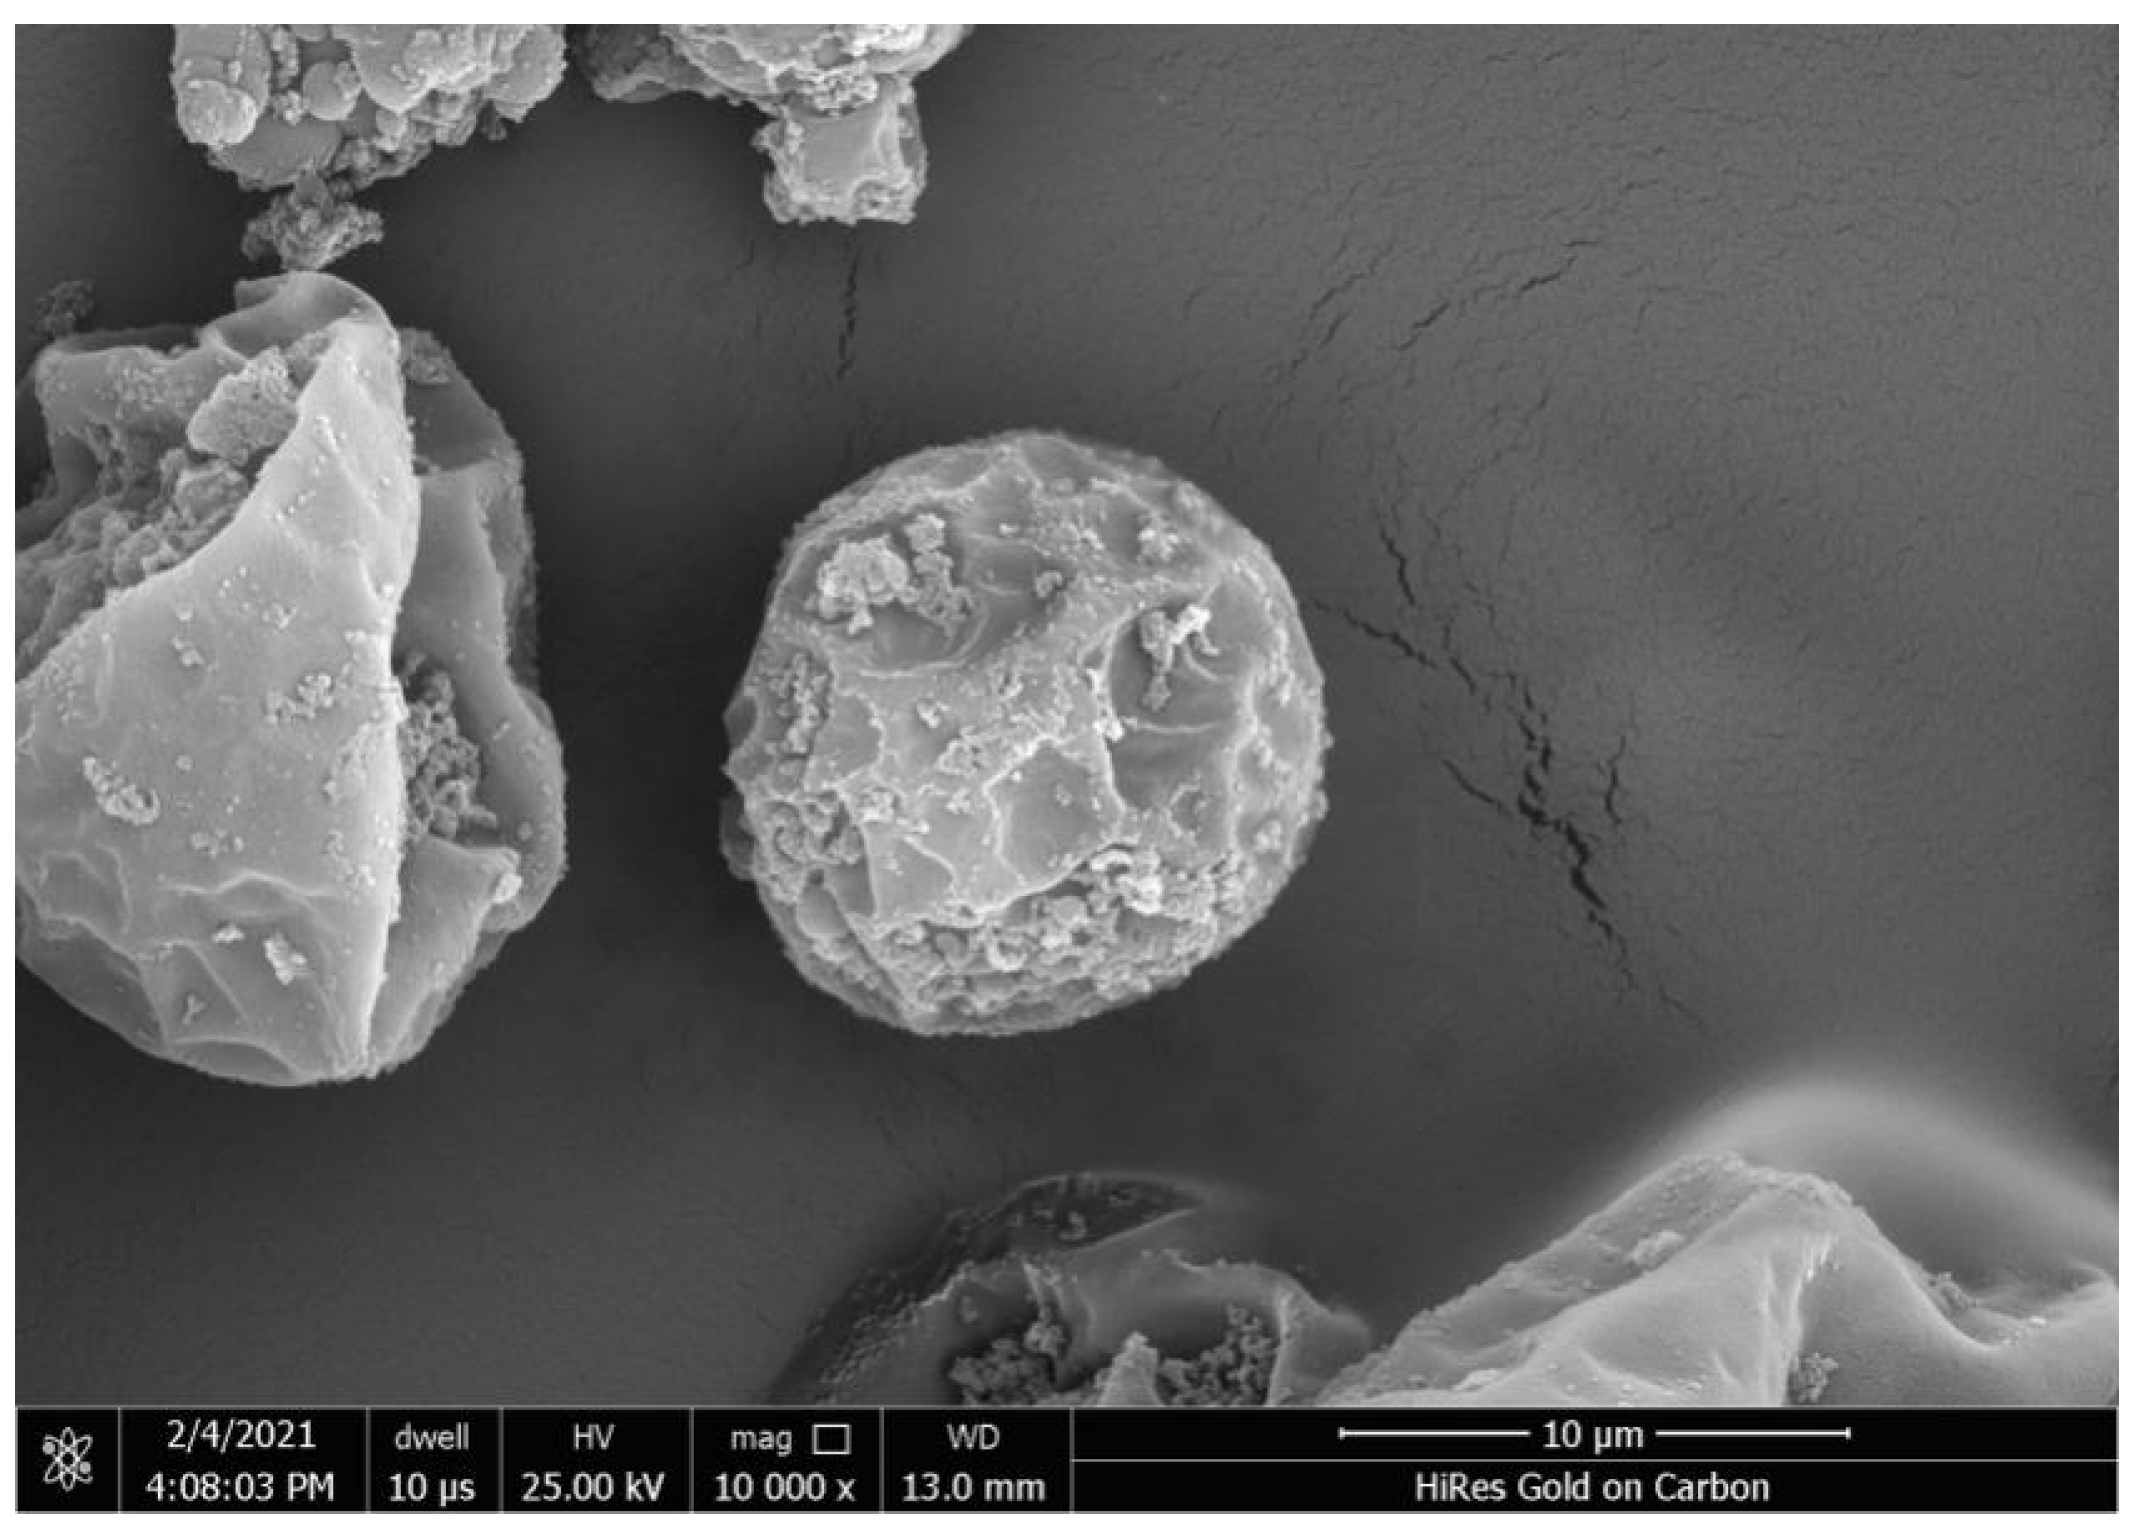
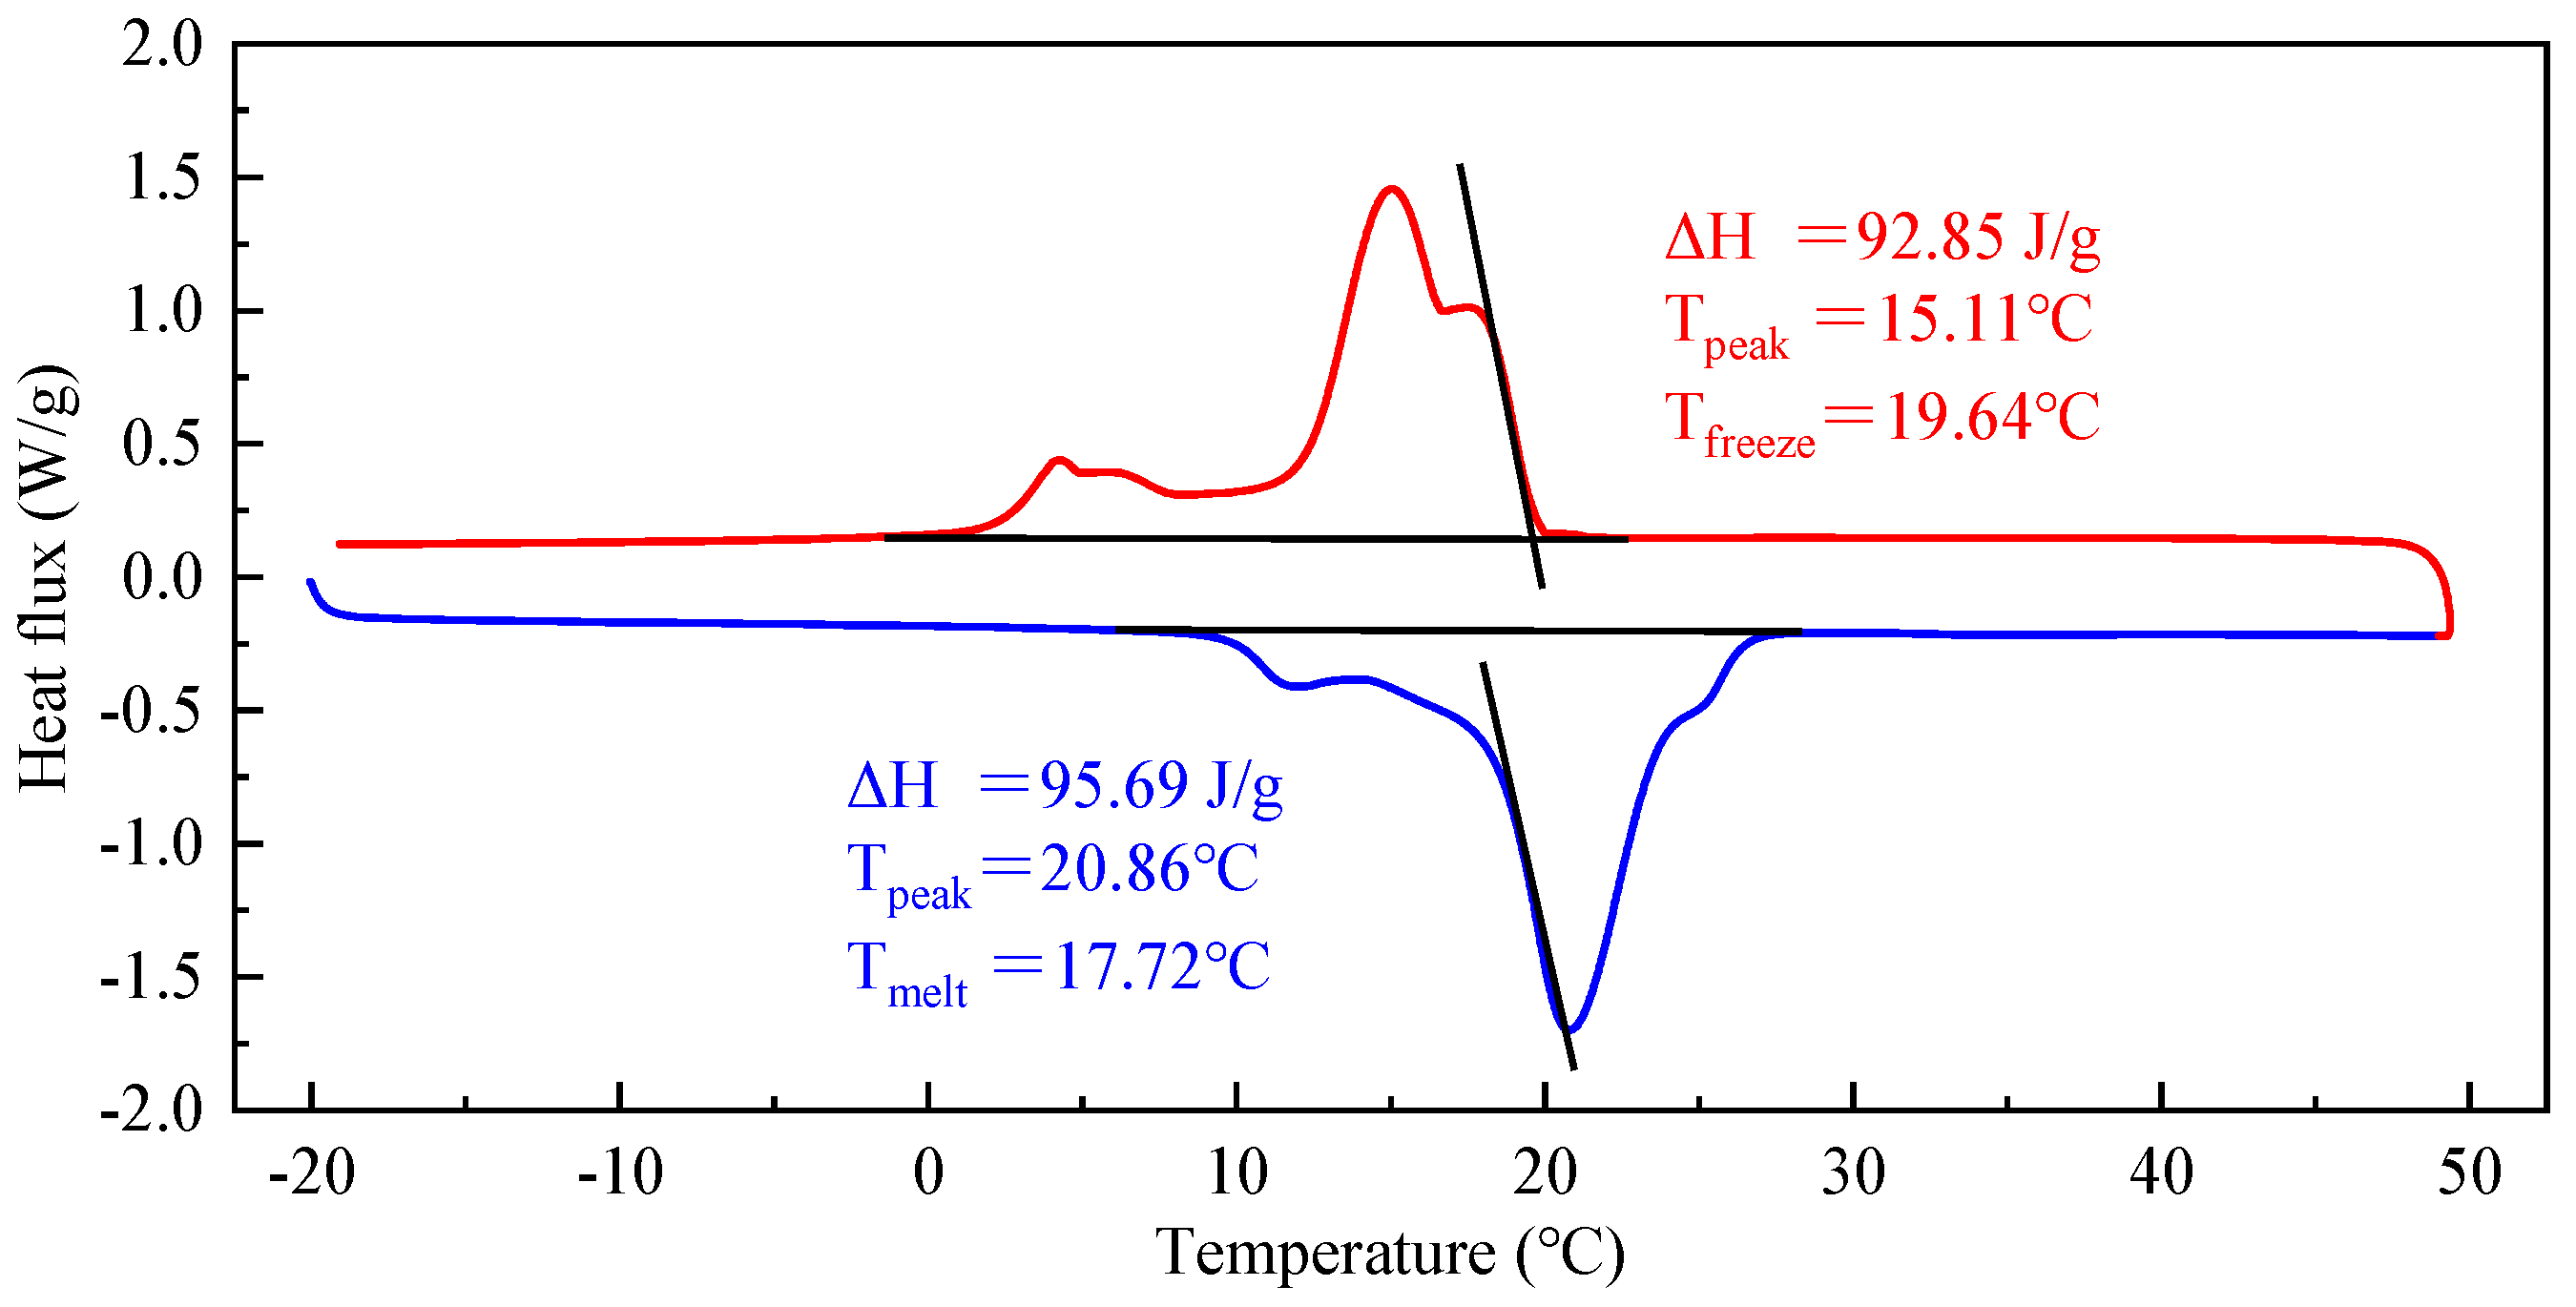
The experimental materials mainly include standard sand, paraffin microcapsules, water-reducing agents, and ordinary Portland cement. Among them, the cement is ordinary Portland cement (P·O 42.5), and its main chemical composition and content are shown in Table 1. The sand is a Chinese ISO standard sand with a density of 2500 kg/m3. Tested using a Malvern laser particle size analyzer (MS3000, Malvern Instruments Inc., Malvern, UK), the sand particle size distribution curves are shown in Figure 1. The PCM is paraffin microcapsules, which are made of paraffin core material and polymethyl methacrylate as wall material, with a density of 850 kg/m3 and a particle size of about 25 μm. Due to the vacuum treatment required before electron microscopy scanning, the microstructure of the paraffin microcapsules appears wrinkled, as presented in Figure 2. Its DSC curves were tested by a differential scanning calorimeter (DSC, QL-2000, TA Company, New Castle, DE, USA) and demonstrated in Figure 3. The curves have endothermic and exothermic peaks of 20.86 °C and 15.11 °C and melting enthalpy and crystallization enthalpy of 95.69 J/g and 92.85 J/g, respectively. The water-reducing agent is a high-performance polycarboxylate water-reducing agent, with a dosage of 1% of the mass of the cementitious material. The mixing water is ordinary tap water.

2.2. Preparation of PCA

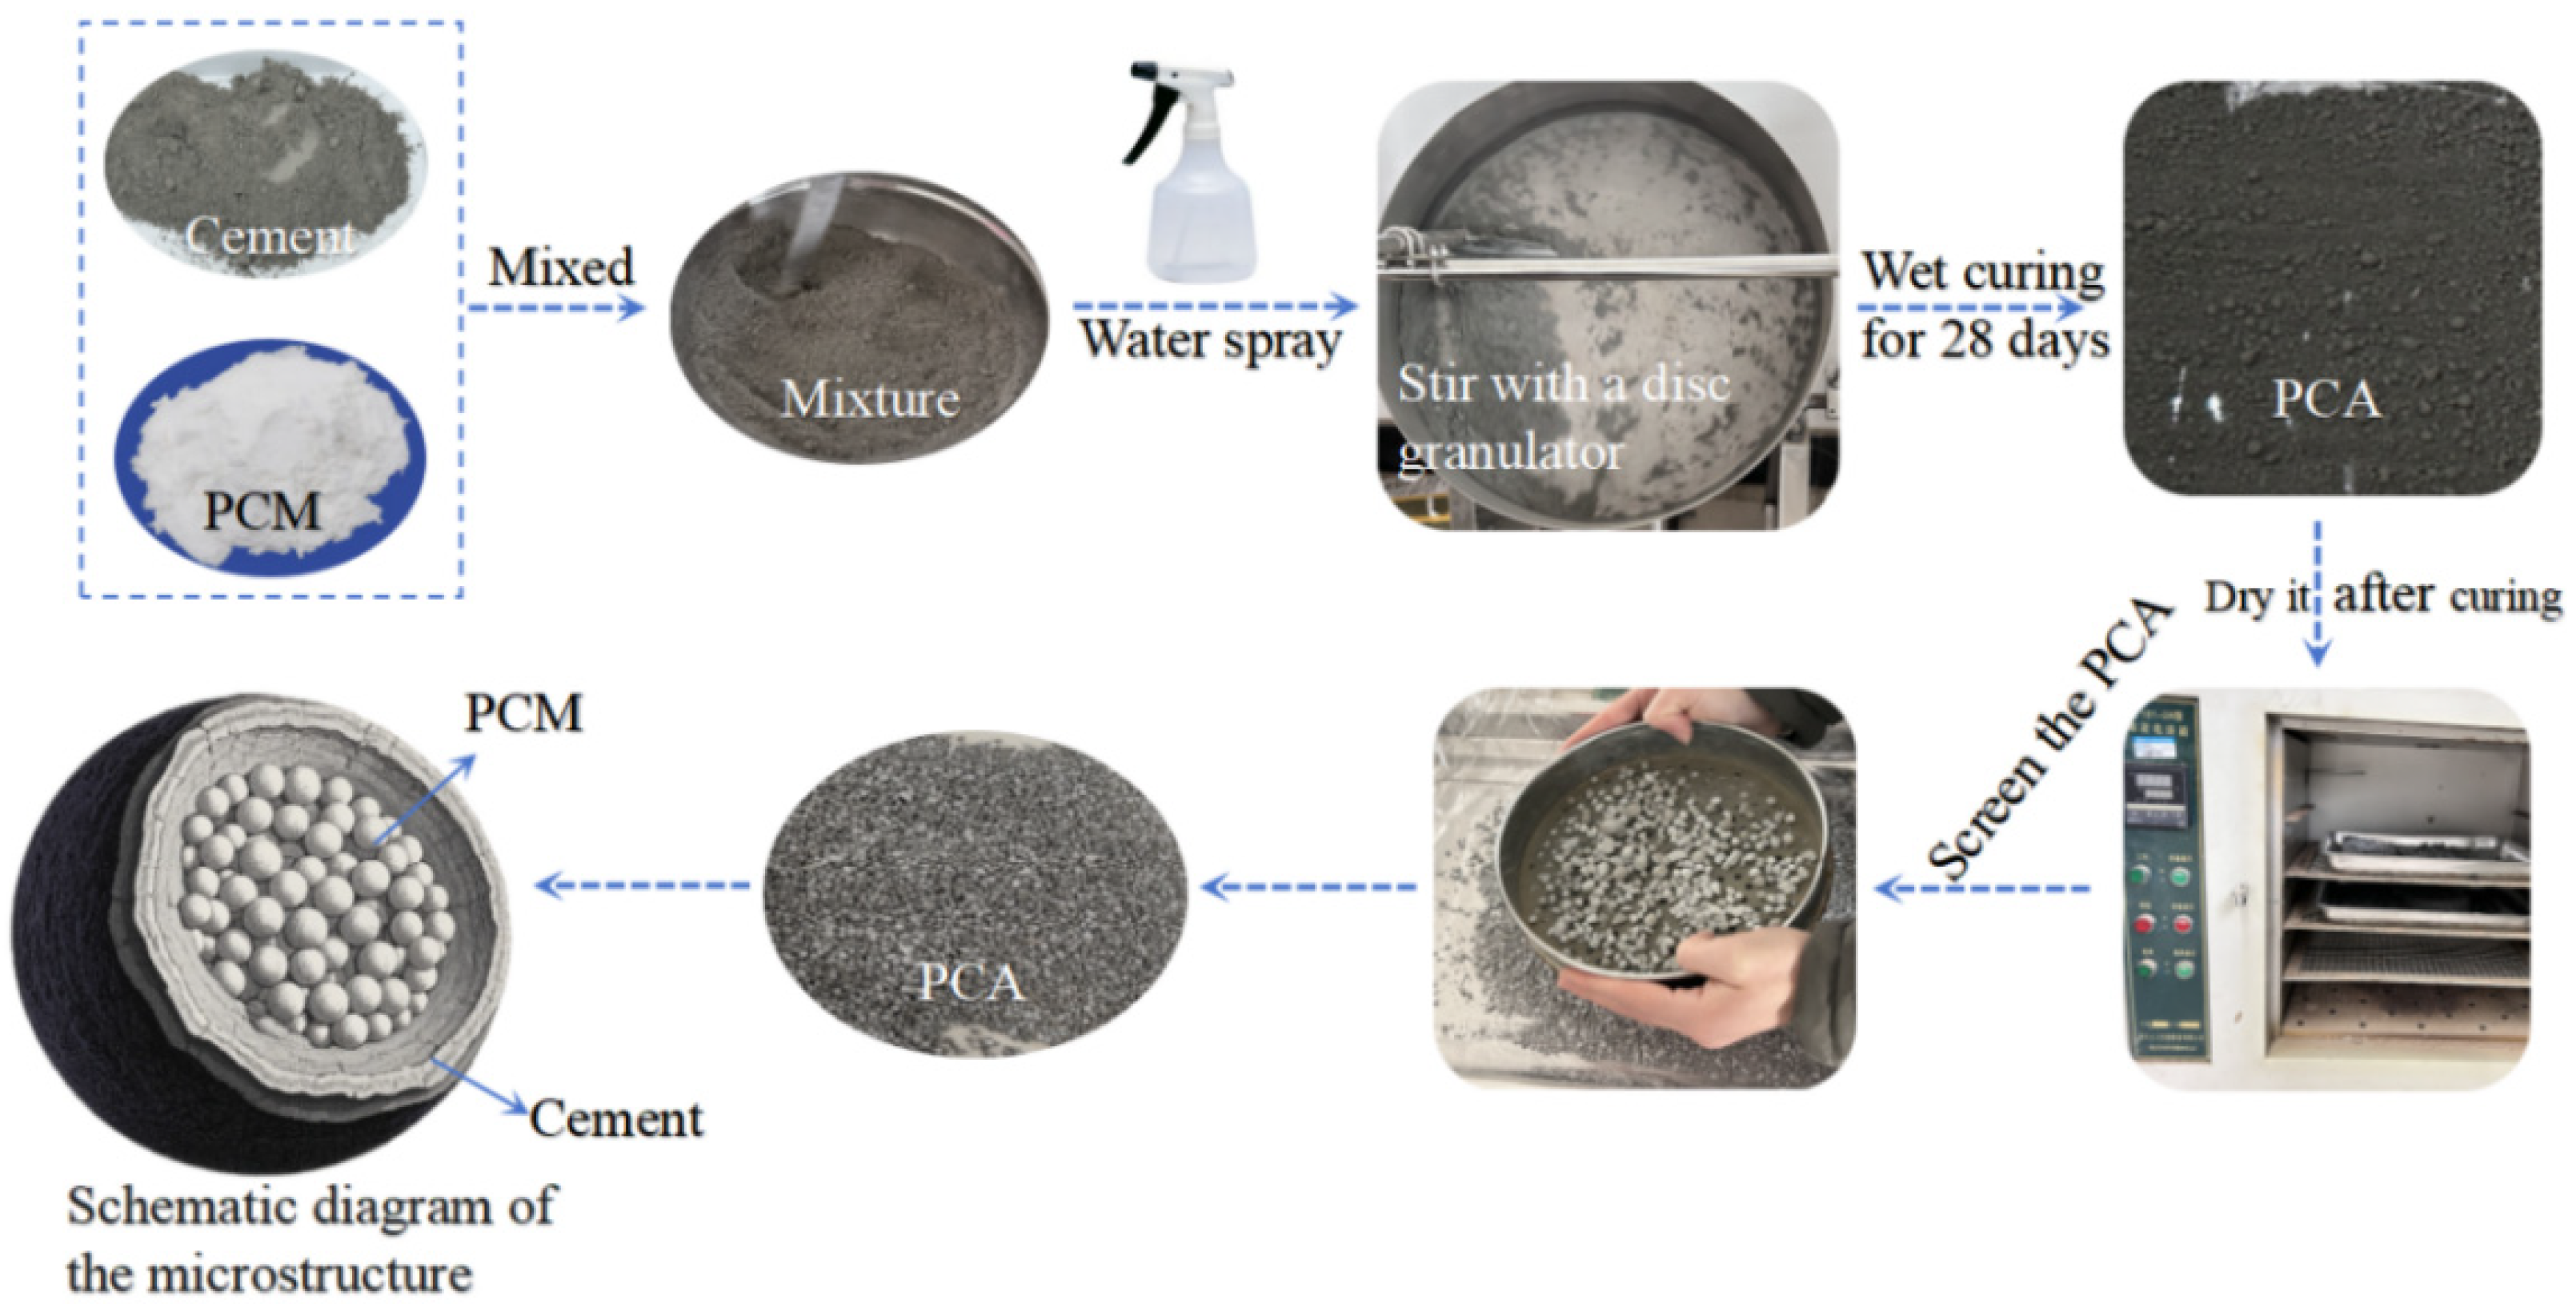
PCA is an aggregate particle made by encapsulating a certain amount of PCM with cement. The PCA prepared in this experiment has a microcapsule content of 20% of the total cement mass. The preparation process is shown in Figure 4.
Firstly, weigh 200 g of cement, 40 g of PCM, and 70 g of water. Place 1/2 of the cement and all PCM in a dry container, continuously spray with atomized water, and stir with a glass rod until the water, cement, and PCM are evenly mixed before use. Then, after ensuring the internal drying of the granulator, turn on the disc granulator and set the speed and tilt angle to 30 r/min and 45°, respectively. Under the action of centrifugal force, friction force, and gravity, the raw materials gradually form particles. Then, slowly add the remaining 1/2 of cement and atomized water, and spray atomized water into the disc while adding cement to form a cement shell. After the cement shell is completely wrapped, place the newly formed PCA in a ventilated place for 24 h, and then place it in room temperature water for curing for 28 days.

2.3. Mix Proportion Design

This experiment used the equal volume sand replacement method to prepare PCC, replacing standard sand with PCA by equal volume, while keeping the amounts of other materials unchanged. The PCC mix design is shown in Table 2.

2.4. Preparation of PCC Specimens

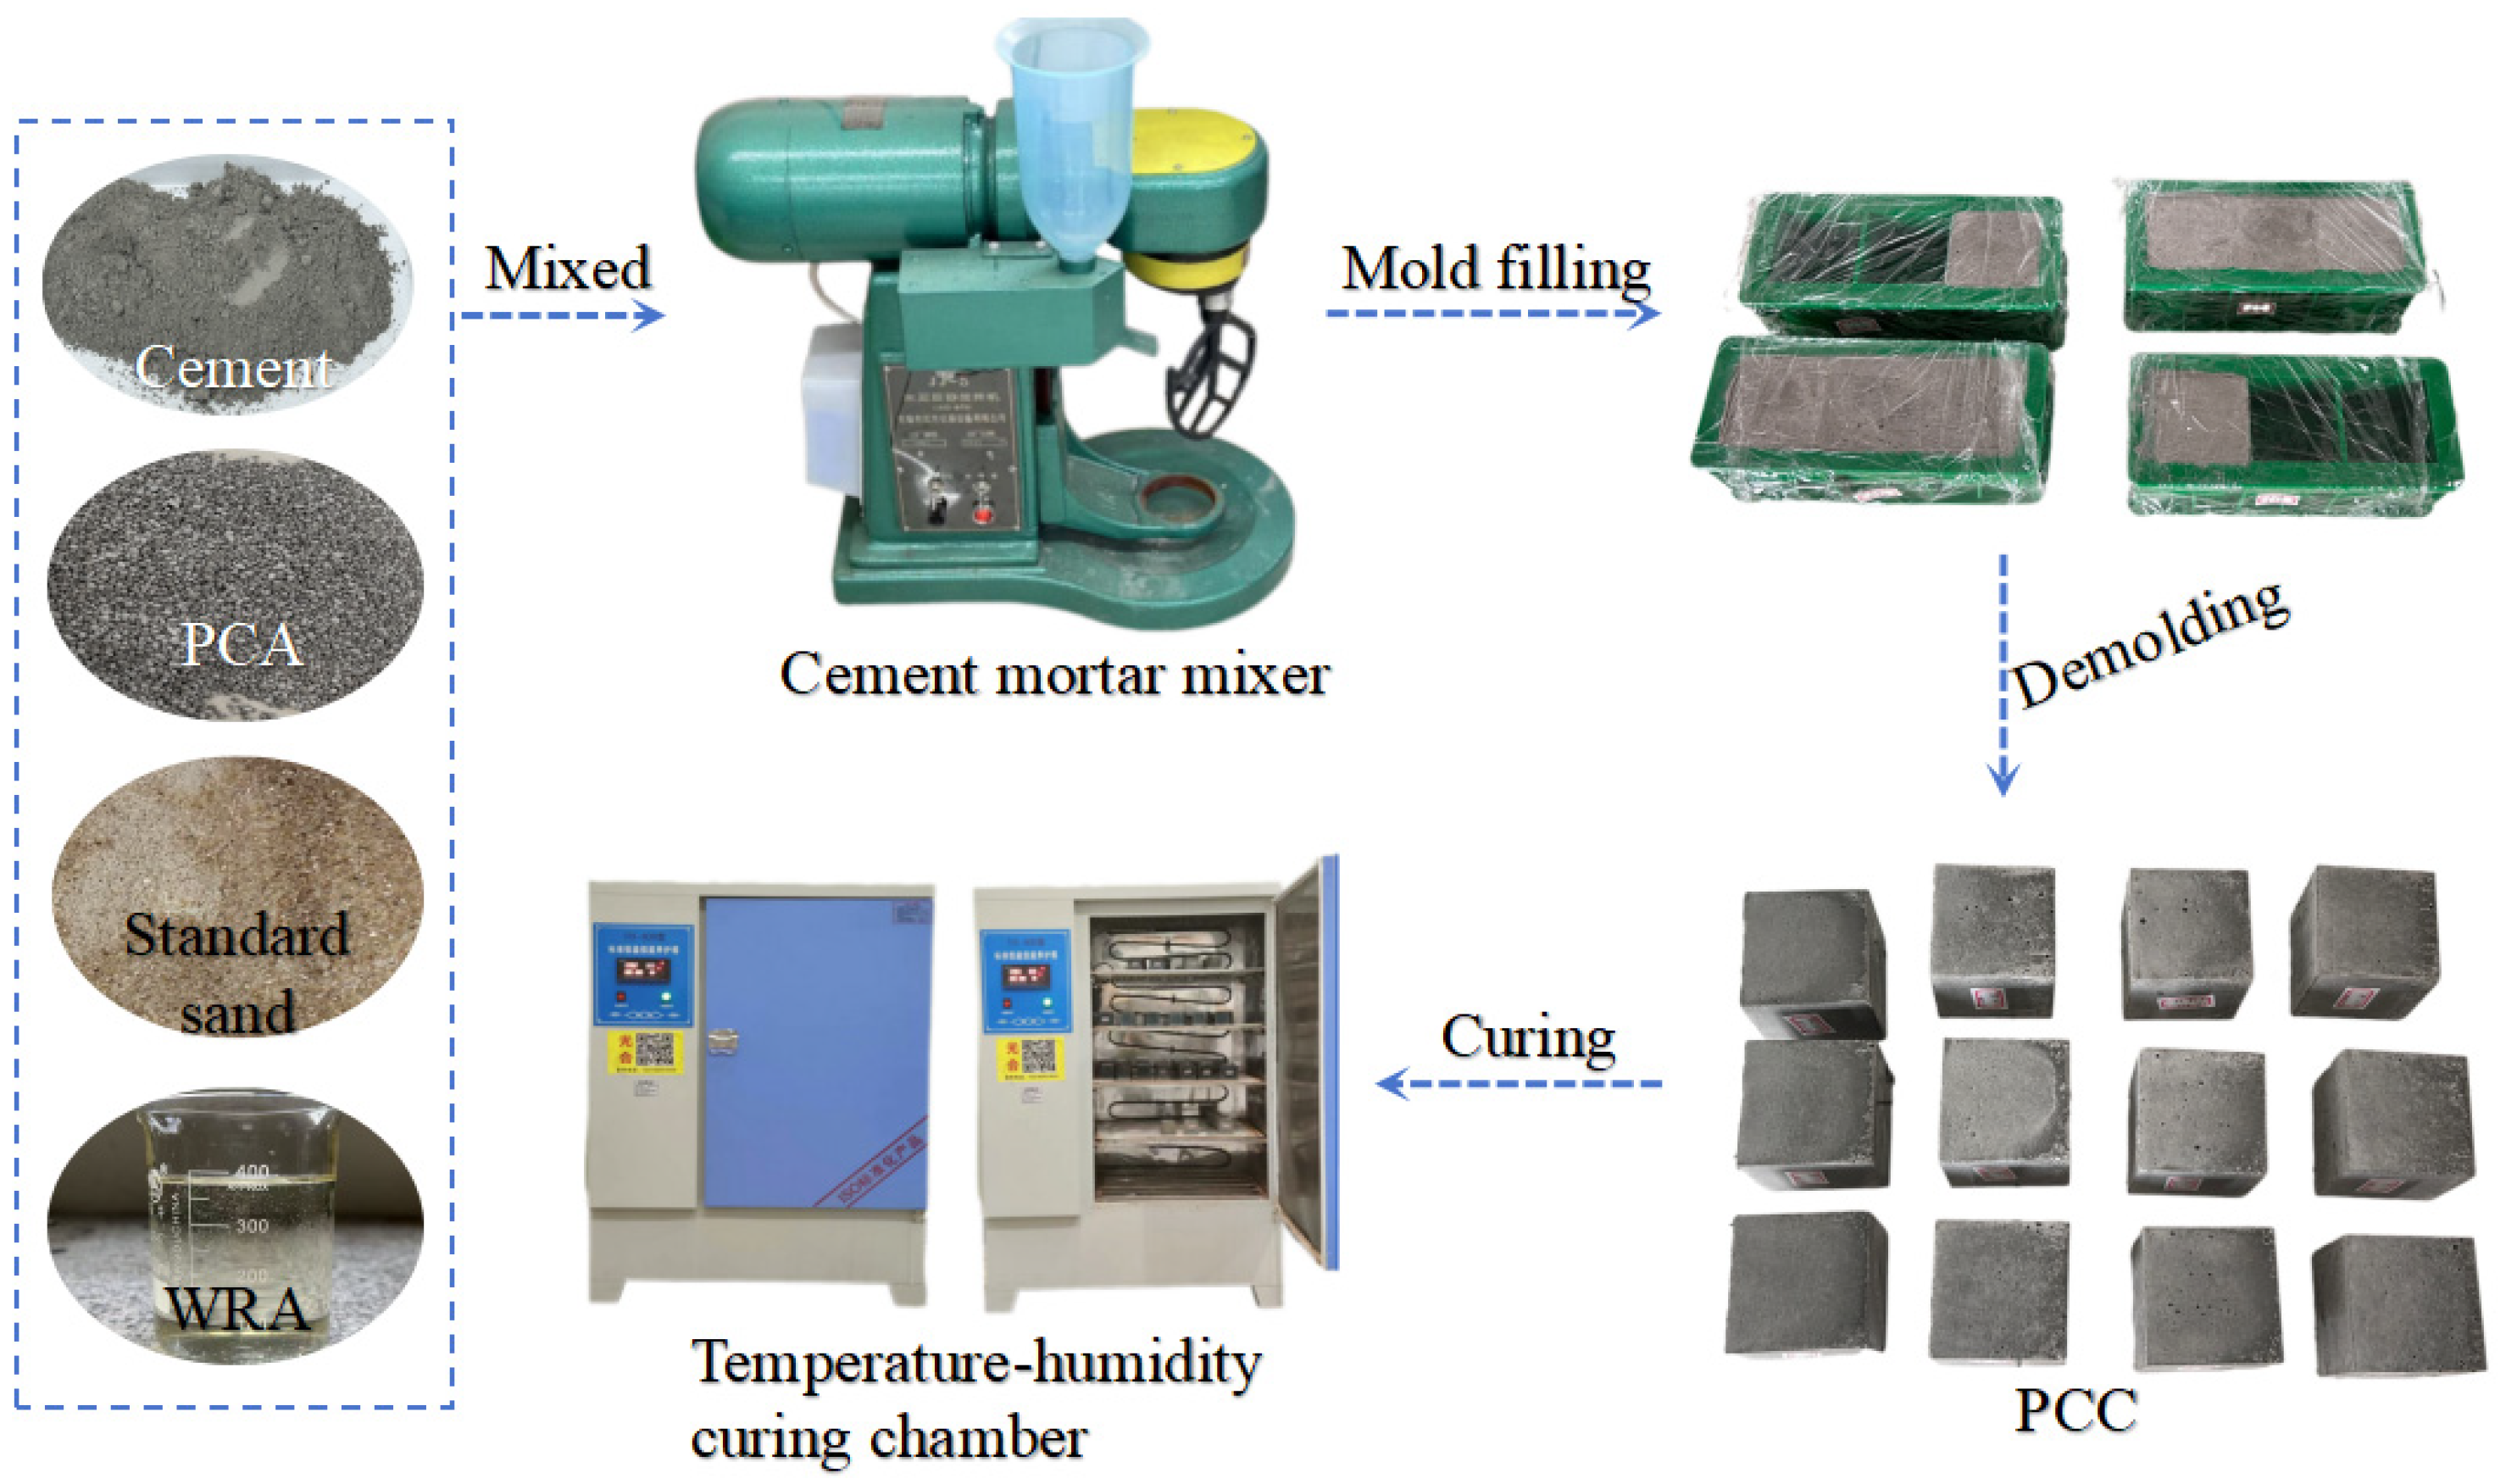
According to Table 2, PCA was used instead of standard sand to prepare PCC specimens. To control the testing cost and improve the testing efficiency, the specimens were made into cubes with a length, width, and height of 50 mm. The production method and process of the specimens are as shown in Figure 5. The method and process are as follows: Firstly, accurately weigh the materials required for the experiment, such as water, cement, standard sand, PCA, and water-reducing agent, and prepare them for later use. Next, place the cement, standard sand, and PCA in a drying dish and mix them thoroughly. Then, pour them into a cement mortar mixer and mix them in the order of “slow speed, fast speed, slow speed” to ensure thorough mixing. Then, add the water-reducing agent and water into the cement mortar mixer, and after mixing is complete, mold and compact them into shape. After 24 h of molding, remove the mold from the concrete and place it in a standard curing box (the temperature is 20 ± 0.5 °C, and the relative humidity is larger than 95%) for curing until a certain age, and then conduct corresponding tests.

2.5. Experimental Methods

2.5.1. Apparent Density

Measure the apparent density of PCC specimens with a curing age of 56 days. Take the specimen out of the curing box and place it in a vacuum-drying oven at 35 °C for drying until the mass is basically constant (the mass change does not exceed 0.1%). Weigh the dry mass of the specimen and then measure the side length of the specimen with a vernier caliper and calculate its volume and its apparent density (accurate to 0.001 g/cm3).

2.5.2. Water-Absorption Test

The experiment uses the quality method to determine the water-absorption rate of PCC test blocks. Firstly, place the 56 d old specimen in a 30 ± 5 °C oven to dry to a constant weight (with a mass change not exceeding 0.1%), and record the drying mass. Subsequently, immerse the test block in water and remove it after 3 h, 6 h, 10 h, 24 h, and 48 h. Wipe off the surface moisture with a damp cloth and weigh it. Calculate the water-absorption rate according to Formula (1).
W = m 1 m 2 m 1 × 100 %
where W is the water-absorption rate, %; m 1 is the mass of PCC when dried, g; and m 2 is the mass of PCC after absorbing water, g.

2.5.3. Compressive Strength Test

The compressive strength test of PCC is strictly carried out in accordance with the “Standard Test Methods for Physical and Mechanical Properties of Concrete” (GBT 50081-2019) [36]. The experimental instrument selected is a microcomputer-controlled universal testing machine with model XYB305C (New Sansi (Shanghai) Enterprise Development Inc., Shanghai, China). The loading method is set to displacement-controlled loading, and the initial loading speed is set to 2.0 mm/min. The loading speed is adjusted to 0.4 mm/min when the pressure head of the testing machine comes into contact with the specimen and the pressure value reaches 500 N. The loading is stopped when the specimen is crushed and the pressure value decays to 40% of the maximum value.

2.5.4. Ultrasonic Pulse Test

The experiment used the NM-4A non-metallic ultrasonic detector (Beijing Newlide Technology Inc., Beijing, China) to measure the ultrasonic velocity of PCC specimens. To ensure the accuracy and reliability of the data, three measurements were taken at the same measuring point, and the average value was taken as the ultrasonic velocity measurement value of the specimen. The ultrasonic pulse velocity was calculated according to Formula (2).
v = L Δ t
where v is the ultrasonic velocity, km/s; L is the distance of the specimen, mm; and Δ t is the transmission time, s.

2.5.5. Microstructure Test

To study the microstructure of PCC at different age groups, microscopic morphology tests were conducted using an Evo10 scanning electron microscope (Carl Zeiss Inc., Oberkochen, Germany). Firstly, concrete fragments were collected after compressive strength testing, surface smooth fragments were selected as SEM test samples, and they were immersed in anhydrous ethanol to terminate their hydration reaction. Before observing the microstructure of PCC, the sample needed to be dried and then fixed on the SEM sample stage with conductive adhesive. It was then placed in the SD-900 ion sputtering instrument (Beijing Boyuan Micro Nano Technology Inc., Beijing, China) for gold-spraying treatment to obtain clear microstructure images and provide data support for analysis.

2.5.6. Thermal-Conductivity-Measurement Test

The TC3000E transient hot-wire method thermal-conductivity meter (Xi’an Xiaxi Electronic Technology Inc., Xi’an, China) was used to test the thermal conductivity of the specimens in the experiment. This instrument has a wide measurement range, with a thermal-conductivity-measurement range of 0.005–10 W/(m·K) and a temperature range of −60 to 120 °C. During the experiment, measurement can be carried out by setting the relevant test parameters through the main interface of the instrument. The sample preparation adopts the static pressure pressing method, and the probe is placed between two samples of the same specification during testing to ensure the accuracy and reliability of the measurement results [37].

3. Results and Discussion

3.1. Analysis of Apparent Density

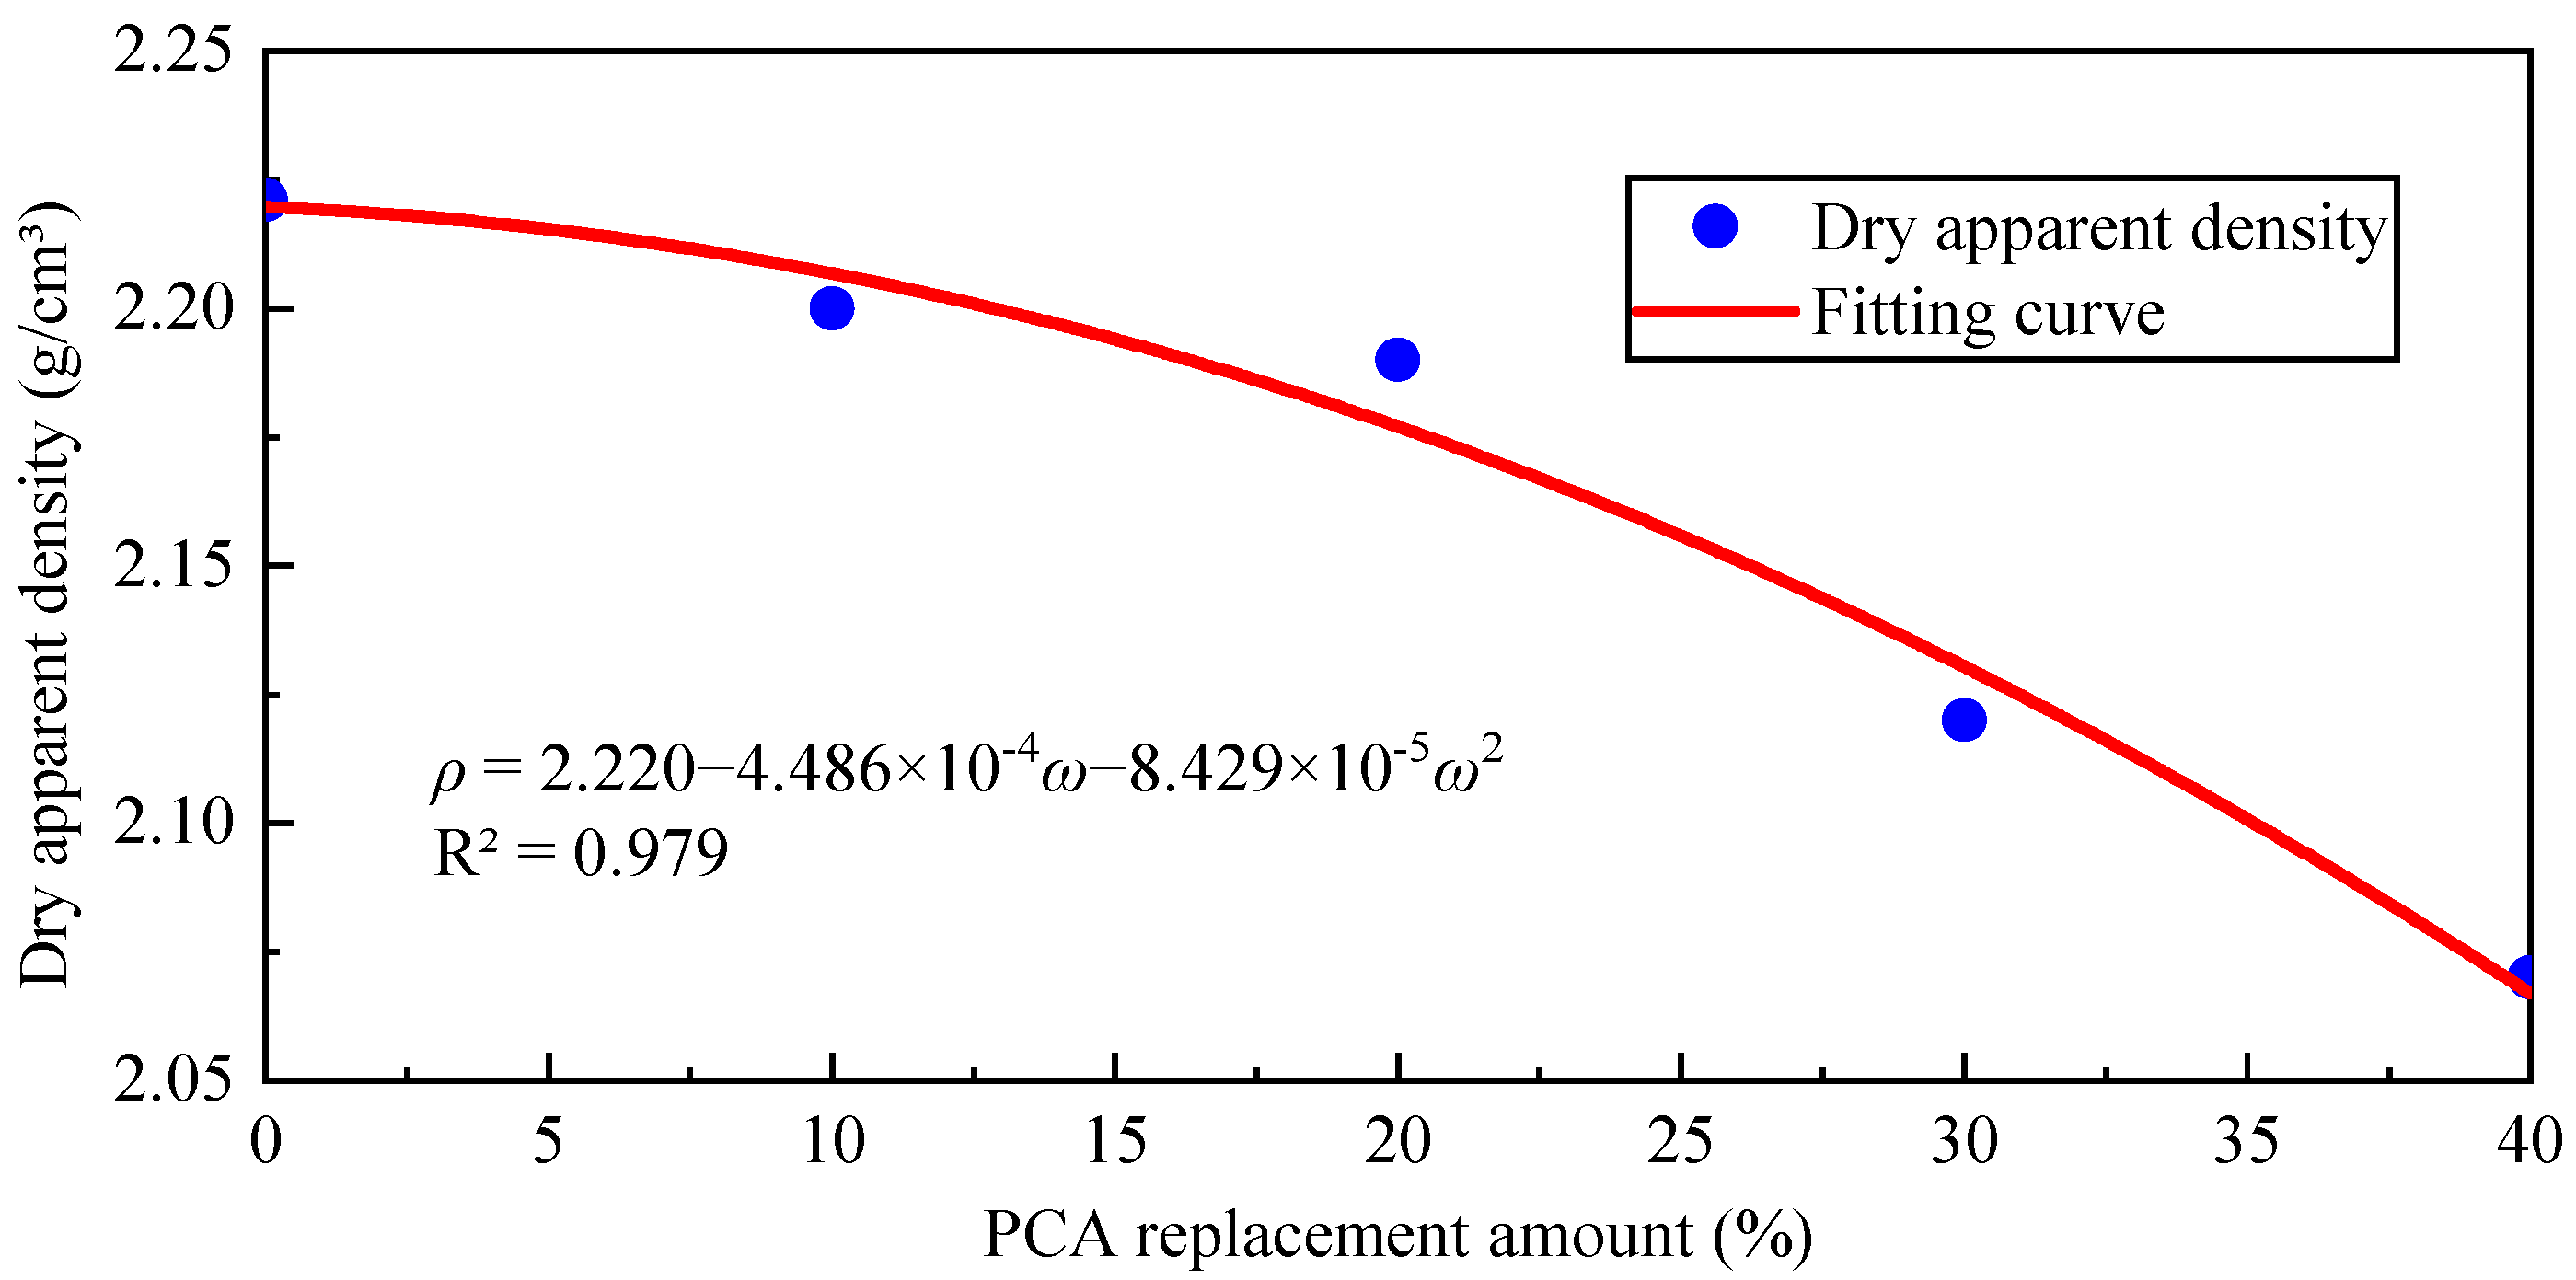
The variation of apparent density of PCC specimens with PCA content is shown in Figure 6.
According to Figure 6, the apparent densities of PCC-0, PCC-10, PCC-20, PCC-30, and PCC-40 are 2.22 g/cm3, 2.20 g/cm3, 2.19 g/cm3, 2.12 g/cm3, and 2.07 g/cm3, respectively, and their apparent densities decrease with increasing PCA content. Compared with the PCC-0 specimen, the apparent densities of the specimens numbered PCC-10, PCC-20, PCC-30, and PCC-40 decreased by 0.95%, 1.40%, 4.55%, and 6.80%, respectively. The decrease in apparent density of the specimen is not significant when the content of PCA is small. As the content of PCA increases, the change rate in apparent density gradually increases. Due to the fact that the density of standard sand is 2500 kg/m3, while the density of PCM is about 850 kg/m3, this will result in a significantly lower density of PCA compared to standard sand and also lead to a decrease in the density of PCC. At the same time, the addition of PCA may increase the porosity inside the concrete, and micro pores may form at the interface between the aggregate shell and the concrete matrix, thereby reducing the overall density. The thermal expansion coefficient of PCMs is significantly different from that of concrete, and weak areas are easily formed at the interface between PCMs and the cement matrix. During the solid–liquid phase-change process, volume expansion may occur, which may damage the internal structure of concrete and indirectly increase porosity.

3.2. Analysis of Water Absorption

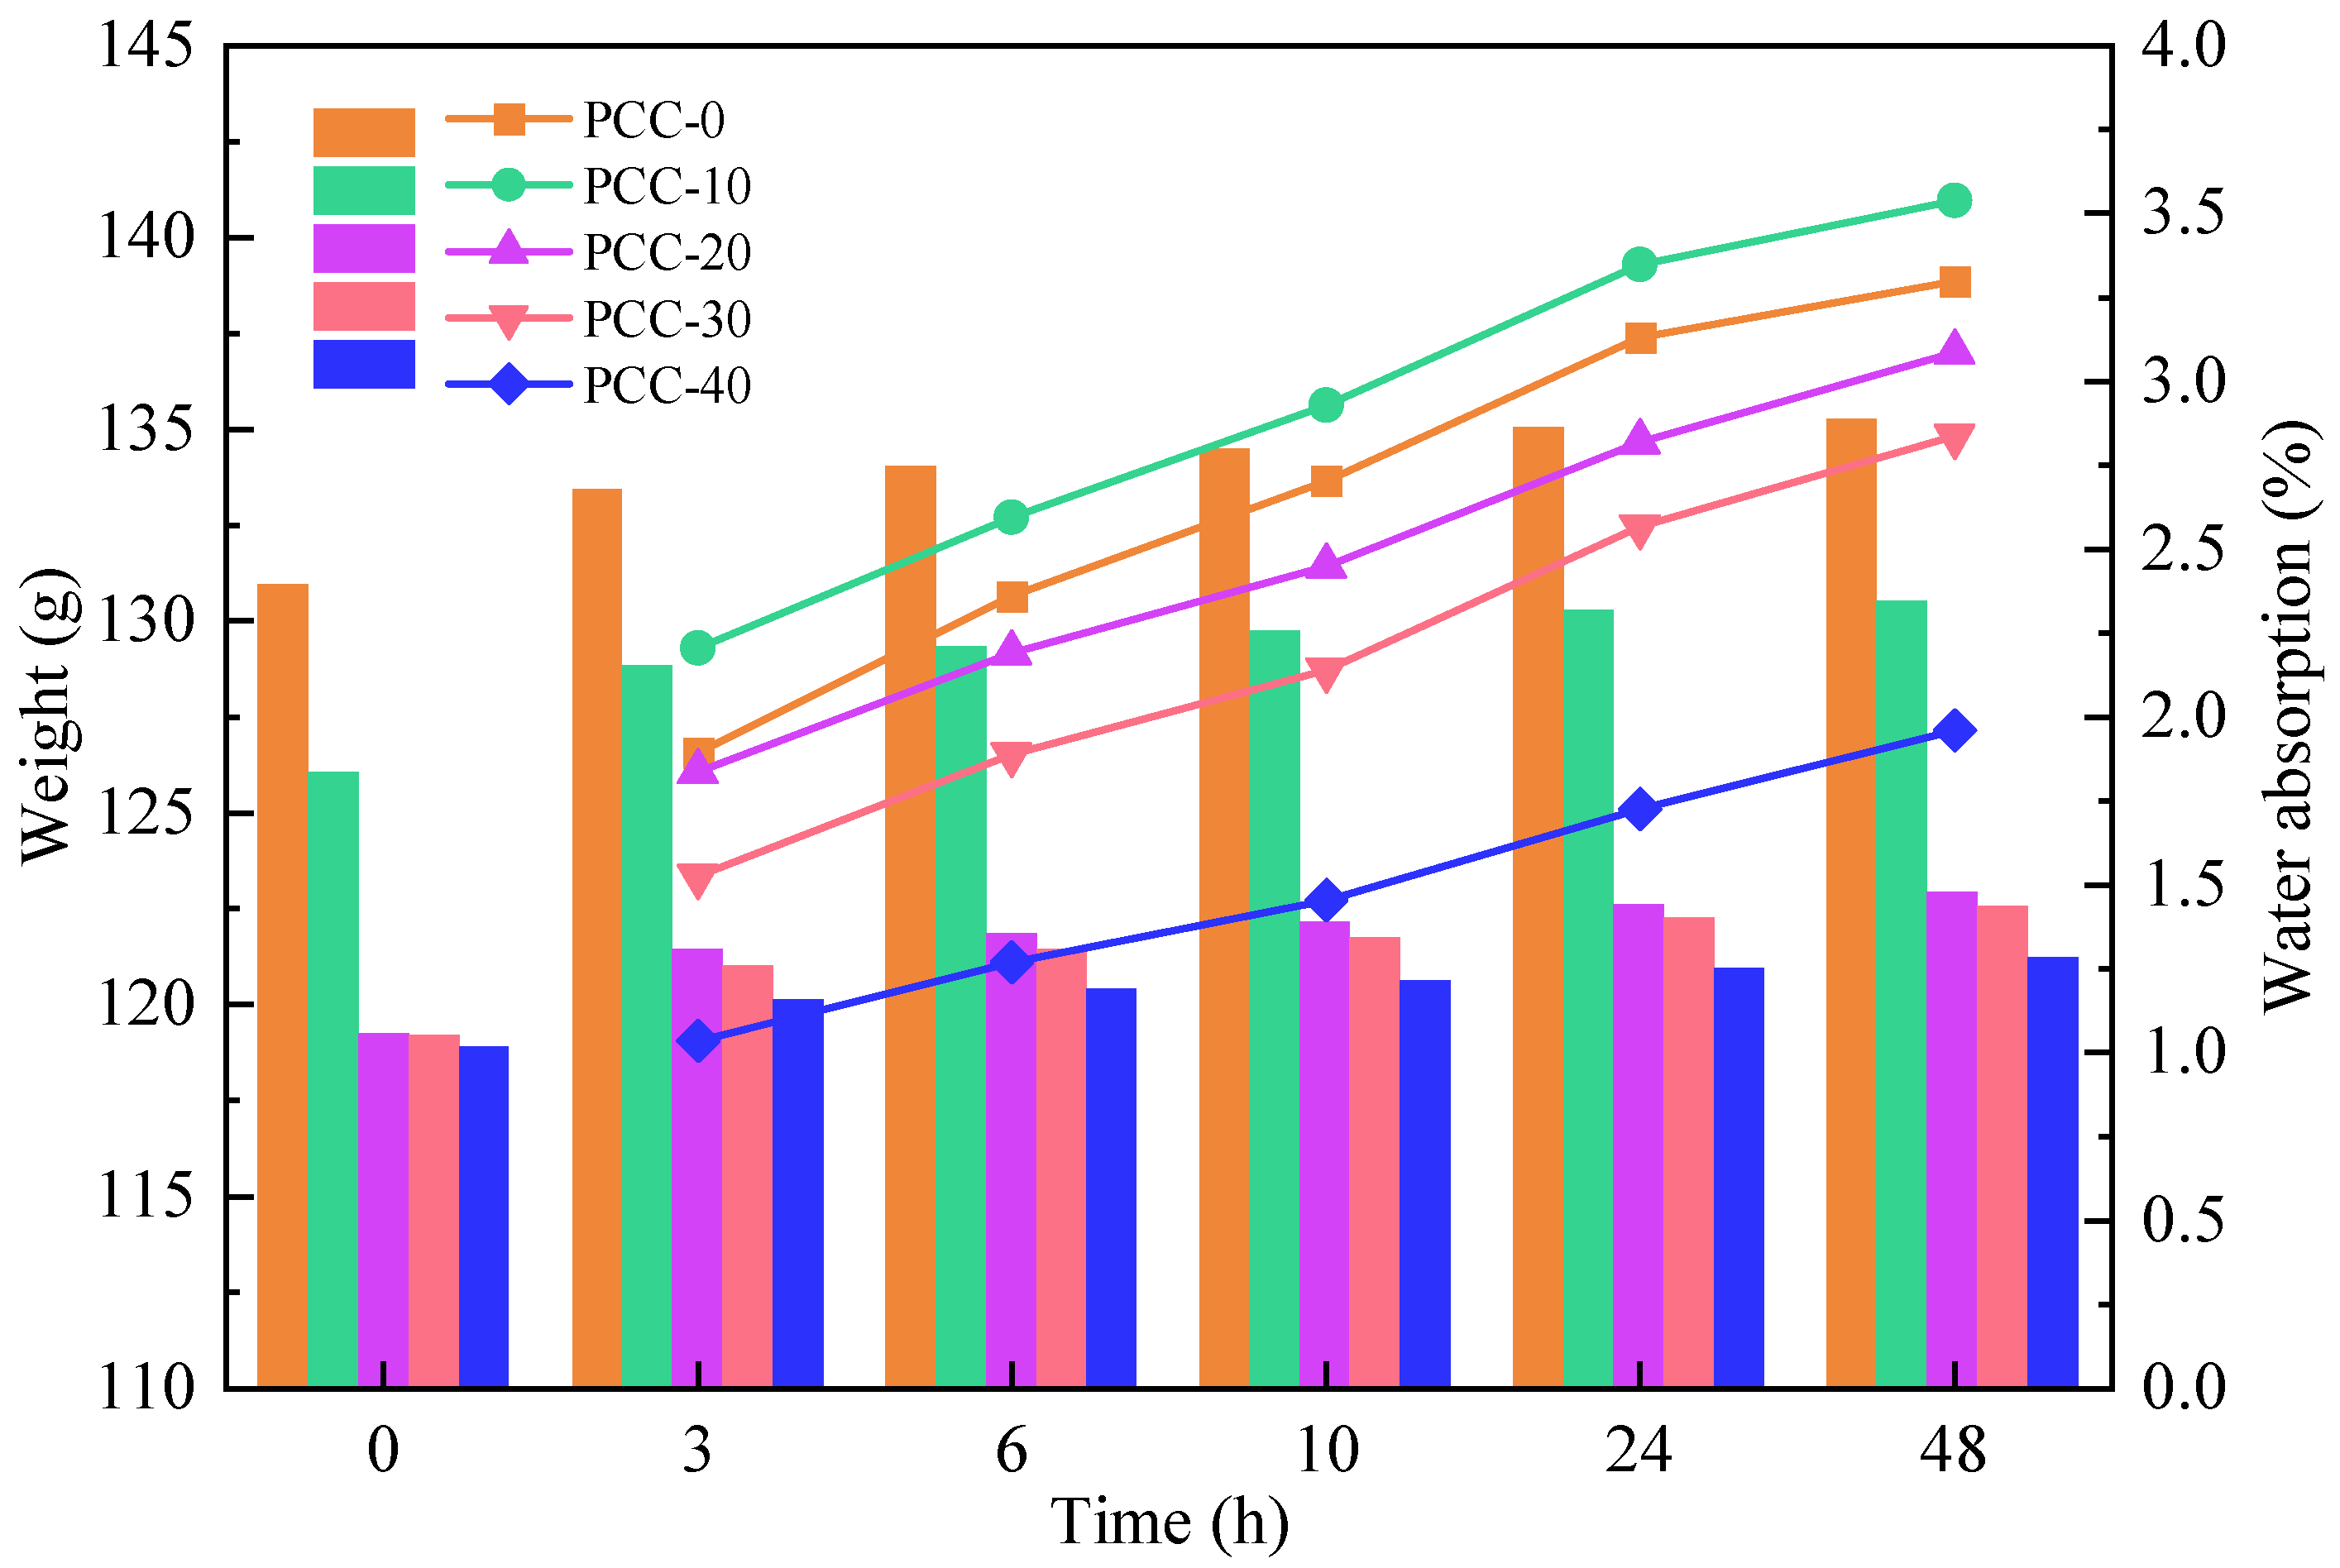
According to the experimental data, water-absorption tests were conducted on concrete samples with different PCA dosages (0%, 10%, 20%, 30%, and 40%). The relationship between water-absorption rate and time is shown in Figure 7.
As illustrated in Figure 7, the water-absorption rate of PCC specimens is higher when the PCA content increases from 0% to 10%. The water-absorption rate of the specimens is generally lower when the PCA content increased from 10% to 40%. The water-absorption rate of the PCC specimen after 48 h is 3.54% when the PCA content is 10%, while the water-absorption rate of the specimen with 40% PCA content is only 1.96%. The addition of PCA particles increases the porosity of the specimen but simultaneously reduces the connected pores in the concrete, thereby decreasing the water-absorption rate [38]. In addition, PCMs are organic compounds with hydrophobicity. When these materials are encapsulated in aggregates, they may reduce the hydrophilicity of concrete [39]. Meanwhile, PCA adopts surface-encapsulation technology to form a dense shell, which blocks the connection between the internal pores of the aggregate and the outside world [40]. The performance of the specimen can enhance its durability and functional stability during use, offering it certain application advantages in the fields of building insulation and energy conservation in humid environments and freeze–thaw areas.

3.3. Analysis of Compressive Strength

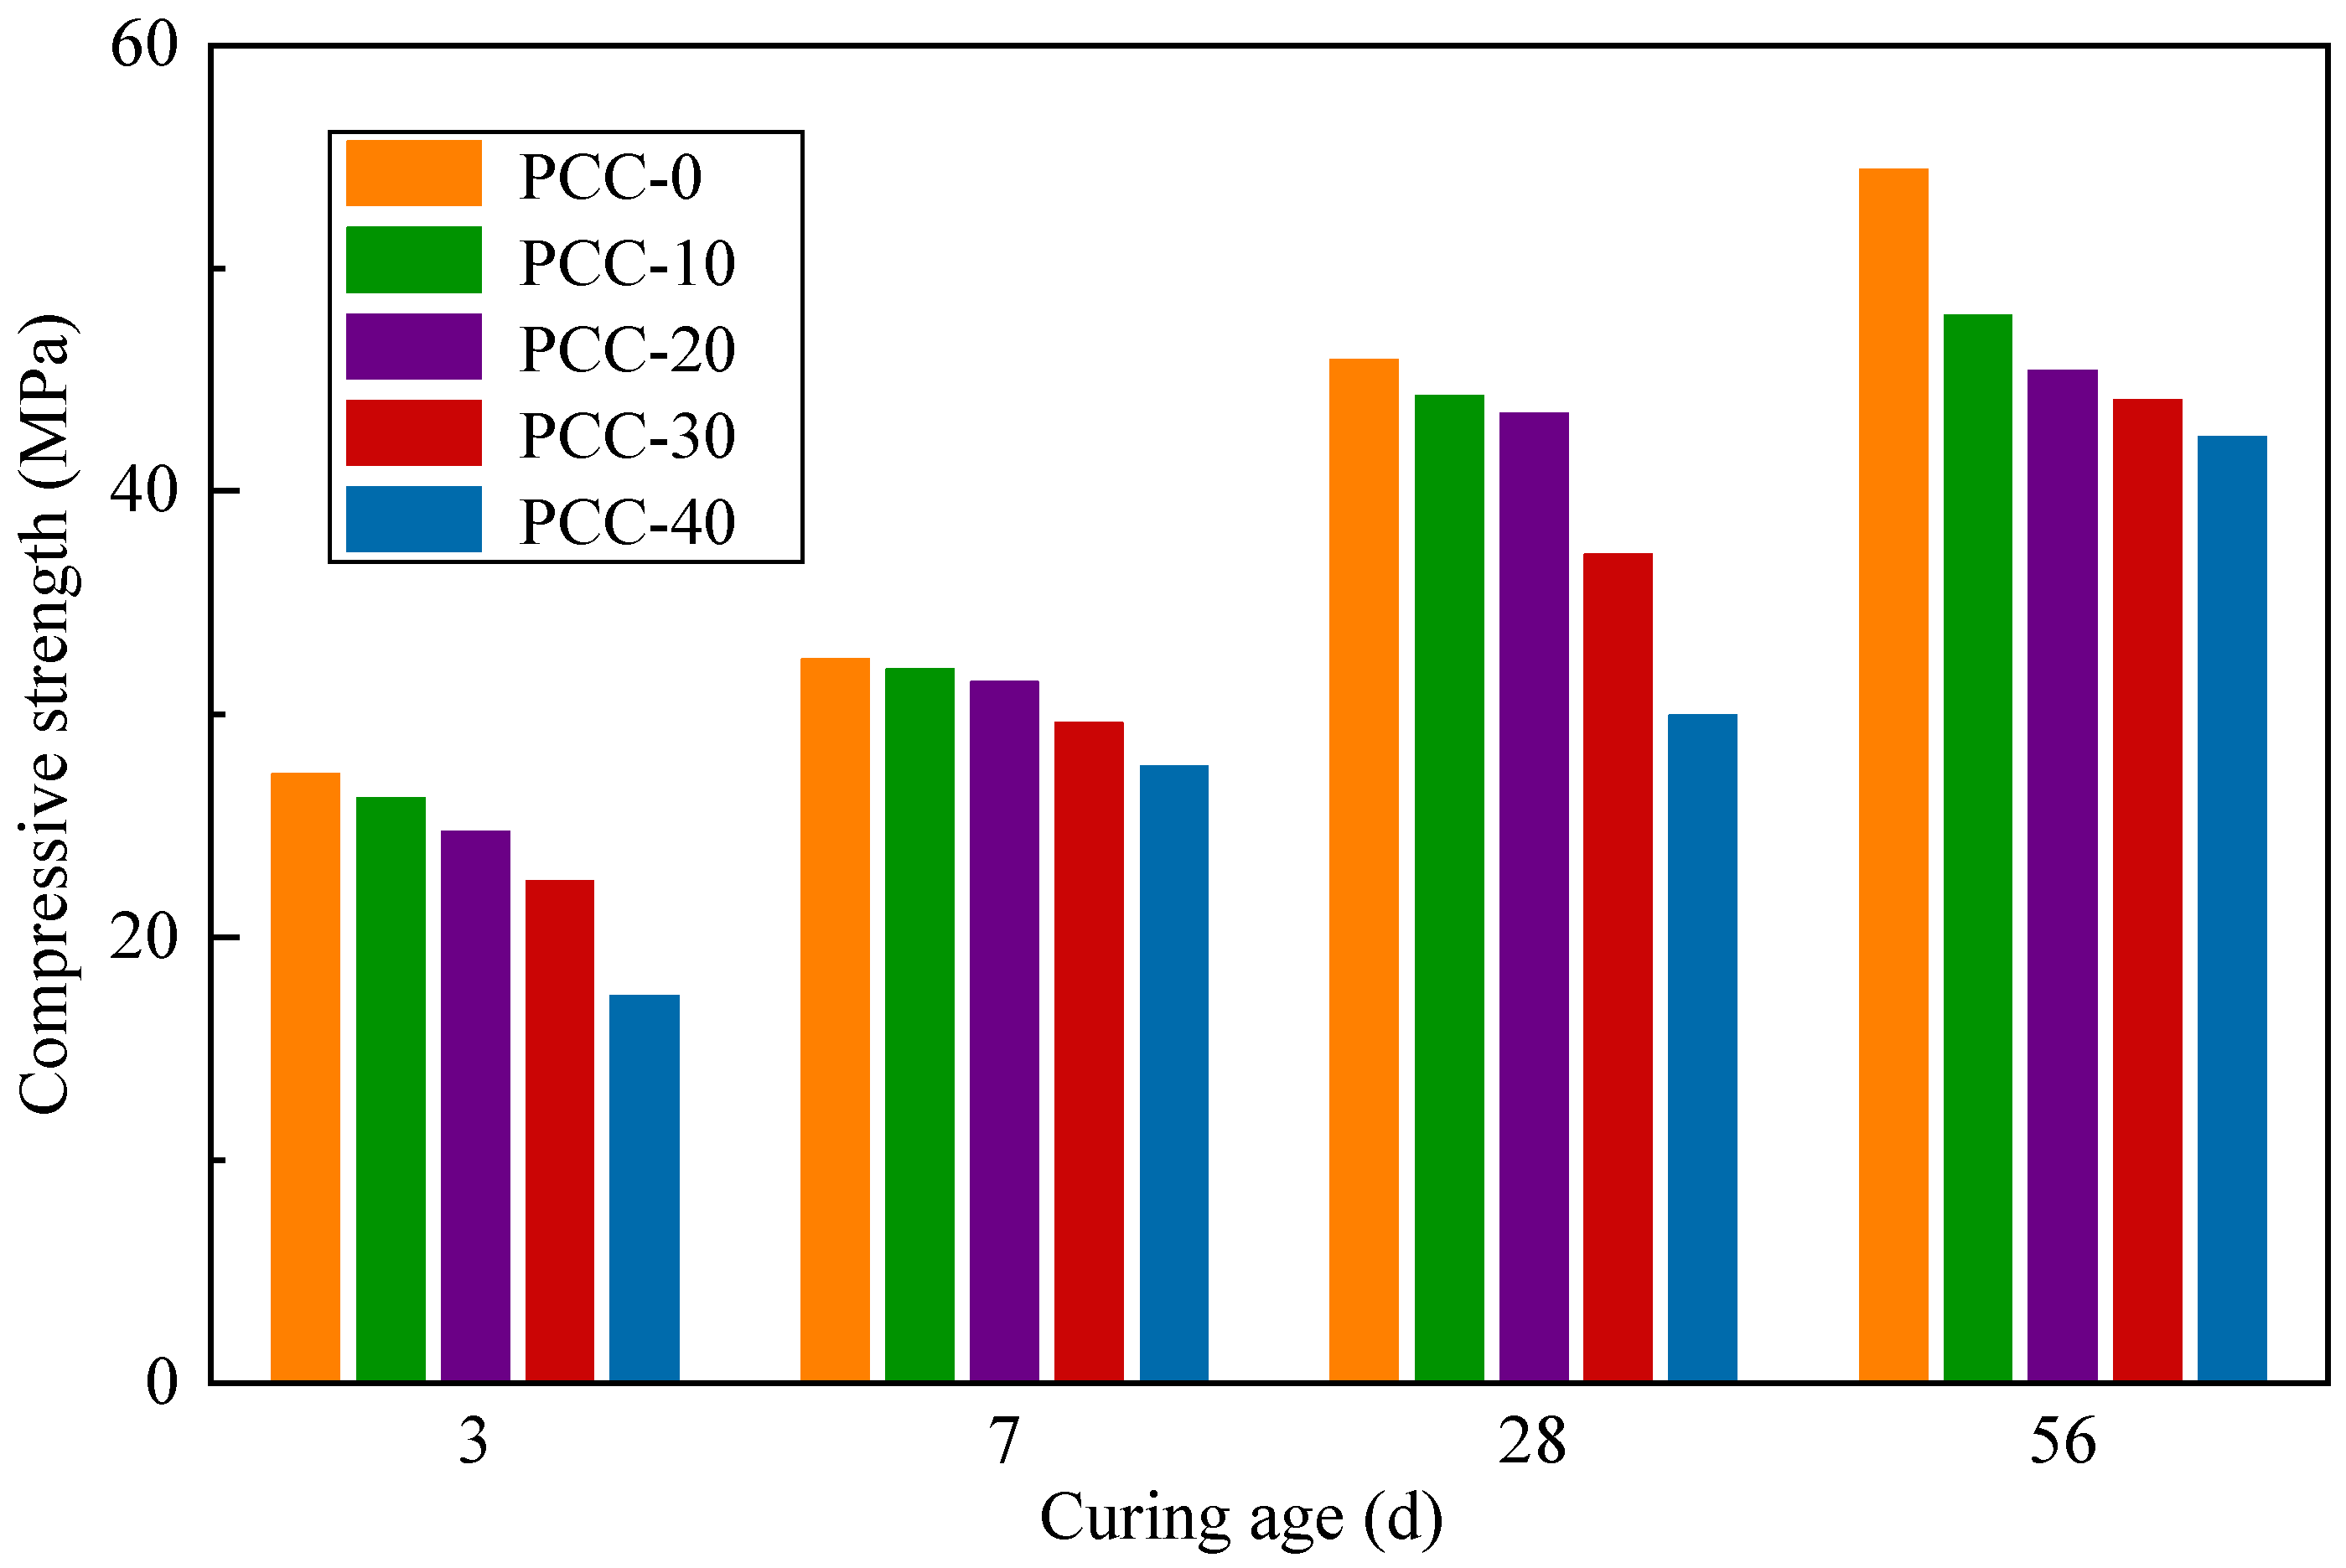
There were five groups of PCC specimens with PCA contents of 0%, 10%, 20%, 30%, and 40% in the experiment. The changes in compressive strength of each group of specimens at 3-, 7-, 28-, and 56-day curing ages are presented in Figure 8.
As depicted in Figure 8, the compressive strength of PCC specimens gradually decreases with the increasing PCA content. Meanwhile, the hydration reaction becomes more complete with the increasing curing age, and the compressive strength of PCC specimens under the same PCA content increases. Calculations are as follows: use the strength-loss rate to represent the degree of decrease in compressive strength, that is, the percentage of decrease in compressive strength of concrete when the PCA content is x% compared to the compressive strength of concrete with 0% of the PCA content and calculate it using Formula (3).
S L P C C x = P P C C 0 P P C C x / P P C C 0 × 100 %
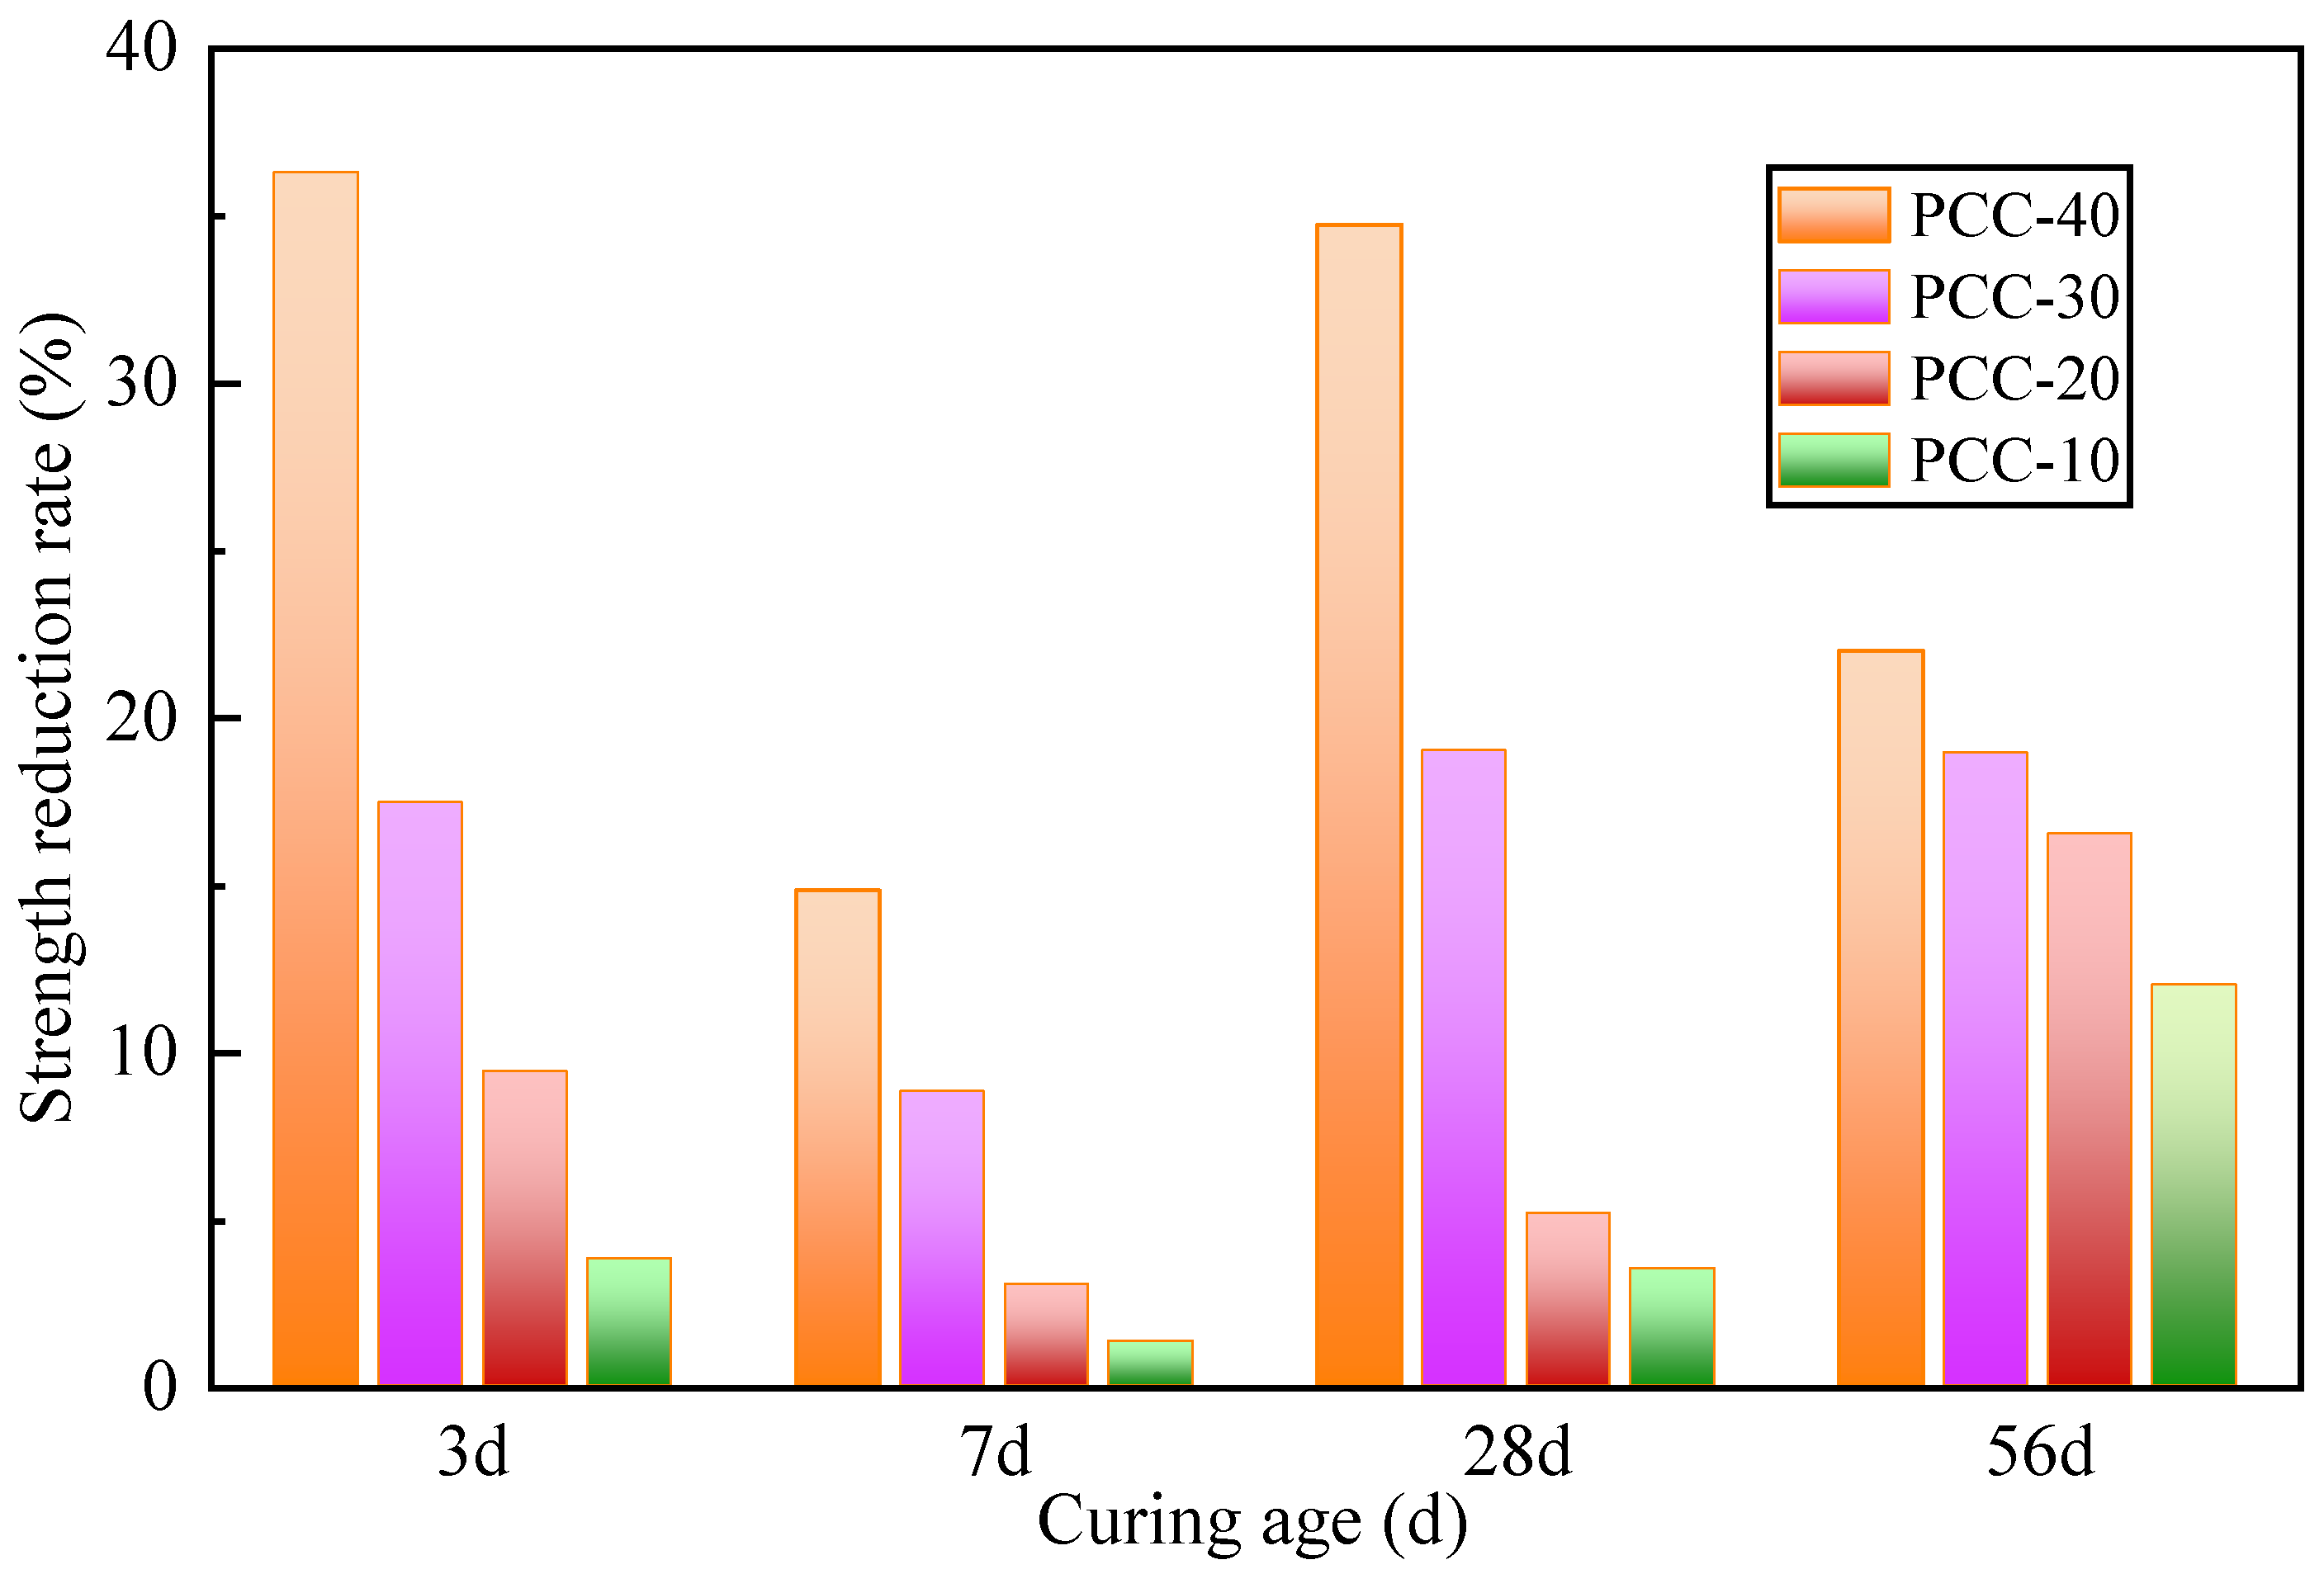
where S L P C C x represents the strength-loss rate of the specimen, %; x represents the percentages of dosage, which are 10, 20, 30, and 40; and P P C C x represents the compressive strength of schemes PCC-10, PCC-20, PCC-30, and PCC-40, respectively, MPa. The strength-loss rate of PCC specimens at different curing ages is shown in Figure 9.
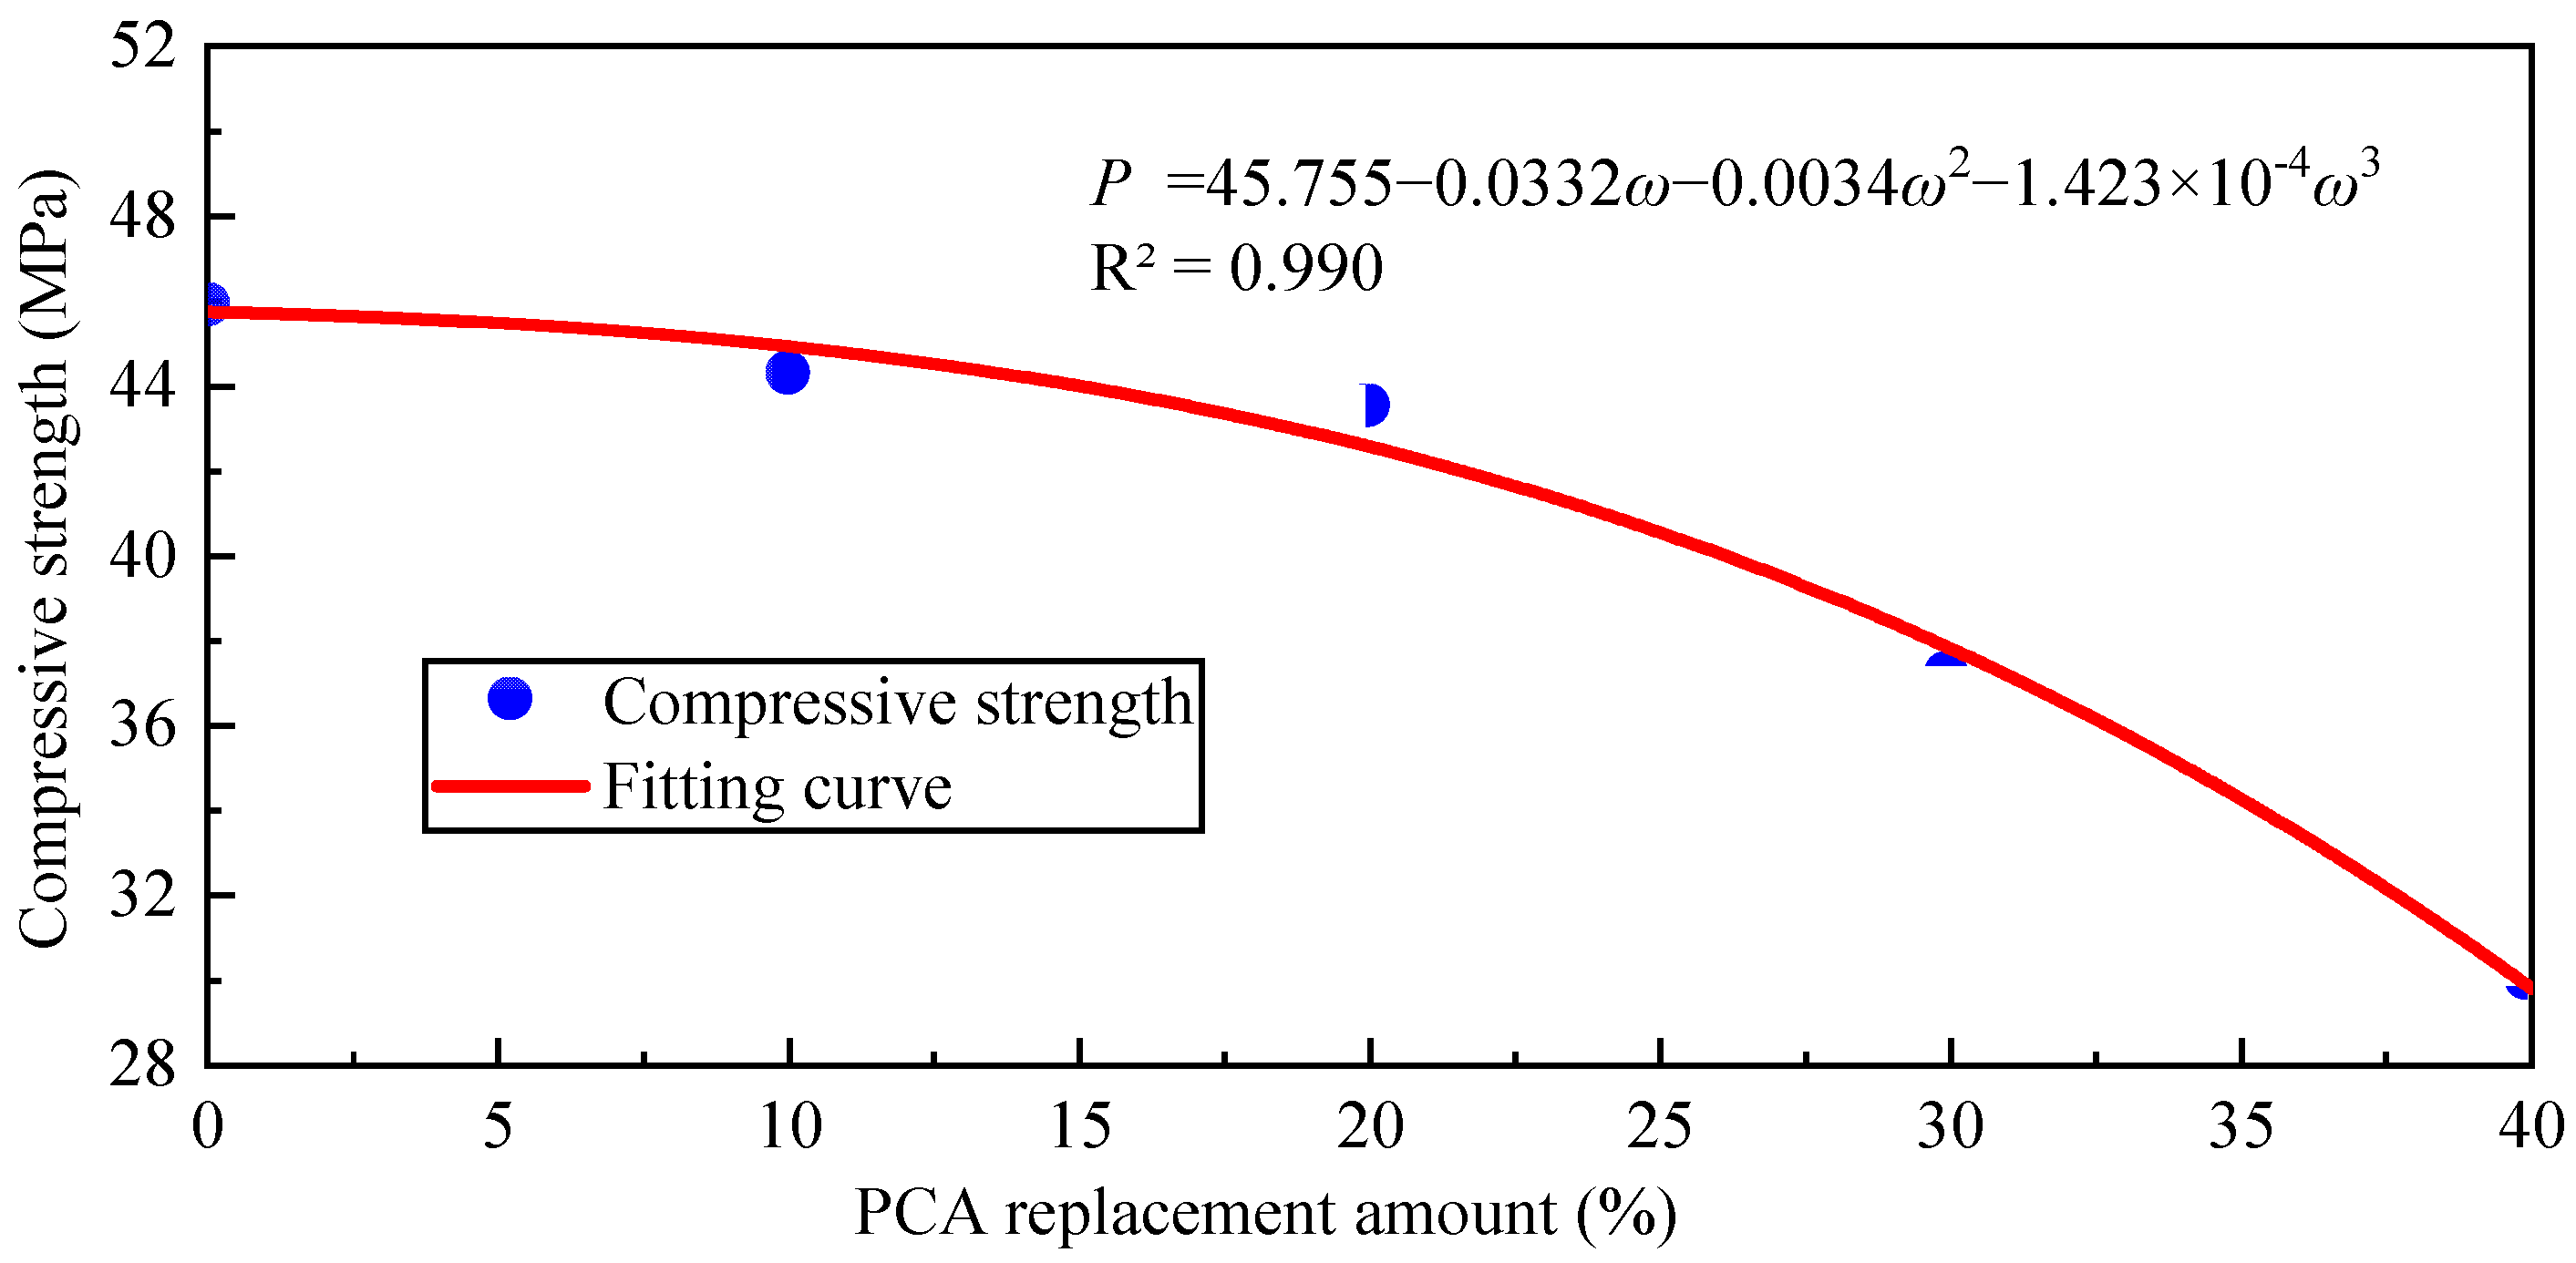
According to Figure 9, the compressive strengths of PCC-10, PCC-20, PCC-30, and PCC-40 at 28 days are 44.30 MPa, 43.53 MPa, 37.18 MPa, and 29.97 MPa, respectively, with corresponding strength-loss rates of 3.52%, 5.19%, 19.02%, and 34.73%, respectively. When the PCA content is low, the compressive strength of the specimen does not decrease significantly, but when the PCA content is larger than 20%, the compressive strength of the specimen significantly decreases. This is consistent with the research results found in references. The fitting curve between the compressive strength of the specimen at 28 days and the PCA replacement amount is shown in Figure 10.
As illustrated in Figure 10, when the PCA replacement amount is low, the compressive strength decreases relatively slowly, but when the replacement amount exceeds 20%, the rate of strength decrease significantly increases. This may be due to the poor physical and chemical compatibility between PCMs and the cement matrix. Without chemical reaction with cement, PCMs are prone to form weak areas at the interface, leading to stress concentration and microcrack propagation. In addition, PCMs undergo volume expansion during the solid–liquid phase-transition process, and repeated thermal expansion and contraction can intensify interfacial delamination, further weakening the interfacial bonding strength [41]. Secondly, the mechanical properties of PCA are much lower than those of standard sand. As the replacement amount of PCA increases, the proportion of low-strength areas in concrete increases, resulting in a significant decrease in the overall compressive strength of the specimen. However, even if the PCA content reaches 40%, the decrease in specimen strength does not exceed 35%, and the strength value is about 30 MPa, which can meet the strength requirements of general building structure concrete.

3.4. Analysis of Ultrasonic Pulse Test

The relationship curve between PCA dosage and ultrasonic velocity is shown in Figure 11.
According to Figure 11, the ultrasonic velocities of PCC-0, PCC-10, PCC-20, PCC-30, and PCC-40 at 56 days of age were 13.51 km/s, 12.55 km/s, 11.42 km/s, 9.63 km/s, and 8.93 km/s, respectively. Among them, the ultrasonic velocities of PCC-10, PCC-20, PCC-30, and PCC-40 decreased by 7.13%, 15.49%, 28.74%, and 33.93%, respectively, compared to PCC-0. As the replacement amount of PCA increases, the density of PCC decreases, and the ultrasonic velocity of PCC significantly decreases, which is consistent with the results of apparent density analysis.
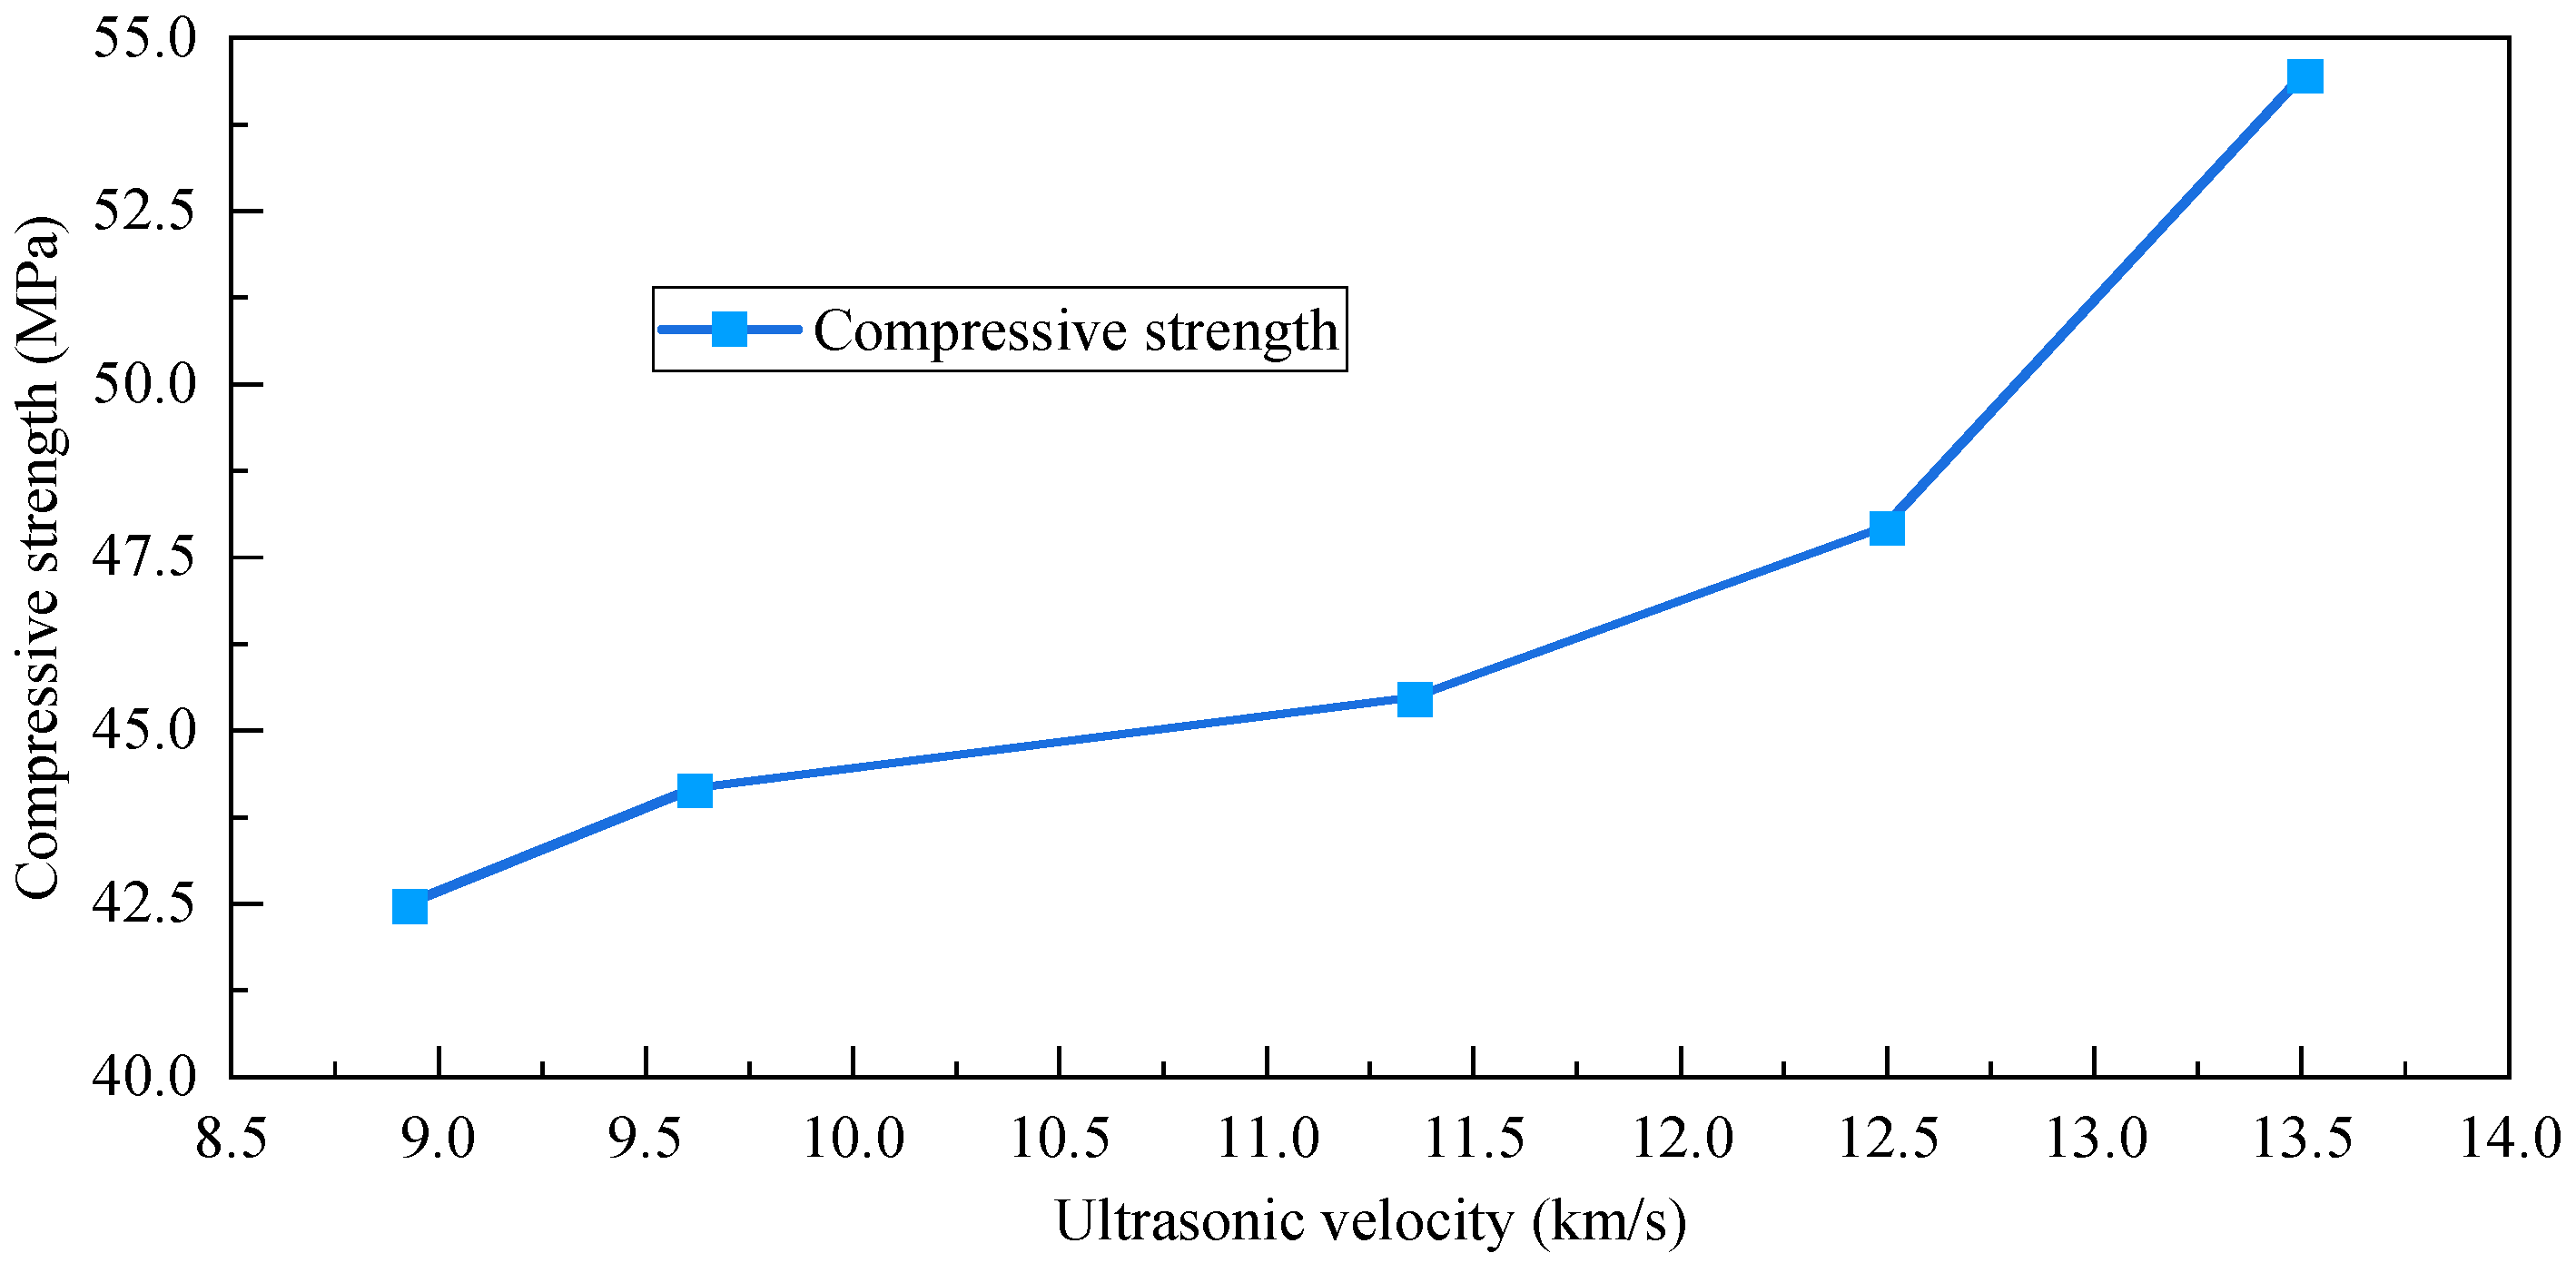
The relationship curve between ultrasonic velocity and 56-day compressive strength is shown in Figure 12.
In the light of Figure 12, the compressive strength increases with the increase of ultrasonic velocity. The compressive strengths corresponding to ultrasonic velocities of 13.51 km/s, 12.55 km/s, 11.42 km/s, 9.63 km/s, and 8.93 km/s are 54.45 MPa, 47.91 MPa, 45.45 MPa, 44.13 MPa, and 42.46 MPa, respectively. As the replacement amount of PCA increases, the porosity inside the PCC specimen increases and the compactness decreases, resulting in a synchronous decrease in ultrasonic velocity and compressive strength.

3.5. Analysis of Microstructure

Scanning electron microscopy (SEM) was used to analyze the microstructure of the fragments of PCC after compressive strength testing, with a focus on studying the microstructure characteristics of samples with PCA contents of 0%, 10%, 20%, and 30% at 3-, 7-, and 56-day curing ages (all magnified 1000 times), as shown in Figure 13, Figure 14, Figure 15 and Figure 16.
It can be seen from Figure 13a that the amount of calcium silicate hydrate (C-S-H) gel [42] is limited and distributed unevenly when the curing age is 3 days, the internal structure of PCC specimen is relatively loose, and there are many unfilled voids. At this time, the hydration reaction of cement has not yet been fully carried out, resulting in insufficient hydration products to fill the pore system and poor compactness of the microstructure. When curing to 7 days (Figure 13b), the number of internal voids of the specimens decreases, and the C-S-H gel in local areas increases significantly, forming a continuous network structure, and meanwhile, needle-like or sheet-like hydration products appear. The accumulation of hydration products effectively fills the pores, but there are still partially closed microcracks in some areas, resulting in poor uniformity of the microstructure of the specimen. After the curing age reaches 56 days (Figure 13c), the C-S-H forms a continuous and dense network structure, which greatly reduces the internal void ratio of the specimen and improves the bond strength between the aggregate and the cement matrix.
According to Figure 14, the interface between PCM particles and the cement matrix is weak when the curing age is 3 days, and the amount of C-S-H is limited and distributed unevenly. Due to the incorporation of PCA occupying a portion of the cementitious material space, early hydration reactions are suppressed, resulting in high porosity and loose structure. This micro defect directly leads to a decrease in the compressive strength of the specimen with increasing PCA content [43]. With the advancement of the hydration process, C-S-H begins to deposit on the surface of PCA, filling pores and cracks, which leads to the improvement of the compressive strength of PCC specimens. After long-term curing, PCM particles are completely wrapped by a continuous C-S-H network, and the interface transition zone basically disappears. Combining Figure 15 and Figure 16, it can be seen that the structure of PCC-0 is relatively dense, with more C-S-H and Ca(OH)2. With increasing PCA content, more PCM is observed, and the cement-hydration products become loose. More pores appear between the cement-hydration products, which is also the main reason for the decrease in concrete strength. Due to the fact that the room temperature is around 22 °C and the melting point of paraffin wax is 17.72 °C, it is in a liquid state, and the electron microscope chamber is in a vacuum environment. The PCM surface has obvious wrinkles, but the wall surface is intact and well wrapped [44].

3.6. Analysis of Thermal Conductivity

When the curing age is 56 days, the fitting curve of the relationship between the thermal conductivity and PCA replacement amount of PCC specimens with different PCA contents is shown in Figure 17.
According to Figure 17, the thermal-conductivity coefficients of the PCC-0, PCC-10, PCC-20, PCC-30, and PCC-40 specimens are 2.48 W/(m·K), 1.97 W/(m·K), 1.66 W/(m·K), 1.65 W/(m·K), and 1.43 W/(m·K), respectively. As the PCA content increases, the thermal-conductivity coefficients generally decrease. The thermal conductivity of PCC-10, PCC-20, PCC-30, and PCC-40 decreased by 20.40%, 32.84%, 33.28%, and 42.45% compared to PCC-0. When the PCA replacement amount is low, the thermal conductivity significantly decreases, and as the PCA replacement amount increases, the decrease in thermal conductivity decreases to some extent. The thermal conductivity of paraffin wax is about 0.2 W/(m·K), much lower than 1.5–2.5 W/(m·K) (traditional aggregates such as sand and gravel). When PCA is used to replace some standard sand, the proportion of low-thermal-conductivity components in the material system increases, and the overall thermal conductivity of the specimen decreases. Existing research results have shown that the addition of PCA can delay heat transfer, while the encapsulation structure can also enhance material durability [45,46,47]. The PCA wraps the PCM around cement as the matrix, forming a cavity-like structure inside the cement shell, which also reduces the thermal conductivity of the specimen. Based on the analyses of apparent density, water-absorption rate, and microstructure data, the porosity inside the concrete increases with the increasing PCA content, which can lead to the obstruction of the heat-transfer paths and a decrease in thermal conductivity [48]. The above factors will lead to significantly lower overall thermal conductivity of the specimen compared to ordinary concrete, which is beneficial for the application of PCC as insulation material in construction projects.

4. Conclusions

This article investigates the effects of different PCA dosages on the apparent density, water absorption, compressive strength, compactness, microstructure, and thermal conductivity of PCC through indoor testing methods. The main conclusions obtained are as follows:
  • The addition of PCA significantly reduced the apparent density, water absorption, compressive strength, and thermal conductivity of PCC. The materials with low thermal conductivity can effectively delay heat transfer, which is beneficial for the insulation of buildings and the relative stability of indoor temperature. When PPC is used as a building insulation filling material, further increasing the content of PCA cannot significantly reduce thermal conductivity, but one can attempt to increase the content of PCM in PCA to reduce thermal conductivity.
  • The addition of PCA increases the porosity inside the concrete, and there are microcracks and loose structures in the interface transition zone, resulting in a decrease in its compactness. The ultrasonic velocity drop reaches 33.93% when the PCA content is 40%, while the decrease in the specimen strength does not exceed 35%, with a strength value of 30 MPa, and if the mix proportion is further optimized, it can meet the strength requirements of general building structure concrete. When the PCA content is high, it has a significant impact on the internal microstructure and physical and mechanical properties of the specimen.
  • Due to the complex composition of PCC and the involvement of multiple factors in its physical and mechanical properties, the study of the influence of PCA content on its physical and mechanical properties by controlling a single variable, as explained in this paper, inevitably has certain limitations. In future research, more attention should be paid to the study of multiple factors on its properties, with a focus on the influence of high PCA content on specimen strength, and improvement measures should be proposed to facilitate the application of this material in engineering structures.

Author Contributions

Conceptualization and methodology were contributed by Z.Q. and Y.T.; Formal analysis, investigation, and data collection were contributed by S.L. (Shixing Liu), L.C., G.C., E.X. and L.Z.; Writing—original draft preparation was contributed by Z.Q. and D.W.; Writing—review and editing was contributed by all the authors; Funding acquisition was contributed by Z.Q.; Resources were contributed by S.L. (Shixing Liu), L.C., G.C., E.X. and L.Z.; Experimental testing was contributed by D.W., Z.L., Y.L., S.L. (Saixuan Lei), J.P., P.Q. and X.Z.; Supervision was contributed by Y.T. and Z.L. All authors have read and agreed to the published version of the manuscript.

Funding

This research was supported by supported by the Nanxun Scholars Program of ZJWEU (RC2024011063) and College Student Innovation and Entrepreneurship Training Program Project of ZJWEU (202311481006).

Data Availability Statement

The original contributions presented in this study are included in the article. Further inquiries can be directed to the corresponding author.

Acknowledgments

The authors thank Zhejiang Design Institute of Water Conservancy and Hydro-Electric Power Co., Ltd. and Wenzhou Water Conservancy Construction Management Center for the testing equipment and testing site provided during the experimental process.

Conflicts of Interest

Authors Shixing Liu and Liangbin Zhang were employed by Zhejiang Hydropower Construction and Installation Co., Ltd. The remaining authors declare that the research was conducted in the absence of any commercial or financial relationships that could be construed as a potential conflict of interest.

References

  1. Arun Kumar, B.; Sangeetha, G.; Srinivas, A.; Awoyera, P.O.; Gobinath, R.; Venkata Ramana, V. Models for predictions of mechanical properties of low-density self-compacting concrete prepared from mineral admixtures and pumice stone. In Soft Computing for Problem Solving; Das, K., Bansal, J., Deep, K., Nagar, A., Pathipooranam, P., Naidu, R., Eds.; Springer: Singapore, 2020; Volume 1057, pp. 677–690. [Google Scholar] [CrossRef]
  2. Khan, P.S.; Reddy, M.R.; Osman, S. An experimental study of the mechanical properties of glass fiber reinforced high strength concrete partially replacing cement with nano silica. Int. J. Eng. Technol. 2018, 5, 4597–4602. [Google Scholar]
  3. Venkatreddy, P.; Krishna, A.S.; Yadav, G.S. Experimental investigation on RCC by using multiple admixtures. Int. J. Eng. Technol. 2018, 7, 14–16. [Google Scholar] [CrossRef]
  4. Awoyera, P.; Gobinath, R.; Haripriya, S.; Kulandaisami, P. New light weight mortar for structural application: Assessment of porosity, strength and morphology properties. In Proceedings of the 1st International Conference on Emerging Trends in Engineering (ICETE 2019), Hyderabad, India, 22–23 March 2019; Springer: Cham, Switzerland, 2020. [Google Scholar] [CrossRef]
  5. China Building Energy Efficiency Association. China research report on carbon emissions in urban and rural construction fields (2024 Edition). J. Build. Energy Effic. (Chin. Engl.) 2025, 53, 154. (In Chinese) [Google Scholar]
  6. Xiao, G. Research on Intelligent Management Platform for Energy Enterprises Based on Big Data Technology. J. Phys. Conf. Ser. 2020, 1549, 042039. [Google Scholar] [CrossRef]
  7. Jeon, J.; Lee, J.; Seo, J.; Jeong, S.G.; Kim, S. Application of PCM Thermal Energy Storage System to Reduce Building Energy Consumption. J. Therm. Anal. 2013, 111, 279–288. [Google Scholar] [CrossRef]
  8. Drissi, S.; Ling, T.; Mo, H.K.; Eddhahak, A. A review of microencapsulated and composite phase change materials: Alteration of strength and thermal properties of cement-based materials. Renew. Sustain. Energy Rev. 2019, 110, 467–484. [Google Scholar] [CrossRef]
  9. Hall, C.; Hoff, D.W. Water Transport in Brick, Stone and Concrete; CRC Press: Boca Raton, FL, USA, 2021. [Google Scholar]
  10. Cervero, R.; Sullivan, C. Green TODs: Marrying Transit-Oriented Development and Green Urbanism. Int. J. Sustain. Dev. World Ecol. 2011, 18, 210–218. [Google Scholar] [CrossRef]
  11. Joulin, A.; Zalewski, L.; Lassue, S.; Naji, H. Experimental investigation of thermal characteristics of a mortar with or without a micro-encapsulated phase change material. Appl. Therm. Eng. 2014, 66, 171–180. [Google Scholar] [CrossRef]
  12. Karaipekli, A.; Sarı, A.; Biçer, A. Thermal regulating performance of gypsum/(C18–C24) composite phase change material (CPCM) for building energy storage applications. Appl. Therm. Eng. 2016, 107, 55–62. [Google Scholar] [CrossRef]
  13. Zhang, Y.; Ding, J.; Wang, X.; Yang, R.; Lin, K. Influence of additives on thermal conductivity of shape-stabilized phase change material. Sol. Energy Mater. Sol. Cells 2006, 90, 1692–1702. [Google Scholar] [CrossRef]
  14. Cabeza, L.; Castell, A.; Barreneche, C.; De Gracia, A.; Fernández, A.I. Materials used as PCM in thermal energy storage in buildings: A review. Renew. Sustain. Energy Rev. 2011, 15, 1675–1695. [Google Scholar] [CrossRef]
  15. Ling, T.; Poon, C. Use of phase change materials for thermal energy storage in concrete: An overview. Constr. Build. Mater. 2013, 46, 55–62. [Google Scholar] [CrossRef]
  16. Kousksou, T.; Arid, A.; Jamil, A.; Zeraouli, Y. Thermal behavior of building material containing microencapsulated PCM. Thermochim. Acta 2012, 550, 42–47. [Google Scholar] [CrossRef]
  17. Li, M. A nano-graphite/paraffin phase change material with high thermal conductivity. Appl. Energy 2013, 106, 25–30. [Google Scholar] [CrossRef]
  18. Xiao, X.; Zhang, P.; Li, M. Preparation and thermal characterization of paraffin/metal foam composite phase change material. Appl. Energy 2013, 112, 1357–1366. [Google Scholar] [CrossRef]
  19. Xu, B.; Li, Z. Paraffin/diatomite/multi-wall carbon nanotubes composite phase change material tailor-made for thermal energy storage cement-based composites. Energy 2014, 72, 371–380. [Google Scholar] [CrossRef]
  20. Xu, B.; Ma, H.; Lu, Z.; Li, Z. Paraffin/expanded vermiculite composite phase change material as aggregate for developing lightweight thermal energy storage cement-based composites. Appl. Energy 2015, 160, 358–367. [Google Scholar] [CrossRef]
  21. Qiao, J.; Song, Z. Preparation and performance study of concrete with low phase change material admixture. Concrete 2023, 11, 20–28. (In Chinese) [Google Scholar]
  22. Huang, W.; Zhang, J.; Wang, J.; Zheng, Y.; Ma, J.; Ding, F. Performance analysis of paraffin microcapsules and phase change concrete based on microporous cenospheres. Constr. Build. Mater. 2023, 409, 134030. [Google Scholar] [CrossRef]
  23. Wang, X.; Liu, S.; Lei, W.; Zhang, C.Y. Thermal properties and infrared stealth performance of paraffin phase change microcapsules. Mater. Rep. 2022, 36, 239–243. (In Chinese) [Google Scholar] [CrossRef]
  24. Jia, Z.; Cunha, S.; Aguiar, J.; Guo, P. The effect of phase change materials on the physical and mechanical properties of concrete made with recycled aggregate. Buildings 2023, 13, 2601. [Google Scholar] [CrossRef]
  25. Chen, R.; Shangguan, H.; Zhang, W.; Yang, K. Finite element method simulation study on the temperature field of mass concrete with phase change material. Buildings 2024, 14, 2755. [Google Scholar] [CrossRef]
  26. Erdene, B.E.P.; Pareek, S.; Koenders, E.; Mankel, C.; Löher, M.; Xiao, P. Evaluation of the thermal performance of fly ash foam concrete containing phase change materials (PCMs). Buildings 2023, 13, 2481. [Google Scholar] [CrossRef]
  27. Zhang, H.; Xing, F.; Cui, H.; Chen, D.Z.; Ouyang, X.; Xu, S.Z.; Wang, J.X.; Huang, Y.T.; Zuo, J.D.; Tang, J.N. A novel phase-change cement composite for thermal energy storage: Fabrication, thermal and mechanical properties. Appl. Energy 2016, 170, 130–139. [Google Scholar] [CrossRef]
  28. Cunha, S.; Lima, M.; Aguiar, B.J. Influence of adding phase change materials on the physical and mechanical properties of cement mortars. Constr. Build. Mater. 2016, 127, 1–10. [Google Scholar] [CrossRef]
  29. Cabeza, L.F.; Castellón, C.; Nogués, M.; Medrano, M.; Leppers, R.; Zubillaga, O. Use of microencapsulated PCM in concrete walls for energy savings. Energy Build. 2006, 39, 113–119. [Google Scholar] [CrossRef]
  30. Sun, D.; Wang, L. Utilization of paraffin/expanded perlite materials to improve mechanical and thermal properties of cement mortar. Constr. Build. Mater. 2015, 101, 791–796. [Google Scholar] [CrossRef]
  31. Zhang, X.; Dong, M.; Jiang, Z.; Li, S. Preparation and physical performance of structure-function integrated phase change materials. Concrete 2025, 1, 104–108. (In Chinese) [Google Scholar] [CrossRef]
  32. Qiu, B.; Zhang, N. Preparation, properties and structure of a phase change aggregate based on expanded perlite. Refrig. Air Cond. 2023, 37, 650–655. (In Chinese) [Google Scholar]
  33. Zhu, L. Experimental Study on the Mechanical-Thermal Properties of Light-Weight Aggregate Concrete Mixed with Microcapsule Phase Change Materials and Theoretical Model Construction. Master’s Thesis, Xi’an University of Technology, Xi’an, China, 2022. (In Chinese) [Google Scholar] [CrossRef]
  34. Tian, Y.; Qin, Z.; Lin, Z.; Shen, P.; Chen, L.; Chen, G.; Zhang, L.; Gao, J.; Liu, S.; Yang, N.; et al. Study on the physical mechanical properties and freeze-thaw resistance of energy storage concrete with artificial phase change aggregate. J. Build. Eng. 2025, 99, 111506. [Google Scholar] [CrossRef]
  35. Abdul, A.S.G.; Shima, S.J.; Zainal, S.A. Waste Materials as the Potential Phase Change Material Substitute in Thermal Energy Storage System: A Review. Chem. Eng. Commun. 2020, 207, 687–707. [Google Scholar] [CrossRef]
  36. GB/T 50081-2019; Ministry of Housing and Urban-Rural Development of the People’s Republic of China. Standard for Test Methods of Concrete Physical and Mechanical Properties. China Architecture & Building Press: Beijing, China, 2019. (In Chinese)
  37. Adesina, A.; Awoyera, P.; Sivakrishna, A.; Kumar, K.R.; Gobinath, R. Phase change materials in concrete: An overview of properties. Mater. Today Proc. 2020, 27, 391–395. [Google Scholar] [CrossRef]
  38. Jiang, C.; Ye, J.; Chen, Y.; Yang, Z.; Li, F. Study on properties of new phase change energy storage foam concrete thermal insulation partition board materials for buildings. New Build. Mater. 2024, 51, 112–117. (In Chinese) [Google Scholar]
  39. Wang, W.; Ma, Q.; Bai, M.; Ma, Y.; Wu, Z. Experimental study and analysis on the compressive and tensile strength and thermal conductivity of phase change concrete with activated carbon energy storage aggregates. Sci. Technol. Eng. 2016, 16, 95–99. (In Chinese) [Google Scholar]
  40. Chengdu Hongji Building Materials Co., Ltd. C30 Phase Change Energy Storage Concrete Using High-Titanium Slag as Phase Change Carrier and Preparation Method Thereof. Chinese Patent CN201811588816.5, 26 April 2019. (In Chinese). [Google Scholar]
  41. Li, J. Research status of phase change energy storage concrete. Sichuan Build. Mater. 2017, 43, 25–27. (In Chinese) [Google Scholar] [CrossRef]
  42. Taylor, H.F.W. Cement Chemistry, 2nd ed.; Thomas Telford Publishing: London, UK, 1997. [Google Scholar] [CrossRef]
  43. Xia, M.; Qin, Z.; Wang, Z.; Li, D.; Ji, A.; He, J.; Lv, X.; Li, C. Study on thermophysical properties of fiber-reinforced subgrade soil in seasonal frozen soil region. Water Power 2023, 49, 106–111. (In Chinese) [Google Scholar]
  44. Peng, Y. Preparation and Thermodynamic Performance Analysis of Cement-Based Phase Change Microcapsule Energy Storage Concrete. Master’s Thesis, Dalian Ocean University, Dalian, China, 2024. (In Chinese) [Google Scholar] [CrossRef]
  45. Zhou, J.; Nie, Z.; Guo, Z.; Yang, J.; Zheng, Z. Review on preparation and properties of phase change concrete. J. Jiangsu Univ. (Nat. Sci. Ed.) 2020, 41, 588–595. (In Chinese) [Google Scholar] [CrossRef]
  46. China Railway Sixth Bureau Group Hohhot Railway Construction Co., Ltd. Temperature-Controlled Phase Change Aggregate and Its Preparation Method and Application. Chinese Patent CN202410035305.X, 10 May 2024. (In Chinese).
  47. Xie, Z.; Kou, Y.; Shi, Q.; Tian, Y. Synthesis and temperature control performance of silica gel waste composite phase change materials. Chem. J. Chin. Univ. 2025, 46, 37–45. (In Chinese) [Google Scholar] [CrossRef]
  48. Liao, Y. Study on Fire Resistance Performance of Phase Change Energy Storage Concrete Walls. Master’s Thesis, Shanghai Normal University, Shanghai, China, 2023. (In Chinese) [Google Scholar] [CrossRef]
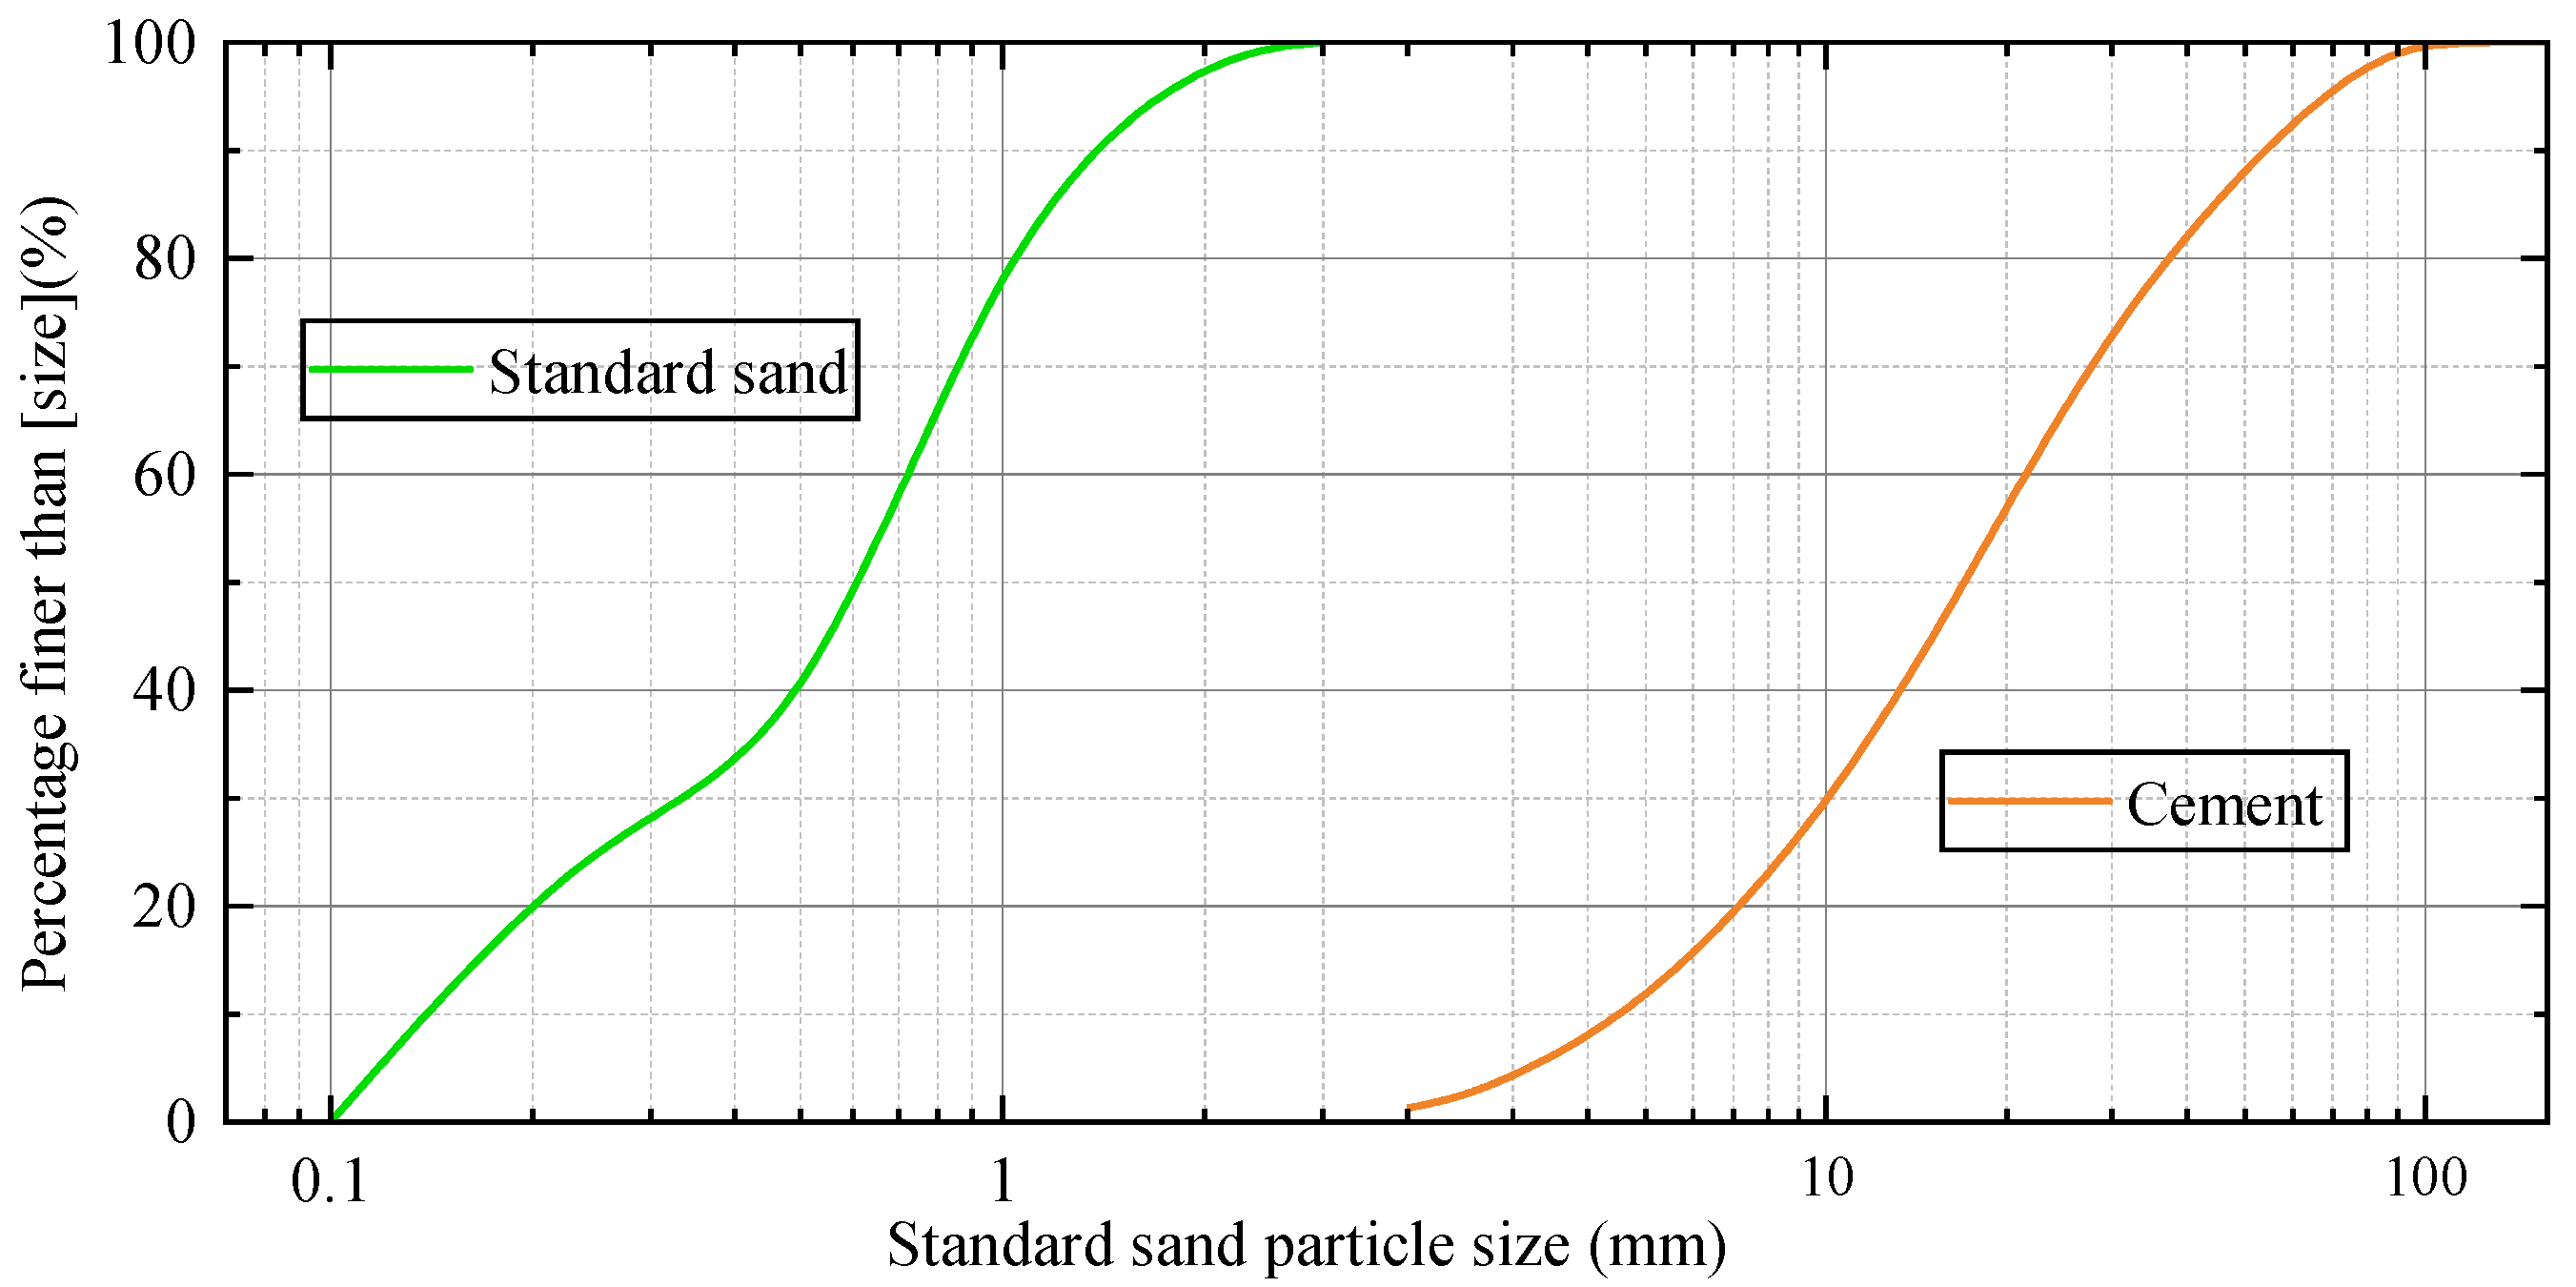
Figure 1. Distribution curves of cement particles and standard sand particle sizes.
Buildings 15 01907 g001
Figure 2. SEM microstructure of paraffin microcapsules.
Buildings 15 01907 g002
Figure 3. DSC curves of paraffin microcapsules.
Buildings 15 01907 g003
Figure 4. Preparation of PCA specimens.
Buildings 15 01907 g004
Figure 5. Preparation of PCC specimens.
Buildings 15 01907 g005
Figure 6. Relationship between apparent density of PCC and PCA replacement amount.
Buildings 15 01907 g006
Figure 7. Bar chart and water-absorption curve of PCC weight over time.
Buildings 15 01907 g007
Figure 8. Compressive strength of PCC specimens at different curing ages.
Buildings 15 01907 g008
Figure 9. Strength-loss rate of PCC specimens at different curing ages.
Buildings 15 01907 g009
Figure 10. Relationship curve between compressive strength of specimen at 28 days and PCA replacement amount.
Buildings 15 01907 g010
Figure 11. Relationship between PCA content and ultrasonic velocity.
Buildings 15 01907 g011
Figure 12. Relationship between ultrasonic velocity and 56-day compressive strength.
Buildings 15 01907 g012
Figure 13. Microstructure of PCC-0 at curing ages of (a) 3 days, (b) 7 days, and (c) 56 days.
Buildings 15 01907 g013
Figure 14. Microstructure of PCC-10 at curing ages of (a) 3 days, (b) 7 days, and (c) 56 days.
Buildings 15 01907 g014
Figure 15. Microstructure of PCC-20 at curing ages of (a) 3 days, (b) 7 days, and (c) 56 days.
Buildings 15 01907 g015
Figure 16. Microstructure of PCC-30 at curing ages of (a) 3 days, (b) 7 days, and (c) 56 days.
Buildings 15 01907 g016
Figure 17. Relationship curve between thermal conductivity of PCC specimen and PCA replacement amount.
Buildings 15 01907 g017
Table 1. Main chemical composition and content of ordinary Portland cement P·O 42.5 (wt.%).
OxideNa2OMgOAl2O3SiO2K2OCaOFe2O3CO2Other
Mass percentage0.712.424.9923.170.8241.522.8822.570.92
Table 2. Mix proportion of ordinary Portland cement PCC.
Experimental Group NumberCement/gStandard Sand/gPCA/gWater/gWater-Reducing Agent/gWater-Cement Ratio
PCC-0 *892.52682.760.00338.844.620.38
PCC-10892.52414.48141.88338.844.620.38
PCC-20892.52146.21283.74338.844.620.38
PCC-30892.51877.93425.64338.844.620.38
PCC-40892.51609.66567.52338.844.620.38
Note: * The number after PCC represents the percentage of replaced sand. For example, PCC-10 refers to a PCC specimen prepared by replacing 10% of standard sand with PCA by volume.
Disclaimer/Publisher’s Note: The statements, opinions and data contained in all publications are solely those of the individual author(s) and contributor(s) and not of MDPI and/or the editor(s). MDPI and/or the editor(s) disclaim responsibility for any injury to people or property resulting from any ideas, methods, instructions or products referred to in the content.