Abstract
Highway tunnel construction in mountainous areas of China has been developing rapidly. The influence of drilling and blasting on the existing tunnel structure has become a key factor affecting the safety and stability of tunnel construction. The double-arch tunnel has unique structural characteristics. The propagation characteristics of blasting vibrations and the resulting stress responses exhibit a certain level of complexity. There is little research on the influence of single-line blasting excavation of double-arch tunnel on the other line tunnel. This paper analyzes the blasting vibration of a double-arch tunnel by ANSYS/LS-DYNA. The propagation law of blasting vibration velocity and stress distribution law of blasting vibration in different sections of the tunnel is revealed. At the same time, the relationship between the peak particle velocity (PPV) and tensile stress is established, and the threshold vibration velocity is proposed. It provides a scientific basis for tunnel design and construction. The propagation of blasting vibration in the adjacent roadway is affected by the middle pilot tunnel. The peak vibration velocity of different parts decreases with the increase in distance. The monitoring of vibration velocity and stress in section A of the right line of the adjacent tunnel should be strengthened, especially in the tunnel vault, blast-facing side wall, and arch foot. The difference in vibration strength across different tunnel parts provides a basis for optimizing the structure. It helps strengthen the parts susceptible to vibration during the design stage of the multi-arch tunnel, improving the tunnel’s safety and stability.
1. Introduction
China is a vast country, two-thirds of which is mountainous. The construction of mountain road tunnels plays a key role in the development of our country’s traffic and economy. In recent years, China’s transportation system has developed rapidly [1,2]. And highway tunnels have increased year by year. Tunnels in mountainous areas are mainly double-arch tunnels and small clear-distance tunnels, due to the limitation of tunnel alignment [3]. The drilling-and-blasting method is a common excavation method for mountain tunnels, with the advantages of simple operation and high propulsion efficiency [4,5]. The vibration wave-generated by blasting-activity acts on the surrounding environment or structure, resulting in a vibration response. The vibration response has an impact on the surrounding environment [6]. Vibration response includes vibration speed, frequency, and so on. The peak particle velocity (PPV) is one of the main parameters to measure the effect of blasting vibration on the surrounding environment. The double-arch tunnel consists of two parallel single-hole tunnels connected by a middle partition wall [7]. The stress wave produced by blasting excavation of a single tunnel may lead to cracks and deformation of the lining of the existing tunnel. By analyzing the PPV, we can evaluate whether the vibration intensity exceeds the threshold required by the design.
ANSYS/LS-DYNA can perform display dynamics analysis. It has the Lagrange algorithm, Arbitrary Lagrangian–Eulerian (ALE) algorithm, and Euler algorithm. The ALE algorithm for fluid–structure coupling analysis can solve various complex engineering blasting problems [8,9,10]. Zhang et al. [11] used the ALE multi-material fluid–structure coupling algorithm to conduct simulation research. The nonlinear coupling of explosives, air, concrete, and soil is realized by modifying keywords. The vibration velocity and stress distribution of the two tunnels are studied by controlling the difference in tunnel distance and height. With the increase in tunnel distance, both vibration velocity and stress decrease. When the tunnel elevation difference increases, the reflected shock wave is enhanced, resulting in the abrupt change in vibration velocity and displacement at some monitoring points. Mohammad Vaghefi et al. [12] used LS-DYNA to analyze the dynamic response of explosion to the concrete bridge deck. The study found that when the amount of explosives increased by 39%, the deck damage increased by 100%. Behnam Mobaraki et al. [13] used the ALE algorithm to study the influence of protective barriers on the dynamic response of underground structures. ALE units were used for explosives, air, and soil, while Lagrange units were used for underground structures and barriers. It is concluded that reducing the distance between the protective barrier and the explosion source or increasing the width of the barrier can reduce the peak pressure of the subway. Liang et al. [14] carried out laboratory tests, field monitoring, and numerical simulation. On this basis, the effect of explosion excitation on the existing railway tunnel in Xinjiang is studied. To investigate the impact of blasting in adjacent tunnels on existing tunnels, Zhao et al. [15] combined field monitoring and numerical simulation to analyze the velocity and frequency characteristics of blast vibrations. The distribution of axial and radial vibration velocities under blasting was studied for existing tunnels. Additionally, the variation in power spectral density was analyzed. The findings provide a reference for similar engineering projects.
Besides ANSYS/LS-DYNA, many experts have also used other finite element software to study the impact of blasting in adjacent tunnels on the vibration of existing structures [16,17]. For example, Duan et al. [18] studied the impact of tunnel blasting construction on adjacent high-pressure towers based on Midas-GTS and field tests. The PPV and foundation displacement of the tower at different distances from the vibration source were investigated. The PPV and stress state of the different height measuring points of the high tower were also investigated. Finally, different vibration responses and corresponding protection measures were obtained when the distance between the vibration source and the tower was 0–30 m. Kasilingam, S. [19] used ABAQUS to model tunnel blast loads. He simulated different materials and soil models to predict the vibration, displacement, and stress distribution of the tunnel. The study found that square tunnels are more vulnerable to attacks, and that lining thickness and burial depth are crucial for blast resistance.
Overall, the vast expanse of China’s territory and the significant proportion of mountainous areas make the construction of highway tunnels in mountainous regions a key factor in promoting transportation and economic development. However, during the construction of such tunnels, especially when using the drilling and blasting method, the impact of vibrations on existing tunnels has become an urgent issue that needs to be addressed. Domestic and foreign scholars have carried out a series of studies on the blasting of nearby buildings, towers, or tunnels [20,21,22,23,24]. However, there is little research on the vibration response of the back hole blasting to the lining of the first hole. By comparing numerical simulations with field data, the PPV and stress distribution of a double-arch tunnel caused by blasting in the back hole are revealed. A series of dangerous positions are obtained. The relationship between PPV and tensile stress is established, and a threshold vibration velocity is proposed. It provides a new theoretical basis and practical guidance for tunnel blasting design and safety monitoring and has important engineering application value.
2. On-Site Test
2.1. Project Overview
Huangjiabu Tunnel is located in the central and western regions of Shaoxing City, Zhejiang Province, China. It is the TJ03 section of the Keqiao to Zhuji Expressway project. It has a total length of 205 m and is designed for six lanes of traffic in both directions. The tunnel is located in a hilly area with a maximum buried depth of about 57 m and belongs to a mountain tunnel. The overall hydrogeological conditions are simple, with scarce water resources. The tunnel portal adopts a portal wall structure. The surrounding rock is composed of IV and V grades. The overall integrity of the surrounding rock is relatively good.
No blasting is performed within 5 m of the tunnel entrance and exit, where mechanical excavation is used. Blasting excavation is carried out in a one-way direction at the tunnel’s inlet and outlet. The middle pilot tunnel is constructed using the full-section method. Excavation of the middle pilot tunnel begins at the small-radius entrance, while the middle partition wall is constructed from the large-radius exit towards the entrance. The surrounding rock of Grade IV and Grade V of the main tunnel is constructed by a three-stage excavation method. Excavation begins from the small radius side, with the right tunnel being excavated first. After the safety distance is achieved, excavation of the left tunnel side begins
2.2. Site Monitoring
2.2.1. Blasting Parameters
The slot holes are excavated using inclined drilling, while the surrounding and auxiliary holes are drilled vertically. The “explosive amount per cycle” is calculated based on Class IV surrounding rock. The spacing between slot holes is 60 mm, with a row spacing of 650 mm. The spacing between auxiliary holes is 80 mm, and the spacing between surrounding holes is 50 mm. The explosive is the No. 2 rock emulsion explosive. The blasting parameters for the upper step are shown in Table 1, and the borehole layout is shown in Figure 1.

Table 1.
Blasting parameters.
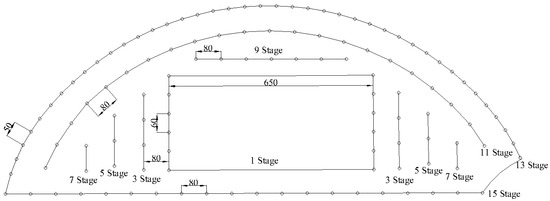
Figure 1.
Borehole layout.
2.2.2. Blasting Monitoring
A blasting vibrometer is composed of a velocity sensor and a vibrometer. Together, they determine the accuracy and reliability of the measured signals. Therefore, selecting the appropriate velocity sensor and vibrometer is key to determining the effectiveness of the blasting vibration detection system. From the perspectives of technology, reliability, and economy, the NuBox-8016 blasting vibrometer was selected, as shown in Figure 2. This choice was made after comparing various blasting vibration measurement instruments.

Figure 2.
The Blast-UM blasting vibrometer.
The velocity sensor is affected by the blasting source and generates an electrical signal related to the vibration velocity. The vibrometer amplifies, filters, and digitizes the electric signal to extract the vibration velocity and other information. The data are studied by a computer for blasting vibration. The specific process is shown in Figure 3.
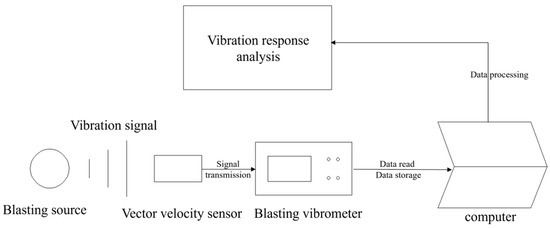
Figure 3.
Flowchart.
Based on the characteristics of seismic wave propagation generated by blasting, under the same conditions, the closer the monitoring point is to the blast site, the greater the vibration impact. The arch foot is near the narrow position. It is convenient to install the monitoring device of blasting vibrometer here, so this is selected as the monitoring point. During the blasting construction of the left tunnel in this project, a vibration monitoring point is arranged on the blast-facing side monitoring the tunnel’s right hole. Another monitoring point is placed on the blasting opposite side monitoring of the right tunnel, both on the same section, for vibration monitoring. The layout of monitoring points is shown in Figure 4.
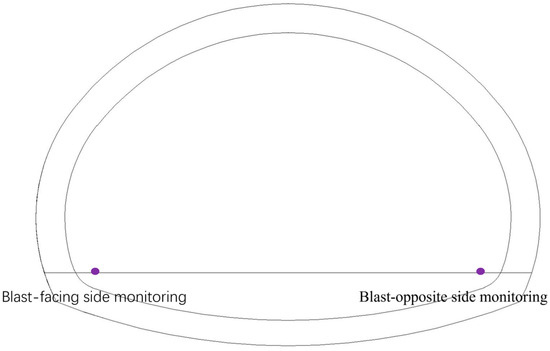
Figure 4.
The layout of the monitoring points.
2.3. Monitoring Results and Analysis
For the blasting construction on the upper step of the left hole of a tunnel, the layout of the blasting vibrometer is shown in Figure 5. The blasting vibration monitoring waveforms for the two monitoring points are shown in Figure 6. Due to the construction site being located in a mountainous area with limited access to transportation, the data obtained from monitoring are insufficient. The specific data for this blasting monitoring are presented in Table 2. The graph of PPV and frequency is shown in Figure 7.
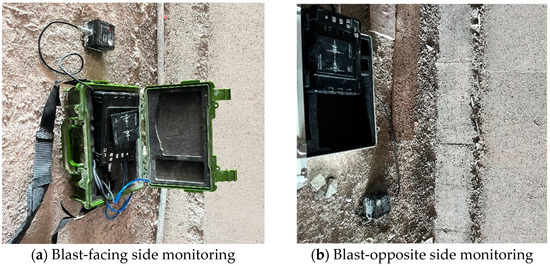
Figure 5.
On-site monitoring equipment.
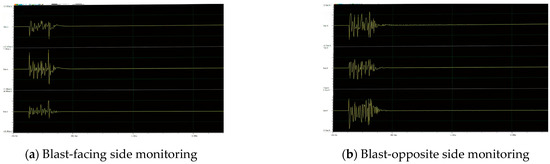
Figure 6.
Vibration diagram.
Table 2.
Monitoring data.
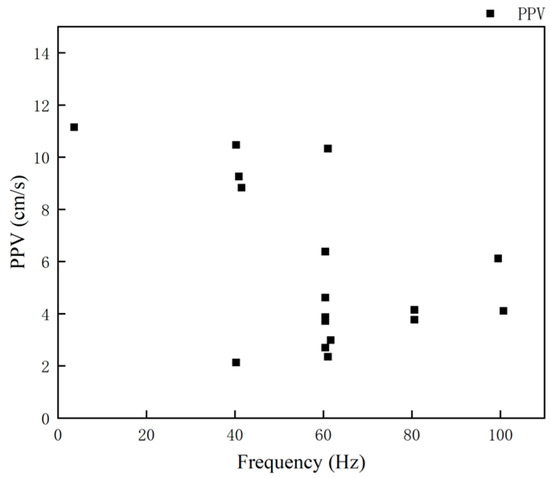
Figure 7.
PPV–frequency.
The maximum safe allowable velocity corresponding to the maximum charge can be obtained from the Sadowski empirical formula [25]:
In the formula, represents the safe allowable vibration velocity at the geological point of the protected object (cm/s), and and are coefficients and attenuation indices related to the terrain and geological conditions between the blasting point and the protected object. For hard rock, K is taken as 50, and α is taken as 1.3; is the amount of explosives (kg); and is the distance from the blasting site to the protected object (m).
The calculated value of is 16.41 cm/s. It is higher than the vibration velocity obtained by monitoring, which meets the relevant standards. The safe allowable vibration velocity of a transportation tunnel is related to its dominant vibration frequency. When the dominant vibration frequency is between 10 Hz and 50 Hz, the safe allowable vibration velocity is 12–15 cm/s. When the dominant vibration frequency exceeds 50 Hz, the safe allowable vibration velocity is 15–20 cm/s [26]. As shown in Figure 7, the monitored frequency is between 40 HZ and 100 Hz. The vibration velocity is 2 cm/s–12 cm/s. It meets the relevant criteria.
3. Numerical Simulation
The ALE algorithm combines the advantages of the Lagrange algorithm and the Euler algorithm. The ALE algorithm introduces moving mesh. During the calculation process, the mesh position will be adjusted appropriately to avoid the deformation of the mesh caused by large deformation. Finally, the transfer of mechanical parameters is realized by coupling the structure with fluid through velocity constraint, acceleration constraint, and penalty function constraint [27]. The relevant formula is as follows [11]:
where and represent the node mass of the fluid unit before and after distribution; is the node contained in a single fluid element; is momentum; is node force;is the acceleration of the node; is the velocity of the node; and and are symbols of fluid and solid elements.
3.1. Model Establishment
ANSYS19.0 was used for model creation. UltraEdit was used for k file editing. LS-PrePost4.3 was used for post-processing. This simulation simulates the blasting process by establishing an explosive model. The main focus of the research is the blasting vibration response, with the key issue being the coupling relationship between the explosive, air, and tamping material. Therefore, in the process of numerical simulation, the ALE algorithm is selected to define the model of air, tamping material, and explosives, and the Lagrange algorithm is selected to establish the model of rock mass and lining. The surrounding rock and lining share nodes, and air, tamping material, and explosives also share nodes. The *SET_PART_LIST keyword is used to distinguish different components, allowing the simulation of the explosives’ impact on the surrounding rock and lining. The model is surrounded by free boundaries. To reduce the impact of the boundaries on the vibration effects, non-reflective boundaries are established around the model.
For a connected arch tunnel, assume that the excavation of the right-line tunnel is completed and the excavation of the left-line tunnel has reached the middle section. A three-dimensional finite element model for the tunnel blasting is established using the finite element software ANSYS/LS-DYNA. The Y direction represents the vertical direction, the X direction is horizontal, and the Z direction is the blasting excavation direction. The numerical simulation scenario assumes that the new tunnel is excavated up to 20 m, at which point the upper step excavation begins. The excavation advance is 4 m, and the blasting employs a delayed initiation method. The upper-step excavation has the greatest impact on the existing tunnel. Therefore, the model only simulates the effect of the upper step blasting excavation of the left-line tunnel on the right-line tunnel. The model dimensions are 69 m × 24 m × 40 m, and solid elements (solid164) are used.
3.2. Mesh Division and Sensitivity Analysis
The mesh division is performed using the built-in functions of ANSYS. The explosive material is meshed using a mapping method. The surrounding rock mass, lining, and middle partition wall are meshed using a sweeping method. A tunnel-blasting model with a 4 m advance is established. Sensitivity analysis of the mesh is conducted by simulating the blasting effect of the slot hole. The lining mesh is divided into models with grid sizes of 30 cm and 50 cm, respectively. The blasting vibration velocity at the monitoring point on the blast-facing side is compared. The simulation results are shown in Figure 8.
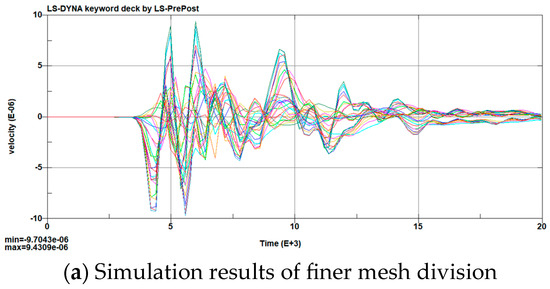
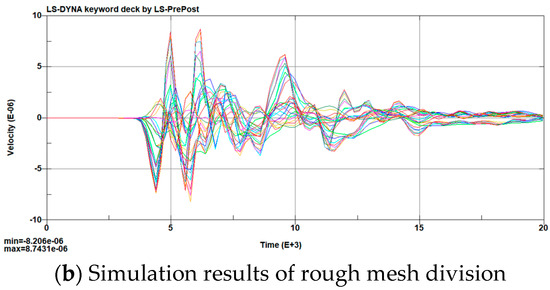
Figure 8.
Simulation result.
The positive and negative limiting vibration velocities for the finer mesh are −9.7 cm/s and 9.4 cm/s, respectively. For the coarser mesh, the velocities are −8.2 cm/s and 8.7 cm/s. The relative errors are 15% and 7.4%, respectively. It shows that mesh refinement significantly affects the simulation results. The first method should be used for this simulation.
In the area near blasting, the mesh is carefully divided, followed by the tunnel area, and other areas are roughly divided. The specific effect is shown in Figure 9. After meshing, the model consists of 77,092 rock mass elements, 46,080 lining elements, 1744 middle partition wall elements, and 53,784 explosive elements. The mesh quality is shown in Figure 10.
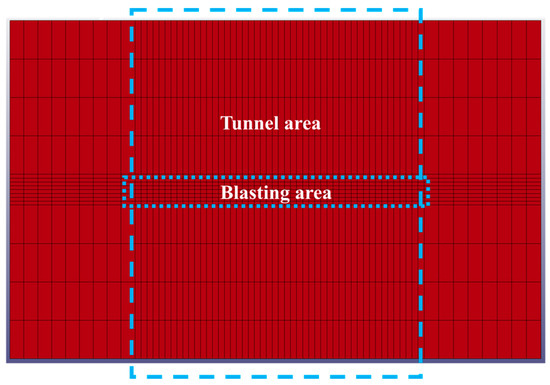
Figure 9.
Mesh fineness.
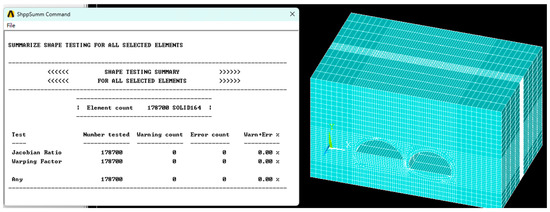
Figure 10.
Mesh quality.
3.3. Material Parameters
Once the mesh is completed, the model outputs a “k file”, which is then modified to set the material properties, calculation methods, and other settings. The unit system used in the numerical simulation is shown in Table 3.
Table 3.
Unit system.
The surrounding rock, tunnel concrete lining, and the middle partition wall all use the Hempel–Johnson–Campbell (HJC) constitutive model. In the LS-DYNA software, the keyword for the HJC constitutive model is *MAT_JOHNSON_HOLMQUIST_CONCRETE. The material model of HJC consists of an equation of state, a strength model, and a damage equation. The equation of state can be divided into the elastic stage, plastic stage, and fully compacted stage. The equation of state is as follows [28]:
Elastic stage ():
Plastic stage ():
Load:
Unload:
Fully compacted stage ():
Load:
Unload:
where is the hydrostatic pressure; is the compacting hydrostatic pressure; is the hydrostatic pressure value at the elastic limit is the hydrostatic pressure before unloadingis the volume strainis the volume deformation corresponding to ; is the volume deformation corresponding to is the volume deformation corresponding to; is the modified volume strain is the volume modulus;, , and are pressure constants, and is the unloading proportion factor.
The strength model is described by the characteristic equivalent stress as follows [28]:
where is the characteristic equivalent stress; is the damage variable; ,,, and are limit surface parameters; is the characteristic pressure; andis the characteristic strain rate.
The damage evolution equation is as follows [28]:
where and represent the equivalent plastic strain increment and plastic volume strain increment of a cell in the calculation cycle; indicates the plastic strain at the current integral step; is the damage constant; is the maximum characteristic tensile pressure that the material can withstand; and is the minimum plastic strain when the material breaks, which is used to control the brittle cracking of the material caused by the tensile stress wave.
This material is suitable for dynamic damage and deformation of materials under large strain, high strain rate, and high confining pressure. The tunnel concrete lining and middle partition wall are made of C30 concrete. The specific parameters are shown in Table 4 [10]. Surrounding rock and lining materials are shown in Figure 11.
Table 4.
Material parameters.
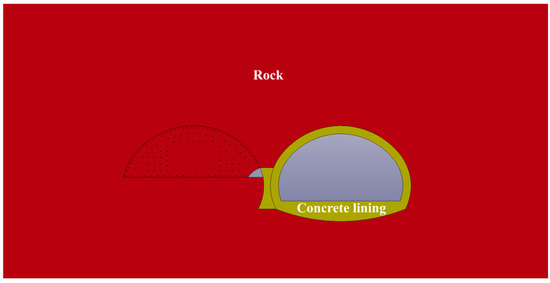
Figure 11.
Material condition.
To extend the blasting duration and prevent the leakage of explosive gases, the boreholes need to be sealed using tamping material. The material used for tamping is soil. In this study, the tamping material is described using the keyword *MAT_ SOIL_ AND_ FOAM. The parameters for the tamping material are given in Table 5 [29].
Table 5.
Tamping material parameters.
The air material is modeled using the MAT_NULL material model, with the state equation supplemented by the *EOS_ LINEAR_ POLYNOMIAL equation of state. The material state equation is as follows.
In the equation, represents the pressure; , , and are the coefficients of the air state equation; is the initial internal energy density; is the specific volume; is the current air density; and is the reference air density.
The specific parameter values of air materials used in blasting simulation of double-arch tunnel engineering and corresponding equation of state parameters are shown in Table 6 [29].
Table 6.
Air material parameters.
In LS-DYNA software, a model for high-energy explosive materials is provided. It can accurately calculate the propagation of blast stress waves. Its keyword is *MAT_ HIGH_ EXPLOSIVE_ BURN. The post-explosion pressure is calculated using the Jones-–Wilkins–Lee equation of state, which is further explained with the keyword *EOS_LINEAR_POLYNOMIAL. The specific expression is as follows:
In the equation, represents the detonation pressure; , and are material constants; is the relative specific volume; andis the initial internal energy density.
The specific parameter values of the explosive used in the blasting simulation for the tunnel engineering and the corresponding equation of state parameters are shown in Table 7 [29].
Table 7.
Explosive parameters.
3.4. Results and Verification
By modifying the k-file, the material parameters, ALE settings, and other definitions are completed. The model is solved using the Ansys Program Manager. Post-processing is performed using LS-PrePost, which provides the simulated vibration velocity curves on the blast-facing side and the blast-opposite side of the tunnel. The simulated vibration velocity curve on the blast-facing side is shown in Figure 12, and the simulated vibration velocity curve on the blast-opposite side is shown in Figure 13.
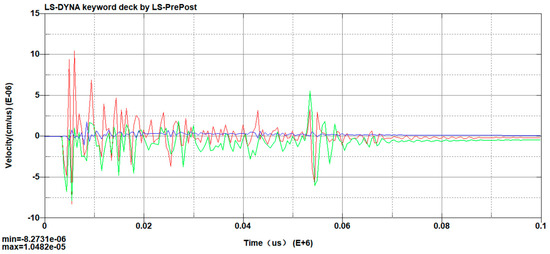
Figure 12.
Simulated vibration velocity on the blast-facing side.
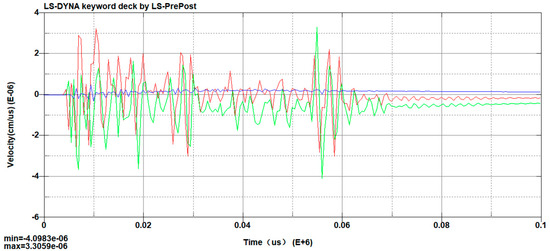
Figure 13.
Simulated vibration velocity on the blast-opposite side.
Many measurements measured during blasting are shown in Table 2. These values are compared with the results from numerical simulations to verify the validity of the simulation. The field monitoring results are as follows: The PPV values on the blast-facing side are 10.47 cm/s, 9.26 cm/s, and 11.15 cm/s, while the PPV values on the opposite-facing side are 3.77 cm/s, 4.11 cm/s, and 4.22 cm/s. Figure 12 and Figure 13 show the simulation results. The PPV on the blast-facing side is 10.48 cm/s, and the PPV on the opposite-facing side is 4.10 cm/s.
The relative errors are 1.0%, 13%, and 6% for the blast-facing side, and 8%, 0.2%, and 2.8% for the opposite-facing side, respectively. The field-monitoring values and the numerical simulation results are quite close. It shows that the results are valid. The on-site monitored vibration velocity curve is shown in Figure 6, while the simulation curve is shown in Figure 12 and Figure 13. It can be observed that the trends of change in the numerical simulation and the on-site monitoring values are quite similar.
The model reduces the influence of free boundaries on the simulation results by setting non-reflective boundaries, but it has certain limitations. The blasting site environment is complex, and factors such as groundwater, temperature, and rock layering were not considered in the simulation, which may have resulted in some errors in the simulation.
In the process of blasting at the project site, the blasting effect is good. The smooth blasting effect is shown in Figure 14.
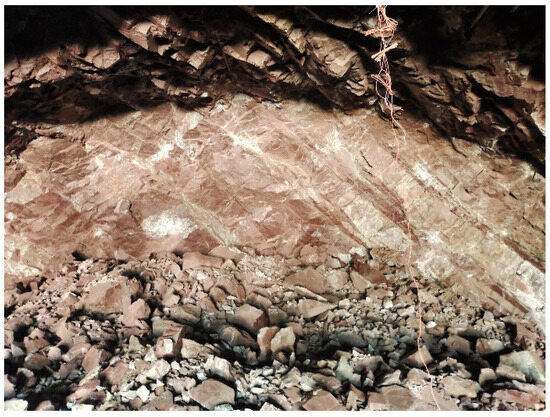
Figure 14.
Effect of smooth blasting.
4. Right Tunnel Blast Vibration Response
4.1. Vibration Velocity Analysis
The left line of the double arch tunnel simulates the blasting of the upper step. Each section is blasted in segments with a blast delay of 10 ms. After blasting at the upper step of the left-line tunnel, Figure 15 shows the vibration velocity contour plot of the right tunnel at different times after blasting.
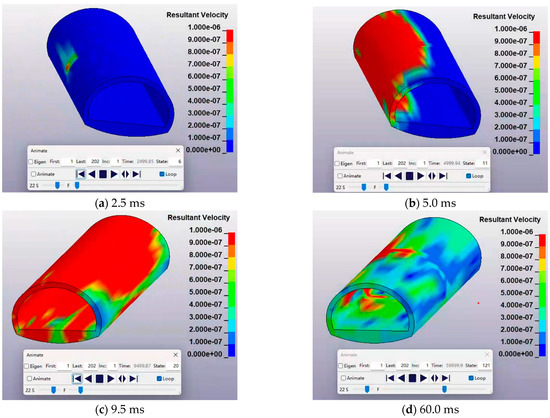
Figure 15.
Blast vibration propagation diagram.
The blast tunnel is the left line of the double-arch tunnel, and the affected tunnel is the right line of the double-arch tunnel. As can be seen from the figure, at 2.5 ms, the left side wall of the right-line tunnel was the first to be affected by vibration. At 5.0 ms, the arch crown of the right line was affected by blasting vibration. At 9.5 ms, the whole right tunnel was affected by blasting vibration. After 10 ms, the subsequent explosive blasting, until 62 ms after the right line tunnel vibration speed gradually decreased.
Compared to the side opposite to the blast, the blast vibration velocity on the blast-facing side (blast side) is greater. Sections at axial distances of 0 m, 2 m, 7 m, 12 m, 17 m, and 22 m from the right-line tunnel are selected and named, as shown in Table 8.
Table 8.
Section naming.
The PPV of the blasting vibration at the positions of the blast-facing side wall and arch foot, tunnel crown, and blast-opposite side wall and arch foot of the right line tunnel are analyzed. The sections and selected points are shown in Figure 16. The PPV distribution diagram is shown in Figure 17 and Figure 18.
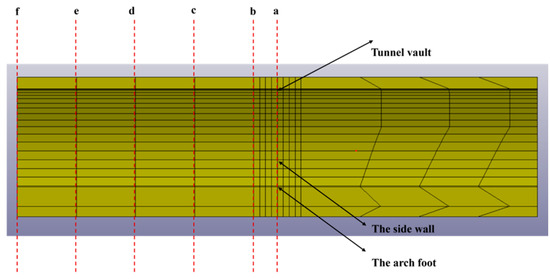
Figure 16.
Section and selected points distribution diagram.
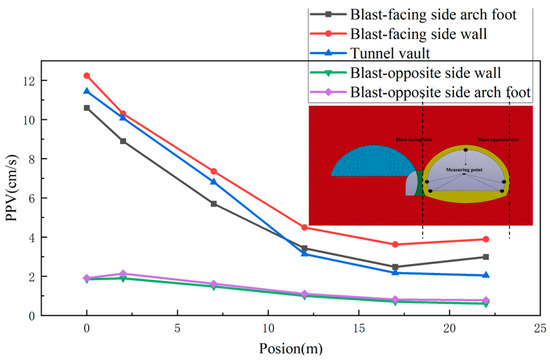
Figure 17.
The PPV distribution diagram 1.
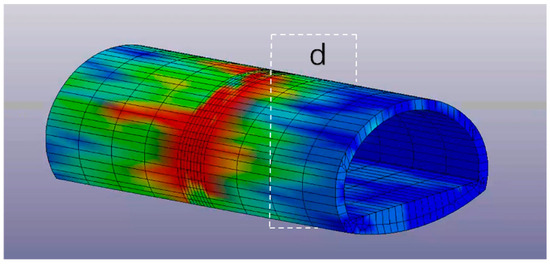
Figure 18.
The PPV distribution diagram 2.
As shown in Figure 17 and Figure 18, within the range of sections a–d, the distribution of PPV along the five broken lines is as follows: the maximum value occurs at the blast-facing side wall, followed by the tunnel vault the blast-facing side arch foot, the blast-opposite side arch foot, and the wall. Within the range of sections d–f, the distribution of PPV along the five broken lines is as follows: the maximum value occurs at the blast-facing side wall, followed by the blast-facing side arch foot, the tunnel vault, the blast-opposite side arch foot, and the wall.
From the five broken lines, it can be observed that the PPV decreases as the distance from the blast center increases. The PPV on the blast-facing side is greater than at other locations. At section a, the PPV on the blast-facing side is the highest. Therefore, during the blasting process, special attention should be paid to monitoring the vibration velocity at this section.
After the detonation of the explosives, the stress wave propagates from the blasting point on the left-line tunnel. It first reaches the blast-facing side wall of the right-line tunnel. At this point, the PPV occurs. The wave then propagates towards both ends of the lining, eventually covering the entire right-line tunnel.
Due to the presence of the middle pilot tunnel within the a–b sections, some of the explosive energy is dissipated. This results in a reduction of the PPV at the arch foot on the blast-facing side within the a–d sections. The tunnel vault is less affected by the dissipation of energy from the middle pilot tunnel, and its PPV is less impacted. As a result, the PPV at the crown is higher than that at the arch foot on the blast-facing side.
In the d–f sections, the dissipation effect of the middle pilot tunnel near the blasting section is almost negligible. Since the arch foot on the blast-facing side is closer to the blast source, the PPV at this location is higher than that at the tunnel vault.
4.2. Stress Analysis
The effective stress of the arch, side wall, and arch foot of the right-line tunnel near the left-line blasting section is extracted. As shown in Figure 19, after the blasting of the left-line tunnel in the connected tunnel, the stress on the blast-facing side of the right-line tunnel is higher.
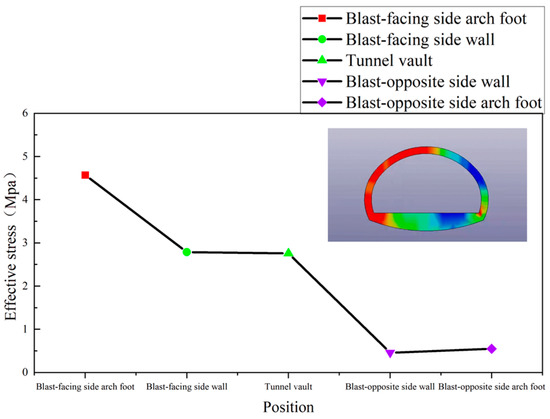
Figure 19.
Distribution of effective stresses.
Select the unit shown in Figure 20 for effective stress analysis. Based on sections a, b, c, d, e, and f, the variation law of effective stresses in key points such as the crown, sidewall, and arch foot of the right-line tunnel is analyzed.
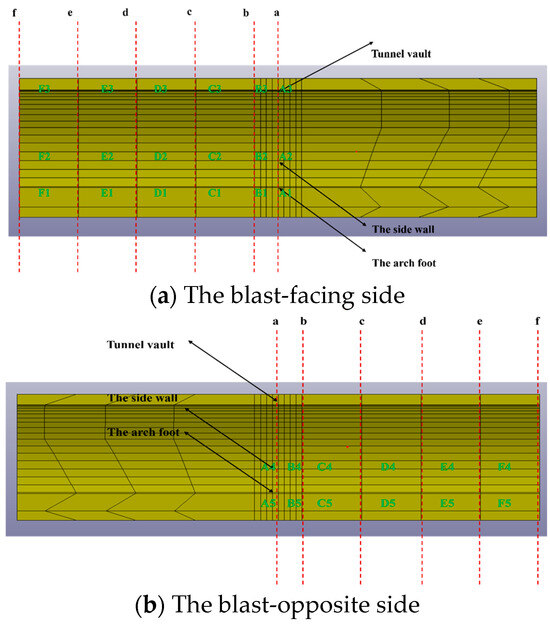
Figure 20.
Unit selection and naming.
As shown in Figure 21, the effective stress at the arch foot on the blast-facing side is the highest, and the change is obvious. During construction, enhanced monitoring and reinforcement should be applied to this area. The effective stresses at the side wall and arch foot on the blast-opposite side are the lowest and nearly identical.
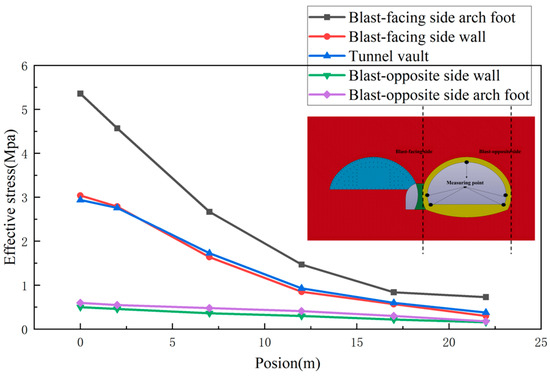
Figure 21.
Variation law of effective stresses.
Before section c, the effective stress at the blast-facing side wall is greater than the effective stress at the tunnel vault. However, after section c, the effective stress at the tunnel vault becomes greater than that at the blast-facing side wall. During construction, monitoring and reinforcement should be enhanced at these two locations.
4.3. Safety Threshold for Vibration Velocity Control of Existing Tunnel Lining
The PPV of each point is shown in Table 9. The effective stress of each element is shown in Table 10.
Table 9.
PPV.
Table 10.
Effective stress.
Based on Table 9 and Table 10 during the blasting of the left step of the tunnel arch, the PPV decreases as the distance from the blast point increases. The PPV on the blast-facing side of the tunnel’s side wall is the largest. The maximum effective stress occurs at the arch foot on the blast-facing side. Therefore, it is necessary to enhance the monitoring of the vibration velocity and stress on the blast-facing side of section a.
The potential structural failure of tunnel lining is related to the maximum tensile stress. The most critical locations for the lining are the blast-facing side wall and the blast-facing side arch foot. By using the relevant data from each unit, as shown in Figure 20, the relationship between the PPV and the maximum tensile stress experienced by the lining at the blast-facing side wall and the blast-facing side arch foot is established [30], as represented by Equations (15) and (16). This is shown in Figure 22.
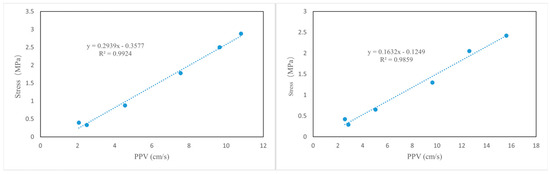
Figure 22.
Maximum tensile stress–PPV.
Relevant studies have shown that the dynamic strength of rocks can be improved to a certain extent under dynamic load [30]:
where is the dynamic tensile strength of the lining; is the static tensile strength of the lining; and is the dynamic strength increase coefficient, generally ranging from 1.24 to 1.48. In this case, it is taken as 1.24.
The ultimate tensile strength of C30 concrete is taken as 2.5 MPa. By substituting this value into equations x-y, the threshold vibration velocity for the arch foot lining is obtained as 12.28 cm/s, and the threshold vibration velocity for the side wall lining is obtained as 20.68 cm/s.
As can be seen from Figure 12, the PPV of the arch foot is 10.8 cm/s, and the PPV of the side wall is 15.6 cm/s. It can be seen that PPV is within the tolerable range of structural integrity.
5. Conclusions
This study systematically analyzes the vibration response and stress distribution characteristics during the blasting process of a double-arch tunnel through numerical simulation and comparison with field data. It proposes the threshold vibration velocity at critical locations. These works fill the research gap in the blasting engineering of double-arch tunnels. The research results provide important theoretical support and practical guidance for tunnel-blasting design and safety monitoring.
- (1)
- The blasting model of the connected arch tunnel based on ANSYS/LS-DYNA was validated by comparing it with the field blasting-vibration velocity data.
- (2)
- The propagation pattern of blasting vibrations in the adjacent tunnel is influenced by the middle pilot tunnel. When blasting on the left upper step, the vibration propagation shows a certain pattern. Specifically, within a certain range, the maximum PPV occurs at the blast-facing side wall, followed by the tunnel vault, blast-facing side arch foot, blast-opposite side arch foot, and blast-opposite side wall. Outside this range, the maximum PPV shifts to the sidewall, followed by the arch foot, tunnel vault, blast-opposite side arch foot, and blast-opposite side wall. Overall, the PPV value decreases with the increasing distance from the blast center.
- (3)
- The effective stress induced by blasting construction exhibits a certain spatial distribution pattern. The maximum effective stress occurs at the blast-facing side arch foot. The minimum effective stress, which is nearly equal, is found at the blast-opposite side wall and blast-opposite side arch foot. Within a certain range, the effective stress at the blast-facing side wall is higher than that at the tunnel vault. Outside this range, the effective stress at the tunnel vault exceeds that at the blast-facing side wall.
- (4)
- The relationship between PPV and tensile stress is established. The threshold vibration velocity is also proposed. This provides a scientific basis for tunnel design and construction. The threshold vibration velocity at the side wall is 20.68 cm/s, and the threshold vibration velocity at the arch foot of the side is 12.28 cm/s.
- (5)
- The stress generated by blasting in the back hole of double-arch tunnel is larger in the front hole, so it is necessary to take measures to reduce vibration. Based on the above vibration and stress distribution patterns, vibration velocity monitoring at section A of the right line of the adjacent tunnel should be strengthened, particularly in the arch foot, tunnel vault, and blast-facing side wall regions. Additionally, the stress in these areas should be closely monitored, and reinforcement measures should be implemented to ensure the stability of the tunnel structure.
- (6)
- These dangerous points are helpful to strengthen the parts vulnerable to vibration in the design stage of double-arch tunnels and improve the safety and stability of tunnels. Despite its contributions, this study has certain limitations. For example, the model does not account for all potential geological factors and blasting methods that may affect vibration. The accuracy and complexity of the numerical model still require further improvement. Additionally, the lack of sufficient field test data restricts the broader applicability of the model. Future research could focus on further improving the numerical simulation of blasting vibrations, considering more complex factors, such as varying geological conditions, blasting parameters, and their coupled effects with tunnel structures.
Author Contributions
Conceptualization, D.L. and Y.T.; data curation, X.S. (Xiaofei Sun) and Y.S.; formal analysis, X.S. (Xiaofei Sun) and Y.S.; investigation, P.Z. and J.H.; methodology, D.L. and Y.T.; project administration, Y.T. and X.S. (Xianghao Sun); software, J.H. and X.S. (Xianghao Sun); supervision, P.Z. and J.H.; validation, Y.S. and P.Z.; writing—original draft, X.S. (Xianghao Sun); writing—review and editing, X.S. (Xiaofei Sun) and D.L. All authors have read and agreed to the published version of the manuscript.
Funding
A Project Supported by Scientific Research Fund of Hunan Provincial Education Department+23C0091.
Data Availability Statement
Data supporting the reported results can be provided by the corresponding author upon reasonable request.
Conflicts of Interest
Authors Xiaofei Sun, Ying Su, Pei Zhang and Jishuang Hu were employed by the company Road & Bridge South China Engineering Co., Ltd. The remaining authors declare that the research was conducted in the absence of any commercial or financial relationships that could be construed as a potential conflict of interest.
References
- Wu, B.; Lu, M.; Huang, W.; Lan, Y.; Wu, Y.; Huang, Z. A Case Study on the Construction Optimization Decision Scheme of Urban Subway Tunnel Based on the TOPSIS Method. KSCE J. Civ. Eng. 2020, 24, 3488–3500. [Google Scholar] [CrossRef]
- Zhu, Q.; Ding, Y. Impact of new undercrossing tunnel excavation on the stability of the existing tunnel. Front. Earth Sci. 2022, 10, 915882. [Google Scholar] [CrossRef]
- Wang, Y.; Xie, Y. Development and Research of Multi-arch Tunnel in China. Highway 2008, 6, 216–219. [Google Scholar]
- Verma, H.; Samadhiya, N.; Singh, M.; Goel, R.; Singh, P. Blast induced rock mass damage around tunnels. Tunn. Undergr. Space Technol. 2018, 71, 149–158. [Google Scholar] [CrossRef]
- Zhang, W.; Liu, D.; Tang, Y.; Qiu, W.; Zhang, R. Multifractal Characteristics of Smooth Blasting Overbreak in Extra-Long Hard Rock Tunnel. Fractal Fract. 2023, 7, 842. [Google Scholar] [CrossRef]
- Jiang, N.; Lyu, G.; Wu, T.; Zhou, C.; Li, H.; Yang, F. Vibration effect and ocean environmental impact of blasting excavation in a subsea tunnel. Tunn. Undergr. Space Technol. 2023, 131, 104855. [Google Scholar] [CrossRef]
- Zhang, X.; Su, J.; Xu, Y.; Min, B. Experimental and numerical investigation the effects of insufficient concrete thickness on the damage behaviour of multi-arch tunnels. Structures 2021, 33, 2628–2638. [Google Scholar] [CrossRef]
- Han, Y.; Liu, H. Finite Element Simulation of Medium-Range Blast Loading Using LS-DYNA. Shock. Vib. 2015, 2015, 1–9. [Google Scholar] [CrossRef]
- Yao, C.; Zhao, S.; Liu, Q.; Liu, D.; Qiang, B.; Li, Y. Flume Experiments and Numerical Simulation of a Barge Collision with a Bridge Pier Based on Fluid–Structure Interaction. Sustainability 2023, 15, 6445. [Google Scholar] [CrossRef]
- Cancan, L. Study on Vibration Effect of Blasting Construction of New High-Speed Railway Tunnel on Existing High Speed Railway Tunnel. Master’s Thesis, Shijiazhuang Railway University, Shijiazhuang, China, 2023. [Google Scholar]
- Zhang, P.; Cai, J.; Zong, F.; He, Y.; Wang, Q. Dynamic Response Analysis of Underground Double-Line Tunnel under Surface Blasting. Shock. Vib. 2021, 2021, 9226615. [Google Scholar] [CrossRef]
- Vaghefi, M.; Mobaraki, B. Evaluation of the Effect of Explosion on the Concrete Bridge Deck Using LS-DYNA. Int. Rev. Civ. Eng. (IRCE) 2021, 12, 135. [Google Scholar] [CrossRef]
- Mobaraki, B.; Vaghefi, M. The Effect of Protective Barriers on the Dynamic Response of Underground Structures. Building 2024, 14, 3764. [Google Scholar] [CrossRef]
- Liang, Q.; Li, J.; Li, D.; Ou, E. Effect of Blast-Induced Vibration from New Railway Tunnel on Existing Adjacent Railway Tunnel in Xinjiang, China. Rock. Mech. Rock. Eng. 2013, 46, 19–39. [Google Scholar] [CrossRef]
- Zhao, H.-B.; Long, Y.; Li, X.-H.; Lu, L. Experimental and numerical investigation of the effect of blast-induced vibration from adjacent tunnel on existing tunnel. KSCE J. Civ. Eng. 2016, 20, 431–439. [Google Scholar] [CrossRef]
- Xiao, X.; Li, X.; Gong, F. Analysis of Tunnel Excavation and Explosion Influence on HighVoltage Tower with FLAC3D. Chin. J. Undergr. Space Eng. 2013, 9, 1401–1405. [Google Scholar]
- Jiang, C. Study on influence of blasting at portal sectio of large span highway tunnel on safety of high slope. J. Saf. Sci. Technol. 2020, 16, 85–91. [Google Scholar] [CrossRef]
- Duan, L.; Lin, W.; Lai, J.; Zhang, P.; Luo, Y. Vibration Characteristic of High-Voltage Tower Influenced by Adjacent Tunnel Blasting Construction. Shock. Vib. 2019, 2019, 8520564. [Google Scholar] [CrossRef]
- Kasilingam, S.; Sethi, M. Mitigation strategies of underground tunnels against blast loading. Int. J. Prot. Struct. 2022, 13, 21–44. [Google Scholar] [CrossRef]
- Wang, X.; Hou, X.; Yuan, W.; He, C.; Sarfarazi, V.; Fan, H. Attenuation of blast-induced vibration on tunnel structures. Geohazard Mech. 2024, 2, 153–163. [Google Scholar] [CrossRef]
- Vo, T. Effect of Blasting During Tunnel Excavation on an Existing Adjacent Tunnel. Tek. Dergi 2022, 33, 12725–12740. [Google Scholar] [CrossRef]
- Guan, Z.; Xie, L.; Chen, D.; Shi, J. Numerical Simulation and Field Monitoring of Blasting Vibration for Tunnel In-Situ Expansion by a Non-Cut Blast Scheme. Sensors 2024, 24, 4546. [Google Scholar] [CrossRef] [PubMed]
- Tian, X.; Song, Z.; Wang, J. Study on the propagation law of tunnel blasting vibration in stratum and blasting vibration reduction technology. Soil. Dyn. Earthq. Eng. 2019, 126, 105813. [Google Scholar] [CrossRef]
- Xia, J.; Wang, B.; Guo, X.; Xie, Z. Vibration response and safety control for blasting vibration of the existing tunnel with defects. Undergr. Space 2024, 15, 76–89. [Google Scholar] [CrossRef]
- Li, G. Analysis on the Influence of Blasting Construction of New Tunnel on the Stability of Existing Tunnel. J. Water Resour. Archit. Eng. 2022, 20, 185–192. [Google Scholar]
- GB6722—2014; Safety Regulations for Blasting China. China Society of Engineering Blasting: Beijing, China, 2014.
- Livermore Software Technology Corporation (LSTC). LS-DYNA Keyword User’s Manual Version R 10.0; Livermore Software Technology Corporation: Livermore, CA, USA, 2017. [Google Scholar]
- Fang, Q.; Kong, X.; Wu, H.; Gong, Z.; Yan, S. Determination of the Holmquist-Johnson-Cook consitiutive model parameters of rock. Eng. Mech. 2014, 31, 197–204. [Google Scholar] [CrossRef]
- Hu, X. Optimizing of Charging Parameters and Numerical Simulation for Blasting of Wedge-Shaped Cut in Mountain Tunnel. Master’s Thesis, Huazhong University of Science and Technology, Wuhan, China, 2020. [Google Scholar]
- Cao, M.; Yan, S.; Zheng, Y.; Shao, C.; Wang, N.; Du, J. Analysis of blasting vibration response of adjacent tunnel. Eng. Blasting 2023, 1–12. [Google Scholar] [CrossRef]
Disclaimer/Publisher’s Note: The statements, opinions and data contained in all publications are solely those of the individual author(s) and contributor(s) and not of MDPI and/or the editor(s). MDPI and/or the editor(s) disclaim responsibility for any injury to people or property resulting from any ideas, methods, instructions or products referred to in the content. |
© 2025 by the authors. Licensee MDPI, Basel, Switzerland. This article is an open access article distributed under the terms and conditions of the Creative Commons Attribution (CC BY) license (https://creativecommons.org/licenses/by/4.0/).