Abstract
As a full tension structural system, the spoke-type single-layer cable net structure has a light graceful shape and superior mechanical properties. During construction, the structure will gradually be tensioned from the flexible unstressed state to the formed state with stiffness, and the structural configuration changes greatly, making construction difficult. This study focused on the spoke-type single-layer cable net structure of the Linyi Olympic Sports Center Stadium. The structural finite element model was established in ANSYS, and the construction scheme was selected and simulated using the nonlinear dynamic finite element method (NDFEM). Most of the existing structural automatic measuring systems are suitable for measuring points with gentle deformation. However, there is the lack of a stable and reliable automatic configuration monitoring system for the construction of single-layer cable net structures. Based on the Lecia TS16 robotic total station (RTS), the configuration automatic monitoring system (CAMS) was developed to obtain the coordinate data of key nodes on the ring cable and compression ring during the construction process. The original finite element model of clamps was refined to obtain the corresponding data in ANSYS. The results indicate that the selected construction scheme has a rational mechanical response according to the finite element simulation. The radial cable force when anchoring the traction cables is smaller than or equal to that in the formed state, which proves that the construction method of anchoring in batches is safe. The results of the ANSYS simulation is basically consistent with those obtained by CAMS, proving that the simulation method is credible. CAMS has good stability and measurement accuracy and can achieve the automatic monitoring of large structural deformation. The research findings provide valuable guidance for practical construction and other similar projects.
1. Introduction
The spoke-type single-layer cable structure is similar to a bicycle wheel, consisting of inner tension rings, an outer compression ring, and radial cables [1,2]. As a full tension structural system [3,4], the spoke-type single-layer cable net structure has the characteristic of a beautiful and varied architectural appearance and can make full use of the material strength because a high-strength cable is used as the tension member. When using few compression members, this structural system can avoid structural instability problems and is known as one of the most efficient structural forms [5]. However, its structural characteristics have higher requirements not only in terms of the structural design and analysis, but also in construction forming technology.
The structure will appear to have large deformation during the construction process, which presents a strong geometric nonlinearity [6]. However, it is difficult to carry out structural form-finding. Therefore, it is significant to choose the appropriate construction scheme, an accurate analytical method of the cable structure’s construction process, and advanced construction technologies to guide the construction project [7,8,9]. The analysis of the cable structure’s construction process refers to constructing the finite element model according to the mechanical analysis method. The structural configuration and internal force under different construction conditions can be obtained to judge the feasibility of the construction scheme. Many methods have also been proposed for the form-finding problem during the construction process such as the dynamic relaxation method, force density method, and nonlinear finite element method [7,10,11,12,13,14,15]. Both Yu et al. [16] and Zhongling et al. [17] respectively used the dynamic relaxation method to analyze the construction process of the cable dome. Guerra Riaño and Várkonyi et al. [18], Li et al. [19], and Tang et al. [20] applied the force density method to carry out form-finding of cable structure. Based on morphological analysis theory, Luo and Xue et al. [21,22] used the nonlinear finite element method to determine the initial geometric configuration of the cable dome structure in construction. Ma et al. [23] proposed unbalanced force iteration, which removed the unbalanced forces using the equilibrium and stiffness equations and was used in the analysis of cable domes. Luo [24] came up with the nonlinear dynamic finite element method (NDFEM) to determine the energy balance state of the cable-rod system. The NDFEM makes the dynamic equilibrium state gradually converge to the static equilibrium by updating the finite element model iteratively. The analytical efficiency and accuracy of NDFEM have been proven by a large number of engineering construction studies [24,25,26,27,28], and was applied in the target engineering in this paper.
In order to ensure the safety of the cable net structure during the construction and achievement of the intended formed geometry, configuration monitoring can be used to obtain the real-time data of the key point coordinates to determine whether the deformation is moderate or not [29]. These measured values from configuration monitoring can be compared and analyzed with theoretical values from the finite element model of the construction process to judge the structural state and ensure the safety and stability. Formerly, manual measurement methods were usually used to obtain the key point coordinates of the cable structure during construction. However, there are many deficiencies such as not being in real-time, low efficiency, and large errors though manual measurement [30]. Therefore, if a robotic total station (RTS) is developed to build a set of automatic configuration monitoring systems that can capture, save, verify, and output the real-time data with acceptable accuracy, the construction efficiency will be significantly improved [31]. The robotic total station (RTS), which is also called a measuring robot, is a high-performance measurement platform integrating target recognition, target tracking, automatic aligning, automatic measurement, and data recording [31,32]. It can use fewer human resources to gain relatively accurate measurement data, which can help engineering technicians grasp the situation of the structural configuration and guide the construction. Based on a Lecia Nova TM50 robotic total station and the polar coordinate method, Zhou et al. [33] monitored the deformation of two dams continuously, which showed a satisfactory accuracy. Based on the TCA2003 surveying robot, Yao et al. [34] developed a landslide deformation monitoring system to monitor the landside deformation of Fuchunjinag Dam, which could realize automatic multiple observations and the generation of field data sheets. Based on a RTS, Stathis C. Stiros et al. [35] monitored the displacement characteristics including pattern, amplitude, and frequency of Gorgopotamos Bridge, which showed that the RTS is appropriate for monitoring stiff structures accurately under small deformation. Luo et al. [36] measured the tunnel displacement by a total station with the 3D coordinate measurement and the remote distance measurement that demonstrated excellent performance, especially in the tunnels with weak surrounding rock. RTSs have been applied in the construction of tunnels, dams, bridges foundation pits, and other fields. However, the automatic measuring of the above RTSs are only appropriate for fixed measuring points; once the measuring point moves a large distance, robot cannot easily find the target object.
The object engineering of this paper was the Linyi Olympic Sport Center Stadium, which has a spoke-type single-layer cable net roof. During the construction process, this structure will appear as a large deformation at the early stage of construction, and its internal force will change drastically at the late stage of development. Therefore, it is difficult to simulate its construction process accurately. Furthermore, the automatic monitoring system above cannot satisfy the requirement of the construction configuration monitoring for this roof structure. In order to ensure safety during its construction, it is necessary to apply the appropriate RTS to establish a set of automatic monitoring systems, which can be used in the situation of large deformation.
In this paper, a spoke-type single-layer cable net of the target engineering was modeled in the finite element software ANSYS 2019R1. The nonlinear dynamic finite element method (NDFEM) was applied to analyze the process of the selected construction scheme and verify its rationality. The configuration automatic monitoring system (CAMS) was established on the Visual Studio 2022 platform to obtain the measured configuration response, which was compared with the simulated theoretical responses. The results show that the measured configuration response was close to the simulated theoretical ones under each construction condition. It was also proven that the CAMS is effective, while the construction process is safe and reliable.
2. Engineering Background
The roof of the Linyi Olympic Sport Center Stadium is a spoke-type single-layer cable net structure (Figure 1 and Figure 2) that is saddle shaped. Its plane is approximately circular. The central opening is 146.2 m wide in the long axis direction, 171.2 m long in the short axis direction, and the overhanging length of the membrane surface is about 50 m.
Figure 1.
Plan diagram of the roof of the Linyi Olympic Sport Center Stadium.
Figure 2.
Spoke-type single-layer cable net structure of the Linyi Olympic Sport Center Stadium.
The cable net structure consists of 40 radial cables, each of which are double cables. An outer compression truss is used as the support member of the roof and the outer compression ring of the cable net. The inner tension ring is composed of 10 ring cables, and the diagram of the cables and cable clamp is shown in Figure 3. A Galfan full lock coil strand cable was used for both radial cables and ring cables, and their specifications and material properties are shown in Table 1. The numbering and layout of the cable is shown in Figure 4.
Figure 3.
Diagram of the cables and cable clamp. (a) Clamp of the ring cable. (b) Pin-connected plate of the outer compression truss.
Table 1.
Specification and material property of the steel and cables.
Figure 4.
The numbering and layout of cables.
3. Construction Process Analysis
3.1. Selection of Construction Scheme
As a typical flexible structure [37], the stiffness of the spoke-type single-layer cable net structure is generated by tensioning the cables. Generally, the temporary supports are built to lift the rigid tension ring. However, the inner tension ring of this structure is composed of light ring cables, so it is uneconomical and inefficient to build temporary supports. Single-layer cable-net structures with flexible tension rings are often hoisted entirely by traction cables.
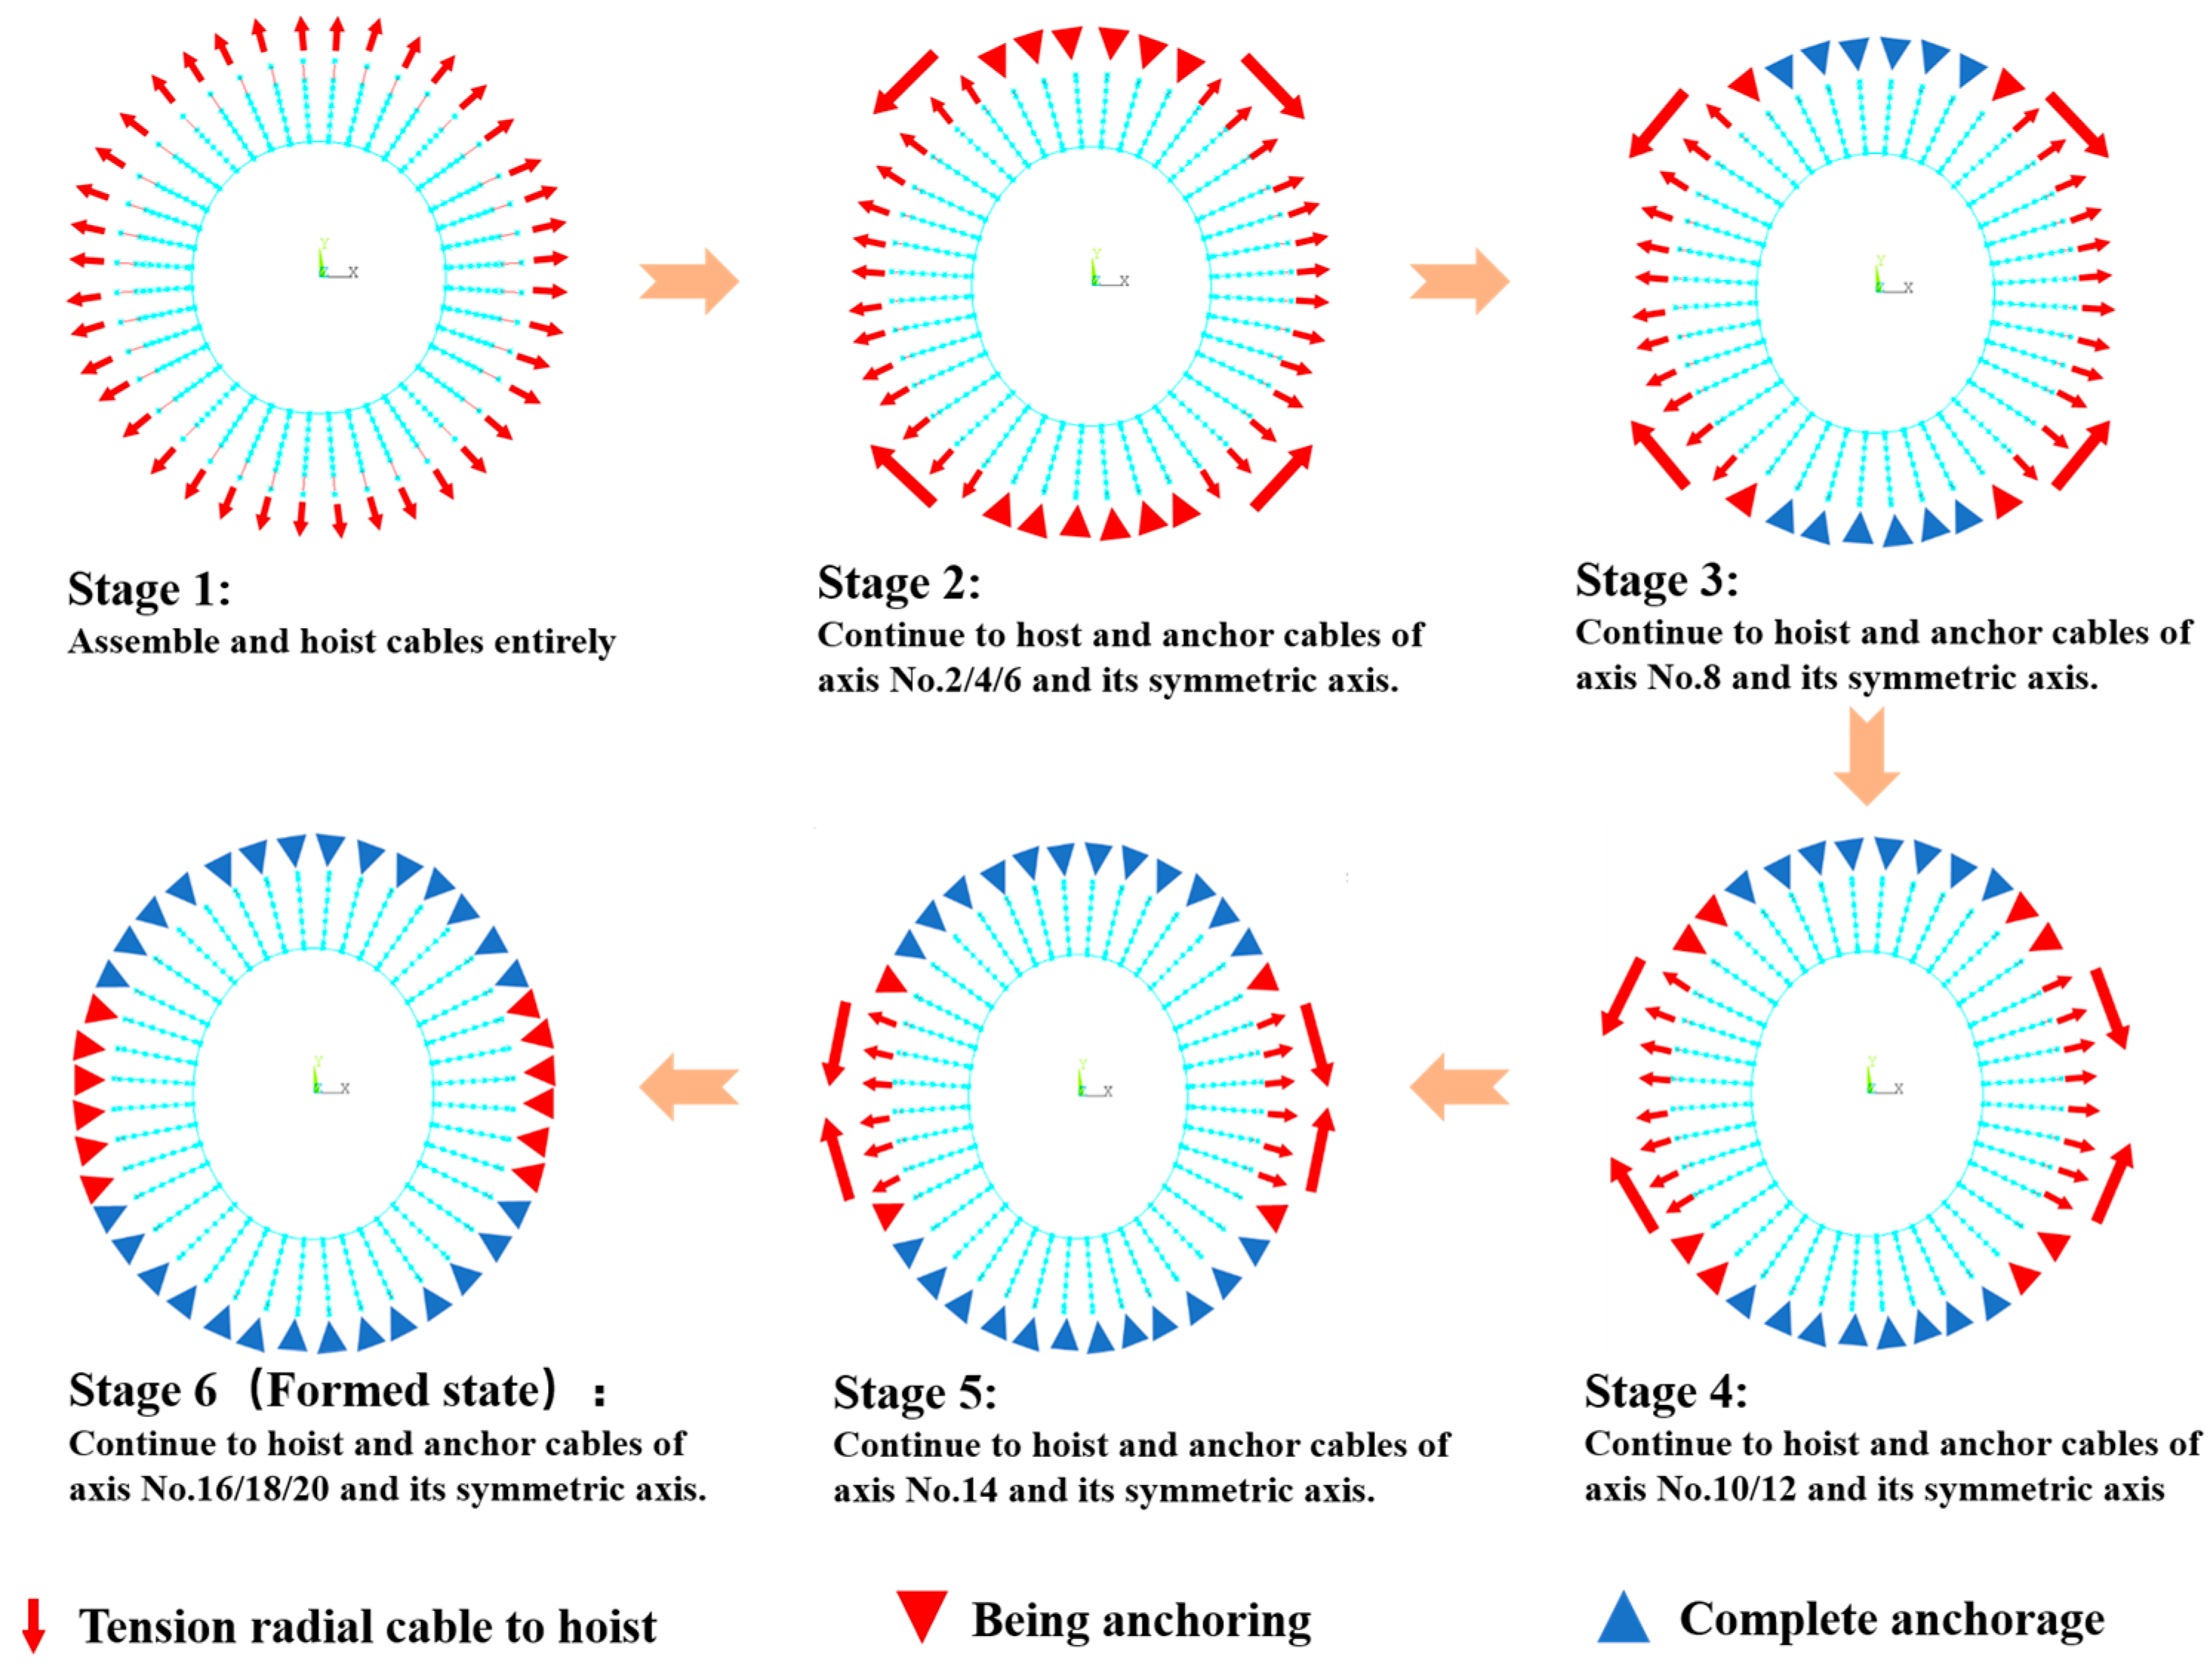
After considering the characteristics of the target engineering comprehensively, it was decided to adopt the construction scheme of “assembling on the ground with free stress, hoisting entirely using traction cables, and tensioning/anchoring in batches”. The radial cables were divided into three groups: A, B, and C (shown as Figure 5). Firstly, the radial and ring cables were assembled on the ground, and the traction devices were used in the outer compression truss to hoist three areas simultaneously. Then, area A was hoisted to the precalculated position, and the radial cables of area A were anchored to the pin-connected plate. Tension was continued on the cables of area B and C, then they were anchored chronologically. The construction scheme of the cables is shown in Figure 6.
Figure 5.
Cable net area and tension batch.
Figure 6.
Flow diagram of cable construction.
After confirming the construction scheme of the cable net structure, the entire structure adopted the following construction scheme:
(1) Assembling of the outer diagonal column and compression truss;
(2) Assembling of the radial cables, ring cables, and cable clamps on the stands or stadium;
(3) Taking the outer compression truss as the fulcrum and using the traction cables to tension the radial cables to hoist the cable net structure;
(4) Anchoring the radial cables to the outer compression truss in batches (areas A–C) until the cable structure was formed.
3.2. Finite Element Modeling
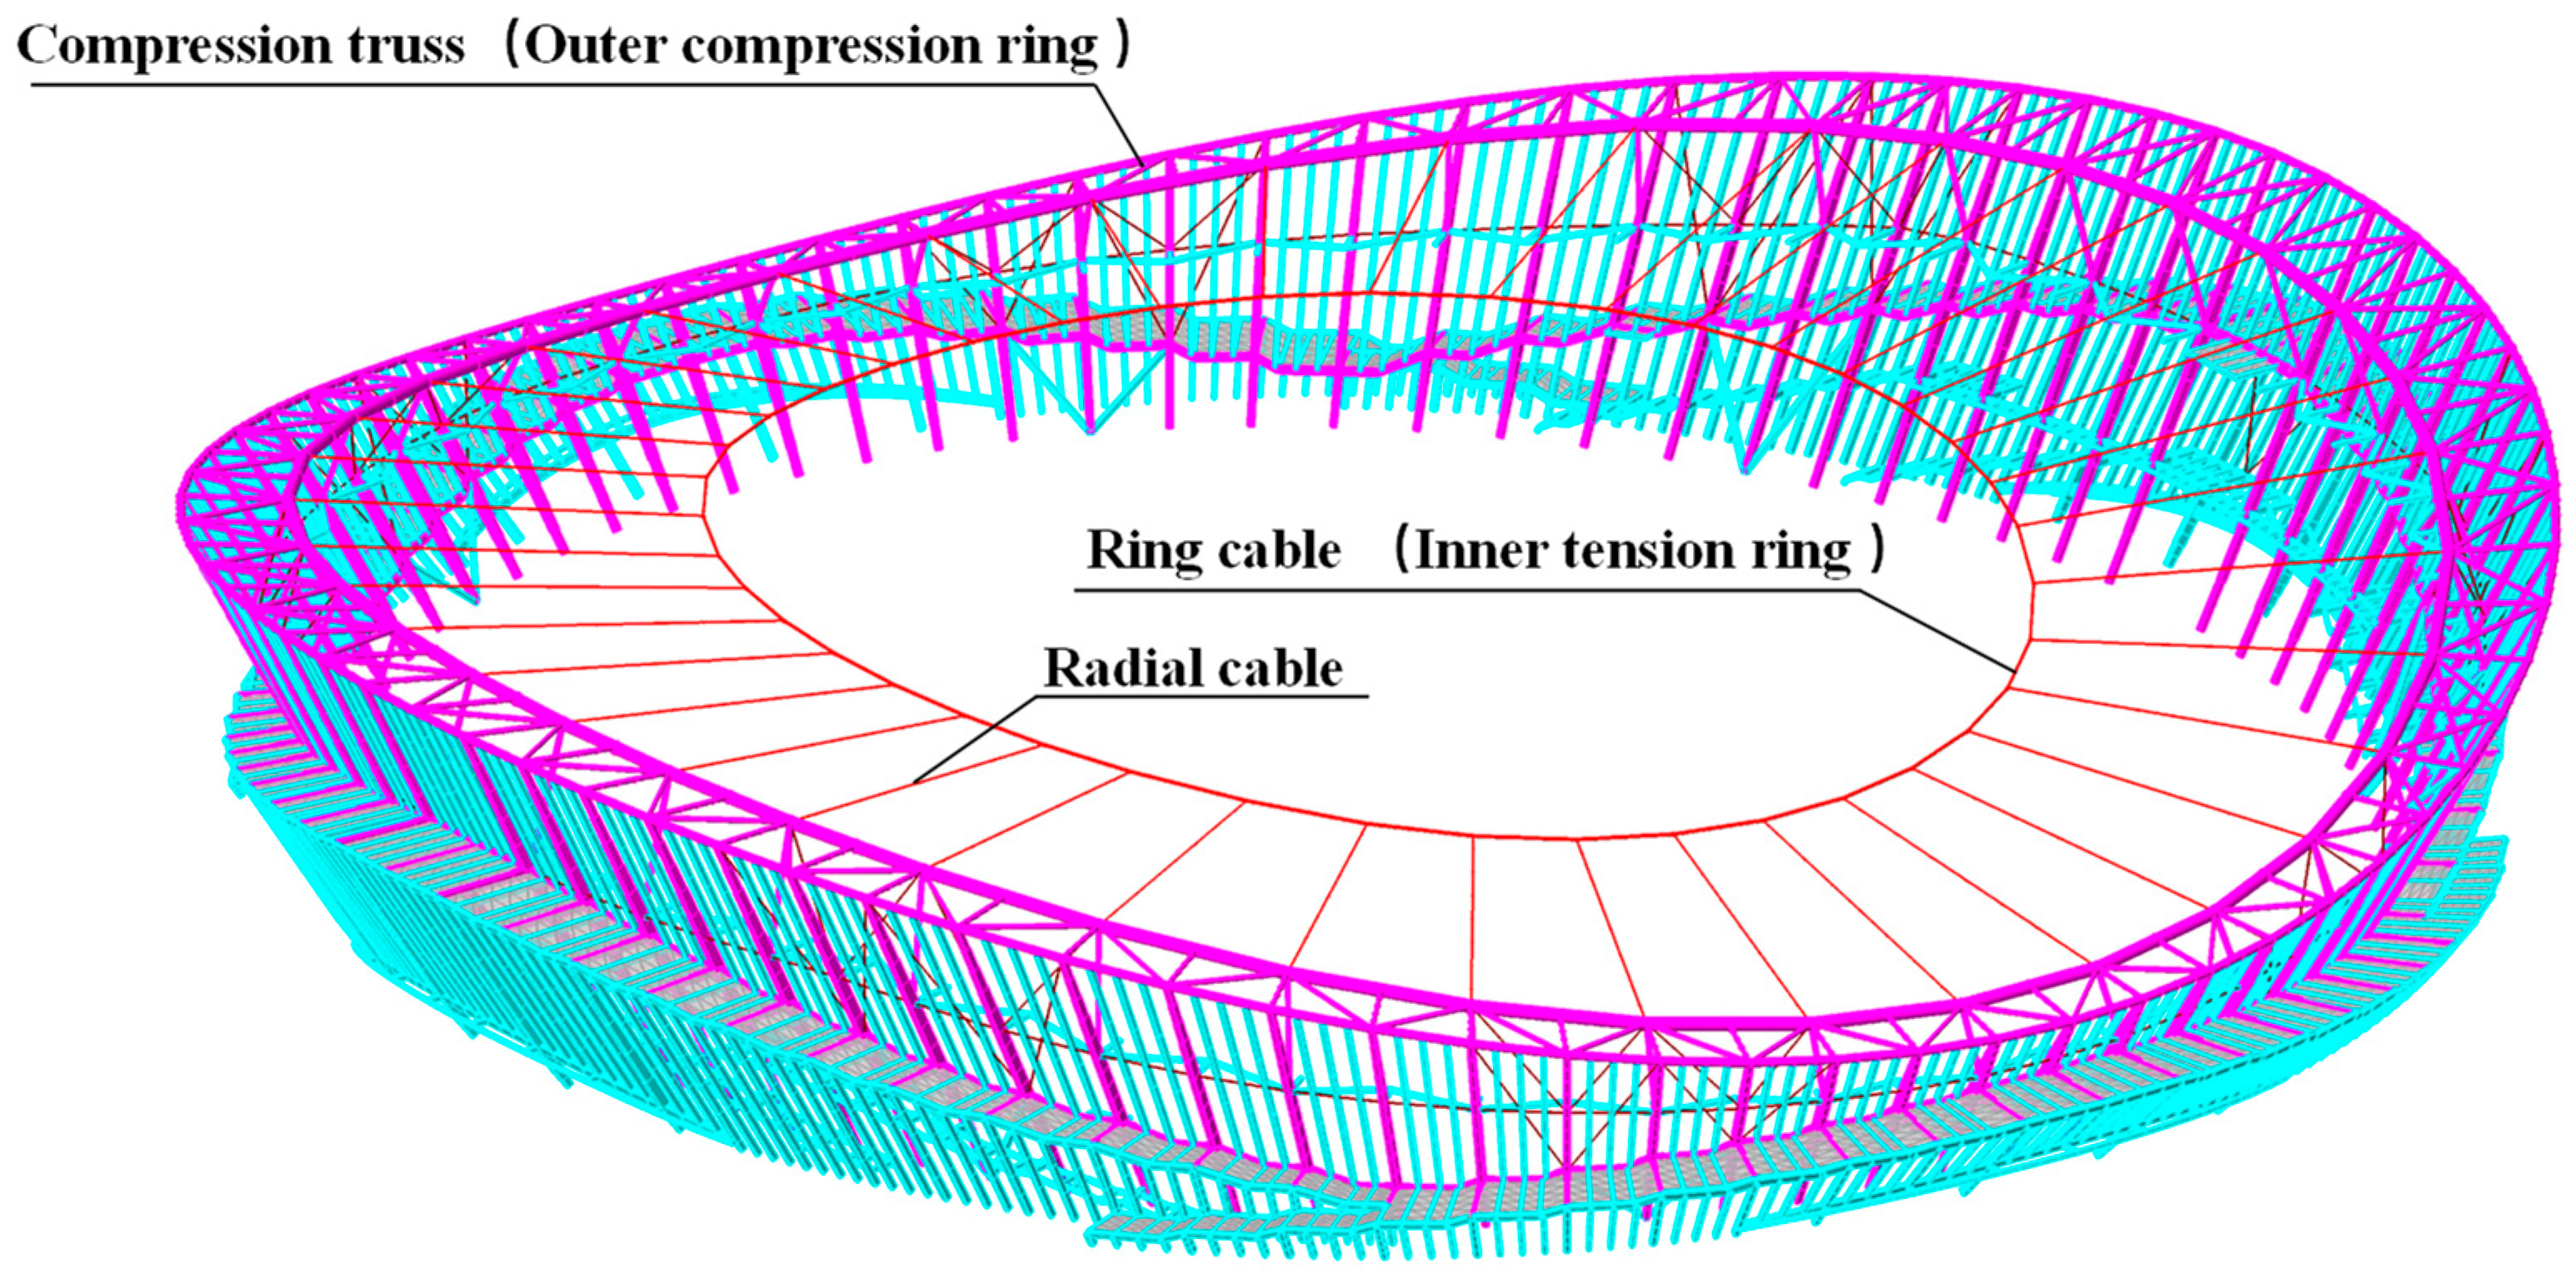
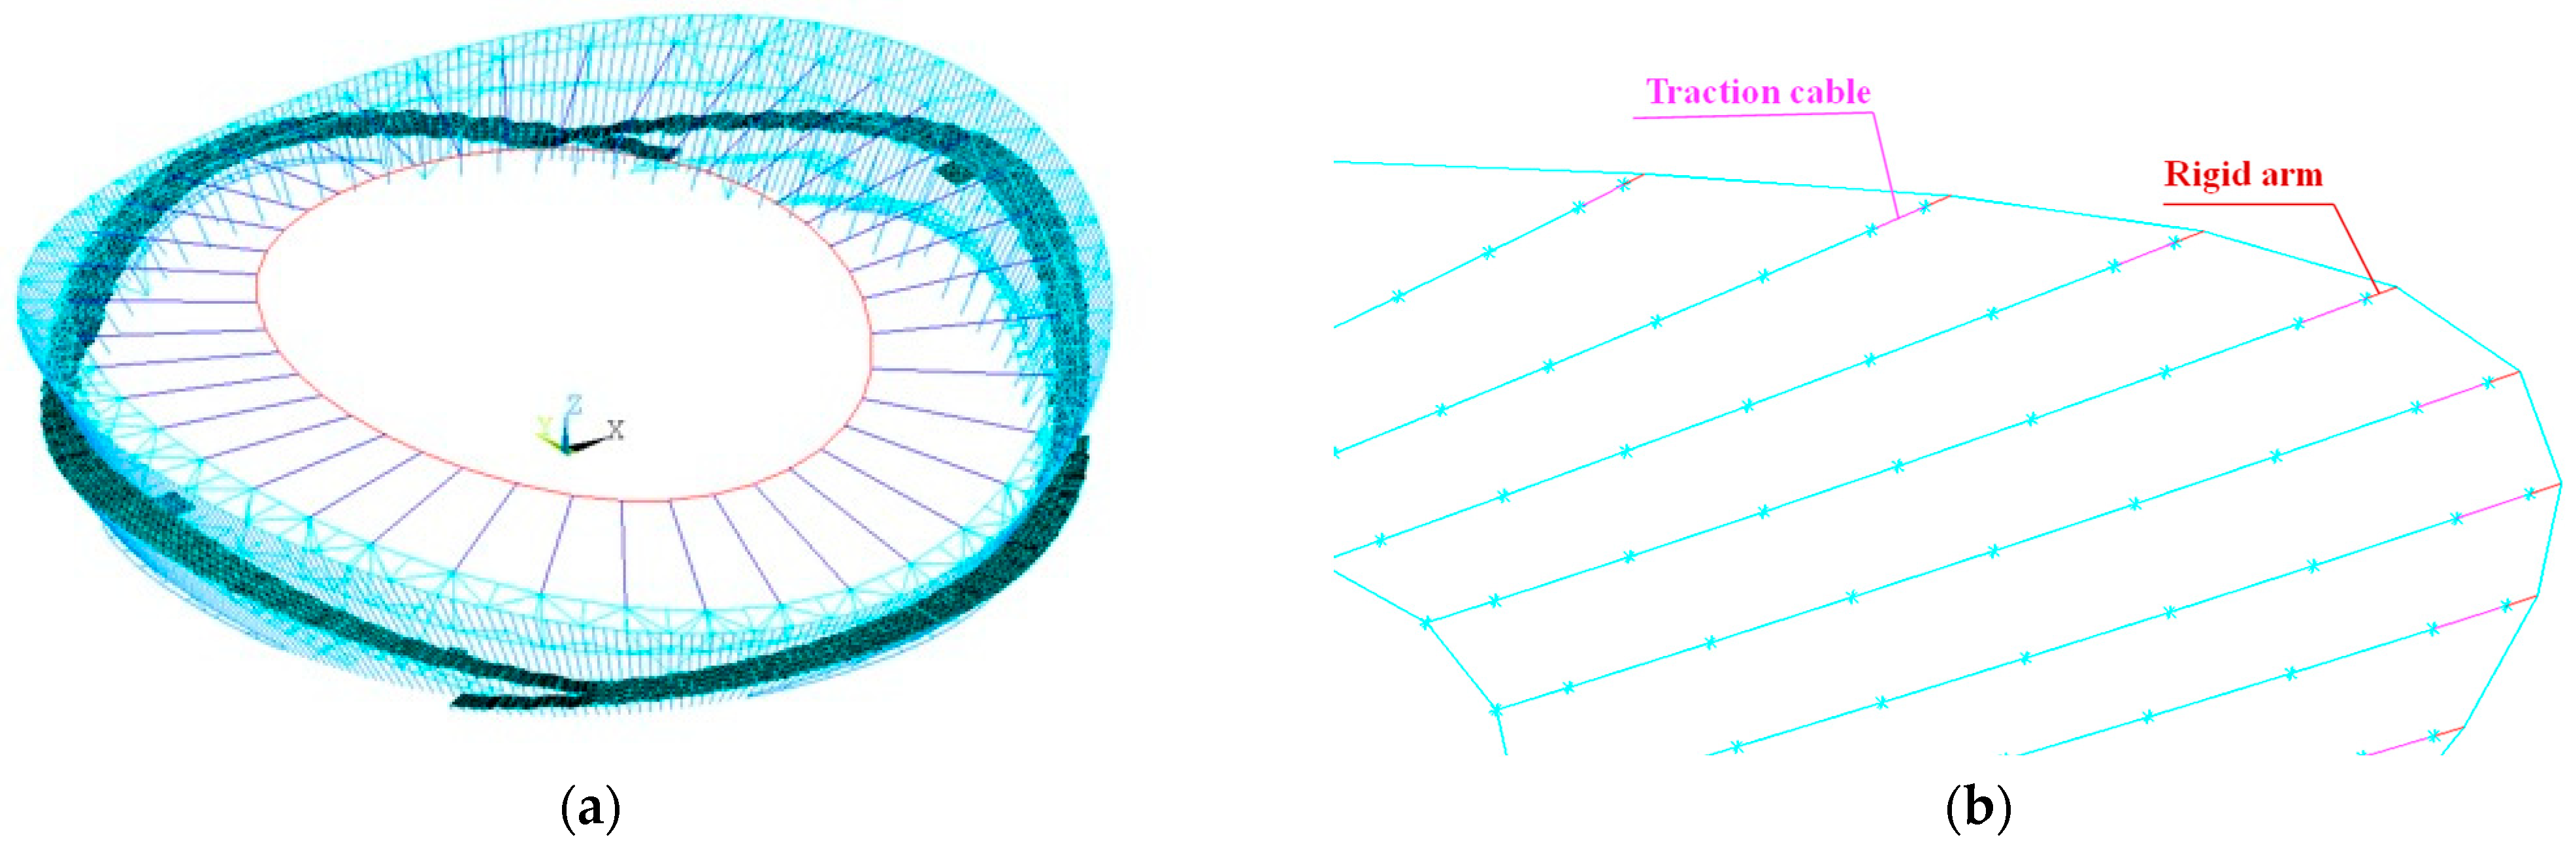
The finite element model of the structure was established in ANSYS 2019R1 according to the information from the structure designer, and the finite element analysis of the construction process was carried out. The finite element model in ANSYS included the outer steel compression truss, radial cables, ring cables, and clamps, as shown in 
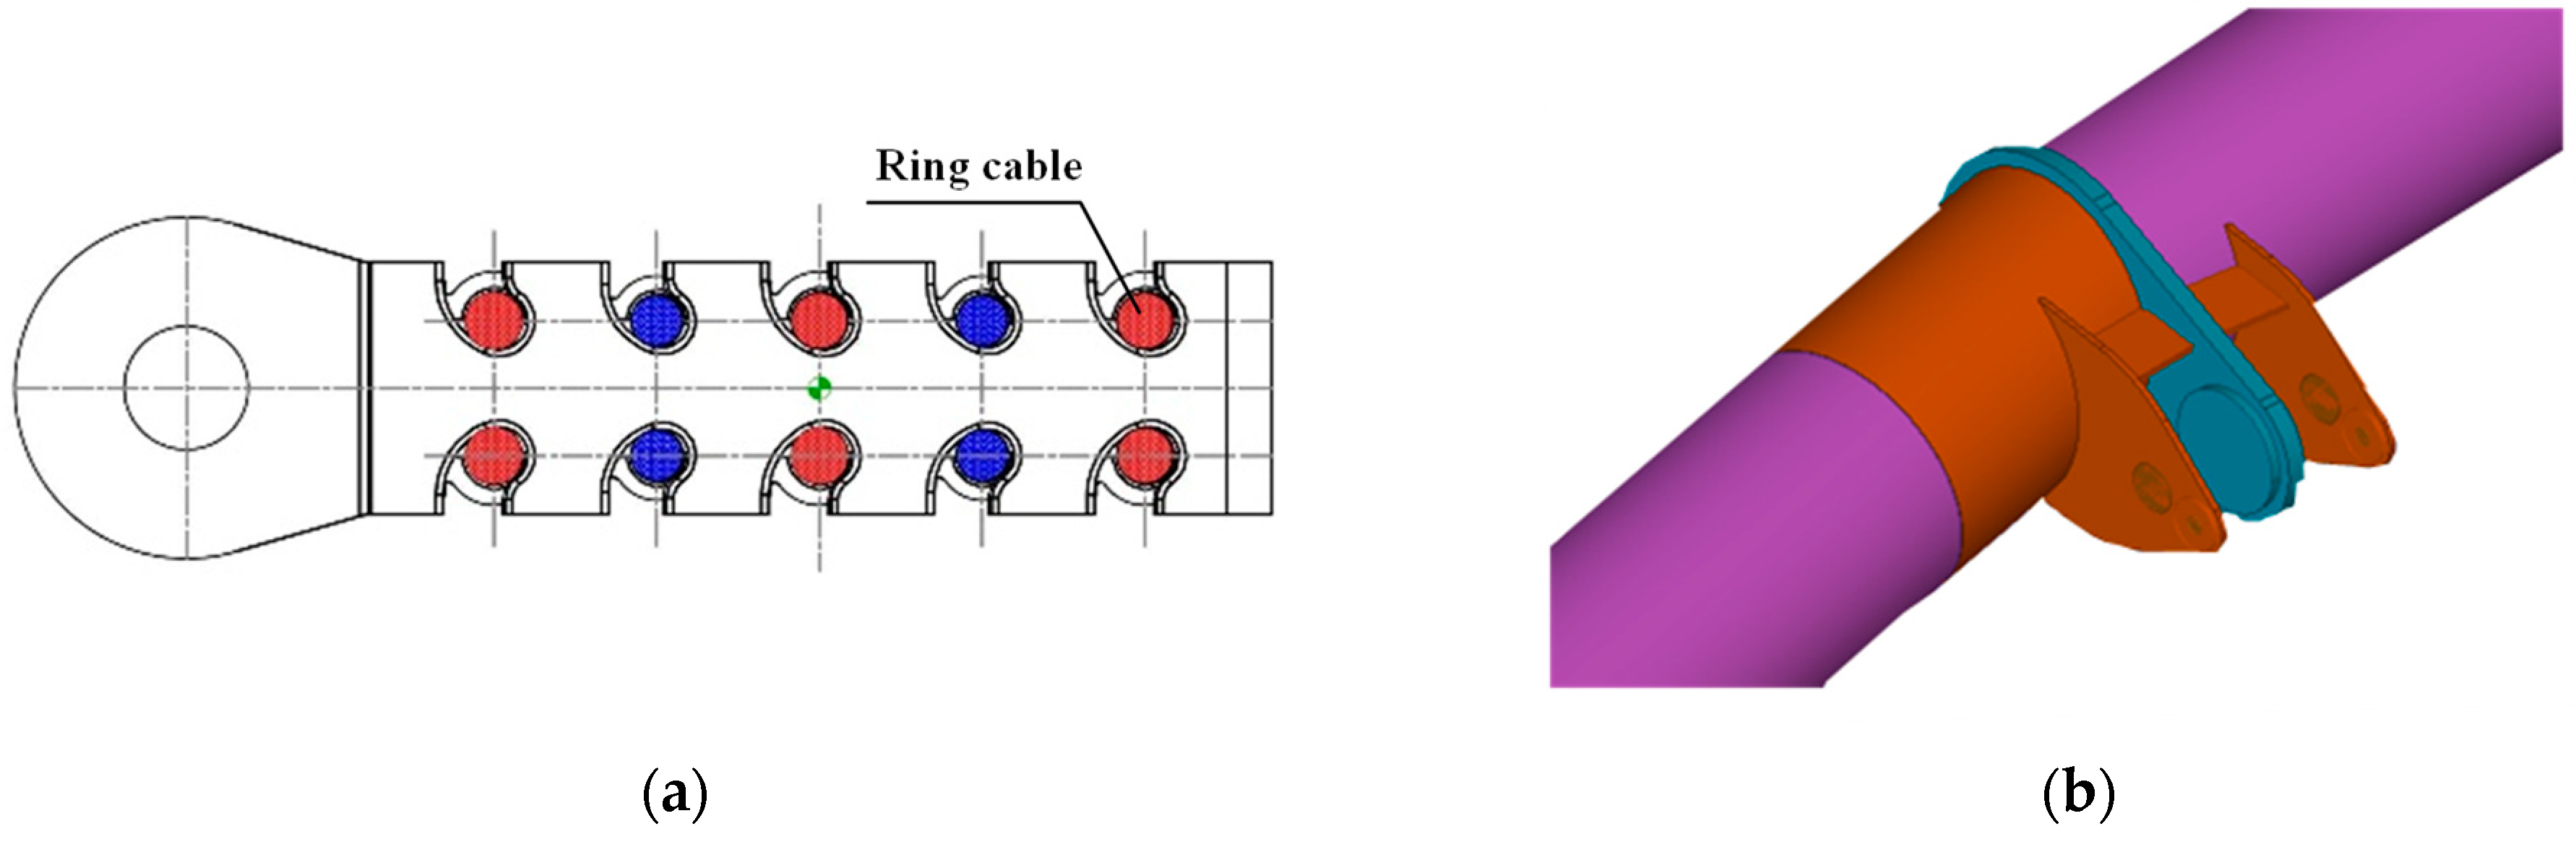
Figure 7a. In ANSYS, traction cables were modeled, and rigid arms were established to simulate the pin-connected plate that connected the radial cables to the outer compression truss, as shown in Figure 7b.
Figure 7.
Finite element model in ANSYS. (a) Overall model. (b) Traction cables (pink) and rigid arms (red).
According to the connection form and force characteristics of different components, the appropriate element type and set element conditions were selected, as shown in Table 2. For this single-layer cable structure, most of the steel structure (BEAM or LINK element) was divided into one unit, and the longer element was divided into 3~5 elements. In order to accurately simulate the cable structure (LINK180 element), each ring cable was divided into ten elements, and each radial cable was divided into eight elements.
Table 2.
Type and condition of the elements.
The loading conditions were 1.0 times the structural self-weight and 1.0 times the cable prestress. The acceleration of gravity was 9.806 m/s2, and the self-weight was automatically calculated by ANSYS. Each clamp of the inner ring cable weighed 5.2 tons and each clamp of the radial cable weighed 0.2 tons, both of which were modeled by the MASS21 element. The surface load of the PTFE membrane surface was 0.15 kN/m2. The prestress (P) was applied to the cable by means of the equivalent temperature difference given by Formula (1).
where E is the elastic modulus, A is the section area, and is the coefficient of linear expansion.
3.3. Nonlinear Dynamic Finite Element Method (NDFEM)
Before the nonlinear dynamic analysis, the structural self-vibration mode of the engineering project was studied. Assuming that the undamped free vibration of the multi-degree-of-freedom structure system was simple harmonic motion, the following formula can be obtained:
where , , , and are the stiffness matrix, mass matrix, displacement component, and natural circle frequency of the structure, respectively. By solving Equation (2), the natural frequencies of each order of the structure can be obtained. In ANSYS, considering the stress hardening effect, the mode of modal analysis adopted a 1.0 dead weight and prestress. The natural frequency of each order is shown in Table 3. The first four modes were mainly vertical vibration of the cable network, and the local torsion in the cable network plane began from the 5th mode.
Table 3.
The first 20 order natural vibration period and frequency statistics table.
The above results show that the basic frequency of the structure was 0.430 Hz, the basic period was 2.236 s, and the vibration frequency distribution was relatively dense. The early mode was vertical vibration, and the local in-plane torsion appeared in the later stage.
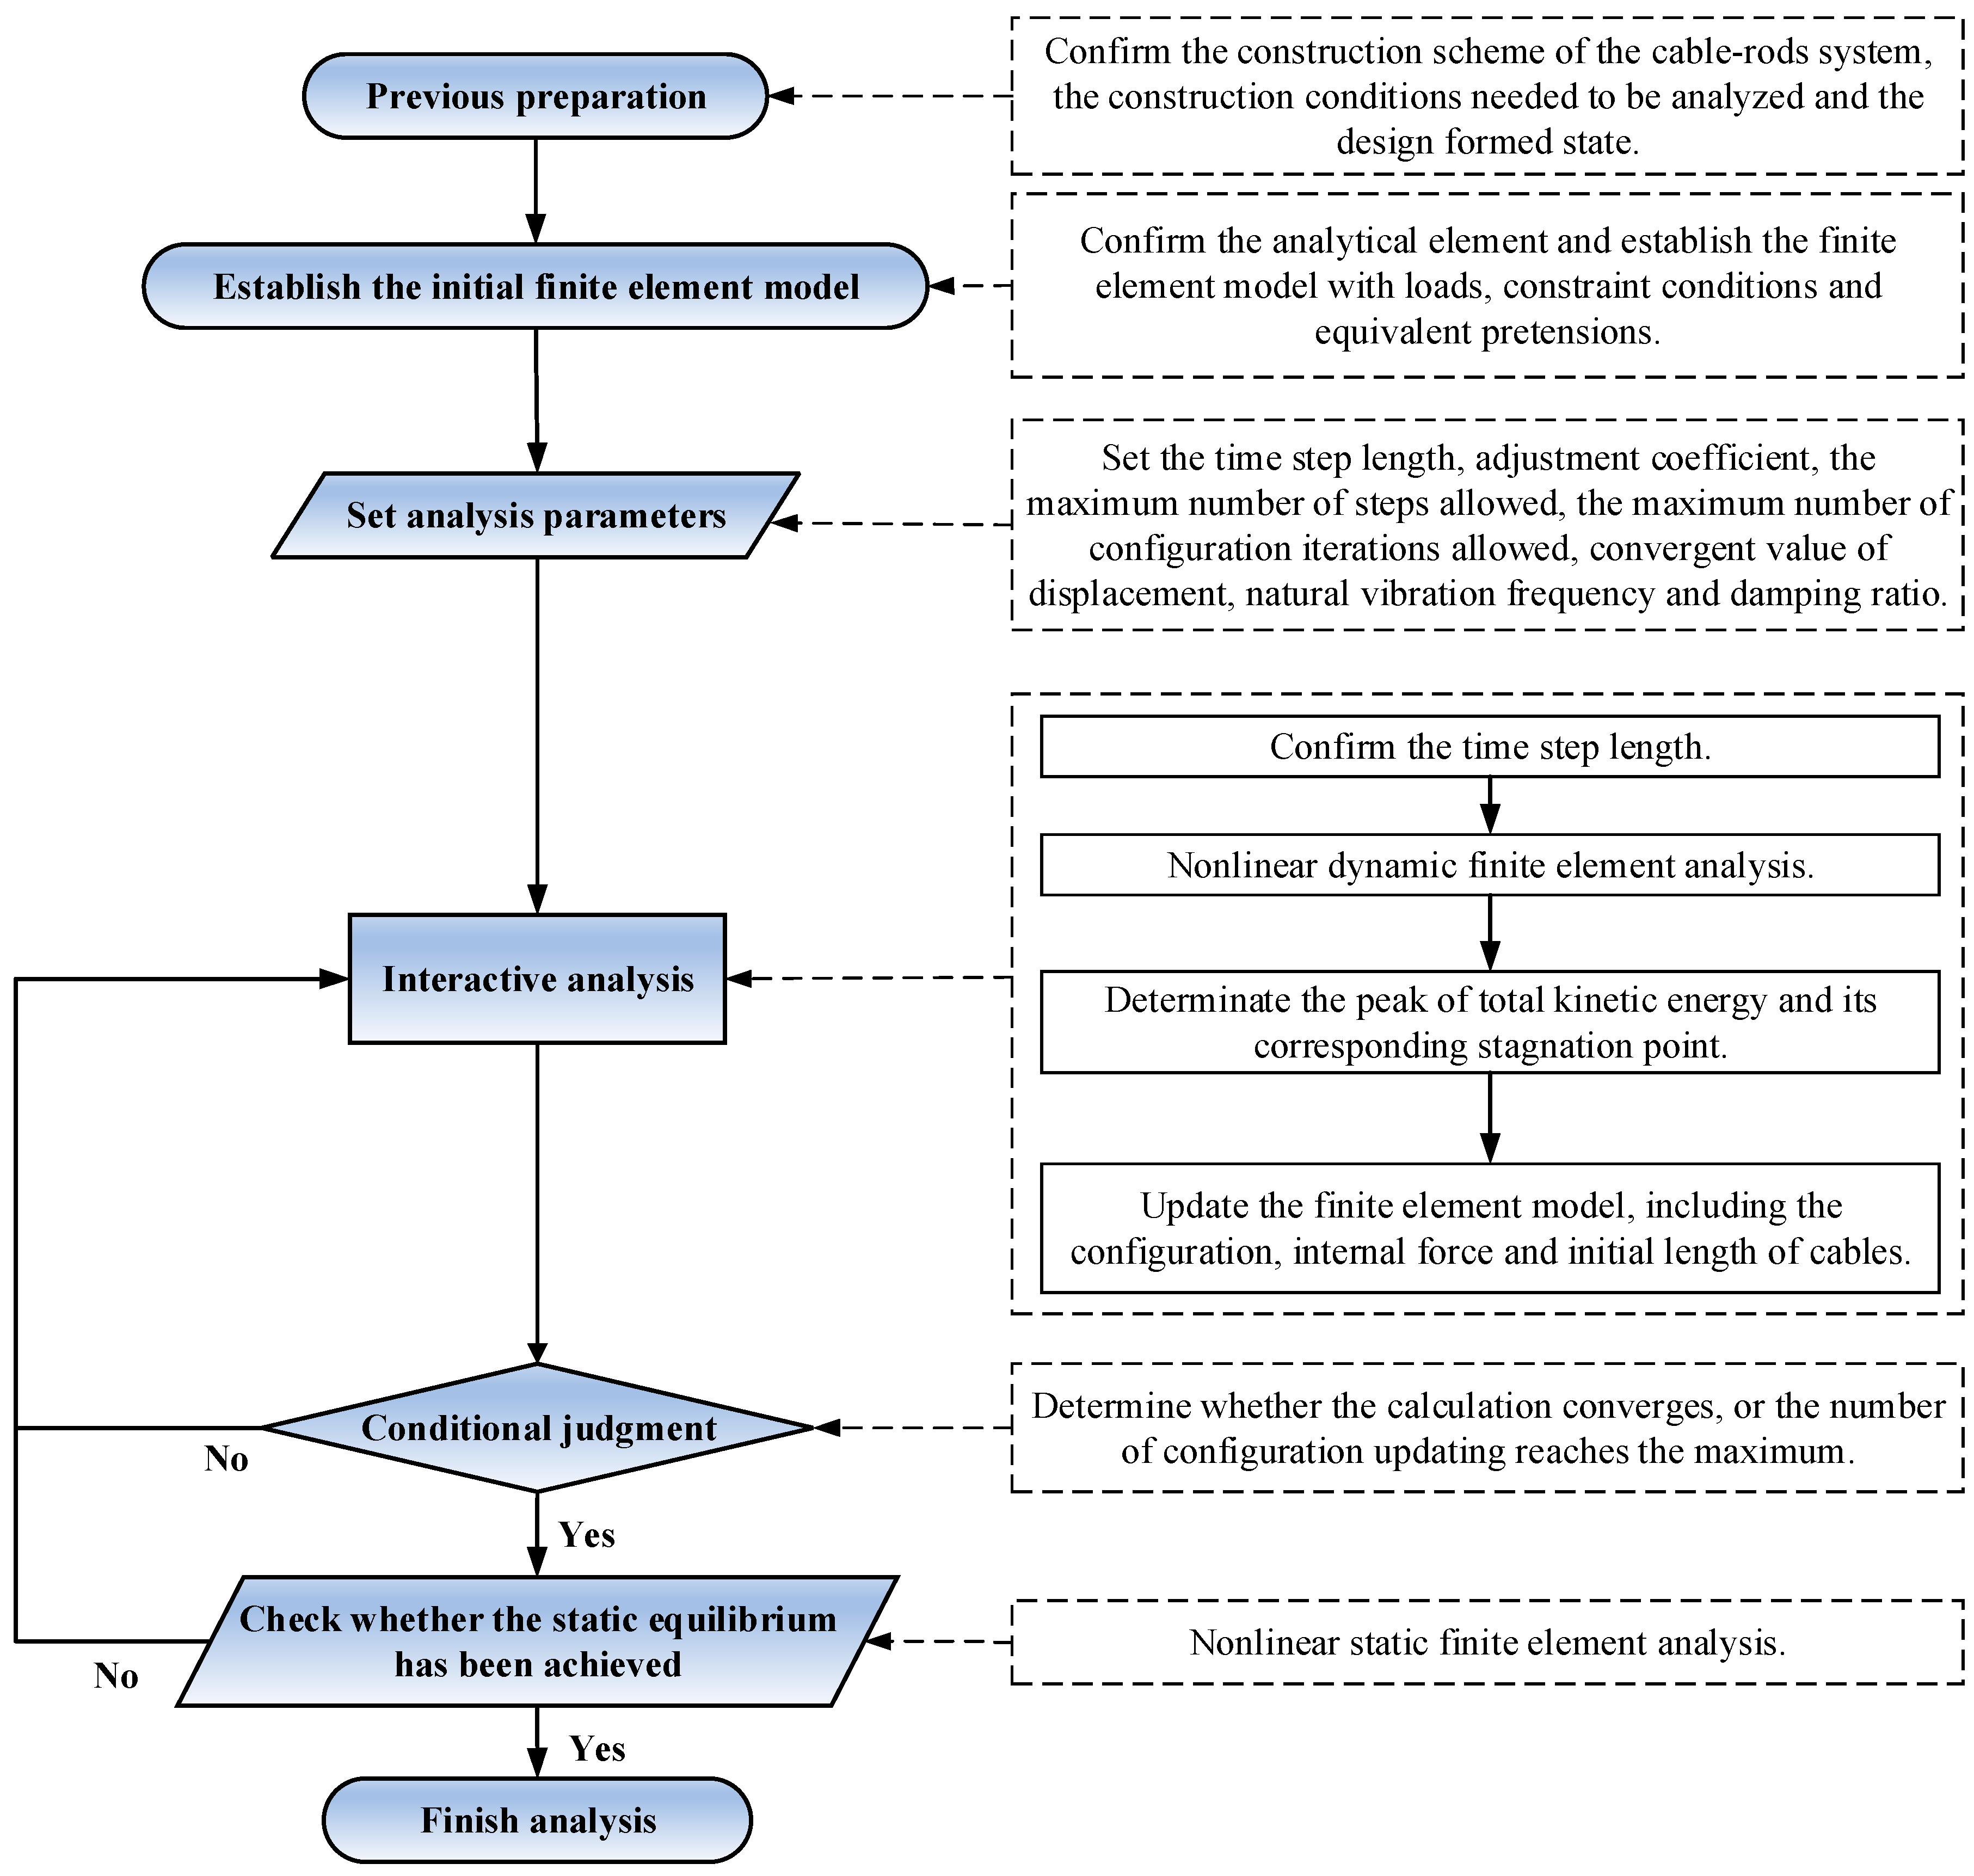
The construction process analysis of the single-layer structure net was based on the nonlinear dynamic finite element method (NDFEM) proposed by Luo [24]. Based on the theory of nonlinear dynamics, this method added the virtual inertial force and viscous damping force to establish the nonlinear motion equation of the whole structure, transforming the static problem into a dynamic problem. The NDFEM makes the dynamic equilibrium state gradually converge to the static equilibrium by iteratively updating the configuration of the finite element model. The cable net structure was in a static unbalanced state before the analysis and in the static balanced state during the analysis. Whether the structure is in static equilibrium or not will be determined according to the peak kinetic energy and time stagnation point obtained in the virtual dynamic process. When the finite element model converged, the nonlinear static analysis was carried out to check the static equilibrium state. The detailed flowchart of the NDFEM is shown in Figure 8.
Figure 8.
Analytical procedure of the NDFEM.
Setting the time step length, the determination of the peak of total kinetic energy, and its corresponding stagnation point are the significant technical measures of the NDFEM.
1. Setting and adjusting the time step length
Time step length, , is one of the key factors that determine the convergence speed and efficiency of NDFEM. A lower can make the iteration of the dynamic equilibrium easier to converge as well as lead to the increase in the total time steps required to achieve static equilibrium and the decrease in calculation efficiency. An acceptable time step should ensure that the total kinetic energy reaches its peak in less time steps under the premise of the convergence of dynamic analysis. The NDFEM can be divided into three stages, as shown in Table 4.
Table 4.
Stages of the NDFEM form-finding analysis.
Considering that the time step has an important influence on the dynamic balance iteration and analysis efficiency, the time step adjustment coefficient was used to automatically adjust the time step of each dynamic analysis in the analysis process, and the adjustment strategy is as follows:
(1) The initial time step length is used in the first iteration.
(2) If the time step arises and the total kinetic energy does not decrease when conducting the (m − 1)th times dynamic analysis, the time step length of the (m)th times dynamic analysis will be adjusted to automatically.
(3) If the (m − 1)th times dynamic analysis does not converge, then .
2. The peak of total kinetic energy () and its corresponding stagnation point
The calculation of the kth time step total kinetic energy in the dynamic analysis is as follows:
The deterministic strategy of the peak of total kinetic energy () and its corresponding stagnation point are as follows:
(1) Adjust ;
(2) When the kth time step converges iteratively, if , , the total kinetic energy does not reach its peak, so continue the dynamic analysis and enter the (k + 1)th time step. If , , make the total kinetic energy of the three continuous time steps fit with a quadratic parabola curve and calculate the peak value of the total kinetic energy and its corresponding time stagnation point. If , , then , .
(3) When the kth time step does not converge iteratively, if k = 1, adjust the time step and enter the next dynamic analysis. If 1 < k , ,.
The NDFEM method can greatly improve the operation efficiency by using appropriate time steps, and the analytical results are stable and accurate. Up to now, the NDFEM method has been applied in the construction simulation analysis of some cable structures and guided their construction successfully. Single-layer cable and double-layer cable structures have been included in Suzhou Industrial Park Stadium [27], Suzhou Swimming Stadium, Sanya Stadium, Leshan Olympic Sport Center Stadium, Linyi Sport Center Stadium, and Desheng Sport Center Stadium.
3.4. Analysis, Results, and Discussion: Finite Element Simulation of Construction Process
The cable net will be anchored from area A to area C during construction. The value of cable forces is small in the early stage, so the length change of the traction cables can be fast. Subsequently, the cable forces become bigger, so the length change of the traction cables should be slower to control the cable force and configuration accurately. According to the above, the construction process analysis was divided into 11 construction conditions, as shown in Table 5.
Table 5.
Analysis conditions of the whole process of construction.
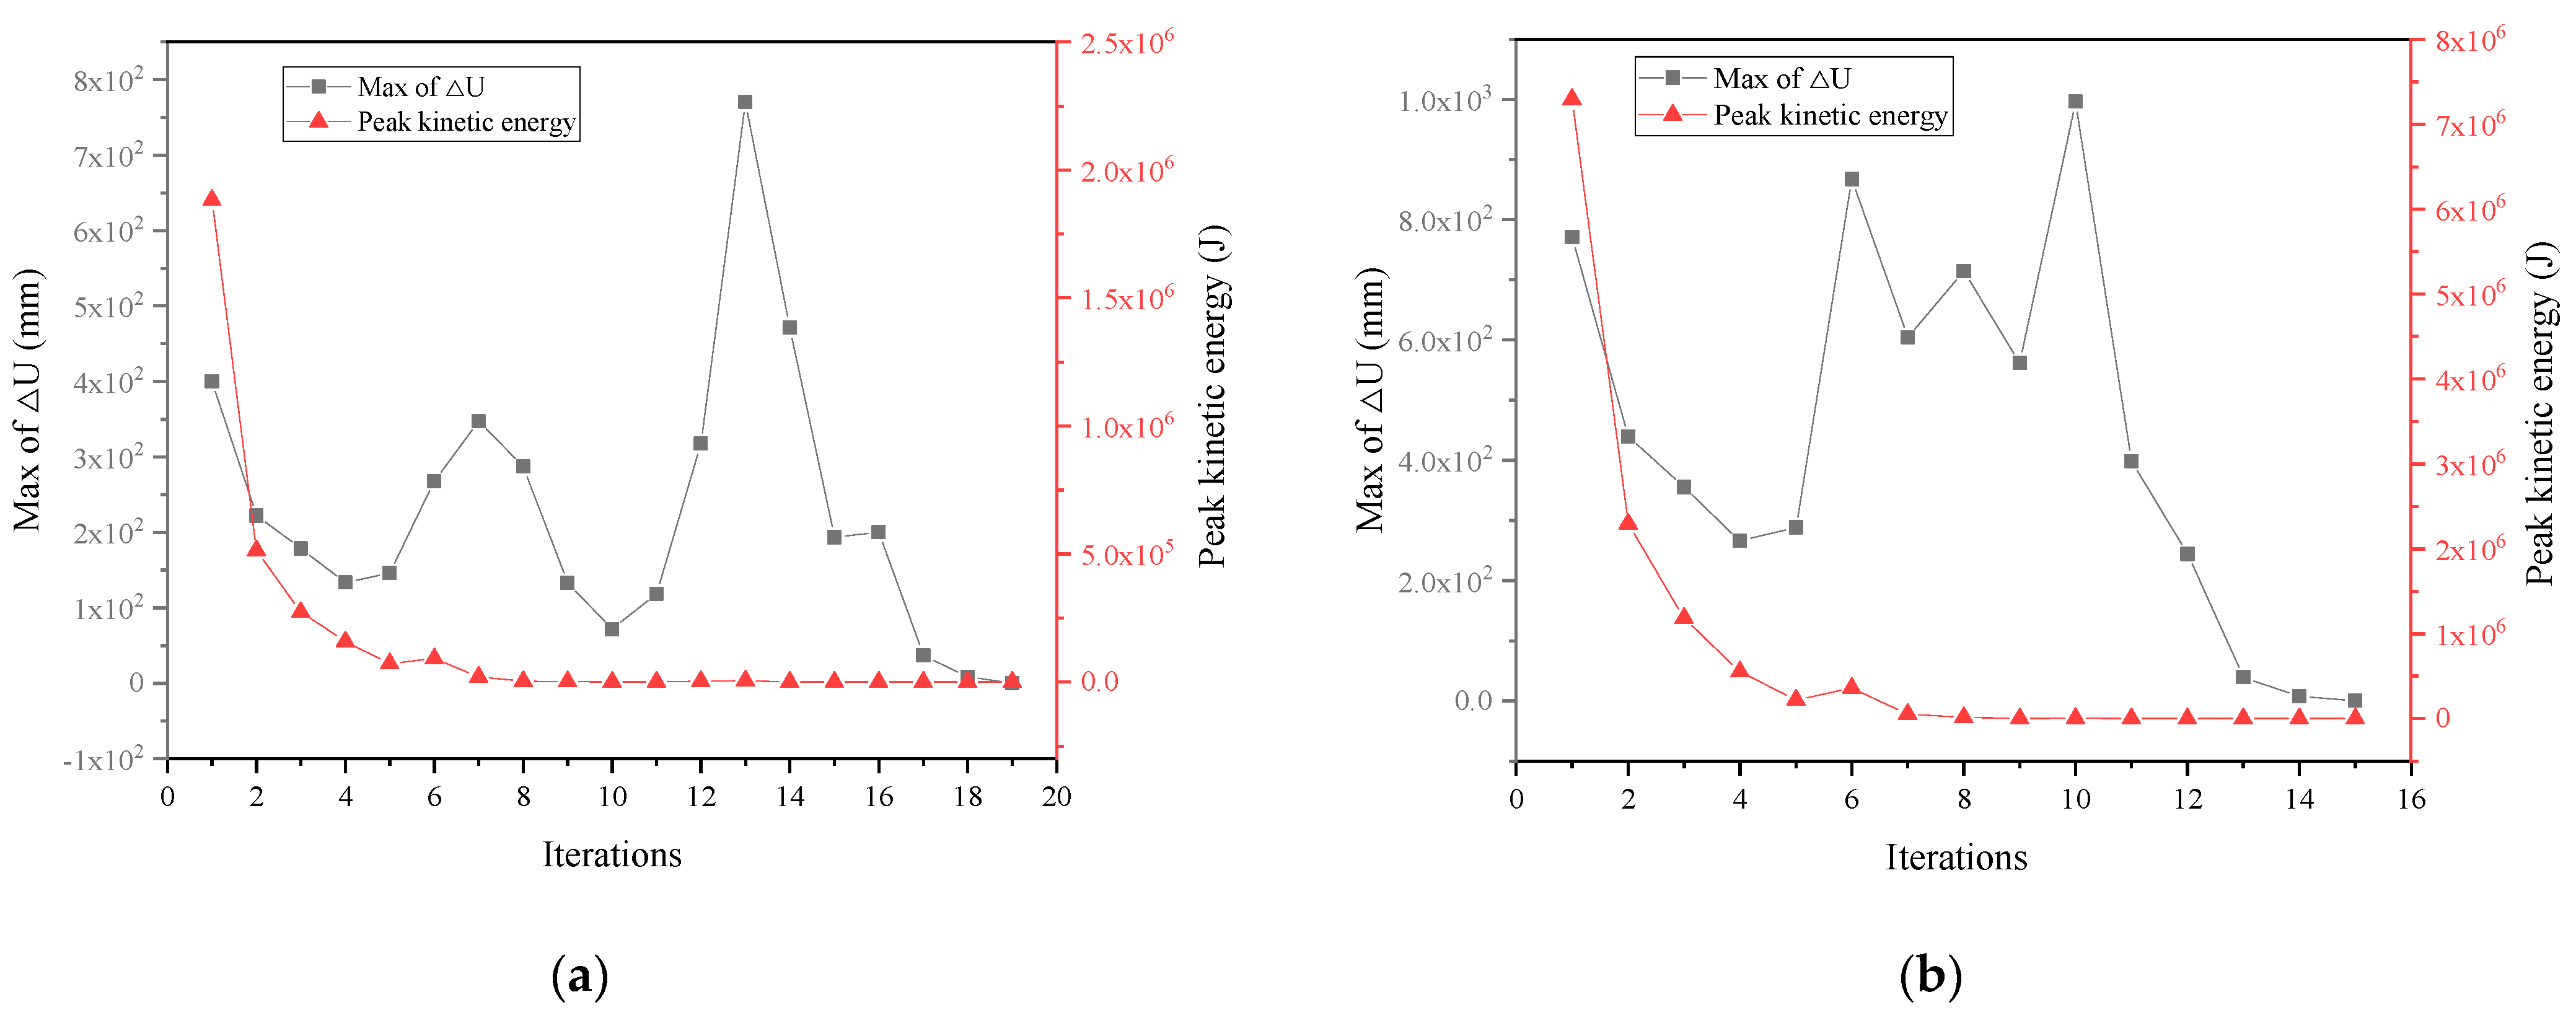
In order to check the convergence performance of the nonlinear iteration of the NDFEM, the inverse process of cable net hoisting in two stages, GK6 and GK7-GK11, was tested. That is, the cable network was lowered to the specified position by lengthening the traction cable. The iterative process is shown in Figure 9. The convergence standard of the maximum adjustment of cable structure coordinates was set to 1 mm. With the progress of iteration, the peak kinetic energy of the cable net steadily decreased until it was close to 0 mm. The maximum value of cable structure coordinate adjustment oscillated in the early stage, gradually decreasing steadily in the later stage. Finally, the iteration was completed when it was less than 1 mm, and the structural nonlinear calculation converged.
Figure 9.
Convergence check of iterative process using the NDFEM method. (a) GK6. (b) GK7–GK11.
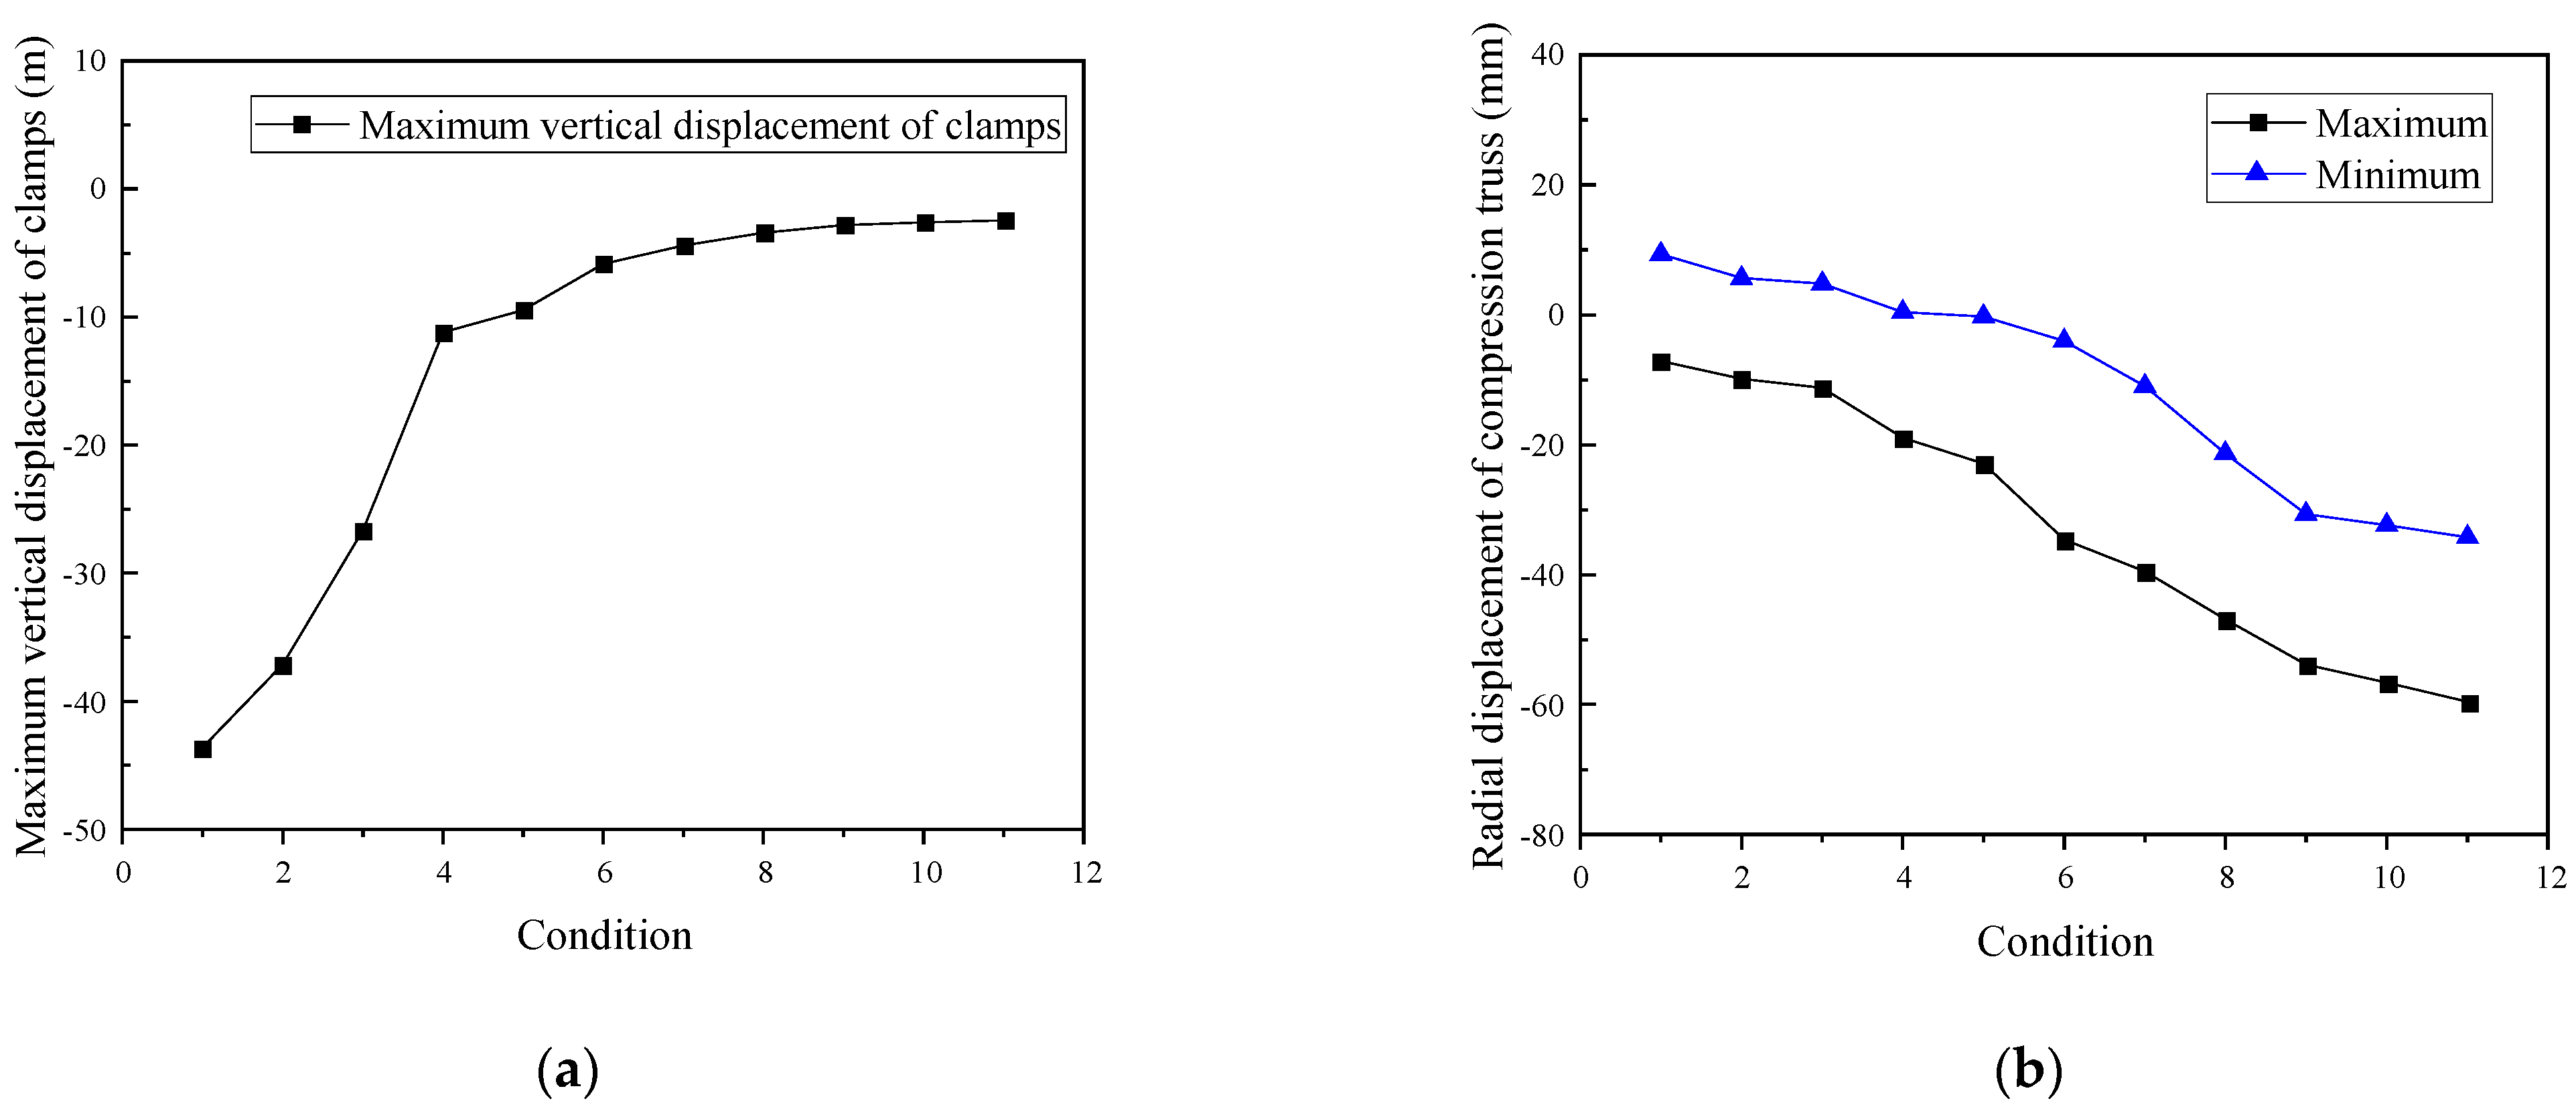
The NDFEM was applied to simulate the construction process of the cable structure in ANSYS. According to the results from ANSYS, we extracted the vertical displacement of the clamps and radial displacement of the outer compression truss, as shown in 
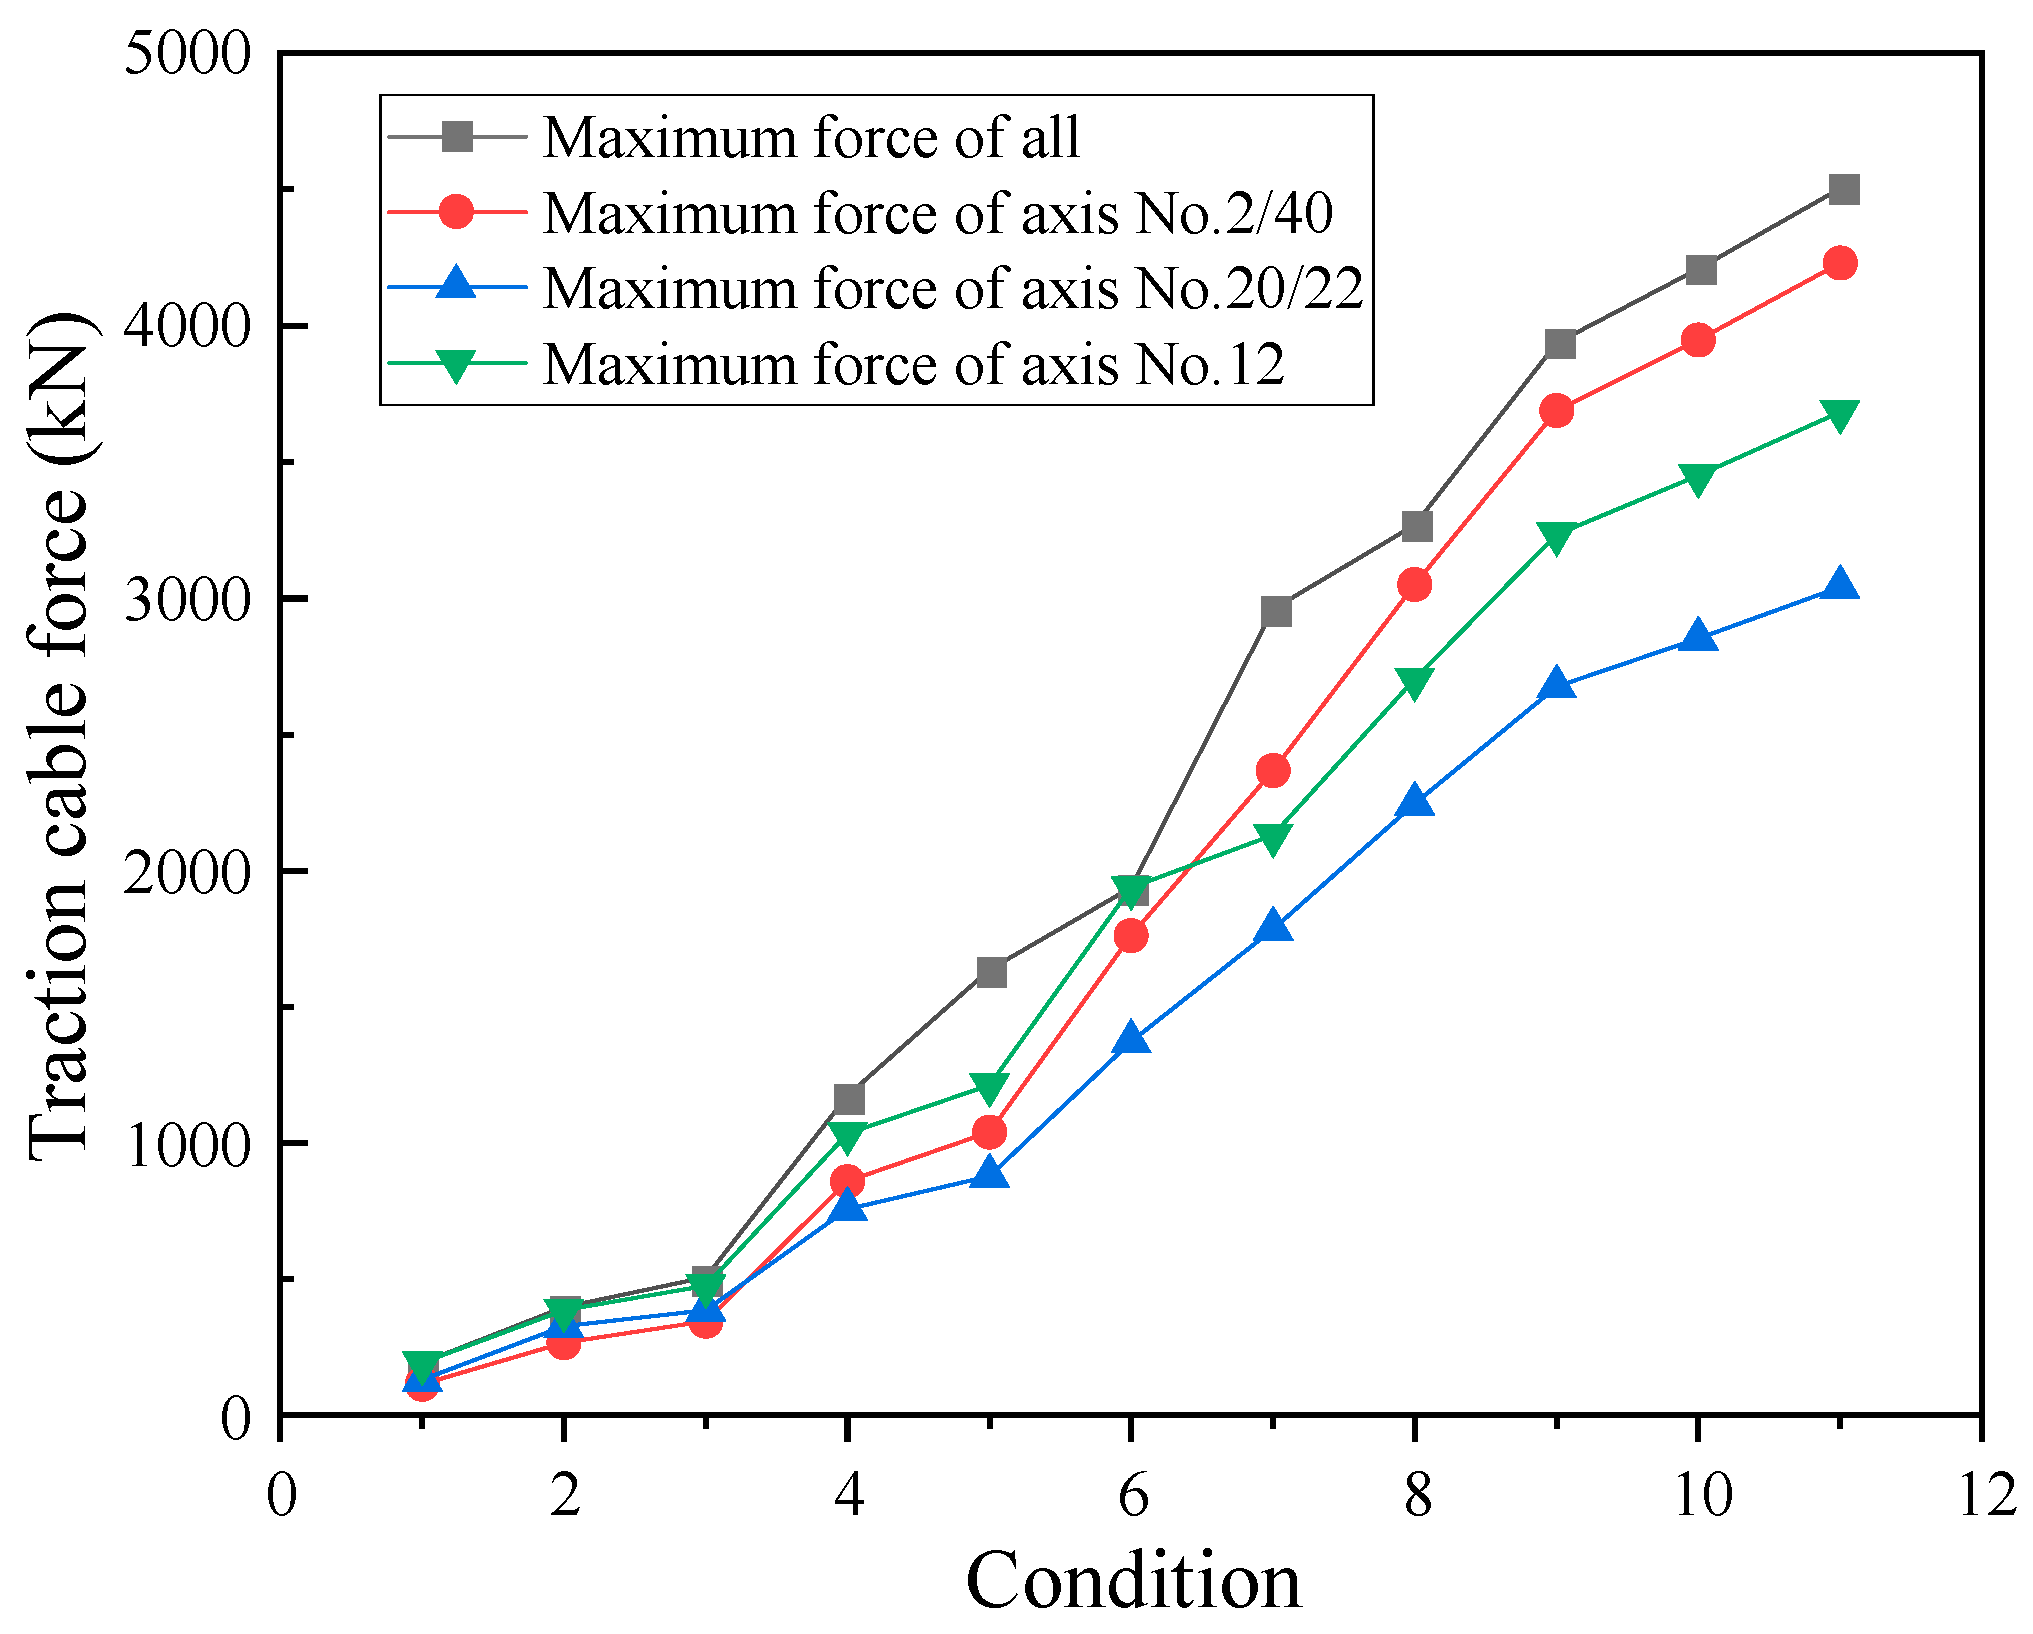
Figure 10. The maximum value of the traction cables is shown in Figure 11. From GK-1 to GK-4, it shows that the length change of the traction cables was relatively large and the elevation of the structure net rose rapidly, but the traction force varied little. In the meantime, the cable force transferred to the outer compression truss gradually, and the radial displacement of truss changed slowly. Starting with GK-4, there were 12 radial cables anchored, and the structure was close to being formed. The length of the traction cables changed less, and the cable net needed to be hoisted slowly because the traction cable force and radial displacement of the truss increased rapidly. It has been proven that the cable force of the single-layer cable net is very sensitive to the change in configuration when the structure approaches formation. It is also a characteristic of this full-tension structure. When the cable net accomplished tension (GK-11), the biggest value of cable force reached was 4504 kN, which is much less than the minimum breaking force of 24,200 kN. Furthermore, the forces of the traction cables in areas B and C were much less than those in the formed state.
Figure 10.
The change in structural displacement under 11 construction conditions. (a) Maximum vertical displacement of clamps. (b) Radial displacement of the compression truss.
Figure 11.
The change in maximum traction forces under 11 construction conditions.
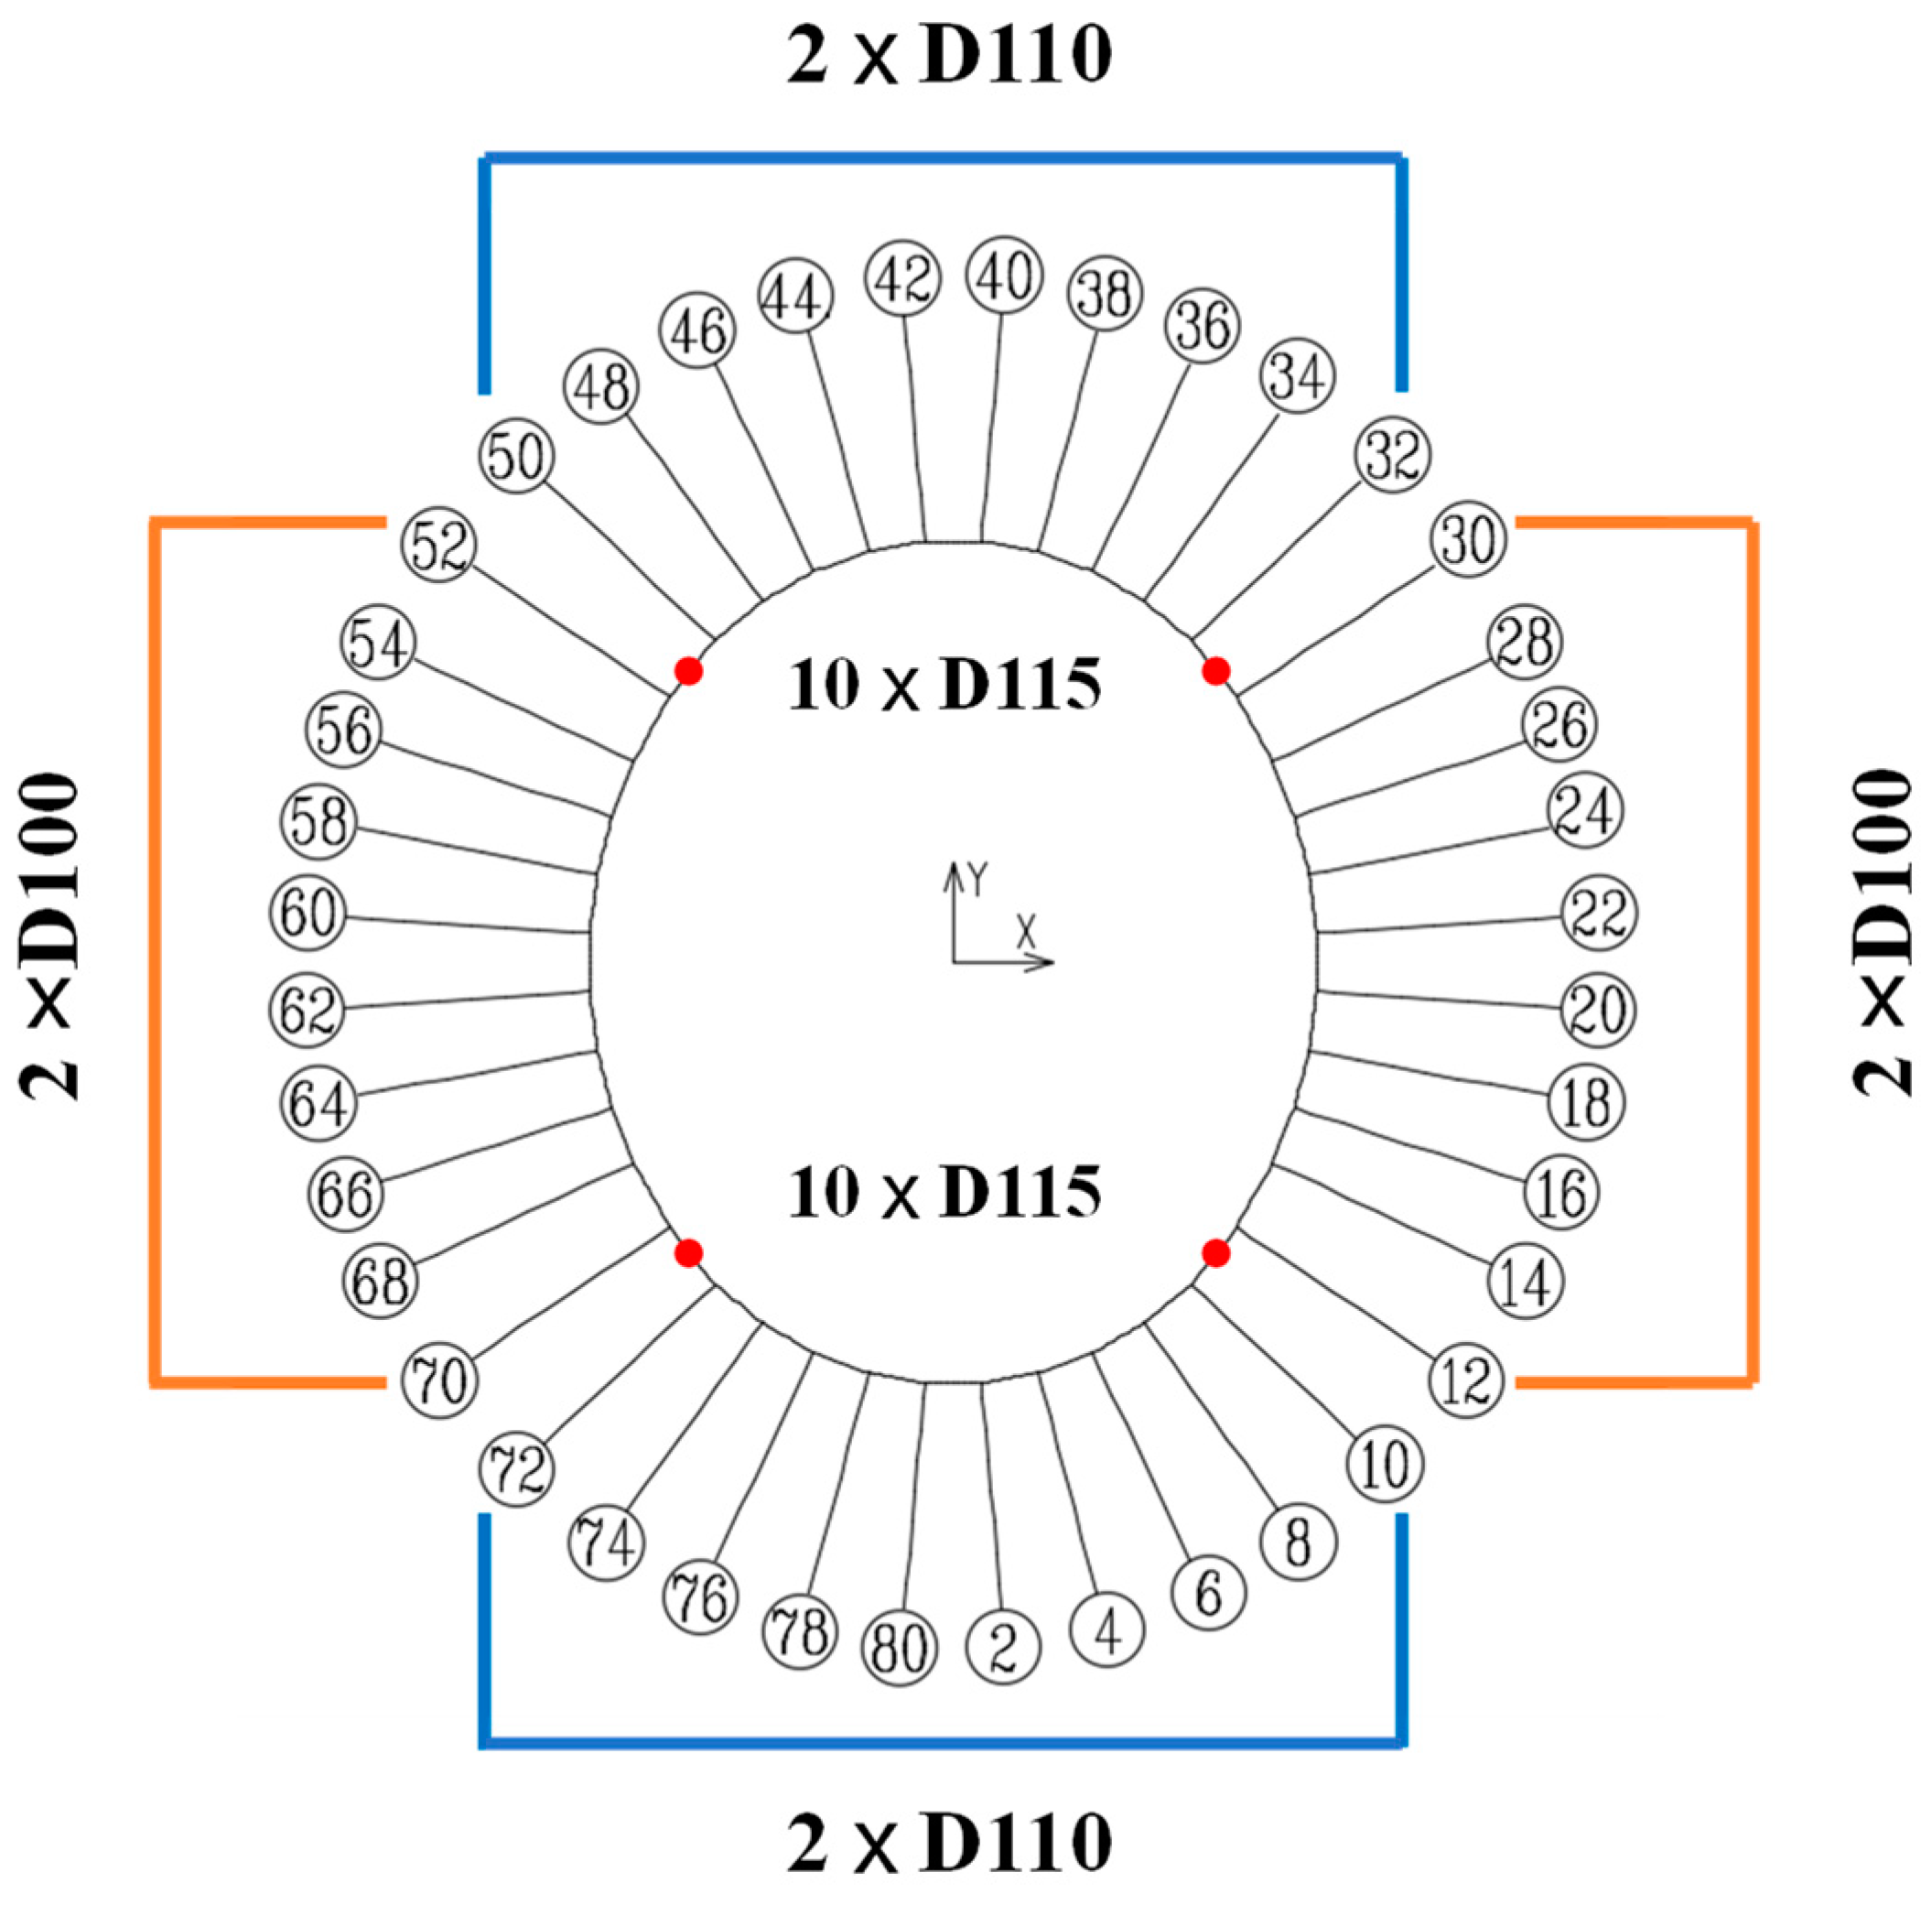
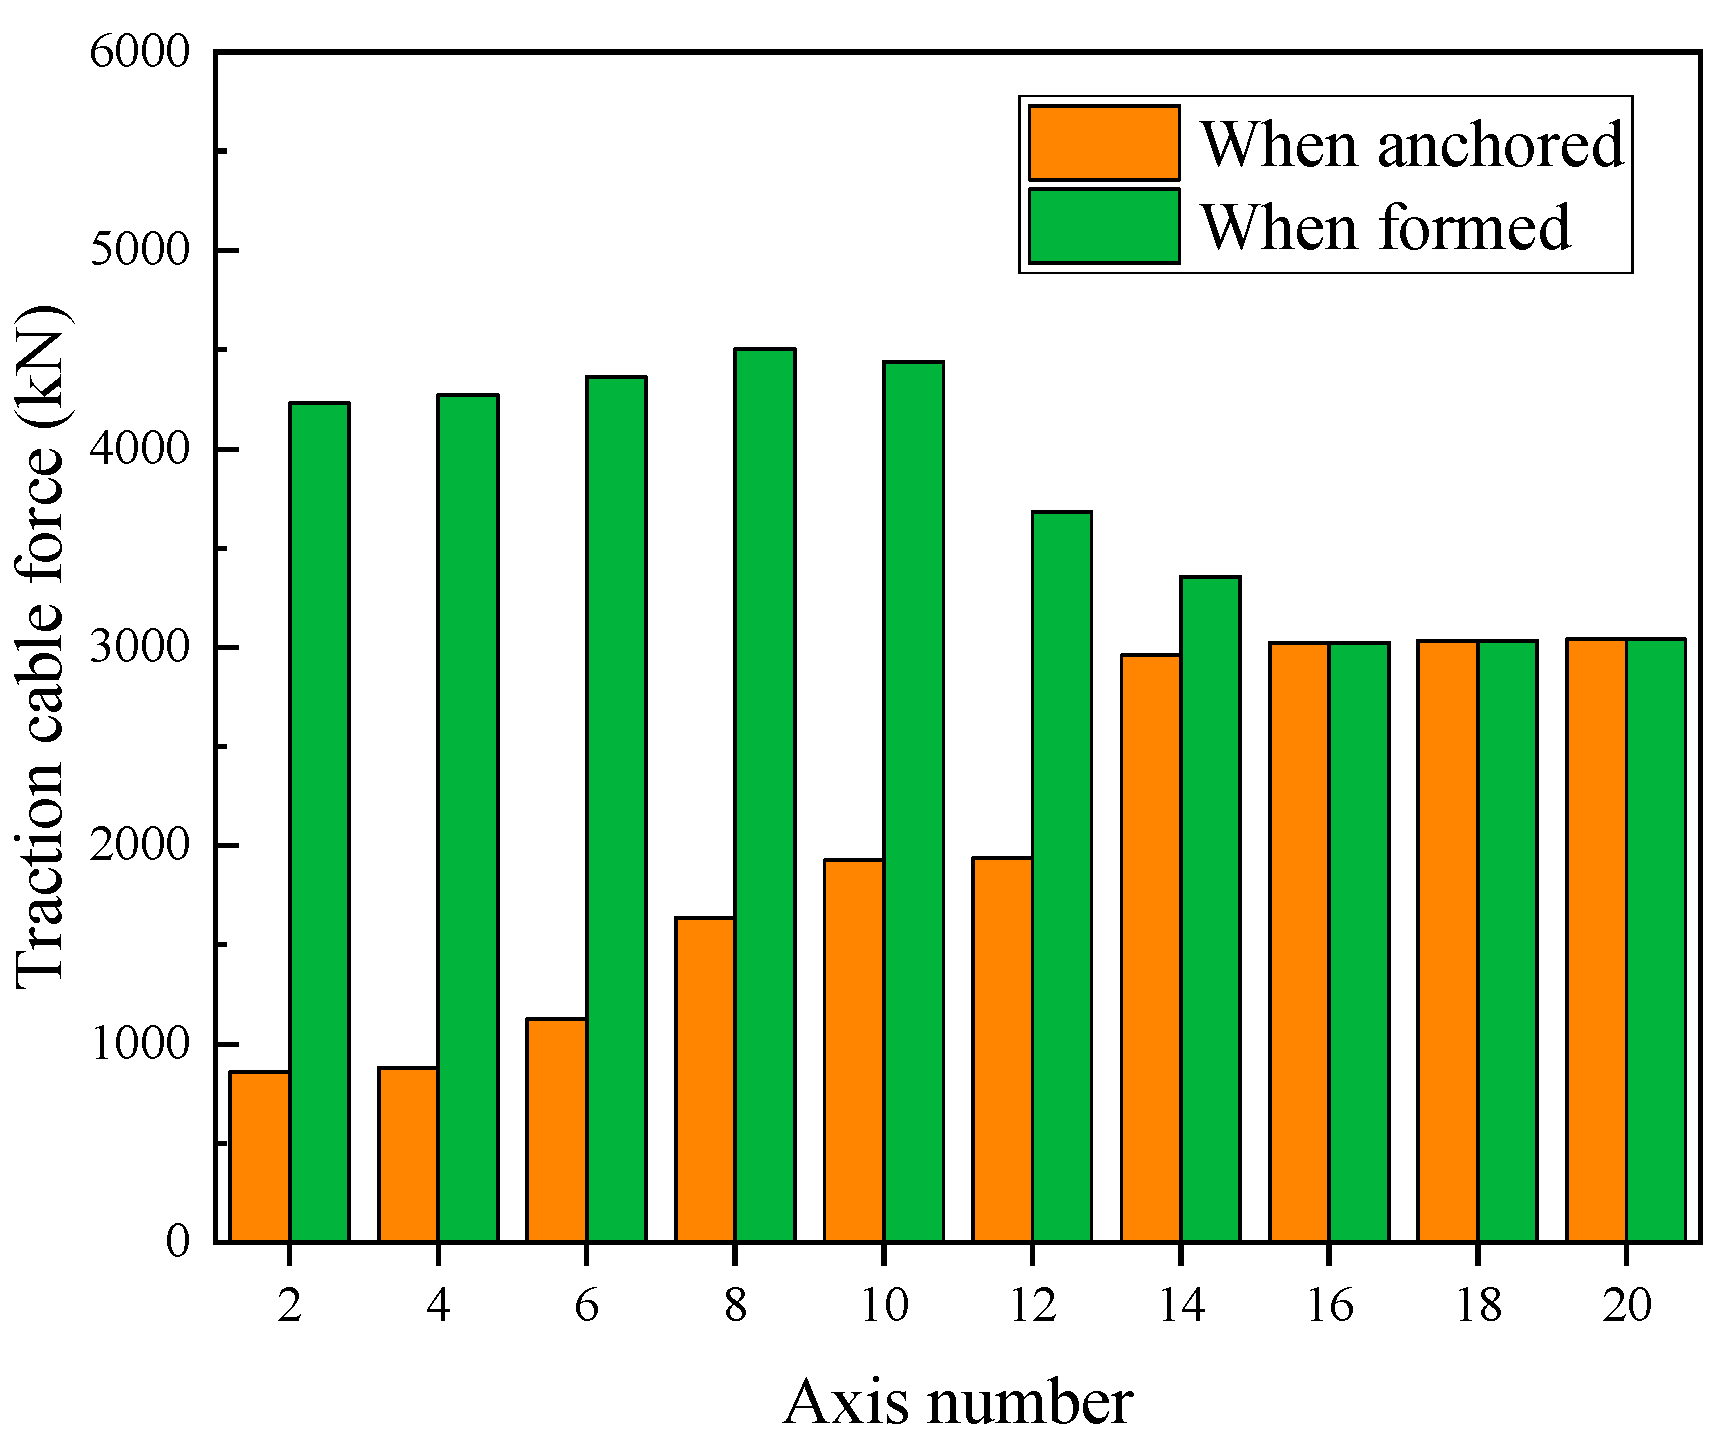
This engineering project is a quarter symmetrical structure, so the traction cable force in the symmetrical position is equal. After the axis number merged, the traction cable forces during construction were as shown in Table 6, where the bold and underlined value indicates the cable force under the current condition. It shows that the forces of the traction cables in area B/C were 1000 kN lower than those in area A when the structure formed. Because the cables in area B/C were anchored first, the traction forces when anchored were much smaller than those when formed in axis no. 2–12, as shown in Figure 12. Tensioning and anchoring in batches, compared to that synchronously, can decrease the traction forces and ensure the safety of cable construction. Furthermore, tensioning and anchoring in batches can reduce the labor cost of construction. All of these results prove the advantages of the method “tensioning and anchoring in batches”.
Table 6.
Traction cable forces under 11 construction conditions.
Figure 12.
Comparison of cable forces between the anchored and formed state.
Equivalent stress of the outer compression truss was obtained to ensure that the stress of the steel did not exceed the limits when the structure net was hoisted. The maximum equivalent stress of the outer compression truss in each construction condition is shown in Table 7. From GK-1 to GK-11, the equivalent stress of the outer compression truss increased, and the maximum value was 102.1 MPa, which was much lower than the design strength. It can thus be seen that the cable net and outer steel were safe.
Table 7.
The maximum equivalent stress of the outer compression truss.
To sum up, based on the NDFEM to analyze the construction process in ANSYS, the value and change in the cable net displacement, cable forces, and steel equivalent stress were obtained. The results showed that there was a large security redundancy and the construction method had a considerable advantage.
4. Data Acquisition and Comparison of Configuration Automatic Monitoring System (CAMS)
4.1. Establishment and Data Acquisition of CAMS
4.1.1. Establishment of System
During the hoisting of the cable net, there were numerous monitoring points that were displaced drastically, so the manual measurement could not collect and process the data swiftly, timely, and accurately. Therefore, it was necessary to establish a configuration automatic monitoring system (CAMS) for cable structure construction that could realize continuous and rapid observation of the cable net monitoring points. Aiming at this requirement, C# was used as the programming language, USR-W610 was used as the communication module, and a CAMS was established on the Visual Studio 2022 platform to realize the function of automatic measurement. The selected hardware and their advantages are shown in Table 8. The system realized the functions of the remote control of the TS16 robotic total station, multi-point continuous measure, result output, data discrimination, replacing the search strategy, and so on. It was proven that the system can satisfy the cable monitoring requirement of real-time, automation, continuity, and stability.
Table 8.
Hardware foundation of the CAMS.
The software system framework of the CAMS is shown in Figure 13. The system consisted of three modules: communication setting, data acquisition, and data output. As the premise of normal operation of the system, the communication setting module ensures stable data communication between the computer and the RTS. As the core function of the system, the data acquisition module is divided into single measurement and timing measurement sub-modules according to the different number of measurement objects, and the search strategy and data determination sub-module are respectively the most important functions of the two measurement modules. The operation flow of the single measurement and timing measurement is shown in Figure 14. The data output module is divided into two sub-modules, which is convenient to operate.
Figure 13.
Functional framework of the CAMS.
Figure 14.
Flowchart of the measurement operation. (a) Single measurement. (b) Timing measurement.
4.1.2. Data Acquisition of CAMS
During the configuration monitoring of the cable net structure in the Linyi Olympic Sport Center Stadium, the CAMS was used to test the performance of the system and obtain the coordinates of the monitoring points.
The monitoring scheme adopted the method of rear-view point to set up the measuring station. The center of the stadium was selected as the monitoring station numbered as LY-CZ. Two rear-view points were the reference points, the location of which should be arranged in a place that is easy to store for a long time, is not disturbed by the external environment, and has good visibility conditions. In order to set three points equidistantly, the two rear-view points, numbered as LY-HA and LY-HB, were arranged on the column of stand, as shown in Figure 15. During the monitoring, the azimuth angle between the measuring station and the monitoring point remained unchanged, and the height and position of the RTS were fixed. The measuring site is shown in Figure 16.
Figure 15.
Arrangement of the measuring station and monitoring point. (a) Diagram of the measuring station and rear-view points. (b) Authentic image of measuring station and rear-view points.
Figure 16.
Authentic image of the monitoring site.
According to the characteristics of this type of engineering and monitoring points, there were 48 monitoring points arranged in the stadium, where 40 points were on the clamp of the inner ring cable and 8 points on the outer compression truss, as shown in Figure 17a. Forty monitoring points (A-2~A-80) were located near the center of the inner ring of the cable clamps, and were attached to the side of the cable clamp by an aluminum alloy adapter, as shown in Figure 17b. These 40 monitoring points were arranged to measure the configuration of the cable net to obtain the deformation data, which were used to compare with the simulated theoretical value from ANSYS, judge the safety of the structure, and adjust the configuration of the cable structure in mid-air. Another eight monitoring points were arranged on the outer compression truss to measure the radial deformation of the outer steel structure to ensure safety.
Figure 17.
Monitoring points. (a) Layout of the monitoring points. (b) A monitoring point of the ring cable clamp.
The CAMS for the cable structure was carried out for 5 days on the construction site of the Linyi Olympic Sport Center Stadium. According to the actual situation, we chose seven process conditions, numbered from GC-1 to GC-7. The length of the traction cable of each axis is shown in Table 9. GC-1 indicates the start of monitoring, during which condition the construction of the outer steel structure was completed and was deformed due to its own weight. We then obtained the coordinate values of these 48 points.
Table 9.
The length of the traction cables under different conditions (mm).
4.2. Simulation Theoretical Values Obtained from ANSYS
Considering that the monitoring points of ring cable clamp were attached to the ring cable clamp facing the center of the side of the field, the incline angle of the ring cables changed when the cable net was hoisted. Therefore, it was necessary to refine the original finite element model to obtain the coordinates of the monitoring points in ANSYS. According to the CAD solid model shown in Figure 18a, the finite element of the ring cable in ANSYS was subdivided into 10 loops to be as consistent as possible with the project. Monitoring points in ANSYS are shown separately, as shown in Figure 18b. The clamps of the ring cable were modeled in the element of BEAM 188 and the material stiffness was consistent with that of the rigid arm. The center point of the ring cable clamp was set as the main key point and the other point as the slave key point, then the rigid zone was established. The material type, member connection condition, loading condition, and construction condition were the same as the original analysis. The coordinates of the monitoring points were obtained from GC-1 to GC-7, as detailed in Section 4.1.2.
Figure 18.
Clamp model of the ring cable. (a) CAD solid model. (b) Finite element model in ANSYS.
4.3. Comparison, Analysis and Discussion: The Theoretical and Measured Displacement
4.3.1. Comparison of Clamps’ Vertical Displacement
A-80, the lowest clamp, was taken as the datum point to obtain the theoretical and measured relative elevation, as shown in Figure 17a, that is, the elevation difference between the target point and the datum point, ΔZ1 and ΔZ2, respectively. The relative difference in elevation ΔZ = ΔZ1 − ΔZ2 was obtained, and the ΔZ from GC1 to GC7 was plotted, as shown in Figure 19.
Figure 19.
The relative difference in the elevation of the ring cable clamp between the theoretical and monitored values.
The biggest ΔZ appeared in GC-1, because the traction cables were long and the radial cables were relaxed. The cable forces were low, so that it would not be efficient to control the configuration of the cable net. Therefore, the discreteness of the measured values and the error were relatively large. Gradually, as the length of the traction cables decreased and the cable forces increased, the ΔZ decreased until the minimum was 68 m in GC-7, which appeared on the monitoring points of A20 and A32. It was proven that the greater the cable force, the less discreteness and ΔZ. As Figure 18 shows, taking axis no. 40 of the horizontal coordinates as the symmetry axis, ΔZ was basically symmetric. With the continuous reduction in the length of the traction cable, the symmetry phenomenon was more obvious, which is consistent with the symmetry of the engineering structure. Meanwhile, the change in cable force was more sensitive when the cable net structure was close to being formed, as shown by the simulations in ANSYS.
It can be concluded that the theoretical displacement is basically consistent with the measured displacement, and the displacement change in the ring cable is basically consistent with the theoretical analysis during construction. Therefore, construction can be carried out safely, and it was proven that the CAMS has considerable precision in vertical deformation monitoring.
4.3.2. Comparison of the Outer Compression Truss’s Radial Deformation
As Figure 20a shows, the radial deformation of eight measuring points decreased as the length of the traction cable decreased. The value of radial deformation developed from 0 mm in the initial state to 50 mm in the formed state compared to GC-1. Because the length of the traction cables decreased, the cable force increased and the outer compression truss was tensioned to move closer to the center of the field gradually. Therefore, the radial deformation increased.
Figure 20.
Deformation of the outer compression truss (compared to GC-1). (a) Theoretical deformation. (b) Measuring deformation.
Due to gravity in the initial state, the measuring radial deformation of truss was not 0 mm, and the configuration was not the design zero state. There was an error between the measured value and the theoretical value. The measuring trend of general deformation was consistent with the theoretical analysis shown in Figure 20b. However, there was an anomaly, where the deformation of the latter condition was smaller than that of the previous condition, because the outer compression truss monitoring points of B-3 between GC2 and GC3, B-1 between GC3 and GC4, and B-3 between GC6 and GC7 were disturbed by accidental human intervention. Although it was corrected in time, its coordinates still showed a certain deviation. Considering the above factors, there were some errors in the radial deformation measured.
The difference between the theoretic and measured deformation is shown in Figure 21. The difference ranged from −50.43 to −1.01 mm. Compared with the initial state (GC-1), the maximum measured deformation (GC-7) was 82.9 mm, and the maximum theoretical deformation was 50.5 mm, with a difference of about 30 mm. Although there was a relative difference, considering the large scale of the structure and different construction seasons, the relative difference is acceptable. Construction was carried out safely, and the automatic measurement system can be recognized as having considerable accuracy.
Figure 21.
The difference between the measured value and theoretical value.
To sum up, the vertical and radial deformation between the measured value and the theoretical value were compared. It was proven that the CAMS in the Linyi Olympic Sport Center Stadium could complete the measurement task. The system had considerable accuracy and stability with acceptable error, which can provide some reference values for the construction of other similar engineering projects.
5. Conclusions
This paper took Linyi Olympic Sports Center Stadium as the engineering background and researched the key technologies of its spoke-type single-layer cable net structure. Based on the NDFEM method, the finite element simulation analysis of the whole construction process was carried out, and the CAMS was developed to monitor the structural configuration during the construction process. The study yielded the following conclusions:
(1) Based on the characteristics of the spoke-type single-layer cable structure used at the Linyi Olympic Sport Center Stadium, the method of “assembling in low-altitude with free stress, hoisting entirely using traction cables, tensioning, and anchoring in batches” was selected, the nonlinear dynamic finite element method (NDFEM) was applied to analyze the construction process in ANSYS, and key responses in ANSYS were obtained. The results showed that the maximum cable force was 4504 kN, the maximum equivalent stress was 102.1 MPa, structural deformation was within an acceptable range, and the structure was safe during construction. Furthermore, tensioning and anchoring in batches could decrease the traction forces, which proved the advantages of the selected construction method.
(2) The CAMS was established to realize the function of automatic measurement for the cable structure, which has large deformation during construction. The system consists of three modules: communication setting, data acquisition, and data output. These modules can realize the functions of the remote control of the TS16 robotic total station, multi-point continuous measure, result output, data discrimination, replacing search strategy, and so on. It was proven that the system could satisfy the monitoring requirement of real-time, automation, continuity, accuracy, and stability.
(3) The original finite element model of the clamps was refined to obtain the coordinates of the monitoring points and the theoretical deformation in ANSYS according to different conditions. The CAMS was applied to the cable structure construction to obtain the measuring coordinates. It was proven that the system had considerable accuracy and stability with acceptable error. It could also be seen that the configuration of the cable net was in a safe and controllable state during construction. Comparative results showed that the application of the CAMS could provide some reference values for the construction of other similar engineering projects.
(4) This study simulated the construction process from the macro level but did not focus on the further study of the component and node levels. In this project, ten ring cable clamps were connected with two radial cables, which was the most important node of the cable network structure. Considering the mechanical properties of the cast steel joints and welds, it is necessary to study the ultimate bearing capacity of the cable clamps. Furthermore, machine learning, deep learning, and artificial intelligence methodologies are expected to forecast the structural response [38,39]. At the same time, the CAMS can be further upgraded to enhance its visualization, and it is expected that the digital model of the construction process of the cable network structure can be quickly established based on the measured coordinates of the monitoring points.
Author Contributions
Conceptualization, Y.R. and B.L.; Methodology, F.W., N.Z., Y.R. and B.L.; Software, F.W., Z.D. and Y.W.; Validation, F.W. and Z.D.; Investigation, F.W., Z.D., Y.W. and X.L.; Resources, N.Z.; Data curation, F.W. and Y.W.; Writing—original draft, F.W. and Z.D.; Writing—review & editing, N.Z. and Y.R.; Supervision, Y.R.; Project administration, B.L. and X.L.; Funding acquisition, B.L. All authors have read and agreed to the published version of the manuscript.
Funding
This research received no external funding.
Data Availability Statement
The data used in this study are not publicly available due to confidentiality and privacy concerns. Access to the data can only be granted upon request and with the permission of the appropriate parties. Please contact the corresponding author for further information.
Conflicts of Interest
Author Xin Liu was employed by the company Nanjing Dong-Da Modern Prestressed Engineering Co., Ltd. The remaining authors declare that the research was conducted in the absence of any commercial or financial relationships that could be construed as a potential conflict of interest.
References
- Liu, Z.; Li, H.; Liu, Y.; Wang, J.; Tafsirojjaman, T.; Shi, G. A novel numerical approach and experimental study to evaluate the effect of component failure on spoke-wheel cable structure. J. Build. Eng. 2022, 61, 105268. [Google Scholar] [CrossRef]
- Hu, Z.; Wang, J.; Zhao, J.; Chen, Y. Experimental study on wheel-spoke crossed cable structures. Adv. Struct. Eng. 2018, 21, 2340–2355. [Google Scholar] [CrossRef]
- Liu, Z.; Shi, G.; Liu, Y.; Sun, Z.; Zeng, B.; Wang, J.; Tafsirojjaman, T. Investigation of mechanical behaviors of spoke-wheel cable structures through experimental and numerical analysis driven by digital-twin. Structures 2024, 62, 106099. [Google Scholar] [CrossRef]
- Aboul-Nasr, G.; Mourad, S.A. An extended force density method for form finding of constrained cable nets. Case Stud. Struct. Eng. 2015, 3, 19–32. [Google Scholar] [CrossRef]
- Li, S.; Zhang, Y.; Mi, X.; Huang, X.; Chen, W. Design and integrated tension test of a large-scale modular CFRP wheel-spoke-shaped structure. Eng. Struct. 2023, 275, 115238. [Google Scholar] [CrossRef]
- Abdulkarim, S.J.; Saeed, N.M. Nonlinear technique of prestressing spatial structures. Mech. Res. Commun. 2023, 127, 104040. [Google Scholar] [CrossRef]
- Ereiz, S.; Duvnjak, I.; Fernando Jiménez-Alonso, J. Review of finite element model updating methods for structural applications. Structures 2022, 41, 684–723. [Google Scholar] [CrossRef]
- Xie, W.; Zhou, X.; Qin, D.; Cao, L.; Tang, R. Prediction of construction cable forces of CFST arch bridge based on DNN. Structures 2024, 61, 106012. [Google Scholar] [CrossRef]
- Zhang, H.; Lu, J.; Gong, P.; Li, N. Member control efficiency and shape control capability of a loaded cable dome. Structures 2023, 58, 105378. [Google Scholar] [CrossRef]
- Schek, H.J. The force density method for form finding and computation of general networks. Comput. Meth. Appl. Mech. Eng. 1974, 3, 115–134. [Google Scholar] [CrossRef]
- Tibert, A.G.; Pellegrino, S. Review of Form-Finding Methods for Tensegrity Structures. Int. J. Space Struct. 2003, 18, 209–223. [Google Scholar] [CrossRef]
- Lu, Y.J.; Na, L.; Ganping, S. Form-finding analysis of irregular tensegrity structures by matrix iteration. Adv. Steel Constr. 2015, 4, 507–516. [Google Scholar] [CrossRef]
- Lee, S.; Gan, B.S.; Lee, J. A fully automatic group selection for form-finding process of truncated tetrahedral tensegrity structures via a double-loop genetic algorithm. Compos. Part B Eng. 2016, 106, 308–315. [Google Scholar] [CrossRef]
- Yuan, X.; Ma, S.; Jiang, S. Form-finding of tensegrity structures based on the Levenberg—Marquardt method. Comput. Struct. 2017, 192, 171–180. [Google Scholar] [CrossRef]
- Li, X.; Xue, S.; Liu, Y. A novel form finding method for minimum surface of cable net. J. Build. Eng. 2022, 48, 103939. [Google Scholar] [CrossRef]
- Yu, Y.; Chen, Z.; Yan, R. Finite element modeling of cable sliding and its effect on dynamic response of cable-supported truss. Front. Struct. Civ. Eng. 2019, 13, 1227–1242. [Google Scholar] [CrossRef]
- Zong, Z.; Gao, M.; Guo, Z. Simulation analysis of cable dome construction forming based on tower lifting and accumulative installation. Build. Sci. 2012, 28, 29–32. [Google Scholar] [CrossRef]
- Guerra Riaño, A.F.; Várkonyi, P.L. Form-finding using the Force Density Method: Existence of solutions, singularities, and an analogy to electric circuits. Int. J. Space Struct. 2023, 38, 302–326. [Google Scholar] [CrossRef]
- Li, X.; Liu, C.; Xue, S.; Li, X.; Zhang, C.; Huang, L.; Wang, W. The modified force density method for form-finding of cable net structure. Thin-Walled Struct. 2024, 195, 111363. [Google Scholar] [CrossRef]
- Tang, Y.; Li, T. Equivalent-force density method as a shape-finding tool for cable-membrane structures. Eng. Struct. 2017, 151, 11–19. [Google Scholar] [CrossRef]
- Xue, Y.; Luo, Y.; Wang, Y.; Xu, X.; Wan, H.; Shen, Y.; Fu, W. A new configuration of Geiger-type cable domes with sliding ridge cables: Computational framework and structural feasibility investigation. Eng. Struct. 2023, 286, 116028. [Google Scholar] [CrossRef]
- Xue, Y.; Luo, Y.; Xu, X. Form-finding of cable-strut structures with given cable forces and strut lengths. Mech. Res. Commun. 2020, 106, 103530. [Google Scholar] [CrossRef]
- Ma, Q.; Ohsaki, M.; Chen, Z.; Yan, X. Step-by-step unbalanced force iteration method for cable-strut structure with irregular shape. Eng. Struct. 2018, 177, 331–344. [Google Scholar] [CrossRef]
- Bin, L.; Zhengxing, G.; Xiangnan, C.; Feng, G.; Kai, W. Static equilibrium form-finding analysis of cable-strut system based on nonlinear dynamic finite element method. Adv. Steel Constr. 2015, 4, 452–468. [Google Scholar] [CrossRef]
- Zhang, N.; Luo, B.; Zhu, L.; Liu, X. Research on the forming technology of a novel type structure of double-layer orthogonal cable net with a large opening. Structures 2024, 63, 106371. [Google Scholar] [CrossRef]
- Ding, M.; Luo, B.; Guan, D.; Wei, Y.; Ding, S.; Huang, L. Accumulative traction-hoisting construction technology of a semi-rigid steel batten cable dome. Structures 2021, 31, 159–171. [Google Scholar] [CrossRef]
- Luo, B.; Ruan, Y.; Li, J.; Ding, M.; Wang, H. Numerical and Experimental Study on Anti-slipping Performance of Cable Clamp for Two-Way Orthogonal Full Locked Coil Cables. Int. J. Steel Struct. 2020, 20, 788–807. [Google Scholar] [CrossRef]
- Huang, L.; Ruan, Y.; Luo, B.; Ding, M.; Gu, H. Research on Key Technologies of the Non-Bracket Construction Method for an Annular Cable Supported Grid Structure. Appl. Sci. 2022, 12, 7624. [Google Scholar] [CrossRef]
- Mishra, M.; Lourenço, P.B.; Ramana, G.V. Structural health monitoring of civil engineering structures by using the internet of things: A review. J. Build. Eng. 2022, 48, 103954. [Google Scholar] [CrossRef]
- Luo, Y.; Chen, Y.; Wan, H.; Yu, F.; Shen, Y. Development of laser-based displacement monitoring system and its application to large-scale spatial structures. J. Civ. Struct. Health Monit. 2021, 11, 381–395. [Google Scholar] [CrossRef]
- Chu, Y.; Wang, J. Application of Measuring Intelligent Robot in Building Deformation Monitoring. Procedia Comput. Sci. 2022, 208, 206–210. [Google Scholar] [CrossRef]
- Mi, Y.H.; Liu, L.X.; Lai, L.F. Research on Automatic Monitoring System with Measurement Robot. Adv. Mater. Res. 2011, 217–218, 1324–1329. [Google Scholar] [CrossRef]
- Zhou, J.; Shi, B.; Liu, G.; Ju, S.; Mosa, A.M. Accuracy analysis of dam deformation monitoring and correction of refraction with robotic total station. PLoS ONE 2021, 16, e251281. [Google Scholar] [CrossRef]
- Yao, L.B.; Sun, H.L.; Zhu, L.X.; Zhou, Y.Y. Development and application of deformation monitoring system for lanslide at Funchunjiang Dam. Surv. Rev. Dir. Overseas Surv. 2014, 46, 444–452. [Google Scholar] [CrossRef]
- Stiros, S.C.; Psimoulis, P.A. Response of a historical short-span railway bridge to passing trains: 3-D deflections and dominant frequencies derived from Robotic Total Station (RTS) measurements. Eng. Struct. 2012, 45, 362–371. [Google Scholar] [CrossRef]
- Yanbin, L.; Jianxun, C.; Weizheng, X.; Pengyu, Z.; Juzhu, L.; Xiong, Q.; Qin, L. Application of a Total Station with RDM to Monitor Tunnel Displacement. J. Perform. Constr. Facil. 2017, 4. [Google Scholar] [CrossRef]
- Xue, S.; Li, X.; Li, X.; Dezhkam, M. Automated design of cable-net structures with multi-objective state. Autom. Constr. 2024, 160, 105288. [Google Scholar] [CrossRef]
- Liu, B.; Lu, W. Surrogate models in machine learning for computational stochastic multi-scale modelling in composite materials design. Int. J. Hydromechatron. 2022, 1, 1. [Google Scholar] [CrossRef]
- Simani, S.; Lam, Y.P.; Farsoni, S.; Castaldi, P. Dynamic Neural Network Architecture Design for Predicting Remaining Useful Life of Dynamic Processes. J. Data Sci. Intell. Syst. 2023, 2. [Google Scholar] [CrossRef]
Disclaimer/Publisher’s Note: The statements, opinions and data contained in all publications are solely those of the individual author(s) and contributor(s) and not of MDPI and/or the editor(s). MDPI and/or the editor(s) disclaim responsibility for any injury to people or property resulting from any ideas, methods, instructions or products referred to in the content. |
© 2024 by the authors. Licensee MDPI, Basel, Switzerland. This article is an open access article distributed under the terms and conditions of the Creative Commons Attribution (CC BY) license (https://creativecommons.org/licenses/by/4.0/).